
#24h
24h
48,378 views
95 Discussing
Hot
Latest

$SHELL — 24H turns red after failing to hold the 0.0220 zone
Binance’s 24H rolling data currently shows $SHELL trading around 0.0205.
📊 24H:
Open: 0.0211
High: 0.0220
Low: 0.0204
Last: 0.0205
Change: -2.84%
Volume: ~16.63M SHELL
Quote volume: ~$34973K
Weighted Avg Price: 0.02103
The current price is about 2.5% lower than the 24-hour volume-weighted average price.
This suggests that most trades within the 24H window took place at higher levels than today’s price.
After failing at 0.0220, the reaction around 0.0204–0.0205 will be key data for assessing whether this is only a retest or whether the short-term structure is weakening.
#SHELL #24H #CryptoAnalysis #Binance
$SHELL — 24H turns red after failing to hold the 0.0220 zone
Binance’s 24H rolling data currently shows $SHELL trading around 0.0205.
📊 24H:
Open: 0.0211
High: 0.0220
Low: 0.0204
Last: 0.0205
Change: -2.84%
Volume: ~16.63M SHELL
Quote volume: ~$34973K
Weighted Avg Price: 0.02103
The current price is about 2.5% lower than the 24-hour volume-weighted average price.
This suggests that most trades within the 24H window took place at higher levels than today’s price.
After failing at 0.0220, the reaction around 0.0204–0.0205 will be key data for assessing whether this is only a retest or whether the short-term structure is weakening.
#SHELL #24H #CryptoAnalysis #Binance
Binance’s 24H rolling data currently shows $SHELL trading around 0.0205.
📊 24H:
Open: 0.0211
High: 0.0220
Low: 0.0204
Last: 0.0205
Change: -2.84%
Volume: ~16.63M SHELL
Quote volume: ~$34973K
Weighted Avg Price: 0.02103
The current price is about 2.5% lower than the 24-hour volume-weighted average price.
This suggests that most trades within the 24H window took place at higher levels than today’s price.
After failing at 0.0220, the reaction around 0.0204–0.0205 will be key data for assessing whether this is only a retest or whether the short-term structure is weakening.
#SHELL #24H #CryptoAnalysis #Binance
4
$SHELL - Rolling 24H rises 11.06%
Binance Spot data shows one of the strongest 24H windows for $SHELL in recent days.
Rolling 24H:
Open: 0.0217
High: 0.0244
Low: 0.0216
Last: 0.0241
Change: +11.06%
Volume: about 25.62M SHELL
Quote volume: about 581.31K USDT
Weighted Avg Price: 0.02269
The current price is about 6.2% higher than the 24H average price and still remains quite close to the 0.0244 high.
This indicates that most of the increase within the 24-hour window is still being retained.
However, the 0.0244 to 0.0255 area still needs further confirmation before we can assess whether a major structure has truly broken out.
#SHELL #24H #CryptoAnalysis #Binance
$SHELL - Rolling 24H rises 11.06%
Binance Spot data shows one of the strongest 24H windows for $SHELL in recent days.
Rolling 24H:
Open: 0.0217
High: 0.0244
Low: 0.0216
Last: 0.0241
Change: +11.06%
Volume: about 25.62M SHELL
Quote volume: about 581.31K USDT
Weighted Avg Price: 0.02269
The current price is about 6.2% higher than the 24H average price and still remains quite close to the 0.0244 high.
This indicates that most of the increase within the 24-hour window is still being retained.
However, the 0.0244 to 0.0255 area still needs further confirmation before we can assess whether a major structure has truly broken out.
#SHELL #24H #CryptoAnalysis #Binance
Binance Spot data shows one of the strongest 24H windows for $SHELL in recent days.
Rolling 24H:
Open: 0.0217
High: 0.0244
Low: 0.0216
Last: 0.0241
Change: +11.06%
Volume: about 25.62M SHELL
Quote volume: about 581.31K USDT
Weighted Avg Price: 0.02269
The current price is about 6.2% higher than the 24H average price and still remains quite close to the 0.0244 high.
This indicates that most of the increase within the 24-hour window is still being retained.
However, the 0.0244 to 0.0255 area still needs further confirmation before we can assess whether a major structure has truly broken out.
#SHELL #24H #CryptoAnalysis #Binance
101
$SHELL — 24H turns negative after failing to hold 0.0220
Binance rolling 24-hour data currently shows $SHELL trading around 0.0205.
📊 24H:
Open: 0.0211
High: 0.0220
Low: 0.0204
Last: 0.0205
Change: -2.84%
Volume: ~16.63M SHELL
Quote volume: ~$34973K
Weighted Avg Price: 0.02103
The current price is roughly 2.5% below the 24-hour volume-weighted average.
This indicates that a large portion of trading during the 24-hour window occurred at higher prices than the current level.
After the rejection from 0.0220, the reaction around 0.0204–0.0205 will be important in determining whether this is only a retest or a sign of weakening short-term structure.
#SHELL #24H #CryptoAnalysis #Binance
$SHELL — 24H turns negative after failing to hold 0.0220
Binance rolling 24-hour data currently shows $SHELL trading around 0.0205.
📊 24H:
Open: 0.0211
High: 0.0220
Low: 0.0204
Last: 0.0205
Change: -2.84%
Volume: ~16.63M SHELL
Quote volume: ~$34973K
Weighted Avg Price: 0.02103
The current price is roughly 2.5% below the 24-hour volume-weighted average.
This indicates that a large portion of trading during the 24-hour window occurred at higher prices than the current level.
After the rejection from 0.0220, the reaction around 0.0204–0.0205 will be important in determining whether this is only a retest or a sign of weakening short-term structure.
#SHELL #24H #CryptoAnalysis #Binance
Binance rolling 24-hour data currently shows $SHELL trading around 0.0205.
📊 24H:
Open: 0.0211
High: 0.0220
Low: 0.0204
Last: 0.0205
Change: -2.84%
Volume: ~16.63M SHELL
Quote volume: ~$34973K
Weighted Avg Price: 0.02103
The current price is roughly 2.5% below the 24-hour volume-weighted average.
This indicates that a large portion of trading during the 24-hour window occurred at higher prices than the current level.
After the rejection from 0.0220, the reaction around 0.0204–0.0205 will be important in determining whether this is only a retest or a sign of weakening short-term structure.
#SHELL #24H #CryptoAnalysis #Binance
64
$SHELL — Rolling 24H remains positive at +0.97%
Although today’s session is slightly negative, $SHELL remains positive on the rolling 24-hour window.
📊 24H:
Open: 0.0207
High: 0.0214
Low: 0.0200
Last: 0.0209
Change: +0.97%
Volume: ~16.95M SHELL
Quote volume: ~$34919K
Weighted Avg Price: 0.02060
The current price is approximately 1.45% above the 24-hour weighted average.
This means SHELL is still trading above the average price of the rolling 24-hour window, despite failing to hold the 0.0214 high.
The 0.0206–0.0208 area may become important if price experiences another short-term pullback.
#SHELL #24H #CryptoAnalysis #Binance
$SHELL — Rolling 24H remains positive at +0.97%
Although today’s session is slightly negative, $SHELL remains positive on the rolling 24-hour window.
📊 24H:
Open: 0.0207
High: 0.0214
Low: 0.0200
Last: 0.0209
Change: +0.97%
Volume: ~16.95M SHELL
Quote volume: ~$34919K
Weighted Avg Price: 0.02060
The current price is approximately 1.45% above the 24-hour weighted average.
This means SHELL is still trading above the average price of the rolling 24-hour window, despite failing to hold the 0.0214 high.
The 0.0206–0.0208 area may become important if price experiences another short-term pullback.
#SHELL #24H #CryptoAnalysis #Binance
Although today’s session is slightly negative, $SHELL remains positive on the rolling 24-hour window.
📊 24H:
Open: 0.0207
High: 0.0214
Low: 0.0200
Last: 0.0209
Change: +0.97%
Volume: ~16.95M SHELL
Quote volume: ~$34919K
Weighted Avg Price: 0.02060
The current price is approximately 1.45% above the 24-hour weighted average.
This means SHELL is still trading above the average price of the rolling 24-hour window, despite failing to hold the 0.0214 high.
The 0.0206–0.0208 area may become important if price experiences another short-term pullback.
#SHELL #24H #CryptoAnalysis #Binance
111
$SHELL — 24H +3.48%, the average price zone has been recovered
Binance’s 24H rolling data shows that $SHELL đ is trading around 0.0208.
📊 24H:
Open: 0.0201
High: 0.0210
Low: 0.0200
Last: 0.0208
Change: +3.48%
Volume: ~14.59M SHELL
Quote volume: ~$29789K
Weighted Avg Price: 0.02042
The current price is about 1.9% higher than the 24-hour volume-weighted average price.
This is a change compared to the period before, when SHELL mainly traded around 0.0194–0.0200.
Maintaining the price above 0.0204 will be the next notable data point, while 0.0210 is currently the highest level of the 24H window.
#SHELL #24H #CryptoAnalysis #Binance
$SHELL — 24H +3.48%, the average price zone has been recovered
Binance’s 24H rolling data shows that $SHELL đ is trading around 0.0208.
📊 24H:
Open: 0.0201
High: 0.0210
Low: 0.0200
Last: 0.0208
Change: +3.48%
Volume: ~14.59M SHELL
Quote volume: ~$29789K
Weighted Avg Price: 0.02042
The current price is about 1.9% higher than the 24-hour volume-weighted average price.
This is a change compared to the period before, when SHELL mainly traded around 0.0194–0.0200.
Maintaining the price above 0.0204 will be the next notable data point, while 0.0210 is currently the highest level of the 24H window.
#SHELL #24H #CryptoAnalysis #Binance
Binance’s 24H rolling data shows that $SHELL đ is trading around 0.0208.
📊 24H:
Open: 0.0201
High: 0.0210
Low: 0.0200
Last: 0.0208
Change: +3.48%
Volume: ~14.59M SHELL
Quote volume: ~$29789K
Weighted Avg Price: 0.02042
The current price is about 1.9% higher than the 24-hour volume-weighted average price.
This is a change compared to the period before, when SHELL mainly traded around 0.0194–0.0200.
Maintaining the price above 0.0204 will be the next notable data point, while 0.0210 is currently the highest level of the 24H window.
#SHELL #24H #CryptoAnalysis #Binance
62

·
--
Bearish
6Seven_run
·
--
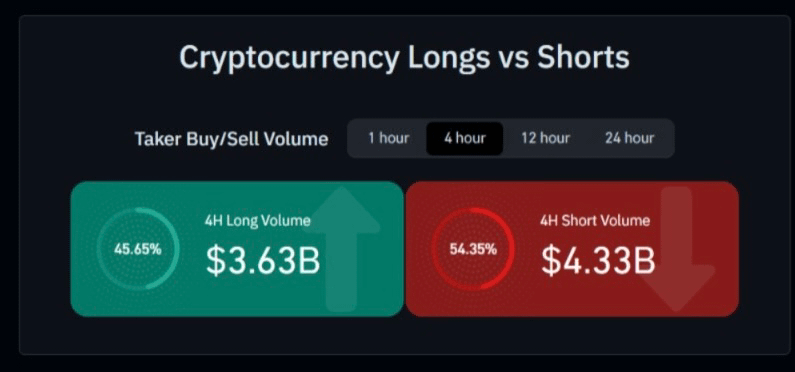
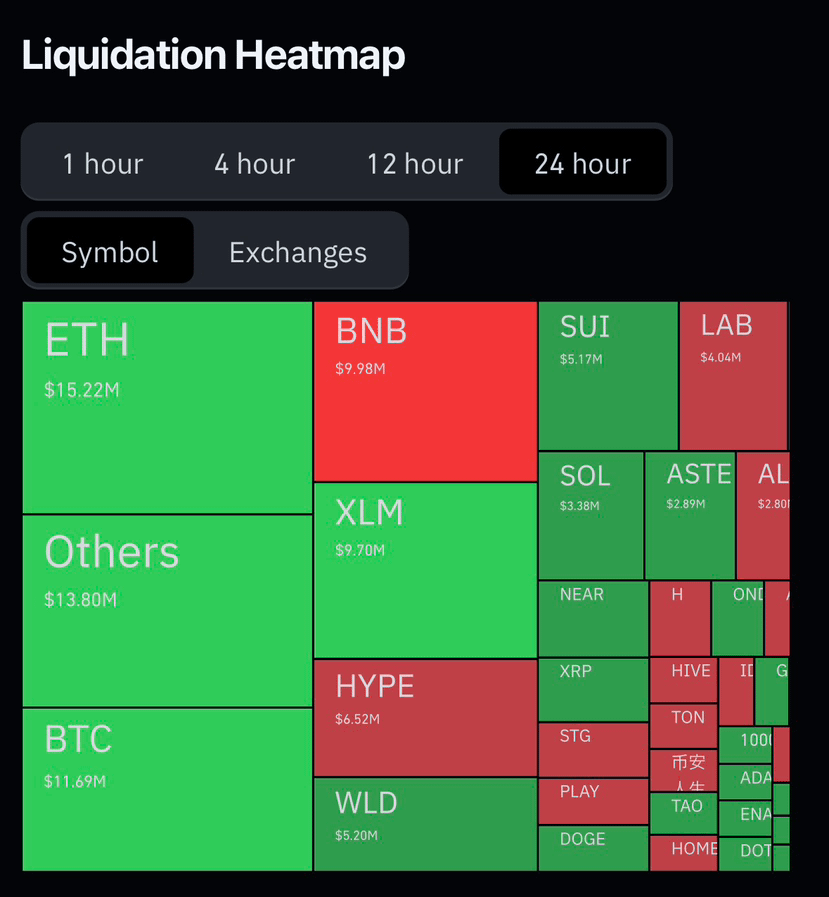
Bearish📊 24H Liquidation Heatmap
ETH 🥇 $15.22M
BTC 🥈 $11.69M
BNB 🥉 $9.98M
💰 Anyone holding long are cashing in big on this move $BNB
Meanwhile you can see $BNB saw strong moves that caught many short sellers off guard 🔥
$BNB (Red) $9.98M 🚨
The opposite game played well
/Traders expected BNB to fall.
/BNB moved higher.
/Shorts got liquidated.
Stay sharp guys, the next 24hrs really gonna be crucial. The market will show their true colors on Monday.⚡
#BTC #ETH #markettoday #bnb
ETH 🥇 $15.22M
BTC 🥈 $11.69M
BNB 🥉 $9.98M
💰 Anyone holding long are cashing in big on this move $BNB
Meanwhile you can see $BNB saw strong moves that caught many short sellers off guard 🔥
$BNB (Red) $9.98M 🚨
The opposite game played well
/Traders expected BNB to fall.
/BNB moved higher.
/Shorts got liquidated.
Stay sharp guys, the next 24hrs really gonna be crucial. The market will show their true colors on Monday.⚡
#BTC #ETH #markettoday #bnb
43

$SHELL — 24H down 1.51% as 0.0192 continues to be tested
Binance rolling 24-hour data shows $SHELL trading around 0.0196.
📊 24H: Open: 0.0199 High: 0.0203 Low: 0.0192 Last: 0.0196 Change: -1.51% Volume: ~13.56M SHELL Quote volume: ~$26566K Weighted Avg Price: 0.01959
One notable point is that the current price is almost identical to the 24H volume-weighted average price.
Meanwhile, 0.0203 remains the highest level of the rolling 24-hour window, while 0.0192 is the recent low.
The current range shows that SHELL has not yet broken out of the narrow trading zone formed over the past few sessions.
#SHELL #24H #CryptoAnalysis #Binance
$SHELL — 24H down 1.51% as 0.0192 continues to be tested
Binance rolling 24-hour data shows $SHELL trading around 0.0196.
📊 24H: Open: 0.0199 High: 0.0203 Low: 0.0192 Last: 0.0196 Change: -1.51% Volume: ~13.56M SHELL Quote volume: ~$26566K Weighted Avg Price: 0.01959
One notable point is that the current price is almost identical to the 24H volume-weighted average price.
Meanwhile, 0.0203 remains the highest level of the rolling 24-hour window, while 0.0192 is the recent low.
The current range shows that SHELL has not yet broken out of the narrow trading zone formed over the past few sessions.
#SHELL #24H #CryptoAnalysis #Binance
Binance rolling 24-hour data shows $SHELL trading around 0.0196.
📊 24H: Open: 0.0199 High: 0.0203 Low: 0.0192 Last: 0.0196 Change: -1.51% Volume: ~13.56M SHELL Quote volume: ~$26566K Weighted Avg Price: 0.01959
One notable point is that the current price is almost identical to the 24H volume-weighted average price.
Meanwhile, 0.0203 remains the highest level of the rolling 24-hour window, while 0.0192 is the recent low.
The current range shows that SHELL has not yet broken out of the narrow trading zone formed over the past few sessions.
#SHELL #24H #CryptoAnalysis #Binance
214
$SHELL — Rolling 24H is almost flat at 0.0198
Binance’s 24-hour rolling data shows that $SHELL is almost unchanged compared to 24 hours ago.
📊 24H: Open: 0.0198 High: 0.0199 Low: 0.0191 Last: 0.0198 Change: 0.00% Volume: ~16.37M SHELL Quote volume: ~$31832K Weighted Avg Price: 0.01944
The opening and closing prices of the 24H window are both 0.0198, even though SHELL still fluctuated down to 0.0191 during this period.
This indicates that a near-zero net change does not mean the price was completely motionless throughout the session.
#SHELL #24H #CryptoAnalysis #Binance
$SHELL — Rolling 24H is almost flat at 0.0198
Binance’s 24-hour rolling data shows that $SHELL is almost unchanged compared to 24 hours ago.
📊 24H: Open: 0.0198 High: 0.0199 Low: 0.0191 Last: 0.0198 Change: 0.00% Volume: ~16.37M SHELL Quote volume: ~$31832K Weighted Avg Price: 0.01944
The opening and closing prices of the 24H window are both 0.0198, even though SHELL still fluctuated down to 0.0191 during this period.
This indicates that a near-zero net change does not mean the price was completely motionless throughout the session.
#SHELL #24H #CryptoAnalysis #Binance
Binance’s 24-hour rolling data shows that $SHELL is almost unchanged compared to 24 hours ago.
📊 24H: Open: 0.0198 High: 0.0199 Low: 0.0191 Last: 0.0198 Change: 0.00% Volume: ~16.37M SHELL Quote volume: ~$31832K Weighted Avg Price: 0.01944
The opening and closing prices of the 24H window are both 0.0198, even though SHELL still fluctuated down to 0.0191 during this period.
This indicates that a near-zero net change does not mean the price was completely motionless throughout the session.
#SHELL #24H #CryptoAnalysis #Binance
71
$SHELL — 24H down 1.51%, the 0.0192 zone continues to be tested
Binance’s 24-hour rolling data shows $SHELL is currently around 0.0196.
📊 24H: Open: 0.0199 High: 0.0203 Low: 0.0192 Last: 0.0196 Change: -1.51% Volume: ~13.56M SHELL Quote volume: ~$26566K Weighted Avg Price: 0.01959
Notably, the current price is almost identical to the 24H volume-weighted average price.
Meanwhile, 0.0203 continues to be the highest level of the 24-hour window and 0.0192 is the nearest low.
The current range indicates that SHELL has not yet broken out of the tight trading zone formed over the past few sessions.
#SHELL #24H #CryptoAnalysis #Binance
$SHELL — 24H down 1.51%, the 0.0192 zone continues to be tested
Binance’s 24-hour rolling data shows $SHELL is currently around 0.0196.
📊 24H: Open: 0.0199 High: 0.0203 Low: 0.0192 Last: 0.0196 Change: -1.51% Volume: ~13.56M SHELL Quote volume: ~$26566K Weighted Avg Price: 0.01959
Notably, the current price is almost identical to the 24H volume-weighted average price.
Meanwhile, 0.0203 continues to be the highest level of the 24-hour window and 0.0192 is the nearest low.
The current range indicates that SHELL has not yet broken out of the tight trading zone formed over the past few sessions.
#SHELL #24H #CryptoAnalysis #Binance
Binance’s 24-hour rolling data shows $SHELL is currently around 0.0196.
📊 24H: Open: 0.0199 High: 0.0203 Low: 0.0192 Last: 0.0196 Change: -1.51% Volume: ~13.56M SHELL Quote volume: ~$26566K Weighted Avg Price: 0.01959
Notably, the current price is almost identical to the 24H volume-weighted average price.
Meanwhile, 0.0203 continues to be the highest level of the 24-hour window and 0.0192 is the nearest low.
The current range indicates that SHELL has not yet broken out of the tight trading zone formed over the past few sessions.
#SHELL #24H #CryptoAnalysis #Binance
13
$SHELL — Rolling 24H returns +1.54%
Binance’s 24-hour rolling data shows $SHELL is currently around 0.0198 USDT.
📊 24H:
Open: 0.0195
High: 0.0204
Low: 0.0192
Last: 0.0198
Change: +1.54%
Volume: ~16.58M SHELL
Quote volume: ~$32808K
Weighted Avg Price: 0.01979
The current price is almost the same as the 24H volume-weighted average price of 0.01979.
This is different from a few previous sessions, when SHELL kept trading below the short-term average range.
However, 0.0204 has not been clearly broken yet. Therefore, the current 24H rise reflects a recovery within the range rather than a newly confirmed uptrend.
#SHELL #24H #MarketUpdate #Binance
$SHELL — Rolling 24H returns +1.54%
Binance’s 24-hour rolling data shows $SHELL is currently around 0.0198 USDT.
📊 24H:
Open: 0.0195
High: 0.0204
Low: 0.0192
Last: 0.0198
Change: +1.54%
Volume: ~16.58M SHELL
Quote volume: ~$32808K
Weighted Avg Price: 0.01979
The current price is almost the same as the 24H volume-weighted average price of 0.01979.
This is different from a few previous sessions, when SHELL kept trading below the short-term average range.
However, 0.0204 has not been clearly broken yet. Therefore, the current 24H rise reflects a recovery within the range rather than a newly confirmed uptrend.
#SHELL #24H #MarketUpdate #Binance
Binance’s 24-hour rolling data shows $SHELL is currently around 0.0198 USDT.
📊 24H:
Open: 0.0195
High: 0.0204
Low: 0.0192
Last: 0.0198
Change: +1.54%
Volume: ~16.58M SHELL
Quote volume: ~$32808K
Weighted Avg Price: 0.01979
The current price is almost the same as the 24H volume-weighted average price of 0.01979.
This is different from a few previous sessions, when SHELL kept trading below the short-term average range.
However, 0.0204 has not been clearly broken yet. Therefore, the current 24H rise reflects a recovery within the range rather than a newly confirmed uptrend.
#SHELL #24H #MarketUpdate #Binance
56

·
--
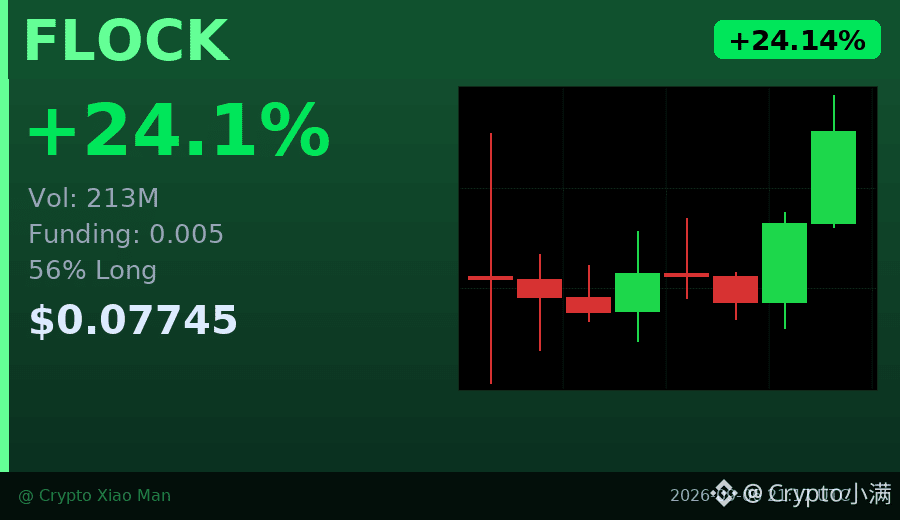
24% gain, but the funding rate is only 0.005 — what does that mean?
FLOCK rose by 0.07745 today, with trading volume of $213 million and a long/short ratio of 56% to 44%, so it isn’t extremely crowded.
The hourly chart has closed green for three consecutive candles, climbing all the way up from the low of 0.061, but funding hasn’t kept up, which suggests there aren’t many leveraged traders chasing the move.
This kind of action looks more like spot buying pushing the price up, rather than derivatives traders driving the move.
If volume stays stable going forward, a pullback to around 0.072 could be a point to watch; if funding suddenly spikes, then caution is warranted.
$FLOCK #资金费率背离 #24h+24%
Click the small card below to quickly view the market 👇
24% gain, but the funding rate is only 0.005 — what does that mean?
FLOCK rose by 0.07745 today, with trading volume of $213 million and a long/short ratio of 56% to 44%, so it isn’t extremely crowded.
The hourly chart has closed green for three consecutive candles, climbing all the way up from the low of 0.061, but funding hasn’t kept up, which suggests there aren’t many leveraged traders chasing the move.
This kind of action looks more like spot buying pushing the price up, rather than derivatives traders driving the move.
If volume stays stable going forward, a pullback to around 0.072 could be a point to watch; if funding suddenly spikes, then caution is warranted.
$FLOCK #资金费率背离 #24h+24%
Click the small card below to quickly view the market 👇
FLOCK rose by 0.07745 today, with trading volume of $213 million and a long/short ratio of 56% to 44%, so it isn’t extremely crowded.
The hourly chart has closed green for three consecutive candles, climbing all the way up from the low of 0.061, but funding hasn’t kept up, which suggests there aren’t many leveraged traders chasing the move.
This kind of action looks more like spot buying pushing the price up, rather than derivatives traders driving the move.
If volume stays stable going forward, a pullback to around 0.072 could be a point to watch; if funding suddenly spikes, then caution is warranted.
$FLOCK #资金费率背离 #24h+24%
Click the small card below to quickly view the market 👇
5
·
--
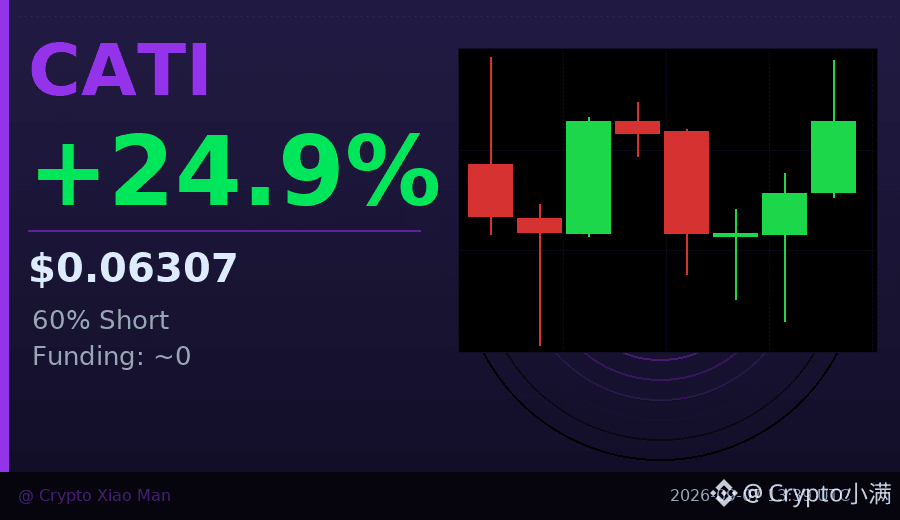
In the past 24 hours it’s risen by nearly 25%, but look at the long/short ratio—60% of people are short, and only 40% are long.
CATI is now 0.063, with trading volume of 55 million USDT and funding rate almost at zero. This kind of divergence is rare: price pushes upward, yet most people are betting it will fall.
On the hourly chart, there are three consecutive bullish candles, and the last one also saw increased volume. The shorts may be getting squeezed.
But don’t rush to pick a side—this kind of extreme sentiment often signals that volatility is coming.
$CATI #多空分歧 #24h+25%
Click the small card below to quickly check the market 👇
In the past 24 hours it’s risen by nearly 25%, but look at the long/short ratio—60% of people are short, and only 40% are long.
CATI is now 0.063, with trading volume of 55 million USDT and funding rate almost at zero. This kind of divergence is rare: price pushes upward, yet most people are betting it will fall.
On the hourly chart, there are three consecutive bullish candles, and the last one also saw increased volume. The shorts may be getting squeezed.
But don’t rush to pick a side—this kind of extreme sentiment often signals that volatility is coming.
$CATI #多空分歧 #24h+25%
Click the small card below to quickly check the market 👇
CATI is now 0.063, with trading volume of 55 million USDT and funding rate almost at zero. This kind of divergence is rare: price pushes upward, yet most people are betting it will fall.
On the hourly chart, there are three consecutive bullish candles, and the last one also saw increased volume. The shorts may be getting squeezed.
But don’t rush to pick a side—this kind of extreme sentiment often signals that volatility is coming.
$CATI #多空分歧 #24h+25%
Click the small card below to quickly check the market 👇
21

·
--
Bullish




Yi He
·
--
My strategy for growing my Plaza followers 🫣
601

·
--
Bearish
🚨 BTC IS STUCK BETWEEN TWO LIQUIDATION ZONES AND THE LEVERAGED TRADERS ARE ALREADY SHAKING 👀🔥
If you want to understand where the next big move might go, stick around, buddy 📉📈
Follow me so you don’t miss anything that’s coming
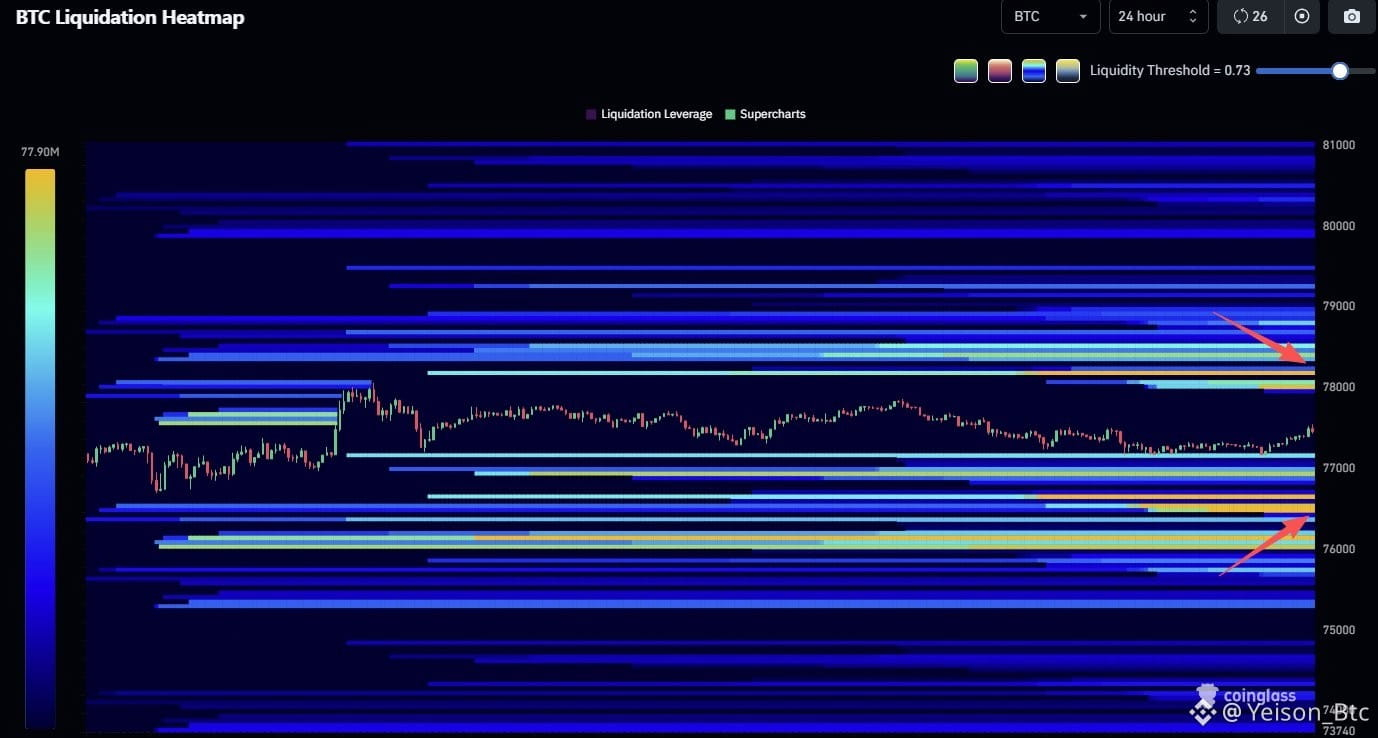
The #heatmap of liquidations at #24h is showing something very clear:
📍Up at 78.10k, there’s strong accumulation of #short s
📍And down at 76.40k, there’s still a lot of liquidity from #long s leveraged positions
🧠 Basically, BTC is trapped between two giant liquidity pools, and market makers usually don’t forgive that 😶🌫️
That’s why the price has been doing: 🎣 quick sweeps
📈 fake breakouts
📉 violent dumps
🍿 and leaving everyone confused
Right now, the most logical scenario is that the market will first go for the zone where it sees more ease to liquidate positions 👀
If BTC regains strength and breaks up: 🚀 the shorts at 78.1k could fuel a quick squeeze
But if fear returns at #WallStreet or another heavy headline drops: 📉 the longs below 76.4k are left completely exposed
And watch out, buddy… in ranges like this, the market often makes the move that the least number of people expect 🤡
Many believe it’s about to rise…
Others are waiting for the definitive dump…
And in the meantime, liquidity keeps growing on both sides 🔥
The real question now is…
Is BTC going to liquidate shorts up top to continue the rally… or will it first sweep the longs before the big move? 👀👇
{spot}(BTCUSDT)
🚨 BTC IS STUCK BETWEEN TWO LIQUIDATION ZONES AND THE LEVERAGED TRADERS ARE ALREADY SHAKING 👀🔥
If you want to understand where the next big move might go, stick around, buddy 📉📈
Follow me so you don’t miss anything that’s coming
The #heatmap of liquidations at #24h is showing something very clear:
📍Up at 78.10k, there’s strong accumulation of #short s
📍And down at 76.40k, there’s still a lot of liquidity from #long s leveraged positions
🧠 Basically, BTC is trapped between two giant liquidity pools, and market makers usually don’t forgive that 😶🌫️
That’s why the price has been doing: 🎣 quick sweeps
📈 fake breakouts
📉 violent dumps
🍿 and leaving everyone confused
Right now, the most logical scenario is that the market will first go for the zone where it sees more ease to liquidate positions 👀
If BTC regains strength and breaks up: 🚀 the shorts at 78.1k could fuel a quick squeeze
But if fear returns at #WallStreet or another heavy headline drops: 📉 the longs below 76.4k are left completely exposed
And watch out, buddy… in ranges like this, the market often makes the move that the least number of people expect 🤡
Many believe it’s about to rise…
Others are waiting for the definitive dump…
And in the meantime, liquidity keeps growing on both sides 🔥
The real question now is…
Is BTC going to liquidate shorts up top to continue the rally… or will it first sweep the longs before the big move? 👀👇
If you want to understand where the next big move might go, stick around, buddy 📉📈
Follow me so you don’t miss anything that’s coming
The #heatmap of liquidations at #24h is showing something very clear:
📍Up at 78.10k, there’s strong accumulation of #short s
📍And down at 76.40k, there’s still a lot of liquidity from #long s leveraged positions
🧠 Basically, BTC is trapped between two giant liquidity pools, and market makers usually don’t forgive that 😶🌫️
That’s why the price has been doing: 🎣 quick sweeps
📈 fake breakouts
📉 violent dumps
🍿 and leaving everyone confused
Right now, the most logical scenario is that the market will first go for the zone where it sees more ease to liquidate positions 👀
If BTC regains strength and breaks up: 🚀 the shorts at 78.1k could fuel a quick squeeze
But if fear returns at #WallStreet or another heavy headline drops: 📉 the longs below 76.4k are left completely exposed
And watch out, buddy… in ranges like this, the market often makes the move that the least number of people expect 🤡
Many believe it’s about to rise…
Others are waiting for the definitive dump…
And in the meantime, liquidity keeps growing on both sides 🔥
The real question now is…
Is BTC going to liquidate shorts up top to continue the rally… or will it first sweep the longs before the big move? 👀👇
4
2
2.7k
·
--
There’s one detail I think is worth mentioning——
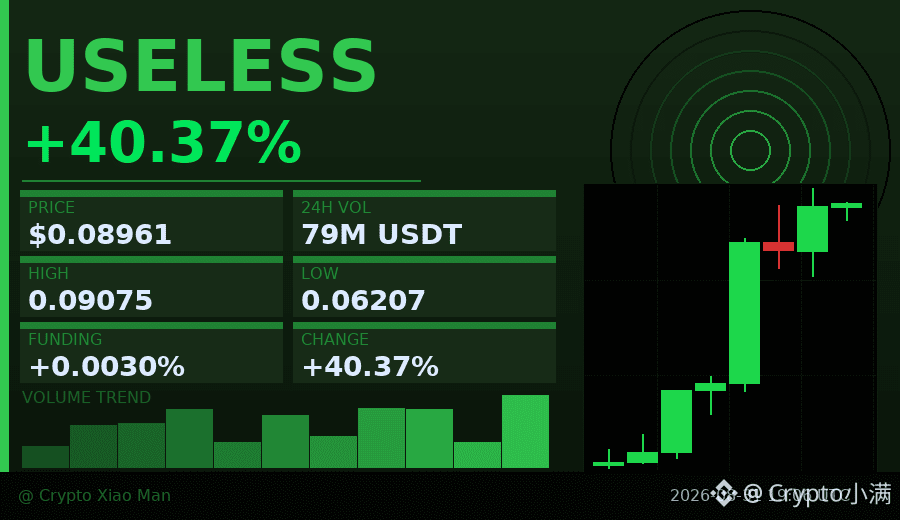
$USELESS is up 40% today, but just looking at the percentage gain isn’t enough; what’s really interesting is its volume.
A few hours ago, the coin’s one-hour trading volume was still under 7 million USDT. Then it ramped up steadily; the highest candlestick’s volume jumped straight to 290 million USDT—over 40 times higher than before. The price followed suit, rising from the low of 0.062 all the way to around 0.09.
In simple terms, it means a large amount of money suddenly flooded in to buy within a short period, pushing the price up rapidly.
At the moment, the volume on the last two candlesticks has already clearly decreased, suggesting the momentum is starting to fade. The price is now ranging and consolidating in the 0.088–0.090 area. This “volume dies first, price drops later” rhythm is very common—when volume can’t keep up, the price often has an easier time falling back.
The long/short ratio is 54% long vs 46% short, with relatively big disagreement. There’s no clear one-sided tilt, which indicates the market hasn’t reached a consensus yet on the next direction.
If you’re already in it, I’ll focus closely on the 0.088 level. If it breaks below there and the volume doesn’t rebound, be careful. Only if trading volume expands again afterward does it have a chance to enter the next phase of the trend.
Chasing the price needs caution. For coins that spike volume in the short term, the pullback speed is often just as fast.
$USELESS #爆量暴涨 #24h+40%
Click the small card below to quickly check the market trend👇
There’s one detail I think is worth mentioning——
$USELESS is up 40% today, but just looking at the percentage gain isn’t enough; what’s really interesting is its volume.
A few hours ago, the coin’s one-hour trading volume was still under 7 million USDT. Then it ramped up steadily; the highest candlestick’s volume jumped straight to 290 million USDT—over 40 times higher than before. The price followed suit, rising from the low of 0.062 all the way to around 0.09.
In simple terms, it means a large amount of money suddenly flooded in to buy within a short period, pushing the price up rapidly.
At the moment, the volume on the last two candlesticks has already clearly decreased, suggesting the momentum is starting to fade. The price is now ranging and consolidating in the 0.088–0.090 area. This “volume dies first, price drops later” rhythm is very common—when volume can’t keep up, the price often has an easier time falling back.
The long/short ratio is 54% long vs 46% short, with relatively big disagreement. There’s no clear one-sided tilt, which indicates the market hasn’t reached a consensus yet on the next direction.
If you’re already in it, I’ll focus closely on the 0.088 level. If it breaks below there and the volume doesn’t rebound, be careful. Only if trading volume expands again afterward does it have a chance to enter the next phase of the trend.
Chasing the price needs caution. For coins that spike volume in the short term, the pullback speed is often just as fast.
$USELESS #爆量暴涨 #24h+40%
Click the small card below to quickly check the market trend👇
$USELESS is up 40% today, but just looking at the percentage gain isn’t enough; what’s really interesting is its volume.
A few hours ago, the coin’s one-hour trading volume was still under 7 million USDT. Then it ramped up steadily; the highest candlestick’s volume jumped straight to 290 million USDT—over 40 times higher than before. The price followed suit, rising from the low of 0.062 all the way to around 0.09.
In simple terms, it means a large amount of money suddenly flooded in to buy within a short period, pushing the price up rapidly.
At the moment, the volume on the last two candlesticks has already clearly decreased, suggesting the momentum is starting to fade. The price is now ranging and consolidating in the 0.088–0.090 area. This “volume dies first, price drops later” rhythm is very common—when volume can’t keep up, the price often has an easier time falling back.
The long/short ratio is 54% long vs 46% short, with relatively big disagreement. There’s no clear one-sided tilt, which indicates the market hasn’t reached a consensus yet on the next direction.
If you’re already in it, I’ll focus closely on the 0.088 level. If it breaks below there and the volume doesn’t rebound, be careful. Only if trading volume expands again afterward does it have a chance to enter the next phase of the trend.
Chasing the price needs caution. For coins that spike volume in the short term, the pullback speed is often just as fast.
$USELESS #爆量暴涨 #24h+40%
Click the small card below to quickly check the market trend👇
152

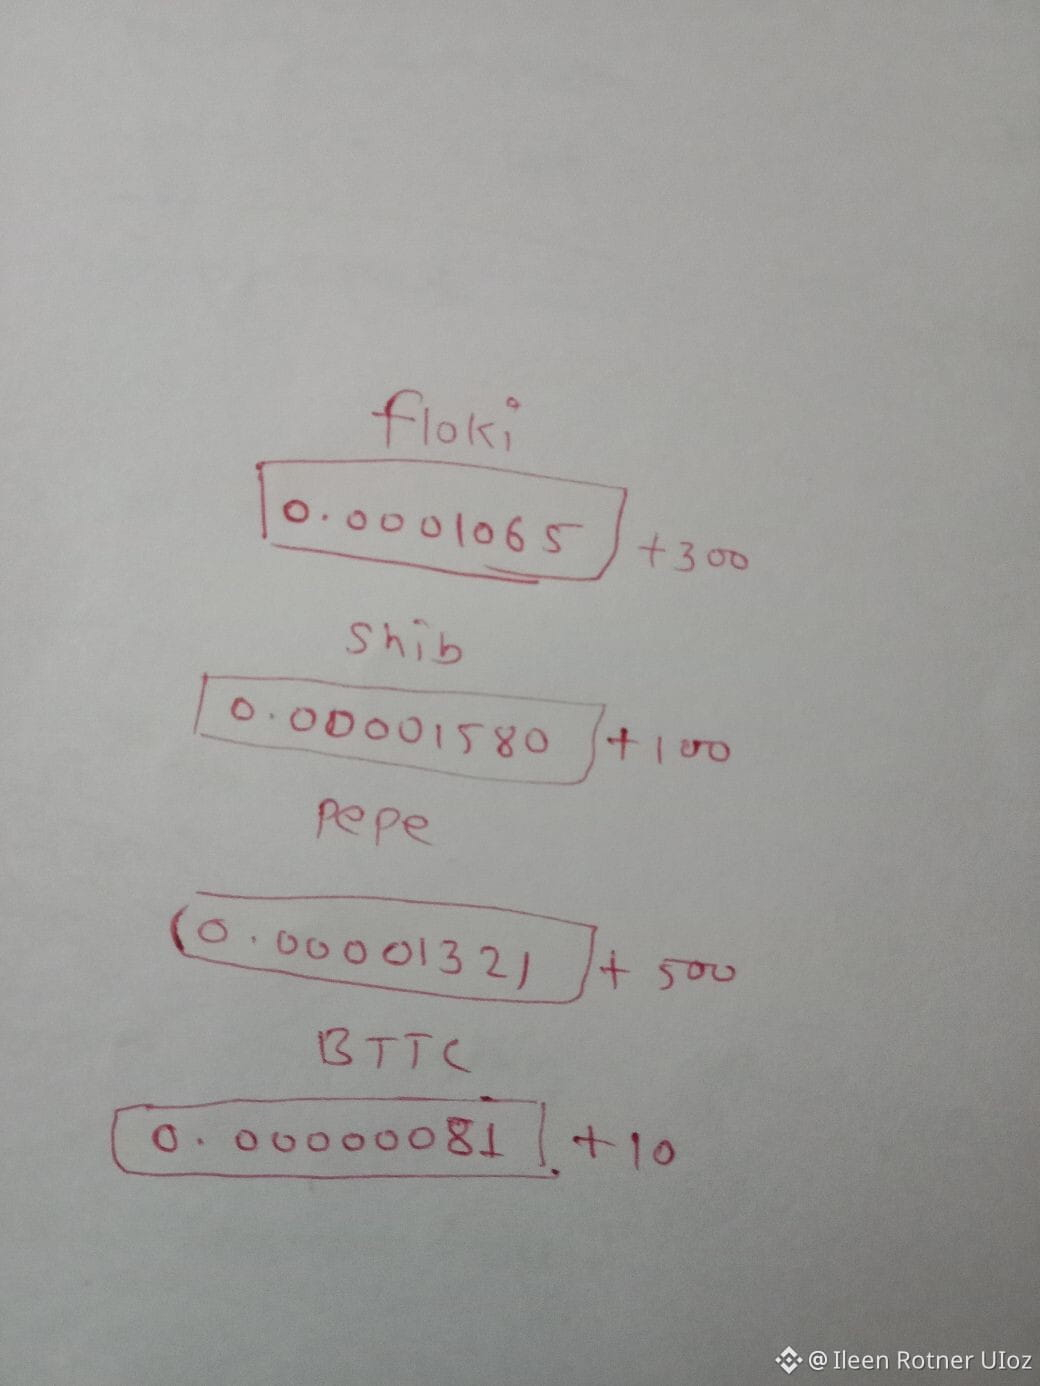
BTTC$BTC low and high productivity 24 hrs ?$BTC
{spot}(BTCUSDT)
Tera luna classic????? Burn ❤️🔥 🥶 2027 price prediction¿!!!! $LUNA
{spot}(LUNAUSDT)
#ECBOpposesEuroStablecoinExpansion #USDCCirculationUp400MWeekly #BankOfAmericaDiscloses53MCryptoETF #SECApprovesBitcoinIndexOptionsNasdaq #24h
BTTC
$BTC low and high productivity 24 hrs ?$BTC
Tera luna classic????? Burn ❤️🔥 🥶 2027 price prediction¿!!!! $LUNA
#ECBOpposesEuroStablecoinExpansion #USDCCirculationUp400MWeekly #BankOfAmericaDiscloses53MCryptoETF #SECApprovesBitcoinIndexOptionsNasdaq #24h
Tera luna classic????? Burn ❤️🔥 🥶 2027 price prediction¿!!!! $LUNA
#ECBOpposesEuroStablecoinExpansion #USDCCirculationUp400MWeekly #BankOfAmericaDiscloses53MCryptoETF #SECApprovesBitcoinIndexOptionsNasdaq #24h

Best Wishes!
From Ileen Rotner UIoz
1
197
·
--
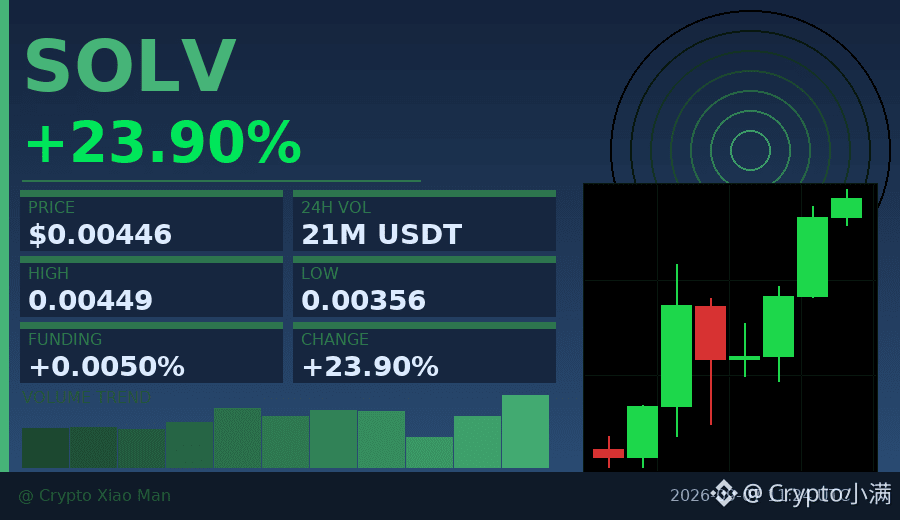
A 24% increase, but what’s truly noteworthy is the trading volume—21.4M USDT in volume paired with three consecutive hourly bullish candlesticks indicates that buy-side demand is continuously stepping in.
The long/short ratio is 58% to 42%. Bulls are slightly in the lead, but not to the point of being crowded. This mild, slightly bullish structure is actually healthier and prevents a one-sided stampede.
SOLV has risen from 0.003563 to the current 0.004459, with an amplitude of nearly 26% from low to high—there are plenty of intraday trading opportunities.
The funding rate of 0.005% is almost neutral, suggesting this rally wasn’t forced up with heavy leverage.
$SOLV #Meme爆发 #24h+24%
Click the small card below to quickly check the market👇
A 24% increase, but what’s truly noteworthy is the trading volume—21.4M USDT in volume paired with three consecutive hourly bullish candlesticks indicates that buy-side demand is continuously stepping in.
The long/short ratio is 58% to 42%. Bulls are slightly in the lead, but not to the point of being crowded. This mild, slightly bullish structure is actually healthier and prevents a one-sided stampede.
SOLV has risen from 0.003563 to the current 0.004459, with an amplitude of nearly 26% from low to high—there are plenty of intraday trading opportunities.
The funding rate of 0.005% is almost neutral, suggesting this rally wasn’t forced up with heavy leverage.
$SOLV #Meme爆发 #24h+24%
Click the small card below to quickly check the market👇
The long/short ratio is 58% to 42%. Bulls are slightly in the lead, but not to the point of being crowded. This mild, slightly bullish structure is actually healthier and prevents a one-sided stampede.
SOLV has risen from 0.003563 to the current 0.004459, with an amplitude of nearly 26% from low to high—there are plenty of intraday trading opportunities.
The funding rate of 0.005% is almost neutral, suggesting this rally wasn’t forced up with heavy leverage.
$SOLV #Meme爆发 #24h+24%
Click the small card below to quickly check the market👇
31
·
--
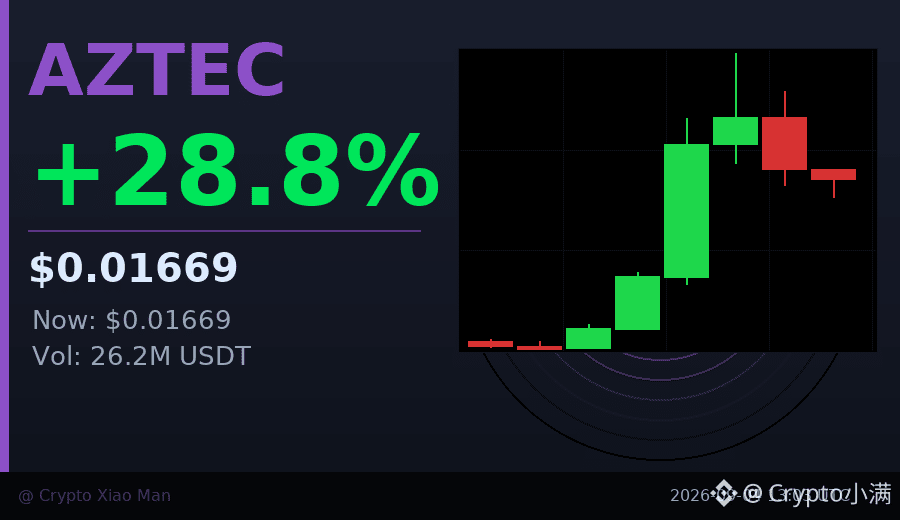
After a 29% increase, AZTEC is experiencing a typical "surge and pullback".
The volume during that sudden rally just now jumped from 1 million to 580 million USDT, clearly showing concentrated capital entering the market. But now, after 3 consecutive hourly candles closed red, the price has pulled back from the high of 0.01878 to 0.01669, and short-term profit-taking is taking place.
The long-short ratio is 58% to 42%, with longs slightly in the lead but not overly extreme. Funding rates are almost neutral, indicating leverage is not overly aggressive.
The key with this kind of pattern is whether it can hold at the current level—if it continues to fall below 0.016, it may further retest around 0.014; if it can move sideways, it means the previous gains are being digested.
$AZTEC #山寨币异动 #24h+29%
Click the small card below to quickly view the market 👇
After a 29% increase, AZTEC is experiencing a typical "surge and pullback".
The volume during that sudden rally just now jumped from 1 million to 580 million USDT, clearly showing concentrated capital entering the market. But now, after 3 consecutive hourly candles closed red, the price has pulled back from the high of 0.01878 to 0.01669, and short-term profit-taking is taking place.
The long-short ratio is 58% to 42%, with longs slightly in the lead but not overly extreme. Funding rates are almost neutral, indicating leverage is not overly aggressive.
The key with this kind of pattern is whether it can hold at the current level—if it continues to fall below 0.016, it may further retest around 0.014; if it can move sideways, it means the previous gains are being digested.
$AZTEC #山寨币异动 #24h+29%
Click the small card below to quickly view the market 👇
The volume during that sudden rally just now jumped from 1 million to 580 million USDT, clearly showing concentrated capital entering the market. But now, after 3 consecutive hourly candles closed red, the price has pulled back from the high of 0.01878 to 0.01669, and short-term profit-taking is taking place.
The long-short ratio is 58% to 42%, with longs slightly in the lead but not overly extreme. Funding rates are almost neutral, indicating leverage is not overly aggressive.
The key with this kind of pattern is whether it can hold at the current level—if it continues to fall below 0.016, it may further retest around 0.014; if it can move sideways, it means the previous gains are being digested.
$AZTEC #山寨币异动 #24h+29%
Click the small card below to quickly view the market 👇
27
Best Wishes!
From Ileen Rotner UIoz
65
Log in to explore more content
Join global crypto users on Binance Square
⚡️ Get latest and useful information about crypto.
💬 Trusted by the world’s largest crypto exchange.
👍 Discover real insights from verified creators.
Email / Phone number
Trending Topics
1
#HuangReportedlyConsidersReturnToNvidia
0 views
16 Discussing
2
#About64000BitcoinMiningMachinesReportedlyHijacked
0 views
4 Discussing
3
#CryptoSelloffTriggersMultipleWhaleLiquidations
229,361 views
2,003 Discussing
4
#USSpotXRPETFsSeeLargestWeeklyOutflowIn8Months
191,886 views
1,665 Discussing
5
#WillFOMCMinutesReinforceRateHikeExpectations?
66,412 views
831 Discussing
6
#BitcoinActiveSupplyInProfitDropsBelow45%
267,618 views
1,914 Discussing
7
#TONStrategyReports$23.97MQ3NetLoss
23,026 views
160 Discussing
8
#KavaSaysAbnormalActivityLimitedToKavaLend
177,246 views
1,096 Discussing
9
#WORPTLetsTouristsConvertCryptoToThaiBaht
70,120 views
459 Discussing
10
#WhoWillSucceedJensenHuangatNvidia?
393,145 views
2,224 Discussing