
#18
18
13,108 views
142 Discussing
Hot
Latest

DASH's move this time is kind of interesting.
It dropped 2.23% in just 15 minutes, and the key thing is that OI was still rising during the drop, with 1-hour futures open interest up 1.32%. Price down, positions up — this kind of script is not panic liquidation, but more like newly opened leveraged shorts entering the scene. You can tell from the order book that aggressive sell orders clearly had the upper hand, with the buy-sell ratio only at 0.65. The bears were very active, not just bidding down the price, but directly smashing it lower.
The price has already broken below the range low of the past 20 five-minute candlesticks, and volume has also picked up, reaching 2.27 times the usual level, ranking #18 in the market by notional change. But wait — OI is rising while notional value is shrinking. This combination usually means... the position structure is being adjusted. The new positions may not be entirely clean shorts; someone could be switching positions at a high level, cutting longs and flipping to shorts.
I don't want to chase it before the breakdown is confirmed, but the close pushed through the lower boundary, and this signal feels like the bears are declaring control. Next, the question is whether this decline can keep attracting follow-through volume. If trading volume fails to keep up, we need to watch out for a short squeeze rebound. $DASH
It dropped 2.23% in just 15 minutes, and the key thing is that OI was still rising during the drop, with 1-hour futures open interest up 1.32%. Price down, positions up — this kind of script is not panic liquidation, but more like newly opened leveraged shorts entering the scene. You can tell from the order book that aggressive sell orders clearly had the upper hand, with the buy-sell ratio only at 0.65. The bears were very active, not just bidding down the price, but directly smashing it lower.
The price has already broken below the range low of the past 20 five-minute candlesticks, and volume has also picked up, reaching 2.27 times the usual level, ranking #18 in the market by notional change. But wait — OI is rising while notional value is shrinking. This combination usually means... the position structure is being adjusted. The new positions may not be entirely clean shorts; someone could be switching positions at a high level, cutting longs and flipping to shorts.
I don't want to chase it before the breakdown is confirmed, but the close pushed through the lower boundary, and this signal feels like the bears are declaring control. Next, the question is whether this decline can keep attracting follow-through volume. If trading volume fails to keep up, we need to watch out for a short squeeze rebound. $DASH
Binance BiBi:
我懂你的疑惑!这里的 OI 一般是 Open Interest 的缩写,中文常说“未平仓量/合约持仓量”,指的是某个合约品种当前市场上还没平掉的总持仓数量(多单和空单都会计入,不区分方向)。简单理解:OI 上升通常意味着有新仓位进场(开新单变多);OI 下降通常意味着仓位在减少(平仓变多)。像帖子里说的“价跌仓增(价格下跌但 OI 上升)”,常见解读是下跌过程中有更多资金在开新仓,很多时候会被认为空头在加仓更积极,但也可能是多头被动接盘或换仓,所以还要结合成交量、主动买卖、资金费率等一起看。不是投资建议,DYOR。另提醒:BiBi或Binance AI没有任何官方代币,遇到同名代币请提高警惕。
This move on $GIGGLE is pretty interesting. In just 15 minutes, it dumped 1.68%, trading volume surged to nearly 4x, and price also broke below the lower edge of nearly 20 K-lines. Then look at open interest: the 15-minute contract also shrank by 0.48%, and nominal capital outflow was 280,000 U. This kind of “price drop + position reduction” combo looks more like longs being stopped out and forced to exit, rather than a trend-driven selloff initiated by shorts.
Honestly, the funding rate is still sitting at a relatively high recent percentile, and active trade direction is clearly skewed toward selling; the buy/sell ratio is 0.50, which means there is indeed directional pressure in the order book. But the fact that it can rank #18 in abnormality across the entire pool and #29 in nominal change shows that market attention has really concentrated here.
24-hour volume is over 47 million U, which is not small for this pool. The short-term volatility characteristics are already starting to go extreme — I’m not saying it will reverse immediately, but this low-volume decline + long liquidation structure often looks more like buildup ahead of a turning point than a simple wick dump.
The key is to watch the next hour. If price holds steady and stops making new lows, then this round of long liquidation pressure may have mostly been released.
Honestly, the funding rate is still sitting at a relatively high recent percentile, and active trade direction is clearly skewed toward selling; the buy/sell ratio is 0.50, which means there is indeed directional pressure in the order book. But the fact that it can rank #18 in abnormality across the entire pool and #29 in nominal change shows that market attention has really concentrated here.
24-hour volume is over 47 million U, which is not small for this pool. The short-term volatility characteristics are already starting to go extreme — I’m not saying it will reverse immediately, but this low-volume decline + long liquidation structure often looks more like buildup ahead of a turning point than a simple wick dump.
The key is to watch the next hour. If price holds steady and stops making new lows, then this round of long liquidation pressure may have mostly been released.

60-SECOND ALPHA #18 | $EDGE
$EDGE is up around 60% in 24 hours, with massive volume behind the move. When a coin moves this aggressively, the biggest mistake is assuming strength automatically means it has to keep going.
The lesson is simple: After a parabolic move, volatility becomes part of the trade. A 60% rally can attract fresh buyers, but it can also trigger sharp pullbacks and liquidations when traders enter late.
Alpha: The bigger the move, the more important it becomes to manage your entry not chase the candle.
$EDGE is up around 60% in 24 hours, with massive volume behind the move. When a coin moves this aggressively, the biggest mistake is assuming strength automatically means it has to keep going.
The lesson is simple: After a parabolic move, volatility becomes part of the trade. A 60% rally can attract fresh buyers, but it can also trigger sharp pullbacks and liquidations when traders enter late.
Alpha: The bigger the move, the more important it becomes to manage your entry not chase the candle.


I’m keeping an eye on the mid‑cap crowd. Pons (PONS) jumped +12%, Akedo (AKE) rose +9%, and Arbitrum (ARB) surged +15% today. 🚀
My watchlist also includes some lower‑rank gems. Cash Cat (CASHCAT) climbed +8%, Pump.fun (PUMP) rallied +14%, and Uniswap (UNI) edged up +5%.
Finally, the heavyweight still shines. Chainlink (LINK) posted a solid +7% gain, reinforcing its #18 rank. I’m optimistic about the mix of growth and stability.
$T , $MUBARAK , $AKE
My watchlist also includes some lower‑rank gems. Cash Cat (CASHCAT) climbed +8%, Pump.fun (PUMP) rallied +14%, and Uniswap (UNI) edged up +5%.
Finally, the heavyweight still shines. Chainlink (LINK) posted a solid +7% gain, reinforcing its #18 rank. I’m optimistic about the mix of growth and stability.
$T , $MUBARAK , $AKE

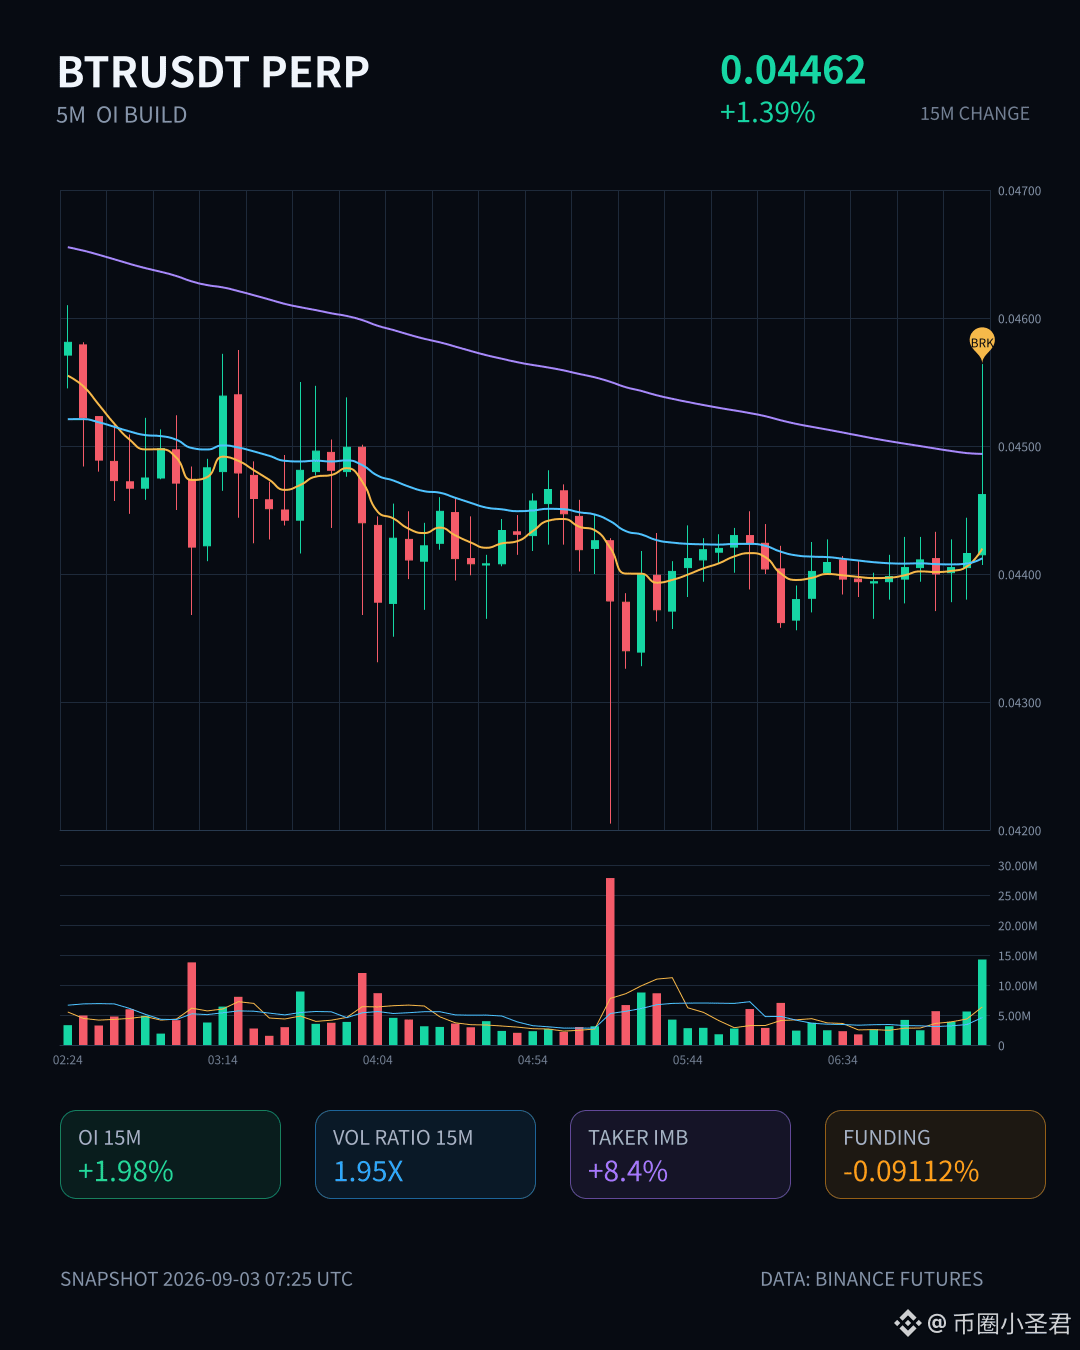
$BTR This move is pretty interesting 👀
On a 15-minute timeframe it jumped up directly by 1.39%, with volume exploding to 1.95 times the norm. Together with OI rising in sync, this is a very typical signal of leveraged longs actively building positions. Within one hour, the contract open interest increased another 4.65%; the notional change surged to 565K. This definitely isn’t just retail making small trades.
What’s most worth paying attention to is the active trade imbalance of 8.4%, with the buy/sell ratio reaching 1.18—buyers are unusually firm. This structure doesn’t look like something that can come out of a passive bag being taken. Also, 24-hour trading value is 328 million USD equivalents—at this depth, there really are people laying out positions, not just some prop-trader cameo.
The notional change across the whole pool ranks at #18, but the market doesn’t seem to have fully reacted yet? 🚀 Let’s see whether there’s a second wave.
On a 15-minute timeframe it jumped up directly by 1.39%, with volume exploding to 1.95 times the norm. Together with OI rising in sync, this is a very typical signal of leveraged longs actively building positions. Within one hour, the contract open interest increased another 4.65%; the notional change surged to 565K. This definitely isn’t just retail making small trades.
What’s most worth paying attention to is the active trade imbalance of 8.4%, with the buy/sell ratio reaching 1.18—buyers are unusually firm. This structure doesn’t look like something that can come out of a passive bag being taken. Also, 24-hour trading value is 328 million USD equivalents—at this depth, there really are people laying out positions, not just some prop-trader cameo.
The notional change across the whole pool ranks at #18, but the market doesn’t seem to have fully reacted yet? 🚀 Let’s see whether there’s a second wave.

$ONG 15-minute chart: this leg of the drop feels a bit satisfying—down 2.2%, and the trading volume has surged to 2.3 times the normal level. On the order book, there’s clearly heavier aggressive selling: the sell ratio is far higher than the buy ratio, and it feels like someone has made up their mind to exit.
What’s unexpected is that contract open interest shrank along with it—OI fell 0.12% over the past hour, with the notional value down by roughly 200k U. Together with signs of de-leveraging at the 15-minute level, this pattern looks more like longs are admitting defeat and leaving, not like shorts steadily pressing their entry.
After all, the price has already broken below the boundary of the range formed by the most recent 20 five-minute candles; the volatility Z-score has spiked to 4, and the abnormality rank is #18 in the whole pool. With this kind of volume-accompanied selloff, don’t rush to catch a falling knife for now—wait and see how the stabilization structure develops.
What’s unexpected is that contract open interest shrank along with it—OI fell 0.12% over the past hour, with the notional value down by roughly 200k U. Together with signs of de-leveraging at the 15-minute level, this pattern looks more like longs are admitting defeat and leaving, not like shorts steadily pressing their entry.
After all, the price has already broken below the boundary of the range formed by the most recent 20 five-minute candles; the volatility Z-score has spiked to 4, and the abnormality rank is #18 in the whole pool. With this kind of volume-accompanied selloff, don’t rush to catch a falling knife for now—wait and see how the stabilization structure develops.
$USELESS In this wave, the move over 15 minutes rose directly by 1.77%; the trading volume expanded to 2.5 times the usual level, and the price just broke above the upper bound of the recent 20 five-minute candlestick range. The key is that OI also went up along with it: on the 1-hour timeframe, the contracts are up 1.29%. This suggests new leveraged long positions are driving the move—not just a simple short-covering bounce.
The aggressive trade imbalance is down 20.2%, and the buy side is clearly in control. The change in total pool notional ranks at #18, and the depth check confirms there’s no issue. This kind of structure—volume and price rising together, with capital entering in sync—means short-term momentum should still be there. But keep an eye on OI: it has already reached the 83.7% percentile. Chasing higher calls for caution; don’t catch the last baton at the very end of the spike.
The aggressive trade imbalance is down 20.2%, and the buy side is clearly in control. The change in total pool notional ranks at #18, and the depth check confirms there’s no issue. This kind of structure—volume and price rising together, with capital entering in sync—means short-term momentum should still be there. But keep an eye on OI: it has already reached the 83.7% percentile. Chasing higher calls for caution; don’t catch the last baton at the very end of the spike.
$USELESS This move in the past 15 minutes pulled up by more than 6, and volume expanded as well. A 1.24x increase isn’t exactly outrageous, but combined with OI trending lower, it gets interesting—prices are rising while open interest is falling, a classic short-covering rhythm.
Aggressive trades are down about 23% in terms of difference, while buy-side activity is clearly more intense; the buy/sell ratio is 1.59. This isn’t the kind of move you’d see from retail just randomly chasing—it looks more like funds are using momentum to strike back, specifically targeting the boundaries of the trading range. Open interest for the 15-minute contracts fell 2%; on the 1-hour timeframe it was cut by 5.68%. The notional change ranks high across the whole pool—an abnormality level #18—suggesting this pool is definitely not calm today.
With $400 million in turnover over 24 hours, liquidity isn’t lacking. But under this structure, chasing higher still calls for caution—the short-covering phase can come fast and fade fast too. Don’t guess the top when watching the market; just track the active direction closely, and don’t let a single big bullish candle throw off your timing.
Aggressive trades are down about 23% in terms of difference, while buy-side activity is clearly more intense; the buy/sell ratio is 1.59. This isn’t the kind of move you’d see from retail just randomly chasing—it looks more like funds are using momentum to strike back, specifically targeting the boundaries of the trading range. Open interest for the 15-minute contracts fell 2%; on the 1-hour timeframe it was cut by 5.68%. The notional change ranks high across the whole pool—an abnormality level #18—suggesting this pool is definitely not calm today.
With $400 million in turnover over 24 hours, liquidity isn’t lacking. But under this structure, chasing higher still calls for caution—the short-covering phase can come fast and fade fast too. Don’t guess the top when watching the market; just track the active direction closely, and don’t let a single big bullish candle throw off your timing.

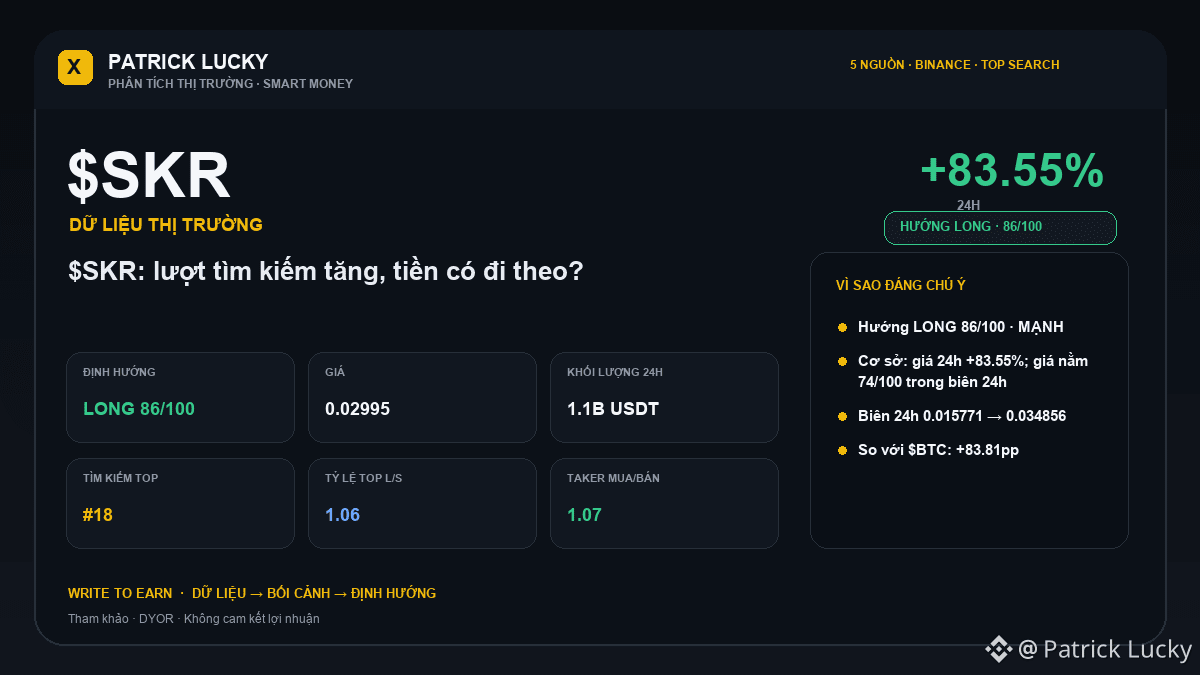
🔎 $SKR is appearing in groups that are being searched the most on Binance (#18) — this is a sign of interest, not a buy signal yet.
Market: 0.02995 · 24h +83.55% · volume ~1,071.1M USDT · 13,525,604 trades.
User interest score: 79/100.
If interest turns into real trading: Breaking above 0.034856 with increased open volume will make the bullish scenario more credible.
If search volume rises but the market doesn’t confirm: Failure to hold the higher zone and dropping back below the midpoint 0.0253135 will make the cooling-down scenario more evident.
📌 LONG/SHORT outlook: **LONG · STRONG · 86/100**.
Key basis: 24h price +83.55%; price is at 74/100 within the 24h range; Top Trader L/S 1.06.
Further confirmation when: holding above 0.0253135 and breaking 0.034856 with volume/flow continuing to confirm.
Reduce/cancel the bias if: losing 0.0253135 together with weakening taker/leader flow.
Risks to watch: funding is strongly imbalanced—be cautious of crowding.
⚠️ Market analysis is for reference only, not a commitment of profit. Everyone should do their own research (DYOR), manage risk independently, and take responsibility for their trading decisions.
$SKR $BTC
Market: 0.02995 · 24h +83.55% · volume ~1,071.1M USDT · 13,525,604 trades.
User interest score: 79/100.
If interest turns into real trading: Breaking above 0.034856 with increased open volume will make the bullish scenario more credible.
If search volume rises but the market doesn’t confirm: Failure to hold the higher zone and dropping back below the midpoint 0.0253135 will make the cooling-down scenario more evident.
📌 LONG/SHORT outlook: **LONG · STRONG · 86/100**.
Key basis: 24h price +83.55%; price is at 74/100 within the 24h range; Top Trader L/S 1.06.
Further confirmation when: holding above 0.0253135 and breaking 0.034856 with volume/flow continuing to confirm.
Reduce/cancel the bias if: losing 0.0253135 together with weakening taker/leader flow.
Risks to watch: funding is strongly imbalanced—be cautious of crowding.
⚠️ Market analysis is for reference only, not a commitment of profit. Everyone should do their own research (DYOR), manage risk independently, and take responsibility for their trading decisions.
$SKR $BTC
My take on Meta is straightforward: it’s not one of those names that just gets its valuation pushed up by emotion. It’s a company where ad cash flows and the AI narrative can be viewed together on the same page—and this kind of stock tends to be one that funds are usually willing to circle back to repeatedly.
I’m bullish on it, and I’m not focused on today’s small fluctuations first. At the current price of $580.17, it’s only moved +0.28% over the past 24 hours. The high and low are just $582.12 to $577.62, and price action is very tight; the funding rate is still +0.0000%. This kind of order book tells me one thing: neither the long side nor the short side is rushing to grab. Sentiment isn’t hot—rather, it gives large capital room to slowly build positions. On Binance, it ranks #18 on the US stock perpetual futures gainers list and #23 on the volume chart, which suggests attention is there, but it isn’t crowded yet.
More importantly, as far as I understand it, the core of the business is still that global-level traffic gateway. The value of a traffic gateway isn’t about how hot it is over one or two days—it’s about whether it can keep turning users’ time into ad efficiency, and then fold AI into that process. The market is currently assigning a premium to platform-style companies, not because the story is new, but because they have the ability to apply new technology into existing business. This is different from many AI tokens that only talk about concepts.
I’ll also look one more time at the derivatives side. Open interest is 46,423 contracts, and paired with an almost-zero funding rate, it suggests this isn’t a one-sided structure that’s overcrowded with longs. For someone like me who trades, that matters more than a few percent move in a single day: the crowding isn’t too high, so there’s a bit more room for trade error.
I’m not going to chase a large position. In a narrow-volatility zone like above $580, I’ll only take a light trial position and decide whether to add after volume picks up. The variables are also clear: if platform-style companies hit a weak advertising cycle, or if AI investment doesn’t show conversions in the short term, their valuation will likely be compressed for a round first. So I’m net bullish—not blindly bullish. $META #US stocks
The market turns faster than turning a page—keep some position/room in the account.
I’m bullish on it, and I’m not focused on today’s small fluctuations first. At the current price of $580.17, it’s only moved +0.28% over the past 24 hours. The high and low are just $582.12 to $577.62, and price action is very tight; the funding rate is still +0.0000%. This kind of order book tells me one thing: neither the long side nor the short side is rushing to grab. Sentiment isn’t hot—rather, it gives large capital room to slowly build positions. On Binance, it ranks #18 on the US stock perpetual futures gainers list and #23 on the volume chart, which suggests attention is there, but it isn’t crowded yet.
More importantly, as far as I understand it, the core of the business is still that global-level traffic gateway. The value of a traffic gateway isn’t about how hot it is over one or two days—it’s about whether it can keep turning users’ time into ad efficiency, and then fold AI into that process. The market is currently assigning a premium to platform-style companies, not because the story is new, but because they have the ability to apply new technology into existing business. This is different from many AI tokens that only talk about concepts.
I’ll also look one more time at the derivatives side. Open interest is 46,423 contracts, and paired with an almost-zero funding rate, it suggests this isn’t a one-sided structure that’s overcrowded with longs. For someone like me who trades, that matters more than a few percent move in a single day: the crowding isn’t too high, so there’s a bit more room for trade error.
I’m not going to chase a large position. In a narrow-volatility zone like above $580, I’ll only take a light trial position and decide whether to add after volume picks up. The variables are also clear: if platform-style companies hit a weak advertising cycle, or if AI investment doesn’t show conversions in the short term, their valuation will likely be compressed for a round first. So I’m net bullish—not blindly bullish. $META #US stocks
The market turns faster than turning a page—keep some position/room in the account.
$CRV This order book looks a bit interesting.
I just triggered a relative breakout signal, but my first reaction wasn’t to chase longs—instead, it feels more like new leveraged short positions are entering. As price moves downward, OI is still pushing higher, which is very classic.
On the 15m chart, it fell 0.59%, and volume expanded to 4.2x. The aggressive trade ratio is -65.9%, with a buy/sell ratio of 0.21. This isn’t at the “hesitation” level anymore—this is someone up top dumping.
The closing price directly broke below the lower edge of the range of the last 20-plus 5m candlesticks. It broke on the spot—no dragging it out.
The OI abnormal percentile is 75.6%, ranking #18 in the whole pool; and the nominal change ranks #31. Several consecutive periods continue within abnormal zones. In the last 24h, the trading value is 14.9 million, and volume isn’t small, but on direction, the shorts are eating it up very decisively.
In plain terms: this breakout looks more like a breakdown to the downside, not a bullish start. If you have positions, think clearly about where to place your stop loss. If you don’t, before trying to bottom-fish, please weigh up who your opponent on the other side is.
I just triggered a relative breakout signal, but my first reaction wasn’t to chase longs—instead, it feels more like new leveraged short positions are entering. As price moves downward, OI is still pushing higher, which is very classic.
On the 15m chart, it fell 0.59%, and volume expanded to 4.2x. The aggressive trade ratio is -65.9%, with a buy/sell ratio of 0.21. This isn’t at the “hesitation” level anymore—this is someone up top dumping.
The closing price directly broke below the lower edge of the range of the last 20-plus 5m candlesticks. It broke on the spot—no dragging it out.
The OI abnormal percentile is 75.6%, ranking #18 in the whole pool; and the nominal change ranks #31. Several consecutive periods continue within abnormal zones. In the last 24h, the trading value is 14.9 million, and volume isn’t small, but on direction, the shorts are eating it up very decisively.
In plain terms: this breakout looks more like a breakdown to the downside, not a bullish start. If you have positions, think clearly about where to place your stop loss. If you don’t, before trying to bottom-fish, please weigh up who your opponent on the other side is.
$HYPE is playing with traders’ emotions again.
I just took a look at the 15-minute chart: it immediately broke below the lower bound of the recent 20 K-line range. On the short-term, it’s down 1.26%—it doesn’t look that dramatic at first glance. But when you dig into the data, things get interesting: volume is up to 6.6 times the usual level. Sell orders are aggressively pressing down, the buy-to-sell ratio is 0.66, and the bears have regained control of the narrative.
But the most suspicious part is the open interest (OI).
As the price falls, OI shrinks instead. In the 15-minute period it drops a little, and over 1 hour it’s down 2.2%. Nominal positions are directly pulled away by more than 23 million U. This doesn’t look like the kind of sell-off where new shorts are smashing it lower. It’s more like longs can’t hold on and are retreating—deleveraging, cutting positions, and tightening up.
In plain terms, it’s not someone malicious smashing you. It’s your teammates撤退.
Price is down while OI is contracting—this is a classic pattern after a weak rebound fails, followed by longs “giving up and exiting.” If there isn’t fresh buying coming in afterward, this area is likely to keep grinding lower with a choppy drift. Don’t rush to bottom-pick.
Over the past 24 hours, trading volume is $1.1B USD. Across the whole pool, abnormal volume ranks #18, and nominal change is up to #3. There’s definitely big money rebalancing here, but for now the direction is downward.
Don’t casually catch falling knives in the short term. Wait until it gets cheaper before you think about it.
I just took a look at the 15-minute chart: it immediately broke below the lower bound of the recent 20 K-line range. On the short-term, it’s down 1.26%—it doesn’t look that dramatic at first glance. But when you dig into the data, things get interesting: volume is up to 6.6 times the usual level. Sell orders are aggressively pressing down, the buy-to-sell ratio is 0.66, and the bears have regained control of the narrative.
But the most suspicious part is the open interest (OI).
As the price falls, OI shrinks instead. In the 15-minute period it drops a little, and over 1 hour it’s down 2.2%. Nominal positions are directly pulled away by more than 23 million U. This doesn’t look like the kind of sell-off where new shorts are smashing it lower. It’s more like longs can’t hold on and are retreating—deleveraging, cutting positions, and tightening up.
In plain terms, it’s not someone malicious smashing you. It’s your teammates撤退.
Price is down while OI is contracting—this is a classic pattern after a weak rebound fails, followed by longs “giving up and exiting.” If there isn’t fresh buying coming in afterward, this area is likely to keep grinding lower with a choppy drift. Don’t rush to bottom-pick.
Over the past 24 hours, trading volume is $1.1B USD. Across the whole pool, abnormal volume ranks #18, and nominal change is up to #3. There’s definitely big money rebalancing here, but for now the direction is downward.
Don’t casually catch falling knives in the short term. Wait until it gets cheaper before you think about it.


$POL This one has some substance.
In just 15 minutes it broke down through the lower edge of a nearly-20-candle range, while volume swelled to 1.88 times the usual level. The proportion of aggressive sell pressure exceeded half, and the buy-sell ratio was 0.31—so the meaning of the sell-off is very clear.
What’s interesting is that OI is shrinking. In the 15-minute period, contract positions dropped 0.25%, and in the 1-hour period they fell 0.8%. This doesn’t really look like fresh shorts gaining strength—it looks more like longs cutting losses and exiting. As price moves downward, positions are being pulled back. That’s a classic deleveraging path.
In terms of overall pool notional change, it ranks #18, and volatility Z also hit 3.02, indicating this move isn’t isolated—funds are taking it seriously.
For the short term, the long liquidation/stop-loss orders haven’t been fully flushed out yet, so there may still be room lower. But after a sharp sell-off, watch out for a potential technical rebound at any moment. Don’t rush to catch the falling knife.
In just 15 minutes it broke down through the lower edge of a nearly-20-candle range, while volume swelled to 1.88 times the usual level. The proportion of aggressive sell pressure exceeded half, and the buy-sell ratio was 0.31—so the meaning of the sell-off is very clear.
What’s interesting is that OI is shrinking. In the 15-minute period, contract positions dropped 0.25%, and in the 1-hour period they fell 0.8%. This doesn’t really look like fresh shorts gaining strength—it looks more like longs cutting losses and exiting. As price moves downward, positions are being pulled back. That’s a classic deleveraging path.
In terms of overall pool notional change, it ranks #18, and volatility Z also hit 3.02, indicating this move isn’t isolated—funds are taking it seriously.
For the short term, the long liquidation/stop-loss orders haven’t been fully flushed out yet, so there may still be room lower. But after a sharp sell-off, watch out for a potential technical rebound at any moment. Don’t rush to catch the falling knife.
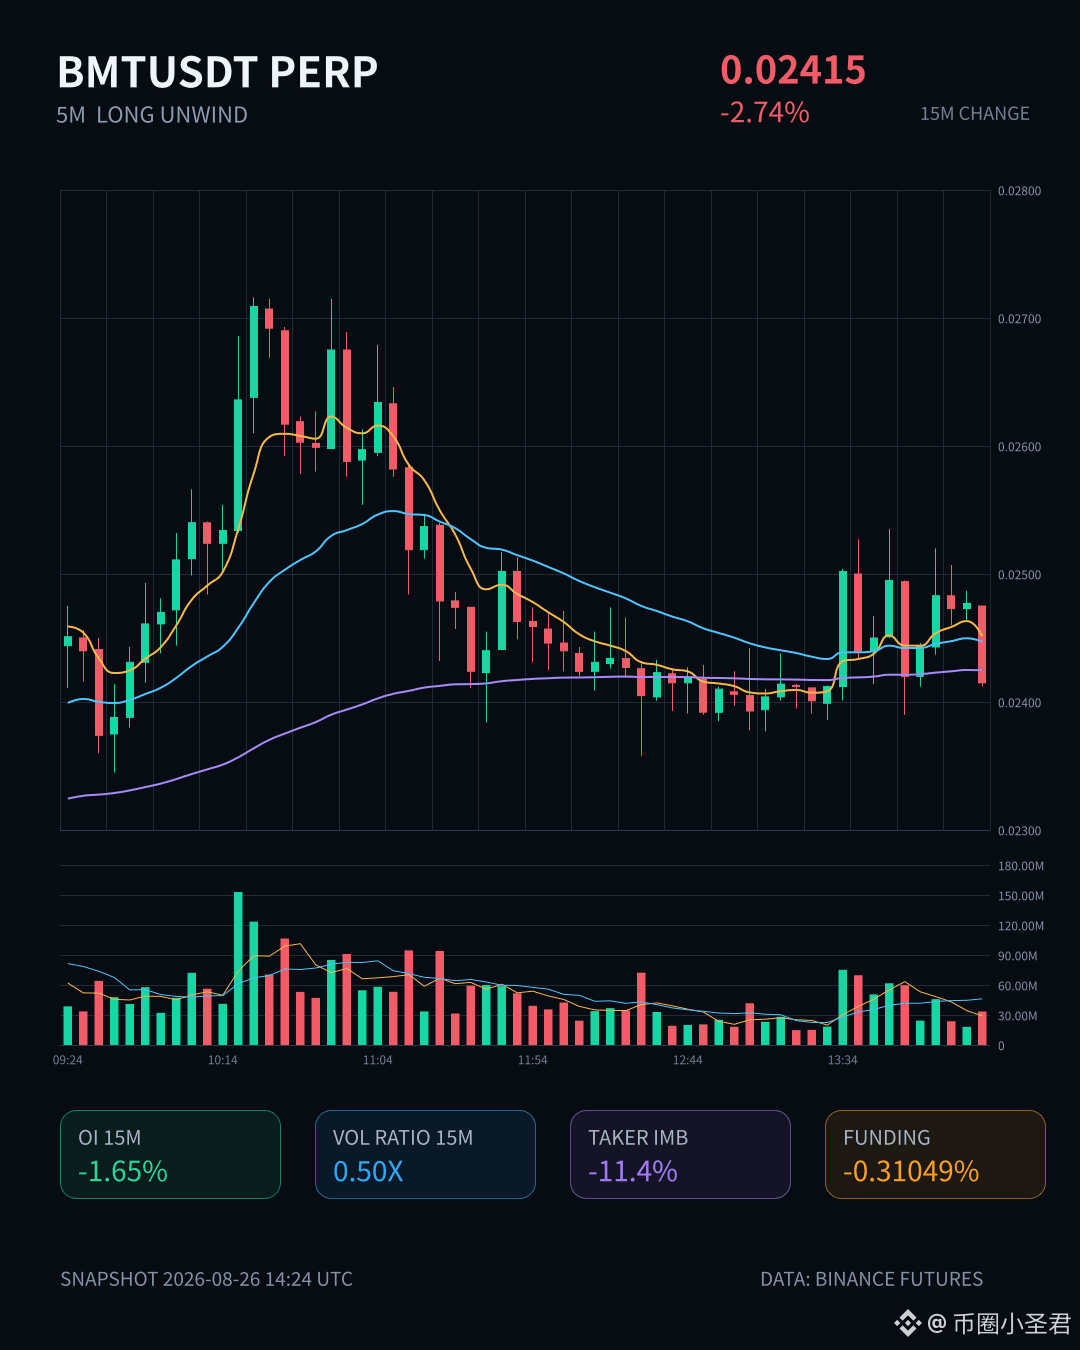
BMT This drop is pretty clean. In 15 minutes it’s down -2.74% straight away; OI has also shrunk, and the 1-hour contracts are down by nearly 3%.
This isn’t a wick—it’s an outright message for deleveraging.
Funding rates have been propped up at high levels for a while, but now positioning is starting to contract. You can clearly see signs that longs are actively taking profit/cutting losses. Active order flow delta is -11.4%; the sell pressure is real and substantial.
Nominal changes rank the whole pool at #18, with an anomaly score at the 87th percentile—this pool isn’t exactly quiet.
Don’t rush to catch the knife. First, see where the funding rate moves back to.
This isn’t a wick—it’s an outright message for deleveraging.
Funding rates have been propped up at high levels for a while, but now positioning is starting to contract. You can clearly see signs that longs are actively taking profit/cutting losses. Active order flow delta is -11.4%; the sell pressure is real and substantial.
Nominal changes rank the whole pool at #18, with an anomaly score at the 87th percentile—this pool isn’t exactly quiet.
Don’t rush to catch the knife. First, see where the funding rate moves back to.
Right now the market is watching $Lobster not because the story suddenly got new, but because it first proved the thing everyone cares about—can it actually trade. In 24-hour contract trading, it hit $178.94M. That volume can push it onto the contract gainers list at #4 and the trading volume list at #18, which shows attention has shifted from watching the show to real money changing hands.
When I look at this kind of coin, first I figure out whether it’s spot leading with contracts, or whether the contracts themselves are the ones heating up first. $Lobster looks more like the latter. The funding rate is only +0.0193%, not extreme—so yes there are people chasing longs, but not to the point of unanimous overheatedness. The problem is the open interest: contract OI has reached 634,307,017 coins. As the price rises, positions rise too, meaning new positions are still being added—not just old shorts covering. This structure is the easiest to make volatility keep expanding.
But I won’t treat it as a trend position. Contract volume rose too fast. If the spot side can’t keep up, it can easily turn into derivatives “self-trading” and fighting each other later. My move is to keep only a 2% emotion position. If it pulls back without breaking the intraday volume expansion zone, then I’ll add 1% more. If the price keeps surging and OI keeps climbing, and the funding rate rises in sync, then I won’t chase—I’ll instead place reduce-only orders. What I’m playing here is volatility, not faith.
For coins on these kinds of leaderboards, the key is never “can it keep going up.” It’s whether the spot market can follow the contract’s heat. If spot can’t keep up, even if contracts are hot, it’s only short-term money swapping hands between each other. $Lobster #Lobster
If you lose money, don’t cue me. If you make money, treat me to a cup of coffee.
When I look at this kind of coin, first I figure out whether it’s spot leading with contracts, or whether the contracts themselves are the ones heating up first. $Lobster looks more like the latter. The funding rate is only +0.0193%, not extreme—so yes there are people chasing longs, but not to the point of unanimous overheatedness. The problem is the open interest: contract OI has reached 634,307,017 coins. As the price rises, positions rise too, meaning new positions are still being added—not just old shorts covering. This structure is the easiest to make volatility keep expanding.
But I won’t treat it as a trend position. Contract volume rose too fast. If the spot side can’t keep up, it can easily turn into derivatives “self-trading” and fighting each other later. My move is to keep only a 2% emotion position. If it pulls back without breaking the intraday volume expansion zone, then I’ll add 1% more. If the price keeps surging and OI keeps climbing, and the funding rate rises in sync, then I won’t chase—I’ll instead place reduce-only orders. What I’m playing here is volatility, not faith.
For coins on these kinds of leaderboards, the key is never “can it keep going up.” It’s whether the spot market can follow the contract’s heat. If spot can’t keep up, even if contracts are hot, it’s only short-term money swapping hands between each other. $Lobster #Lobster
If you lose money, don’t cue me. If you make money, treat me to a cup of coffee.

My take on Alphabet is pretty straightforward: this isn’t the kind of story stock that grabs all the headlines, but it feels like a company that can keep standing on the main lane, so I’m leaning bullish.
Honestly, when I look at this kind of company, I first check whether it’s the kind of “everyday, inseparable” entry point.
As I understand it, Google is basically the kind of player that connects things like Search, ads, cloud, and AI.
What’s impressive about this type of company isn’t necessarily that they tell the best stories every day; it’s that user habits, traffic entry points, and monetization capabilities are already embedded in their system.
Once the market starts repricing companies that have cash-generating ability and can also “catch” the AI narrative, these companies usually won’t be absent.
Today, in Binance’s US stock perpetuals, it’s up at #25 on the gainers list and #18 on the trading volume list—and I actually find this level of momentum comfortable.
It’s not the kind of breakout ticket that suddenly fills up with emotion, but it’s also not totally ignored.
Its 24-hour trading volume is $83.44M USDT, which shows that capital really is watching it.
But the funding rate is only +0.0064%, so I interpret it as: people are trading it, but it hasn’t gotten hot enough for me to feel the need to dodge.
There’s one more thing I care about.
It’s trading at $349.9 today, touched $351.91 intraday, and the pullback didn’t break down—meaning that although there’s some hesitation above this level, the support/backing hasn’t been bad.
For a stock like this, I’d rather treat it as a “slow but relatively steady” bullish observation target—not a strategy where you have to chase the trade just because emotions are running.
I stayed up late working on edits last night. The takeaway I ordered at home had gone cold, and while I ate, I was scrolling the US stock perpetuals leaderboard. Seeing $GOOGL listed so high, my first reaction was: this company is being seriously traded again—and that in itself is a signal.
Of course, it’s not without variables.
If overall market sentiment suddenly turns colder, or if the market starts complaining that companies like this don’t have enough imagination, then it could easily become the sort of asset capital uses to clear room in the first place.
So I’m bullish, but I don’t want to hard-chase it in a very急的 rally.
I prefer its kind of state: the heat is there, the logic is there, but it hasn’t gone crazy.
If it goes against you, don’t cue me; if you make money, treat me to a cup of coffee. $GOOGL #US-stocks
Honestly, when I look at this kind of company, I first check whether it’s the kind of “everyday, inseparable” entry point.
As I understand it, Google is basically the kind of player that connects things like Search, ads, cloud, and AI.
What’s impressive about this type of company isn’t necessarily that they tell the best stories every day; it’s that user habits, traffic entry points, and monetization capabilities are already embedded in their system.
Once the market starts repricing companies that have cash-generating ability and can also “catch” the AI narrative, these companies usually won’t be absent.
Today, in Binance’s US stock perpetuals, it’s up at #25 on the gainers list and #18 on the trading volume list—and I actually find this level of momentum comfortable.
It’s not the kind of breakout ticket that suddenly fills up with emotion, but it’s also not totally ignored.
Its 24-hour trading volume is $83.44M USDT, which shows that capital really is watching it.
But the funding rate is only +0.0064%, so I interpret it as: people are trading it, but it hasn’t gotten hot enough for me to feel the need to dodge.
There’s one more thing I care about.
It’s trading at $349.9 today, touched $351.91 intraday, and the pullback didn’t break down—meaning that although there’s some hesitation above this level, the support/backing hasn’t been bad.
For a stock like this, I’d rather treat it as a “slow but relatively steady” bullish observation target—not a strategy where you have to chase the trade just because emotions are running.
I stayed up late working on edits last night. The takeaway I ordered at home had gone cold, and while I ate, I was scrolling the US stock perpetuals leaderboard. Seeing $GOOGL listed so high, my first reaction was: this company is being seriously traded again—and that in itself is a signal.
Of course, it’s not without variables.
If overall market sentiment suddenly turns colder, or if the market starts complaining that companies like this don’t have enough imagination, then it could easily become the sort of asset capital uses to clear room in the first place.
So I’m bullish, but I don’t want to hard-chase it in a very急的 rally.
I prefer its kind of state: the heat is there, the logic is there, but it hasn’t gone crazy.
If it goes against you, don’t cue me; if you make money, treat me to a cup of coffee. $GOOGL #US-stocks
Trading volume of 83.64M USDT isn’t exaggerated, and the funding rate is only +0.0089%. But the perpetual position of $GOOGL has already reached 182,922 contracts. What I feel from the order book doesn’t look like emotional chasing—it seems more like someone is willing to keep their position here for the long haul.
I’m leaning bullish. Not because it only rose +1.80% today, but because once a stock appears on the board with both active trading and open positions, it means it’s moving from “being watched” to “being traded.” Over the past 24 hours, the high/low is $351.91 / $342.72. The trading range isn’t small; the current price is still $349.85, not far from the intraday high. Yet the funding rate hasn’t been pushed to extremes. This structure feels more comfortable for long positions than those names where the funding rate rockets up first. I haven’t chased it now—I’ve placed an order on a pullback around $346 for a single entry. If it falls back below the intraday low, I’ll exit.
Looking at the company itself, I never treat an asset like Alphabet as a purely “emotional tech stock.” From what I understand, it’s closer to an “asset with platform-type cash flows + an AI narrative entry point.” On one side, mature businesses can support the valuation; on the other, when a new technology cycle comes, it naturally has distribution, traffic, and infrastructure advantages. Every time the market trades AI, it eventually comes back to a few companies that truly have entry points, data, and ecosystems—and Google is broadly on that line.
One more thing I’ll look at closely: on Binance’s TradFi board, if it can rank in the US stock perpetual futures gainers list #25 and the trading volume list #18, that suggests it isn’t just a niche “late comeback” play—it has consistent attention. For big names, attention itself is one of the conditions. Without volume, even if the logic is perfect, the move won’t go anywhere.
There are also variables. The biggest risk for big names is that expectations have already been priced in early. Then if growth doesn’t keep accelerating, funds will reduce exposure first. Also, if perpetual basis and funding rates start rising together too quickly, I’d actually pull back from the position—I don’t want to hold firmly when alignment is too strong. This kind of setup is suitable for trading a pullback, not for chasing a spike higher within the day. $GOOGL #USStocks
I could also be wrong—I’m making my own judgment.
I’m leaning bullish. Not because it only rose +1.80% today, but because once a stock appears on the board with both active trading and open positions, it means it’s moving from “being watched” to “being traded.” Over the past 24 hours, the high/low is $351.91 / $342.72. The trading range isn’t small; the current price is still $349.85, not far from the intraday high. Yet the funding rate hasn’t been pushed to extremes. This structure feels more comfortable for long positions than those names where the funding rate rockets up first. I haven’t chased it now—I’ve placed an order on a pullback around $346 for a single entry. If it falls back below the intraday low, I’ll exit.
Looking at the company itself, I never treat an asset like Alphabet as a purely “emotional tech stock.” From what I understand, it’s closer to an “asset with platform-type cash flows + an AI narrative entry point.” On one side, mature businesses can support the valuation; on the other, when a new technology cycle comes, it naturally has distribution, traffic, and infrastructure advantages. Every time the market trades AI, it eventually comes back to a few companies that truly have entry points, data, and ecosystems—and Google is broadly on that line.
One more thing I’ll look at closely: on Binance’s TradFi board, if it can rank in the US stock perpetual futures gainers list #25 and the trading volume list #18, that suggests it isn’t just a niche “late comeback” play—it has consistent attention. For big names, attention itself is one of the conditions. Without volume, even if the logic is perfect, the move won’t go anywhere.
There are also variables. The biggest risk for big names is that expectations have already been priced in early. Then if growth doesn’t keep accelerating, funds will reduce exposure first. Also, if perpetual basis and funding rates start rising together too quickly, I’d actually pull back from the position—I don’t want to hold firmly when alignment is too strong. This kind of setup is suitable for trading a pullback, not for chasing a spike higher within the day. $GOOGL #USStocks
I could also be wrong—I’m making my own judgment.

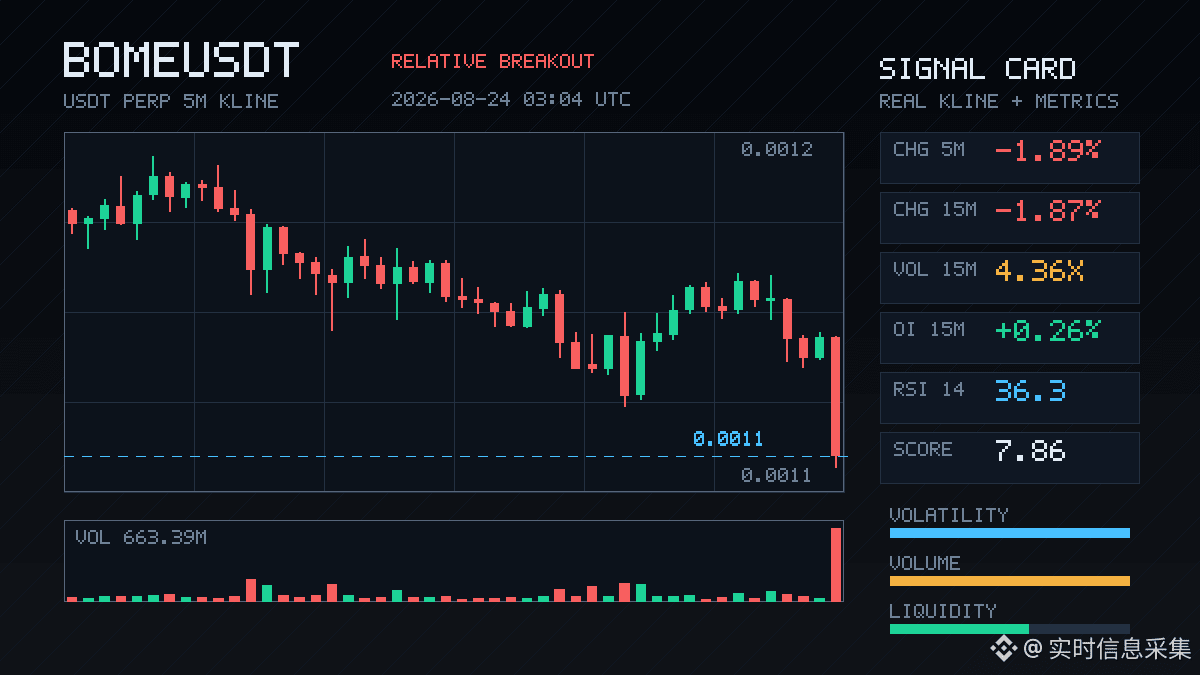
BOME, this pullback is kind of interesting. In just 15 minutes it dropped 1.87%, and the trading volume surged to 4.36x. The volatility Z-value is 4.05. It has already completely broken through the lower bound of the most recent ~20 five-minute K-line range.
But what really makes me wary is the OI data: the price is falling, yet OI is still rising—and it’s the kind of play where “new leveraged shorts” are coming in to participate. The contract nominal value change is -1.52%, and the funding rate is also sitting at a high percentile recently. This chart looks a lot like shorts are adding positions in batches to push price downward.
Aggressive trade gap is -35.6%, buy-sell ratio is 0.47—almost an all-sell market. The O I anomaly percentile has reached 82.9%, with the whole pool ranking #18 for anomalies, and nominal change ranking #26. None of this looks like a quiet, passive drift lower—someone is actively stirring things up inside.
In plain terms: the direction seems right, but I don’t want to chase from a spot that’s crowded with high-leverage shorts. I’ll first look for an opportunity to confirm with a rebound, or wait until the shorts loosen their grip on their own.
But what really makes me wary is the OI data: the price is falling, yet OI is still rising—and it’s the kind of play where “new leveraged shorts” are coming in to participate. The contract nominal value change is -1.52%, and the funding rate is also sitting at a high percentile recently. This chart looks a lot like shorts are adding positions in batches to push price downward.
Aggressive trade gap is -35.6%, buy-sell ratio is 0.47—almost an all-sell market. The O I anomaly percentile has reached 82.9%, with the whole pool ranking #18 for anomalies, and nominal change ranking #26. None of this looks like a quiet, passive drift lower—someone is actively stirring things up inside.
In plain terms: the direction seems right, but I don’t want to chase from a spot that’s crowded with high-leverage shorts. I’ll first look for an opportunity to confirm with a rebound, or wait until the shorts loosen their grip on their own.
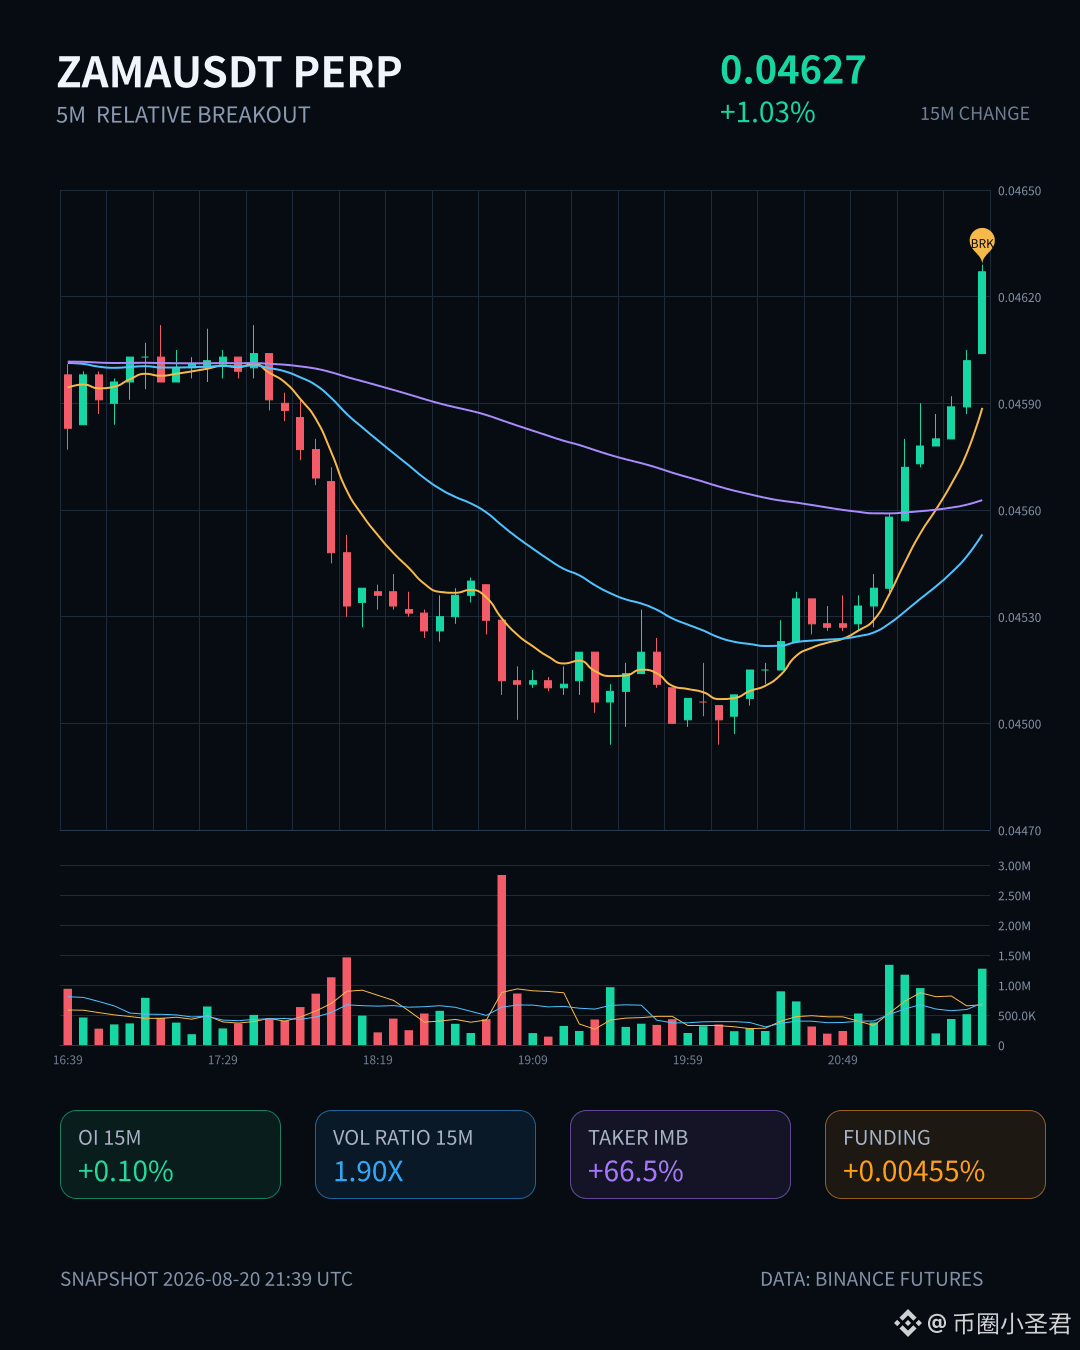
$ZAMA 5:34 There’s something about this 15m 15-meter line.
The price has broken above the upper boundary of nearly 20 consecutive 5m K-line ranges; the trading volume directly surged to 1.9 times the normal level. Active trading differs by 66.5%, and the buy-sell ratio is 4.97—bulls are really paying in cash. OI is also coordinating in sync: the 15m notional change is 85K, and the 1h added another 188K. With the 85.5% abnormal percentile, this doesn’t look like a simple bull trap—it looks more like newly added leveraged longs entering actively. The abnormal ranking in the whole pool is #18—not top-tier, but judging from this structure, the short-term trend most likely hasn’t finished yet.
Pay the money and get the goods—let’s see how it plays out.
The price has broken above the upper boundary of nearly 20 consecutive 5m K-line ranges; the trading volume directly surged to 1.9 times the normal level. Active trading differs by 66.5%, and the buy-sell ratio is 4.97—bulls are really paying in cash. OI is also coordinating in sync: the 15m notional change is 85K, and the 1h added another 188K. With the 85.5% abnormal percentile, this doesn’t look like a simple bull trap—it looks more like newly added leveraged longs entering actively. The abnormal ranking in the whole pool is #18—not top-tier, but judging from this structure, the short-term trend most likely hasn’t finished yet.
Pay the money and get the goods—let’s see how it plays out.
Log in to explore more content