

#042
042
142 views
4 Discussing
Hot
Latest

·
--
【Structure Watch #042|$SOXL 4H】Higher highs and higher lows; price is hugging the top of the range
Previous level check: The SOXL range marked today at 08:01 was 92.81–106.11. The current price is 104.29, still within it, and neither boundary has been touched.
At 20:00, the price is 104.3, up 10.84% over 24 hours, with trading volume of 2.941 billion U. Intraday range: 93.820–105.5.
① Structure: Over the last 30 candles, both the highs and lows have been rising. The range is 80.780–104.8, with a width of 29.8%. The current price is at the 98th percentile of the range, essentially hugging the top. MA25 is at 91.300, below the current price, and its slope over the last 5 candles is +4.55%—the moving average itself is trending upward.
② Volume and price: Volume over the last 10 candles is 1.31 times that of the previous 30, a clear increase; 6 of the last 10 candles closed green. Rising volume alongside higher highs and lows makes this stretch of the structure look fairly solid.
③ Confluence: Above, 104.8–106.1 has only one supporting factor, so its reliability should be discounted. Below, the 91.300–95.655 area is supported by both Fib 0.382 (95.655) and MA25 (91.300). With two factors overlapping, this zone is stronger than the one above.
④ Positioning: Funding rate +0.0000%, meaning shorts are paying; open interest has changed by +4.52% over 7 4H candles, so positions are building; the long/short account ratio is 2.93, suggesting accounts are skewed to one side.
Watch zones: Above, 104.8–106.1; below, 92.815–95.655.
1H view: Over the last 12 hours, price has moved between 100.3 and 105.5. The latest close is at the 76th percentile—toward the upper end, but not pinned at the top.
Invalidation: A 4H close above 106.1 or below 92.815 invalidates this assessment.
The upper zone at 104.8–106.1 has only one supporting factor, so I’ve discounted it in my own analysis. Would you leave the same amount of leeway around the upper boundary on your chart?
This is a record of market structure based on public data, not investment advice. You are responsible for your own profits and losses.
$SOXL
#技术分析 #合约交易 #BTC #Crypto
【Structure Watch #042|$SOXL 4H】Higher highs and higher lows; price is hugging the top of the range
Previous level check: The SOXL range marked today at 08:01 was 92.81–106.11. The current price is 104.29, still within it, and neither boundary has been touched.
At 20:00, the price is 104.3, up 10.84% over 24 hours, with trading volume of 2.941 billion U. Intraday range: 93.820–105.5.
① Structure: Over the last 30 candles, both the highs and lows have been rising. The range is 80.780–104.8, with a width of 29.8%. The current price is at the 98th percentile of the range, essentially hugging the top. MA25 is at 91.300, below the current price, and its slope over the last 5 candles is +4.55%—the moving average itself is trending upward.
② Volume and price: Volume over the last 10 candles is 1.31 times that of the previous 30, a clear increase; 6 of the last 10 candles closed green. Rising volume alongside higher highs and lows makes this stretch of the structure look fairly solid.
③ Confluence: Above, 104.8–106.1 has only one supporting factor, so its reliability should be discounted. Below, the 91.300–95.655 area is supported by both Fib 0.382 (95.655) and MA25 (91.300). With two factors overlapping, this zone is stronger than the one above.
④ Positioning: Funding rate +0.0000%, meaning shorts are paying; open interest has changed by +4.52% over 7 4H candles, so positions are building; the long/short account ratio is 2.93, suggesting accounts are skewed to one side.
Watch zones: Above, 104.8–106.1; below, 92.815–95.655.
1H view: Over the last 12 hours, price has moved between 100.3 and 105.5. The latest close is at the 76th percentile—toward the upper end, but not pinned at the top.
Invalidation: A 4H close above 106.1 or below 92.815 invalidates this assessment.
The upper zone at 104.8–106.1 has only one supporting factor, so I’ve discounted it in my own analysis. Would you leave the same amount of leeway around the upper boundary on your chart?
This is a record of market structure based on public data, not investment advice. You are responsible for your own profits and losses.
$SOXL
#技术分析 #合约交易 #BTC #Crypto
Previous level check: The SOXL range marked today at 08:01 was 92.81–106.11. The current price is 104.29, still within it, and neither boundary has been touched.
At 20:00, the price is 104.3, up 10.84% over 24 hours, with trading volume of 2.941 billion U. Intraday range: 93.820–105.5.
① Structure: Over the last 30 candles, both the highs and lows have been rising. The range is 80.780–104.8, with a width of 29.8%. The current price is at the 98th percentile of the range, essentially hugging the top. MA25 is at 91.300, below the current price, and its slope over the last 5 candles is +4.55%—the moving average itself is trending upward.
② Volume and price: Volume over the last 10 candles is 1.31 times that of the previous 30, a clear increase; 6 of the last 10 candles closed green. Rising volume alongside higher highs and lows makes this stretch of the structure look fairly solid.
③ Confluence: Above, 104.8–106.1 has only one supporting factor, so its reliability should be discounted. Below, the 91.300–95.655 area is supported by both Fib 0.382 (95.655) and MA25 (91.300). With two factors overlapping, this zone is stronger than the one above.
④ Positioning: Funding rate +0.0000%, meaning shorts are paying; open interest has changed by +4.52% over 7 4H candles, so positions are building; the long/short account ratio is 2.93, suggesting accounts are skewed to one side.
Watch zones: Above, 104.8–106.1; below, 92.815–95.655.
1H view: Over the last 12 hours, price has moved between 100.3 and 105.5. The latest close is at the 76th percentile—toward the upper end, but not pinned at the top.
Invalidation: A 4H close above 106.1 or below 92.815 invalidates this assessment.
The upper zone at 104.8–106.1 has only one supporting factor, so I’ve discounted it in my own analysis. Would you leave the same amount of leeway around the upper boundary on your chart?
This is a record of market structure based on public data, not investment advice. You are responsible for your own profits and losses.
$SOXL
#技术分析 #合约交易 #BTC #Crypto
6

·
--
Battle Report #042 — $DOGE
{spot}(DOGEUSDT)
/USDT (Dogecoin)
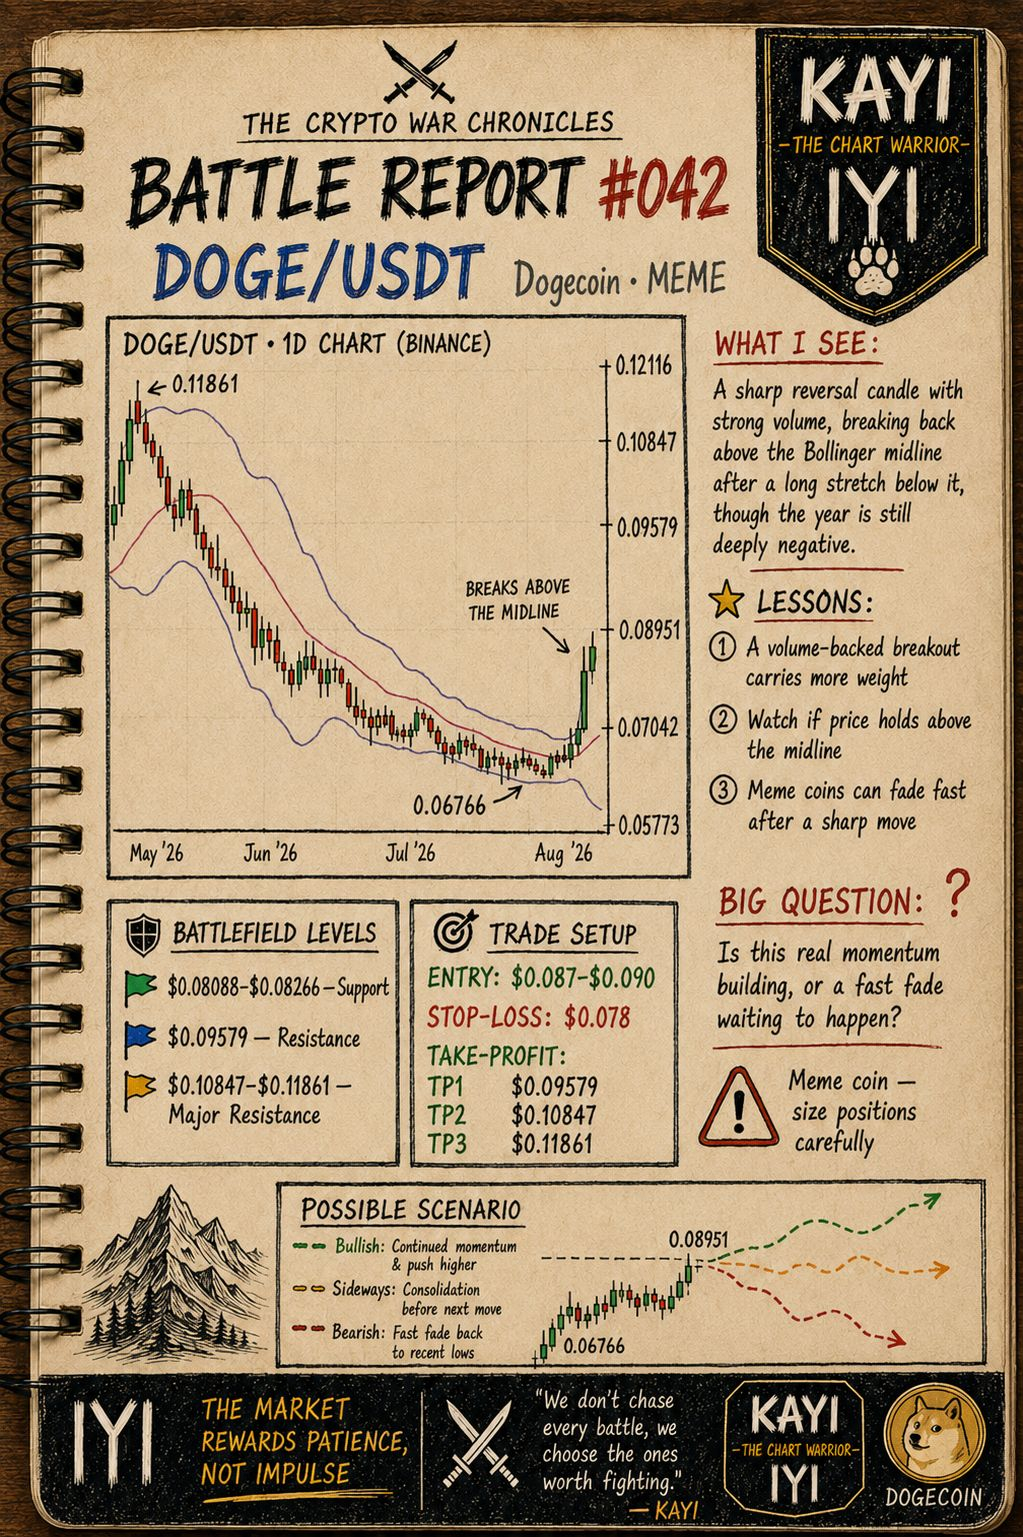
DOGE just delivered a sharp bounce — up 10.27% today, 5.18% over 7 days, and 27.04% over 30 days. The chart shows a clean fall from $0.11861 down to a low of $0.06766, followed by a sudden, strong reversal candle breaking back above the Bollinger midline.
90-day is nearly flat at 0.03%, meaning the deep correction has largely been recovered over the past three months — but 180-day (-1.28%) and 1-year (-57.74%) show this is still a long way from erasing the bigger downtrend. That said, this particular bounce looks more decisive than most — a strong volume spike accompanied the move, and price has broken clean above both the middle and lower Bollinger bands after a long stretch below them.
The real test now is whether DOGE can hold above the middle band ($0.08266) and push through resistance, or whether this fast move fades the way sharp bounces often do after a long grind lower.
Battlefield Levels:
Support: $0.08088–$0.08266
Resistance: $0.09579
Major resistance: $0.10847–$0.11861
Trade Setup:
Entry: $0.087–$0.090 after confirmation of a hold above $0.0827
SL: $0.078
TP1: $0.09579
TP2: $0.10847
TP3: $0.11861
Meme coin volatility is real here — size positions carefully even on a strong-looking move like this.
Momentum building, or a fast fade incoming? Comment "Momentum" or "Fade" 👇
Follow KAYI — THE CHART WARRIOR for the next Battle Report ⚔️
$DOGE #MemeCoin #CryptoTrading
Battle Report #042 — $DOGE
/USDT (Dogecoin)
DOGE just delivered a sharp bounce — up 10.27% today, 5.18% over 7 days, and 27.04% over 30 days. The chart shows a clean fall from $0.11861 down to a low of $0.06766, followed by a sudden, strong reversal candle breaking back above the Bollinger midline.
90-day is nearly flat at 0.03%, meaning the deep correction has largely been recovered over the past three months — but 180-day (-1.28%) and 1-year (-57.74%) show this is still a long way from erasing the bigger downtrend. That said, this particular bounce looks more decisive than most — a strong volume spike accompanied the move, and price has broken clean above both the middle and lower Bollinger bands after a long stretch below them.
The real test now is whether DOGE can hold above the middle band ($0.08266) and push through resistance, or whether this fast move fades the way sharp bounces often do after a long grind lower.
Battlefield Levels:
Support: $0.08088–$0.08266
Resistance: $0.09579
Major resistance: $0.10847–$0.11861
Trade Setup:
Entry: $0.087–$0.090 after confirmation of a hold above $0.0827
SL: $0.078
TP1: $0.09579
TP2: $0.10847
TP3: $0.11861
Meme coin volatility is real here — size positions carefully even on a strong-looking move like this.
Momentum building, or a fast fade incoming? Comment "Momentum" or "Fade" 👇
Follow KAYI — THE CHART WARRIOR for the next Battle Report ⚔️
$DOGE #MemeCoin #CryptoTrading
/USDT (Dogecoin)
DOGE just delivered a sharp bounce — up 10.27% today, 5.18% over 7 days, and 27.04% over 30 days. The chart shows a clean fall from $0.11861 down to a low of $0.06766, followed by a sudden, strong reversal candle breaking back above the Bollinger midline.
90-day is nearly flat at 0.03%, meaning the deep correction has largely been recovered over the past three months — but 180-day (-1.28%) and 1-year (-57.74%) show this is still a long way from erasing the bigger downtrend. That said, this particular bounce looks more decisive than most — a strong volume spike accompanied the move, and price has broken clean above both the middle and lower Bollinger bands after a long stretch below them.
The real test now is whether DOGE can hold above the middle band ($0.08266) and push through resistance, or whether this fast move fades the way sharp bounces often do after a long grind lower.
Battlefield Levels:
Support: $0.08088–$0.08266
Resistance: $0.09579
Major resistance: $0.10847–$0.11861
Trade Setup:
Entry: $0.087–$0.090 after confirmation of a hold above $0.0827
SL: $0.078
TP1: $0.09579
TP2: $0.10847
TP3: $0.11861
Meme coin volatility is real here — size positions carefully even on a strong-looking move like this.
Momentum building, or a fast fade incoming? Comment "Momentum" or "Fade" 👇
Follow KAYI — THE CHART WARRIOR for the next Battle Report ⚔️
$DOGE #MemeCoin #CryptoTrading
1
71
Log in to explore more content
Join global crypto users on Binance Square
⚡️ Get latest and useful information about crypto.
💬 Trusted by the world’s largest crypto exchange.
👍 Discover real insights from verified creators.
Email / Phone number
Trending Topics
1
#BinanceSAFUFundTransferCompleted7499BTC
33,741 views
739 Discussing
2
#BinanceRecovery90% of stolen assets
128,953 views
165 Discussing
3
#YiHe:ProofOfReserves:10TokensAt100%Backing
131,036 views
723 Discussing
4
#BackedNotBroken:RichardTengSaysUsersBearNoLoss
38,536 views
441 Discussing
5
#CZSaysCompensationIsinPlaceUsersAreProtected
121,940 views
1,360 Discussing
6
#IntelHasItsWorstDaySince1974
45,611 views
688 Discussing
7
#TRMCambodianCasinosReceived$1.07BInCrypto
12,335 views
69 Discussing
8
#USDCCirculationFallsAbout800MInSevenDays
68,856 views
714 Discussing
9
#SuspectedNorthKoreaAttacksAccountForNearly89%OfCryptoHackLosses
14,509 views
97 Discussing
10
#OpenAICutsFundraisingTargetBy$10B
3,570 views
73 Discussing