
#040
040
17 views
3 Discussing
Hot
Latest

·
--
【Structure Observation #040|$SOXL 4H】Highs and lows are both moving up; price is tracking along the top of the range
Previous check-in: The SOXL range I marked yesterday at 20:00 was 89.97–96.8. The current price of 100.29 has moved above 96.8, so that setup is invalidated.
At 08:00, the current price was 100.3, up 7.92% over 24 hours, with trading volume of 3.124 billion U. The intraday high was 102.3 and the low was 87.750.
① Structure: Over the last 30 4H candles, the highs have risen and the lows have risen. The range is 80.780–104.8, with a width of 29.8%. The current price is at the 82nd percentile of the range, essentially right up against the top. MA25 is at 88.694, below the current price, with a slope of +3.40% over the last 5 candles; the moving average is still trending upward. The most noticeable feature of the current structure is how far price has pulled away from the moving average.
② Volume and price: Volume over the last 10 candles is 1.58 times that of the previous 30, a clear increase. Five of the 10 candles closed higher. Volume has picked up, but the number of bullish candles is evenly split, suggesting that turnover is increasing around the top of the range.
③ Confluence: There is only one reference above, at 104.8–106.1, so its reliability should be discounted. Below, the 88.694–95.655 area has two levels overlapping: Fib 0.382 at 95.655 and MA25 at 88.694, in the same general zone.
④ Positioning: Funding rate is +0.0000%, with shorts paying; open interest is up +9.10% over the last 7 4H candles, so positions are increasing; the long/short account ratio is 3.23. Open interest is rising, funding is near zero, and the account ratio is skewed to one side.
Levels to watch: 104.8–106.1 above; 92.815–95.655 below.
1H view: Over the last 12 hours, price has moved between 94.200 and 102.3. The latest close is at the 75th percentile, toward the upper half of the range.
Invalidation conditions: If a 4H candle closes above 106.1 or below 92.815, this assessment is invalidated.
I’m watching the gap between the Fib level at 95.655 and MA25 at 88.694. Price is far from them right now; whether it comes back is something to see later. Which lower line would you use, 95.655 or 88.694?
This is a structural observation based on public data, not investment advice. You are responsible for your own gains and losses.
$SOXL
#技术分析 #合约交易 #BTC #Cryptocurrency
【Structure Observation #040|$SOXL 4H】Highs and lows are both moving up; price is tracking along the top of the range
Previous check-in: The SOXL range I marked yesterday at 20:00 was 89.97–96.8. The current price of 100.29 has moved above 96.8, so that setup is invalidated.
At 08:00, the current price was 100.3, up 7.92% over 24 hours, with trading volume of 3.124 billion U. The intraday high was 102.3 and the low was 87.750.
① Structure: Over the last 30 4H candles, the highs have risen and the lows have risen. The range is 80.780–104.8, with a width of 29.8%. The current price is at the 82nd percentile of the range, essentially right up against the top. MA25 is at 88.694, below the current price, with a slope of +3.40% over the last 5 candles; the moving average is still trending upward. The most noticeable feature of the current structure is how far price has pulled away from the moving average.
② Volume and price: Volume over the last 10 candles is 1.58 times that of the previous 30, a clear increase. Five of the 10 candles closed higher. Volume has picked up, but the number of bullish candles is evenly split, suggesting that turnover is increasing around the top of the range.
③ Confluence: There is only one reference above, at 104.8–106.1, so its reliability should be discounted. Below, the 88.694–95.655 area has two levels overlapping: Fib 0.382 at 95.655 and MA25 at 88.694, in the same general zone.
④ Positioning: Funding rate is +0.0000%, with shorts paying; open interest is up +9.10% over the last 7 4H candles, so positions are increasing; the long/short account ratio is 3.23. Open interest is rising, funding is near zero, and the account ratio is skewed to one side.
Levels to watch: 104.8–106.1 above; 92.815–95.655 below.
1H view: Over the last 12 hours, price has moved between 94.200 and 102.3. The latest close is at the 75th percentile, toward the upper half of the range.
Invalidation conditions: If a 4H candle closes above 106.1 or below 92.815, this assessment is invalidated.
I’m watching the gap between the Fib level at 95.655 and MA25 at 88.694. Price is far from them right now; whether it comes back is something to see later. Which lower line would you use, 95.655 or 88.694?
This is a structural observation based on public data, not investment advice. You are responsible for your own gains and losses.
$SOXL
#技术分析 #合约交易 #BTC #Cryptocurrency
Previous check-in: The SOXL range I marked yesterday at 20:00 was 89.97–96.8. The current price of 100.29 has moved above 96.8, so that setup is invalidated.
At 08:00, the current price was 100.3, up 7.92% over 24 hours, with trading volume of 3.124 billion U. The intraday high was 102.3 and the low was 87.750.
① Structure: Over the last 30 4H candles, the highs have risen and the lows have risen. The range is 80.780–104.8, with a width of 29.8%. The current price is at the 82nd percentile of the range, essentially right up against the top. MA25 is at 88.694, below the current price, with a slope of +3.40% over the last 5 candles; the moving average is still trending upward. The most noticeable feature of the current structure is how far price has pulled away from the moving average.
② Volume and price: Volume over the last 10 candles is 1.58 times that of the previous 30, a clear increase. Five of the 10 candles closed higher. Volume has picked up, but the number of bullish candles is evenly split, suggesting that turnover is increasing around the top of the range.
③ Confluence: There is only one reference above, at 104.8–106.1, so its reliability should be discounted. Below, the 88.694–95.655 area has two levels overlapping: Fib 0.382 at 95.655 and MA25 at 88.694, in the same general zone.
④ Positioning: Funding rate is +0.0000%, with shorts paying; open interest is up +9.10% over the last 7 4H candles, so positions are increasing; the long/short account ratio is 3.23. Open interest is rising, funding is near zero, and the account ratio is skewed to one side.
Levels to watch: 104.8–106.1 above; 92.815–95.655 below.
1H view: Over the last 12 hours, price has moved between 94.200 and 102.3. The latest close is at the 75th percentile, toward the upper half of the range.
Invalidation conditions: If a 4H candle closes above 106.1 or below 92.815, this assessment is invalidated.
I’m watching the gap between the Fib level at 95.655 and MA25 at 88.694. Price is far from them right now; whether it comes back is something to see later. Which lower line would you use, 95.655 or 88.694?
This is a structural observation based on public data, not investment advice. You are responsible for your own gains and losses.
$SOXL
#技术分析 #合约交易 #BTC #Cryptocurrency
34

·
--
Battle Report #040 — $UNI
{future}(UNIUSDT)
/USDT (Uniswap)
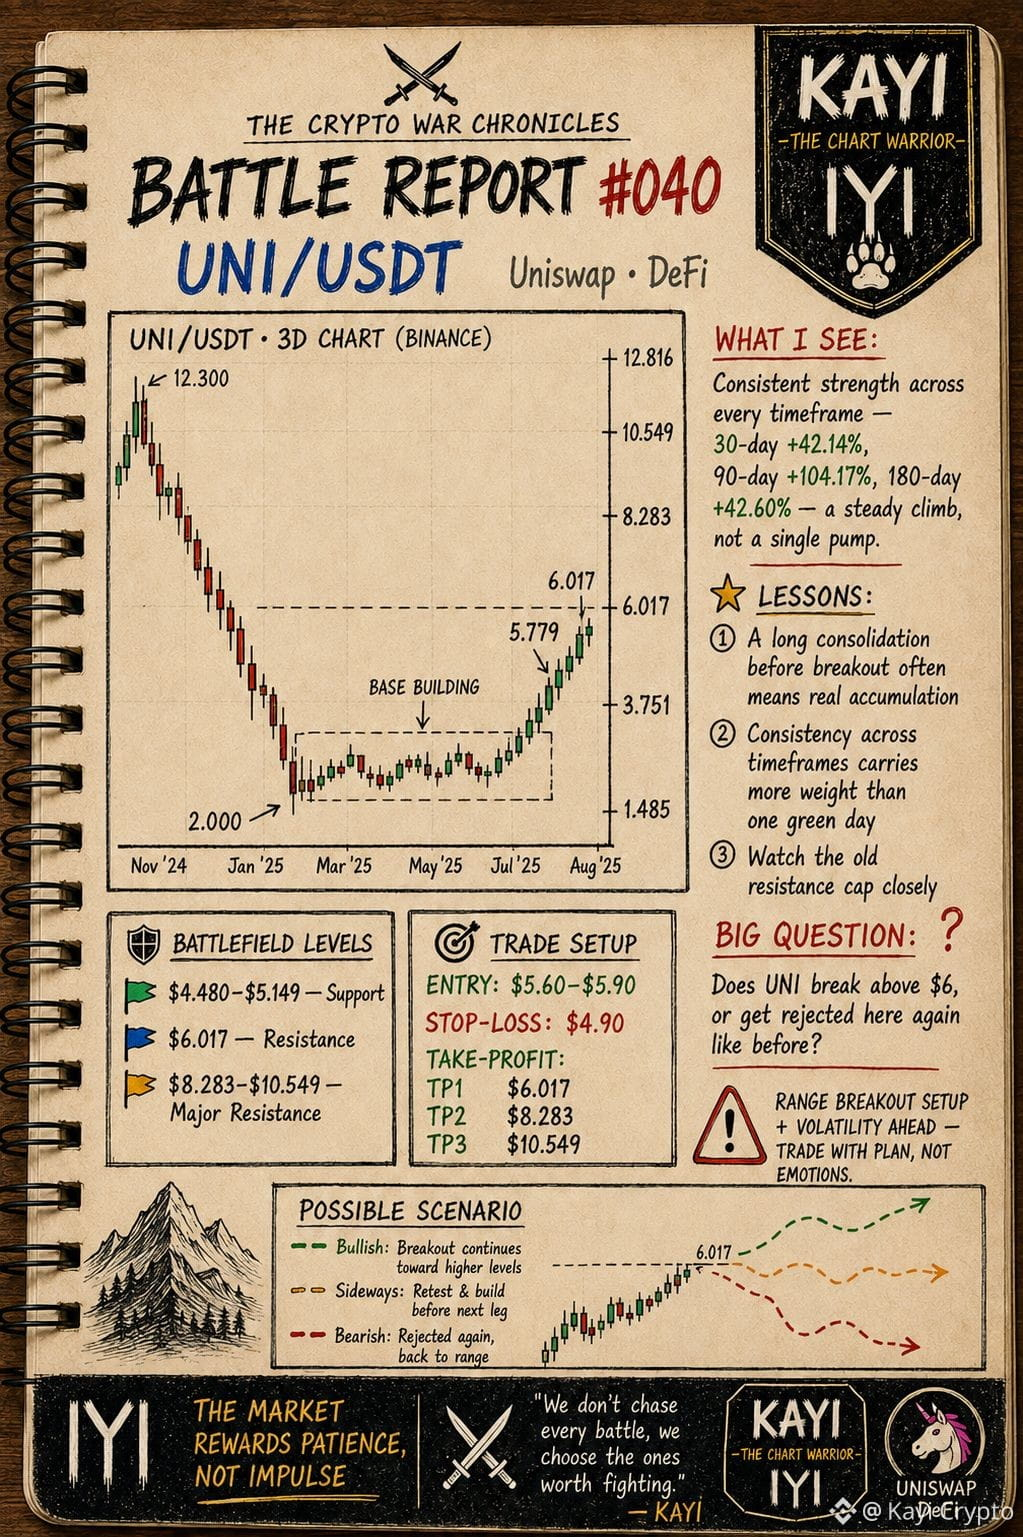
UNI is showing strong, sustained recovery — up 10.71% today, 35.51% over 7 days, 42.14% over 30 days, and 104.17% over 90 days. This isn't a one-off spike, it's a consistent grind higher across every major timeframe.
The chart tells a clear story: a hard fall from $12.300 down to a low of $2.000, followed by a long consolidation phase, and now a decisive breakout above that range with a steady climb to $5.779. 180-day is also positive at 42.60%, though 1-year is still down -41.27%, reminding us this is a strong recovery inside a bigger downtrend, not a full reversal to old highs yet.
What makes this setup stand out is the consistency — the recent green candles show real accumulation, not a single explosive pump that fades. Price is now testing the $6.017 zone, a level that's capped every rally attempt during the consolidation phase.
Battlefield Levels:
Support: $4.480–$5.149
Resistance: $6.017
Major resistance: $8.283–$10.549
Trade Setup:
Entry: $5.60–$5.90 after confirmation of a hold above $5.15
SL: $4.90
TP1: $6.017
TP2: $8.283
TP3: $10.549
This is one of the strongest multi-timeframe recoveries I've covered — steady buying, not a single spike.
Breakout above $6, or rejection at this level again? Comment "Breakout" or "Rejection" 👇
Follow KAYI — THE CHART WARRIOR for the next Battle Report ⚔️
$UNI #CryptoTrading #DeFi
Battle Report #040 — $UNI
/USDT (Uniswap)
UNI is showing strong, sustained recovery — up 10.71% today, 35.51% over 7 days, 42.14% over 30 days, and 104.17% over 90 days. This isn't a one-off spike, it's a consistent grind higher across every major timeframe.
The chart tells a clear story: a hard fall from $12.300 down to a low of $2.000, followed by a long consolidation phase, and now a decisive breakout above that range with a steady climb to $5.779. 180-day is also positive at 42.60%, though 1-year is still down -41.27%, reminding us this is a strong recovery inside a bigger downtrend, not a full reversal to old highs yet.
What makes this setup stand out is the consistency — the recent green candles show real accumulation, not a single explosive pump that fades. Price is now testing the $6.017 zone, a level that's capped every rally attempt during the consolidation phase.
Battlefield Levels:
Support: $4.480–$5.149
Resistance: $6.017
Major resistance: $8.283–$10.549
Trade Setup:
Entry: $5.60–$5.90 after confirmation of a hold above $5.15
SL: $4.90
TP1: $6.017
TP2: $8.283
TP3: $10.549
This is one of the strongest multi-timeframe recoveries I've covered — steady buying, not a single spike.
Breakout above $6, or rejection at this level again? Comment "Breakout" or "Rejection" 👇
Follow KAYI — THE CHART WARRIOR for the next Battle Report ⚔️
$UNI #CryptoTrading #DeFi
/USDT (Uniswap)
UNI is showing strong, sustained recovery — up 10.71% today, 35.51% over 7 days, 42.14% over 30 days, and 104.17% over 90 days. This isn't a one-off spike, it's a consistent grind higher across every major timeframe.
The chart tells a clear story: a hard fall from $12.300 down to a low of $2.000, followed by a long consolidation phase, and now a decisive breakout above that range with a steady climb to $5.779. 180-day is also positive at 42.60%, though 1-year is still down -41.27%, reminding us this is a strong recovery inside a bigger downtrend, not a full reversal to old highs yet.
What makes this setup stand out is the consistency — the recent green candles show real accumulation, not a single explosive pump that fades. Price is now testing the $6.017 zone, a level that's capped every rally attempt during the consolidation phase.
Battlefield Levels:
Support: $4.480–$5.149
Resistance: $6.017
Major resistance: $8.283–$10.549
Trade Setup:
Entry: $5.60–$5.90 after confirmation of a hold above $5.15
SL: $4.90
TP1: $6.017
TP2: $8.283
TP3: $10.549
This is one of the strongest multi-timeframe recoveries I've covered — steady buying, not a single spike.
Breakout above $6, or rejection at this level again? Comment "Breakout" or "Rejection" 👇
Follow KAYI — THE CHART WARRIOR for the next Battle Report ⚔️
$UNI #CryptoTrading #DeFi
97
Log in to explore more content
Join global crypto users on Binance Square
⚡️ Get latest and useful information about crypto.
💬 Trusted by the world’s largest crypto exchange.
👍 Discover real insights from verified creators.
Email / Phone number
Trending Topics
1
#BTCRebounds80K
25,412 views
513 Discussing
2
#Binance98PercentReplenished
22,082 views
458 Discussing
3
#USMidterms-WhatAreMarketsExpecting?
289,846 views
1,936 Discussing
4
#USOctoberNFP-AreRateCutsStillPossible
368,265 views
2,754 Discussing
5
#AMDBeatsExpectations-AINarrativeContinues
82,279 views
739 Discussing
6
#CircleQ3Revenue865M
21,956 views
414 Discussing
7
#BinanceIncidentReport
491,420 views
2,052 Discussing
8
#USStocksOpenHigherAsDowGains1.9%
3,071 views
66 Discussing
9
#ADPUSPrivateEmployersAdd86000JobsInOctober
2,447 views
45 Discussing
10
#FrenchAssemblyPassesSelfCustodiedCryptoReportingAmendment
749 views
21 Discussing