
R3N 1
508 Публикации

R3N 1
Отправить жалобу
Заблокировать пользователя
Web3 & crypto Analyst || Breaking down market moves || token updates daily ➪NFA!!!
0 подписок(и/а)
3 подписчиков(а)
2 понравилось
Посты
·
--
См. перевод
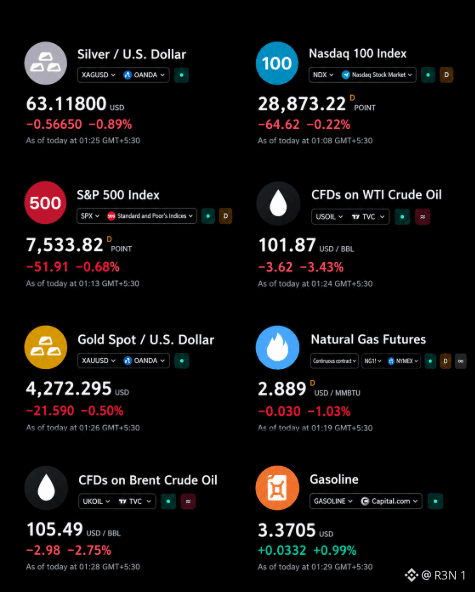
Gasoline was the only thing on this board still green. Everything else, stocks, oil, gold, silver, natural gas, turned red during Warsh's press conference, and that split tells you exactly where the actual signal was, in his tone, not the hike itself. The Dow closed down 631 points, about 1.2%, the S&P fell roughly 0.4 to 0.45%, the Nasdaq finished essentially flat. The dollar index popped 0.6% to 100.21, its highest since late July, and the 10 year yield pushed back above 5%. Worth being precise on the "two more hikes" framing, the Fed's own dot plot shows the median official penciling in one more 25bp hike this year to 4.125%, with four wanting two and only two seeing none. What's actually shifted more aggressively is trader positioning in fed funds futures, where the probability of two more hikes has spiked separately from the Fed's own median projection, two different things worth keeping distinct. Warsh's specific framing was notable too, he said the hike offers "good news" for Americans without financial assets or home equity, arguing price stability protects real take home pay, a pitch aimed past the market reaction toward ordinary households. Markets clearly weren't buying the reassurance in the moment. Bitcoin was already near $75,800 heading into this, down close to 3% over the prior 24 hours. A hawkish press conference landing on an already soft crypto tape, one day after the Senate blocked CLARITY, is a second real headwind stacking on the first, not an isolated event. My honest read: markets reading guidance as more hawkish than the headline hike is a normal pattern, but the size of this reversal, a 600 plus point Dow swing intraday, suggests positioning going in was more optimistic than the actual data supported. What I'm watching: whether this hawkish repricing holds through the next few sessions, or whether it's a knee jerk reaction that fades once the press conference isn't the freshest data point anymore. $BTC #BTC Price Analysis# $XAUt
Gasoline was the only thing on this board still green. Everything else, stocks, oil, gold, silver, natural gas, turned red during Warsh's press conference, and that split tells you exactly where the actual signal was, in his tone, not the hike itself. The Dow closed down 631 points, about 1.2%, the S&P fell roughly 0.4 to 0.45%, the Nasdaq finished essentially flat. The dollar index popped 0.6% to 100.21, its highest since late July, and the 10 year yield pushed back above 5%. Worth being precise on the "two more hikes" framing, the Fed's own dot plot shows the median official penciling in one more 25bp hike this year to 4.125%, with four wanting two and only two seeing none. What's actually shifted more aggressively is trader positioning in fed funds futures, where the probability of two more hikes has spiked separately from the Fed's own median projection, two different things worth keeping distinct. Warsh's specific framing was notable too, he said the hike offers "good news" for Americans without financial assets or home equity, arguing price stability protects real take home pay, a pitch aimed past the market reaction toward ordinary households. Markets clearly weren't buying the reassurance in the moment. Bitcoin was already near $75,800 heading into this, down close to 3% over the prior 24 hours. A hawkish press conference landing on an already soft crypto tape, one day after the Senate blocked CLARITY, is a second real headwind stacking on the first, not an isolated event. My honest read: markets reading guidance as more hawkish than the headline hike is a normal pattern, but the size of this reversal, a 600 plus point Dow swing intraday, suggests positioning going in was more optimistic than the actual data supported. What I'm watching: whether this hawkish repricing holds through the next few sessions, or whether it's a knee jerk reaction that fades once the press conference isn't the freshest data point anymore. $BTC #BTC Price Analysis# $XAUt
9
·
--
См. перевод
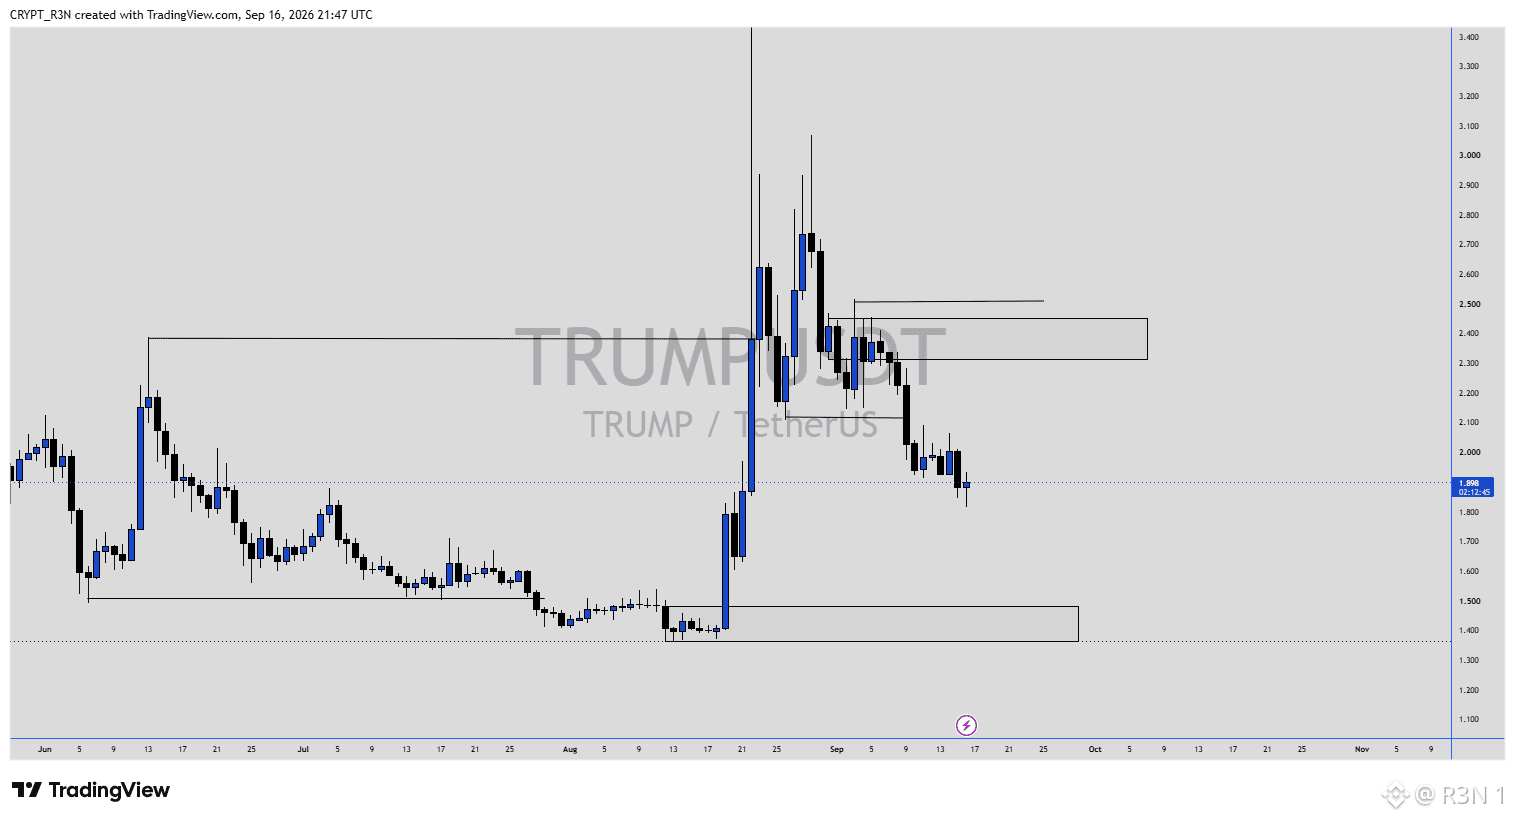
TRUMP just broke back below $2.00, sitting at $1.898, after failing to reclaim the $2.30 to $2.50 zone that capped its post spike consolidation. That structure actually supports a bearish lean here, not just sentiment. The bigger picture: TRUMP spiked hard from the $1.40 to $1.50 base I've marked in mid to late August, tagging highs above $3.20 to $3.40 briefly before rolling into a lower, choppier range between roughly $2.20 and $2.70 through early September. That range has now broken down, price sliced through $2.00 and is testing levels last seen before the spike even started building. The move from the $2.30 to $2.50 resistance zone down to current price has been fairly directional, not a slow bleed. What stands out to me structurally is that TRUMP hasn't even come close to retesting that original $1.40 to $1.50 base yet, it's still trading meaningfully above it. That matters for how much further a bearish continuation actually has room to run before hitting real prior demand, versus just chopping in open air with no defined support nearby. What I'm watching: whether $1.80 to $1.90 holds as a shelf, or whether this continues sliding back toward that $1.40 to $1.50 zone where the real prior demand sits. $TRUMP #BTC Price Analysis# #Altcoin Season#
TRUMP just broke back below $2.00, sitting at $1.898, after failing to reclaim the $2.30 to $2.50 zone that capped its post spike consolidation. That structure actually supports a bearish lean here, not just sentiment. The bigger picture: TRUMP spiked hard from the $1.40 to $1.50 base I've marked in mid to late August, tagging highs above $3.20 to $3.40 briefly before rolling into a lower, choppier range between roughly $2.20 and $2.70 through early September. That range has now broken down, price sliced through $2.00 and is testing levels last seen before the spike even started building. The move from the $2.30 to $2.50 resistance zone down to current price has been fairly directional, not a slow bleed. What stands out to me structurally is that TRUMP hasn't even come close to retesting that original $1.40 to $1.50 base yet, it's still trading meaningfully above it. That matters for how much further a bearish continuation actually has room to run before hitting real prior demand, versus just chopping in open air with no defined support nearby. What I'm watching: whether $1.80 to $1.90 holds as a shelf, or whether this continues sliding back toward that $1.40 to $1.50 zone where the real prior demand sits. $TRUMP #BTC Price Analysis# #Altcoin Season#
32
·
--
См. перевод
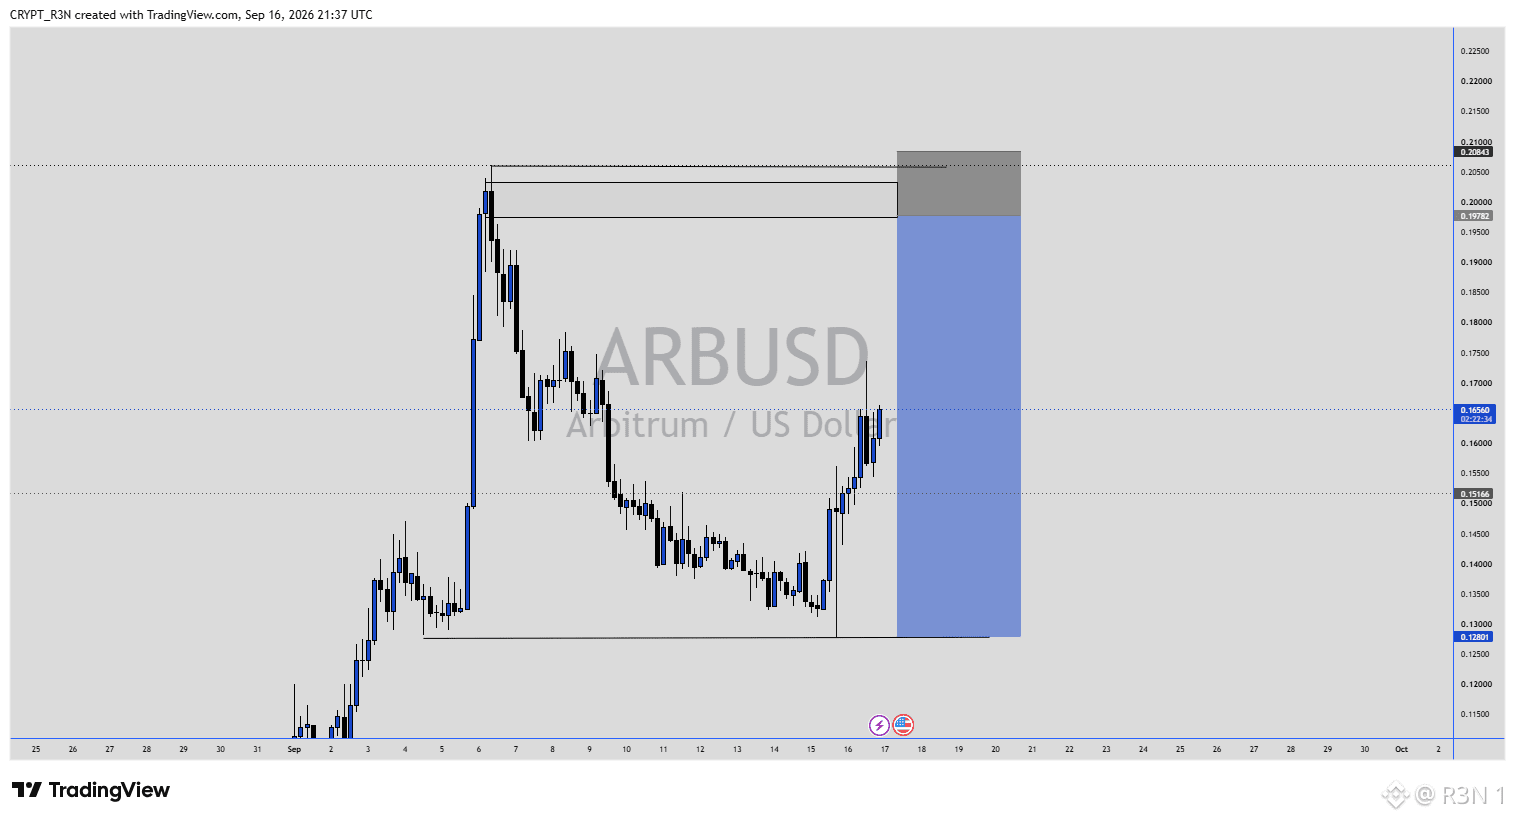
$ARB just ripped off its September low in a single session, from around $0.128 to $0.16563 currently, one of the sharper reversal candles on this chart since the initial early September spike. Zooming out, $ARB rallied hard from roughly $0.11 in late August to a spike high near $0.205 around September 5 to 6, then spent the following ten days grinding lower through a choppy range, roughly $0.135 to $0.175, before testing down into the $0.128 to $0.13 zone I've marked as support on this chart. That low held, and the bounce off it has been immediate and sharp rather than a slow grind back up. What I'm watching structurally is the $0.198 to $0.2084 zone marked at the top, the area where that initial spike topped out and where price got rejected on the way down. That's the level that actually matters here, not the September low. Reclaiming and holding above it would be a real structural shift, a fresh high rather than just a recovery back into the prior range. My honest read: this bounce is constructive, holding a defined support level and reversing sharply off it is a legitimate bullish signal in isolation. But I'd be careful calling this a trend change yet, ARB is still trading well inside the range it's carved out since the initial spike, and this could just as easily be another rally that fades back into the same $0.135 to $0.175 chop that dominated most of September. Where I'd push back on getting ahead of this: one sharp bounce off support after ten days of grinding lower isn't the same as a confirmed reversal, the real test is whether this move actually challenges that upper resistance zone or stalls out well below it again. What I'm watching: whether this bounce extends toward $0.175 to $0.198 with real follow through, or whether it fades back into the range like the last few attempts have. #BTC Price Analysis# #Meme Alpha#
$ARB just ripped off its September low in a single session, from around $0.128 to $0.16563 currently, one of the sharper reversal candles on this chart since the initial early September spike. Zooming out, $ARB rallied hard from roughly $0.11 in late August to a spike high near $0.205 around September 5 to 6, then spent the following ten days grinding lower through a choppy range, roughly $0.135 to $0.175, before testing down into the $0.128 to $0.13 zone I've marked as support on this chart. That low held, and the bounce off it has been immediate and sharp rather than a slow grind back up. What I'm watching structurally is the $0.198 to $0.2084 zone marked at the top, the area where that initial spike topped out and where price got rejected on the way down. That's the level that actually matters here, not the September low. Reclaiming and holding above it would be a real structural shift, a fresh high rather than just a recovery back into the prior range. My honest read: this bounce is constructive, holding a defined support level and reversing sharply off it is a legitimate bullish signal in isolation. But I'd be careful calling this a trend change yet, ARB is still trading well inside the range it's carved out since the initial spike, and this could just as easily be another rally that fades back into the same $0.135 to $0.175 chop that dominated most of September. Where I'd push back on getting ahead of this: one sharp bounce off support after ten days of grinding lower isn't the same as a confirmed reversal, the real test is whether this move actually challenges that upper resistance zone or stalls out well below it again. What I'm watching: whether this bounce extends toward $0.175 to $0.198 with real follow through, or whether it fades back into the range like the last few attempts have. #BTC Price Analysis# #Meme Alpha#
30
·
--
См. перевод
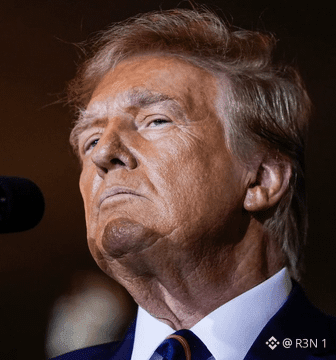
A president publicly demanding rates 275 basis points below where his own hand picked Fed chair just moved them. That's not spin, that's the literal gap between 1% and 3.75 to 4%. Trump posted the demand Wednesday evening on Truth Social, hours after the FOMC's unanimous 12-0 vote to hike, "Interest Rates in the United States should be 1%, or less, because we are the Best Credit in the World, BY FAR," followed by "LOWER THE INTEREST RATES FOR THE UNITED STATES OF AMERICA, AND FAST!" Worth a direct fact check, NBC notes that claim isn't accurate, S&P rates several countries higher than the US on credit, including Canada, Australia, and Germany. Not a minor detail, it's the entire stated justification for the 1% demand, and it doesn't hold up. What makes this notable beyond the rhetoric is who's being defied. Kevin Warsh is Trump's own pick to chair the Fed, nominated specifically, according to Trump himself, because Warsh wanted to lower rates. Instead Warsh's committee just voted unanimously to raise them, citing inflation that "remains elevated" and geopolitical uncertainty tied to the Iran conflict driving energy prices higher. The White House had mounted real pressure ahead of this, Trump, Vance, and Treasury Secretary Bessent all pushed publicly against a hike in the days before Wednesday. My honest read: a 275 basis point gap between demand and actual policy is a genuine, unusual level of open conflict, not typical jawboning. Fed independence held here, the committee moved on its own read of inflation data over direct executive pressure, worth noting as the actual substance under the headline noise. What I'm watching: whether this pressure escalates into something more concrete before December's meeting, where the dot plot already signals another hike may be coming regardless of how loud this gets. $BTC #Macro Insights# #Meme Alpha# $ETH
A president publicly demanding rates 275 basis points below where his own hand picked Fed chair just moved them. That's not spin, that's the literal gap between 1% and 3.75 to 4%. Trump posted the demand Wednesday evening on Truth Social, hours after the FOMC's unanimous 12-0 vote to hike, "Interest Rates in the United States should be 1%, or less, because we are the Best Credit in the World, BY FAR," followed by "LOWER THE INTEREST RATES FOR THE UNITED STATES OF AMERICA, AND FAST!" Worth a direct fact check, NBC notes that claim isn't accurate, S&P rates several countries higher than the US on credit, including Canada, Australia, and Germany. Not a minor detail, it's the entire stated justification for the 1% demand, and it doesn't hold up. What makes this notable beyond the rhetoric is who's being defied. Kevin Warsh is Trump's own pick to chair the Fed, nominated specifically, according to Trump himself, because Warsh wanted to lower rates. Instead Warsh's committee just voted unanimously to raise them, citing inflation that "remains elevated" and geopolitical uncertainty tied to the Iran conflict driving energy prices higher. The White House had mounted real pressure ahead of this, Trump, Vance, and Treasury Secretary Bessent all pushed publicly against a hike in the days before Wednesday. My honest read: a 275 basis point gap between demand and actual policy is a genuine, unusual level of open conflict, not typical jawboning. Fed independence held here, the committee moved on its own read of inflation data over direct executive pressure, worth noting as the actual substance under the headline noise. What I'm watching: whether this pressure escalates into something more concrete before December's meeting, where the dot plot already signals another hike may be coming regardless of how loud this gets. $BTC #Macro Insights# #Meme Alpha# $ETH

·
--
См. перевод
Getting FCA authorization won't get you a functioning bank account in the UK, that's the actual finding here, and it's a more useful story than the "deadline looms" framing suggests. Per The Banker, nine of the UK's ten largest retail banks currently restrict or block payments to crypto exchanges, and that won't automatically change when the FCA's new regime takes effect October 25, 2027. Industry data puts roughly 40% of UK bank to exchange transfers blocked or delayed right now. Specifics vary by bank, Chase UK, Starling, TSB, Virgin Money, and Metro Bank block these transactions entirely, while Barclays and HSBC cap transfers at £2,500 per transaction and £10,000 over a rolling 30 days, NatWest allows £1,000 daily and £5,000 monthly, Santander caps at £1,000 per transaction and £3,000 monthly. The regulatory mechanics matter here. FCA authorization applications open September 30, 2026, running through February 28, 2027, ahead of the full regime. But per The Banker, the FCA will encourage banks to avoid blanket restrictions rather than compel them to change policy, leaving two genuine tiers of access even after firms clear the regulatory bar, some FCA authorized platforms will have functioning banking rails, others won't, depending entirely on which bank holds the money. My honest read: this is a structural friction problem regulatory approval alone doesn't solve, HM Treasury has called banking decisions "largely commercial in nature," meaning banks retain real discretion regardless of who's licensed. What I'm watching: whether any of the nine restrictive banks loosen policy once FCA authorization starts rolling out, or whether this gap persists past October 2027. $BTC #BTC Price Analysis# #BNBChain#
Getting FCA authorization won't get you a functioning bank account in the UK, that's the actual finding here, and it's a more useful story than the "deadline looms" framing suggests. Per The Banker, nine of the UK's ten largest retail banks currently restrict or block payments to crypto exchanges, and that won't automatically change when the FCA's new regime takes effect October 25, 2027. Industry data puts roughly 40% of UK bank to exchange transfers blocked or delayed right now. Specifics vary by bank, Chase UK, Starling, TSB, Virgin Money, and Metro Bank block these transactions entirely, while Barclays and HSBC cap transfers at £2,500 per transaction and £10,000 over a rolling 30 days, NatWest allows £1,000 daily and £5,000 monthly, Santander caps at £1,000 per transaction and £3,000 monthly. The regulatory mechanics matter here. FCA authorization applications open September 30, 2026, running through February 28, 2027, ahead of the full regime. But per The Banker, the FCA will encourage banks to avoid blanket restrictions rather than compel them to change policy, leaving two genuine tiers of access even after firms clear the regulatory bar, some FCA authorized platforms will have functioning banking rails, others won't, depending entirely on which bank holds the money. My honest read: this is a structural friction problem regulatory approval alone doesn't solve, HM Treasury has called banking decisions "largely commercial in nature," meaning banks retain real discretion regardless of who's licensed. What I'm watching: whether any of the nine restrictive banks loosen policy once FCA authorization starts rolling out, or whether this gap persists past October 2027. $BTC #BTC Price Analysis# #BNBChain#
41
·
--
См. перевод
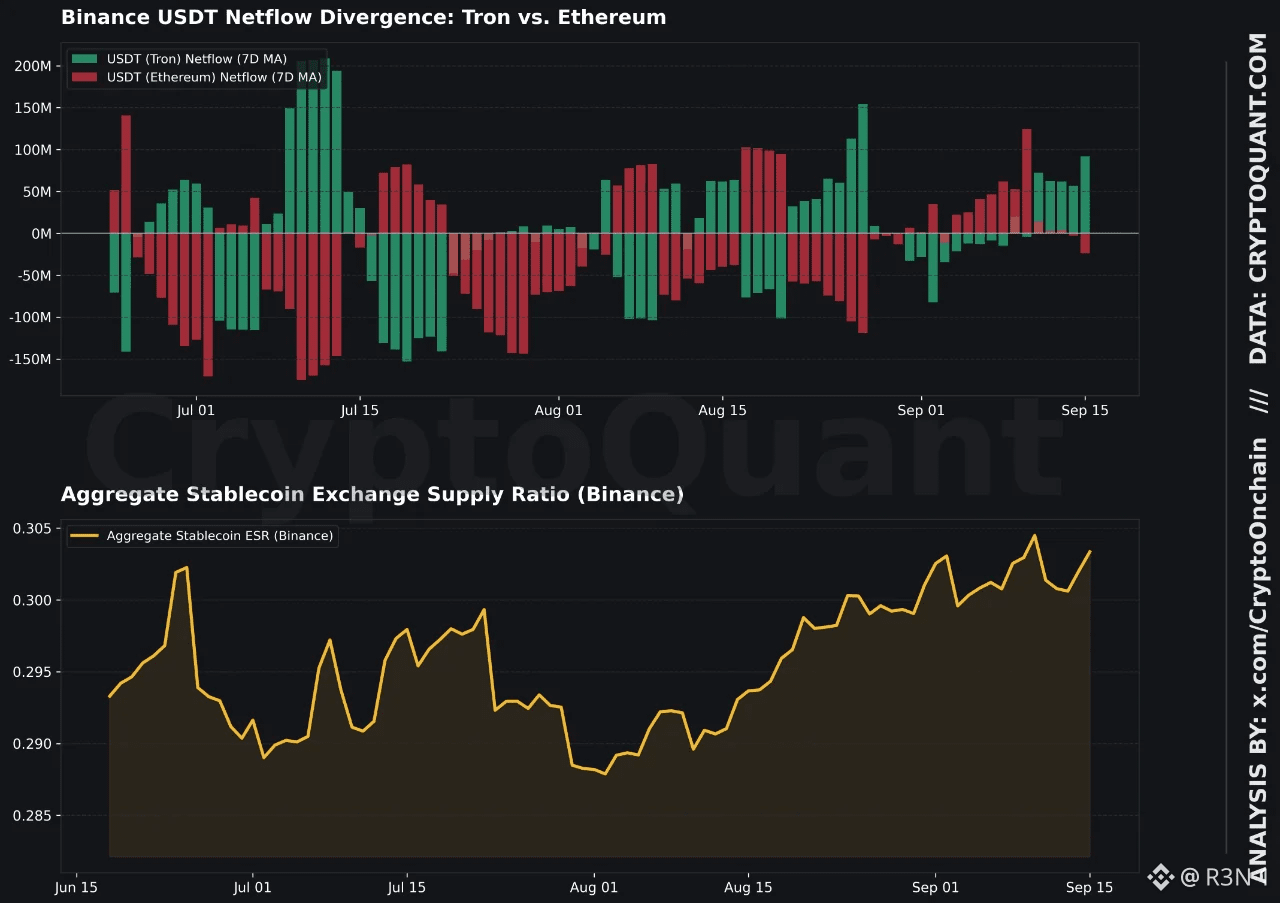
USDT on Tron flooding into Binance at 660% above its 30 day baseline, right as CPI, PPI, and the FOMC decision all landed in the same window. Timing that isn't likely coincidental. USDT(TRX) netflow averaged +$91.73M daily to Binance over the seven days ending September 15, USDC added +$23.71M daily, pushing total stablecoin reserves on the exchange to $43.44 billion. Worth flagging, September 6 has no recorded prints, so these averages rest on six sessions, not seven. The composition matters more than the aggregate. Tron based USDT and USDC both saw heavy accumulation, up 624% and 518% against their 90 day baselines, while Ethereum based USDT saw net outflows averaging -$23.89M daily over the same stretch. A real network level rotation toward the cheaper rail, not stablecoins broadly flowing toward Binance. The aggregate Exchange Supply Ratio still climbed to 0.3022 despite that split. Macro sits behind this. CPI printed 3.4% YoY in August, core 2.4%, PPI final demand at 5.4%, the 10 year closed at 4.97%. One unverified possibility worth naming as speculation: this rotation reflects positioning ahead of the FOMC decision rather than a reaction to data already released, capital staging on the cheapest rail while waiting for clarity. My honest read: a climbing Exchange Supply Ratio alongside this kind of network specific staging has historically preceded liquidity deployment around major macro events, a real pattern, not proof of what comes next. What I'm watching: whether this staged capital deploys now that the Fed decision has landed, or continues sitting on Tron rails. #BTC Price Analysis# $USDT #Macro Insights# $TRX
USDT on Tron flooding into Binance at 660% above its 30 day baseline, right as CPI, PPI, and the FOMC decision all landed in the same window. Timing that isn't likely coincidental. USDT(TRX) netflow averaged +$91.73M daily to Binance over the seven days ending September 15, USDC added +$23.71M daily, pushing total stablecoin reserves on the exchange to $43.44 billion. Worth flagging, September 6 has no recorded prints, so these averages rest on six sessions, not seven. The composition matters more than the aggregate. Tron based USDT and USDC both saw heavy accumulation, up 624% and 518% against their 90 day baselines, while Ethereum based USDT saw net outflows averaging -$23.89M daily over the same stretch. A real network level rotation toward the cheaper rail, not stablecoins broadly flowing toward Binance. The aggregate Exchange Supply Ratio still climbed to 0.3022 despite that split. Macro sits behind this. CPI printed 3.4% YoY in August, core 2.4%, PPI final demand at 5.4%, the 10 year closed at 4.97%. One unverified possibility worth naming as speculation: this rotation reflects positioning ahead of the FOMC decision rather than a reaction to data already released, capital staging on the cheapest rail while waiting for clarity. My honest read: a climbing Exchange Supply Ratio alongside this kind of network specific staging has historically preceded liquidity deployment around major macro events, a real pattern, not proof of what comes next. What I'm watching: whether this staged capital deploys now that the Fed decision has landed, or continues sitting on Tron rails. #BTC Price Analysis# $USDT #Macro Insights# $TRX
55
·
--
$1 миллиард торгового объёма за три дня во время пилотной фазы. Вот эта цифра на самом деле объясняет, почему X сделал это постоянным — а не сам по себе заголовок о главной функции.
Партнёрская программа Cashtag полностью запустилась во вторник: пользователи могут нажать на поддерживаемый тикер, увидеть график цены и связанные посты, а затем нажать Trade, чтобы запрос был перенаправлен одному из пяти партнёров — Interactive Brokers, Moomoo, Gemini, Kraken или Coinbase. Однако стоит быть точным, что именно происходит технически. X ничего сам не исполняет — он прямо это заявляет: нет исполнения, нет обработки, нет хранения. Это передача в собственное приложение или на сайт брокера, где пользователь входит в систему или открывает счёт, а реальная транзакция целиком происходит вне X.
Наличие криптовалют в списке запуска — это деталь, которую я бы взвесил в первую очередь. Трое из пяти партнёров — Coinbase, Kraken и Gemini — это криптобиржи, то есть цифровые активы получают тот же самый путь для обнаружения и торговли, что и акции и ETF, начиная с первого дня, а не добавляются “впоследствии”. Interactive Brokers, как сообщается, также запускает стимул на $100 для новых пополненных счетов, открытых через именно этот поток — настоящий аквизиционный импульс, наложенный поверх самой функции.
Моё честное мнение: это действительно хорошо выстроенная дистрибуционная игра. У X уже есть объём разговоров в финансовой повестке, а сокращение шага с ручным поиском и открытием отдельного брокерского приложения — реальное снижение трения, а не косметическая функция. Важно для крипто-составляющей то, что цифровые активы здесь относятся к ядру запуска, а не к категории, прикрученной позже.
За чем я наблюдаю: сохранится ли ежедневный объём через этот канал после того, как всё стало живым продуктом, а не новинкой пилота, и расширится ли список партнёров за пределы этих первых пяти.
$BTC #BTC Price Analysis# #Altcoin Season# $ETH
$1 миллиард торгового объёма за три дня во время пилотной фазы. Вот эта цифра на самом деле объясняет, почему X сделал это постоянным — а не сам по себе заголовок о главной функции.
Партнёрская программа Cashtag полностью запустилась во вторник: пользователи могут нажать на поддерживаемый тикер, увидеть график цены и связанные посты, а затем нажать Trade, чтобы запрос был перенаправлен одному из пяти партнёров — Interactive Brokers, Moomoo, Gemini, Kraken или Coinbase. Однако стоит быть точным, что именно происходит технически. X ничего сам не исполняет — он прямо это заявляет: нет исполнения, нет обработки, нет хранения. Это передача в собственное приложение или на сайт брокера, где пользователь входит в систему или открывает счёт, а реальная транзакция целиком происходит вне X.
Наличие криптовалют в списке запуска — это деталь, которую я бы взвесил в первую очередь. Трое из пяти партнёров — Coinbase, Kraken и Gemini — это криптобиржи, то есть цифровые активы получают тот же самый путь для обнаружения и торговли, что и акции и ETF, начиная с первого дня, а не добавляются “впоследствии”. Interactive Brokers, как сообщается, также запускает стимул на $100 для новых пополненных счетов, открытых через именно этот поток — настоящий аквизиционный импульс, наложенный поверх самой функции.
Моё честное мнение: это действительно хорошо выстроенная дистрибуционная игра. У X уже есть объём разговоров в финансовой повестке, а сокращение шага с ручным поиском и открытием отдельного брокерского приложения — реальное снижение трения, а не косметическая функция. Важно для крипто-составляющей то, что цифровые активы здесь относятся к ядру запуска, а не к категории, прикрученной позже.
За чем я наблюдаю: сохранится ли ежедневный объём через этот канал после того, как всё стало живым продуктом, а не новинкой пилота, и расширится ли список партнёров за пределы этих первых пяти.
$BTC #BTC Price Analysis# #Altcoin Season# $ETH
Партнёрская программа Cashtag полностью запустилась во вторник: пользователи могут нажать на поддерживаемый тикер, увидеть график цены и связанные посты, а затем нажать Trade, чтобы запрос был перенаправлен одному из пяти партнёров — Interactive Brokers, Moomoo, Gemini, Kraken или Coinbase. Однако стоит быть точным, что именно происходит технически. X ничего сам не исполняет — он прямо это заявляет: нет исполнения, нет обработки, нет хранения. Это передача в собственное приложение или на сайт брокера, где пользователь входит в систему или открывает счёт, а реальная транзакция целиком происходит вне X.
Наличие криптовалют в списке запуска — это деталь, которую я бы взвесил в первую очередь. Трое из пяти партнёров — Coinbase, Kraken и Gemini — это криптобиржи, то есть цифровые активы получают тот же самый путь для обнаружения и торговли, что и акции и ETF, начиная с первого дня, а не добавляются “впоследствии”. Interactive Brokers, как сообщается, также запускает стимул на $100 для новых пополненных счетов, открытых через именно этот поток — настоящий аквизиционный импульс, наложенный поверх самой функции.
Моё честное мнение: это действительно хорошо выстроенная дистрибуционная игра. У X уже есть объём разговоров в финансовой повестке, а сокращение шага с ручным поиском и открытием отдельного брокерского приложения — реальное снижение трения, а не косметическая функция. Важно для крипто-составляющей то, что цифровые активы здесь относятся к ядру запуска, а не к категории, прикрученной позже.
За чем я наблюдаю: сохранится ли ежедневный объём через этот канал после того, как всё стало живым продуктом, а не новинкой пилота, и расширится ли список партнёров за пределы этих первых пяти.
$BTC #BTC Price Analysis# #Altcoin Season# $ETH

88
·
--
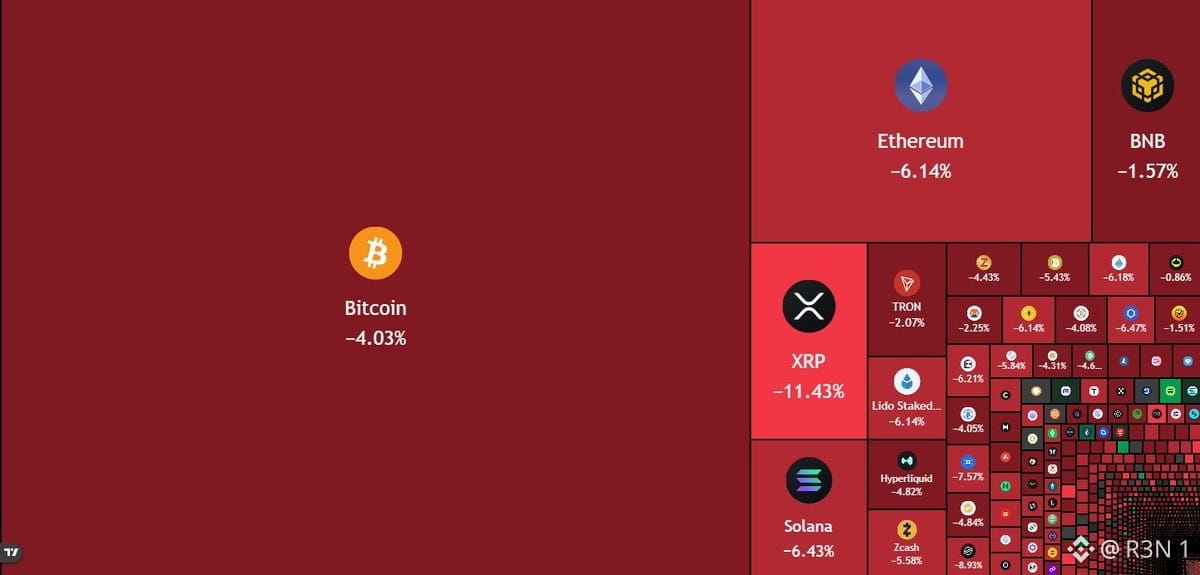
40 голосов “против” были уже учтены до завершения подсчёта, и Bitcoin уже тогда начал скользить. Такова картина по итоговому голосованию по законопроекту CLARITY Act на сегодня: идёт онлайн-подсчёт, но рынок уже явно считывает направление.
Отдельно стоит точно обозначить цифры вероятностей. По данным нескольких источников, прогнозные рынки в понедельник смещались примерно с 30–34% вниз до диапазона 17–20% сегодня после того, как сенатские демократы представили встречное предложение с более жёсткими этическими правилами. В него включены положения, продлевающие ограничения для членов семьи должностных лиц, а также сокращающие сроки отчуждения/разделения активов до 180 дней. Цифра в 14%, которая сейчас активно циркулирует, соответствует той же направленной “просадке” — даже если точное значение слегка отличается в зависимости от платформы и временного штампа: всё это происходило быстро, в рамках того же дня.
BTC откатился обратно к $76 000 по мере продолжения подсчёта голосов: Circle, Bullish и Coinbase также продлили ранее понесённые потери. У республиканцев 53 места, то есть как минимум семь демократов или независимых должны были перейти на другую сторону, а когда уже зафиксированы 40 голосов “нет”, следующая “утечка” фактически завершает эту попытку на 2026 год. Ламмис была прямолинейна относительно ставок: она заявила, что если сегодня голосование о прекращении прений (cloture) провалится, переговоры, вероятно, будут окончены; этот законопроект — это более года работы и уже включённые 126 запрошенных изменений.
Моё честное прочтение: реакция рынка здесь — BTC скользит в реальном времени по мере того, как идёт подсчёт, — на самом деле более информативный сигнал, чем любая отдельная цифра с прогнозного рынка. Трейдеры закладывают провал ещё до последнего “молотка”, и это именно “живое” прочтение, а не прогноз.
За чем я слежу: за самим финальным зафиксированным итогом голосования, потому что узкий провал в районе высоких 50% может означать, что попытка вернётся с поправками в 2027 году, тогда как более широкий провал укажет, что конкретно этот законопроект действительно мёртв по итогам года.
$BTC #Altcoin Season# #Macro Insights#
40 голосов “против” были уже учтены до завершения подсчёта, и Bitcoin уже тогда начал скользить. Такова картина по итоговому голосованию по законопроекту CLARITY Act на сегодня: идёт онлайн-подсчёт, но рынок уже явно считывает направление.
Отдельно стоит точно обозначить цифры вероятностей. По данным нескольких источников, прогнозные рынки в понедельник смещались примерно с 30–34% вниз до диапазона 17–20% сегодня после того, как сенатские демократы представили встречное предложение с более жёсткими этическими правилами. В него включены положения, продлевающие ограничения для членов семьи должностных лиц, а также сокращающие сроки отчуждения/разделения активов до 180 дней. Цифра в 14%, которая сейчас активно циркулирует, соответствует той же направленной “просадке” — даже если точное значение слегка отличается в зависимости от платформы и временного штампа: всё это происходило быстро, в рамках того же дня.
BTC откатился обратно к $76 000 по мере продолжения подсчёта голосов: Circle, Bullish и Coinbase также продлили ранее понесённые потери. У республиканцев 53 места, то есть как минимум семь демократов или независимых должны были перейти на другую сторону, а когда уже зафиксированы 40 голосов “нет”, следующая “утечка” фактически завершает эту попытку на 2026 год. Ламмис была прямолинейна относительно ставок: она заявила, что если сегодня голосование о прекращении прений (cloture) провалится, переговоры, вероятно, будут окончены; этот законопроект — это более года работы и уже включённые 126 запрошенных изменений.
Моё честное прочтение: реакция рынка здесь — BTC скользит в реальном времени по мере того, как идёт подсчёт, — на самом деле более информативный сигнал, чем любая отдельная цифра с прогнозного рынка. Трейдеры закладывают провал ещё до последнего “молотка”, и это именно “живое” прочтение, а не прогноз.
За чем я слежу: за самим финальным зафиксированным итогом голосования, потому что узкий провал в районе высоких 50% может означать, что попытка вернётся с поправками в 2027 году, тогда как более широкий провал укажет, что конкретно этот законопроект действительно мёртв по итогам года.
$BTC #Altcoin Season# #Macro Insights#
Отдельно стоит точно обозначить цифры вероятностей. По данным нескольких источников, прогнозные рынки в понедельник смещались примерно с 30–34% вниз до диапазона 17–20% сегодня после того, как сенатские демократы представили встречное предложение с более жёсткими этическими правилами. В него включены положения, продлевающие ограничения для членов семьи должностных лиц, а также сокращающие сроки отчуждения/разделения активов до 180 дней. Цифра в 14%, которая сейчас активно циркулирует, соответствует той же направленной “просадке” — даже если точное значение слегка отличается в зависимости от платформы и временного штампа: всё это происходило быстро, в рамках того же дня.
BTC откатился обратно к $76 000 по мере продолжения подсчёта голосов: Circle, Bullish и Coinbase также продлили ранее понесённые потери. У республиканцев 53 места, то есть как минимум семь демократов или независимых должны были перейти на другую сторону, а когда уже зафиксированы 40 голосов “нет”, следующая “утечка” фактически завершает эту попытку на 2026 год. Ламмис была прямолинейна относительно ставок: она заявила, что если сегодня голосование о прекращении прений (cloture) провалится, переговоры, вероятно, будут окончены; этот законопроект — это более года работы и уже включённые 126 запрошенных изменений.
Моё честное прочтение: реакция рынка здесь — BTC скользит в реальном времени по мере того, как идёт подсчёт, — на самом деле более информативный сигнал, чем любая отдельная цифра с прогнозного рынка. Трейдеры закладывают провал ещё до последнего “молотка”, и это именно “живое” прочтение, а не прогноз.
За чем я слежу: за самим финальным зафиксированным итогом голосования, потому что узкий провал в районе высоких 50% может означать, что попытка вернётся с поправками в 2027 году, тогда как более широкий провал укажет, что конкретно этот законопроект действительно мёртв по итогам года.
$BTC #Altcoin Season# #Macro Insights#
1
·
--
30 прямых дней без ухода под воду. Это и есть реальная веха, а не то, что краткосрочные держатели якобы безумно прибыльны — нет, это не так. Речь о стабильности, а не о величине.
По данным CryptoQuant, кошельки когорты STH (монеты, находящиеся в обращении менее шести месяцев) как минимум частично в прибыли с 16 августа. К этой неделе прибыль составила $168,2 млрд против $102,6 млрд убытков. Более широкая база инвесторов удерживает чистую прибыль с 19 августа и в тот же день показатель отношения реализованной прибыли к затратам (spent output profit ratio) пересек уровень безубыточности 1, после чего оставался чуть выше него. Себестоимость для держателей со сроком 1–3 месяца держится примерно на уровне $63 372, а для держателей 3–6 месяцев — ближе к $73 190.
Почему 30 дней важны — это сравнение, которое проводит CryptoQuant. Последняя сопоставимая серия была в январе: она длилась менее недели, прежде чем прервалась. В мае в когорте доминировали убытки. Это не регулярный паттерн, а первая устойчивая серия с момента, когда рынок достиг пика. CryptoQuant также отмечает, что похожие многонедельные отрезки предшествовали завершению 2022 года медвежьего рынка.
Мой честный взгляд: это действительно значимый факт, который стоит воспринимать всерьёз. Устойчивая прибыльность у когорты, известной тем, что она быстро реагирует и продаёт при слабости, — это в целом другое, нежели краткий отскок. Но я бы отделял наблюдение от вывода: CryptoQuant считает это предпосылкой для устойчивого разворота, а не подтверждением такового; необходимое условие не является достаточным.
Где я бы спорил с тем, чтобы заранее делать выводы: удержание позиций на фоне обычной волатильности — это один из входящих сигналов, но не отдельный самостоятельный индикатор. Даже если показатель чуть выше безубыточности, это всё ещё означает, что значимая доля этой когорты остаётся близко к себестоимости, а не уверенно уходит в плюс.
Что я отслеживаю: продолжится ли эта серия при реальном испытании — подлинной коррекции, которая будет давить на эти уровни себестоимости, а не просто накопление дней во время спокойного участка рынка.
$BTC #BTC Price Analysis# #Altcoin Season#
30 прямых дней без ухода под воду. Это и есть реальная веха, а не то, что краткосрочные держатели якобы безумно прибыльны — нет, это не так. Речь о стабильности, а не о величине.
По данным CryptoQuant, кошельки когорты STH (монеты, находящиеся в обращении менее шести месяцев) как минимум частично в прибыли с 16 августа. К этой неделе прибыль составила $168,2 млрд против $102,6 млрд убытков. Более широкая база инвесторов удерживает чистую прибыль с 19 августа и в тот же день показатель отношения реализованной прибыли к затратам (spent output profit ratio) пересек уровень безубыточности 1, после чего оставался чуть выше него. Себестоимость для держателей со сроком 1–3 месяца держится примерно на уровне $63 372, а для держателей 3–6 месяцев — ближе к $73 190.
Почему 30 дней важны — это сравнение, которое проводит CryptoQuant. Последняя сопоставимая серия была в январе: она длилась менее недели, прежде чем прервалась. В мае в когорте доминировали убытки. Это не регулярный паттерн, а первая устойчивая серия с момента, когда рынок достиг пика. CryptoQuant также отмечает, что похожие многонедельные отрезки предшествовали завершению 2022 года медвежьего рынка.
Мой честный взгляд: это действительно значимый факт, который стоит воспринимать всерьёз. Устойчивая прибыльность у когорты, известной тем, что она быстро реагирует и продаёт при слабости, — это в целом другое, нежели краткий отскок. Но я бы отделял наблюдение от вывода: CryptoQuant считает это предпосылкой для устойчивого разворота, а не подтверждением такового; необходимое условие не является достаточным.
Где я бы спорил с тем, чтобы заранее делать выводы: удержание позиций на фоне обычной волатильности — это один из входящих сигналов, но не отдельный самостоятельный индикатор. Даже если показатель чуть выше безубыточности, это всё ещё означает, что значимая доля этой когорты остаётся близко к себестоимости, а не уверенно уходит в плюс.
Что я отслеживаю: продолжится ли эта серия при реальном испытании — подлинной коррекции, которая будет давить на эти уровни себестоимости, а не просто накопление дней во время спокойного участка рынка.
$BTC #BTC Price Analysis# #Altcoin Season#
По данным CryptoQuant, кошельки когорты STH (монеты, находящиеся в обращении менее шести месяцев) как минимум частично в прибыли с 16 августа. К этой неделе прибыль составила $168,2 млрд против $102,6 млрд убытков. Более широкая база инвесторов удерживает чистую прибыль с 19 августа и в тот же день показатель отношения реализованной прибыли к затратам (spent output profit ratio) пересек уровень безубыточности 1, после чего оставался чуть выше него. Себестоимость для держателей со сроком 1–3 месяца держится примерно на уровне $63 372, а для держателей 3–6 месяцев — ближе к $73 190.
Почему 30 дней важны — это сравнение, которое проводит CryptoQuant. Последняя сопоставимая серия была в январе: она длилась менее недели, прежде чем прервалась. В мае в когорте доминировали убытки. Это не регулярный паттерн, а первая устойчивая серия с момента, когда рынок достиг пика. CryptoQuant также отмечает, что похожие многонедельные отрезки предшествовали завершению 2022 года медвежьего рынка.
Мой честный взгляд: это действительно значимый факт, который стоит воспринимать всерьёз. Устойчивая прибыльность у когорты, известной тем, что она быстро реагирует и продаёт при слабости, — это в целом другое, нежели краткий отскок. Но я бы отделял наблюдение от вывода: CryptoQuant считает это предпосылкой для устойчивого разворота, а не подтверждением такового; необходимое условие не является достаточным.
Где я бы спорил с тем, чтобы заранее делать выводы: удержание позиций на фоне обычной волатильности — это один из входящих сигналов, но не отдельный самостоятельный индикатор. Даже если показатель чуть выше безубыточности, это всё ещё означает, что значимая доля этой когорты остаётся близко к себестоимости, а не уверенно уходит в плюс.
Что я отслеживаю: продолжится ли эта серия при реальном испытании — подлинной коррекции, которая будет давить на эти уровни себестоимости, а не просто накопление дней во время спокойного участка рынка.
$BTC #BTC Price Analysis# #Altcoin Season#

30
·
--
Нет невозвратных кредитов на сумму $14 миллиардов в совокупном объеме транзакций. Этот послужной список здесь делает больше, чем заголовок про рыночную капитализацию.
PST, токен PayFi Strategy от Huma Finance, только что преодолел отметку в $322 миллиона рыночной капитализации — с $158 миллионов в апреле и $200 миллионов в июле. Сейчас это крупнейший доходный актив на Solana. Пополнение USDC чеканит PST, а этот капитал затем выдается в виде краткосрочного финансирования сроком обычно от одного до пяти дней лицензированным платежным институтам, которые закрывают трансграничные расчеты и торговое финансирование. Проценты и комиссии возвращаются держателям, подталкивая стоимость токена со временем, а не выплачивая отдельно.
Годовая доходность составляет порядка 7–9% в пересчете на USDC. Около 80% капитала размещается в собственных PayFi-пулах Huma, а остальное — в ликвидные DeFi-стратегии через Kamino, Jupiter, Aave и Pendle.
Заявление о нулевых дефолтах — та часть, которую я бы оценивал сильнее всего. Каждый выданный через протокол заем, как сообщается, был погашен — то есть профиль риска существенно отличается от большинства источников DeFi-доходности, он подкреплен реальным краткосрочным коммерческим финансированием, а не токеновыми эмиссиями или заливными позициями. PST также расширился на Ethereum через Morpho и Fluid, привлекая институциональных участников, включая Bitwise и Coinbase Asset Management.
Мое честное мнение: это выглядит как реальный продукт RWA с доходностью на основе реального использования, а не как спекулятивная токеновая накачка; и кривая роста, и базовые механики это подтверждают. Стать крупнейшим доходным активом Solana — реальная веха, хотя я бы хотел увидеть, сохранится ли этот титул, когда больше конкурентов в сегменте RWA начнут масштабировать собственные продукты.
За чем я слежу: сохранится ли трек-рекорд по нулевым дефолтам по мере того, как баланс PST продолжит расти, потому что размер и дисциплина по рискам не всегда остаются совместимыми в кредитных продуктах.
$SOL #Altcoin Season# #Meme Alpha#
Нет невозвратных кредитов на сумму $14 миллиардов в совокупном объеме транзакций. Этот послужной список здесь делает больше, чем заголовок про рыночную капитализацию.
PST, токен PayFi Strategy от Huma Finance, только что преодолел отметку в $322 миллиона рыночной капитализации — с $158 миллионов в апреле и $200 миллионов в июле. Сейчас это крупнейший доходный актив на Solana. Пополнение USDC чеканит PST, а этот капитал затем выдается в виде краткосрочного финансирования сроком обычно от одного до пяти дней лицензированным платежным институтам, которые закрывают трансграничные расчеты и торговое финансирование. Проценты и комиссии возвращаются держателям, подталкивая стоимость токена со временем, а не выплачивая отдельно.
Годовая доходность составляет порядка 7–9% в пересчете на USDC. Около 80% капитала размещается в собственных PayFi-пулах Huma, а остальное — в ликвидные DeFi-стратегии через Kamino, Jupiter, Aave и Pendle.
Заявление о нулевых дефолтах — та часть, которую я бы оценивал сильнее всего. Каждый выданный через протокол заем, как сообщается, был погашен — то есть профиль риска существенно отличается от большинства источников DeFi-доходности, он подкреплен реальным краткосрочным коммерческим финансированием, а не токеновыми эмиссиями или заливными позициями. PST также расширился на Ethereum через Morpho и Fluid, привлекая институциональных участников, включая Bitwise и Coinbase Asset Management.
Мое честное мнение: это выглядит как реальный продукт RWA с доходностью на основе реального использования, а не как спекулятивная токеновая накачка; и кривая роста, и базовые механики это подтверждают. Стать крупнейшим доходным активом Solana — реальная веха, хотя я бы хотел увидеть, сохранится ли этот титул, когда больше конкурентов в сегменте RWA начнут масштабировать собственные продукты.
За чем я слежу: сохранится ли трек-рекорд по нулевым дефолтам по мере того, как баланс PST продолжит расти, потому что размер и дисциплина по рискам не всегда остаются совместимыми в кредитных продуктах.
$SOL #Altcoin Season# #Meme Alpha#
PST, токен PayFi Strategy от Huma Finance, только что преодолел отметку в $322 миллиона рыночной капитализации — с $158 миллионов в апреле и $200 миллионов в июле. Сейчас это крупнейший доходный актив на Solana. Пополнение USDC чеканит PST, а этот капитал затем выдается в виде краткосрочного финансирования сроком обычно от одного до пяти дней лицензированным платежным институтам, которые закрывают трансграничные расчеты и торговое финансирование. Проценты и комиссии возвращаются держателям, подталкивая стоимость токена со временем, а не выплачивая отдельно.
Годовая доходность составляет порядка 7–9% в пересчете на USDC. Около 80% капитала размещается в собственных PayFi-пулах Huma, а остальное — в ликвидные DeFi-стратегии через Kamino, Jupiter, Aave и Pendle.
Заявление о нулевых дефолтах — та часть, которую я бы оценивал сильнее всего. Каждый выданный через протокол заем, как сообщается, был погашен — то есть профиль риска существенно отличается от большинства источников DeFi-доходности, он подкреплен реальным краткосрочным коммерческим финансированием, а не токеновыми эмиссиями или заливными позициями. PST также расширился на Ethereum через Morpho и Fluid, привлекая институциональных участников, включая Bitwise и Coinbase Asset Management.
Мое честное мнение: это выглядит как реальный продукт RWA с доходностью на основе реального использования, а не как спекулятивная токеновая накачка; и кривая роста, и базовые механики это подтверждают. Стать крупнейшим доходным активом Solana — реальная веха, хотя я бы хотел увидеть, сохранится ли этот титул, когда больше конкурентов в сегменте RWA начнут масштабировать собственные продукты.
За чем я слежу: сохранится ли трек-рекорд по нулевым дефолтам по мере того, как баланс PST продолжит расти, потому что размер и дисциплина по рискам не всегда остаются совместимыми в кредитных продуктах.
$SOL #Altcoin Season# #Meme Alpha#

29
·
--
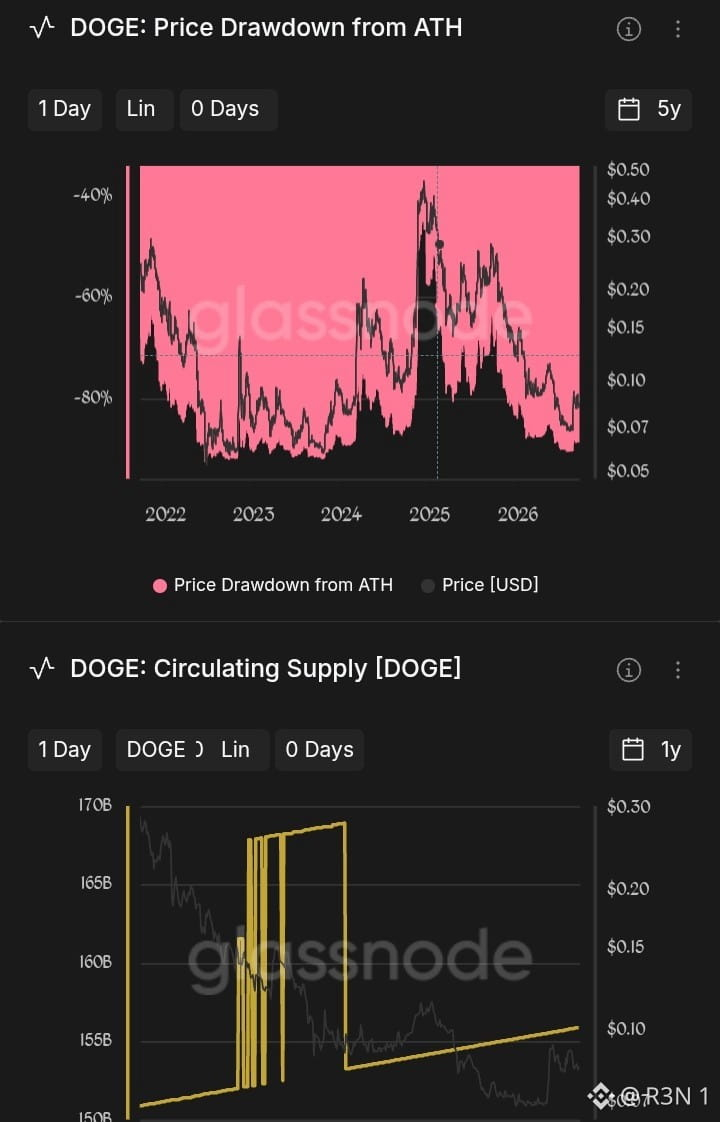
DOGE не выходил из просадки более чем на 80% по сравнению со своим историческим максимумом уже несколько лет. И, глядя на этот график, видно, что это не недавнее явление — скорее норма, сохраняющаяся с пика 2021 года.
График просадки за пять лет показывает, что DOGE в основном колеблется в диапазоне примерно от -60% до -85% относительно ATH. При этом кратковременные «облегчающие» ралли ненадолго тянут этот показатель ближе к -40% во время реальных циклов ажиотажа. Самый заметный такой всплеск виден здесь в конце 2024 года — вероятно, он связан с предвыборным периодом, когда «памп» поднял мемкоины в целом. За пределами этих пиков DOGE проводит подавляющую часть времени глубоко в зоне просадки, и его текущее положение на этом графике все еще находится в той же глубокой скидке — не рядом с восстановлением.
Я хочу честно указать на второй график, не пытаясь натянуть на него интерпретацию. Серия по обращающемуся предложению показывает резкие вертикальные всплески, которые повторно «прыгают» между примерно 150 млрд и 170 млрд в пределах короткого промежутка времени. Это не похоже на то, как работает предложение DOGE: фиксированная ежегодная эмиссия около 5 млрд монет должна отражаться на графике как плавная, постепенная линия, а не как вертикальные скачки. Похоже, это артефакт построения или данных — возможно, наложение серий. Я бы не делал выводов об изменениях реального предложения из того, что показано.
Мое честное прочтение того, что здесь действительно можно использовать: график просадки рассказывает реальную и довольно медвежью структурную историю. DOGE не смог существенно вернуть утраченное относительно своего ATH на протяжении нескольких циклов — с учетом исключений в виде кратких вспышек, driven ажиотажем. Такой паттерн стоит воспринимать серьезно, а не предполагать, что следующий цикл хайпа поведет себя иначе.
Что бы я хотел увидеть, прежде чем извлекать больше из стороны предложения: более чистую версию того графика по circulating supply, потому что тот, который показан здесь, не является надежным для интерпретации.
$DOGE #BTC Price Analysis# #Altcoin Season#
DOGE не выходил из просадки более чем на 80% по сравнению со своим историческим максимумом уже несколько лет. И, глядя на этот график, видно, что это не недавнее явление — скорее норма, сохраняющаяся с пика 2021 года.
График просадки за пять лет показывает, что DOGE в основном колеблется в диапазоне примерно от -60% до -85% относительно ATH. При этом кратковременные «облегчающие» ралли ненадолго тянут этот показатель ближе к -40% во время реальных циклов ажиотажа. Самый заметный такой всплеск виден здесь в конце 2024 года — вероятно, он связан с предвыборным периодом, когда «памп» поднял мемкоины в целом. За пределами этих пиков DOGE проводит подавляющую часть времени глубоко в зоне просадки, и его текущее положение на этом графике все еще находится в той же глубокой скидке — не рядом с восстановлением.
Я хочу честно указать на второй график, не пытаясь натянуть на него интерпретацию. Серия по обращающемуся предложению показывает резкие вертикальные всплески, которые повторно «прыгают» между примерно 150 млрд и 170 млрд в пределах короткого промежутка времени. Это не похоже на то, как работает предложение DOGE: фиксированная ежегодная эмиссия около 5 млрд монет должна отражаться на графике как плавная, постепенная линия, а не как вертикальные скачки. Похоже, это артефакт построения или данных — возможно, наложение серий. Я бы не делал выводов об изменениях реального предложения из того, что показано.
Мое честное прочтение того, что здесь действительно можно использовать: график просадки рассказывает реальную и довольно медвежью структурную историю. DOGE не смог существенно вернуть утраченное относительно своего ATH на протяжении нескольких циклов — с учетом исключений в виде кратких вспышек, driven ажиотажем. Такой паттерн стоит воспринимать серьезно, а не предполагать, что следующий цикл хайпа поведет себя иначе.
Что бы я хотел увидеть, прежде чем извлекать больше из стороны предложения: более чистую версию того графика по circulating supply, потому что тот, который показан здесь, не является надежным для интерпретации.
$DOGE #BTC Price Analysis# #Altcoin Season#
График просадки за пять лет показывает, что DOGE в основном колеблется в диапазоне примерно от -60% до -85% относительно ATH. При этом кратковременные «облегчающие» ралли ненадолго тянут этот показатель ближе к -40% во время реальных циклов ажиотажа. Самый заметный такой всплеск виден здесь в конце 2024 года — вероятно, он связан с предвыборным периодом, когда «памп» поднял мемкоины в целом. За пределами этих пиков DOGE проводит подавляющую часть времени глубоко в зоне просадки, и его текущее положение на этом графике все еще находится в той же глубокой скидке — не рядом с восстановлением.
Я хочу честно указать на второй график, не пытаясь натянуть на него интерпретацию. Серия по обращающемуся предложению показывает резкие вертикальные всплески, которые повторно «прыгают» между примерно 150 млрд и 170 млрд в пределах короткого промежутка времени. Это не похоже на то, как работает предложение DOGE: фиксированная ежегодная эмиссия около 5 млрд монет должна отражаться на графике как плавная, постепенная линия, а не как вертикальные скачки. Похоже, это артефакт построения или данных — возможно, наложение серий. Я бы не делал выводов об изменениях реального предложения из того, что показано.
Мое честное прочтение того, что здесь действительно можно использовать: график просадки рассказывает реальную и довольно медвежью структурную историю. DOGE не смог существенно вернуть утраченное относительно своего ATH на протяжении нескольких циклов — с учетом исключений в виде кратких вспышек, driven ажиотажем. Такой паттерн стоит воспринимать серьезно, а не предполагать, что следующий цикл хайпа поведет себя иначе.
Что бы я хотел увидеть, прежде чем извлекать больше из стороны предложения: более чистую версию того графика по circulating supply, потому что тот, который показан здесь, не является надежным для интерпретации.
$DOGE #BTC Price Analysis# #Altcoin Season#
42
·
--
Все четыре основные категории спотовых ETF показали притоки в один и тот же день — 14 сентября. Это не то, что происходило стабильно в течение этого месяца: в большинстве сессий как минимум одна категория расходилась с остальными.
BTC лидировал с $160.04M, за ним следом шли ETH — $121.02M; при этом SOL и XRP пришли с меньшими показателями и почти сравнялись между собой: $11.01M и $11.26M соответственно. Разрыв между BTC и ETH по сравнению с SOL и XRP примерно в 10 раз — это соответствует тому, как эти рынки обычно соотносятся по масштабам друг с другом. Но именно то, что все четыре категории в один и тот же день показали «зелёный» результат, является здесь по-настоящему заметной деталью, а не любая отдельно взятая цифра.
Стоит прямо уточнить контекст по времени. Это происходит прямо перед двумя реальными катализаторами: решением ФРС от 16 сентября и голосованием в Сенате по законопроекту CLARITY Act за прекращение прений. Оба события приходятся на эту неделю. Притоки в один и тот же день по каждой крупной категории ETF накануне этого отрезка могут отражать реальную уверенную позиционируемость, а могут означать и более скромный, менее направленный поток перед двумя бинарными исходами, против которых трейдерам не хочется сильно «ставить». У меня недостаточно данных, чтобы с уверенностью отличить эти два прочтения.
Моё честное мнение: равномерный «зелёный» день по BTC, ETH, SOL и XRP — это умеренно позитивный сигнал. Институциональный спрос сейчас не сосредоточен в одном активе — он широкий. Но один день, даже если он чисто позитивный, сам по себе недостаточен, чтобы назвать это сменой тренда, особенно учитывая, что впереди всё ещё два крупных катализатора, которые вполне могут развернуть картину в любую сторону.
Что я отслеживаю: сохранится ли эта широкая модель «всё зелёное» — по всем активам — через голосование Сената за прекращение прений во вторник и решение ФРС в среду, или же потоки снова фрагментируются, как только станут известны результаты этих событий.
$BTC $SOL #BTC Price Analysis# #Macro Insights#
Все четыре основные категории спотовых ETF показали притоки в один и тот же день — 14 сентября. Это не то, что происходило стабильно в течение этого месяца: в большинстве сессий как минимум одна категория расходилась с остальными.
BTC лидировал с $160.04M, за ним следом шли ETH — $121.02M; при этом SOL и XRP пришли с меньшими показателями и почти сравнялись между собой: $11.01M и $11.26M соответственно. Разрыв между BTC и ETH по сравнению с SOL и XRP примерно в 10 раз — это соответствует тому, как эти рынки обычно соотносятся по масштабам друг с другом. Но именно то, что все четыре категории в один и тот же день показали «зелёный» результат, является здесь по-настоящему заметной деталью, а не любая отдельно взятая цифра.
Стоит прямо уточнить контекст по времени. Это происходит прямо перед двумя реальными катализаторами: решением ФРС от 16 сентября и голосованием в Сенате по законопроекту CLARITY Act за прекращение прений. Оба события приходятся на эту неделю. Притоки в один и тот же день по каждой крупной категории ETF накануне этого отрезка могут отражать реальную уверенную позиционируемость, а могут означать и более скромный, менее направленный поток перед двумя бинарными исходами, против которых трейдерам не хочется сильно «ставить». У меня недостаточно данных, чтобы с уверенностью отличить эти два прочтения.
Моё честное мнение: равномерный «зелёный» день по BTC, ETH, SOL и XRP — это умеренно позитивный сигнал. Институциональный спрос сейчас не сосредоточен в одном активе — он широкий. Но один день, даже если он чисто позитивный, сам по себе недостаточен, чтобы назвать это сменой тренда, особенно учитывая, что впереди всё ещё два крупных катализатора, которые вполне могут развернуть картину в любую сторону.
Что я отслеживаю: сохранится ли эта широкая модель «всё зелёное» — по всем активам — через голосование Сената за прекращение прений во вторник и решение ФРС в среду, или же потоки снова фрагментируются, как только станут известны результаты этих событий.
$BTC $SOL #BTC Price Analysis# #Macro Insights#
BTC лидировал с $160.04M, за ним следом шли ETH — $121.02M; при этом SOL и XRP пришли с меньшими показателями и почти сравнялись между собой: $11.01M и $11.26M соответственно. Разрыв между BTC и ETH по сравнению с SOL и XRP примерно в 10 раз — это соответствует тому, как эти рынки обычно соотносятся по масштабам друг с другом. Но именно то, что все четыре категории в один и тот же день показали «зелёный» результат, является здесь по-настоящему заметной деталью, а не любая отдельно взятая цифра.
Стоит прямо уточнить контекст по времени. Это происходит прямо перед двумя реальными катализаторами: решением ФРС от 16 сентября и голосованием в Сенате по законопроекту CLARITY Act за прекращение прений. Оба события приходятся на эту неделю. Притоки в один и тот же день по каждой крупной категории ETF накануне этого отрезка могут отражать реальную уверенную позиционируемость, а могут означать и более скромный, менее направленный поток перед двумя бинарными исходами, против которых трейдерам не хочется сильно «ставить». У меня недостаточно данных, чтобы с уверенностью отличить эти два прочтения.
Моё честное мнение: равномерный «зелёный» день по BTC, ETH, SOL и XRP — это умеренно позитивный сигнал. Институциональный спрос сейчас не сосредоточен в одном активе — он широкий. Но один день, даже если он чисто позитивный, сам по себе недостаточен, чтобы назвать это сменой тренда, особенно учитывая, что впереди всё ещё два крупных катализатора, которые вполне могут развернуть картину в любую сторону.
Что я отслеживаю: сохранится ли эта широкая модель «всё зелёное» — по всем активам — через голосование Сената за прекращение прений во вторник и решение ФРС в среду, или же потоки снова фрагментируются, как только станут известны результаты этих событий.
$BTC $SOL #BTC Price Analysis# #Macro Insights#


51
·
--
CoinEx — это четвертая биржа, объявившая о прекращении работы в этом году, а не первая. Этот шаблон важнее, чем любая отдельная приостановка сама по себе.
Основатель Хайпо Ян подтвердил завершение деятельности 15 сентября, спустя почти девять лет работы. Он сослался на затяжной спад на рынке, сокращение общего объема торгов и ликвидности по всей отрасли, а также на издержки комплаенса, которые, по его словам, превысили разумные пределы. Новые регистрации были остановлены сразу, фьючерсы перевели в режим только сокращения позиций в тот же день; спотовые торги завершатся 29 сентября, а вывод средств будет оставаться доступным до 22 декабря 2026 года в 02:00 UTC.
CoinEx утверждает, что ее коэффициент резервирования находится выше 100%, и все активы пользователей полностью обеспечены. Держатели CET получат выкуп по 0.005 USDT — выше текущей цены токена около $0.00466. Все, что не будет выведено после дедлайна, перейдет в хранение третьей стороне, при этом будет начисляться ежемесячная комиссия 5%. Заявления принимаются до августа 2028 года.
Важным является и то, как это описал сам Ян: он сказал, что возить на себе неограниченный риск ради ограниченной выручки перестало быть рациональным выбором, и отверг идею продать биржу, потому что пользователи доверяли платформе — и часто ему лично — со своими средствами. Он выбрал упорядоченное завершение.
Это не единичный случай. Bitget, BitMart и BitMEX также объявили о собственных закрытиях в 2026 году: BitMEX закрывается 23 сентября, BitMart прекращает работу постепенно — вплоть до января 2027. CoinEx занимает 33-е место по объему торгов: это биржа «средней категории», и она вписывается в этот шаблон. Однако давление приходится именно на этот сегмент, а не только на самые маленькие платформы.
Мой честный вывод: упорядоченное, полностью профинансированное завершение с коэффициентом резервирования 100% плюс и окном на вывод средств в три месяца — это, по сути, один из самых «чистых» вариантов выхода; это действительно отличается от коллапса или события неплатежеспособности. Но это не делает общий тренд менее заметным.
На что я смотрю: пойдут ли еще больше бирж среднего уровня по той же схеме до конца года, и действительно ли CET поднимется к цене выкупа по мере приближения дедлайна.
$XRP #BTC Price Analysis# $ETH
CoinEx — это четвертая биржа, объявившая о прекращении работы в этом году, а не первая. Этот шаблон важнее, чем любая отдельная приостановка сама по себе.
Основатель Хайпо Ян подтвердил завершение деятельности 15 сентября, спустя почти девять лет работы. Он сослался на затяжной спад на рынке, сокращение общего объема торгов и ликвидности по всей отрасли, а также на издержки комплаенса, которые, по его словам, превысили разумные пределы. Новые регистрации были остановлены сразу, фьючерсы перевели в режим только сокращения позиций в тот же день; спотовые торги завершатся 29 сентября, а вывод средств будет оставаться доступным до 22 декабря 2026 года в 02:00 UTC.
CoinEx утверждает, что ее коэффициент резервирования находится выше 100%, и все активы пользователей полностью обеспечены. Держатели CET получат выкуп по 0.005 USDT — выше текущей цены токена около $0.00466. Все, что не будет выведено после дедлайна, перейдет в хранение третьей стороне, при этом будет начисляться ежемесячная комиссия 5%. Заявления принимаются до августа 2028 года.
Важным является и то, как это описал сам Ян: он сказал, что возить на себе неограниченный риск ради ограниченной выручки перестало быть рациональным выбором, и отверг идею продать биржу, потому что пользователи доверяли платформе — и часто ему лично — со своими средствами. Он выбрал упорядоченное завершение.
Это не единичный случай. Bitget, BitMart и BitMEX также объявили о собственных закрытиях в 2026 году: BitMEX закрывается 23 сентября, BitMart прекращает работу постепенно — вплоть до января 2027. CoinEx занимает 33-е место по объему торгов: это биржа «средней категории», и она вписывается в этот шаблон. Однако давление приходится именно на этот сегмент, а не только на самые маленькие платформы.
Мой честный вывод: упорядоченное, полностью профинансированное завершение с коэффициентом резервирования 100% плюс и окном на вывод средств в три месяца — это, по сути, один из самых «чистых» вариантов выхода; это действительно отличается от коллапса или события неплатежеспособности. Но это не делает общий тренд менее заметным.
На что я смотрю: пойдут ли еще больше бирж среднего уровня по той же схеме до конца года, и действительно ли CET поднимется к цене выкупа по мере приближения дедлайна.
$XRP #BTC Price Analysis# $ETH
Основатель Хайпо Ян подтвердил завершение деятельности 15 сентября, спустя почти девять лет работы. Он сослался на затяжной спад на рынке, сокращение общего объема торгов и ликвидности по всей отрасли, а также на издержки комплаенса, которые, по его словам, превысили разумные пределы. Новые регистрации были остановлены сразу, фьючерсы перевели в режим только сокращения позиций в тот же день; спотовые торги завершатся 29 сентября, а вывод средств будет оставаться доступным до 22 декабря 2026 года в 02:00 UTC.
CoinEx утверждает, что ее коэффициент резервирования находится выше 100%, и все активы пользователей полностью обеспечены. Держатели CET получат выкуп по 0.005 USDT — выше текущей цены токена около $0.00466. Все, что не будет выведено после дедлайна, перейдет в хранение третьей стороне, при этом будет начисляться ежемесячная комиссия 5%. Заявления принимаются до августа 2028 года.
Важным является и то, как это описал сам Ян: он сказал, что возить на себе неограниченный риск ради ограниченной выручки перестало быть рациональным выбором, и отверг идею продать биржу, потому что пользователи доверяли платформе — и часто ему лично — со своими средствами. Он выбрал упорядоченное завершение.
Это не единичный случай. Bitget, BitMart и BitMEX также объявили о собственных закрытиях в 2026 году: BitMEX закрывается 23 сентября, BitMart прекращает работу постепенно — вплоть до января 2027. CoinEx занимает 33-е место по объему торгов: это биржа «средней категории», и она вписывается в этот шаблон. Однако давление приходится именно на этот сегмент, а не только на самые маленькие платформы.
Мой честный вывод: упорядоченное, полностью профинансированное завершение с коэффициентом резервирования 100% плюс и окном на вывод средств в три месяца — это, по сути, один из самых «чистых» вариантов выхода; это действительно отличается от коллапса или события неплатежеспособности. Но это не делает общий тренд менее заметным.
На что я смотрю: пойдут ли еще больше бирж среднего уровня по той же схеме до конца года, и действительно ли CET поднимется к цене выкупа по мере приближения дедлайна.
$XRP #BTC Price Analysis# $ETH
58
·
--
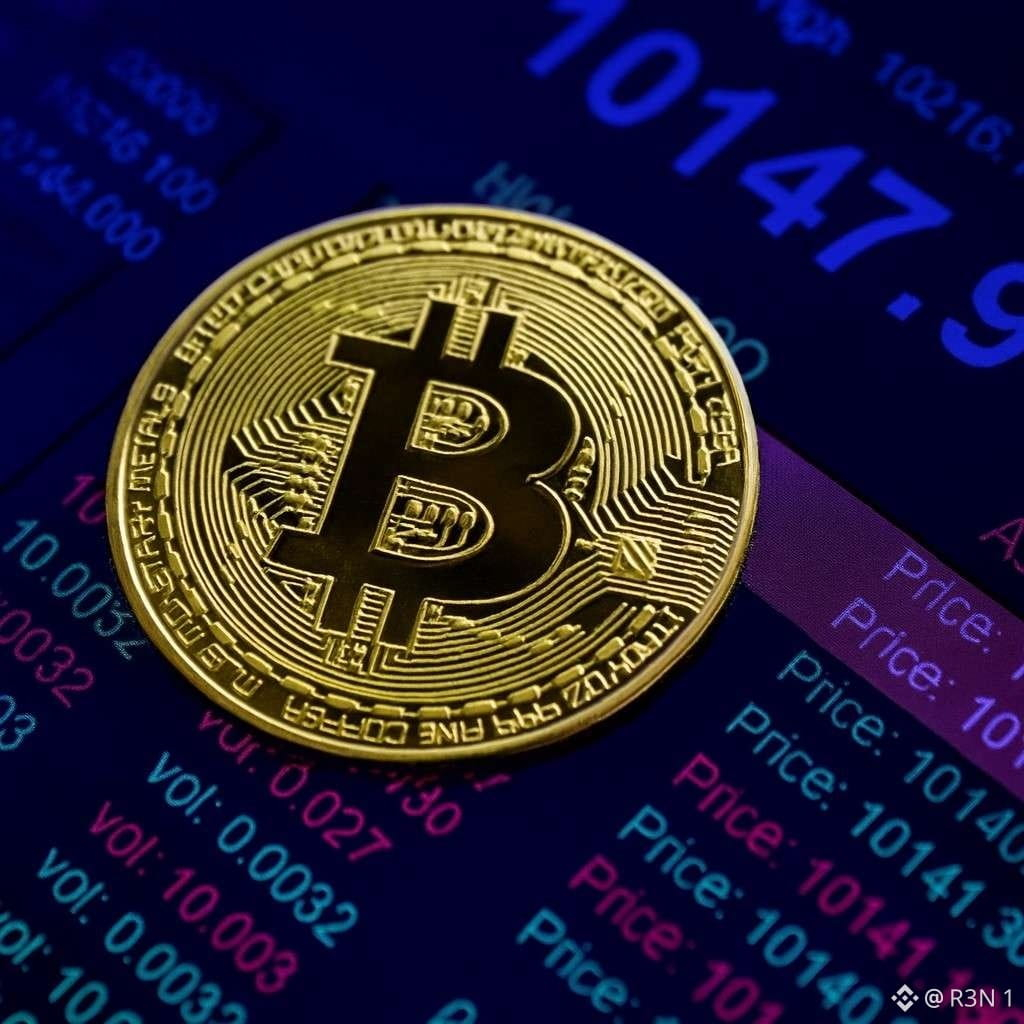
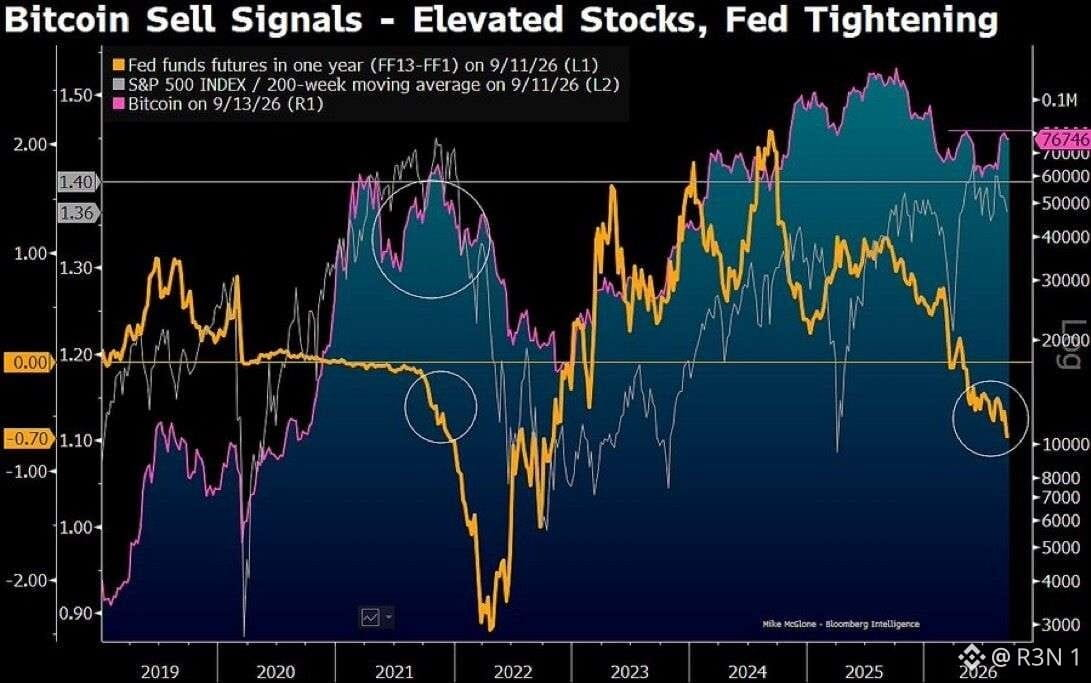
Bloomberg Intelligence Майк Макглон 13 сентября изложил сценарий: коррекция примерно на 20% в S&P 500, которая будет сохраняться, а не превратится в кратковременный спад, может подтолкнуть биткоин к $10 000 — исходя из того, что он называет сильной корреляцией между ними. Его доводы опираются на три пункта: недавний отскок биткоина остановился на $76 746, не дойдя до $80 000; фьючерсы на ставку по федеральным фондам на год вперед оценивают еще примерно 70 базисных пунктов дополнительных повышений; и S&P находится намного выше своей 200-недельной скользящей средней — исторически благодатная почва для фиксации прибыли институционалами.
Также он отмечает, что биткоин повторил пятилетнюю доходность S&P с примерно втрое большей волатильностью — в его формулировке это был плохой риск-корректированный трейд.
Стоит прямо обозначить контекст. Макглон фактически сделал этот же прогноз на $10 000 в декабре 2025 года для календарного 2026-го, и сейчас повторяет его в сентябре, добавив свежую техническую рамку. Это не значит, что логика неверна: корреляция и чувствительность к ставкам действительно существуют, но прогноз, идущий уже почти год и не получивший подтверждения, заслуживает того, чтобы к нему была приложена эта история.
С другой стороны, собственная методология CryptoQuant более ближайший тест ставит на еженедельное закрытие выше $81 700 — на уровень средней цены за год — чтобы подтвердить начало новой бычьей фазы. Сопротивление находится на $83 600 и $88 700 выше этого. Поддержка сначала — на $70 000, затем в диапазоне спроса $62 000–$65 000, сформированном на базе примерно 476 000 BTC накопленных ранее покупок — это заметно иной сценарий понижения, чем $10 000.
Мой честный взгляд: аргумент про корреляцию правомерен, но цель $10 000 требует конкретного, устойчивого обвала на фондовом рынке, который еще не произошел, на фоне того что сделанный ранее прогноз уже идет долго, не получив подтверждения.
За чем я слежу: будет ли уровень еженедельного закрытия $81 700 сначала отвоеван или отвергнут, поскольку это проясняет ситуацию задолго до того, как кому-то нужно будет беспокоиться о $10 000.
$BTC #Altcoin Season# #Altcoin Season#
Bloomberg Intelligence Майк Макглон 13 сентября изложил сценарий: коррекция примерно на 20% в S&P 500, которая будет сохраняться, а не превратится в кратковременный спад, может подтолкнуть биткоин к $10 000 — исходя из того, что он называет сильной корреляцией между ними. Его доводы опираются на три пункта: недавний отскок биткоина остановился на $76 746, не дойдя до $80 000; фьючерсы на ставку по федеральным фондам на год вперед оценивают еще примерно 70 базисных пунктов дополнительных повышений; и S&P находится намного выше своей 200-недельной скользящей средней — исторически благодатная почва для фиксации прибыли институционалами.
Также он отмечает, что биткоин повторил пятилетнюю доходность S&P с примерно втрое большей волатильностью — в его формулировке это был плохой риск-корректированный трейд.
Стоит прямо обозначить контекст. Макглон фактически сделал этот же прогноз на $10 000 в декабре 2025 года для календарного 2026-го, и сейчас повторяет его в сентябре, добавив свежую техническую рамку. Это не значит, что логика неверна: корреляция и чувствительность к ставкам действительно существуют, но прогноз, идущий уже почти год и не получивший подтверждения, заслуживает того, чтобы к нему была приложена эта история.
С другой стороны, собственная методология CryptoQuant более ближайший тест ставит на еженедельное закрытие выше $81 700 — на уровень средней цены за год — чтобы подтвердить начало новой бычьей фазы. Сопротивление находится на $83 600 и $88 700 выше этого. Поддержка сначала — на $70 000, затем в диапазоне спроса $62 000–$65 000, сформированном на базе примерно 476 000 BTC накопленных ранее покупок — это заметно иной сценарий понижения, чем $10 000.
Мой честный взгляд: аргумент про корреляцию правомерен, но цель $10 000 требует конкретного, устойчивого обвала на фондовом рынке, который еще не произошел, на фоне того что сделанный ранее прогноз уже идет долго, не получив подтверждения.
За чем я слежу: будет ли уровень еженедельного закрытия $81 700 сначала отвоеван или отвергнут, поскольку это проясняет ситуацию задолго до того, как кому-то нужно будет беспокоиться о $10 000.
$BTC #Altcoin Season# #Altcoin Season#
Также он отмечает, что биткоин повторил пятилетнюю доходность S&P с примерно втрое большей волатильностью — в его формулировке это был плохой риск-корректированный трейд.
Стоит прямо обозначить контекст. Макглон фактически сделал этот же прогноз на $10 000 в декабре 2025 года для календарного 2026-го, и сейчас повторяет его в сентябре, добавив свежую техническую рамку. Это не значит, что логика неверна: корреляция и чувствительность к ставкам действительно существуют, но прогноз, идущий уже почти год и не получивший подтверждения, заслуживает того, чтобы к нему была приложена эта история.
С другой стороны, собственная методология CryptoQuant более ближайший тест ставит на еженедельное закрытие выше $81 700 — на уровень средней цены за год — чтобы подтвердить начало новой бычьей фазы. Сопротивление находится на $83 600 и $88 700 выше этого. Поддержка сначала — на $70 000, затем в диапазоне спроса $62 000–$65 000, сформированном на базе примерно 476 000 BTC накопленных ранее покупок — это заметно иной сценарий понижения, чем $10 000.
Мой честный взгляд: аргумент про корреляцию правомерен, но цель $10 000 требует конкретного, устойчивого обвала на фондовом рынке, который еще не произошел, на фоне того что сделанный ранее прогноз уже идет долго, не получив подтверждения.
За чем я слежу: будет ли уровень еженедельного закрытия $81 700 сначала отвоеван или отвергнут, поскольку это проясняет ситуацию задолго до того, как кому-то нужно будет беспокоиться о $10 000.
$BTC #Altcoin Season# #Altcoin Season#
·
--
Раньше я проверял свои DeFi-позиции каждый день. Иногда по несколько раз в день. Я убеждал себя, что это активное управление. На самом деле это была привычка, которая систематически ухудшала мои решения. Проблема ежедневных проверок в том, что дневные данные в основном шум. Объём пула за 24 часа во вторник почти ничего не говорит о том, насколько надёжно его экономика устроена. Цена наградного токена в любой конкретный день почти ничего не говорит о том, будут ли реальные доходы, если накапливать его в течение 60-дневного периода фарминга. Снимок TVL показывает, какой капитал присутствует прямо сейчас, но без контекста: он пришёл недавно в рамках кампании или находится там уже через несколько рыночных циклов. Ежедневные проверки создают конкретный режим сбоя. Вы видите неблагоприятную точку: объём упал, цена наградного токена ниже, TVL сжат — и принимаете решение, опираясь на одну эту точку, а не на тренд, частью которого она является. Или вы видите благоприятную точку и она подталкивает оставаться в позиции дольше того момента, когда данные тренда уже потребовали бы выхода. Изменение, которое я сделал, — это задание явных частот проверки для разных типов решений. Данные по APR пула и объёму я проверяю раз в неделю, а не ежедневно: недельные данные показывают тренды, которые дневные данные скрывают. Тренд цены наградного токена я проверяю раз в месяц, а не каждый раз, когда случайно открываю вкладку с графиками. Соотношение непостоянных потерь и дохода от комиссий я рассчитываю раз в месяц, а не реагирую на него импульсивно, когда начинаю переживать из‑за позиции. Изменение частоты сократило количество решений и одновременно улучшило их качество. Меньше решений, потому что я не реагирую на дневной шум. Лучше решения, потому что я действую на основе данных о тренде, а не на основе отдельных снимков. Формат еженедельного дайджеста фарминга у @ston_fi существует по той же причине: еженедельный снимок по сравнению с данными прошлой недели более полезен, чем дневной снимок, прочитанный изолированно. Подробнее о defi и crypto https://blog.ston.fi/ #BTC Price Analysis# $PI $TRUMP
Раньше я проверял свои DeFi-позиции каждый день. Иногда по несколько раз в день. Я убеждал себя, что это активное управление. На самом деле это была привычка, которая систематически ухудшала мои решения. Проблема ежедневных проверок в том, что дневные данные в основном шум. Объём пула за 24 часа во вторник почти ничего не говорит о том, насколько надёжно его экономика устроена. Цена наградного токена в любой конкретный день почти ничего не говорит о том, будут ли реальные доходы, если накапливать его в течение 60-дневного периода фарминга. Снимок TVL показывает, какой капитал присутствует прямо сейчас, но без контекста: он пришёл недавно в рамках кампании или находится там уже через несколько рыночных циклов. Ежедневные проверки создают конкретный режим сбоя. Вы видите неблагоприятную точку: объём упал, цена наградного токена ниже, TVL сжат — и принимаете решение, опираясь на одну эту точку, а не на тренд, частью которого она является. Или вы видите благоприятную точку и она подталкивает оставаться в позиции дольше того момента, когда данные тренда уже потребовали бы выхода. Изменение, которое я сделал, — это задание явных частот проверки для разных типов решений. Данные по APR пула и объёму я проверяю раз в неделю, а не ежедневно: недельные данные показывают тренды, которые дневные данные скрывают. Тренд цены наградного токена я проверяю раз в месяц, а не каждый раз, когда случайно открываю вкладку с графиками. Соотношение непостоянных потерь и дохода от комиссий я рассчитываю раз в месяц, а не реагирую на него импульсивно, когда начинаю переживать из‑за позиции. Изменение частоты сократило количество решений и одновременно улучшило их качество. Меньше решений, потому что я не реагирую на дневной шум. Лучше решения, потому что я действую на основе данных о тренде, а не на основе отдельных снимков. Формат еженедельного дайджеста фарминга у @ston_fi существует по той же причине: еженедельный снимок по сравнению с данными прошлой недели более полезен, чем дневной снимок, прочитанный изолированно. Подробнее о defi и crypto https://blog.ston.fi/ #BTC Price Analysis# $PI $TRUMP

4
·
--
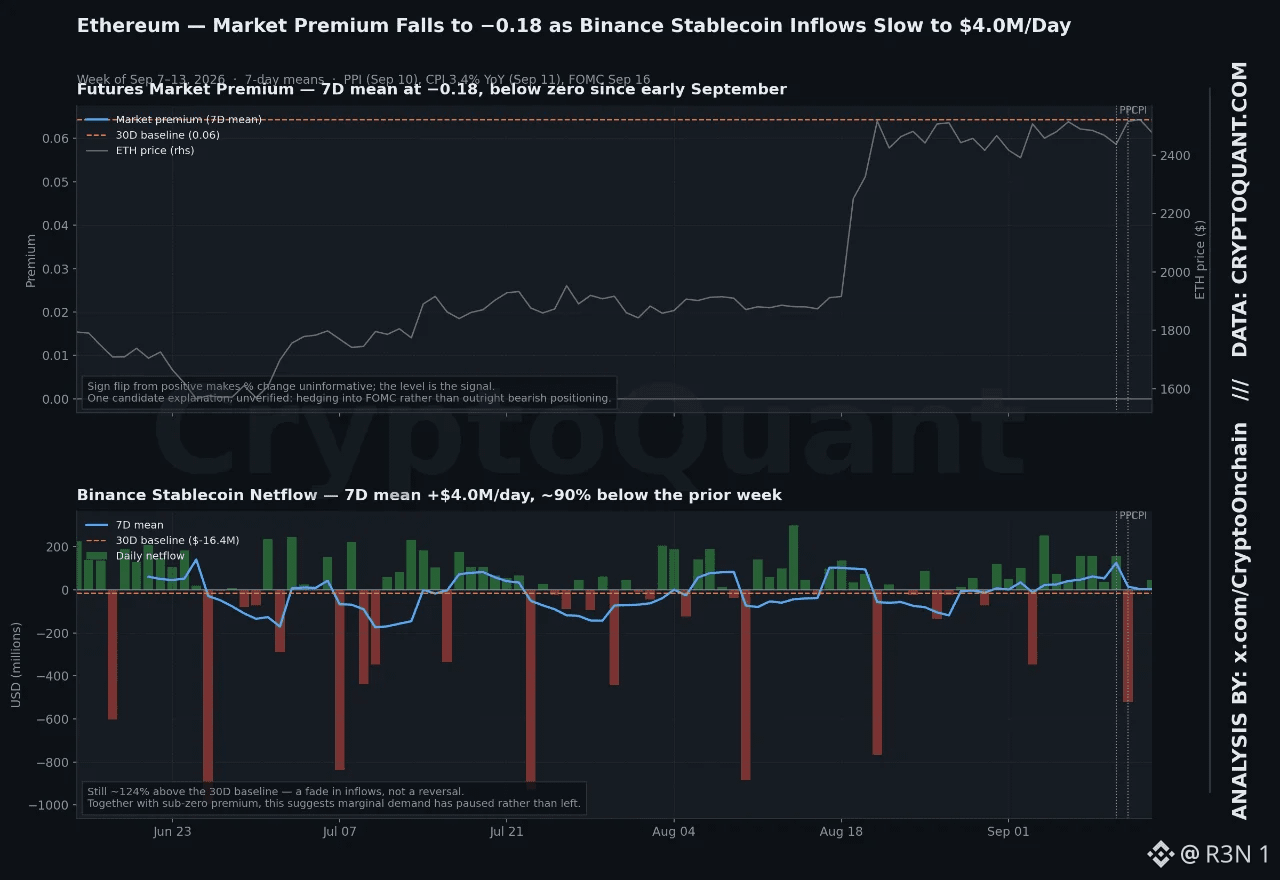
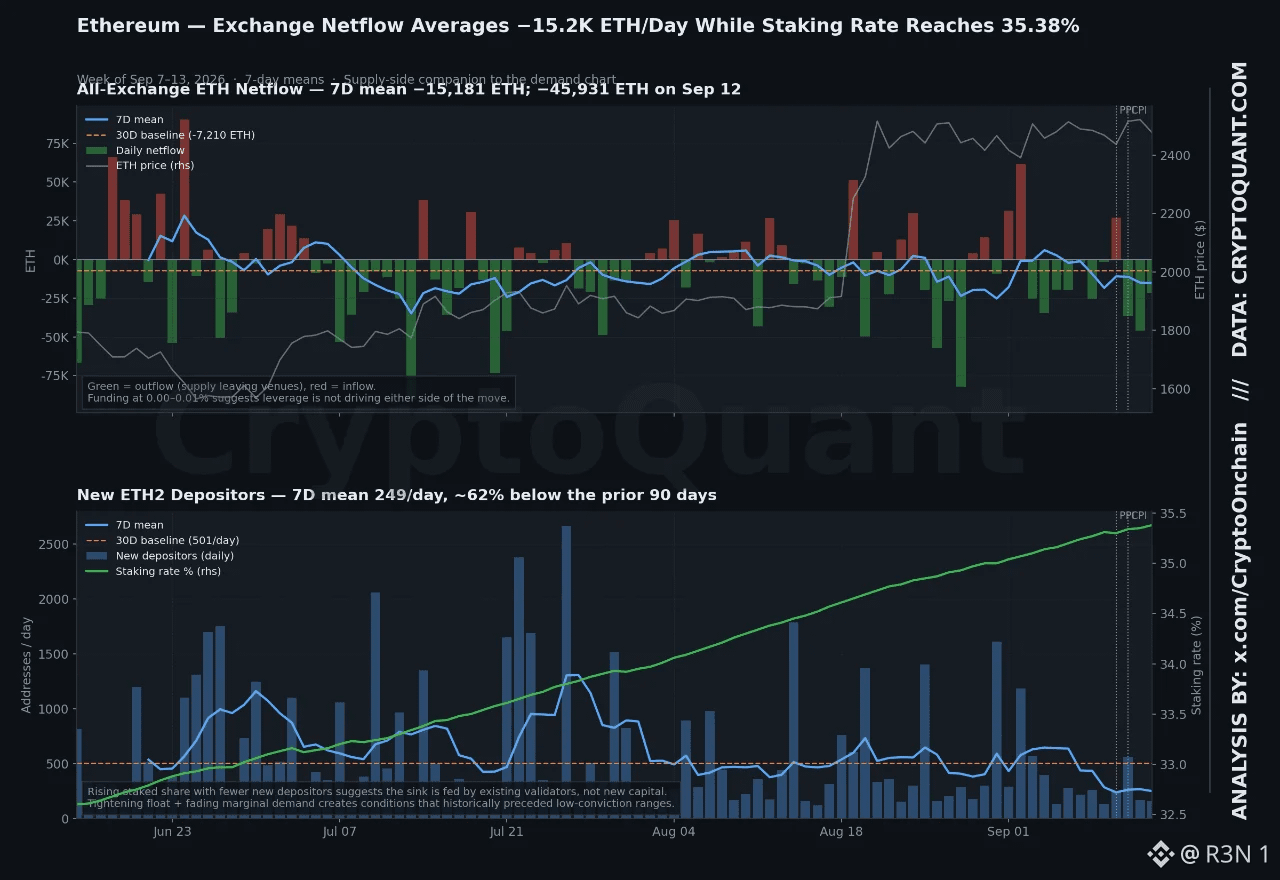
Фьючерсная премия Ethereum только что ушла в минус: -0,18 за семь дней до 13 сентября, при этом «стейблкоин-стейджинг» на Binance, призванный поглощать предложение, в значительной степени перестал появляться. Два этих события одновременно — и есть реальный сигнал, а не каждое по отдельности. Стоит быть здесь предельно точным. Премия перешла из положительной в отрицательную, поэтому процентное изменение здесь не имеет смысла; важен только уровень. Приток стейблкоинов на Binance в среднем составил 4,0 млн долларов в день: примерно на 90% меньше, чем на прошлой неделе, но при этом всё ещё на 124% выше базовой линии за 30 дней — это снижение с повышенного уровня, а не разворот. Из серии медианных переводов и комиссий исключаются данные: при почти нулевых знаменателях проценты вводят в заблуждение. Макроконтекст играет здесь роль на фоне. PPI вышел на уровне 5,4% г/г 10 сентября, CPI — 3,4%, базовый — 2,4% 11 сентября. Доходность 10-летних держалась около 4,95% вплоть до 16 сентября, до решения FOMC. ETH закрылся на уровне 2 477 долларов — всё ещё внутри диапазона 2 391–2 522 доллара, который держится с 31 августа. Одна неподтверждённая возможность, которую стоит назвать как спекуляцию: отрицательная премия может отражать хеджирование в преддверии решения ФРС, а не медвежью позицию; фандинг 0,00–0,01% подразумевает, что ни одна сторона не толкает ситуацию за счёт плеча. Более интересное разделение — спрос против предложения. Каналы спроса остывают одновременно: стейблкоин-стейджинг застопорился, фьючерсы торгуются ниже спота, премия на Coinbase составляет -0,05. Предложение продолжает ужесточаться: биржевой нетфлоу в среднем был -15 181 ETH в день, ставка стейкинга достигла 35,38%. Падение числа новых вкладчиков говорит о том, что рост стейкинга идёт за счёт уже существующих валидаторов, а не за счёт нового капитала. Мой честный вывод: ужесточение «плавающего» объёма на фоне затухающего предельного спроса — это настройка, которая исторически предшествовала низкоконвикционным диапазонам, тем, что разрешаются внешним катализатором, а не только через базовые потоки. За чем я слежу: возобновится ли стейблкоин-стейджинг по другую сторону от решения ФРС в среду, или же эта пауза сохранится независимо от исхода. $ETH #BTC Price Analysis# #ETH
Фьючерсная премия Ethereum только что ушла в минус: -0,18 за семь дней до 13 сентября, при этом «стейблкоин-стейджинг» на Binance, призванный поглощать предложение, в значительной степени перестал появляться. Два этих события одновременно — и есть реальный сигнал, а не каждое по отдельности. Стоит быть здесь предельно точным. Премия перешла из положительной в отрицательную, поэтому процентное изменение здесь не имеет смысла; важен только уровень. Приток стейблкоинов на Binance в среднем составил 4,0 млн долларов в день: примерно на 90% меньше, чем на прошлой неделе, но при этом всё ещё на 124% выше базовой линии за 30 дней — это снижение с повышенного уровня, а не разворот. Из серии медианных переводов и комиссий исключаются данные: при почти нулевых знаменателях проценты вводят в заблуждение. Макроконтекст играет здесь роль на фоне. PPI вышел на уровне 5,4% г/г 10 сентября, CPI — 3,4%, базовый — 2,4% 11 сентября. Доходность 10-летних держалась около 4,95% вплоть до 16 сентября, до решения FOMC. ETH закрылся на уровне 2 477 долларов — всё ещё внутри диапазона 2 391–2 522 доллара, который держится с 31 августа. Одна неподтверждённая возможность, которую стоит назвать как спекуляцию: отрицательная премия может отражать хеджирование в преддверии решения ФРС, а не медвежью позицию; фандинг 0,00–0,01% подразумевает, что ни одна сторона не толкает ситуацию за счёт плеча. Более интересное разделение — спрос против предложения. Каналы спроса остывают одновременно: стейблкоин-стейджинг застопорился, фьючерсы торгуются ниже спота, премия на Coinbase составляет -0,05. Предложение продолжает ужесточаться: биржевой нетфлоу в среднем был -15 181 ETH в день, ставка стейкинга достигла 35,38%. Падение числа новых вкладчиков говорит о том, что рост стейкинга идёт за счёт уже существующих валидаторов, а не за счёт нового капитала. Мой честный вывод: ужесточение «плавающего» объёма на фоне затухающего предельного спроса — это настройка, которая исторически предшествовала низкоконвикционным диапазонам, тем, что разрешаются внешним катализатором, а не только через базовые потоки. За чем я слежу: возобновится ли стейблкоин-стейджинг по другую сторону от решения ФРС в среду, или же эта пауза сохранится независимо от исхода. $ETH #BTC Price Analysis# #ETH
·
--
Со стороны закона CLARITY шансы меняются стремительно. По данным CoinDesk, опубликованным сегодня, Polymarket оценивает вероятность того, что законопроект станет законом в этом году, почти в 30% — это резко выше 12%, которые были ранее в начале сентября. В то же время отдельный контракт Kalshi, который будет разрешён в октябре 2027 года, подскочил в пике до 64% за ночь, а затем закрепился примерно на уровне 53%. Стоит сказать прямо: разные платформы и сроки разрешения дают разные цифры; к любой одной приведённой цифре, взятой в отрыве, нужно относиться с осторожностью, учитывая, насколько сильно эти оценки качались в течение нескольких дней. Показательное голосование по cloture во вторник требует 60 голосов; у республиканцев — 53. Это действительно спорный вопрос, а не формальность. Со стороны ФРС решение FOMC от 16 сентября на этой стадии цикла необычно неоднозначное. Данные CME FedWatch варьировались примерно от 28% до более чем 80% вероятности повышения ставки — в зависимости от дня и источника. J.P. Morgan ожидает повышение на 25 базисных пунктов, а Goldman Sachs считает это крайне маловероятным. Это реальное институциональное расхождение, а не шум — оно обусловлено тем, что эскалация, связанная с конфликтом вокруг Ирана, подталкивает инфляционные ожидания вверх, а более слабые данные по занятости тянут в другую сторону. Мой честный взгляд: эти два события действительно конкурируют за внимание BTC на этой неделе, и я не думаю, что заранее очевидно, какое из них возьмёт верх. Законодательная ясность — более медленно «сжигающий» структурный позитив, тогда как повышение ставки ФРС — это немедленный удар по риск-активам, чувствительным к ставкам. Если оба фактора реализуются в одном направлении — конструктивно для CLARITY и как удержание, а не повышение, — это будет существенно другая конфигурация, чем если бы они сложились против друг друга. Что я отслеживаю: фактическое число голосов по cloture во вторник вместе с решением FOMC в среду, потому что последовательность и общий исход обоих событий вместе, вероятно, будут важнее, чем каждое из них по отдельности. $BTC #BTC Price Analysis# #Altcoin Season# #CLARITYAct
Со стороны закона CLARITY шансы меняются стремительно. По данным CoinDesk, опубликованным сегодня, Polymarket оценивает вероятность того, что законопроект станет законом в этом году, почти в 30% — это резко выше 12%, которые были ранее в начале сентября. В то же время отдельный контракт Kalshi, который будет разрешён в октябре 2027 года, подскочил в пике до 64% за ночь, а затем закрепился примерно на уровне 53%. Стоит сказать прямо: разные платформы и сроки разрешения дают разные цифры; к любой одной приведённой цифре, взятой в отрыве, нужно относиться с осторожностью, учитывая, насколько сильно эти оценки качались в течение нескольких дней. Показательное голосование по cloture во вторник требует 60 голосов; у республиканцев — 53. Это действительно спорный вопрос, а не формальность. Со стороны ФРС решение FOMC от 16 сентября на этой стадии цикла необычно неоднозначное. Данные CME FedWatch варьировались примерно от 28% до более чем 80% вероятности повышения ставки — в зависимости от дня и источника. J.P. Morgan ожидает повышение на 25 базисных пунктов, а Goldman Sachs считает это крайне маловероятным. Это реальное институциональное расхождение, а не шум — оно обусловлено тем, что эскалация, связанная с конфликтом вокруг Ирана, подталкивает инфляционные ожидания вверх, а более слабые данные по занятости тянут в другую сторону. Мой честный взгляд: эти два события действительно конкурируют за внимание BTC на этой неделе, и я не думаю, что заранее очевидно, какое из них возьмёт верх. Законодательная ясность — более медленно «сжигающий» структурный позитив, тогда как повышение ставки ФРС — это немедленный удар по риск-активам, чувствительным к ставкам. Если оба фактора реализуются в одном направлении — конструктивно для CLARITY и как удержание, а не повышение, — это будет существенно другая конфигурация, чем если бы они сложились против друг друга. Что я отслеживаю: фактическое число голосов по cloture во вторник вместе с решением FOMC в среду, потому что последовательность и общий исход обоих событий вместе, вероятно, будут важнее, чем каждое из них по отдельности. $BTC #BTC Price Analysis# #Altcoin Season# #CLARITYAct
·
--
HYPE спотовые ETF сбросили $26,4 млн за прошлую неделю, и разделение между двумя фондами говорит больше, чем общая цифра.
По данным SoSoValue, основной вклад внес Bitwise: BHYP забрал на себя львиную долю — $20,1 млн, тогда как у 21Shares THYP потери составили $6,3 млн. Это не равномерная распродажа, а сосредоточение почти целиком в одном продукте. Обычно это указывает на то, что конкретный держатель или аллокатор выходит из позиции, а не на то, что общий настрой инвесторов во все HYPE-ETF разом ухудшился.
И это не единичная неделя. За 12 торговых сессий, завершившихся 3 августа, эти два фонда вместе сбросили $29,8 млн. Давление от оттока нарастало волнами — то усиливалось, то ослабевало, и не выглядит так, будто оно появилось из ниоткуда.
Что особенно бросается в глаза — расхождение между тем, что показывают потоки по ETF, и тем, что происходит on-chain в тот же период. Сообщается, что whale-адреса продолжали добавлять и стейкать HYPE напрямую в рамках этого же окна: один из покупок составил $26 млн за один заход. Это реальное расхождение: инвесторы ETF выводят деньги через регулируемый продукт, в то время как крупные держатели накапливают сам токен, и эти два поведения не сходятся по направлению.
Стоит добавить контекст по масштабу: кумулятивный чистый приток для этих фондов по-прежнему превышает $280 млн с момента запуска в мае. То есть отток на этой неделе, даже если сложить его с предыдущим отрезком, — это скорее «вмятина» в общей картине, а не обвал.
Главный открытый вопрос — является ли это следствием того, что один крупный держатель сокращает именно экспозицию через ETF, возможно, по причинам налогов, хранения или комиссий, не связанным с убежденностью в HYPE, либо это ранний сигнал, что база ETF-инвесторов действительно менее воодушевлена, чем активность on-chain whale-ов. По данным потоков эти две гипотезы выглядят одинаково. Но это не одна и та же история.
$HYPE #BTC Price Analysis# #Altcoin Season#
HYPE спотовые ETF сбросили $26,4 млн за прошлую неделю, и разделение между двумя фондами говорит больше, чем общая цифра.
По данным SoSoValue, основной вклад внес Bitwise: BHYP забрал на себя львиную долю — $20,1 млн, тогда как у 21Shares THYP потери составили $6,3 млн. Это не равномерная распродажа, а сосредоточение почти целиком в одном продукте. Обычно это указывает на то, что конкретный держатель или аллокатор выходит из позиции, а не на то, что общий настрой инвесторов во все HYPE-ETF разом ухудшился.
И это не единичная неделя. За 12 торговых сессий, завершившихся 3 августа, эти два фонда вместе сбросили $29,8 млн. Давление от оттока нарастало волнами — то усиливалось, то ослабевало, и не выглядит так, будто оно появилось из ниоткуда.
Что особенно бросается в глаза — расхождение между тем, что показывают потоки по ETF, и тем, что происходит on-chain в тот же период. Сообщается, что whale-адреса продолжали добавлять и стейкать HYPE напрямую в рамках этого же окна: один из покупок составил $26 млн за один заход. Это реальное расхождение: инвесторы ETF выводят деньги через регулируемый продукт, в то время как крупные держатели накапливают сам токен, и эти два поведения не сходятся по направлению.
Стоит добавить контекст по масштабу: кумулятивный чистый приток для этих фондов по-прежнему превышает $280 млн с момента запуска в мае. То есть отток на этой неделе, даже если сложить его с предыдущим отрезком, — это скорее «вмятина» в общей картине, а не обвал.
Главный открытый вопрос — является ли это следствием того, что один крупный держатель сокращает именно экспозицию через ETF, возможно, по причинам налогов, хранения или комиссий, не связанным с убежденностью в HYPE, либо это ранний сигнал, что база ETF-инвесторов действительно менее воодушевлена, чем активность on-chain whale-ов. По данным потоков эти две гипотезы выглядят одинаково. Но это не одна и та же история.
$HYPE #BTC Price Analysis# #Altcoin Season#
По данным SoSoValue, основной вклад внес Bitwise: BHYP забрал на себя львиную долю — $20,1 млн, тогда как у 21Shares THYP потери составили $6,3 млн. Это не равномерная распродажа, а сосредоточение почти целиком в одном продукте. Обычно это указывает на то, что конкретный держатель или аллокатор выходит из позиции, а не на то, что общий настрой инвесторов во все HYPE-ETF разом ухудшился.
И это не единичная неделя. За 12 торговых сессий, завершившихся 3 августа, эти два фонда вместе сбросили $29,8 млн. Давление от оттока нарастало волнами — то усиливалось, то ослабевало, и не выглядит так, будто оно появилось из ниоткуда.
Что особенно бросается в глаза — расхождение между тем, что показывают потоки по ETF, и тем, что происходит on-chain в тот же период. Сообщается, что whale-адреса продолжали добавлять и стейкать HYPE напрямую в рамках этого же окна: один из покупок составил $26 млн за один заход. Это реальное расхождение: инвесторы ETF выводят деньги через регулируемый продукт, в то время как крупные держатели накапливают сам токен, и эти два поведения не сходятся по направлению.
Стоит добавить контекст по масштабу: кумулятивный чистый приток для этих фондов по-прежнему превышает $280 млн с момента запуска в мае. То есть отток на этой неделе, даже если сложить его с предыдущим отрезком, — это скорее «вмятина» в общей картине, а не обвал.
Главный открытый вопрос — является ли это следствием того, что один крупный держатель сокращает именно экспозицию через ETF, возможно, по причинам налогов, хранения или комиссий, не связанным с убежденностью в HYPE, либо это ранний сигнал, что база ETF-инвесторов действительно менее воодушевлена, чем активность on-chain whale-ов. По данным потоков эти две гипотезы выглядят одинаково. Но это не одна и та же история.
$HYPE #BTC Price Analysis# #Altcoin Season#
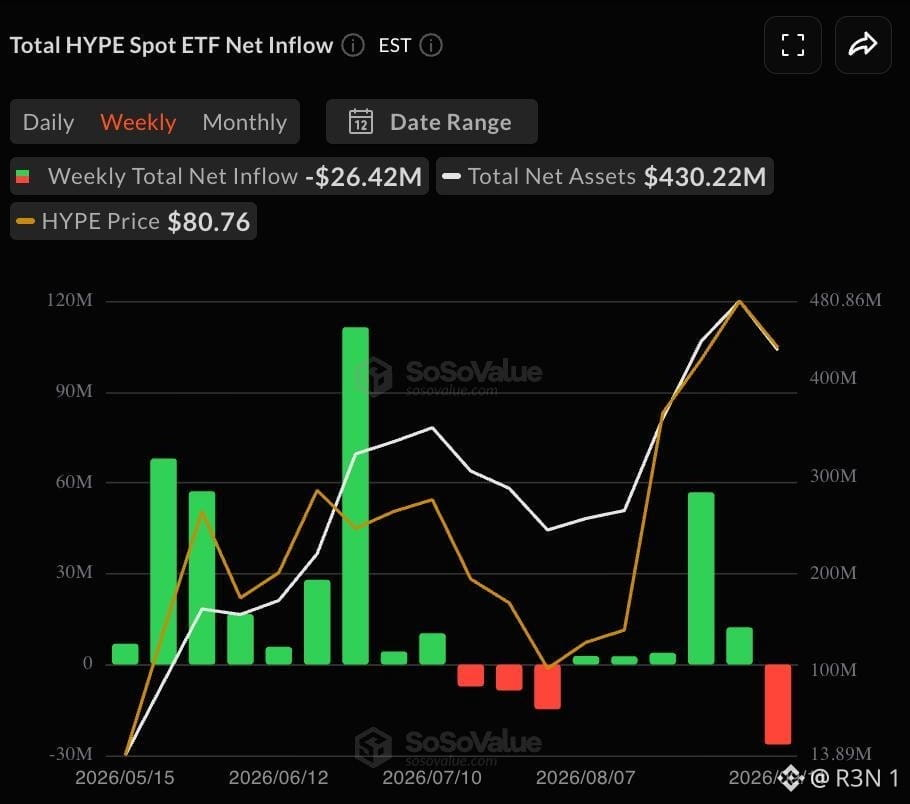
27
·
--
Бернстайн говорит, что любой позитивный сюрприз по CLARITY «точно не учтен в цене», и учитывая, где находятся ставки на прогнозных рынках, это не пустая фраза.
Сенатские республиканцы поздно вечером в воскресенье опубликовали то, что они называют окончательной редакцией, включив 126 существенных изменений, которые конкретно попросили демократы — действительно большое число для законопроекта, который уже прошел Сенатский банковский комитет 15–9 в мае. Трамп согласился с большинством предложений по этике в двухпартийном формате Tillis–Gallego, включая разрешение генеральным прокурорам штатов обеспечивать соблюдение правил по конфликту интересов для федеральных должностных лиц — прямой ответ на критику его собственных криптоактивов: в его раскрытии они оценивались более чем в $1,4 млрд дохода в 2025 году.
В «стейблкоиновой» части также появилось свое уступка. Проект добавляет «аварийный ограничитель» (circuit-breaker) от Казначейства: это дает министру финансов возможность ограничивать вознаграждения в стейблкоинах, если отток депозитов из общественных банков станет заметным. Бернстайн утверждает, что это защищает и банковское лобби; без такого механизма сторонние платформы могли бы продолжать предлагать полную доходность независимо от влияния на банковские депозиты.
Заметнее всего для меня второй аргумент Бернстайна — меньше про текст законопроекта и больше про политические стимулы. Он подчеркивает, что сенатские демократы могут не захотеть выглядеть «анти-крипто» накануне выборов в середине срока, учитывая, что криптолобби финансировало кандидатов по обе стороны. Судить об этом можно не по политике, а по позиционированию — и по-настоящему проверить это получится только после того, как будут отданы голоса.
Котировки Kalshi снова поднялись выше 30% на этой новости. Сказать по-честному: это все еще заметно ниже даже уровня «50 на 50»; рынок не называет это вероятным — он лишь считает это менее маловероятным, чем неделю назад.
Открытый вопрос в том, действительно ли 126 уступок превращают скептически настроенных демократов в сторонников «за», или же формулировки об этике изначально не были главным препятствием, а более глубокие опасения по поводу незаконного финансирования и положений о защите потребителей снова выйдут на первый план, как только спор об этике утихнет.
$ETH #Macro Insights# #BTC Price Analysis# $XRP
Бернстайн говорит, что любой позитивный сюрприз по CLARITY «точно не учтен в цене», и учитывая, где находятся ставки на прогнозных рынках, это не пустая фраза.
Сенатские республиканцы поздно вечером в воскресенье опубликовали то, что они называют окончательной редакцией, включив 126 существенных изменений, которые конкретно попросили демократы — действительно большое число для законопроекта, который уже прошел Сенатский банковский комитет 15–9 в мае. Трамп согласился с большинством предложений по этике в двухпартийном формате Tillis–Gallego, включая разрешение генеральным прокурорам штатов обеспечивать соблюдение правил по конфликту интересов для федеральных должностных лиц — прямой ответ на критику его собственных криптоактивов: в его раскрытии они оценивались более чем в $1,4 млрд дохода в 2025 году.
В «стейблкоиновой» части также появилось свое уступка. Проект добавляет «аварийный ограничитель» (circuit-breaker) от Казначейства: это дает министру финансов возможность ограничивать вознаграждения в стейблкоинах, если отток депозитов из общественных банков станет заметным. Бернстайн утверждает, что это защищает и банковское лобби; без такого механизма сторонние платформы могли бы продолжать предлагать полную доходность независимо от влияния на банковские депозиты.
Заметнее всего для меня второй аргумент Бернстайна — меньше про текст законопроекта и больше про политические стимулы. Он подчеркивает, что сенатские демократы могут не захотеть выглядеть «анти-крипто» накануне выборов в середине срока, учитывая, что криптолобби финансировало кандидатов по обе стороны. Судить об этом можно не по политике, а по позиционированию — и по-настоящему проверить это получится только после того, как будут отданы голоса.
Котировки Kalshi снова поднялись выше 30% на этой новости. Сказать по-честному: это все еще заметно ниже даже уровня «50 на 50»; рынок не называет это вероятным — он лишь считает это менее маловероятным, чем неделю назад.
Открытый вопрос в том, действительно ли 126 уступок превращают скептически настроенных демократов в сторонников «за», или же формулировки об этике изначально не были главным препятствием, а более глубокие опасения по поводу незаконного финансирования и положений о защите потребителей снова выйдут на первый план, как только спор об этике утихнет.
$ETH #Macro Insights# #BTC Price Analysis# $XRP
Сенатские республиканцы поздно вечером в воскресенье опубликовали то, что они называют окончательной редакцией, включив 126 существенных изменений, которые конкретно попросили демократы — действительно большое число для законопроекта, который уже прошел Сенатский банковский комитет 15–9 в мае. Трамп согласился с большинством предложений по этике в двухпартийном формате Tillis–Gallego, включая разрешение генеральным прокурорам штатов обеспечивать соблюдение правил по конфликту интересов для федеральных должностных лиц — прямой ответ на критику его собственных криптоактивов: в его раскрытии они оценивались более чем в $1,4 млрд дохода в 2025 году.
В «стейблкоиновой» части также появилось свое уступка. Проект добавляет «аварийный ограничитель» (circuit-breaker) от Казначейства: это дает министру финансов возможность ограничивать вознаграждения в стейблкоинах, если отток депозитов из общественных банков станет заметным. Бернстайн утверждает, что это защищает и банковское лобби; без такого механизма сторонние платформы могли бы продолжать предлагать полную доходность независимо от влияния на банковские депозиты.
Заметнее всего для меня второй аргумент Бернстайна — меньше про текст законопроекта и больше про политические стимулы. Он подчеркивает, что сенатские демократы могут не захотеть выглядеть «анти-крипто» накануне выборов в середине срока, учитывая, что криптолобби финансировало кандидатов по обе стороны. Судить об этом можно не по политике, а по позиционированию — и по-настоящему проверить это получится только после того, как будут отданы голоса.
Котировки Kalshi снова поднялись выше 30% на этой новости. Сказать по-честному: это все еще заметно ниже даже уровня «50 на 50»; рынок не называет это вероятным — он лишь считает это менее маловероятным, чем неделю назад.
Открытый вопрос в том, действительно ли 126 уступок превращают скептически настроенных демократов в сторонников «за», или же формулировки об этике изначально не были главным препятствием, а более глубокие опасения по поводу незаконного финансирования и положений о защите потребителей снова выйдут на первый план, как только спор об этике утихнет.
$ETH #Macro Insights# #BTC Price Analysis# $XRP

24
·
--
Большая часть контента, который описывает Omniston, называет его кроссчейн-протоколом свопов. Такое описание верно примерно так же, как верно описывать автомобиль как металлический ящик, который едет. Технически правильно. Почти бесполезно для понимания того, чем он отличается от всего остального в кроссчейн-среде.
Различие, которое действительно важно, — это намерение versus инструкция.
Традиционное выполнение DEX основано на инструкциях. Вы говорите протоколу ровно, что нужно сделать: поменять этот конкретный токен через этот конкретный пул при этой конкретной допустимой просадке. Протокол выполняет ваши инструкции максимально буквально, насколько это возможно, исходя из состояния сети на момент подтверждения. Если ваши инструкции были неоптимальными, если рыночные условия изменились между подачей и исполнением, если существовал лучший маршрут, который ваши инструкции не учли, то протокол выполнит то, что вы сказали, а не то, чего вы хотели.
Omniston — выполнение на основе намерений. Вы выражаете результат — я хочу получить этот актив в этой сети в таком-то количестве — и сеть конкурирующих резолверов выясняет, как его доставить. Задача пользователя заканчивается выражением намерения. Задача резолвера — найти оптимальный путь, чтобы выполнить его. Структура расчетов на HTLC гарантирует: резолвер либо доставит заявленный результат, либо обе стороны вернутся в исходную позицию.
Что это дает на практике — вполне конкретная вещь, которой не дает инструкционное выполнение. Уверенность в цитате. Сумма, показанная при подтверждении, и есть та, которая приходит, потому что резолвер обязался доставить именно этот конкретный результат, а не выполнять инструкции, которые лишь приближенно его воспроизводят. Исполнение либо доставляет то, что было процитировано, либо вообще не исполняется.
Большинство объяснений про кроссчейн концентрируются на механизме. Именно модель намерений на самом деле меняет пользовательский опыт.
👉 Исследуйте Omniston →https://app.ston.fi/swap?mode=cross-chain
#Altcoin Season# $TRUMP #Altcoin Season# $PI
Большая часть контента, который описывает Omniston, называет его кроссчейн-протоколом свопов. Такое описание верно примерно так же, как верно описывать автомобиль как металлический ящик, который едет. Технически правильно. Почти бесполезно для понимания того, чем он отличается от всего остального в кроссчейн-среде.
Различие, которое действительно важно, — это намерение versus инструкция.
Традиционное выполнение DEX основано на инструкциях. Вы говорите протоколу ровно, что нужно сделать: поменять этот конкретный токен через этот конкретный пул при этой конкретной допустимой просадке. Протокол выполняет ваши инструкции максимально буквально, насколько это возможно, исходя из состояния сети на момент подтверждения. Если ваши инструкции были неоптимальными, если рыночные условия изменились между подачей и исполнением, если существовал лучший маршрут, который ваши инструкции не учли, то протокол выполнит то, что вы сказали, а не то, чего вы хотели.
Omniston — выполнение на основе намерений. Вы выражаете результат — я хочу получить этот актив в этой сети в таком-то количестве — и сеть конкурирующих резолверов выясняет, как его доставить. Задача пользователя заканчивается выражением намерения. Задача резолвера — найти оптимальный путь, чтобы выполнить его. Структура расчетов на HTLC гарантирует: резолвер либо доставит заявленный результат, либо обе стороны вернутся в исходную позицию.
Что это дает на практике — вполне конкретная вещь, которой не дает инструкционное выполнение. Уверенность в цитате. Сумма, показанная при подтверждении, и есть та, которая приходит, потому что резолвер обязался доставить именно этот конкретный результат, а не выполнять инструкции, которые лишь приближенно его воспроизводят. Исполнение либо доставляет то, что было процитировано, либо вообще не исполняется.
Большинство объяснений про кроссчейн концентрируются на механизме. Именно модель намерений на самом деле меняет пользовательский опыт.
👉 Исследуйте Omniston →https://app.ston.fi/swap?mode=cross-chain
#Altcoin Season# $TRUMP #Altcoin Season# $PI
Различие, которое действительно важно, — это намерение versus инструкция.
Традиционное выполнение DEX основано на инструкциях. Вы говорите протоколу ровно, что нужно сделать: поменять этот конкретный токен через этот конкретный пул при этой конкретной допустимой просадке. Протокол выполняет ваши инструкции максимально буквально, насколько это возможно, исходя из состояния сети на момент подтверждения. Если ваши инструкции были неоптимальными, если рыночные условия изменились между подачей и исполнением, если существовал лучший маршрут, который ваши инструкции не учли, то протокол выполнит то, что вы сказали, а не то, чего вы хотели.
Omniston — выполнение на основе намерений. Вы выражаете результат — я хочу получить этот актив в этой сети в таком-то количестве — и сеть конкурирующих резолверов выясняет, как его доставить. Задача пользователя заканчивается выражением намерения. Задача резолвера — найти оптимальный путь, чтобы выполнить его. Структура расчетов на HTLC гарантирует: резолвер либо доставит заявленный результат, либо обе стороны вернутся в исходную позицию.
Что это дает на практике — вполне конкретная вещь, которой не дает инструкционное выполнение. Уверенность в цитате. Сумма, показанная при подтверждении, и есть та, которая приходит, потому что резолвер обязался доставить именно этот конкретный результат, а не выполнять инструкции, которые лишь приближенно его воспроизводят. Исполнение либо доставляет то, что было процитировано, либо вообще не исполняется.
Большинство объяснений про кроссчейн концентрируются на механизме. Именно модель намерений на самом деле меняет пользовательский опыт.
👉 Исследуйте Omniston →https://app.ston.fi/swap?mode=cross-chain
#Altcoin Season# $TRUMP #Altcoin Season# $PI

36
Войдите, чтобы посмотреть больше материала
Присоединяйтесь к пользователям криптовалют по всему миру на Binance Square
⚡️ Получайте новейшую и полезную информацию о криптоактивах.
💬 Нам доверяет крупнейшая в мире криптобиржа.
👍 Получите достоверные аналитические данные от верифицированных создателей контента.
Эл. почта/номер телефона
В тренде
FedRateWatch
Просмотров: 1.7M
7,223 обсуждают
Поделитесь и получите награду за трафик в нашей кампании с трендовым хэштегом
✨Тема: FOMC в сентябре — что дальше сделает ФРС?
👉Как присоединиться:
Опубликуйте короткий пост или статью с хэштегом #FedRateWatch
Создайте контент, опираясь на следующие тезисы:
- Августовский базовый CPI вырос на 0,3% м/м, а вероятность повышения ставки на 25 б.п. на этой неделе теперь близка к 90%. Как вы думаете, будет ли повышение ставки на этой неделе? Это разовое событие или начало более длительного цикла ужесточения?
- Если повышение состоится, как это скажется на BTC, технологических акциях и золоте? Быком или медведем?
- Как вы планируете торговать дальше? Поделитесь своей сделкой/позициями по BTC, акциям или золоту с помощью нашего виджета для обмена торговыми идеями.
⏰Период кампании:
- 2026-09-15 11:00 - 2026-09-17 3:00 UTC
🎁Награда:
- Квалифицированные посты, которые соответствуют приведенным выше требованиям и содержат более 100 слов, будут рассмотрены и могут получить случайный бонус к трафику в размере от 500 до 3,000 просмотров. Вы получите уведомление от вашего секретаря ленты, если ваш пост будет выбран.
- Получите шанс, чтобы вашу статью разместили на Binance Square Official
Нужны идеи для вашего поста? Посетите страницу темы #FedRateWatch или Square Guide on How to Post for Better Reach.
Binance Square Official
·Лайков: 674
·Просмотров: 1.8M
ПротоколFOMC
Просмотров: 18,130
90 обсуждают
fomcотслеживание
Просмотров: 24,203
298 обсуждают