
CryptoZeno 1
360 Публикации

CryptoZeno 1
Featured Creator on #CoinMarketCap #BinanceSquare and #CryptoQuant | On Chain Research and Market Insights
0 подписок(и/а)
8 подписчиков(а)
19 понравилось
Посты
См. перевод
$BTC Bears will get rekt soon.
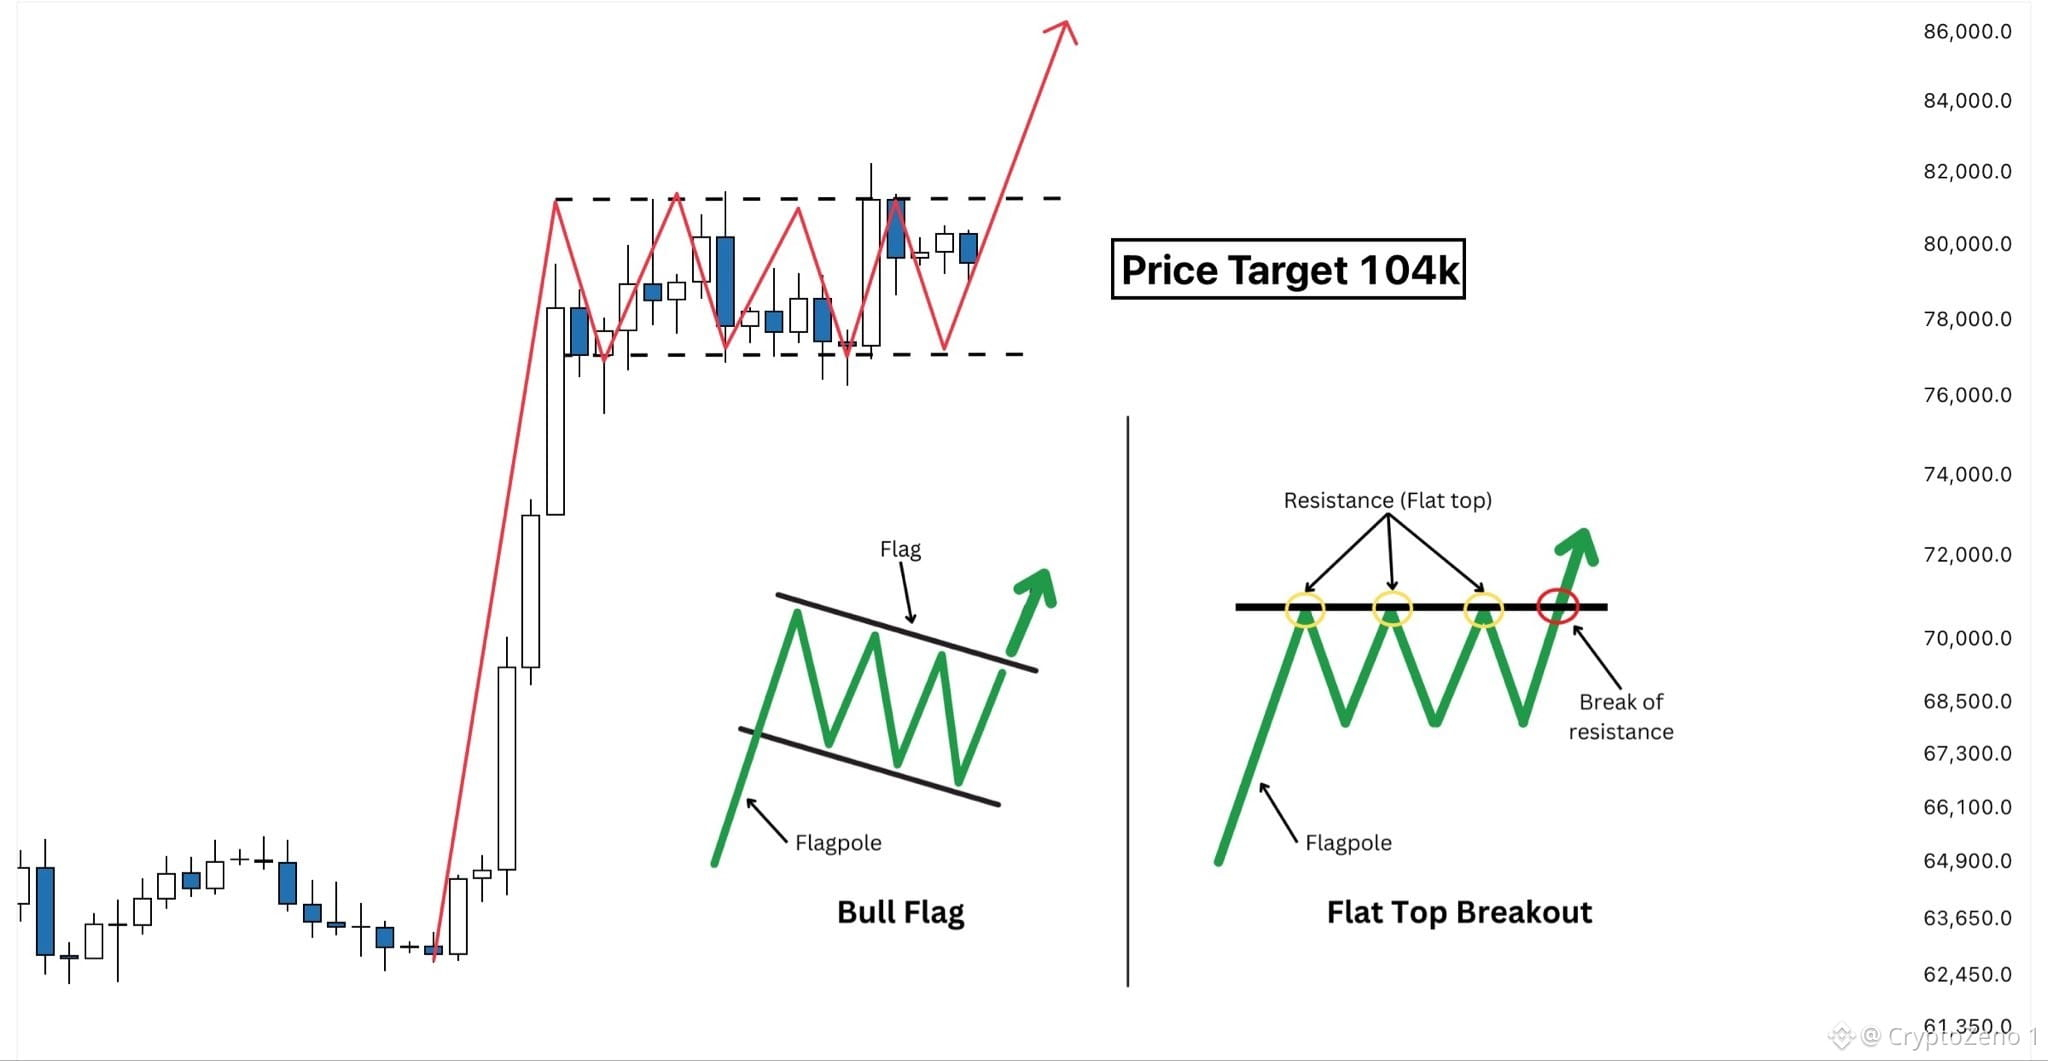
Price is still trading inside this bull flag.
For me, it’s a sign of strength that after a pump like the one we saw previously, market participants are still accumulating.
If we get a confirmed breakout, this could bring price toward 104k. #BTC Price Analysis# #Macro Insights# #Altcoin Season#
Price is still trading inside this bull flag.
For me, it’s a sign of strength that after a pump like the one we saw previously, market participants are still accumulating.
If we get a confirmed breakout, this could bring price toward 104k. #BTC Price Analysis# #Macro Insights# #Altcoin Season#
См. перевод
#Bitcoin On Chain Profit Signals Are Improving But The Market Is Not Out Of Danger Yet
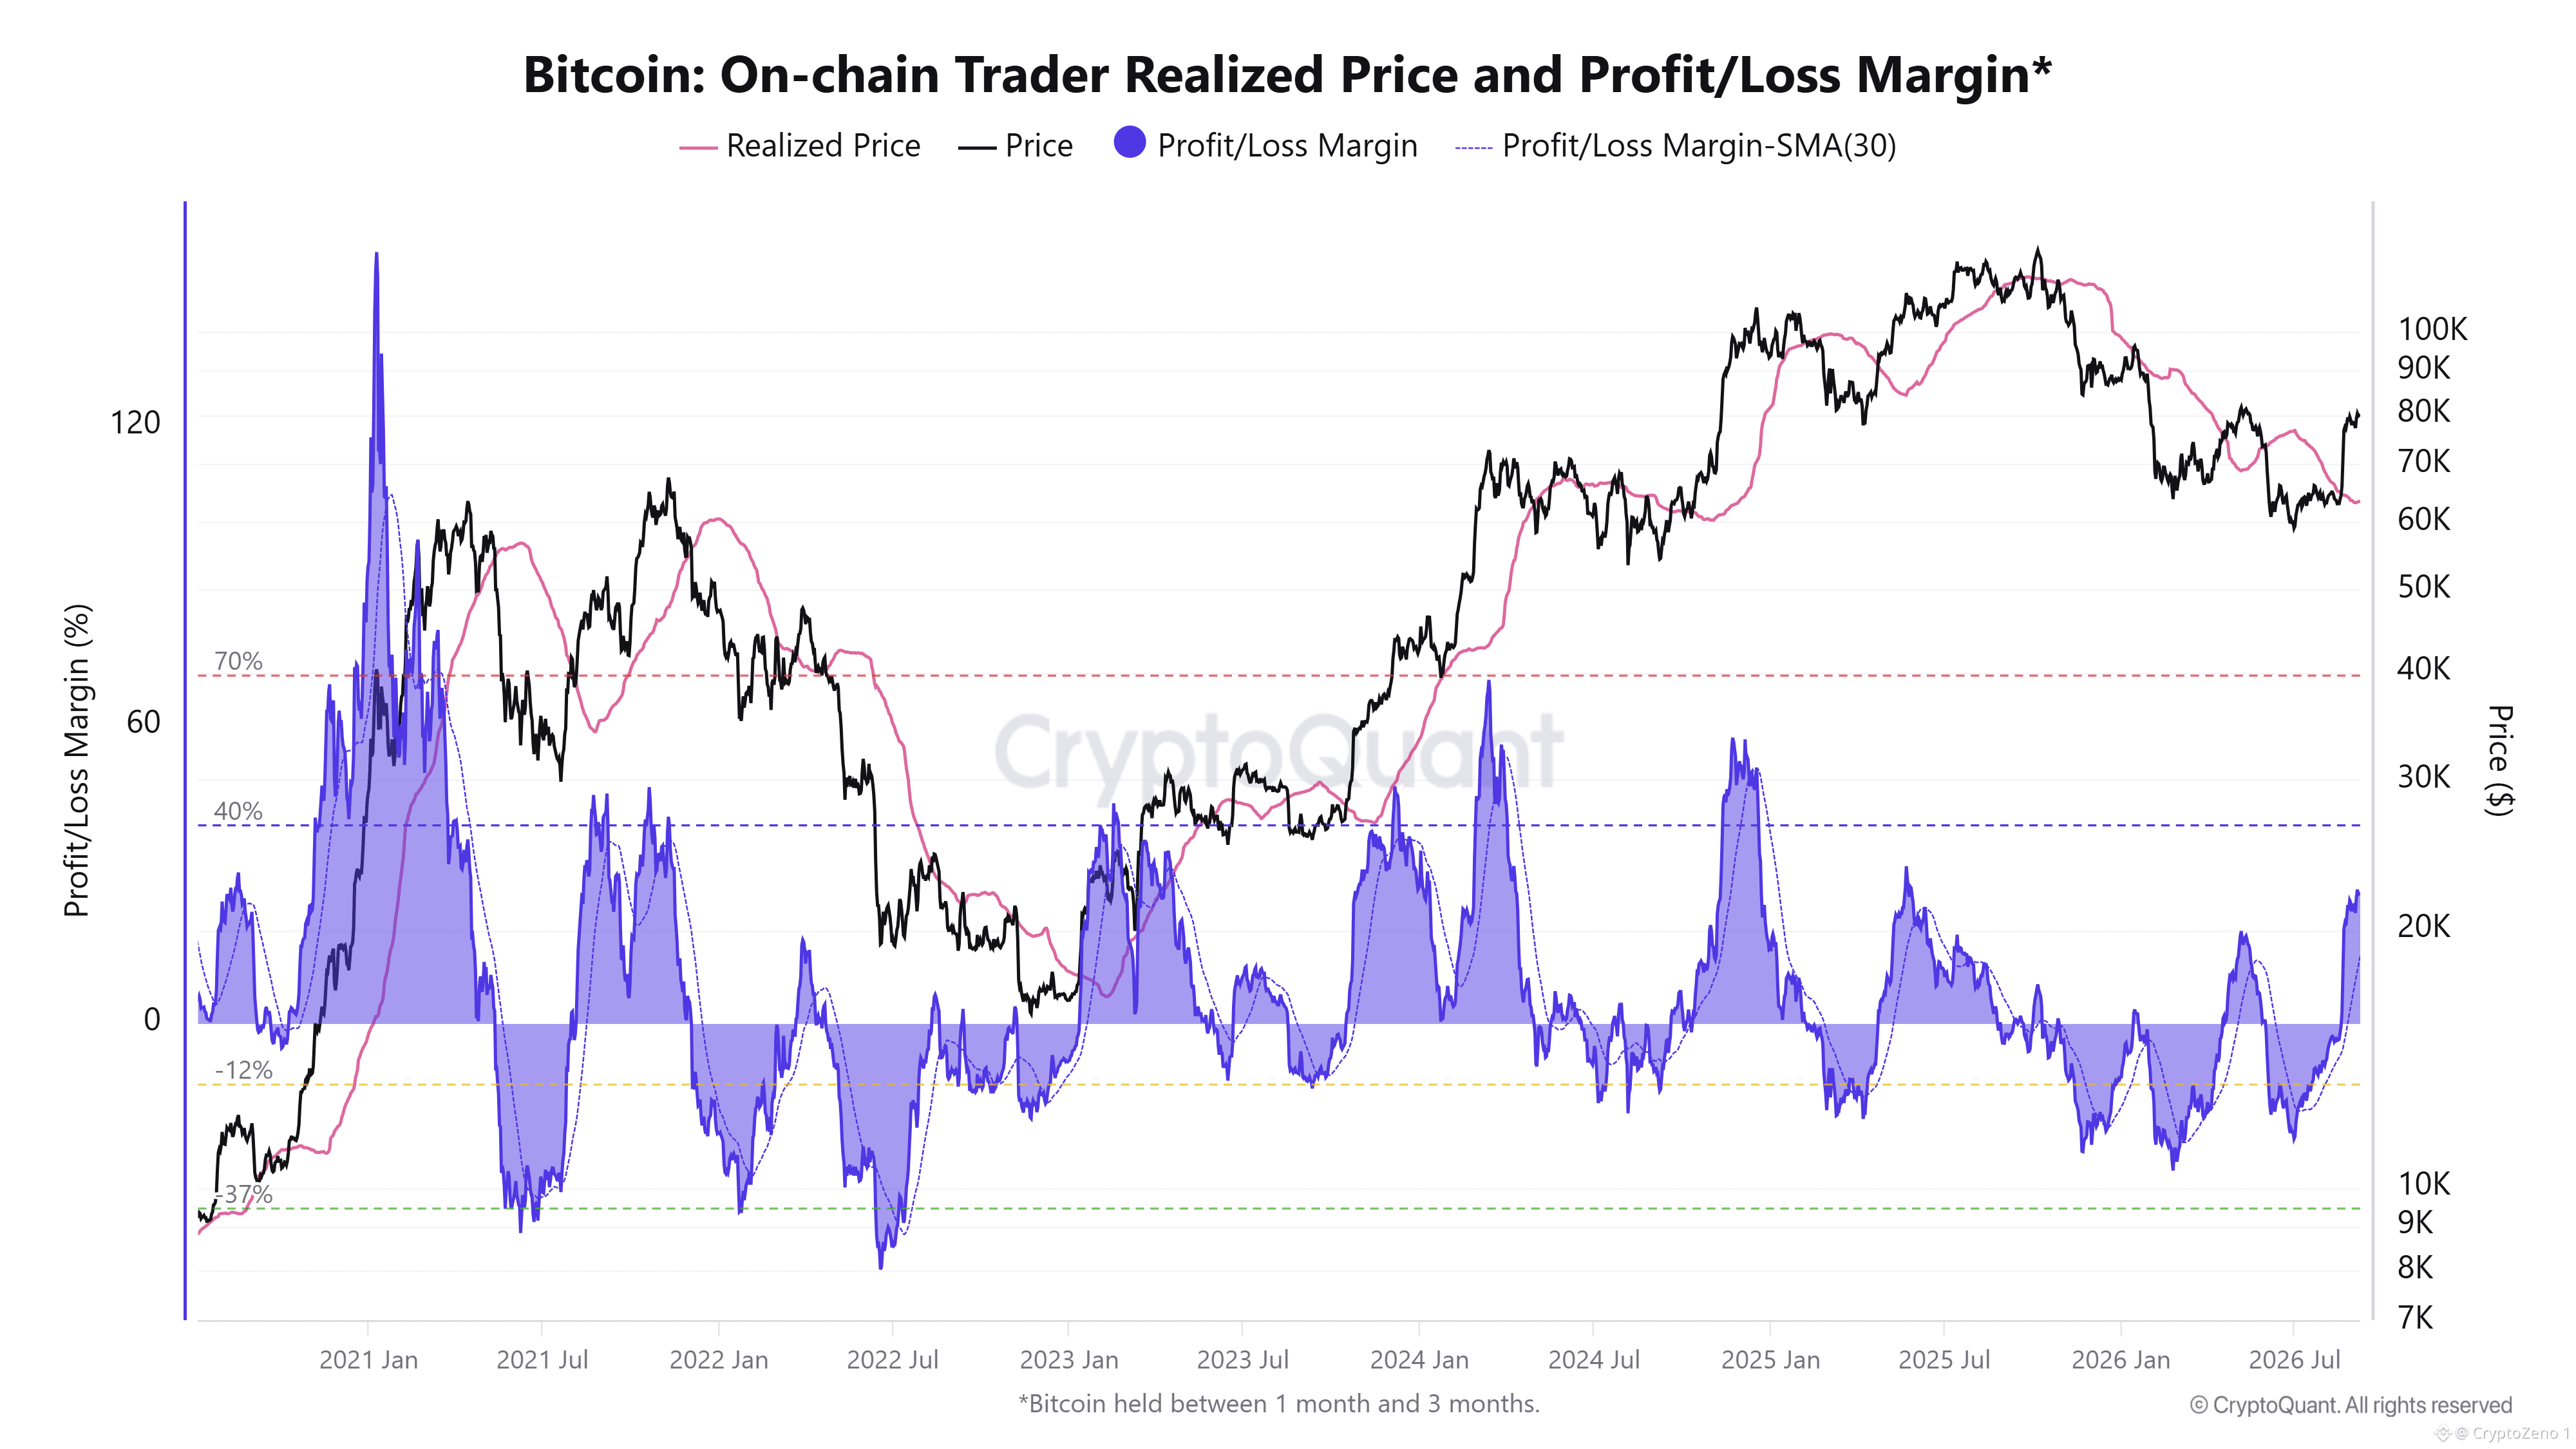
$BTC on chain structure is improving, but the latest data does not yet show the extreme profitability normally associated with a late stage euphoric market. BTC is trading around $80K, while the realized price of coins held for 1 to 3 months is near $63K. This leaves the cohort with roughly 27% unrealized profit, a significant recovery from the negative conditions seen during previous drawdowns. Short term holders are therefore back in profit, but the cushion remains moderate rather than extreme.
The Profit/Loss Margin is still below the key historical 40% and 70% reference levels. The 30 day moving average has recovered from negative territory, indicating that profitability among recent market participants is rebuilding. Historically, the 40% zone has represented a much stronger profit environment, while moves toward 70% have coincided with substantially higher unrealized gains. Current positioning therefore suggests recovery rather than widespread short term euphoria.
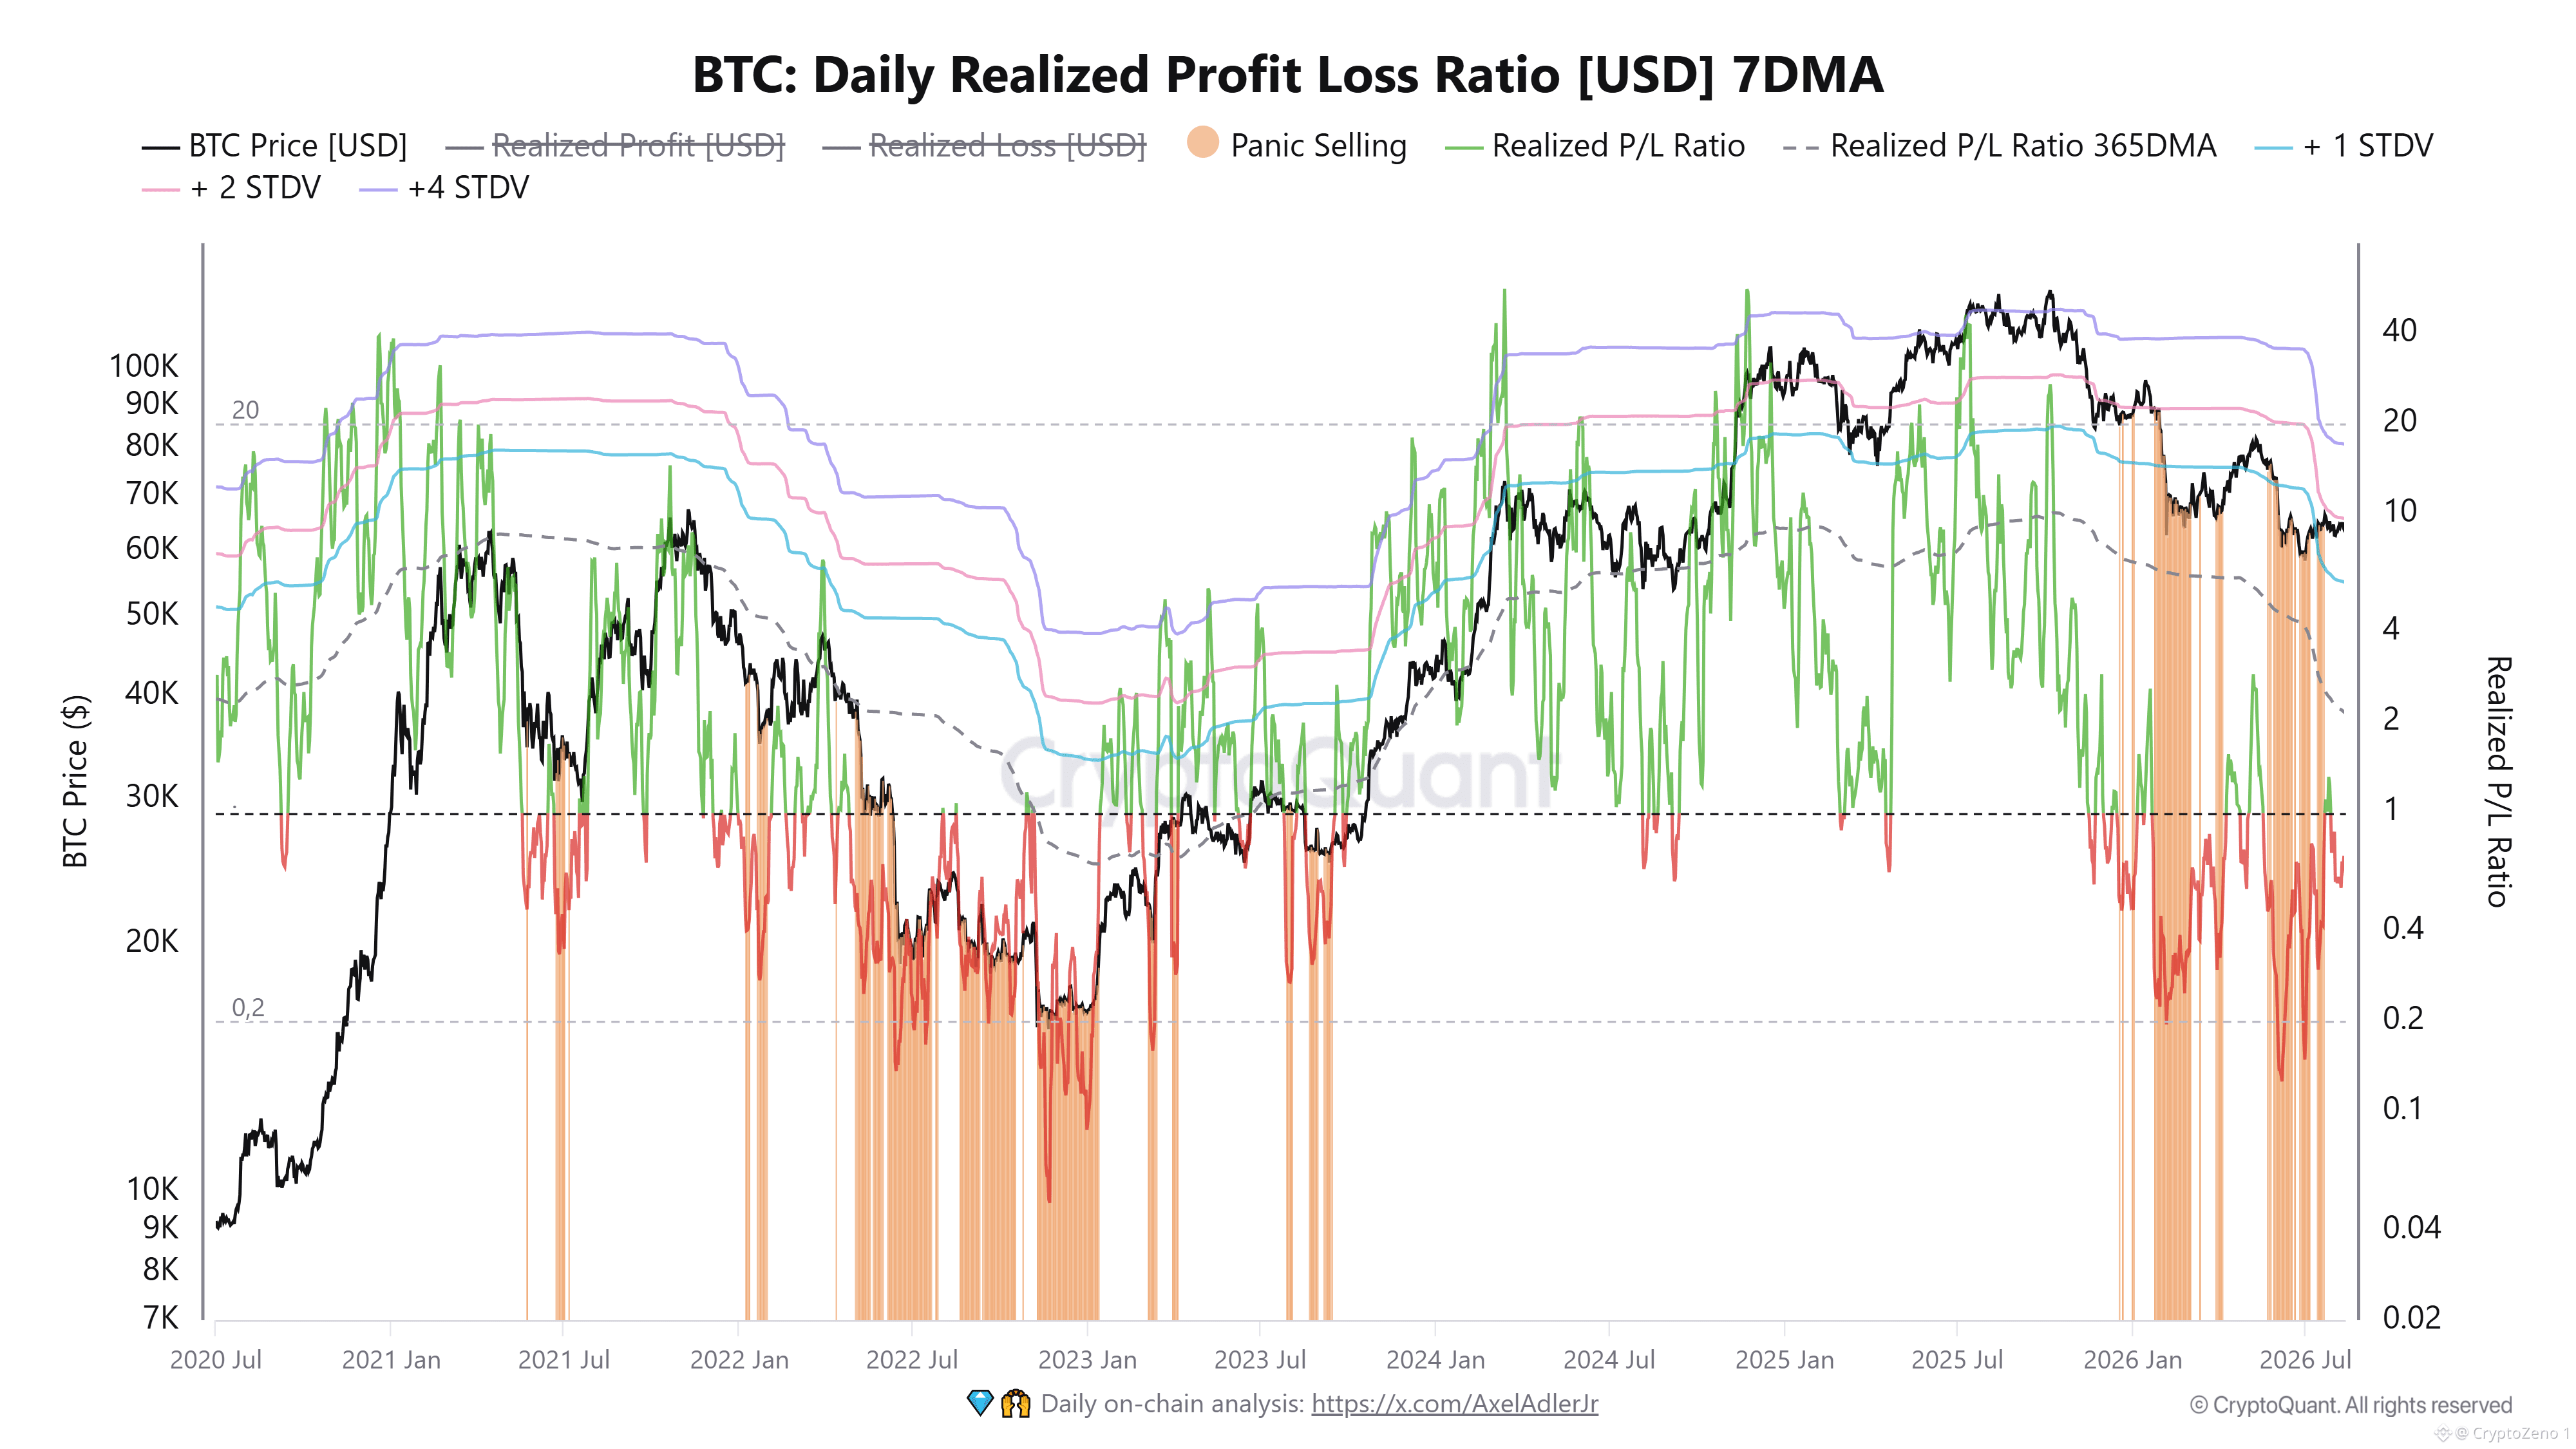
The second chart provides a more cautious signal. Bitcoin 7 day realized profit/loss ratio has repeatedly dropped below 1 during 2026, meaning realized losses temporarily exceeded realized profits. Several concentrated selling periods appeared as BTC moved through roughly the $60K to $90K range.
The key level to monitor is therefore the gap between BTC current price and the ~$63K realized price of the 1 to 3 month cohort. As long as BTC remains comfortably above this cost basis, short term holders remain in aggregate profit. A continued rise in the profit margin without a renewed surge in realized losses would strengthen the recovery structure. Conversely, a sustained decline toward the realized price could quickly increase selling pressure. #BTC Price Analysis# #Macro Insights#
$BTC on chain structure is improving, but the latest data does not yet show the extreme profitability normally associated with a late stage euphoric market. BTC is trading around $80K, while the realized price of coins held for 1 to 3 months is near $63K. This leaves the cohort with roughly 27% unrealized profit, a significant recovery from the negative conditions seen during previous drawdowns. Short term holders are therefore back in profit, but the cushion remains moderate rather than extreme.
The Profit/Loss Margin is still below the key historical 40% and 70% reference levels. The 30 day moving average has recovered from negative territory, indicating that profitability among recent market participants is rebuilding. Historically, the 40% zone has represented a much stronger profit environment, while moves toward 70% have coincided with substantially higher unrealized gains. Current positioning therefore suggests recovery rather than widespread short term euphoria.
The second chart provides a more cautious signal. Bitcoin 7 day realized profit/loss ratio has repeatedly dropped below 1 during 2026, meaning realized losses temporarily exceeded realized profits. Several concentrated selling periods appeared as BTC moved through roughly the $60K to $90K range.
The key level to monitor is therefore the gap between BTC current price and the ~$63K realized price of the 1 to 3 month cohort. As long as BTC remains comfortably above this cost basis, short term holders remain in aggregate profit. A continued rise in the profit margin without a renewed surge in realized losses would strengthen the recovery structure. Conversely, a sustained decline toward the realized price could quickly increase selling pressure. #BTC Price Analysis# #Macro Insights#
См. перевод
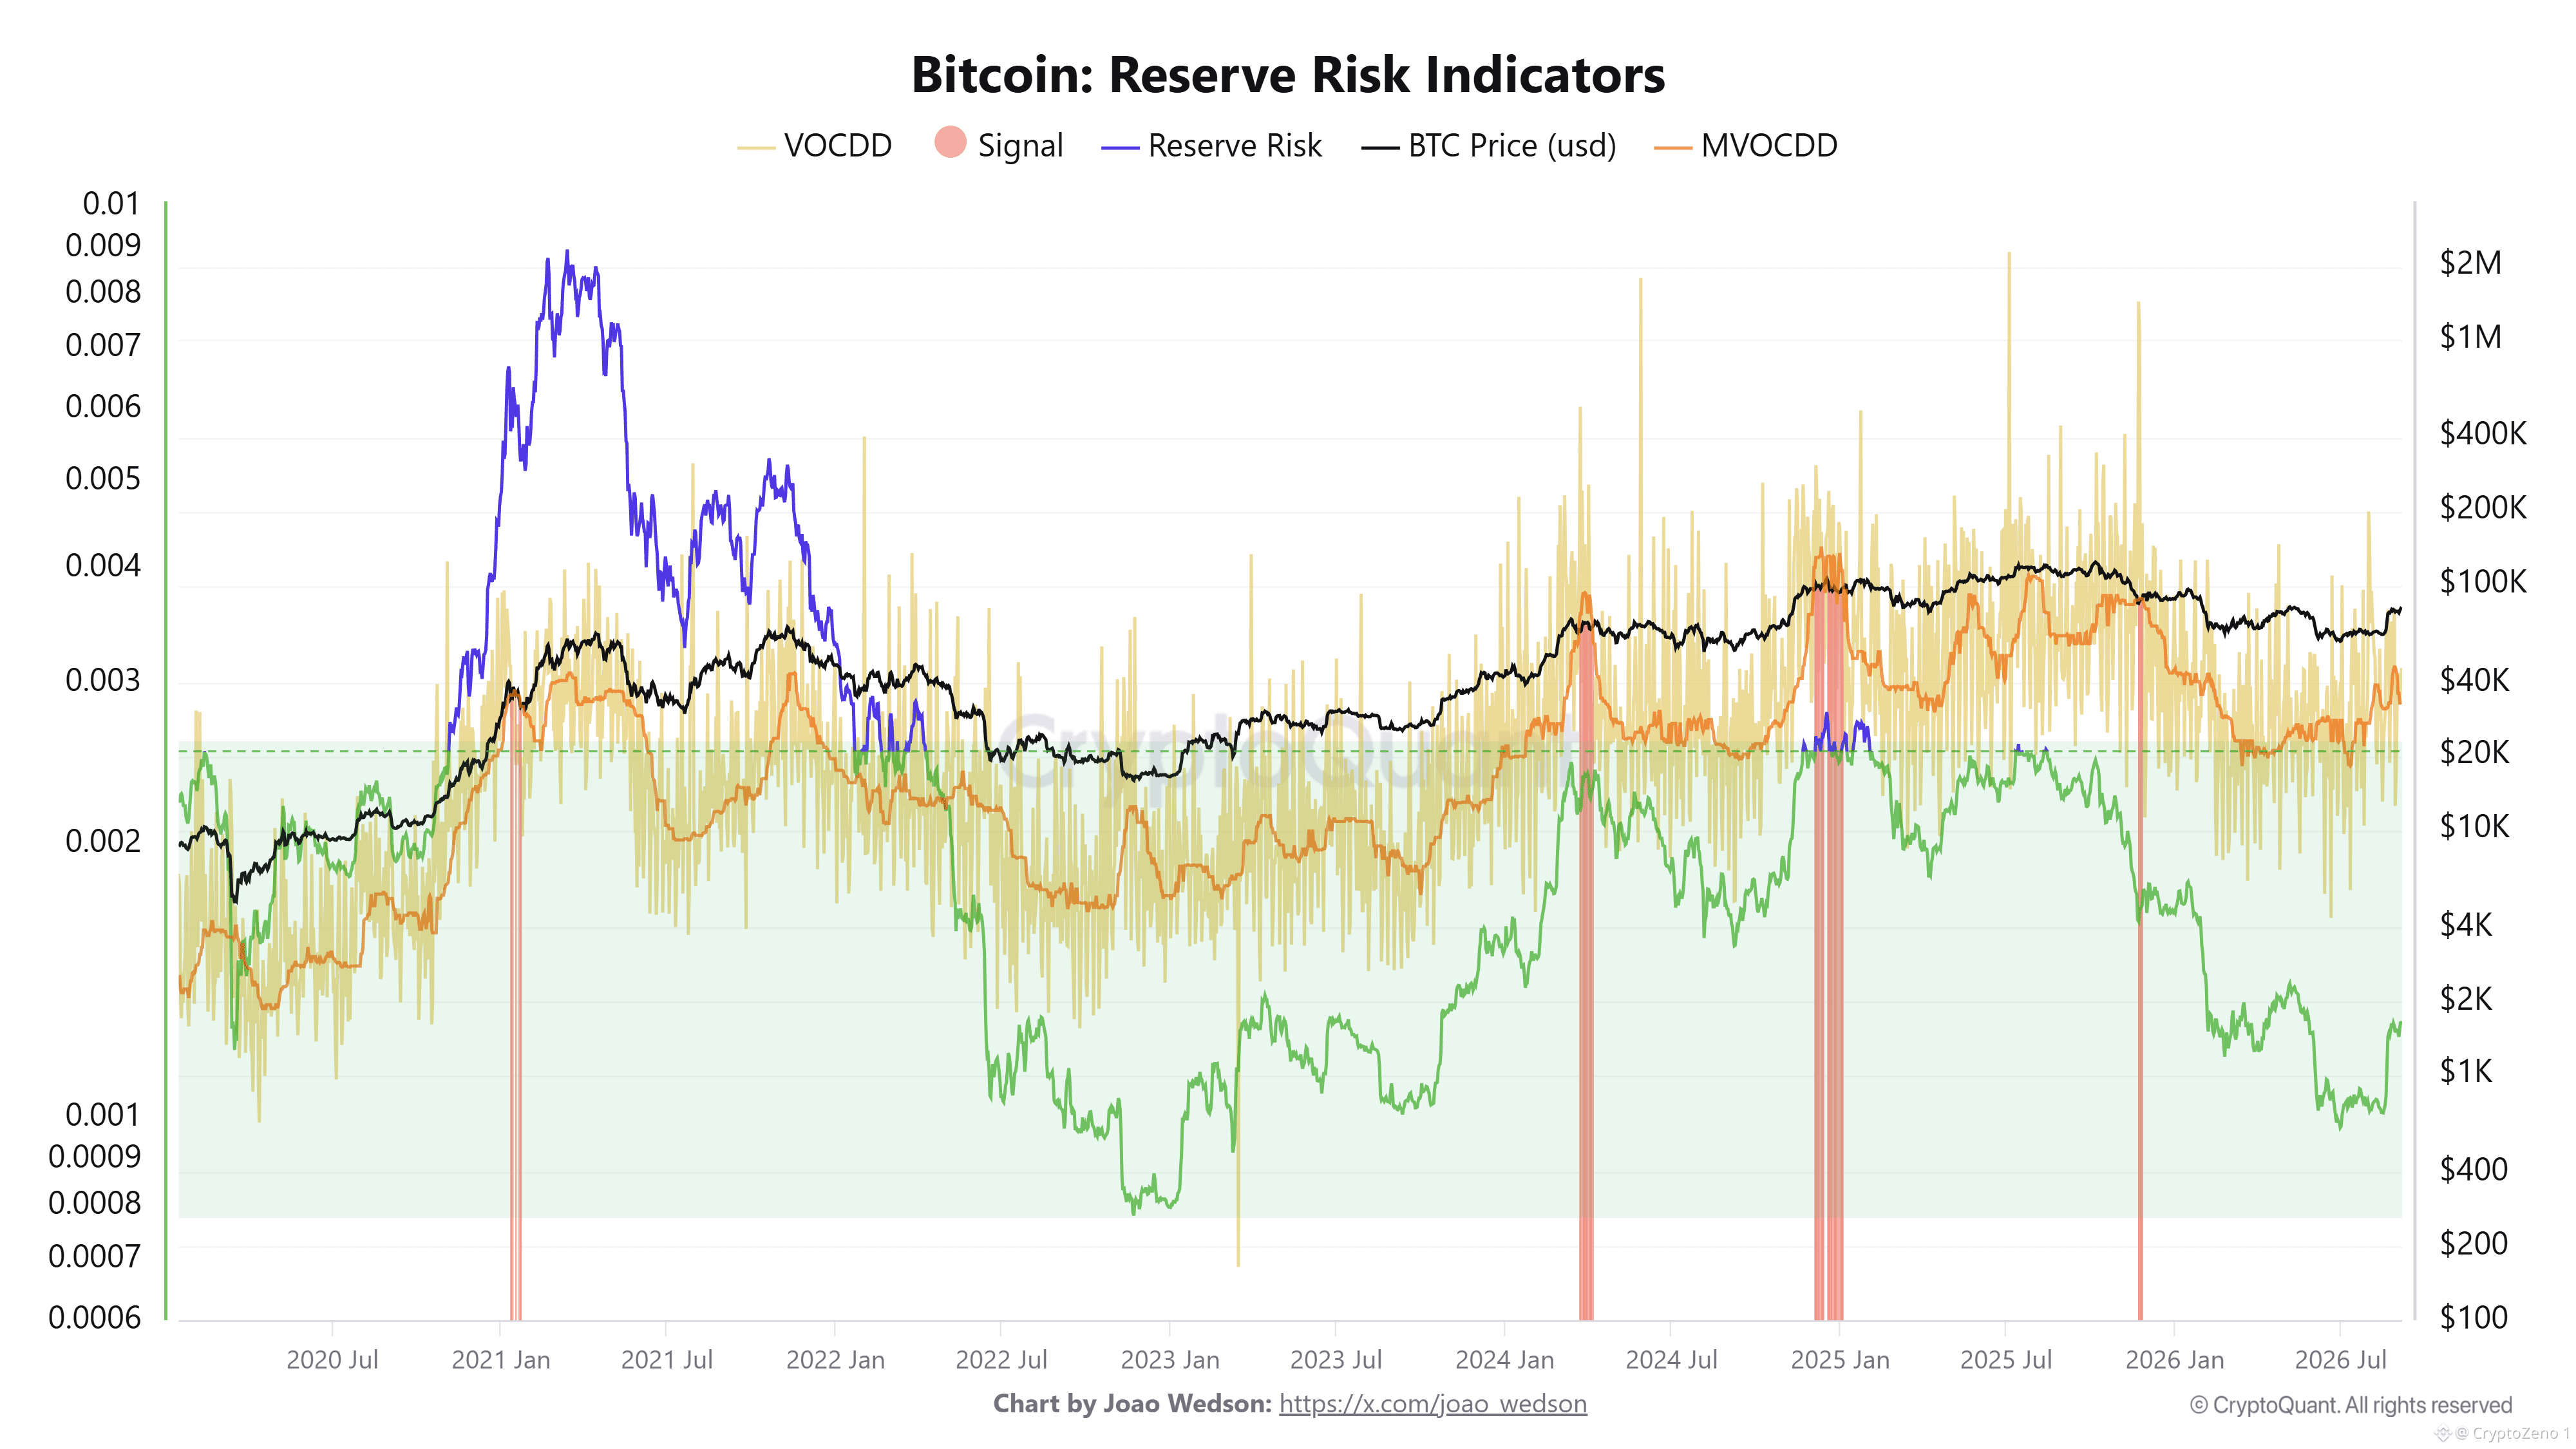
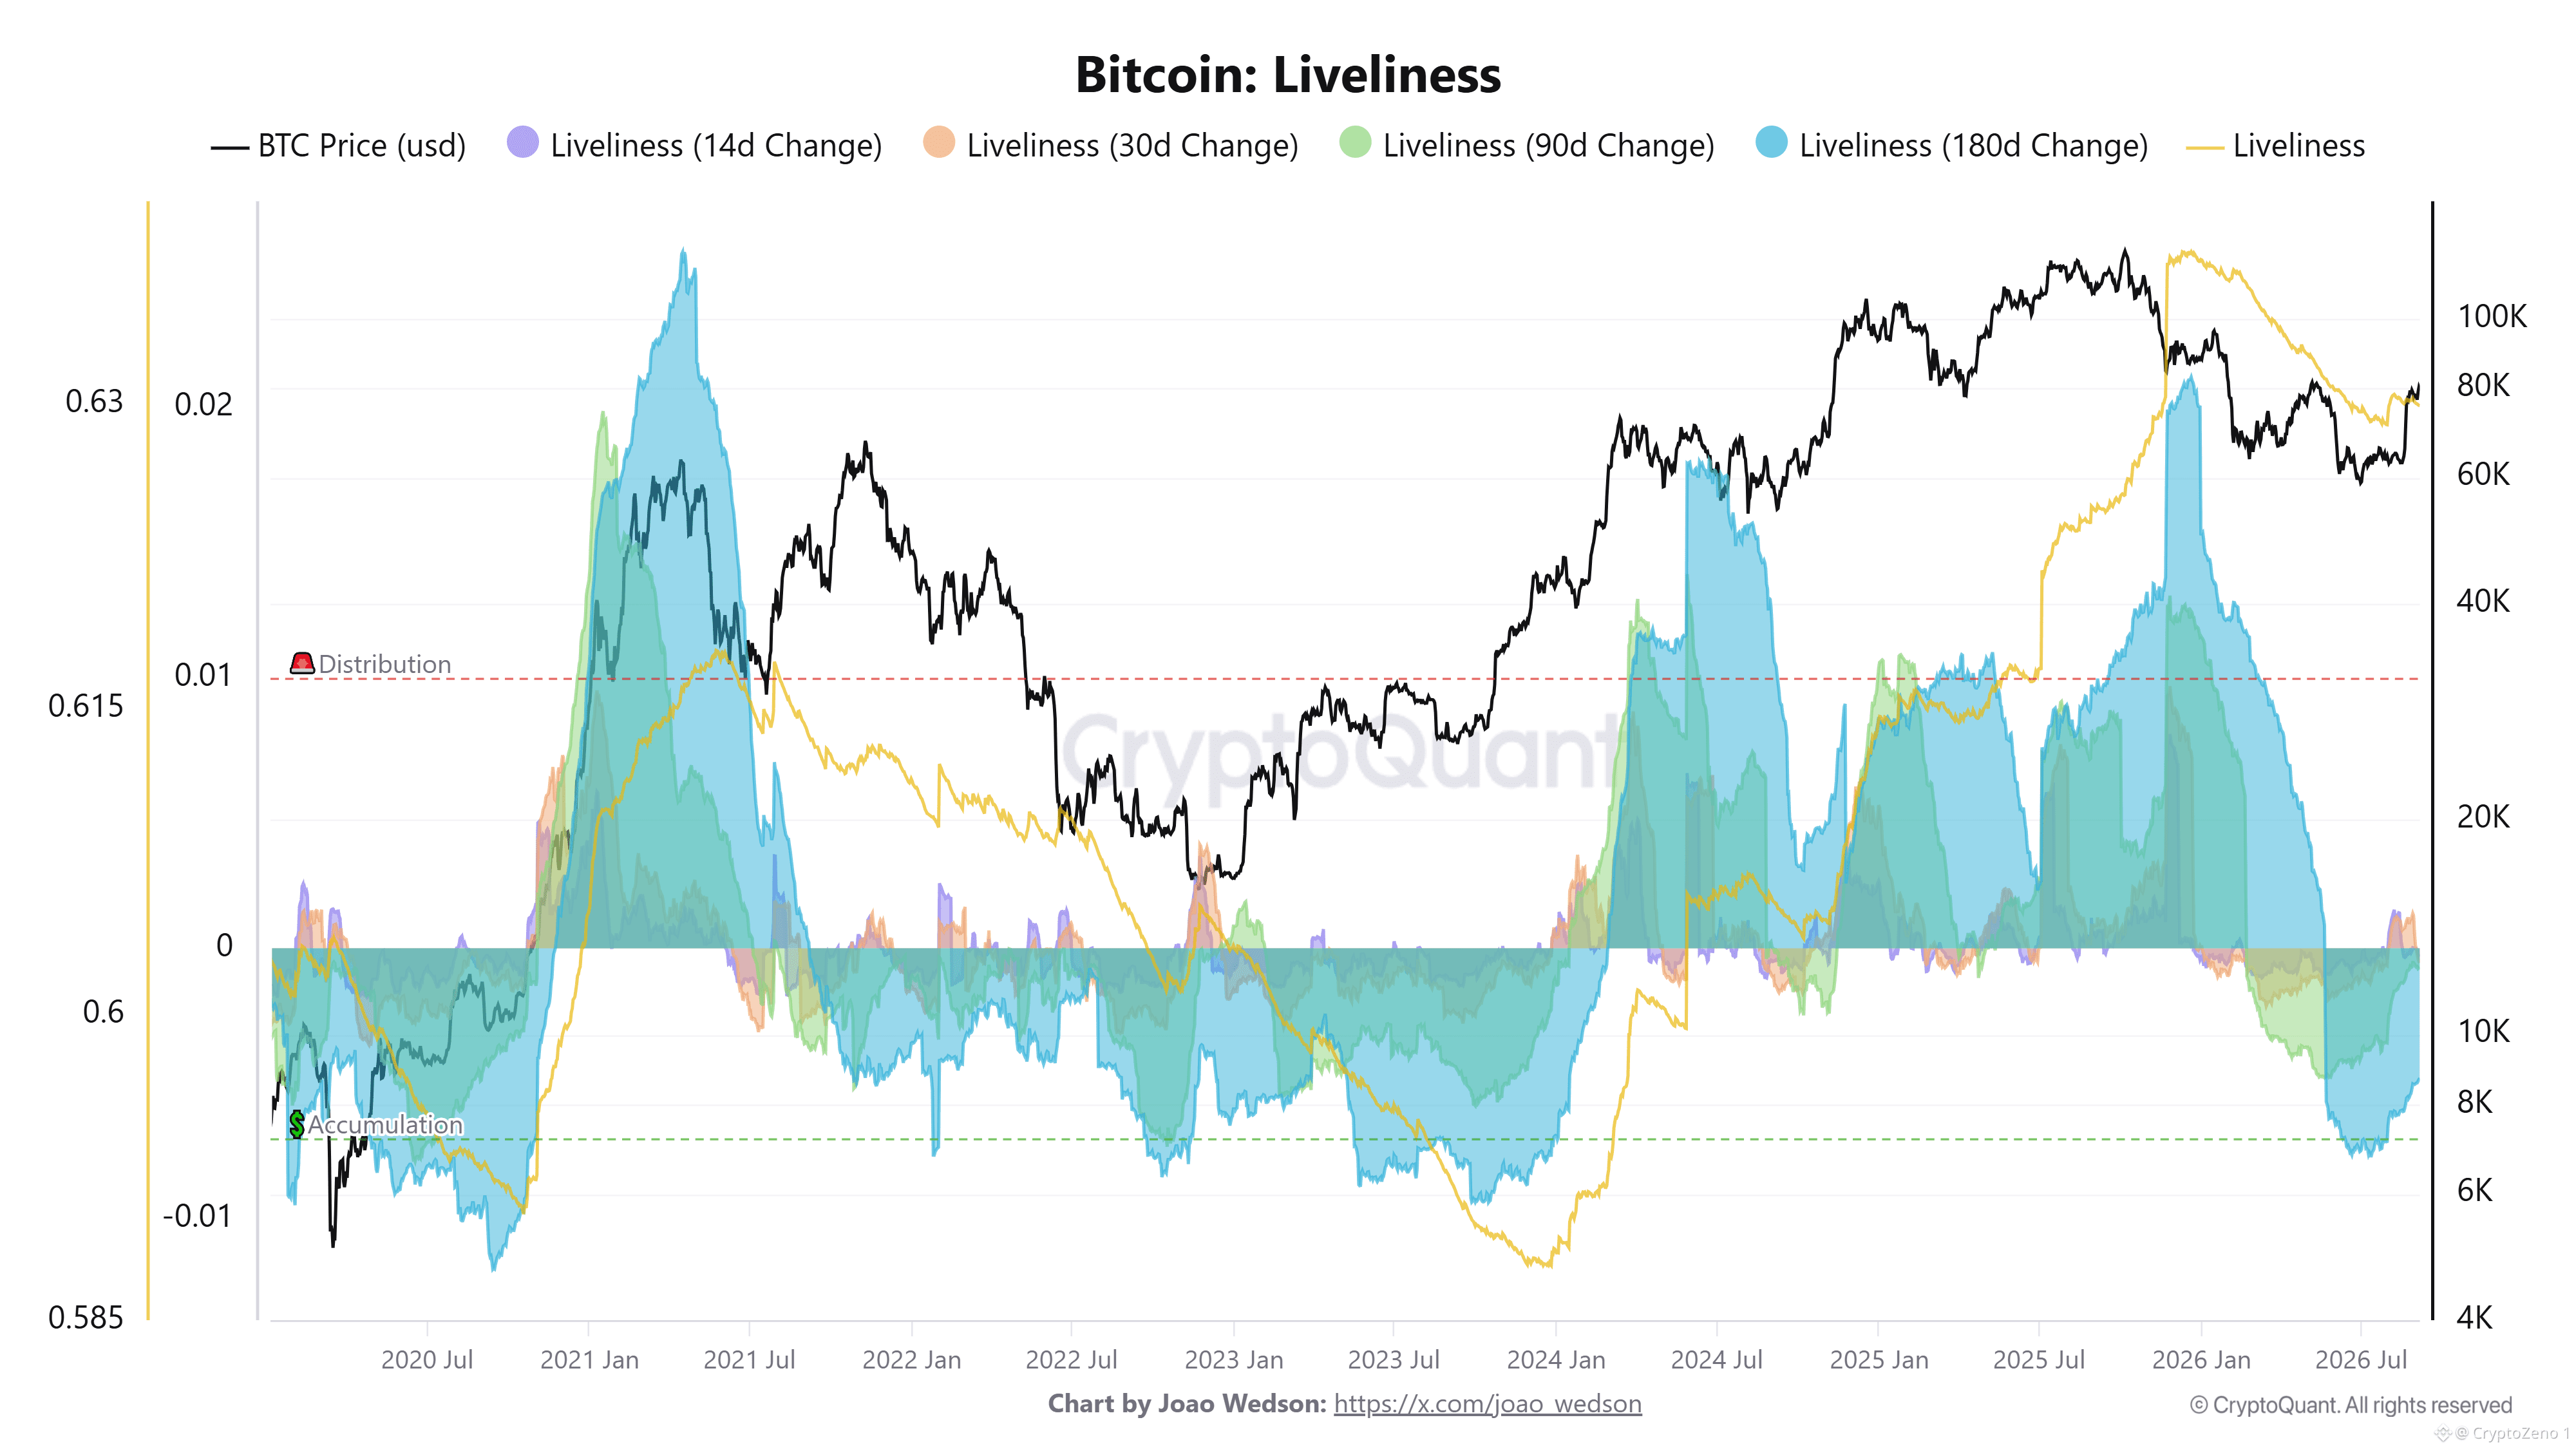
#Bitcoin Is Cooling, But The On-Chain Structure Has Not Broken $BTC is in a much more interesting position than a simple “bullish or bearish” label suggests. The Reserve Risk chart shows that the indicator remains far below the extreme levels reached around the 2021 cycle top. At the same time, BTC price is still holding well above the deep accumulation zones seen in 2022 and 2023. Valuation risk has cooled, but it has not moved into an obvious capitulation regime either. What caught my attention more is Liveliness. The longer-term structure had been rising through 2025, but the latest data shows a broad reversal. The 14D, 30D, 90D and 180D changes have all moved below zero, meaning the recent decline is appearing across several timeframes rather than coming from one short burst of activity. That tells me the behavior of existing coins is changing. Liveliness is useful here because it looks beyond price and asks what holders are actually doing with their coins. When Liveliness rises, more supply is being activated and spent. When it falls, previously active supply is becoming quieter. The current decline therefore does not automatically mean sellers are taking control. It can also reflect a market where coins are moving less frequently and holders are becoming less active. The combination is what matters. Reserve Risk is not flashing the kind of elevated conditions that have historically accompanied major cycle exhaustion, while declining Liveliness suggests that supply activity is losing intensity. BTC has clearly pulled back from its highs, but the on-chain data does not yet resemble a full structural breakdown. I would watch for a sustained Liveliness rebound alongside rising Reserve Risk. That combination would tell a very different story. For now, the data looks more like a cooling market than a confirmed cycle reversal. #BTC Price Analysis# #Macro Insights#
См. перевод
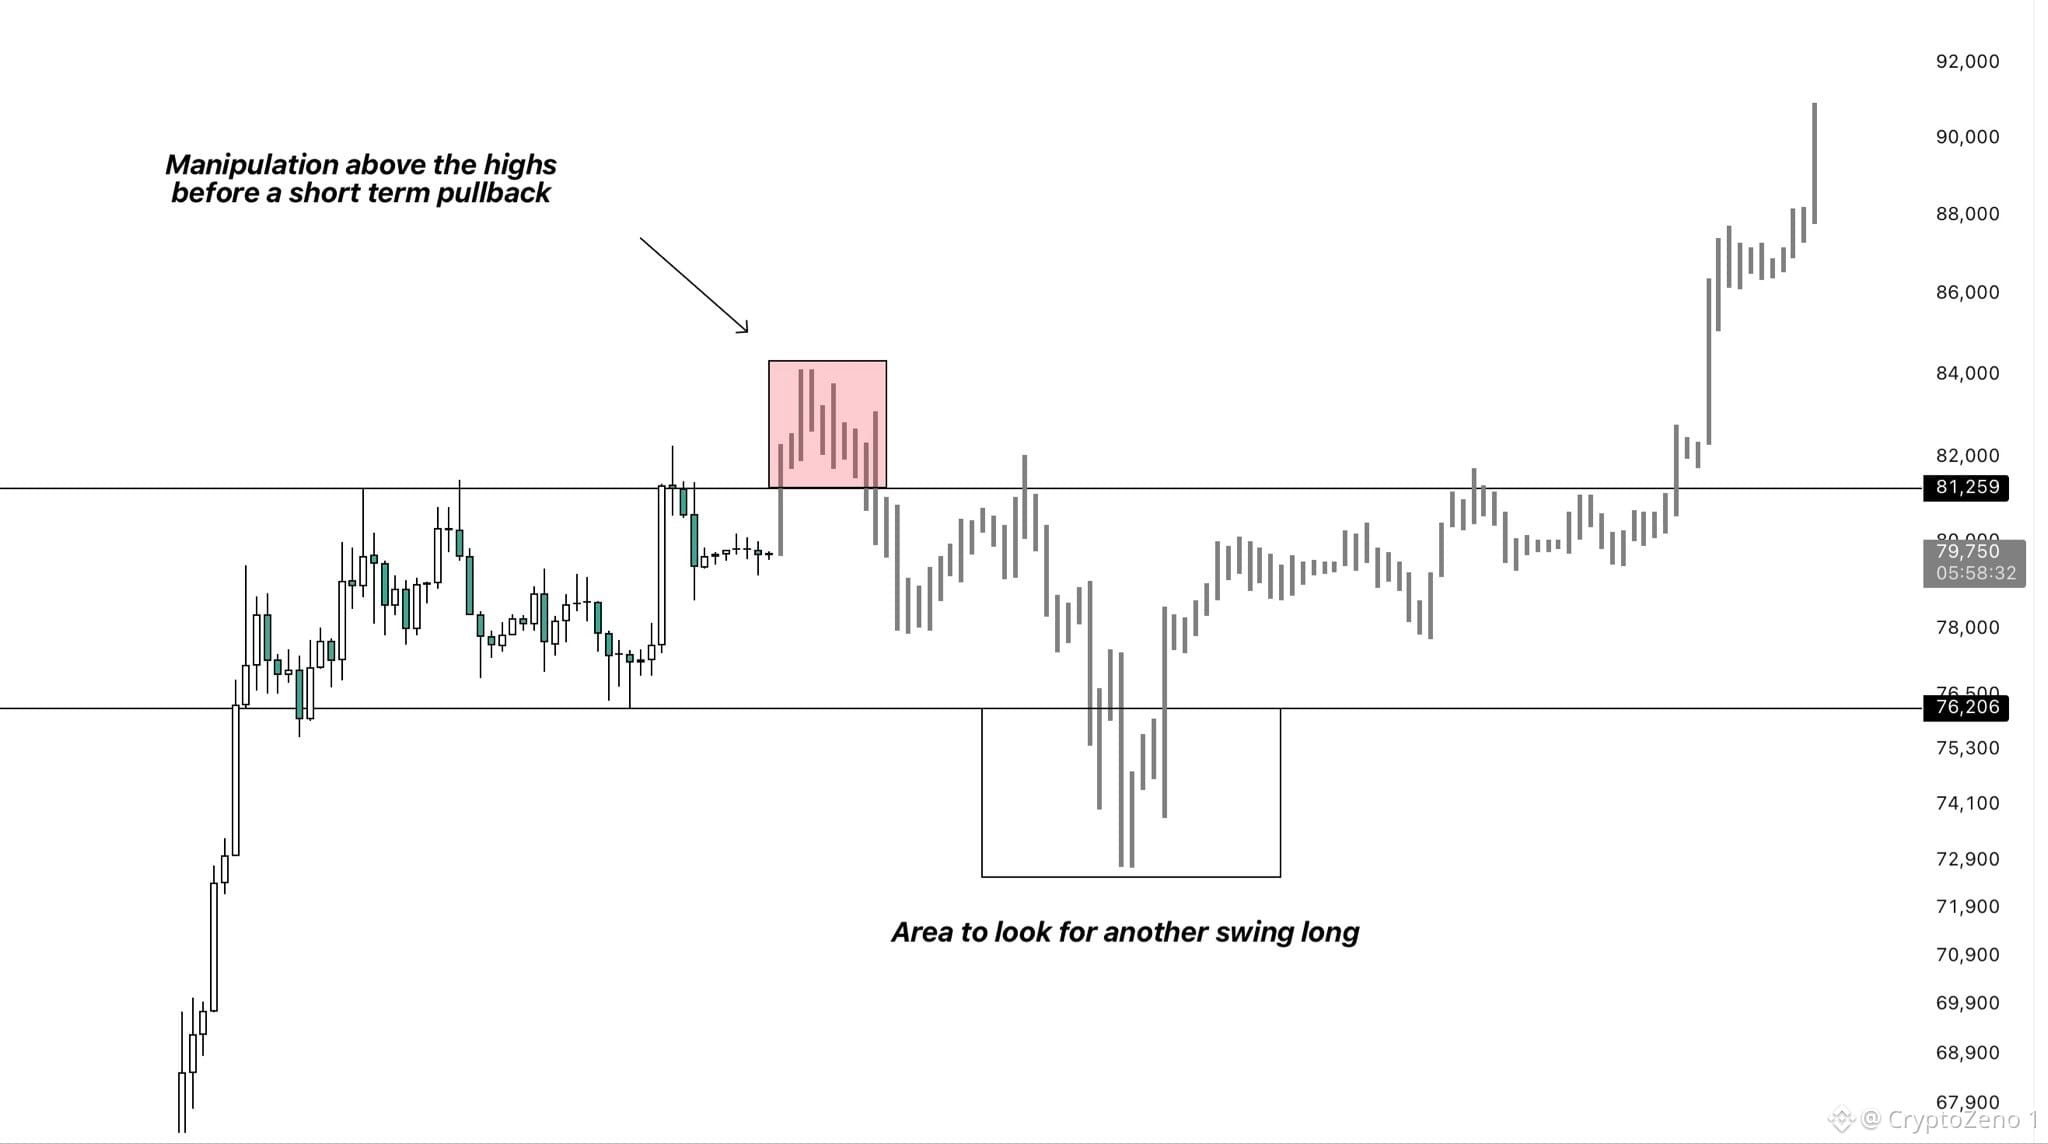
$BTC This is what I think price action could look like over the next weeks/months.
Right now, price is moving within a defined range with liquidity building up on both ends.
If you compare the current structure to the bear market fractal from 2022, it looks very similar.
Back then, we saw a short deviation above the range where price swept the previous high, followed by a larger pullback to retest a recent breakout level.
This was then followed by the next major move to the upside.
I believe this time around could play out in a very similar way.
A final push above the current highs to take out the remaining liquidity before a larger pullback would therefore not surprise me.
If that happens, the $72K–$74K region will be the main area where I’ll look for another swing long, assuming buyers step back in and defend it.
Obviously, I don’t expect price to follow this exact path candle for candle, but from a structural perspective this is currently the scenario that makes the most sense to me. #BTC Price Analysis# #Macro Insights# #Meme Alpha#
Right now, price is moving within a defined range with liquidity building up on both ends.
If you compare the current structure to the bear market fractal from 2022, it looks very similar.
Back then, we saw a short deviation above the range where price swept the previous high, followed by a larger pullback to retest a recent breakout level.
This was then followed by the next major move to the upside.
I believe this time around could play out in a very similar way.
A final push above the current highs to take out the remaining liquidity before a larger pullback would therefore not surprise me.
If that happens, the $72K–$74K region will be the main area where I’ll look for another swing long, assuming buyers step back in and defend it.
Obviously, I don’t expect price to follow this exact path candle for candle, but from a structural perspective this is currently the scenario that makes the most sense to me. #BTC Price Analysis# #Macro Insights# #Meme Alpha#
См. перевод
Buy $BTC in the next 85 days
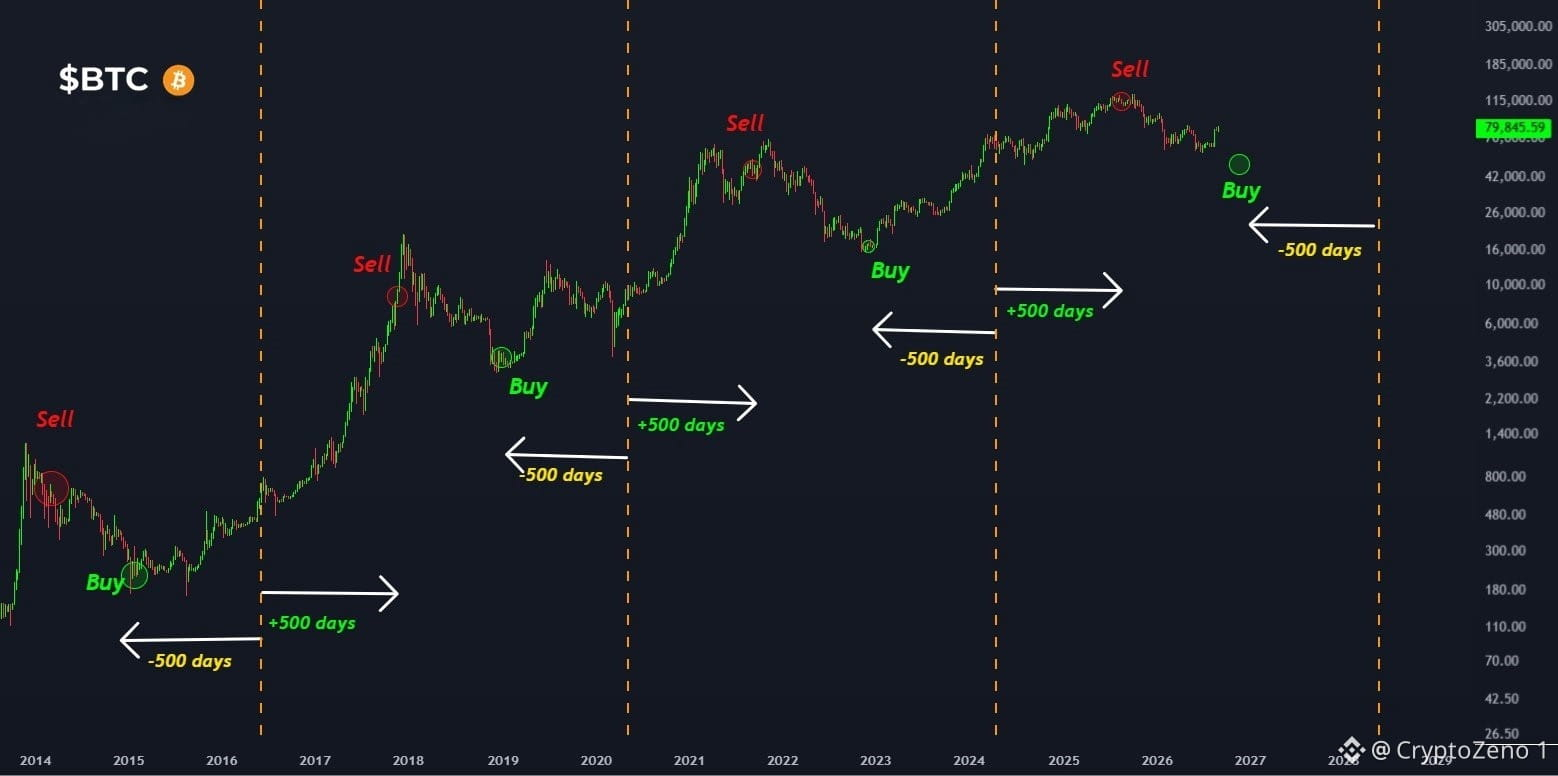
According to the 500-Day Bitcoin Strategy :
1) Buy Bitcoin 500 days before the halving
2) Hold & don’t get shaken out
3) Sell 500 days after the halving
4) Repeat
This strategy has worked remarkably well in previous cycles.
The next Bitcoin halving is only ~585 days away.
That means, according to this strategy, we have roughly 85 days left to accumulate BTC.
85 days from today = November 30th.
The best time to buy Bitcoin & Crypto is coming. Don't miss #BTC Price Analysis# #Macro Insights#
According to the 500-Day Bitcoin Strategy :
1) Buy Bitcoin 500 days before the halving
2) Hold & don’t get shaken out
3) Sell 500 days after the halving
4) Repeat
This strategy has worked remarkably well in previous cycles.
The next Bitcoin halving is only ~585 days away.
That means, according to this strategy, we have roughly 85 days left to accumulate BTC.
85 days from today = November 30th.
The best time to buy Bitcoin & Crypto is coming. Don't miss #BTC Price Analysis# #Macro Insights#
См. перевод
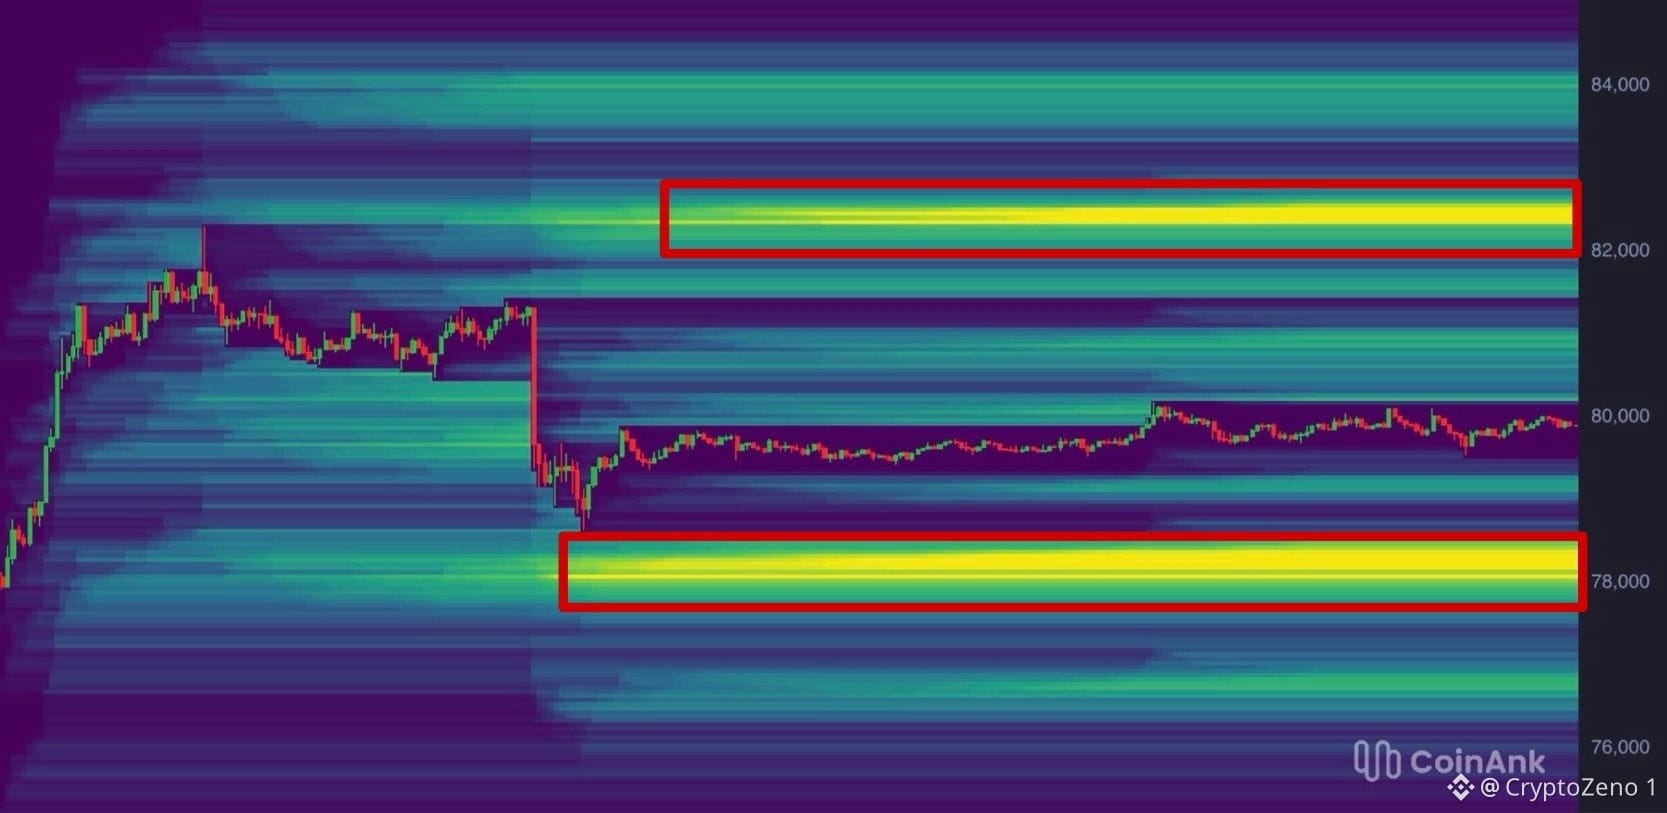
$BTC We have notable liquidation clusters both above the highs and below the lows.
The downside liquidity is theoretically closer, making it easier and more likely to get swept first.
However, in scenarios like this, a sweep of both clusters happens pretty often.
My thesis is that we sweep the upside liquidity today, followed by a sweep of the downside cluster on Monday. #BTC Price Analysis# #Macro Insights#
The downside liquidity is theoretically closer, making it easier and more likely to get swept first.
However, in scenarios like this, a sweep of both clusters happens pretty often.
My thesis is that we sweep the upside liquidity today, followed by a sweep of the downside cluster on Monday. #BTC Price Analysis# #Macro Insights#
См. перевод
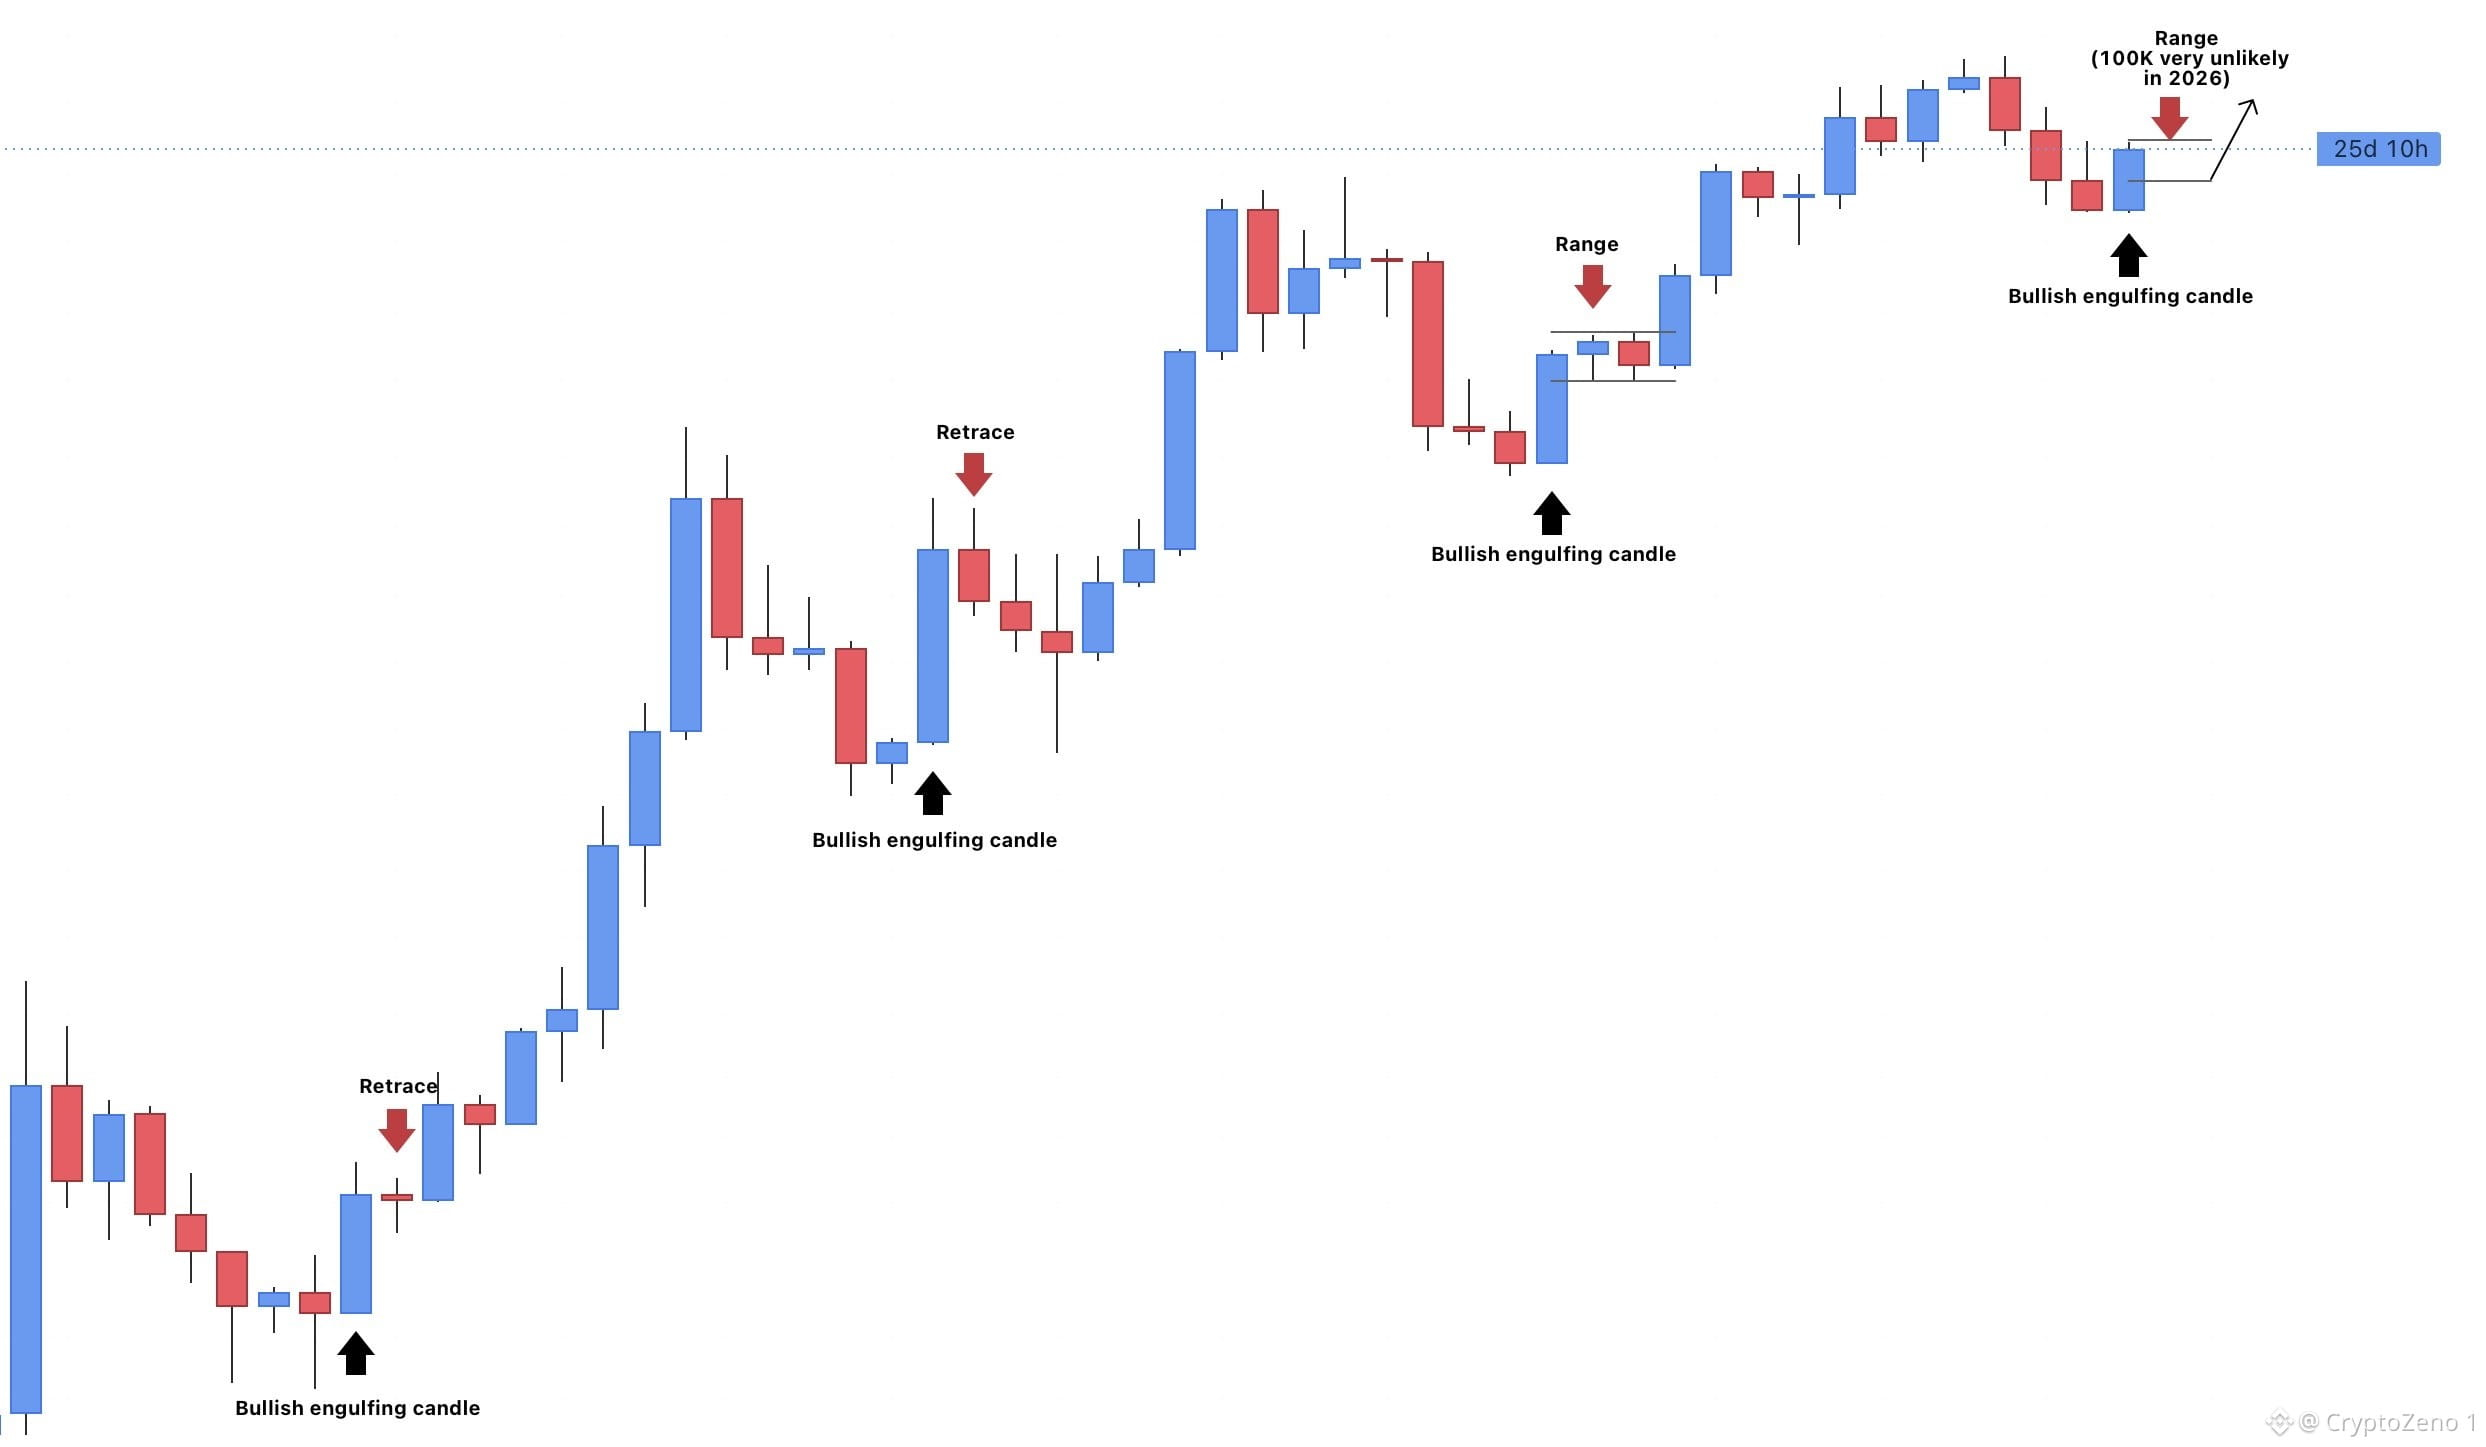
$BTC A bullish engulfing quarterly candle has always marked the bear market bottom.
Historically, these candles have been followed by a retrace or a range before the next expansion to the upside.
That being said, price will likely consolidate over the next 2–3 months before the next expansion, making 100K unlikely in 2026.
Bottom is in. I'm bullish, but don't be delusional. #BTC Price Analysis# #Macro Insights#
Historically, these candles have been followed by a retrace or a range before the next expansion to the upside.
That being said, price will likely consolidate over the next 2–3 months before the next expansion, making 100K unlikely in 2026.
Bottom is in. I'm bullish, but don't be delusional. #BTC Price Analysis# #Macro Insights#
См. перевод
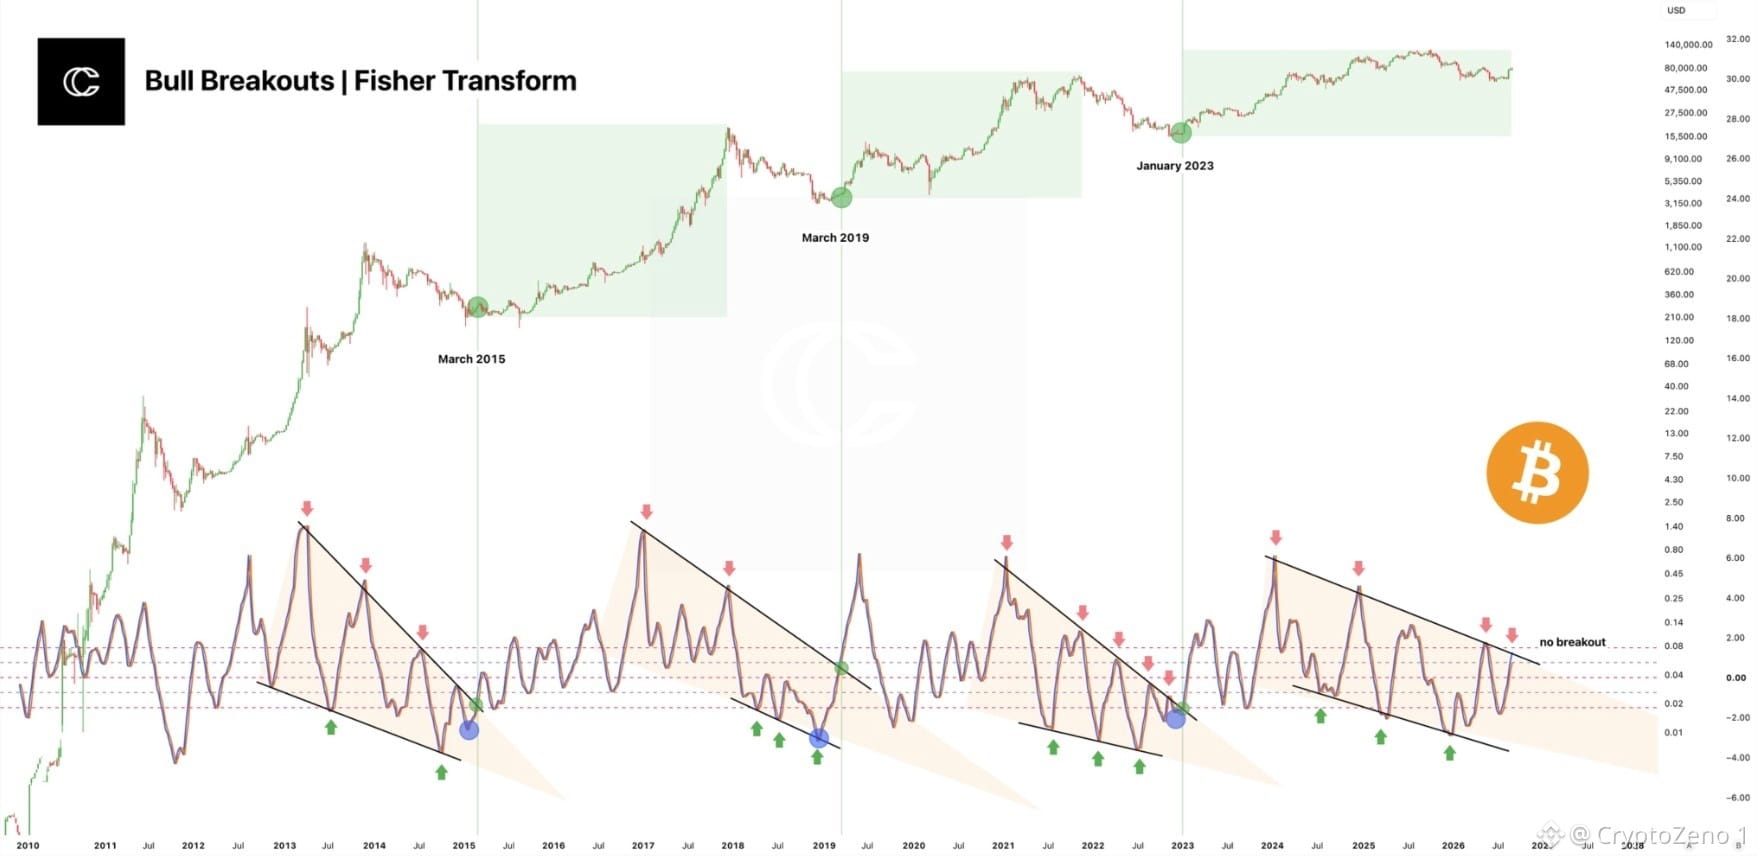
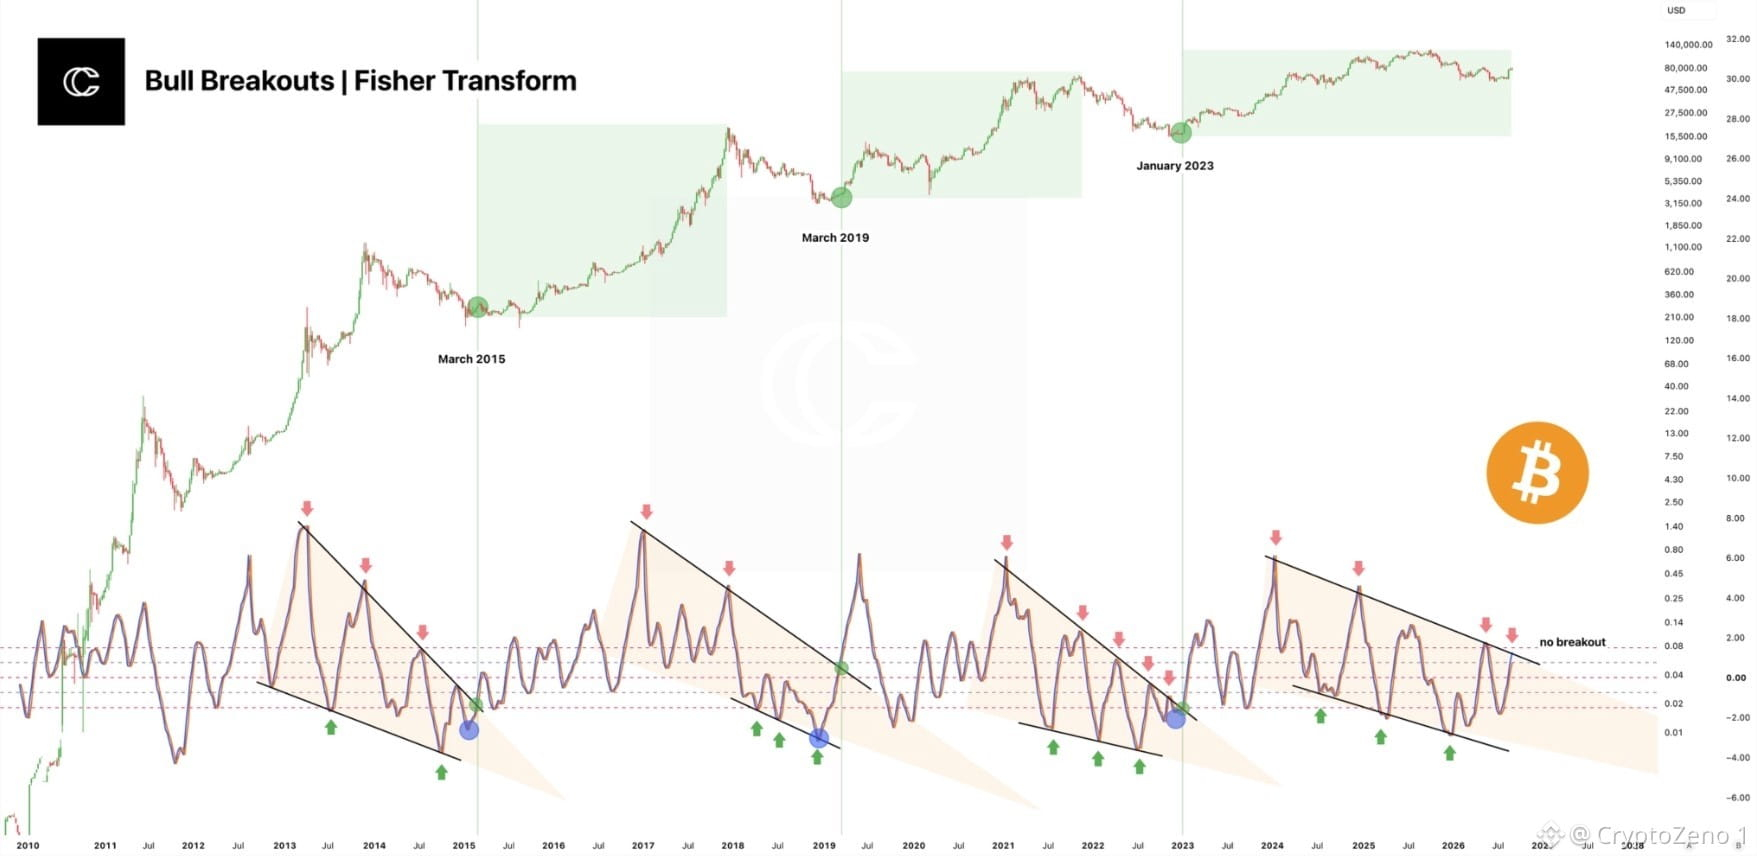
🚨 $BTC Fisher Transform Is Flashing A Pattern The Market Cannot Ignore #Bitcoin may be approaching another critical turning point. This chart compares the Fisher Transform with previous major BTC cycle phases and highlights a striking recurring structure: deep oscillator compression, a descending trendline, repeated rejection points, followed by a decisive upside breakout that preceded major bullish expansions. In 2015, 2019 and 2023, the Fisher Transform reached a deeply compressed zone before breaking its descending structure. Each historical breakout aligned with a major transition from accumulation into a much stronger bullish phase. The green markers on the chart show how these reversals developed after prolonged oscillator weakness rather than during periods of obvious euphoria. The current setup is especially interesting. BTC has again formed a descending structure on the Fisher Transform, with multiple lower highs and repeated downside pressure. However, the chart still shows “no breakout”, meaning the historical signal has not been fully confirmed yet. That distinction matters. A move above the descending Fisher trendline could become the technical trigger that shifts the market structure from compression toward expansion. Until then, this remains a setup, not a confirmed signal. The bigger picture is simple: the oscillator is approaching a zone where previous BTC cycle transitions became explosive. If history rhymes rather than repeats, the next confirmed Fisher breakout could become one of the most important signals to watch for the next major BTC move. BTC is not giving confirmation yet. But the setup is getting harder to ignore. #Macro Insights# #BTC Price Analysis#
См. перевод
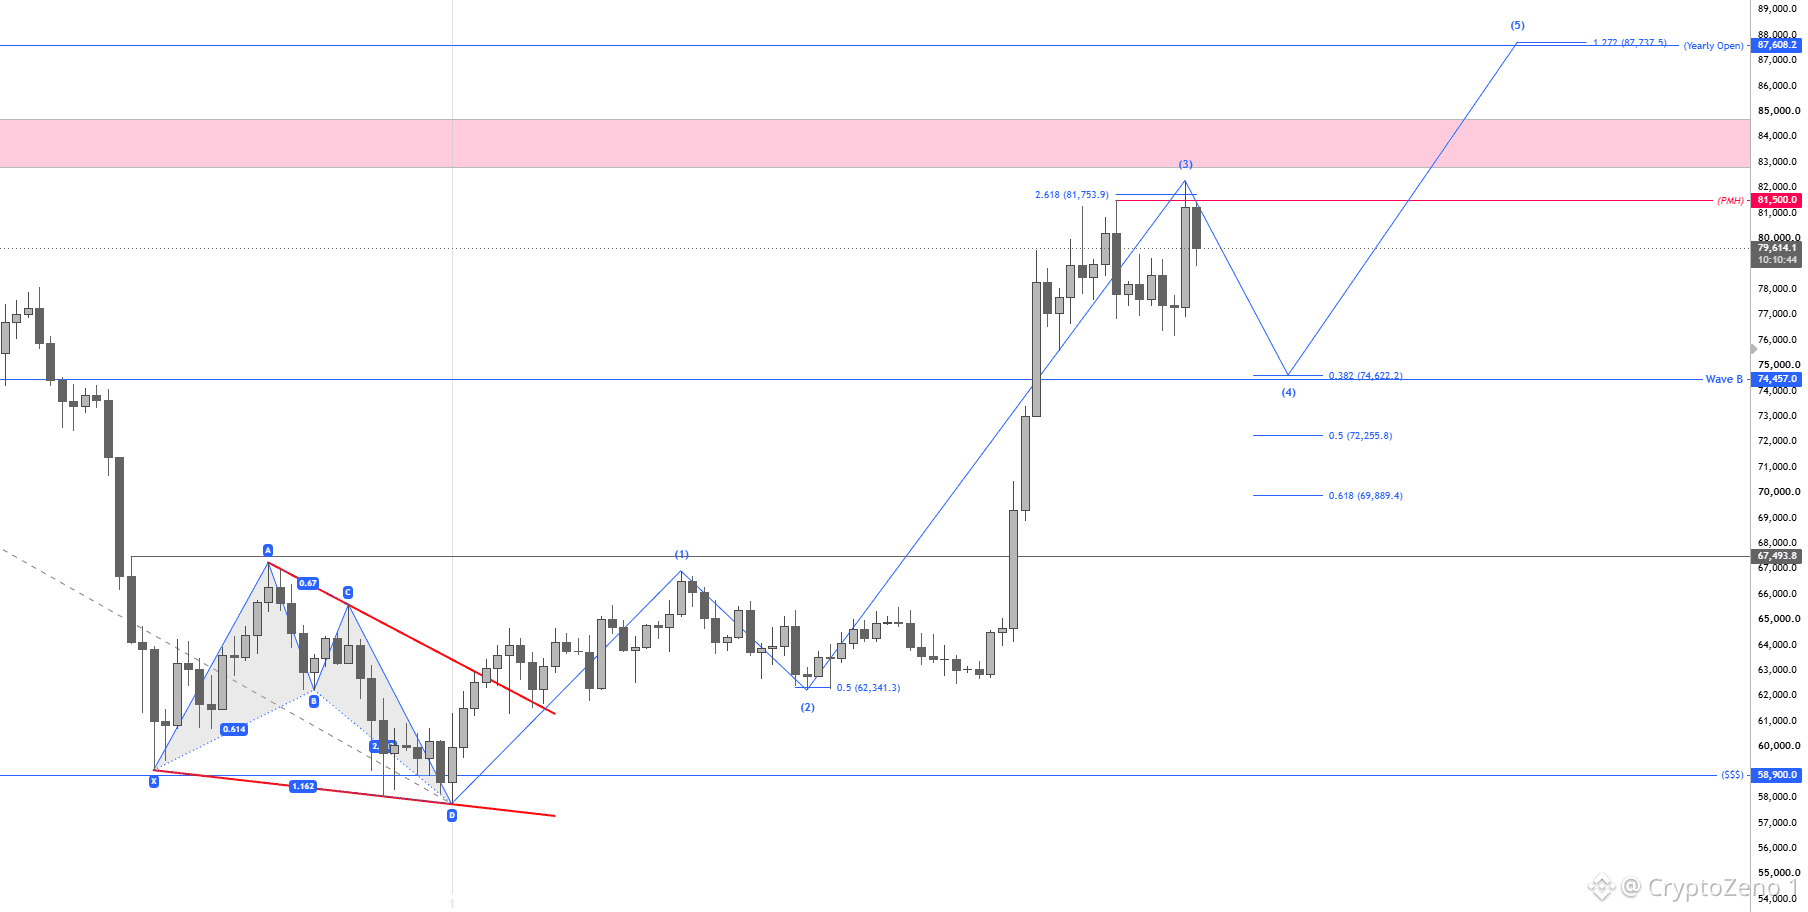
$BTC Plan remains the same...
Our Wave 3 extended to the 2.618 Fib Extension.
We also swept the previous monthly high and then rejected it through a deviation and close back below.
Given that Wave 3 extended a bit further, the Wave 4 levels have also shifted.
The minimum retest level I’m eyeing is now 74.6K, with 72.9K being my maximum downside target for now.
Will keep you all updated if anything changes! #BTC Price Analysis# #Macro Insights# #Altcoin Season#
Our Wave 3 extended to the 2.618 Fib Extension.
We also swept the previous monthly high and then rejected it through a deviation and close back below.
Given that Wave 3 extended a bit further, the Wave 4 levels have also shifted.
The minimum retest level I’m eyeing is now 74.6K, with 72.9K being my maximum downside target for now.
Will keep you all updated if anything changes! #BTC Price Analysis# #Macro Insights# #Altcoin Season#
См. перевод
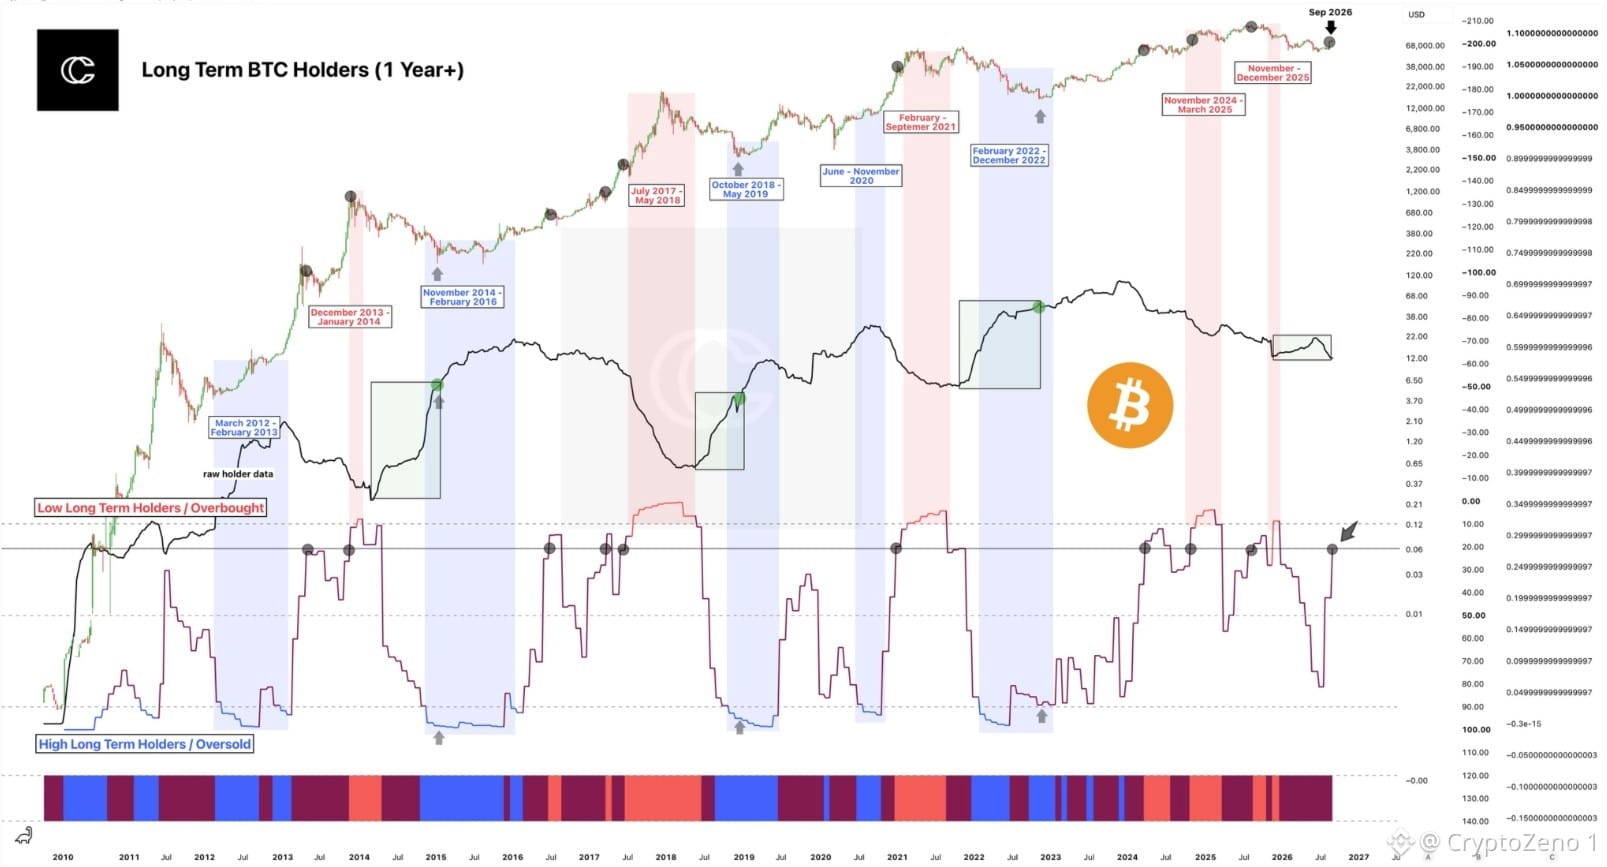
🚨 $BTC LONG TERM HOLDERS ARE SENDING A CYCLE WARNING The historical Long Term BTC Holders 1 Year+ structure is approaching a critical transition zone. The lower oscillator has rebounded sharply from the deep accumulation and oversold region seen during previous cycle bottoms, but the current reading around 0.06 is still well below the historical 0.12+ overbought zone that has repeatedly appeared near major distribution phases. What makes this chart interesting is the timing rather than the absolute level. Across previous Bitcoin cycles, long term holder behavior tends to move through a recognizable sequence: aggressive accumulation creates an oversold extreme, holder conviction rises during the expansion phase, then the indicator eventually reaches the upper distribution zone as older coins begin returning to the market. The current structure suggests #BTC is much further into the cycle than the 2022 accumulation phase, but it has not yet reached the historical long term holder extreme associated with major cycle tops. The upper price structure adds another layer. BTC remains in a high valuation regime while long term holder behavior is no longer at maximum accumulation. That combination historically deserves attention because the market can continue trending higher even while smart money gradually reduces exposure. The key signal is therefore not an immediate top call. If the oscillator continues climbing toward 0.10 to 0.12+, while BTC prints new highs and long term holder supply continues weakening, the probability of entering a mature distribution phase would increase significantly. BTC is getting closer to the zone where holder behavior matters more than price momentum. The next major move in this indicator could determine whether Bitcoin is entering the final acceleration phase or preparing for a broader cycle distribution. #BTC Price Analysis# #Macro Insights#
См. перевод
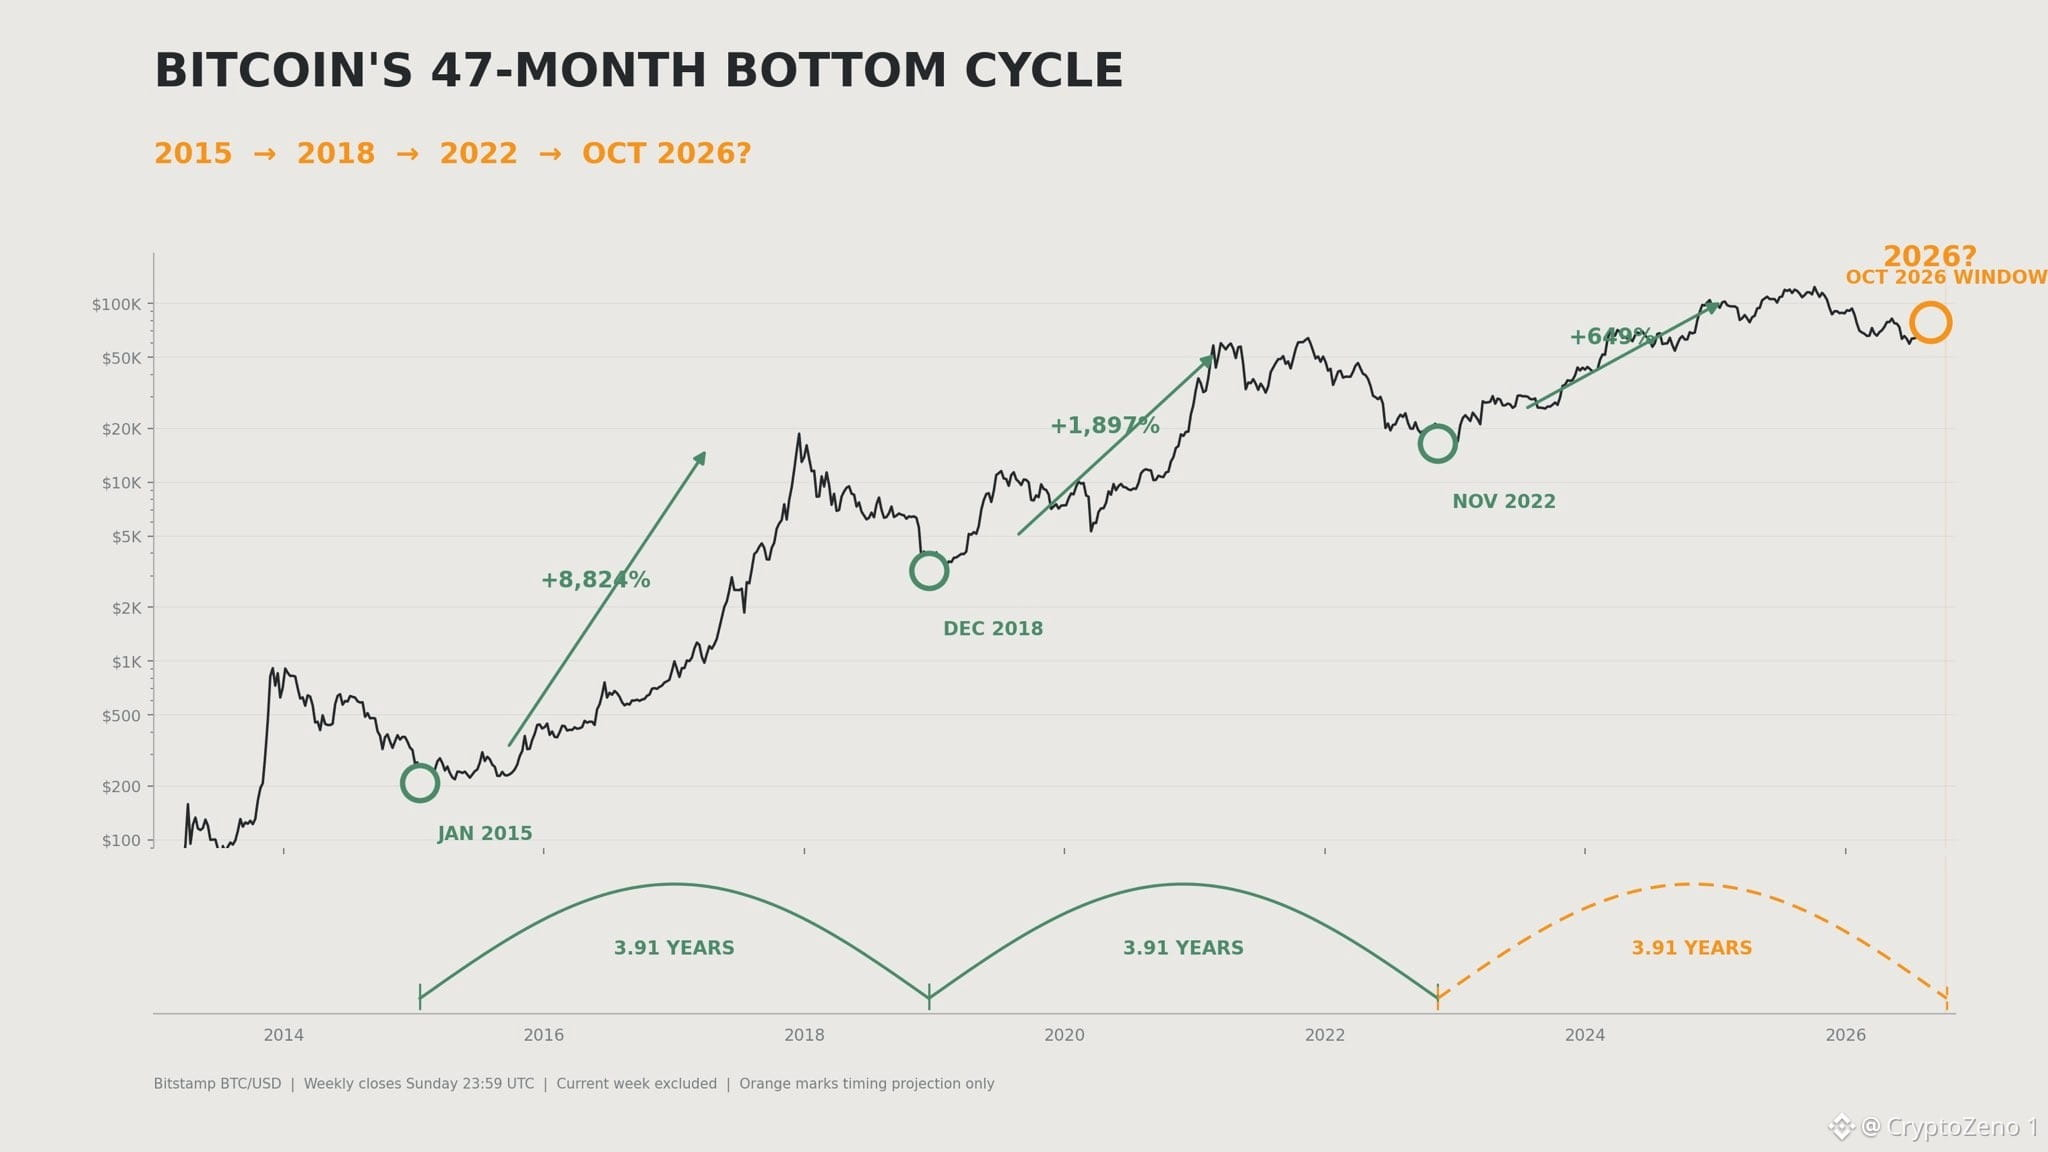
#Bitcoin last two bottom-to-bottom cycles both lasted exactly 1,428 days.
After those cycle lows,
$BTC
rallied:
• 2015: +8,824%
• 2018: +1,897%
• 2022: +649%
That rhythm projects the next timing window into October 2026.
But I don’t think Bitcoin needs to make a new low exactly then. July’s ~$58K may already have been the bottom, or close enough.
Markets front-run obvious cycles. #BTC Price Analysis# #Macro Insights#
After those cycle lows,
$BTC
rallied:
• 2015: +8,824%
• 2018: +1,897%
• 2022: +649%
That rhythm projects the next timing window into October 2026.
But I don’t think Bitcoin needs to make a new low exactly then. July’s ~$58K may already have been the bottom, or close enough.
Markets front-run obvious cycles. #BTC Price Analysis# #Macro Insights#
См. перевод
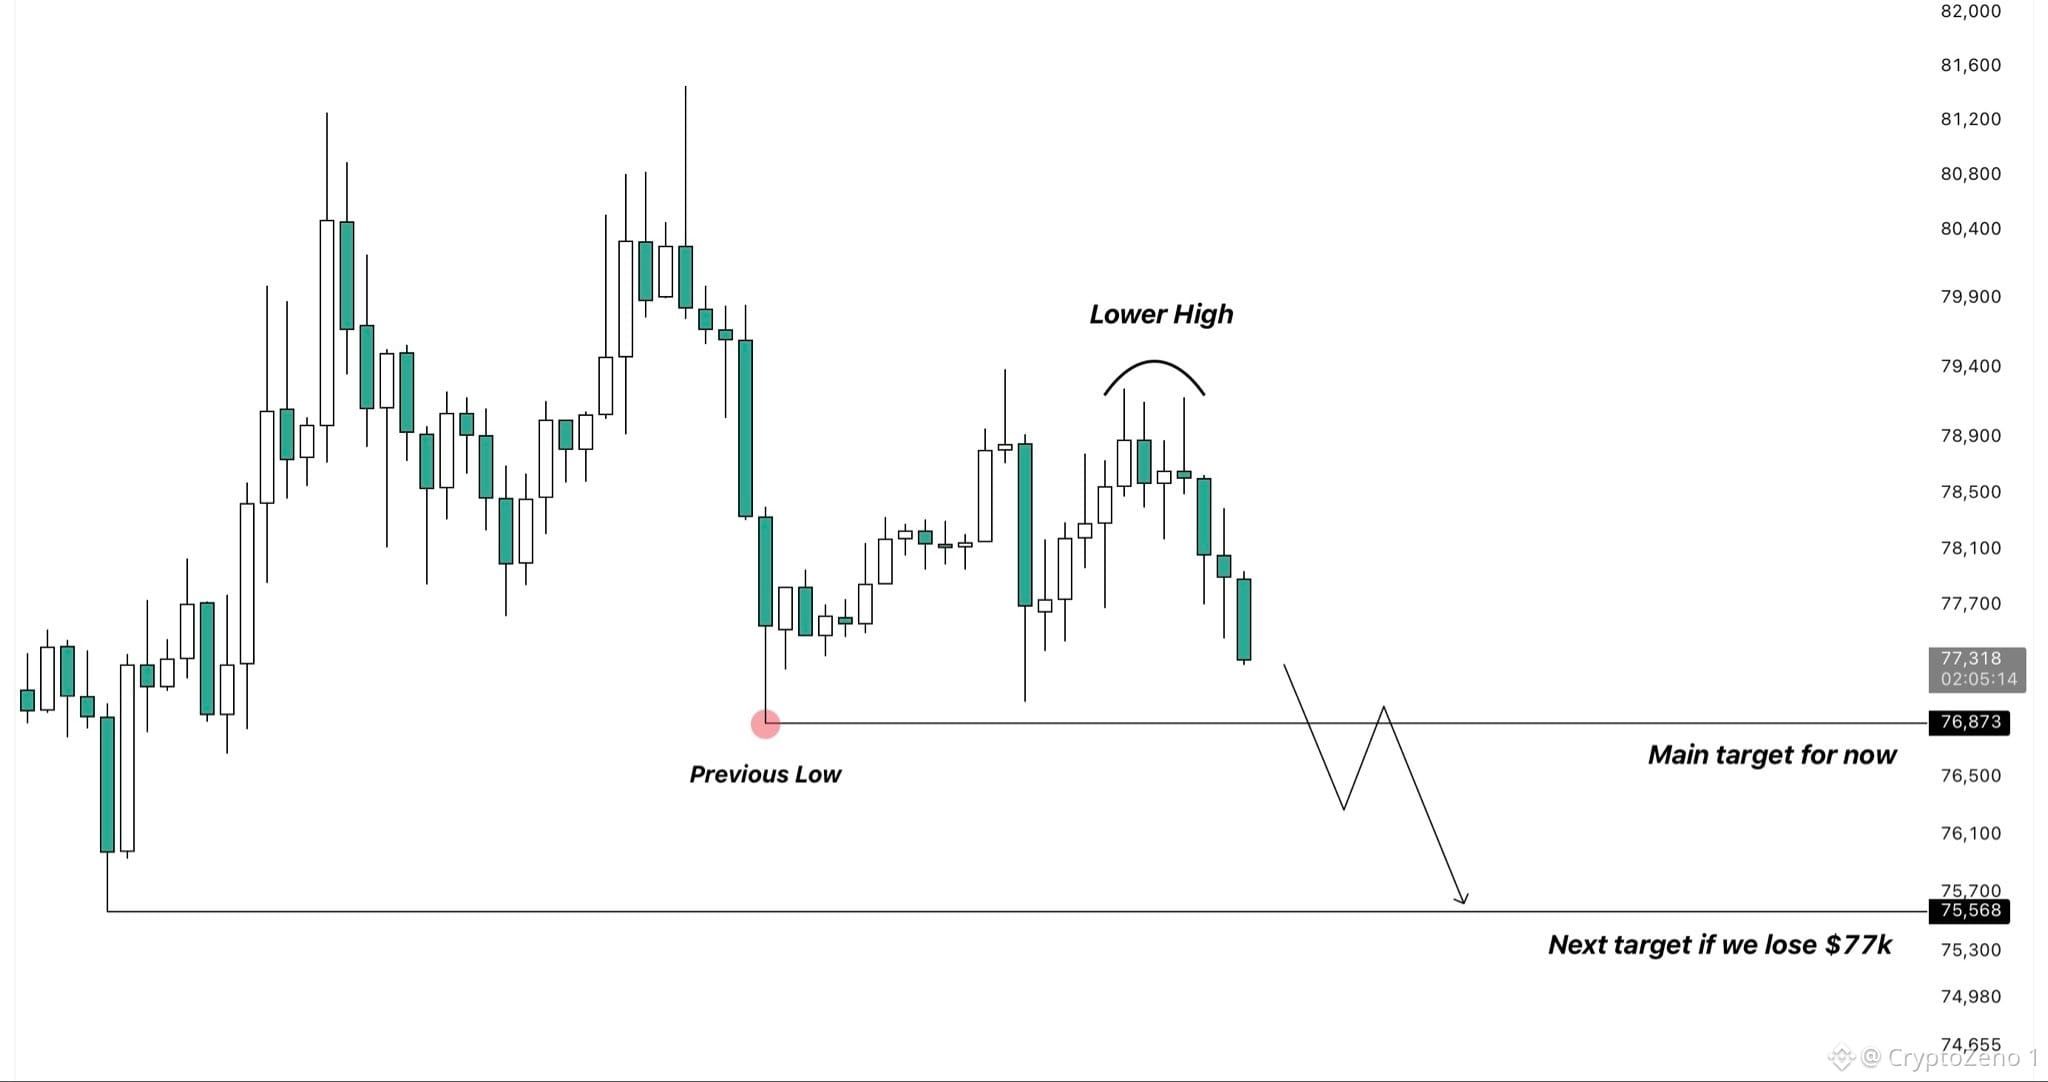
$BTC Structure is starting to look increasingly bearish.
After failing to reclaim the previous high, BTC has now printed a clear lower high and is moving back toward the
recent low around $76.9K.
That level remains my main short-term target for now.
If buyers manage to defend it again, we could see another bounce and would have to reassess from there.
However, if $77K gives way and price finds acceptance below it, I would expect a continuation to the downside to target the remaining low around $75.6K. #BTC Price Analysis# #Macro Insights# #BNBChain#
After failing to reclaim the previous high, BTC has now printed a clear lower high and is moving back toward the
recent low around $76.9K.
That level remains my main short-term target for now.
If buyers manage to defend it again, we could see another bounce and would have to reassess from there.
However, if $77K gives way and price finds acceptance below it, I would expect a continuation to the downside to target the remaining low around $75.6K. #BTC Price Analysis# #Macro Insights# #BNBChain#
См. перевод
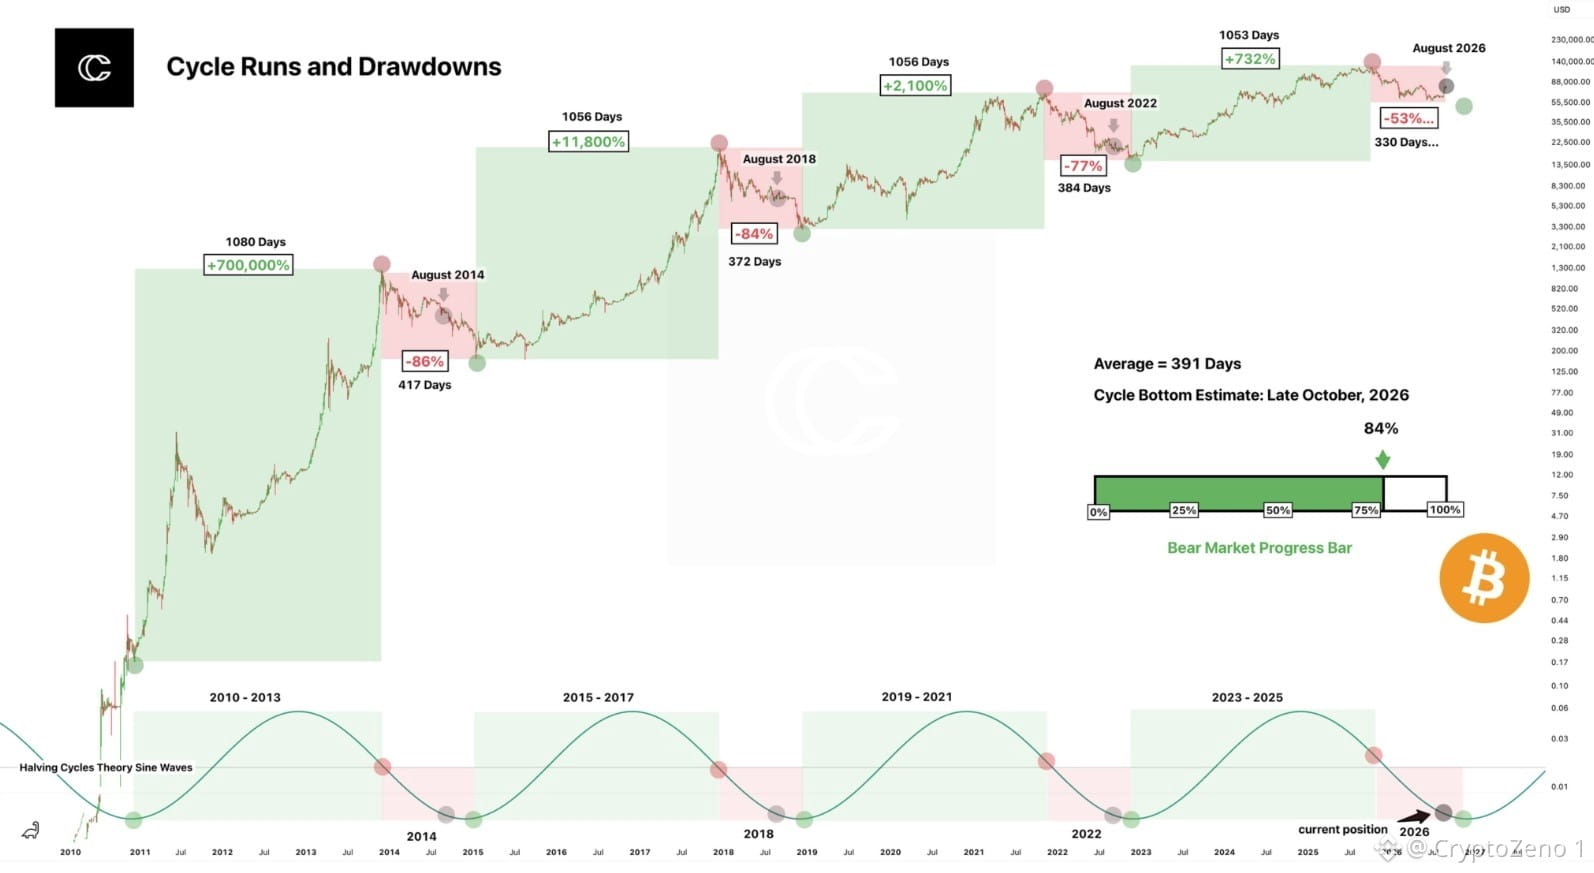
🚨 $BTC Cycle History Is Flashing A Major Warning #Bitcoin may be entering the late stage of a cycle that has historically preceded brutal drawdowns. The chart shows strikingly consistent behavior across previous cycles, with major peaks followed by corrections of roughly 84%, 86%, 77%, and 53%, while the expansion phases repeatedly lasted around 1,050 days. The current cycle has reached approximately 1,053 days, remarkably close to the duration of the previous major expansion phases. If historical timing continues to rhyme, the market may already be transitioning from distribution into a deeper bearish phase, with the chart estimating an average 391 day bear market cycle and a potential bottom around late October 2026. What makes this setup interesting is the combination of cycle duration, historical drawdown structure, and the halving cycle sine wave. The current position appears increasingly aligned with the declining side of the long term cycle, suggesting that BTC may have more downside risk ahead before the next major accumulation phase begins. History does not repeat perfectly, but when multiple independent cycle measurements point toward the same region, ignoring the signal can become expensive. BTC is not necessarily at the bottom yet. The real question may be how much of the bear cycle is still ahead. 📉 #BTC Price Analysis# #Macro Insights#
См. перевод
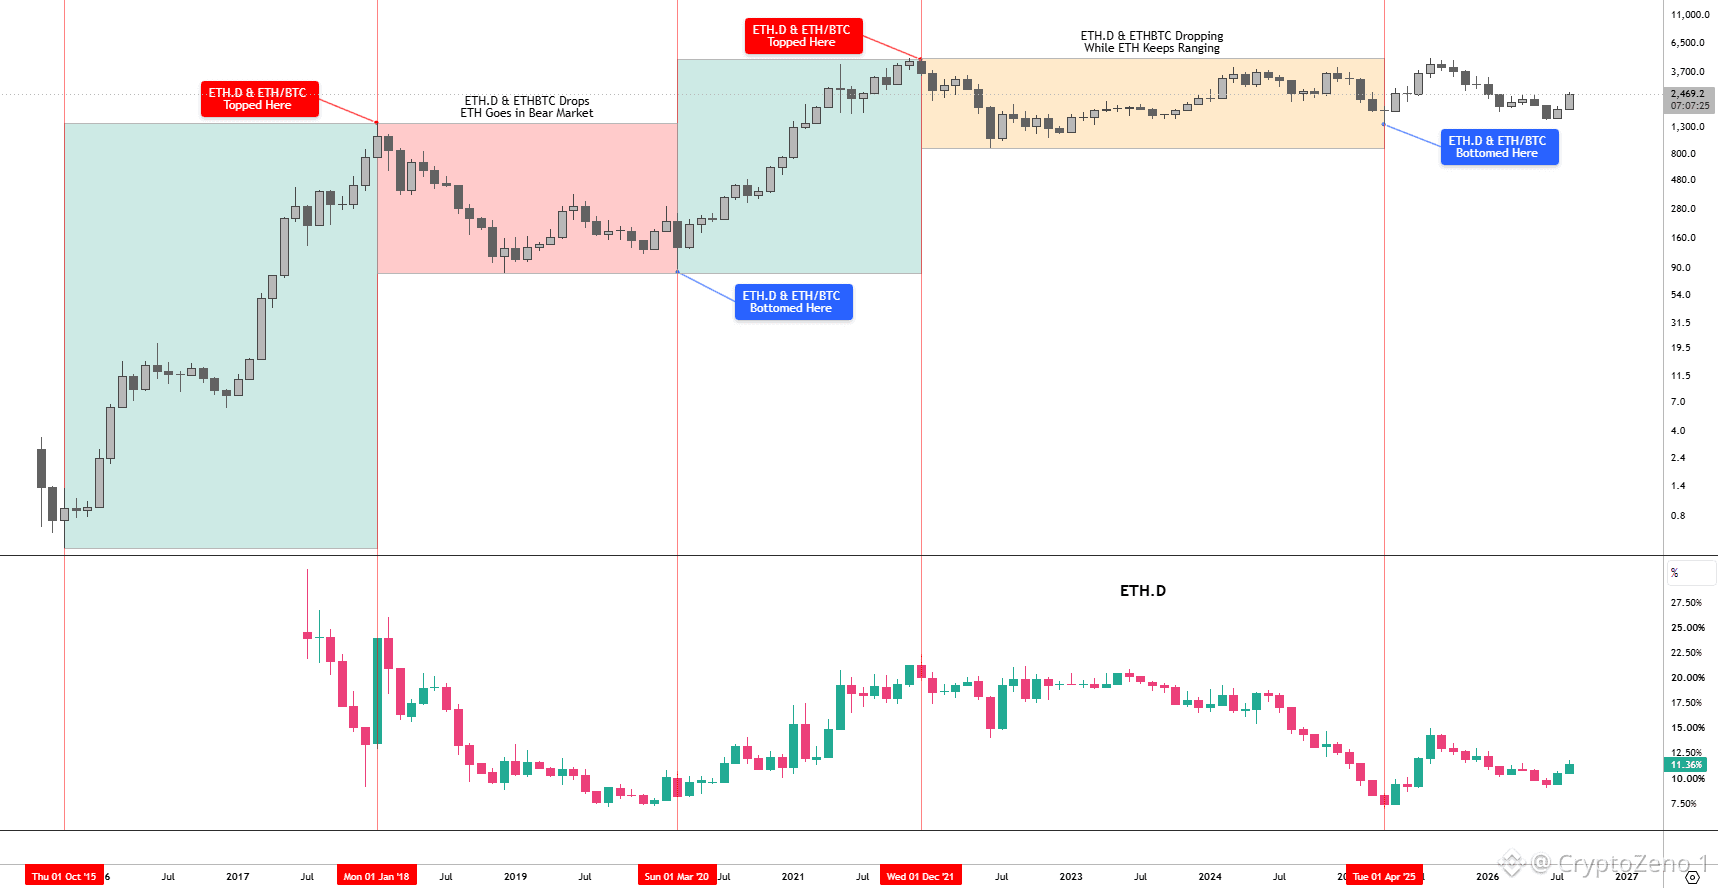
$ETH Underperformed Because ETH.D was Dying.
For the past 4-5 years, ETH.D remained trapped in a persistent downtrend, which was one of the main reasons ETH failed to perform the way it historically has.
But this Cycle's Structure is Different.
ETH.D found its bottom when ETH was trading in the 1300s back in April 2025.
Just 5 months later, ETH went parabolic and swept its previous ATH after 3.5 years.
And that was only a glimpse of what ETH is capable of when ETH.D starts expanding.
More importantly, during this Bear Market, both ETH and ETH.D have created Higher Lows after bottoming in April 2025.
That is a major structural shift and a clear indication that bullish momentum is returning to ETH.
If ETH.D continues gaining strength here, ETH reaching $5k-$7K this cycle is very realistic.
Because when the lows continue to hold, the market eventually starts reaching for the highs.
The stronger ETH.D gets, the more explosive ETH can become. #Macro Insights# #Altcoin Season# #ETH
For the past 4-5 years, ETH.D remained trapped in a persistent downtrend, which was one of the main reasons ETH failed to perform the way it historically has.
But this Cycle's Structure is Different.
ETH.D found its bottom when ETH was trading in the 1300s back in April 2025.
Just 5 months later, ETH went parabolic and swept its previous ATH after 3.5 years.
And that was only a glimpse of what ETH is capable of when ETH.D starts expanding.
More importantly, during this Bear Market, both ETH and ETH.D have created Higher Lows after bottoming in April 2025.
That is a major structural shift and a clear indication that bullish momentum is returning to ETH.
If ETH.D continues gaining strength here, ETH reaching $5k-$7K this cycle is very realistic.
Because when the lows continue to hold, the market eventually starts reaching for the highs.
The stronger ETH.D gets, the more explosive ETH can become. #Macro Insights# #Altcoin Season# #ETH
См. перевод
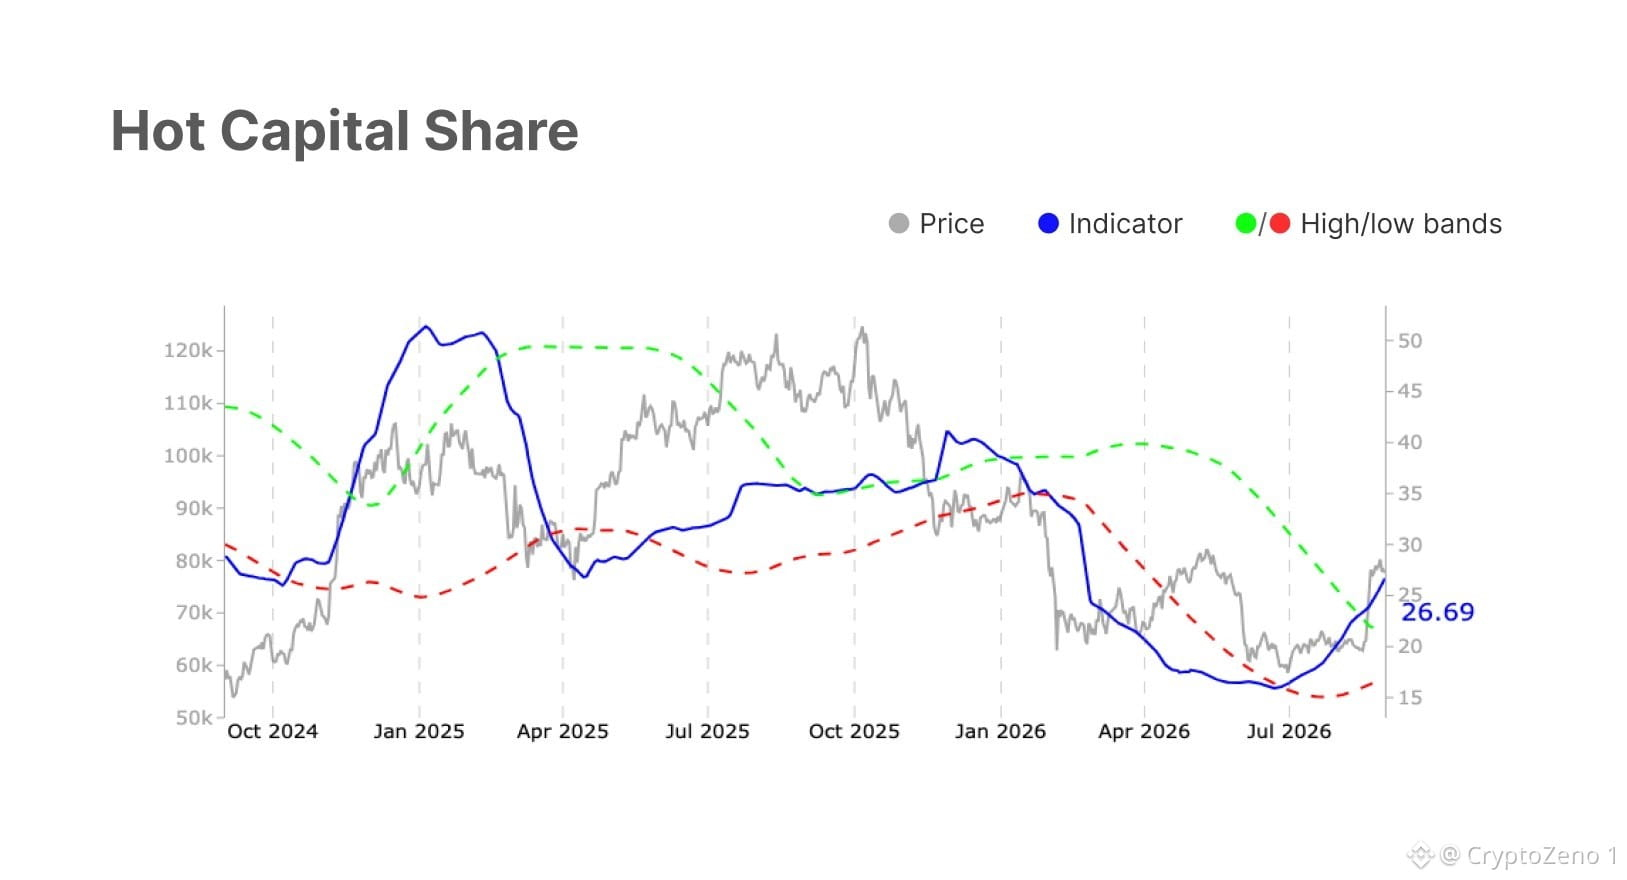
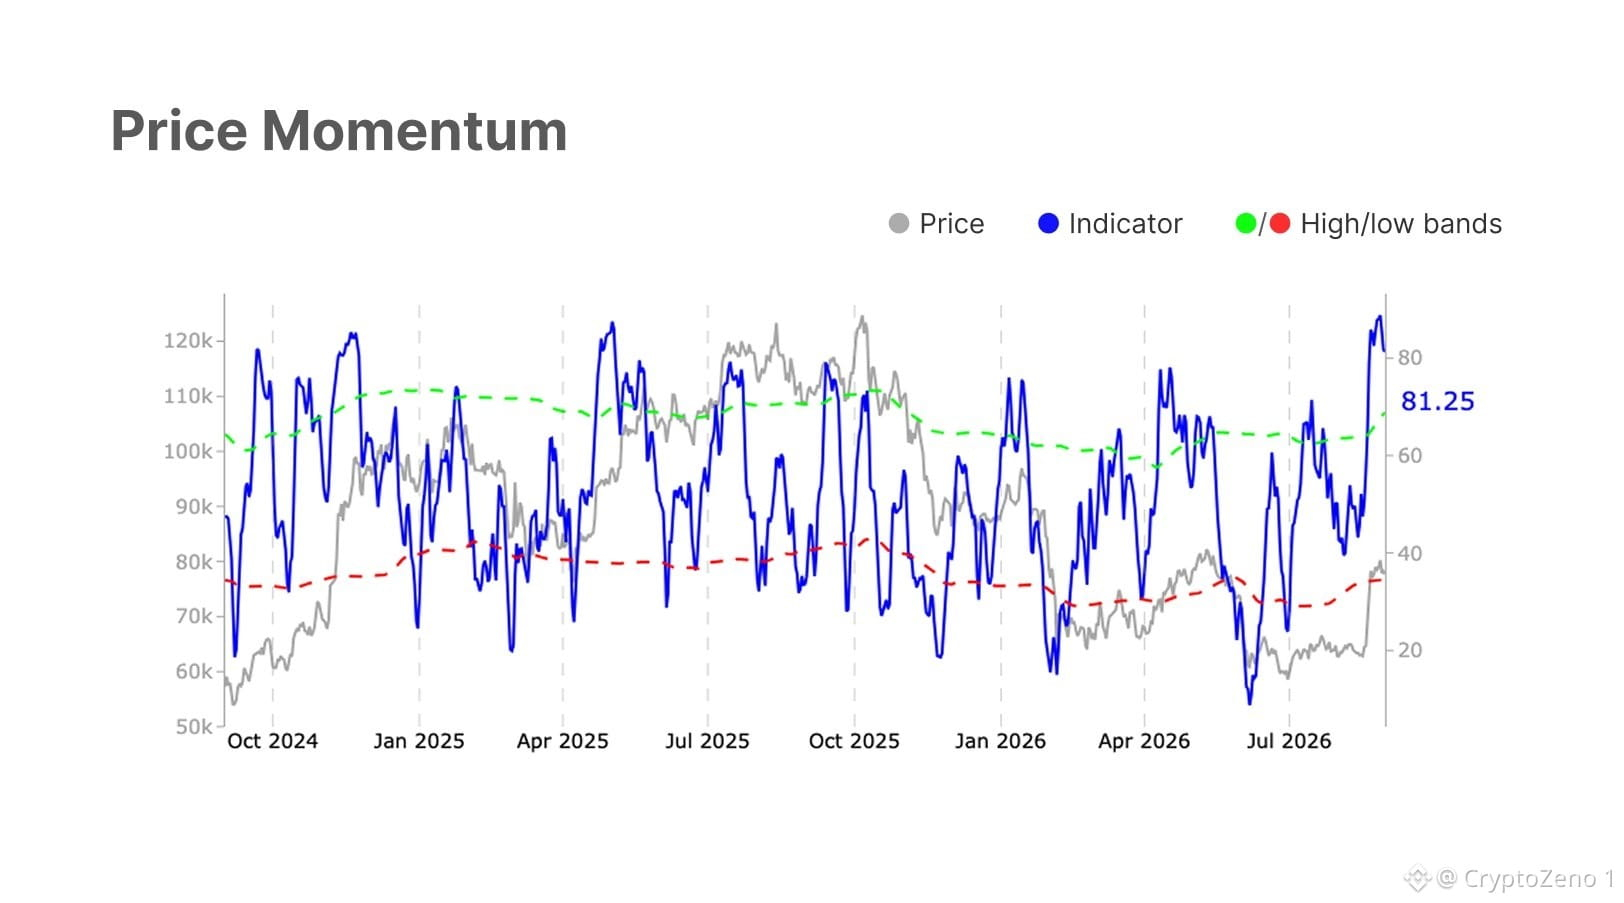
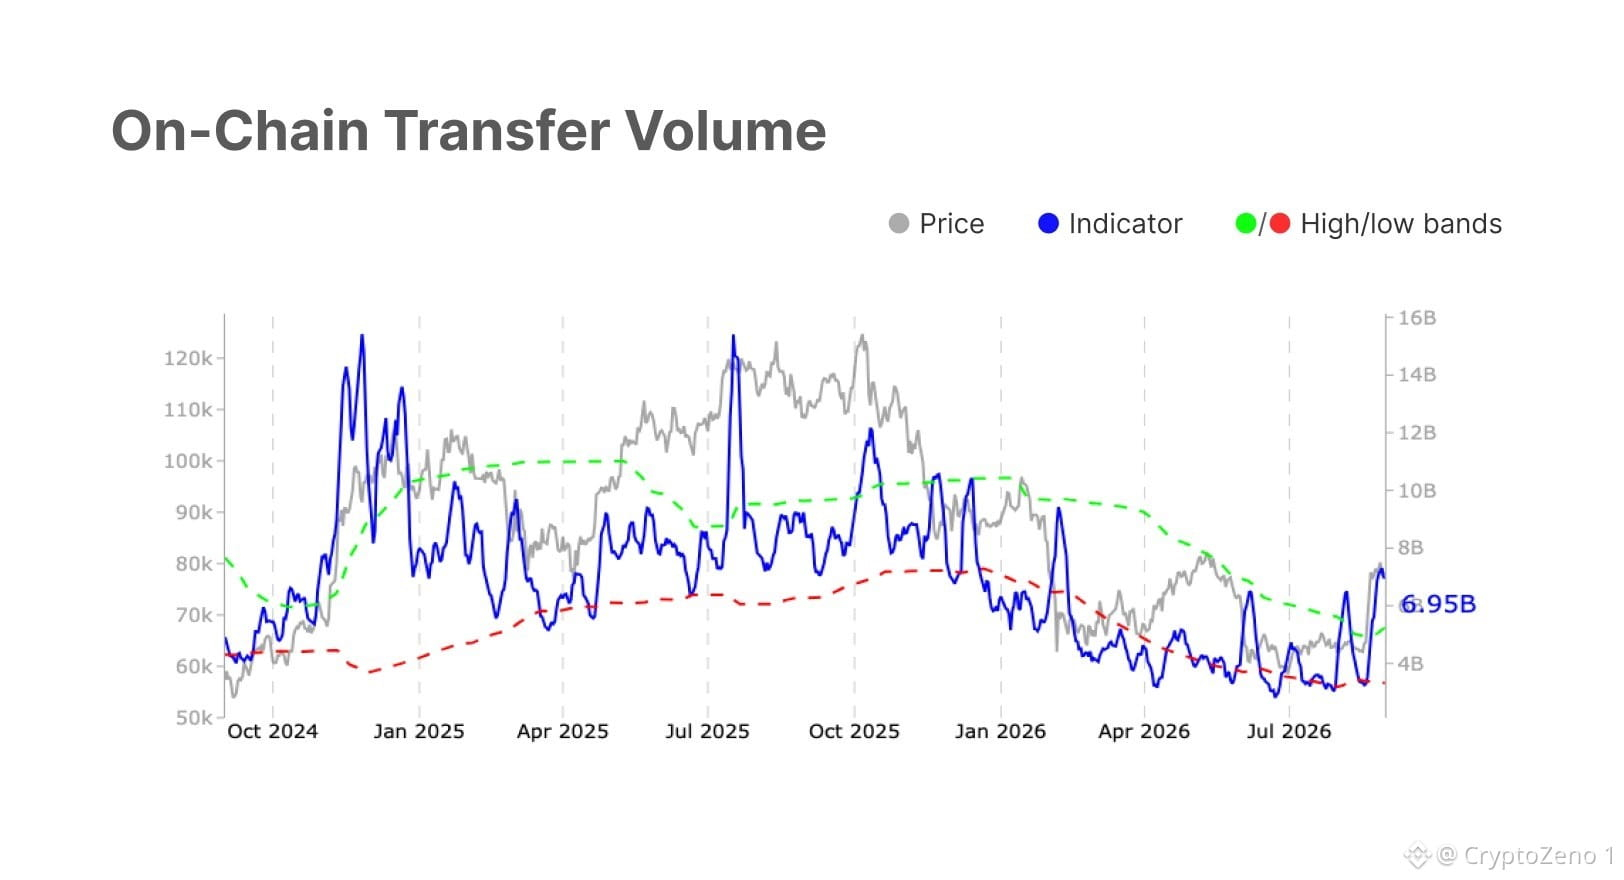
$BTC
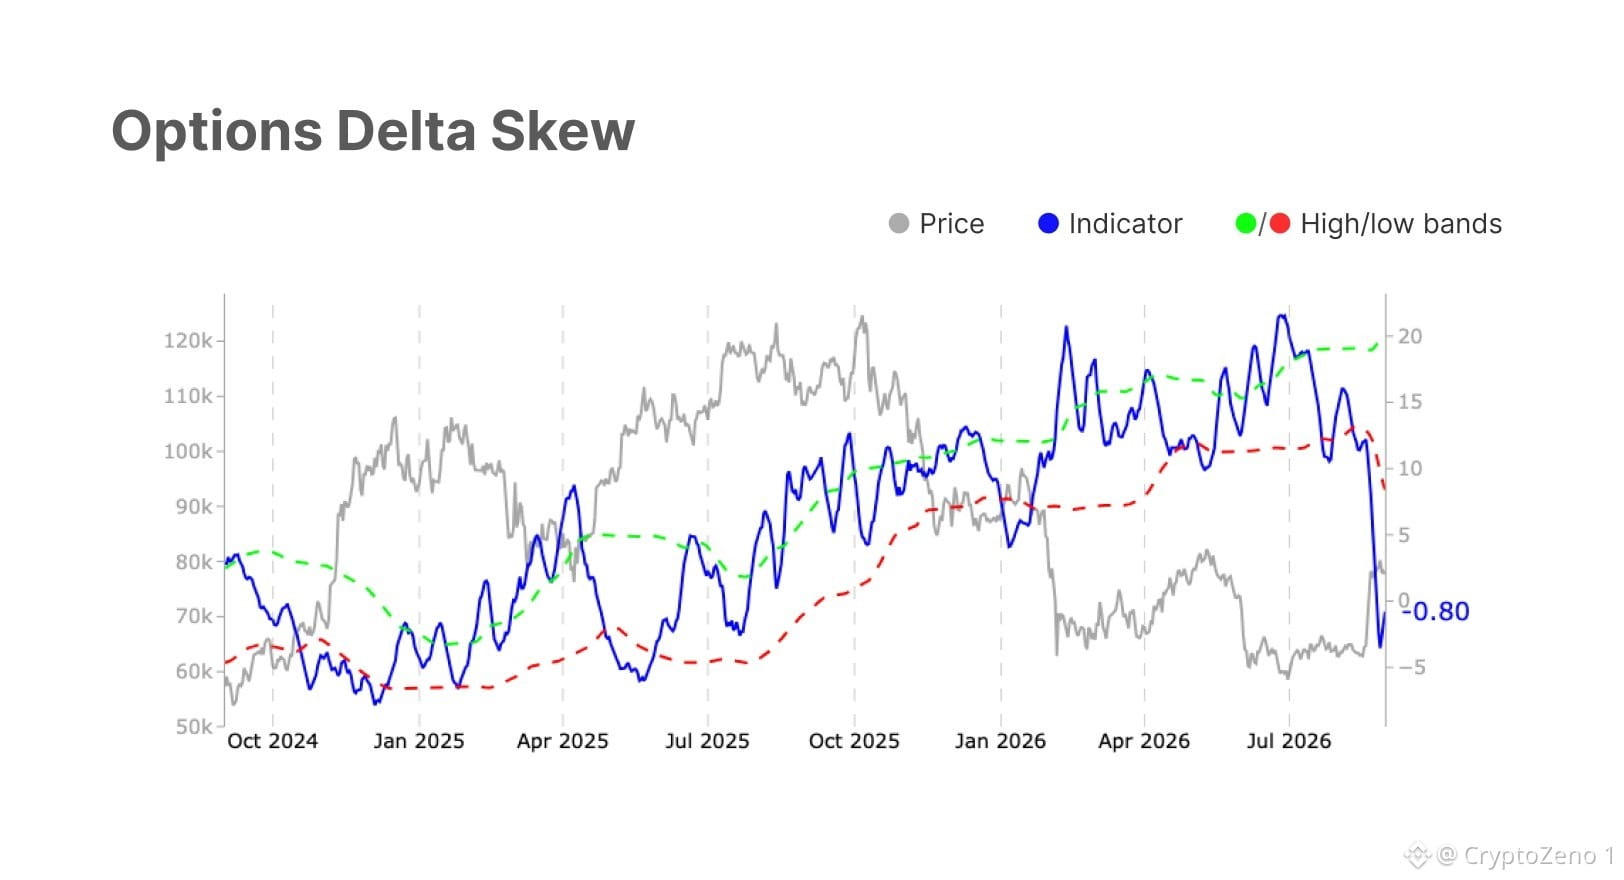
holds near $78,300 after rallying from $64k lows. Institutional inflows stay strong, but rising leverage, tight volatility spreads, and softening retail activity point to a cautious, transitional market. #BTC Price Analysis# #Macro Insights#
holds near $78,300 after rallying from $64k lows. Institutional inflows stay strong, but rising leverage, tight volatility spreads, and softening retail activity point to a cautious, transitional market. #BTC Price Analysis# #Macro Insights#
См. перевод
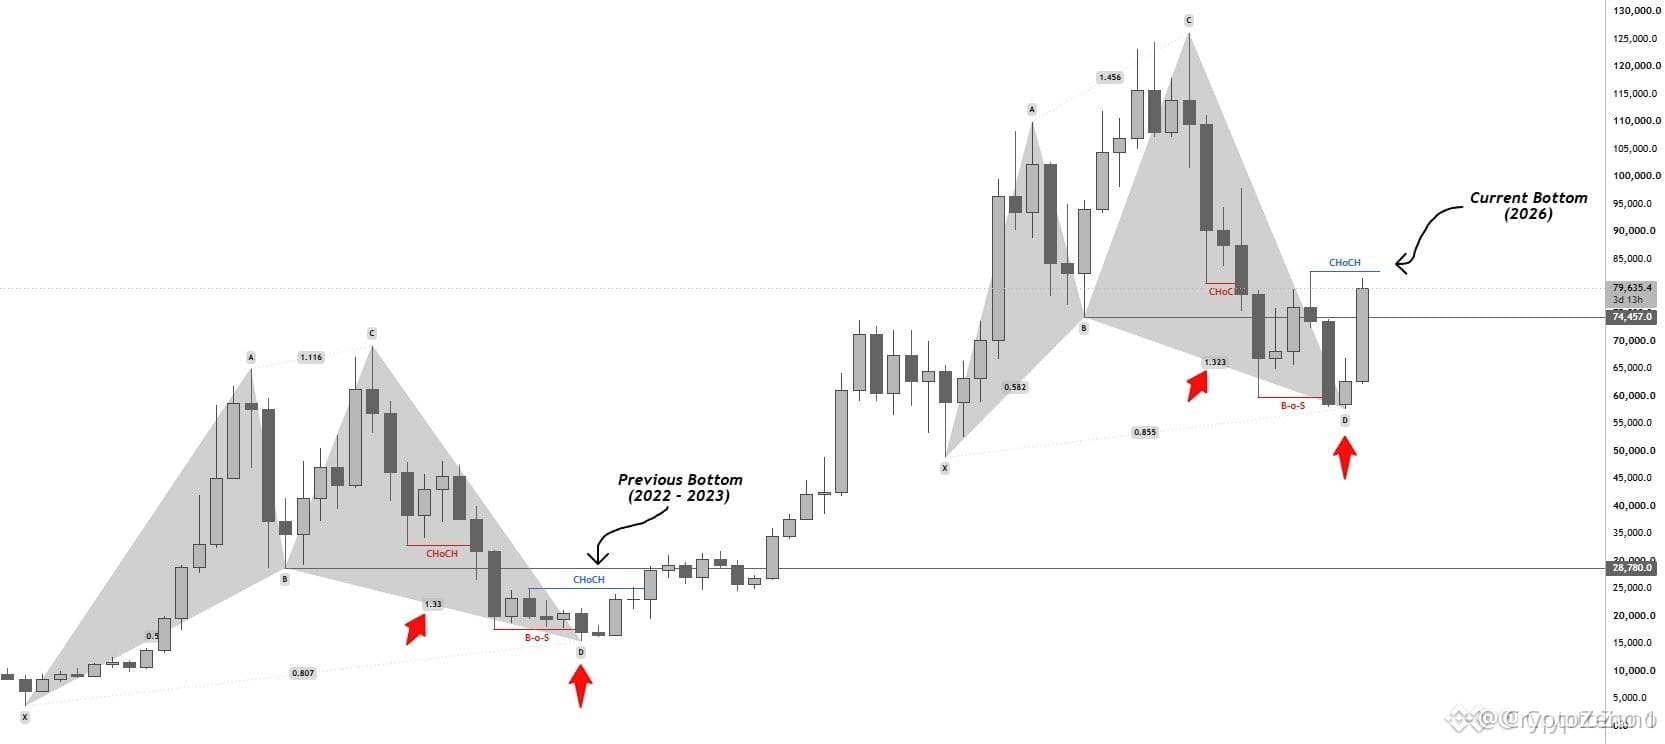
$BTC Same Structure. Same Bottom.
Yet people made the same mistake they’ve made EVERY. SINGLE. TIME we get a dip.
They waited for lower.
Suddenly, everyone had a new reason why Bitcoin was going to 54K.
Funny how that works. #BTC Price Analysis# #Macro Insights# #Altcoin Season#
Yet people made the same mistake they’ve made EVERY. SINGLE. TIME we get a dip.
They waited for lower.
Suddenly, everyone had a new reason why Bitcoin was going to 54K.
Funny how that works. #BTC Price Analysis# #Macro Insights# #Altcoin Season#
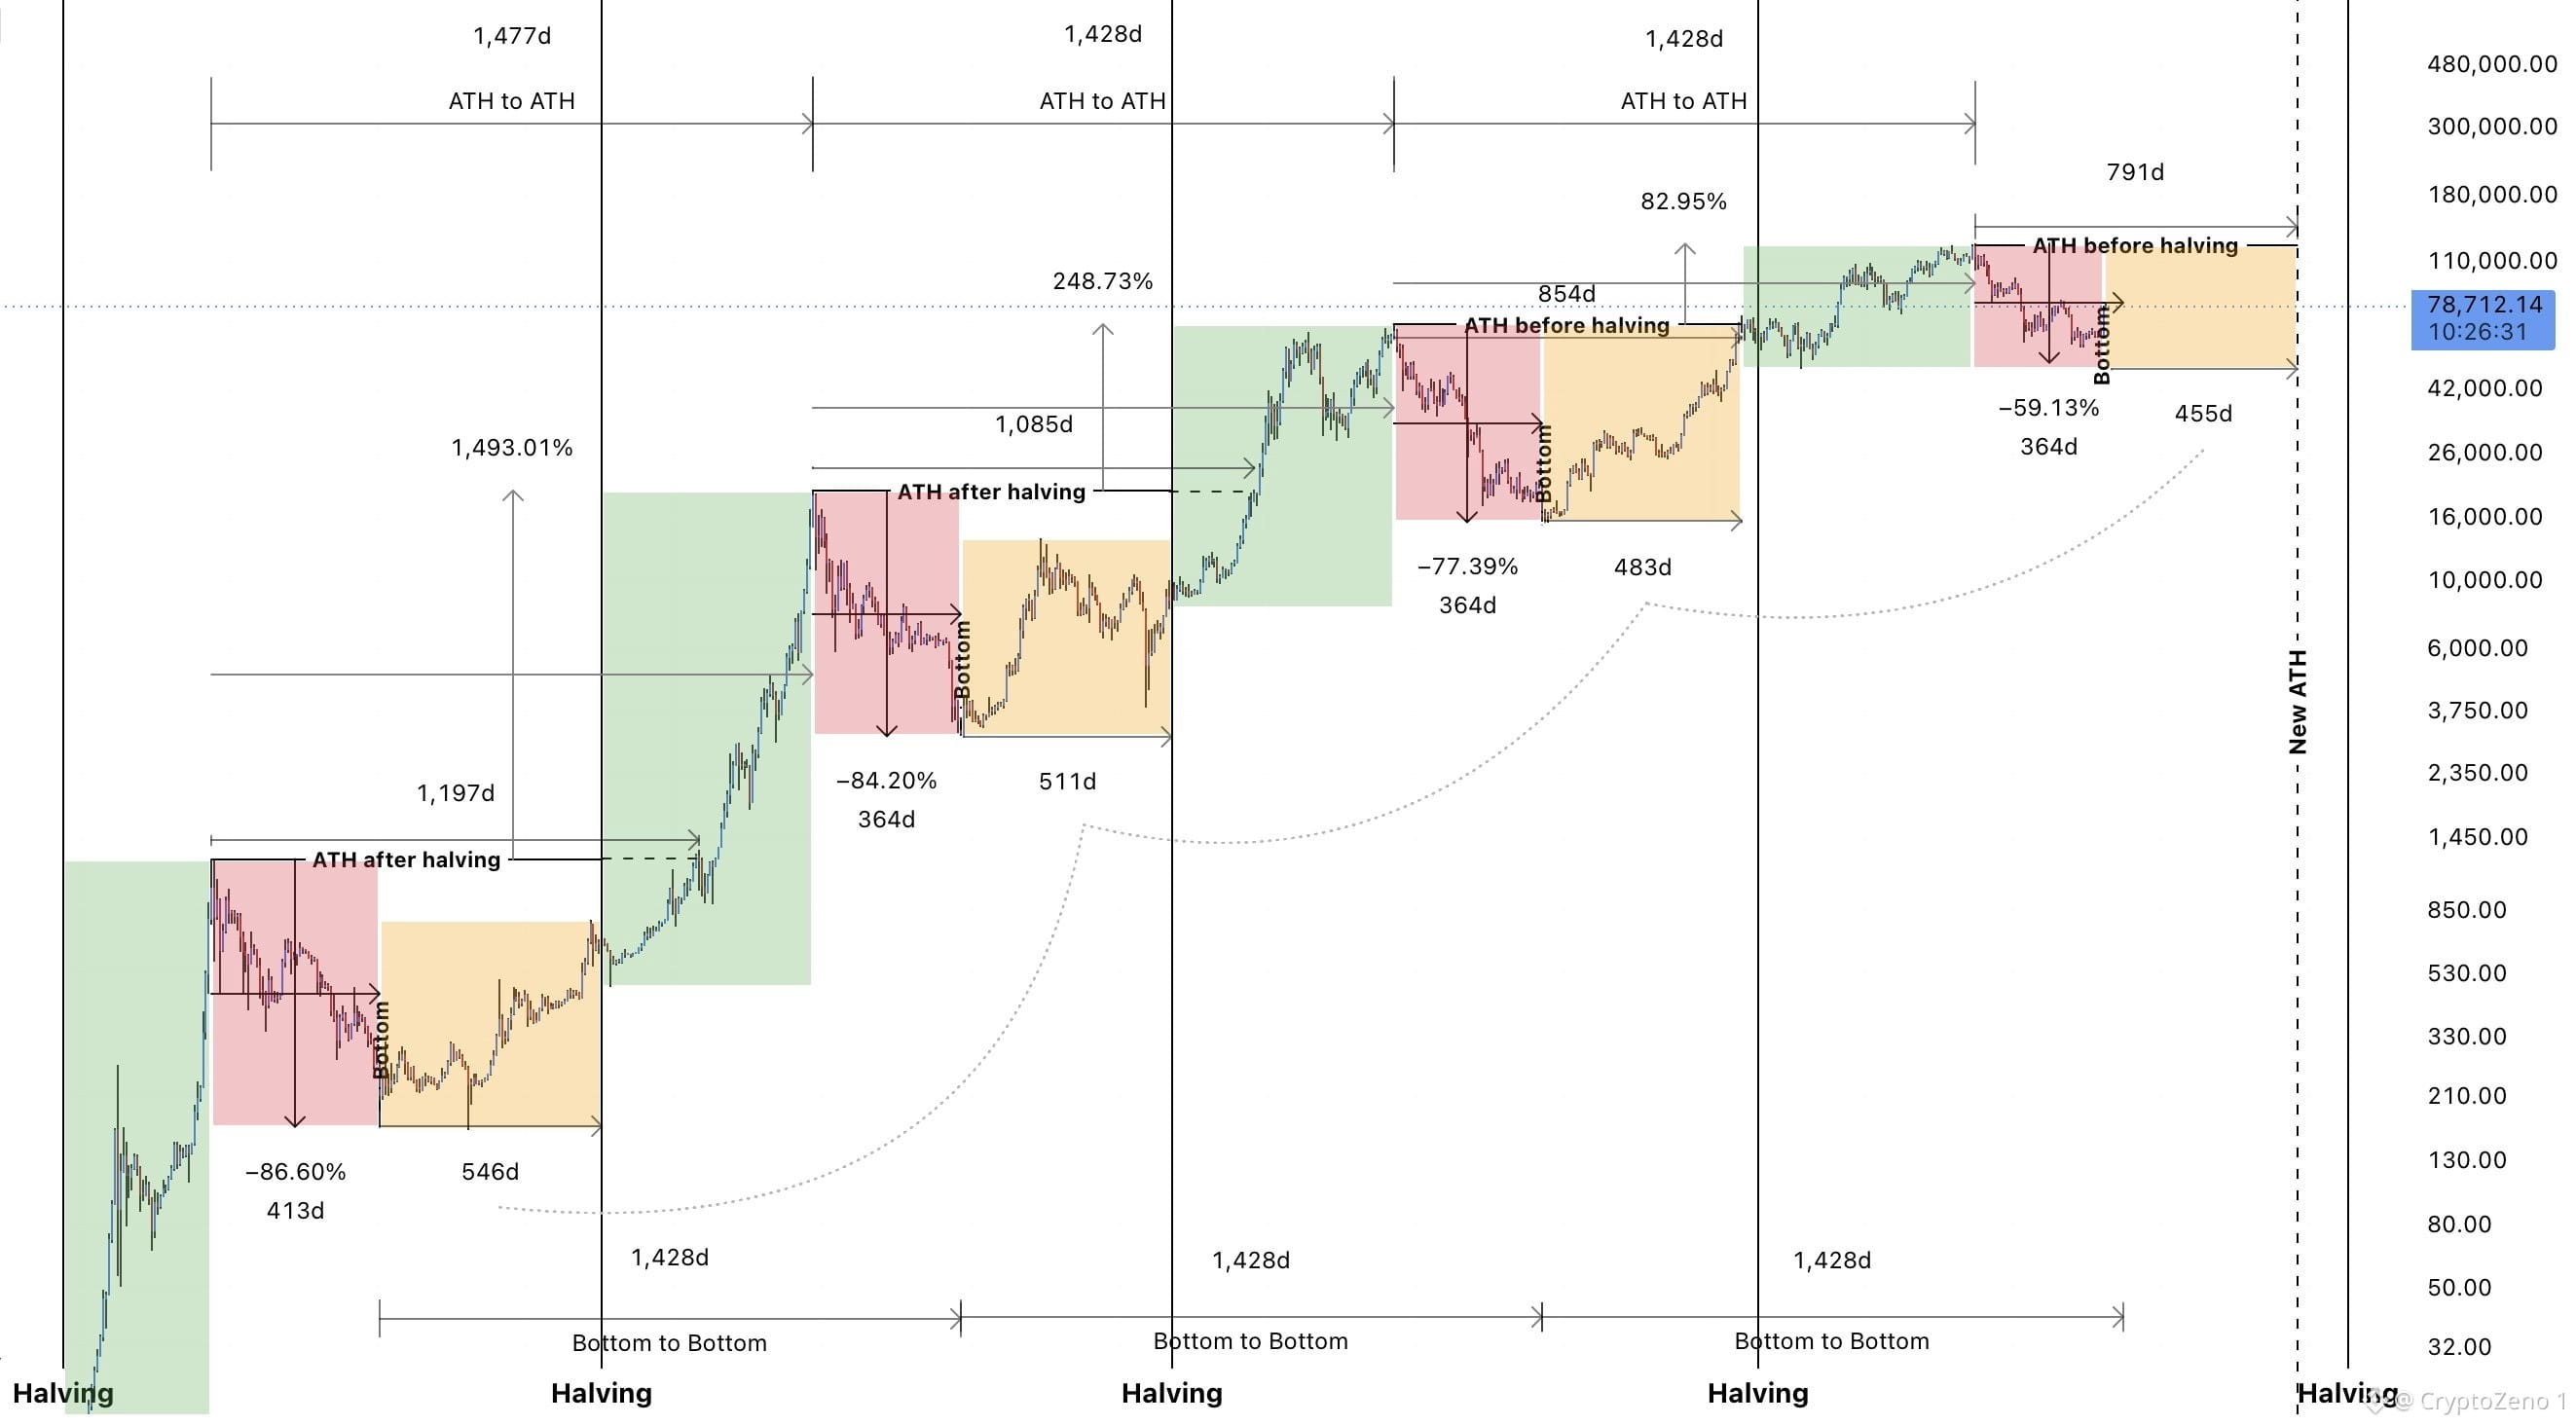
$BTC Новый ATH примерно за 455 дней.
Q4 2027.⏳
Дно медвежьего рынка уже позади. Циклы продолжают развиваться и с каждым разом ускоряются, что делает новый ATH до халвинга весьма вероятным.
Сейчас цена входит в оранжевую фазу, которая исторически отмечала начало бычьего рынка, и каждый откат следует покупать.
Более высокие минимумы. Более высокие максимумы. Не открывайте шорты. #BTC Price Analysis# #Macro Insights#
Q4 2027.⏳
Дно медвежьего рынка уже позади. Циклы продолжают развиваться и с каждым разом ускоряются, что делает новый ATH до халвинга весьма вероятным.
Сейчас цена входит в оранжевую фазу, которая исторически отмечала начало бычьего рынка, и каждый откат следует покупать.
Более высокие минимумы. Более высокие максимумы. Не открывайте шорты. #BTC Price Analysis# #Macro Insights#
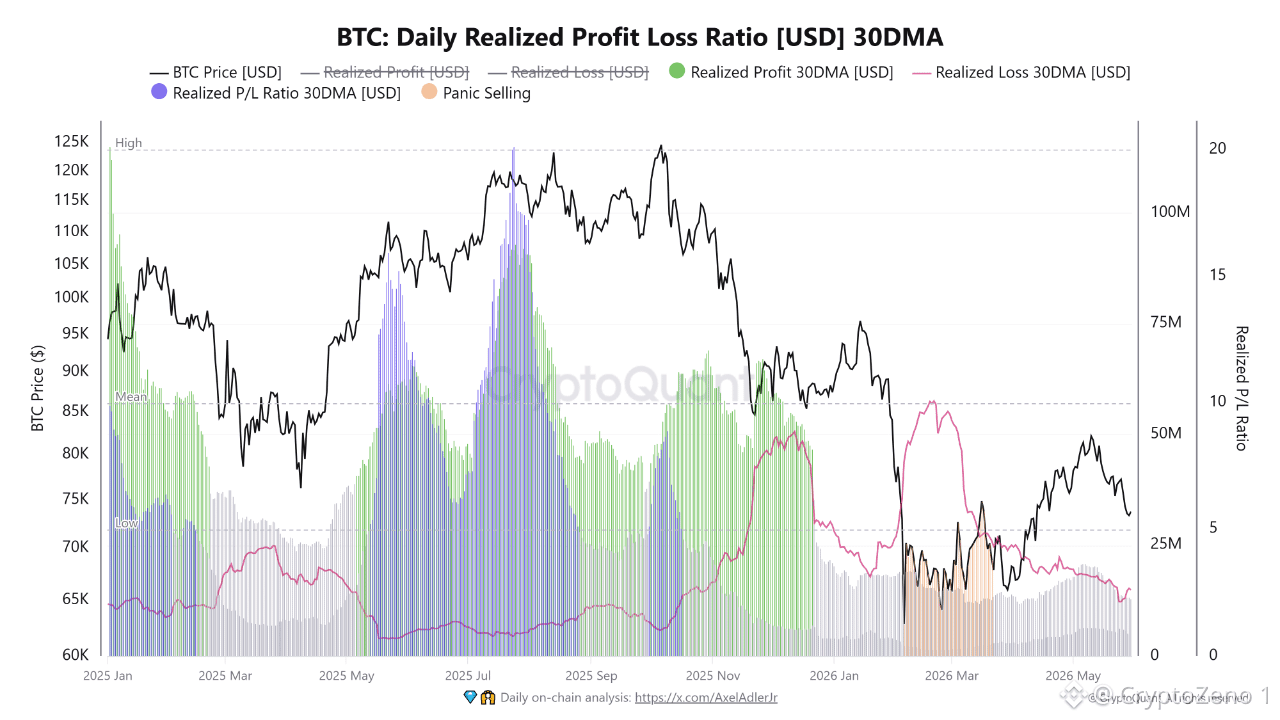
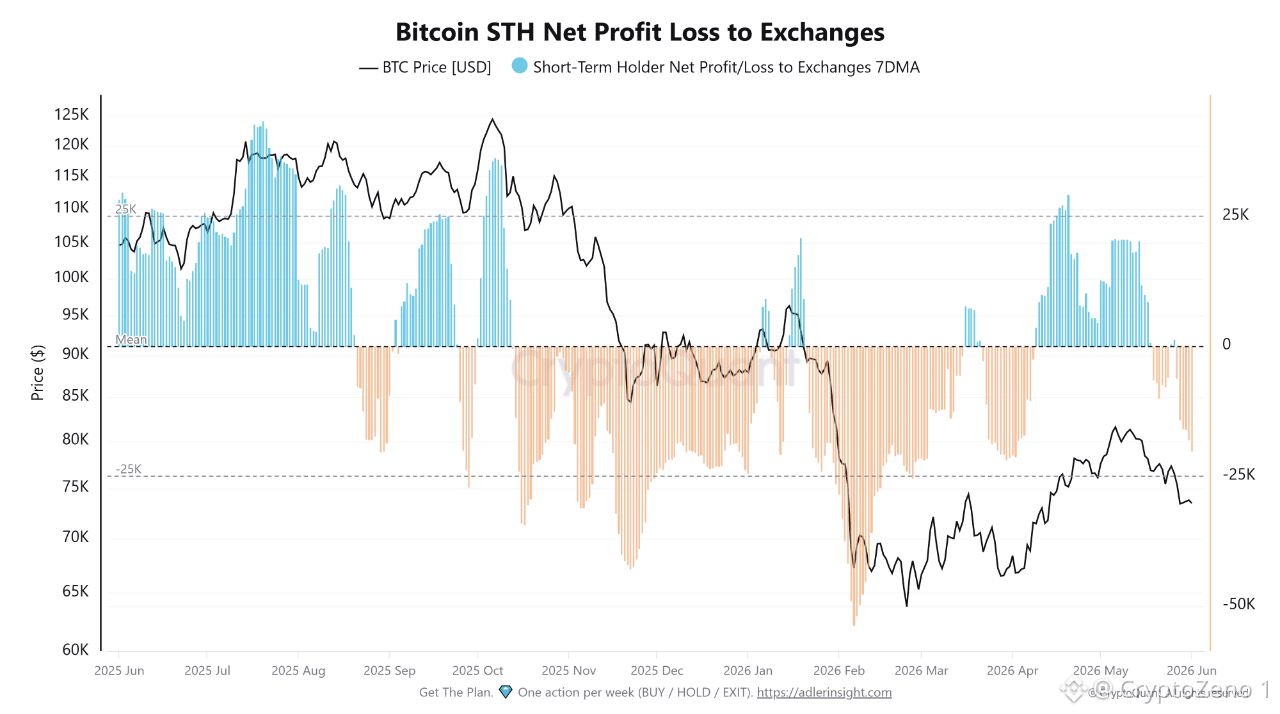
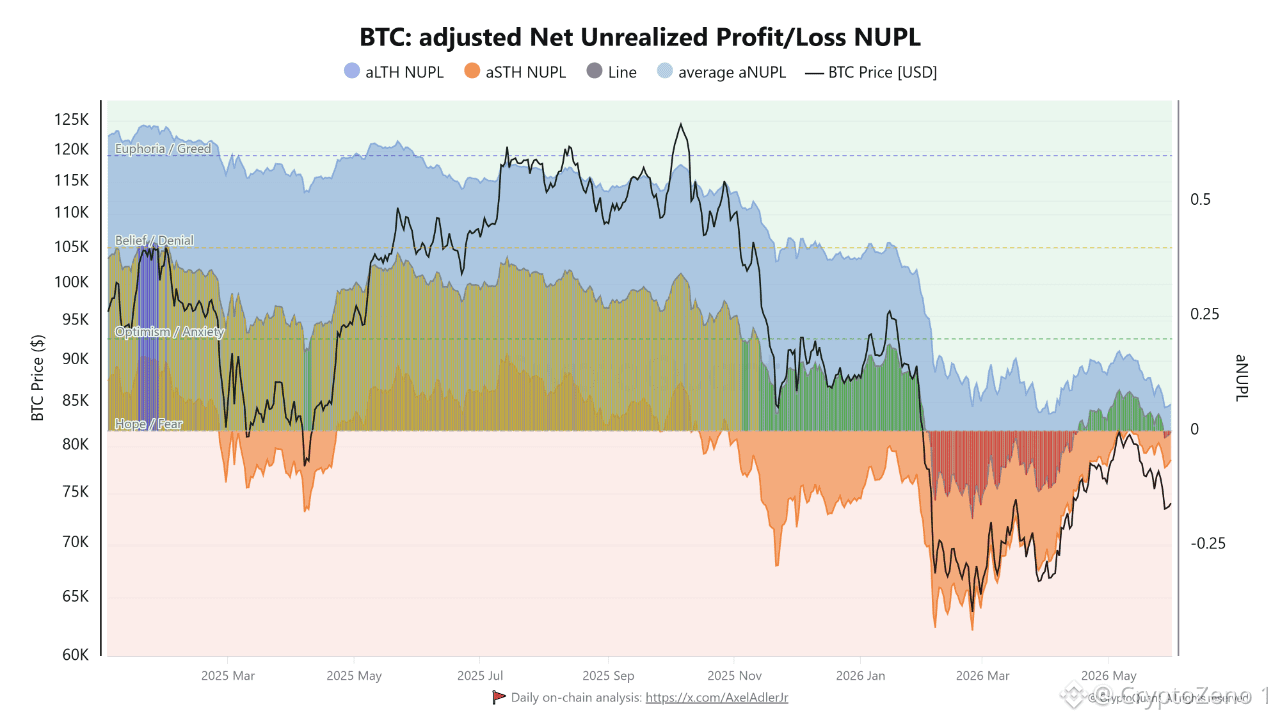
$BTC сталкивается с тихим «сбросом», поскольку краткосрочные держатели поглощают растущие убытки. Недавние данные on-chain указывают на то, что #Bitcoin проходит период сжатия прибыли, а не на прямую капитуляцию. Метрика Short-Term Holder Net Profit/Loss to Exchanges снова ушла в отрицательную зону, что означает: многие новые инвесторы фиксируют убытки при переводе монет на биржи. Это отражает ослабление уверенности после того, как последняя попытка восстановления не смогла сформировать более сильный восходящий тренд. Однако реализованные убытки все еще значительно ниже экстремальных уровней, которые обычно наблюдаются рядом с крупными дном цикла. Соотношение Realized Profit/Loss Ratio (30DMA) рассказывает похожую историю. Реализованные убытки по-прежнему превышают реализованную прибыль, показывая, что участники рынка все чаще принимают убытки, а не ждут более выгодных точек выхода. Тем не менее текущая структура отличается от исторических панических событий. Вместо внезапной волны вынужденных продаж данные указывают на постепенный процесс перераспределения предложения, когда более слабые участники снижают экспозицию со временем. Между тем, скорректированный NUPL подчеркивает растущее давление на краткосрочных держателей. aSTH NUPL остается ниже нуля, помещая недавних покупателей в позицию нереализованного убытка. Одновременно общая прибыльность сети стабильно снижается по сравнению с оптимистичными условиями, наблюдавшимися во время предыдущего роста. В совокупности это говорит о том, что настроение заметно охладилось, даже если рынок пока не достиг той глубокой пессимистичности, которая часто ассоциируется с завершающими фазами капитуляции. Эти индикаторы описывают рынок, проходящий здоровый «рестарт». Краткосрочные держатели реализуют убытки, нереализованная прибыль сокращается, а спекулятивные излишки выводятся из системы. Хотя условия on-chain остаются хрупкими, данные пока не показывают тот тип экстремального стресса, который исторически отмечал окончательные точки минимума цикла. #Анализ цены BTC# #Макро-выводы#
#$BTC по-прежнему не может вернуть Бычий OB на 4H.
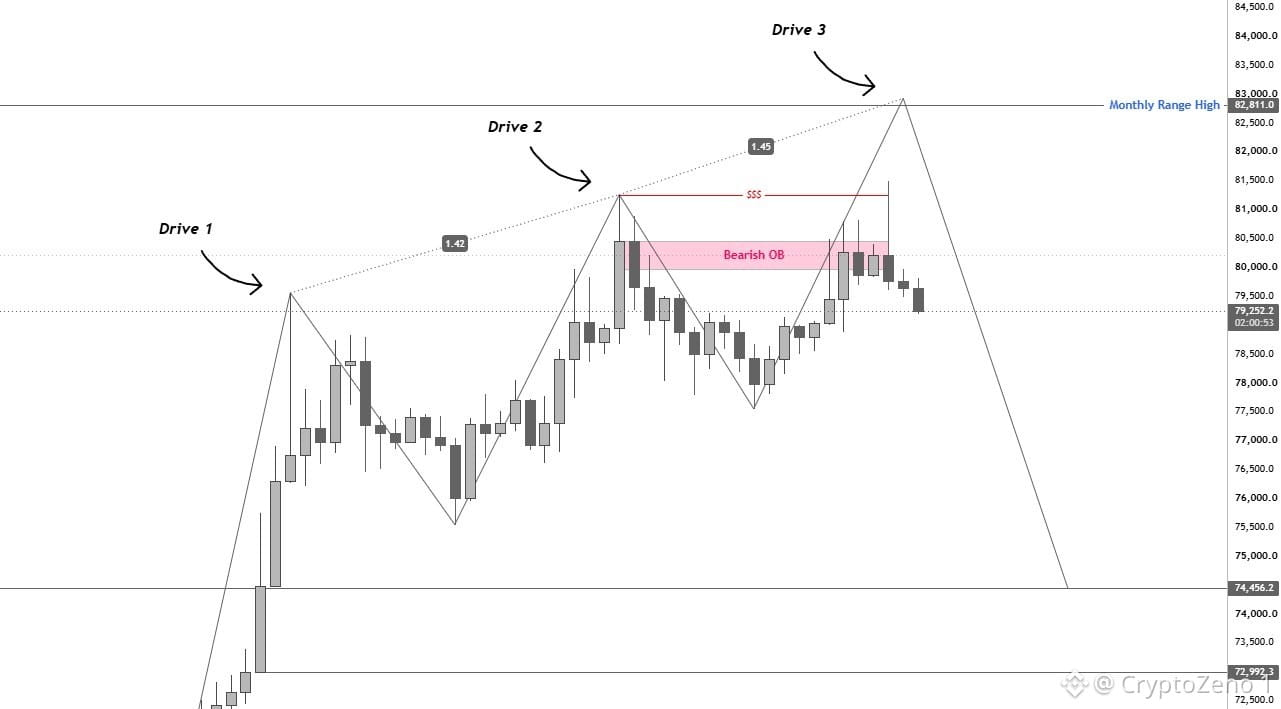
Ранее сегодня мы увидели снос текущих максимумов, за которым последовал довольно сильный отбой, и теперь кажется, что медведи начинают брать контроль отсюда.
Предварительное перехватывание ликвидности на Предыдущем Месячном Диапазоне Максимум (82,8K) тоже было бы неудивительно.
Здесь многие поздние лонги попадут в ловушку, а привычные сетапы «сместить максимумы и шортить» в итоге окажутся разыграны раньше.
Я знаю, что все ожидают, что 82,8K будет задет прежде чем начнётся хоть сколько-нибудь значимый уход вниз, и именно поэтому я бы не удивился, если рынок сделает наоборот.
POI в сторону понижения остаётся тем же.
Жду, пока цена коснётся этой зоны, чтобы я смог триггернуть Краткосрочный Свинг Лонг оттуда и добавить оставшиеся 30% в мой Spot Bag.
Пусть поздние лонги обеспечат ликвидность. #BTC Price Analysis# #Macro Insights#
Ранее сегодня мы увидели снос текущих максимумов, за которым последовал довольно сильный отбой, и теперь кажется, что медведи начинают брать контроль отсюда.
Предварительное перехватывание ликвидности на Предыдущем Месячном Диапазоне Максимум (82,8K) тоже было бы неудивительно.
Здесь многие поздние лонги попадут в ловушку, а привычные сетапы «сместить максимумы и шортить» в итоге окажутся разыграны раньше.
Я знаю, что все ожидают, что 82,8K будет задет прежде чем начнётся хоть сколько-нибудь значимый уход вниз, и именно поэтому я бы не удивился, если рынок сделает наоборот.
POI в сторону понижения остаётся тем же.
Жду, пока цена коснётся этой зоны, чтобы я смог триггернуть Краткосрочный Свинг Лонг оттуда и добавить оставшиеся 30% в мой Spot Bag.
Пусть поздние лонги обеспечат ликвидность. #BTC Price Analysis# #Macro Insights#
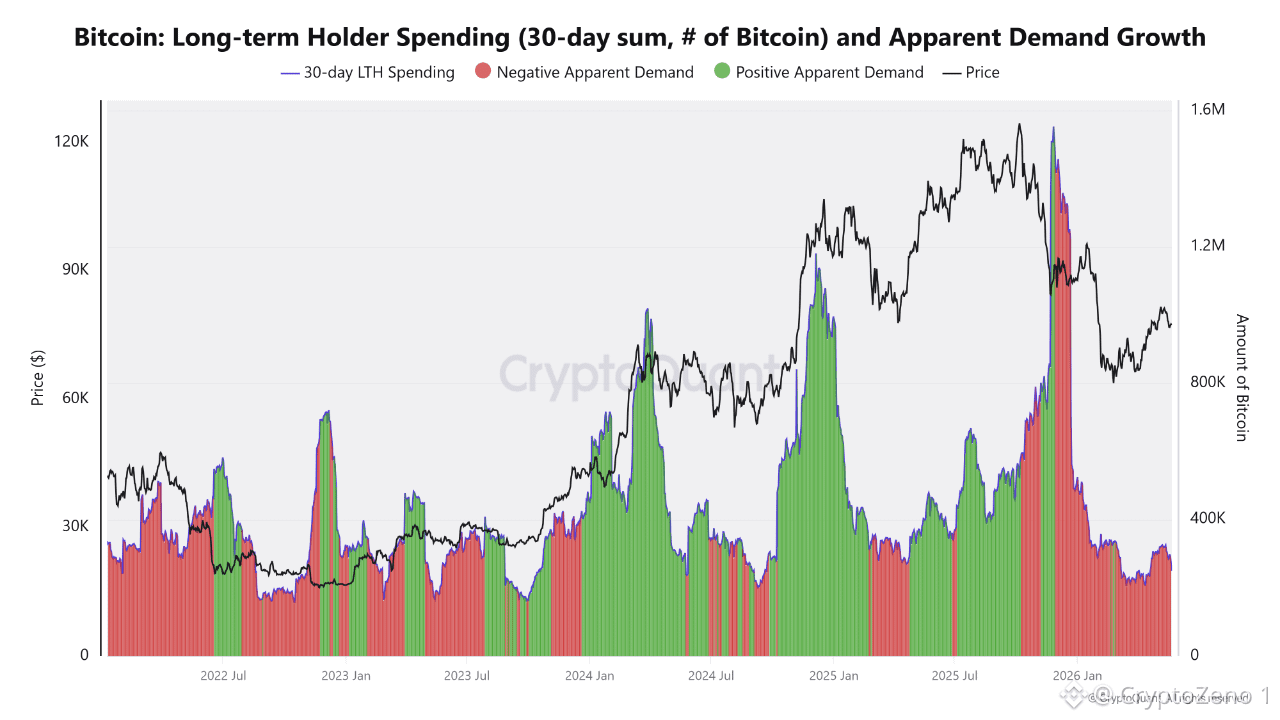
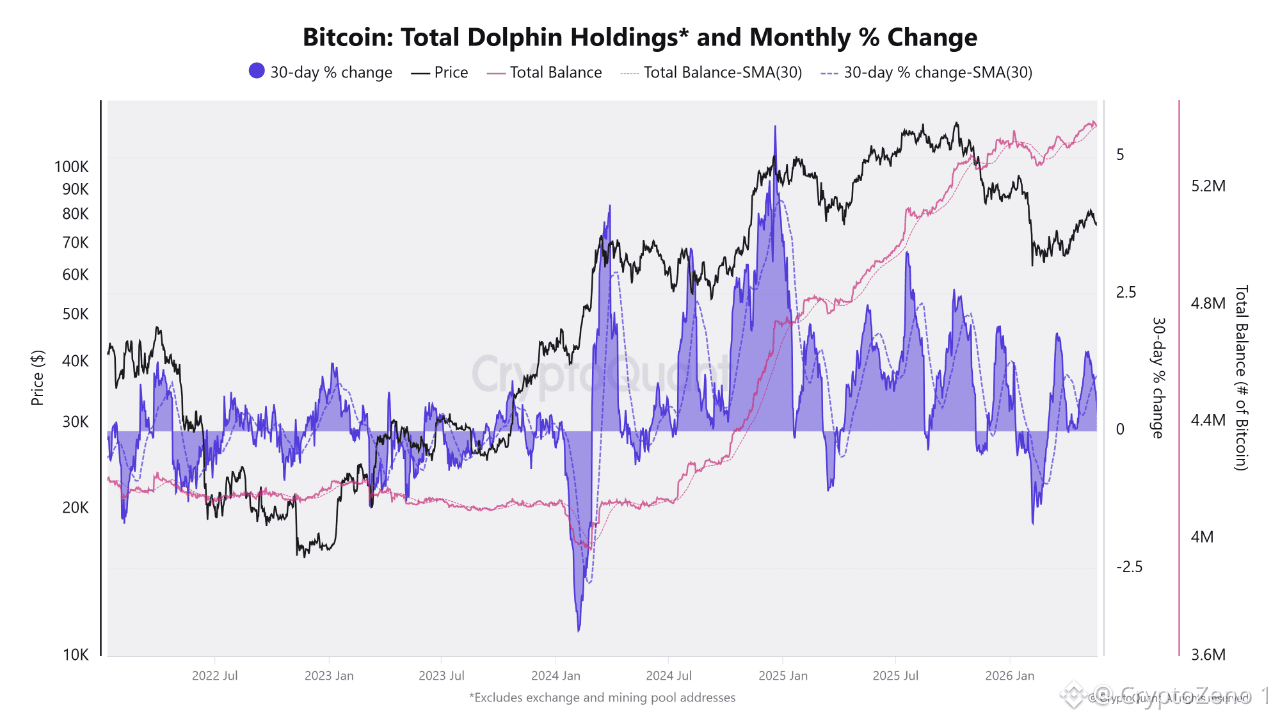
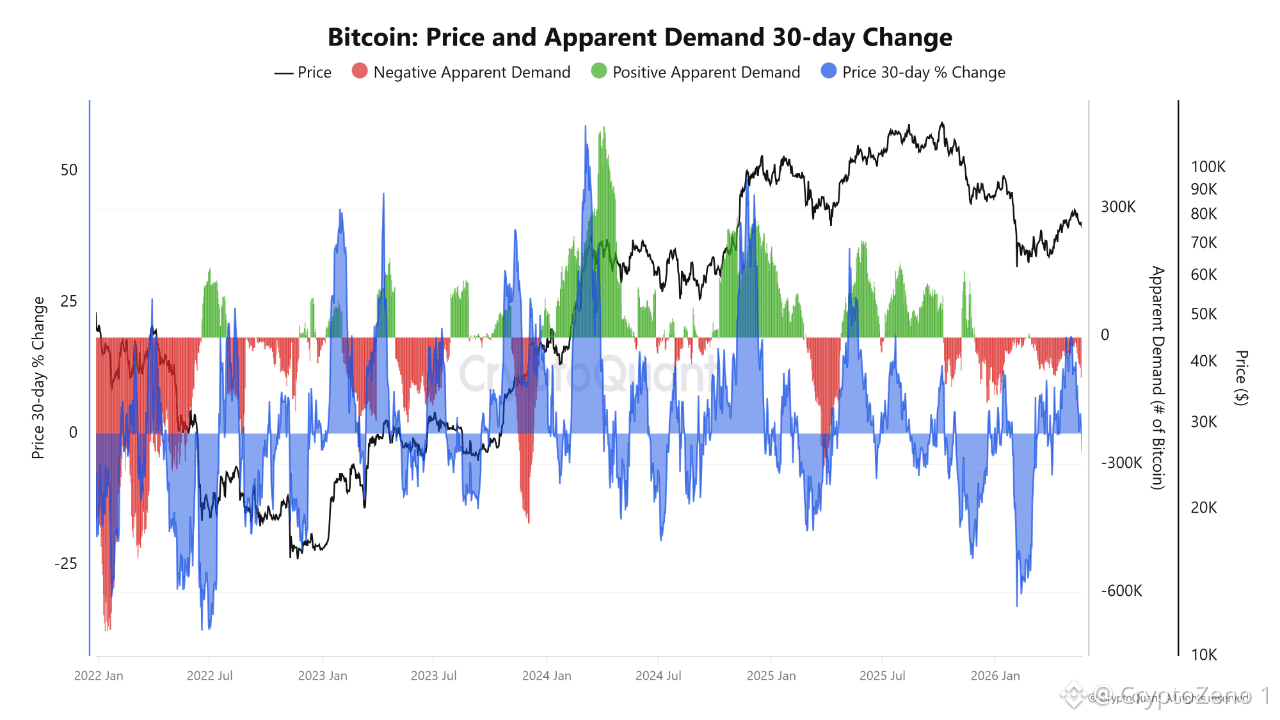
#Биткоин Текущая коррекция происходит на фоне продолжающегося обвала спроса $BTC по-прежнему торгуется внутри более широкой структуры коррекции, и последние on-chain данные указывают на то, что слабость больше не исходит только из динамики цены. Очевидный спрос остается крайне вялым, пока рынок пытается восстановить импульс после недавнего отклонения вверх. Это создает опасную ситуацию: цена пытается стабилизироваться, но приток капитала на глубинном уровне не поддерживает восстановительную силу. Один из самых заметных сдвигов происходит в поведении держателей. Кошельки «дельфинов», которые держат от 100 до 1K BTC, по-прежнему сохраняют исторически повышенные балансы, но импульс накопления резко замедлился по сравнению с предыдущими месяцами. Крупные держатели больше не расширяют позиции агрессивно во время откатов. Такая смена часто наблюдается в фазах позднего цикла, когда уверенность остается, но убежденность ослабевает. Одновременно начались вновь растущие расходы долгосрочных держателей, в то время как условия спроса продолжают ухудшаться. Более старые монеты, выходящие в обращение в периоды отрицательного «очевидного спроса», обычно усиливают структурное давление на рынок, потому что новые покупатели не поглощают предложение достаточно быстро. Похожие условия в предыдущих циклах часто приводили к затяжным «рваным» коррекциям вместо немедленного продолжения прорыва. Трудность текущей обстановки в том, что паника еще не наступила в полной мере, но и органическое восстановление спроса тоже отсутствует. Сейчас Bitcoin оказался между замедляющимся накоплением, ростом движения старых монет и слабым притоком капитала по всей сети. Пока сила спроса снова не начнет заметно восстанавливаться, коррекция может оставаться незавершенной, даже если в краткосрочной перспективе продолжают появляться отскоки цены. #Анализ цены BTC# #Макро-выводы#
Войдите, чтобы посмотреть больше материала