
ProTrader365
137 Publicações

ProTrader365
"Over 8 years in crypto have taught us one thing: winning isn’t luck; it’s strategy. We're here to help you master yours." ProTrader | Investor | Content Creator | Analyzer
0 A seguir
1 Seguidores
6 Gostaram
Publicações
Ver tradução
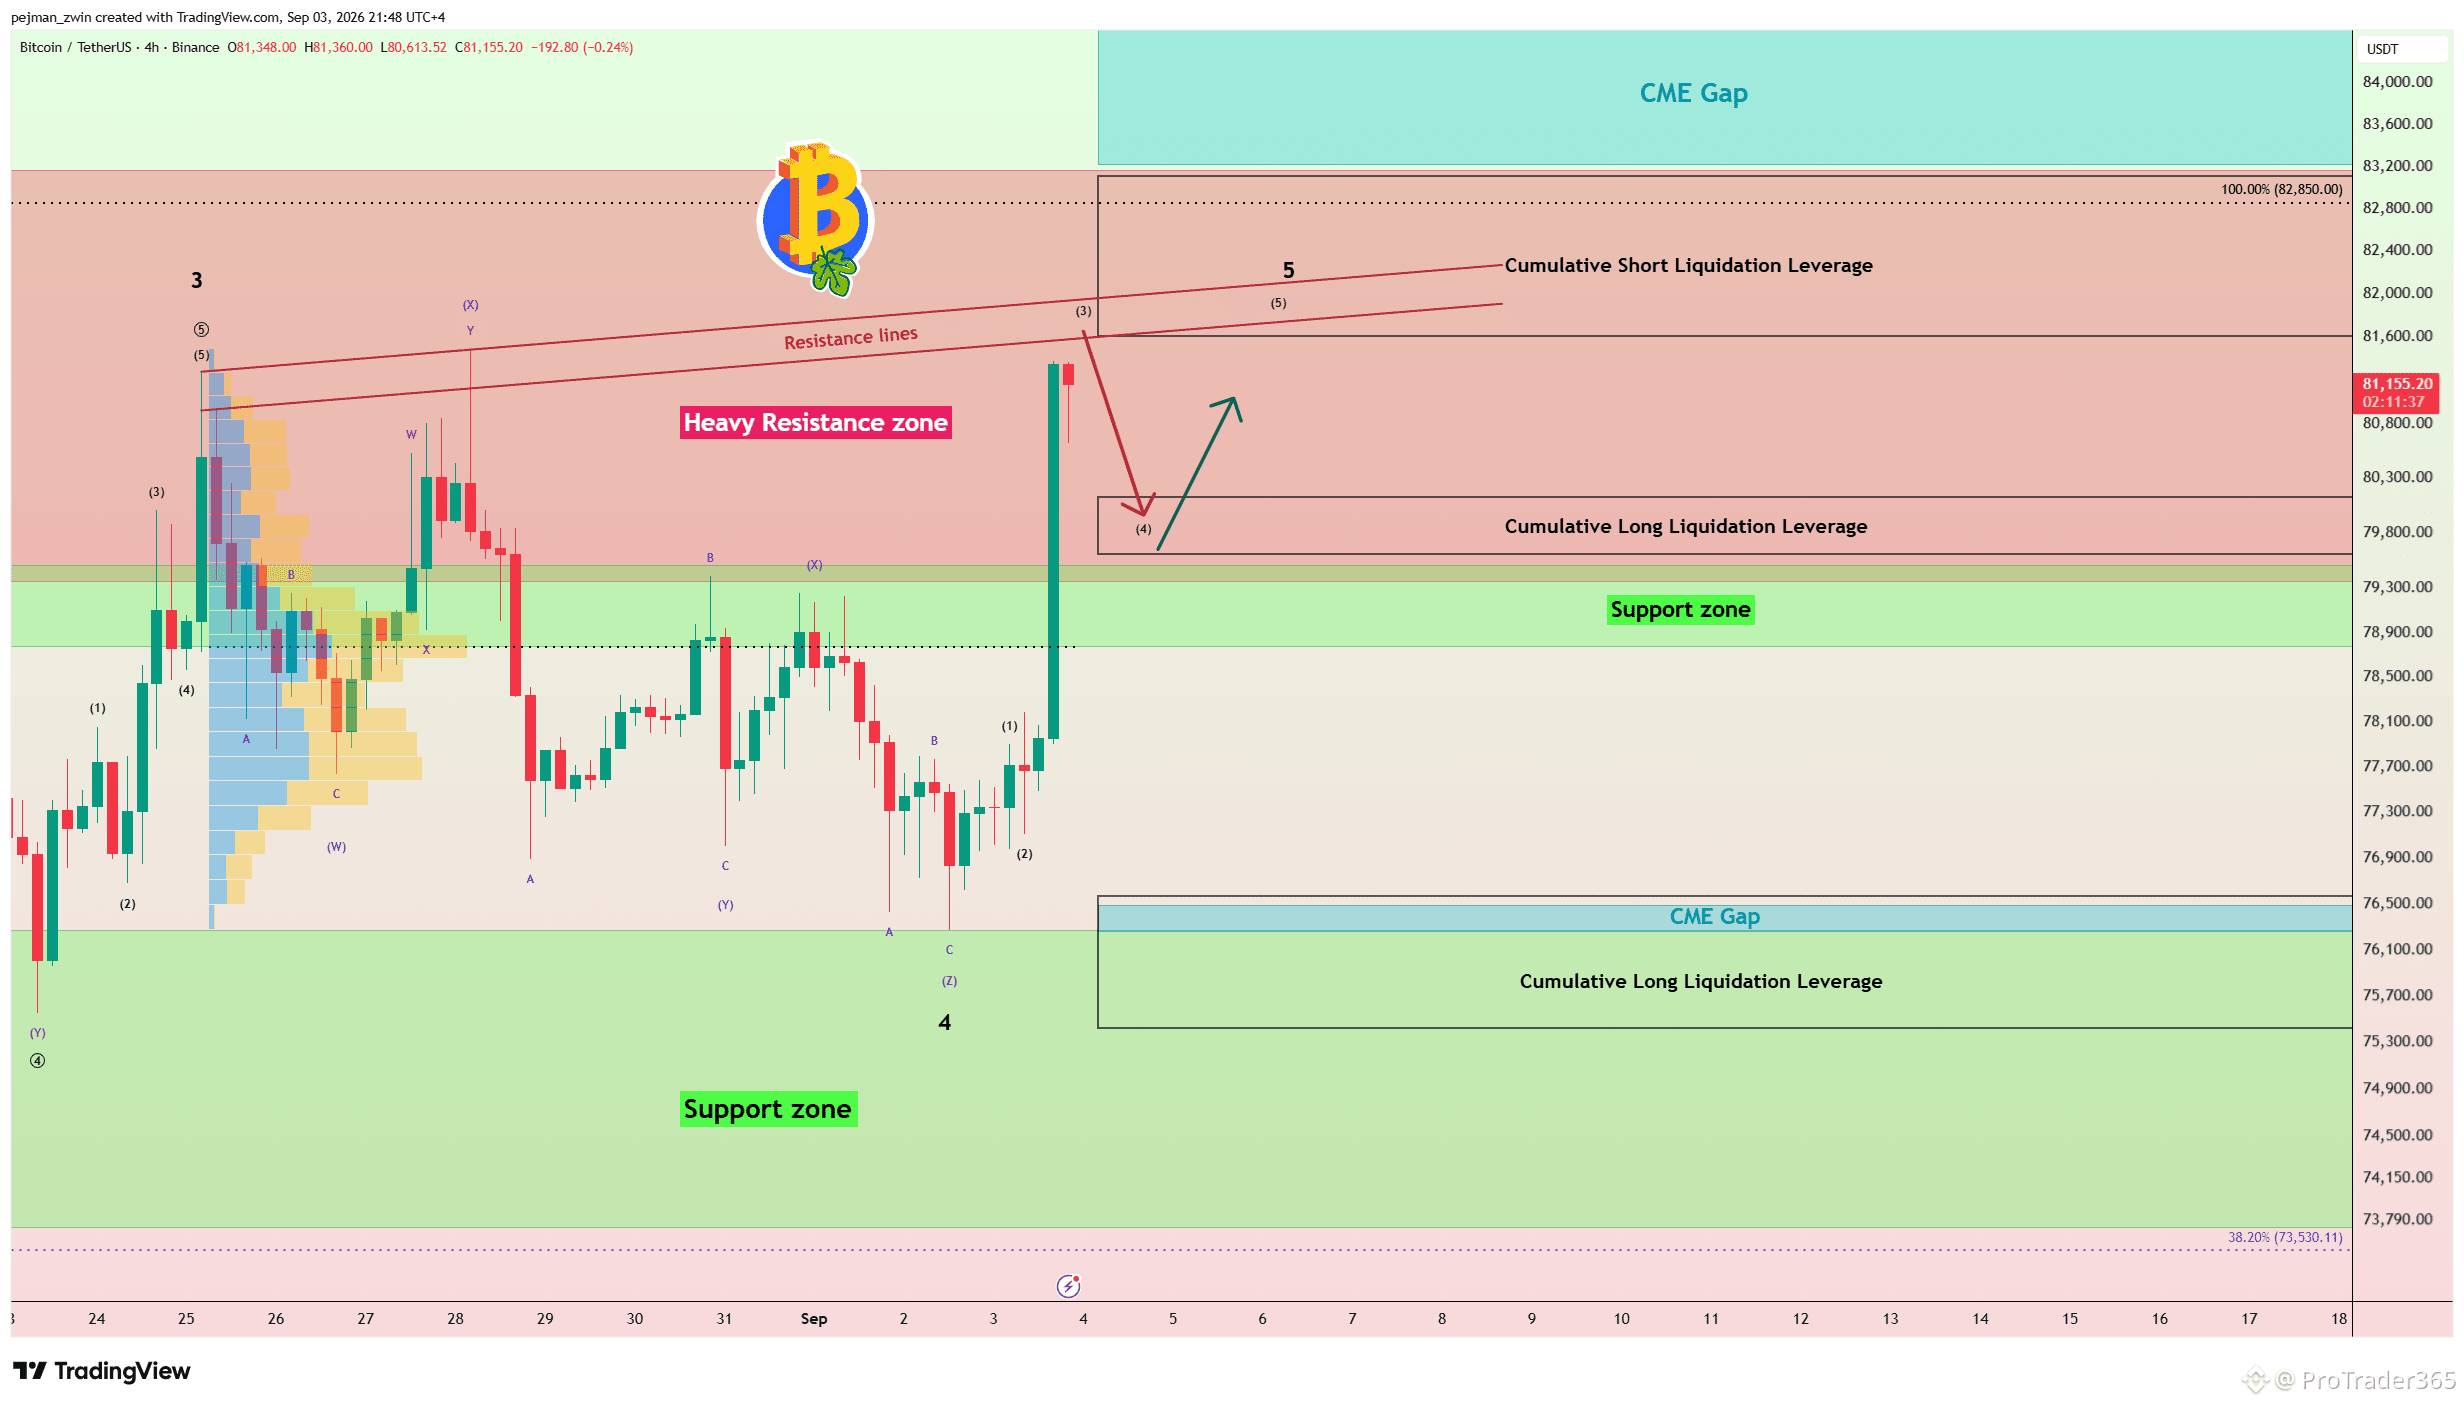
$BTC Reclaims $80,000 — But Wave 5 May Be Near Completion Bitcoin reclaimed the $80,000 level after Fed Governor Christopher Waller signaled support for keeping interest rates unchanged, while more than $415 million in crypto short liquidations accelerated the rally. Technical Analysis On the 4-hour time frame, Bitcoin is still below the Heavy Resistance Zone and is approaching the Resistance Lines and the Cumulative Short Liquidation Leverage($83,100-$81,600). From an Elliott Wave perspective, Bitcoin appears to be completing Impulsive Wave 5. I expect another rejection from the Resistance Lines and a short-term correction toward the Cumulative Long Liquidation Leverage($80,120-$79,600). After reaching this liquidity zone, I expect a strong bullish reaction and another spike to the upside. Stop Loss(SL): $83,220(Worst) Will Bitcoin reach the Cumulative Long Liquidation Leverage before breaking above the Heavy Resistance Zone?
Ver tradução
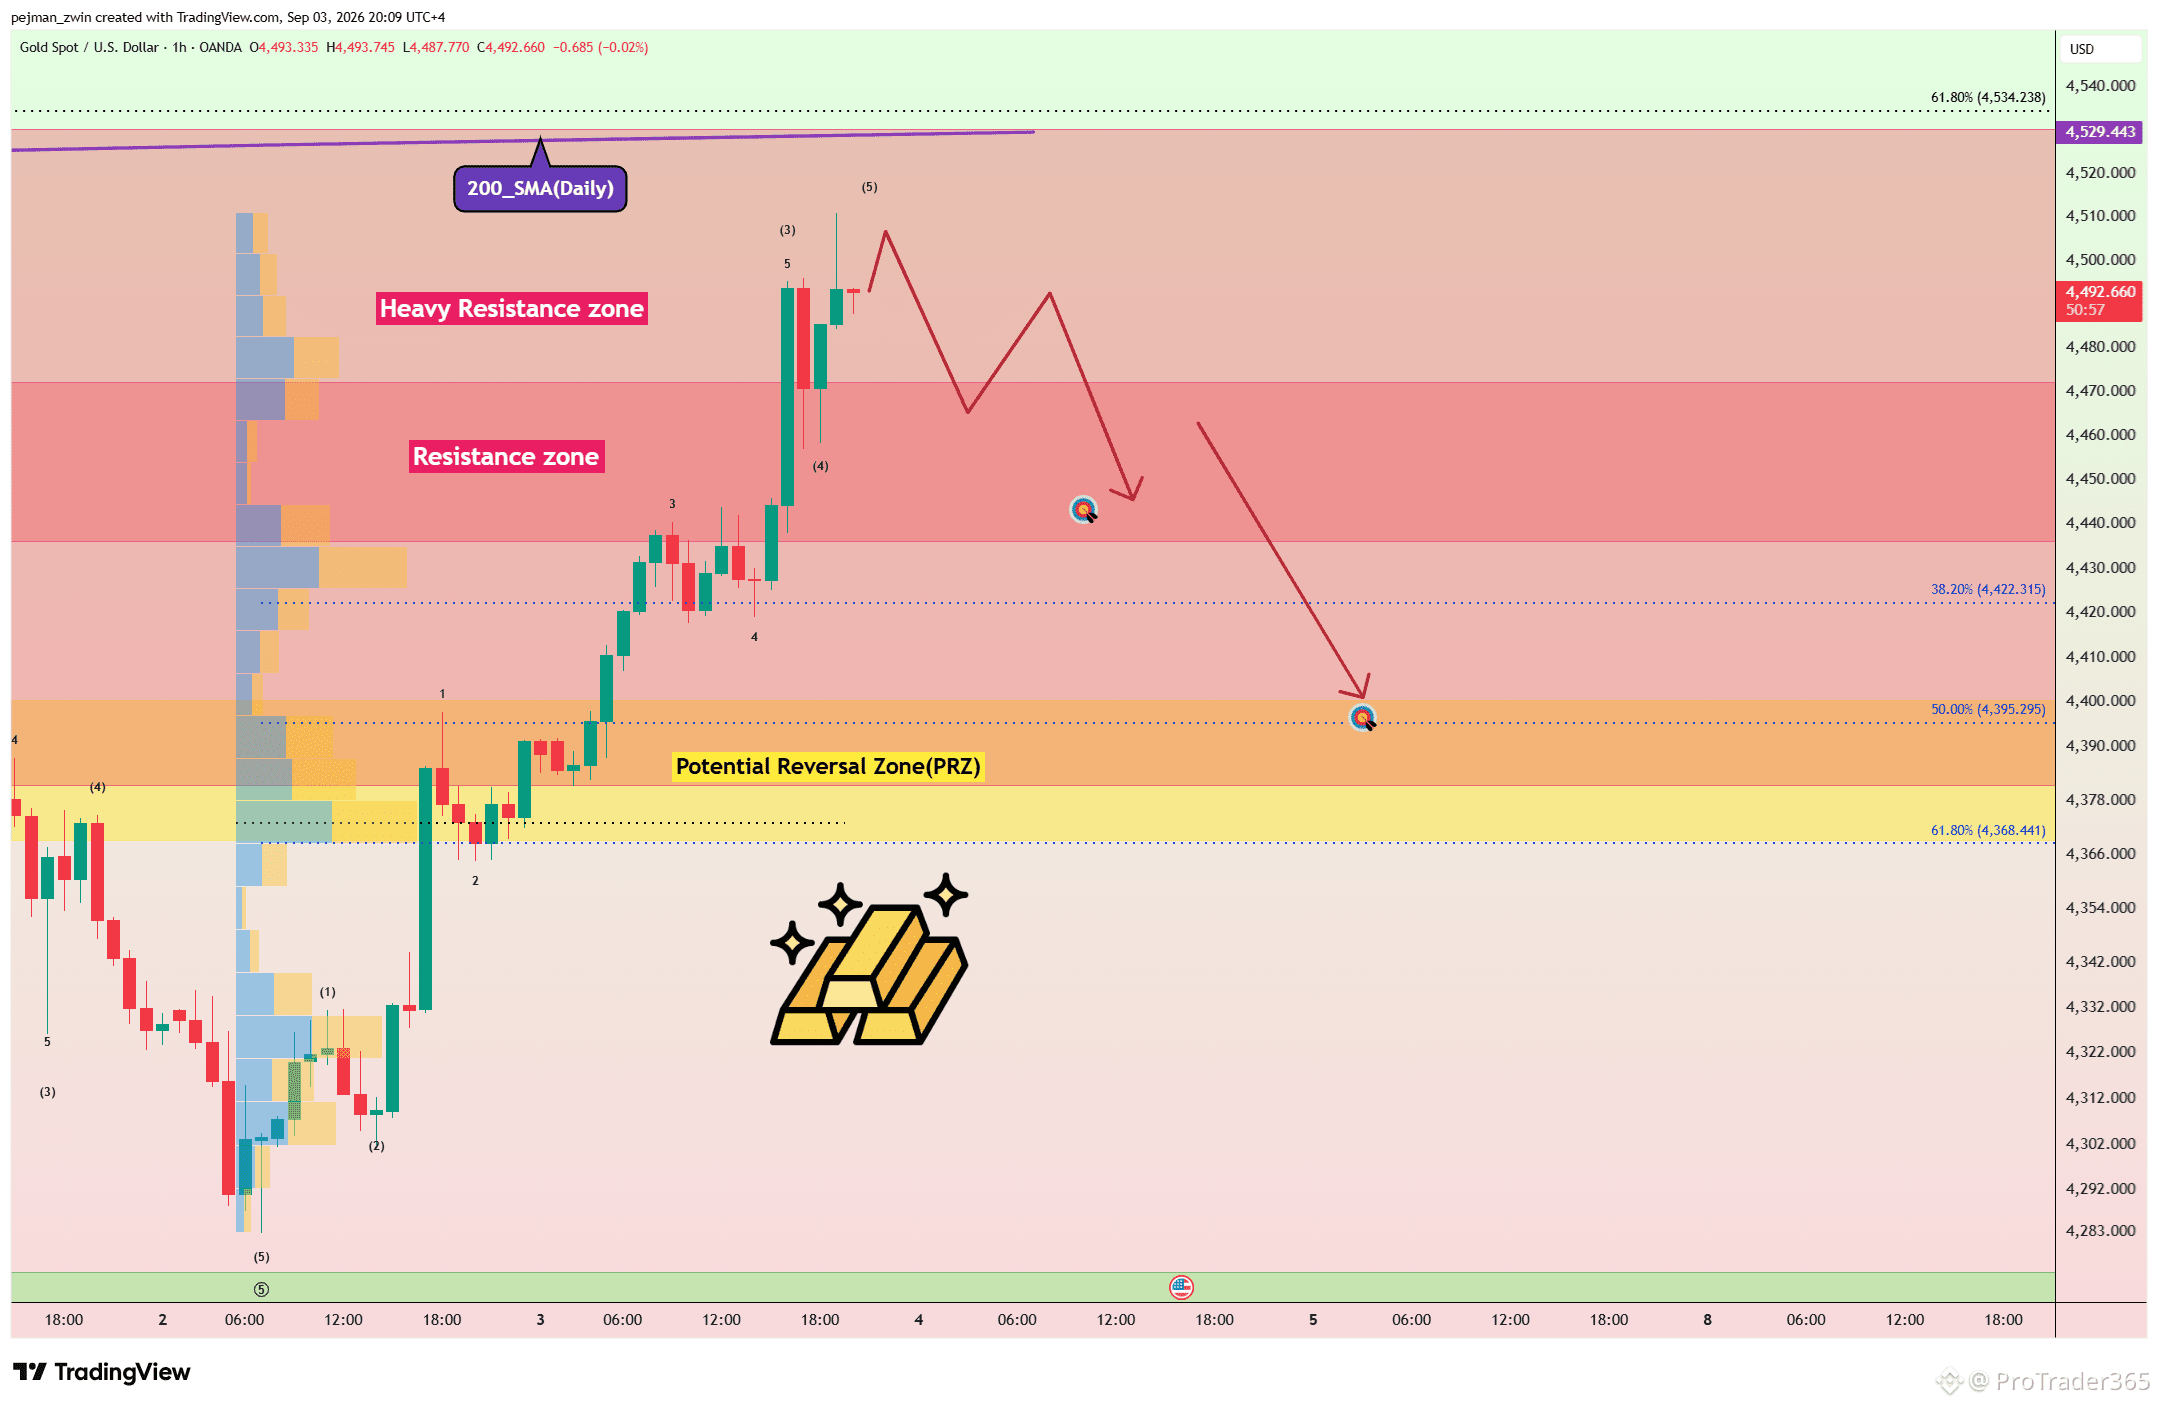
$XAUt Faces the 200_SMA(Daily) — Is Another Bearish Move Next? Gold has resumed its bullish trend over the past two days and is now trading inside the Heavy Resistance Zone, above the Resistance Zone, and close to the 200_SMA(Daily). However, the breakout has not been supported by strong trading volume. Technical Analysis I don’t expect gold to reclaim the 200_SMA(Daily) on its first attempt. From an Elliott Wave perspective, gold appears to be completing Wave 5 If gold moves back below the Resistance Zone, the correction could extend toward the Potential Reversal Zone(PRZ)[$4,400-$4,368]. Stop Loss(SL): $4,543 Can gold reclaim the 200_SMA(Daily), or will the correction begin first? #Gold
Ver tradução
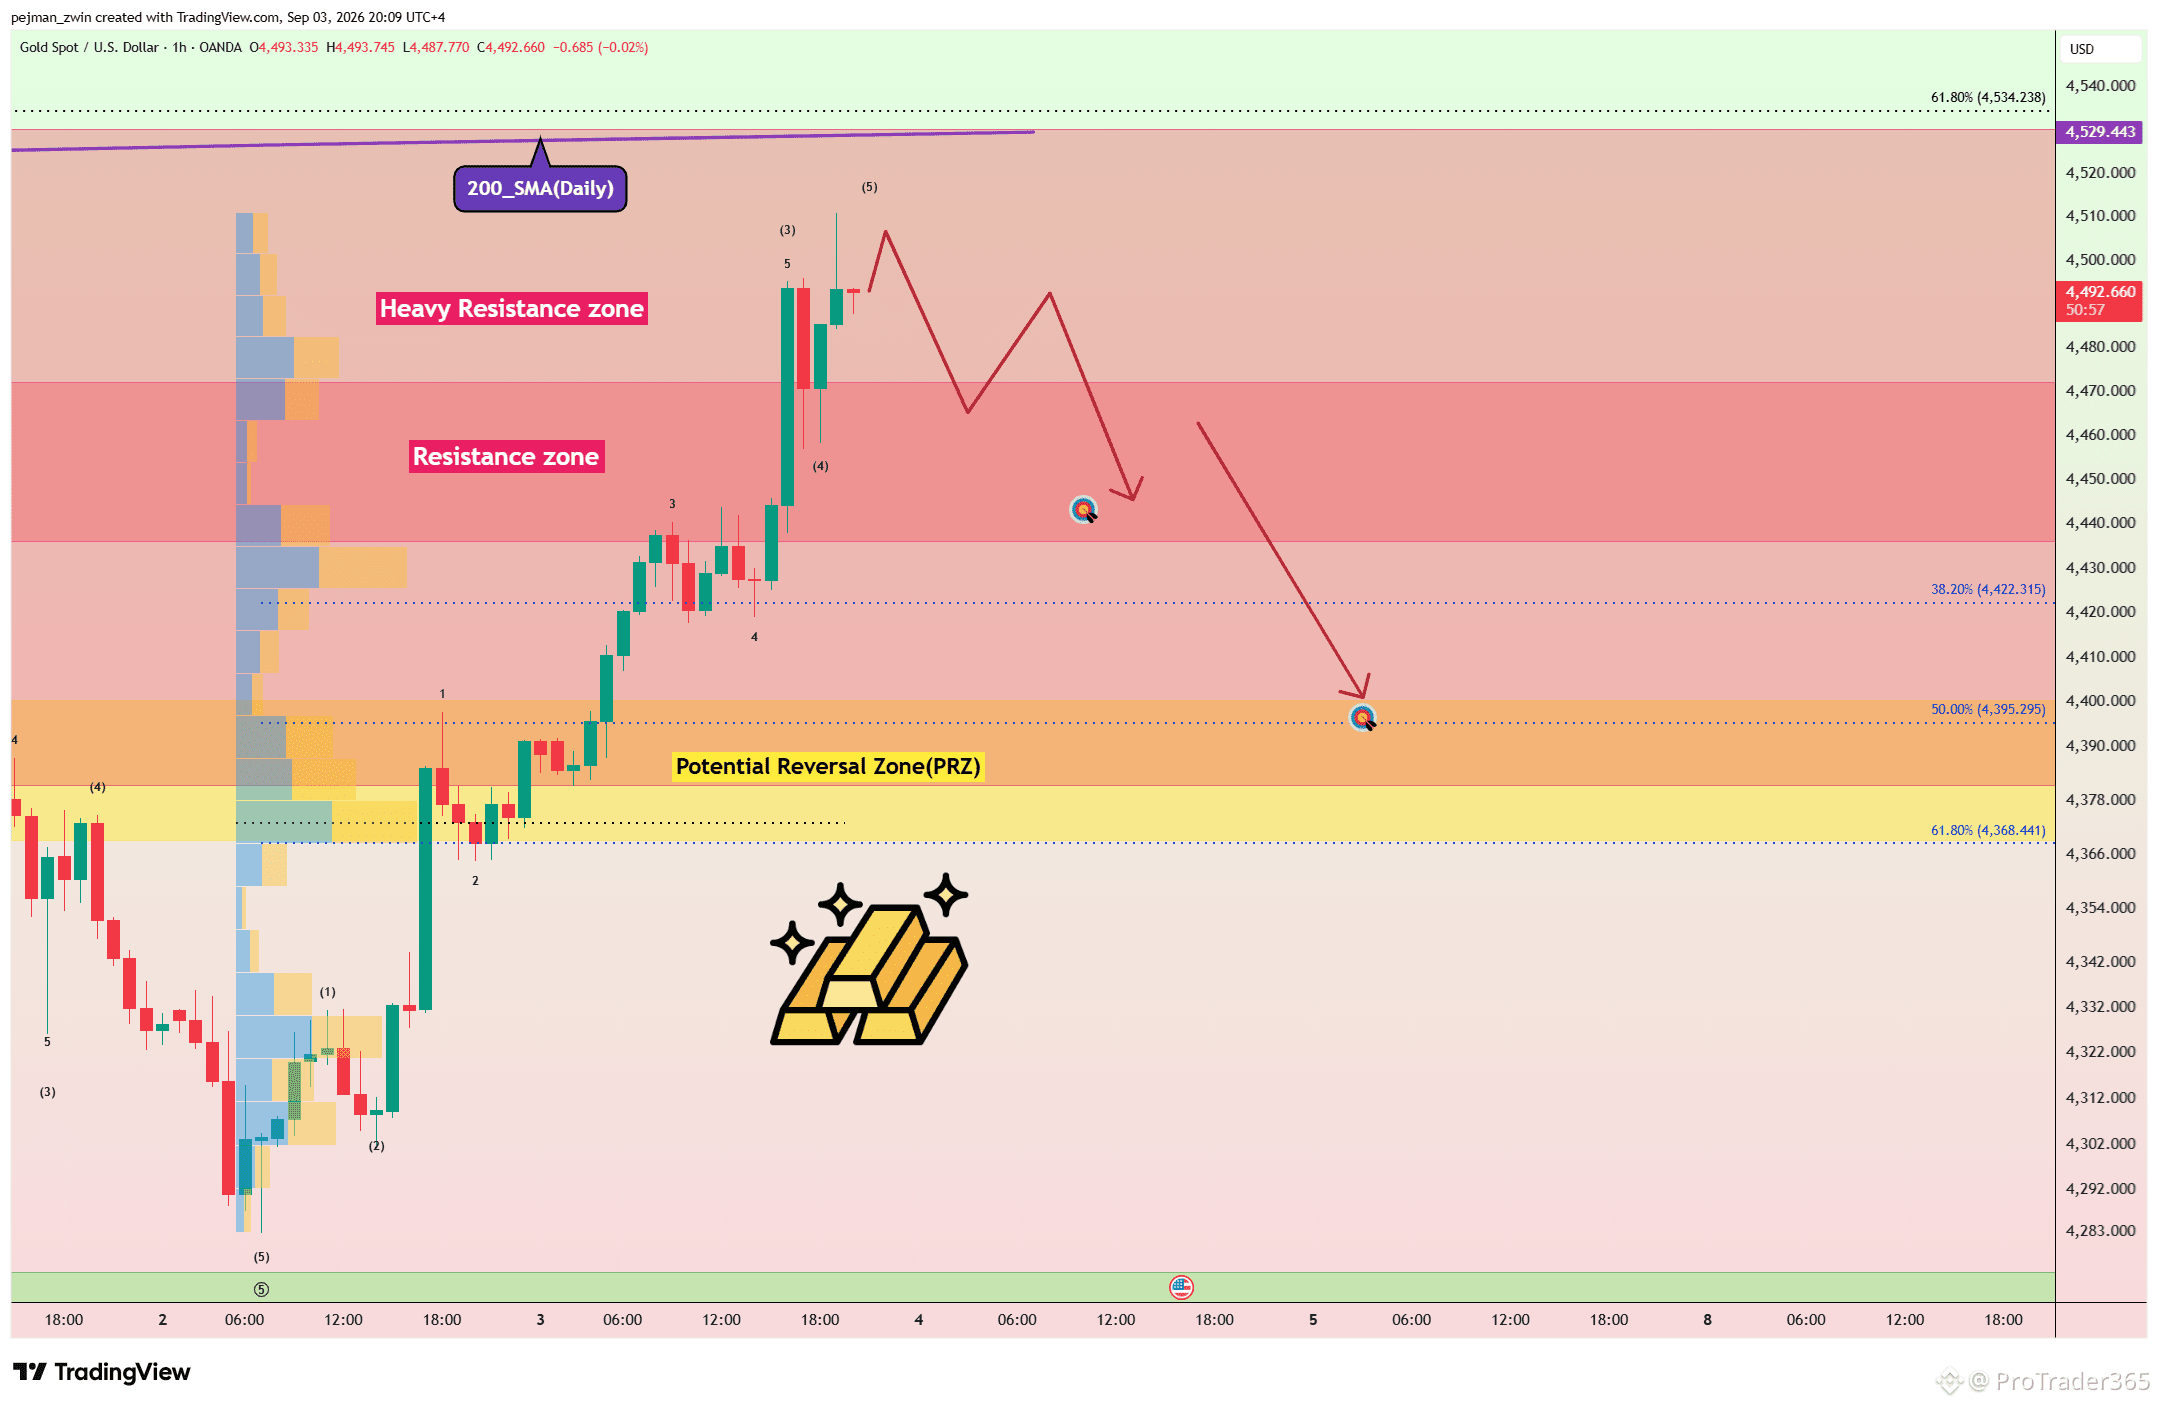
$XAUt Faces the 200_SMA(Daily) — Is Another Bearish Move Next? Gold has resumed its bullish trend over the past two days and is now trading inside the Heavy Resistance Zone, above the Resistance Zone, and close to the 200_SMA(Daily). However, the breakout has not been supported by strong trading volume. Technical Analysis I don’t expect gold to reclaim the 200_SMA(Daily) on its first attempt. From an Elliott Wave perspective, gold appears to be completing Wave 3 of Wave C within a Flat Correction, with Wave 3 developing as an Extended Wave. A Positive Regular Divergence(RD+) is also visible between two Consecutive Valleys. After Wave 3 is completed, I expect another bearish move toward $4,443. If gold moves back below the Resistance Zone, the correction could extend toward the Potential Reversal Zone(PRZ)[$4,400-$4,368]. Stop Loss(SL): $4,543 Can gold reclaim the 200_SMA(Daily), or will the correction begin first? #Gold
Ver tradução
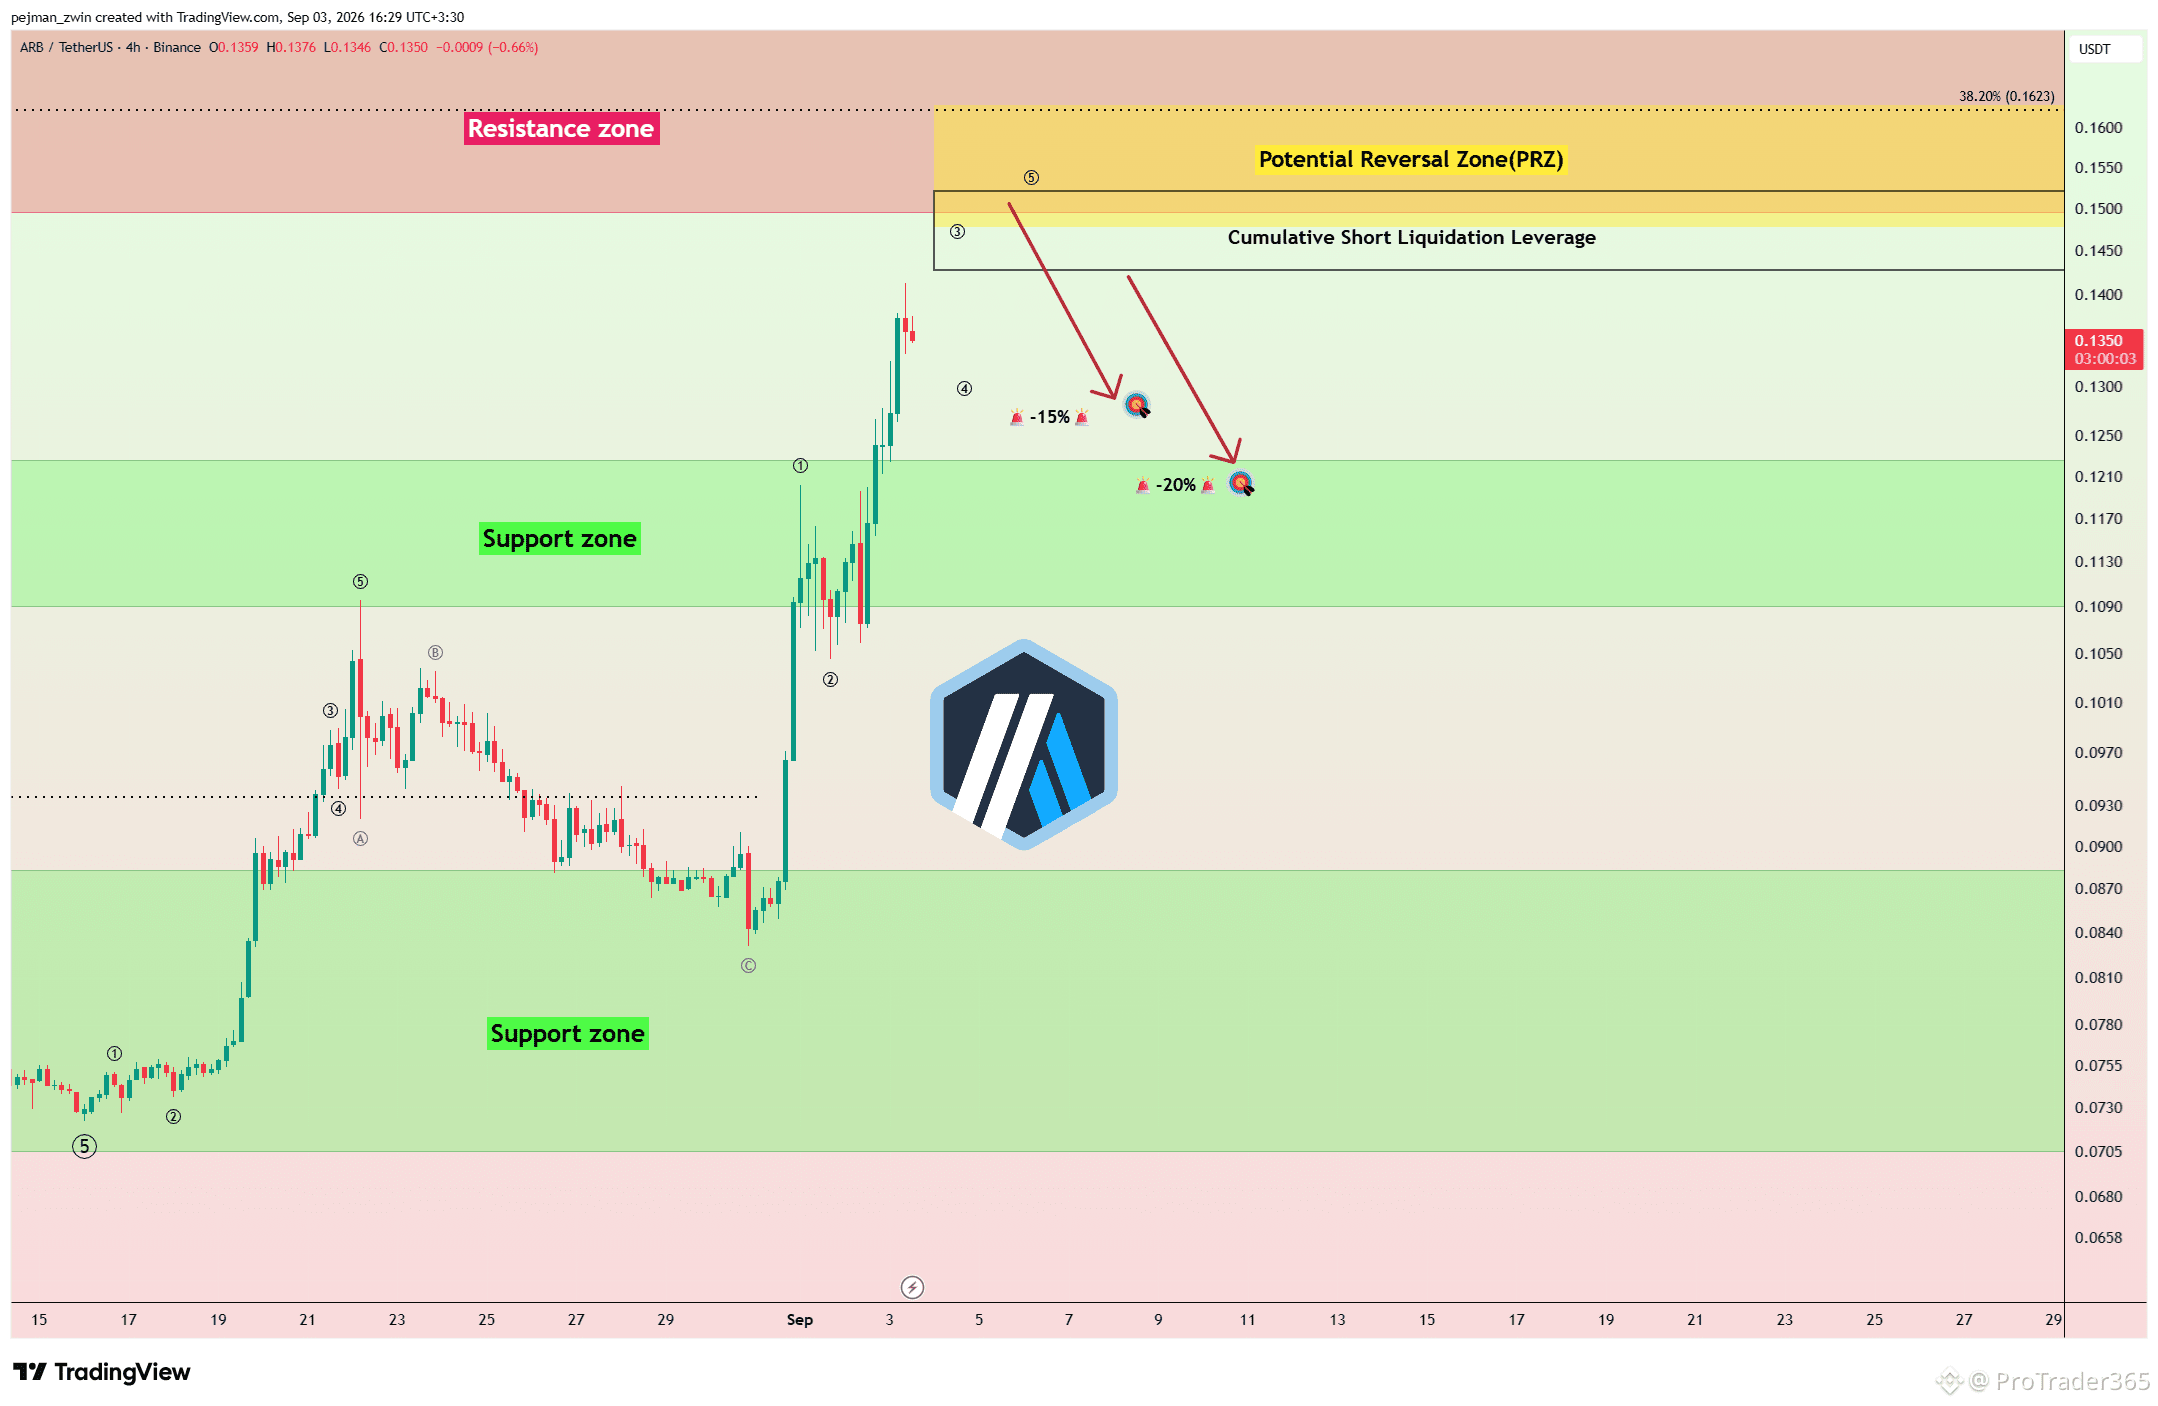
$ARB Rally Meets a Major PRZ — Is a Correction Next? ARB has moved sharply higher as Robinhood Chain strengthens Arbitrum’s fundamental outlook through rising DEX activity, protocol revenue, and the return of 10% of net protocol revenue to the Arbitrum ecosystem. Technical Analysis On the 4-hour time frame, ARB is approaching the Resistance Zone, the Cumulative Short Liquidation Leverage($0.142-$0.152), and the Potential Reversal Zone(PRZ)[$0.148-$0.163]. However, trading volume is declining while price continues higher, creating a negative divergence between price and volume. From an Elliott Wave perspective, ARB also appears to be completing a Five-Wave Impulsive Structure, with the final wave potentially ending inside the PRZ. I expect a corrective move from this area toward $0.127, with stronger bearish momentum potentially extending the decline toward $0.121. Stop Loss(SL): $0.169 Will ARB reject from the PRZ and start the correction, or break above $0.169 first? #Arbitrum
Ver tradução
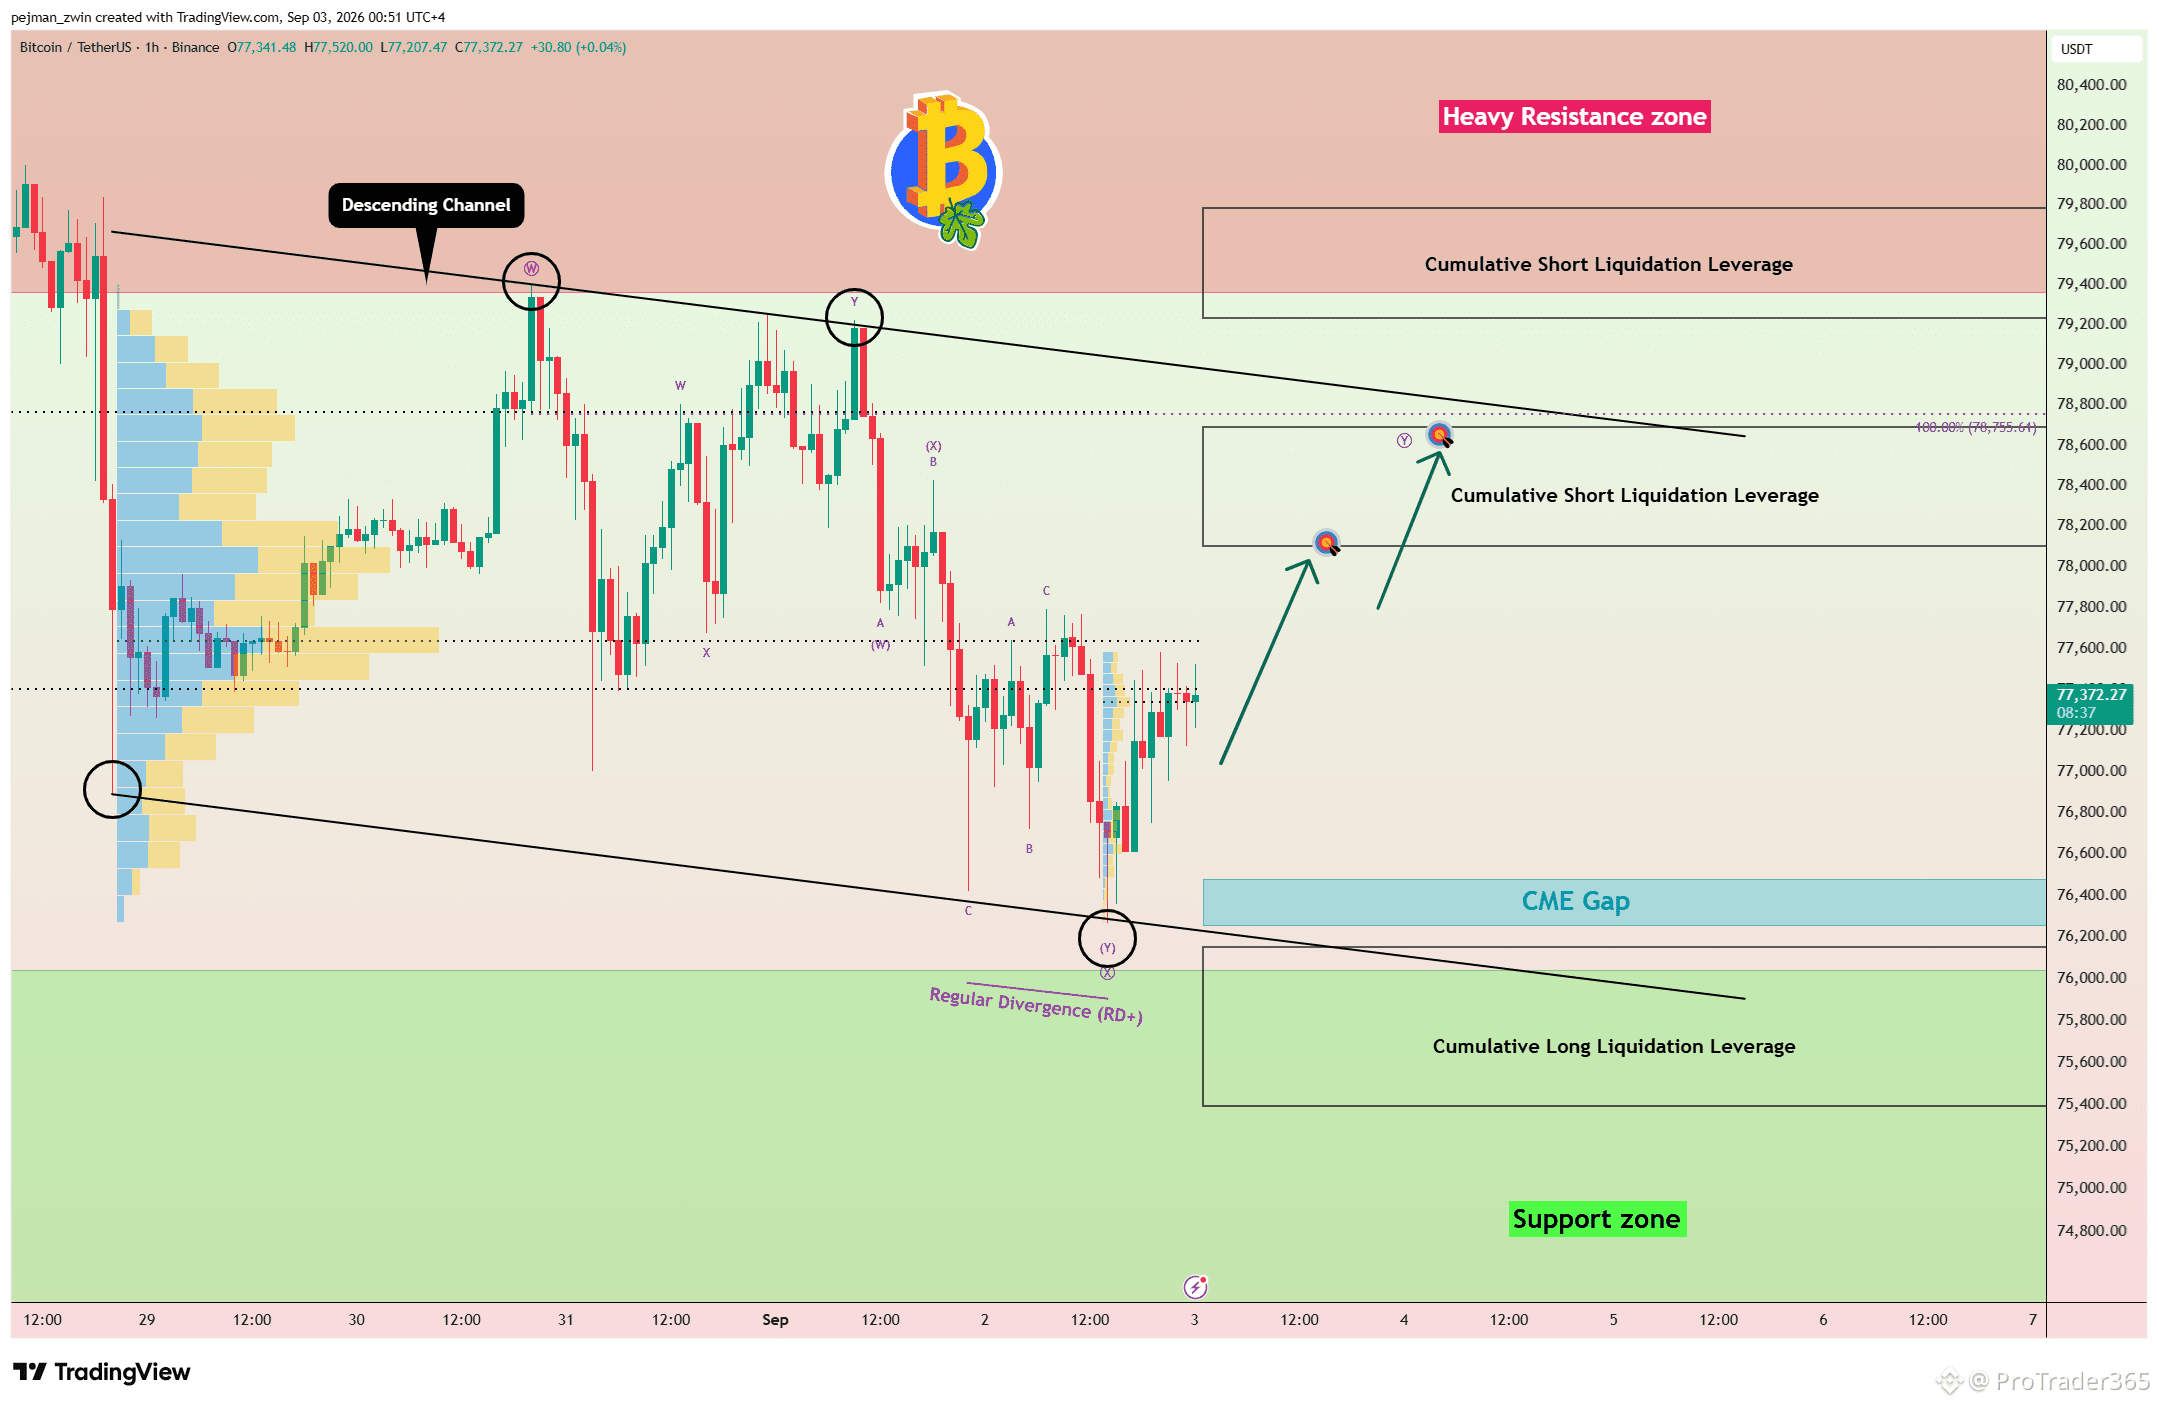
$BTC Eyes a Breakout From the Descending Channel Toward $78,770 Bitcoin has been trading inside a Descending Channel for the past 4–5 days, while renewed tensions in the Middle East have added pressure to Bitcoin and other risk assets. BTC is now attempting to break above the key trading levels of $77,400-$77,630. Technical Analysis If these levels are broken, Bitcoin could move toward the Cumulative Short Liquidation Leverage and the key trading level of $78,770, which also aligns with the upper trendline of the Descending Channel. From an Elliott Wave perspective, Bitcoin still appears to need to complete Wave Y of a Double Three Correction(W-X-Y). I expect Bitcoin to break above $77,400-$77,630 and rise toward $78,040 and $78,570. Stronger bullish momentum could open the way above $78,770. Stop Loss(SL): $76,580 CME Gap: $76,480-$76,255 Can Bitcoin break $78,770 and escape the Descending Channel before another move toward $75,000? #BTC Price Analysis#
Ver tradução
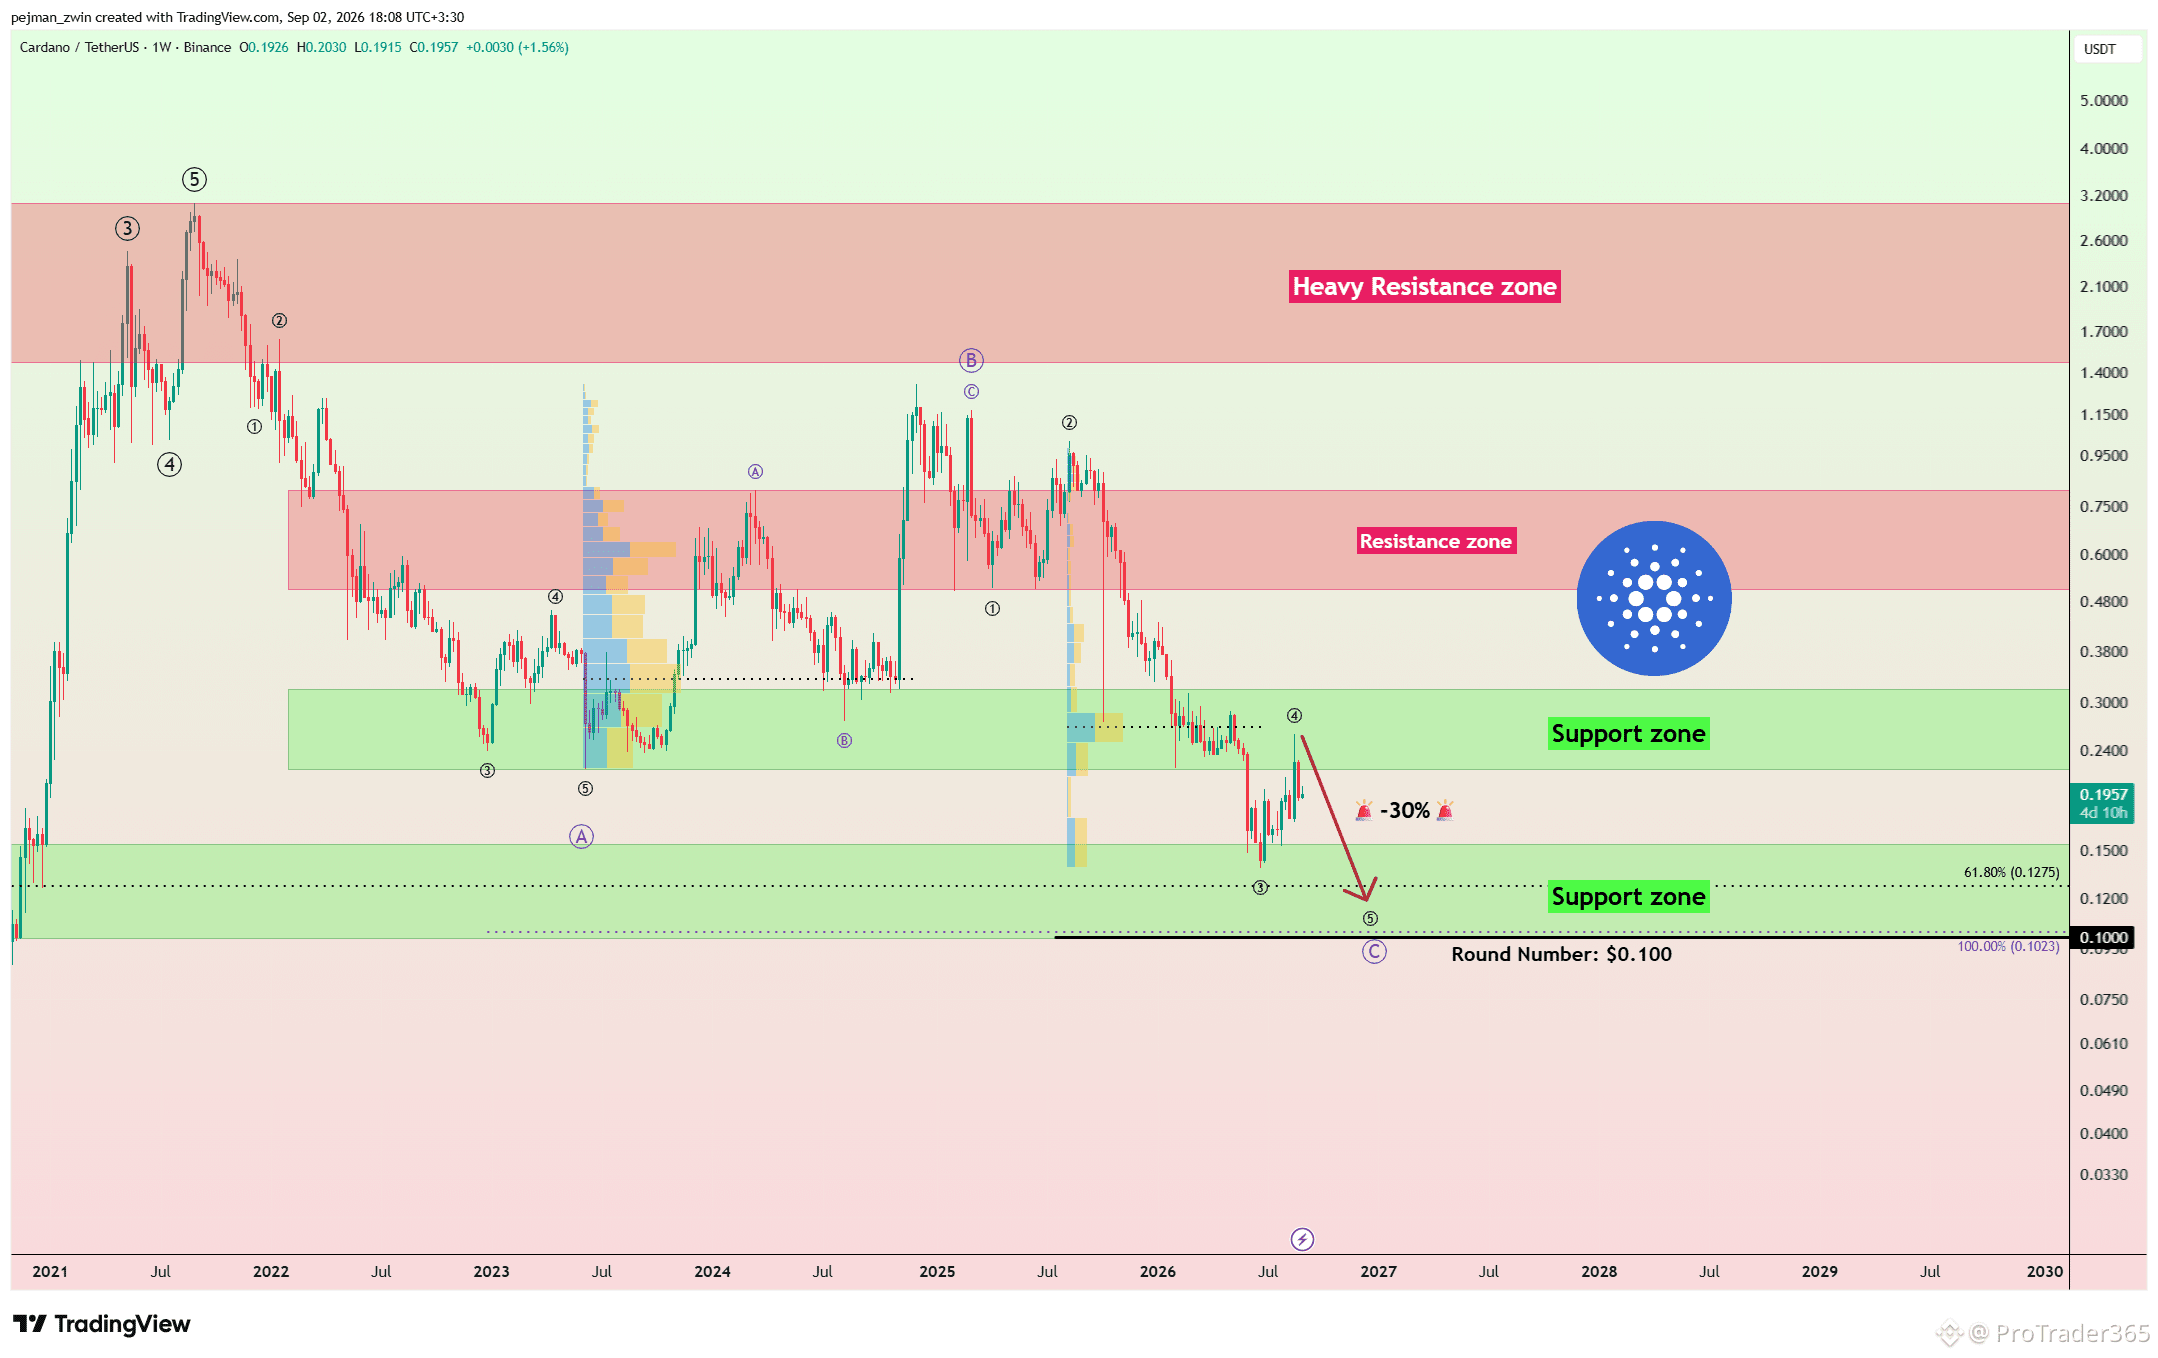
$ADA Could Face Another 30% Decline as Primary Wave 5 Develops ADA has broken below its weekly Support Zone and has so far failed to reclaim the important $0.34 trading level. The current price action suggests that ADA may now be completing a pullback toward the broken support structure. From an Elliott Wave perspective, ADA appears to have completed its Primary Wave 4 on the weekly timeframe, potentially opening the way for Primary Wave 5 to the downside. I expect ADA to potentially decline by at least 30%. If selling pressure remains strong, the broader Wave 5 structure could extend toward the major Support Zone near the psychological $0.10 round-number level, which may later become an important Potential Reversal Zone. As long as ADA remains below $0.34, the broader bearish scenario remains valid. Do you think ADA reaches the $0.10 area before the next major recovery? #Cardano
Ver tradução
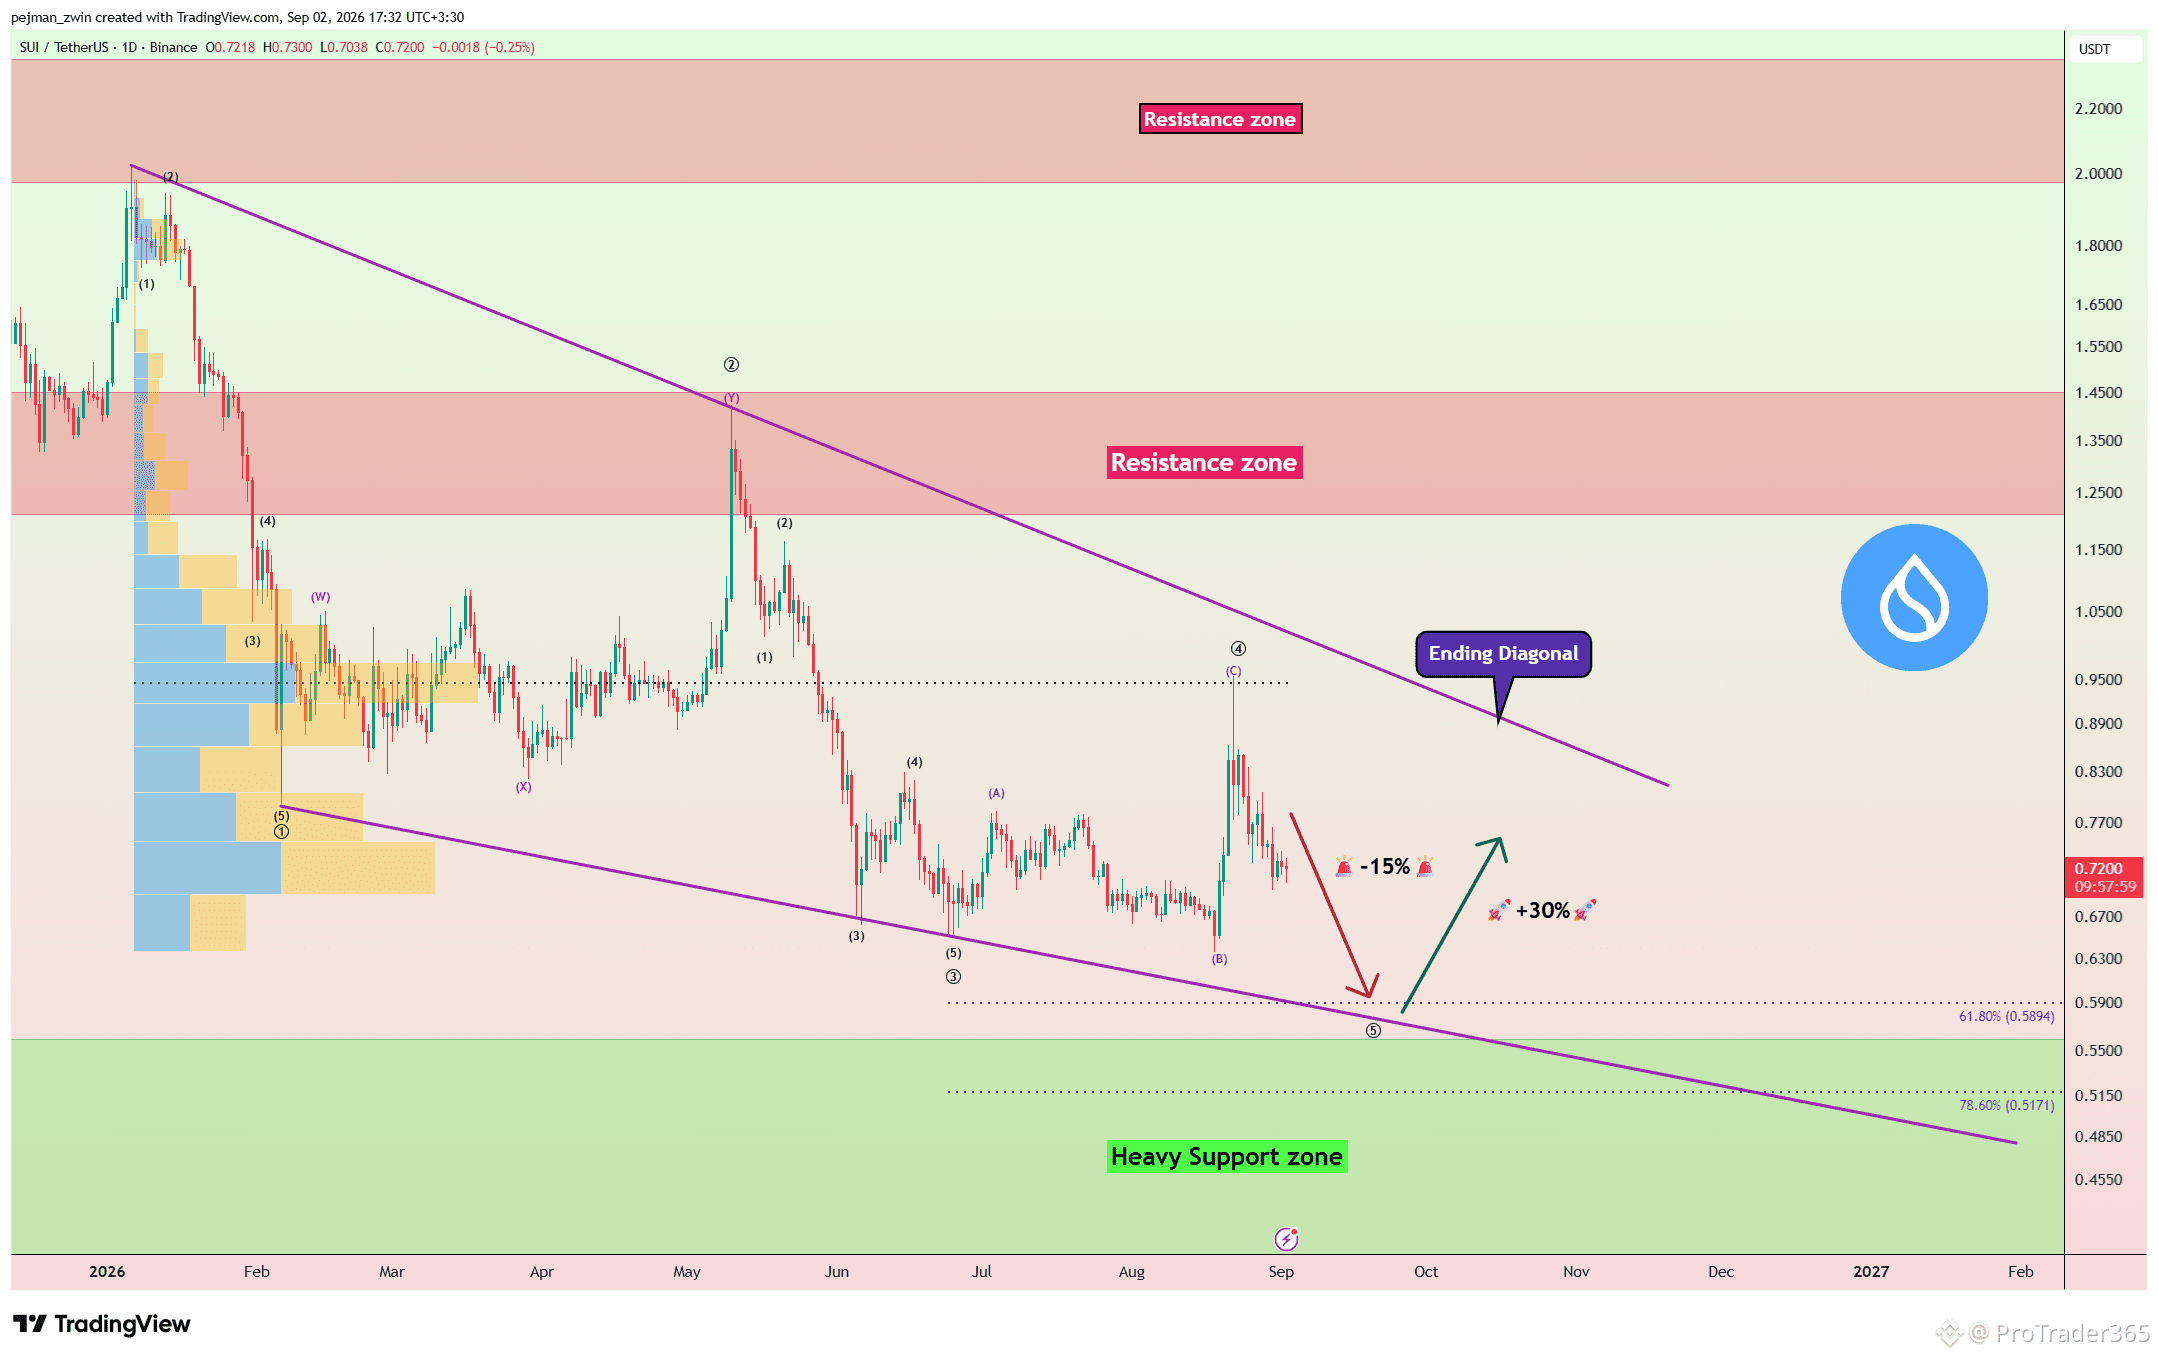
$SUI Could Drop Another 15% Before a Strong Bullish Reversal SUI failed to break above the important $0.95 trading level and has started to decline again. From an Elliott Wave perspective, SUI appears to have completed its Primary Wave 4, with the corrective structure taking the form of an Expanding Flat. The current price action also suggests that an Ending Diagonal may now be developing. I expect the decline to continue after a confirmed break below the key $0.67 trading level. In this scenario, price could fall by at least 15% toward the lower boundary of the Ending Diagonal and a strong Support Zone. If the Ending Diagonal completes there, I would then expect a strong bullish reversal with potential for at least a 30% recovery. Will SUI break below $0.67 first and complete the Ending Diagonal before the next major bullish move? #sui
Ver tradução
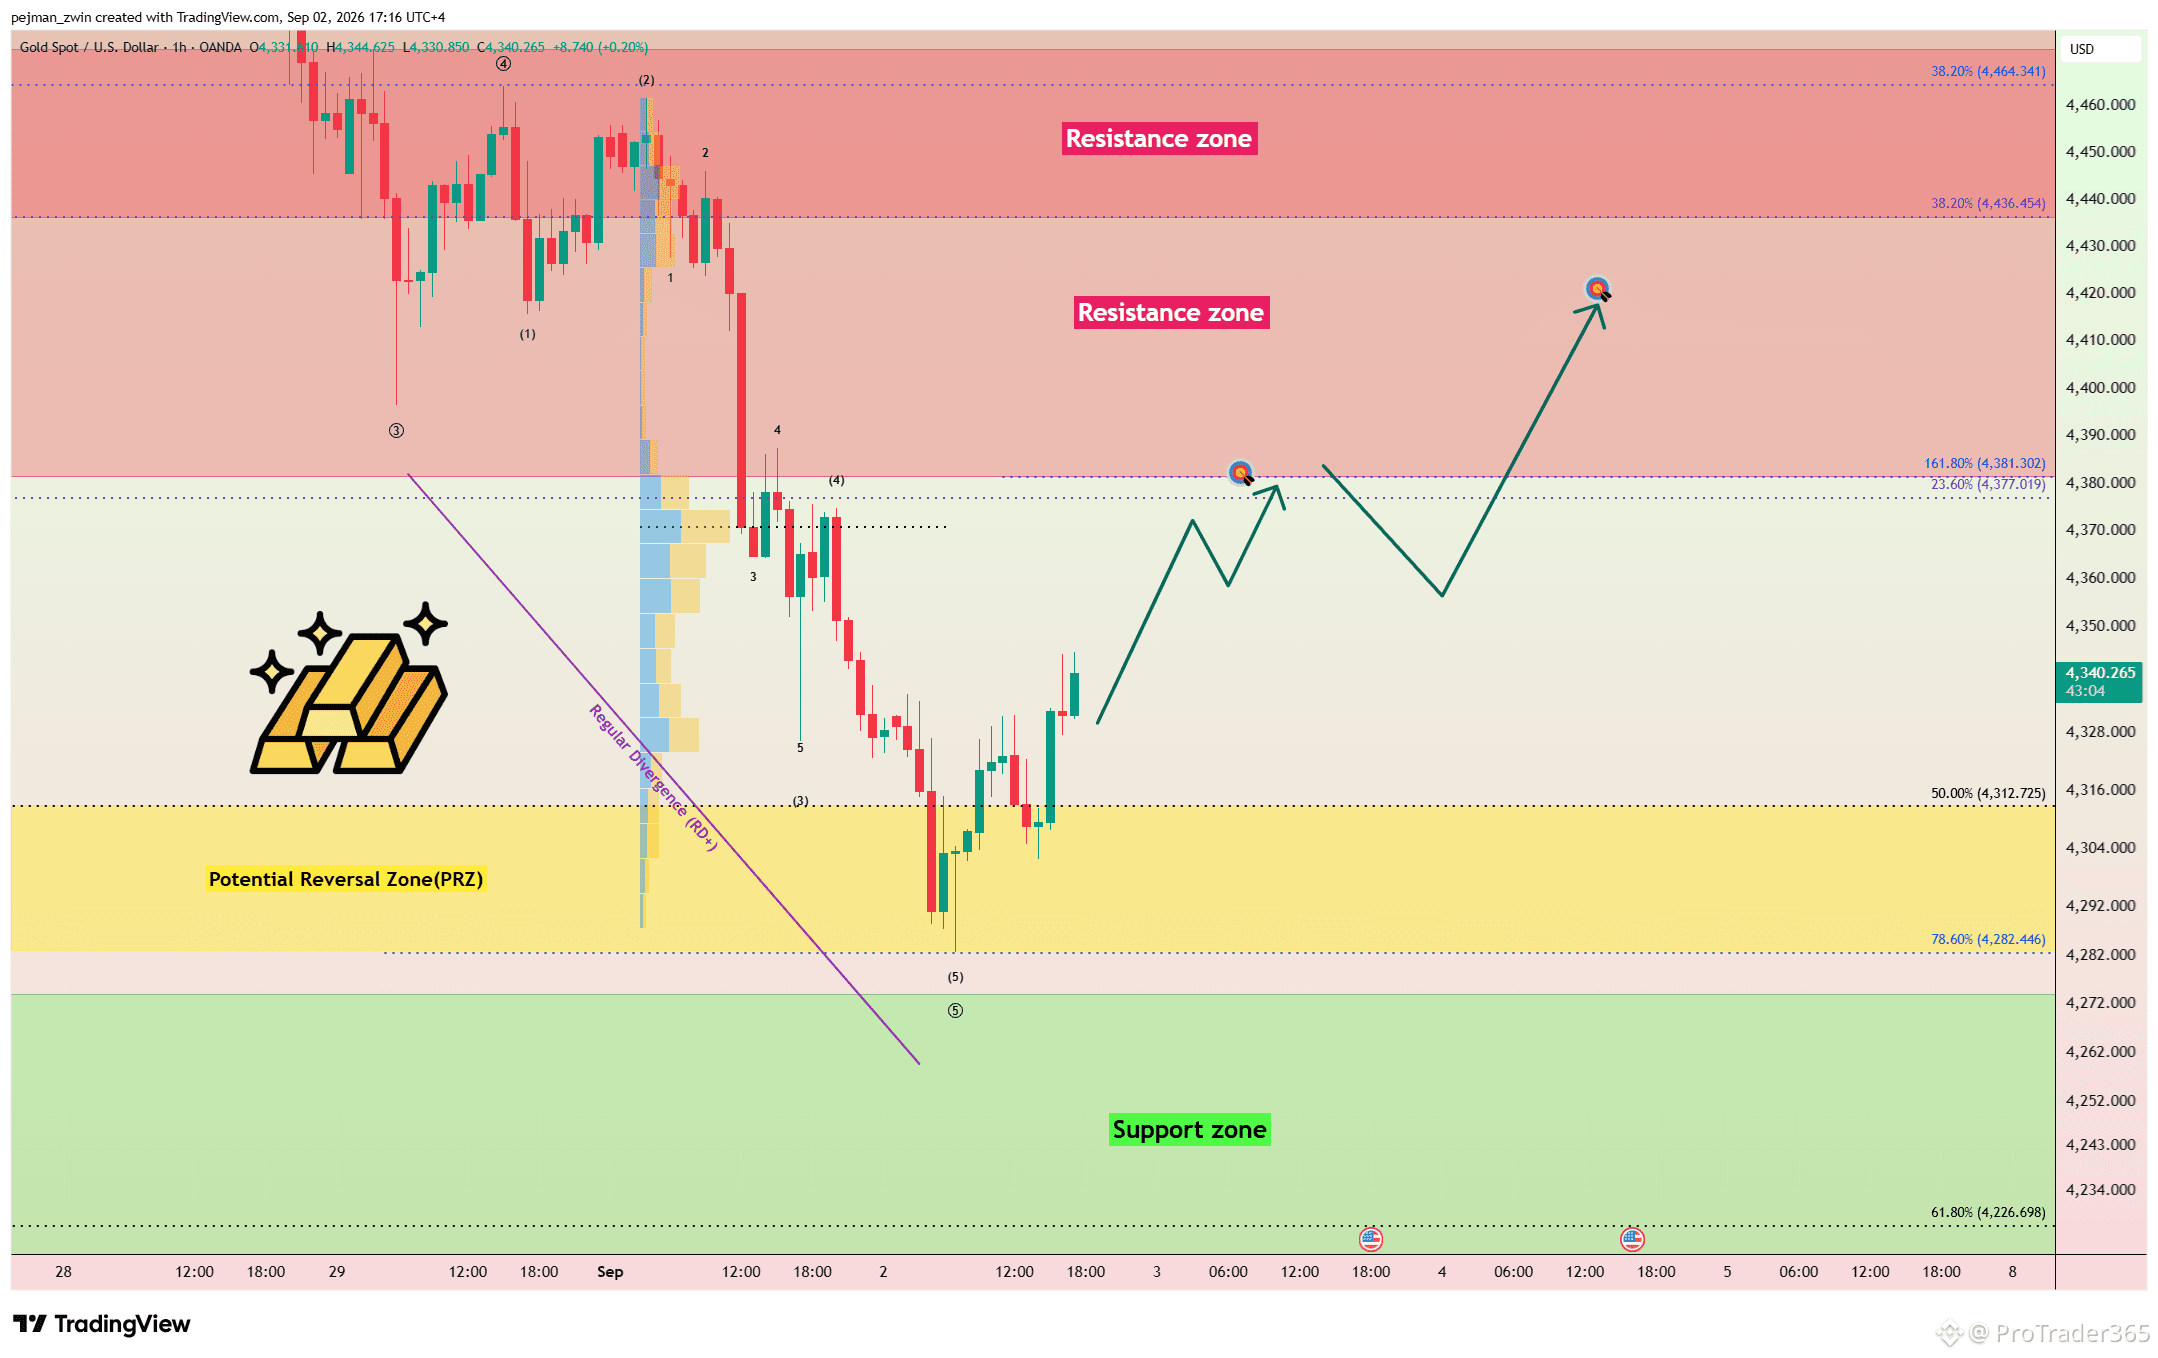
$XAUt Rebounds From the PRZ — Can Gold Reclaim $4,400? Gold continued to decline yesterday as tensions in the Middle East escalated again, although geopolitical developments appear to be having less impact on gold than in previous months. Price has now started to recover from the Potential Reversal Zone(PRZ)[$4,313-$4,283]. Technical Analysis From an Elliott Wave perspective, gold appears to have completed its Primary Wave 5 to the downside. A Positive Regular Divergence(RD+) is also visible between two Consecutive Valleys, suggesting bearish momentum may be weakening. I expect gold to continue higher toward $4,381. If bullish momentum increases, the recovery could extend toward $4,417. Stop Loss(SL): $4,277 Key Trading Levels: $4,370 _ $4,390 Can gold break above $4,390 and extend the recovery toward $4,417? #Gold
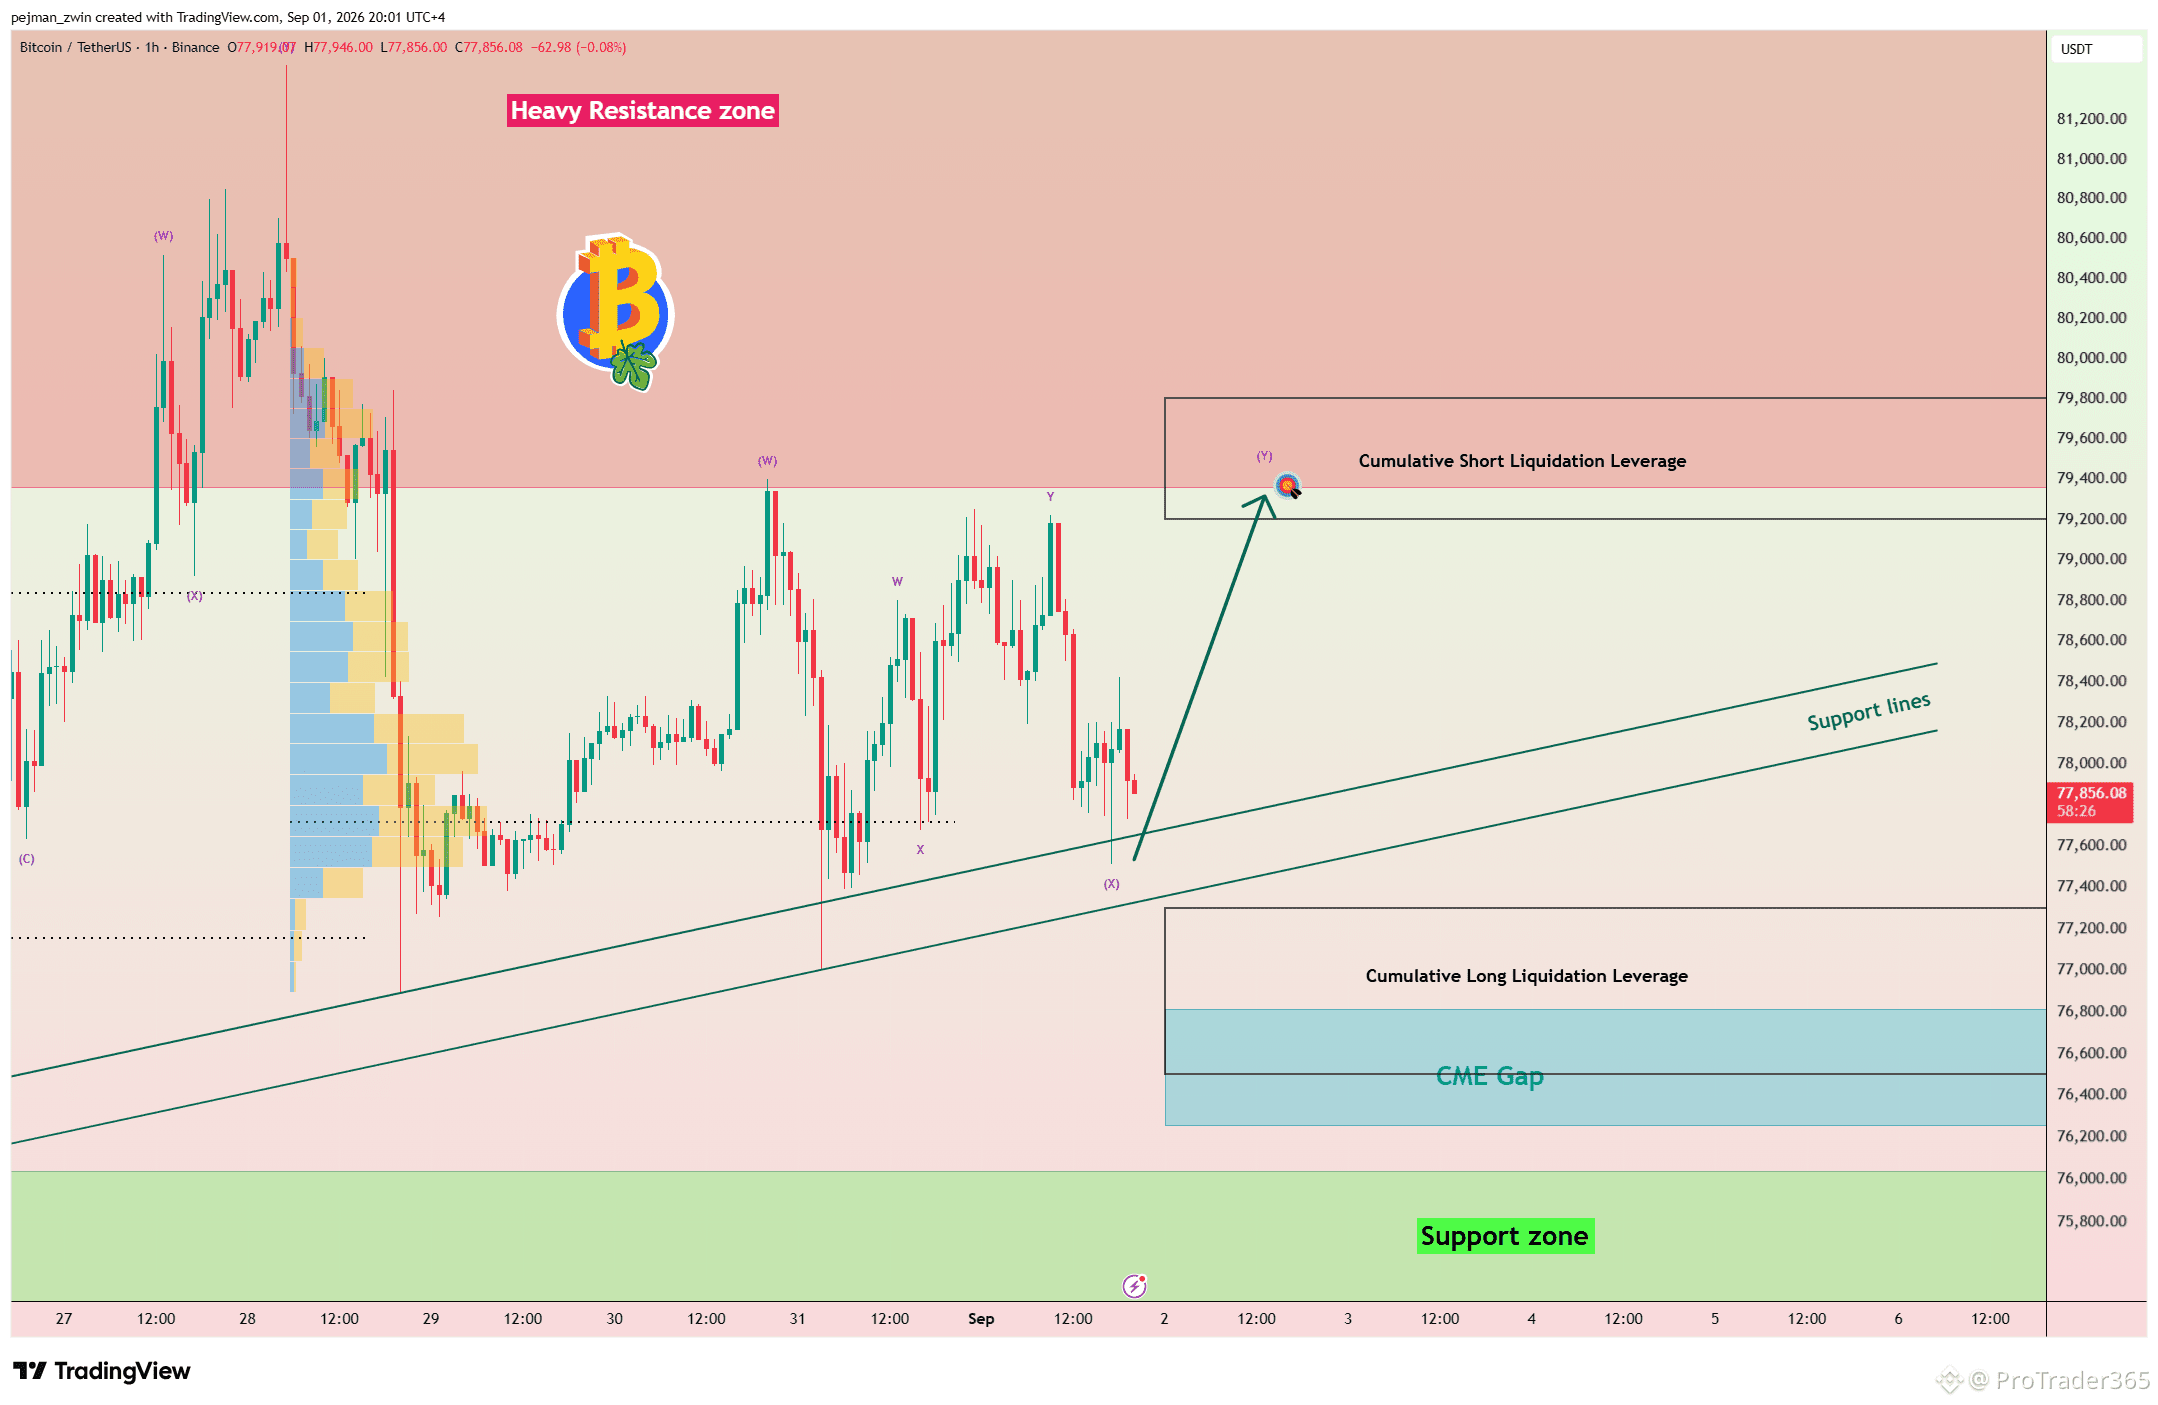
$BTC Mantém Suporte-Chave — $80.000 Pode Ser o Próximo Movimento? O Bitcoin está atualmente sendo negociado perto dos níveis-chave de negociação de US$ 77.720 e US$ 77.000, enquanto as Linhas de Suporte continuam a se manter. Uma quebra confirmada abaixo desses níveis provavelmente exigirá um impulso de baixa mais forte. Análise Técnica Na perspectiva das Ondas de Elliott, o Bitcoin parece estar desenvolvendo uma Correção Complexa na forma de uma Correção de Duplo Três (W-X-Y). A Onda X atual e suas sub-ondas internas parecem ter sido concluídas, potencialmente abrindo caminho para outro movimento de alta de curto prazo. Espero que o Bitcoin suba em direção à Alavancagem de Liquidação Curta Acumulada (US$ 79.800–US$ 79.200). Um impulso de alta mais forte pode trazer novamente a área de US$ 80.000 para o foco. Stop Loss (SL): US$ 76.970 CME Gap: US$ 76.810–US$ 76.255 O Bitcoin consegue defender US$ 77.000 e chegar à zona de liquidação antes de outra correção?
Ver tradução
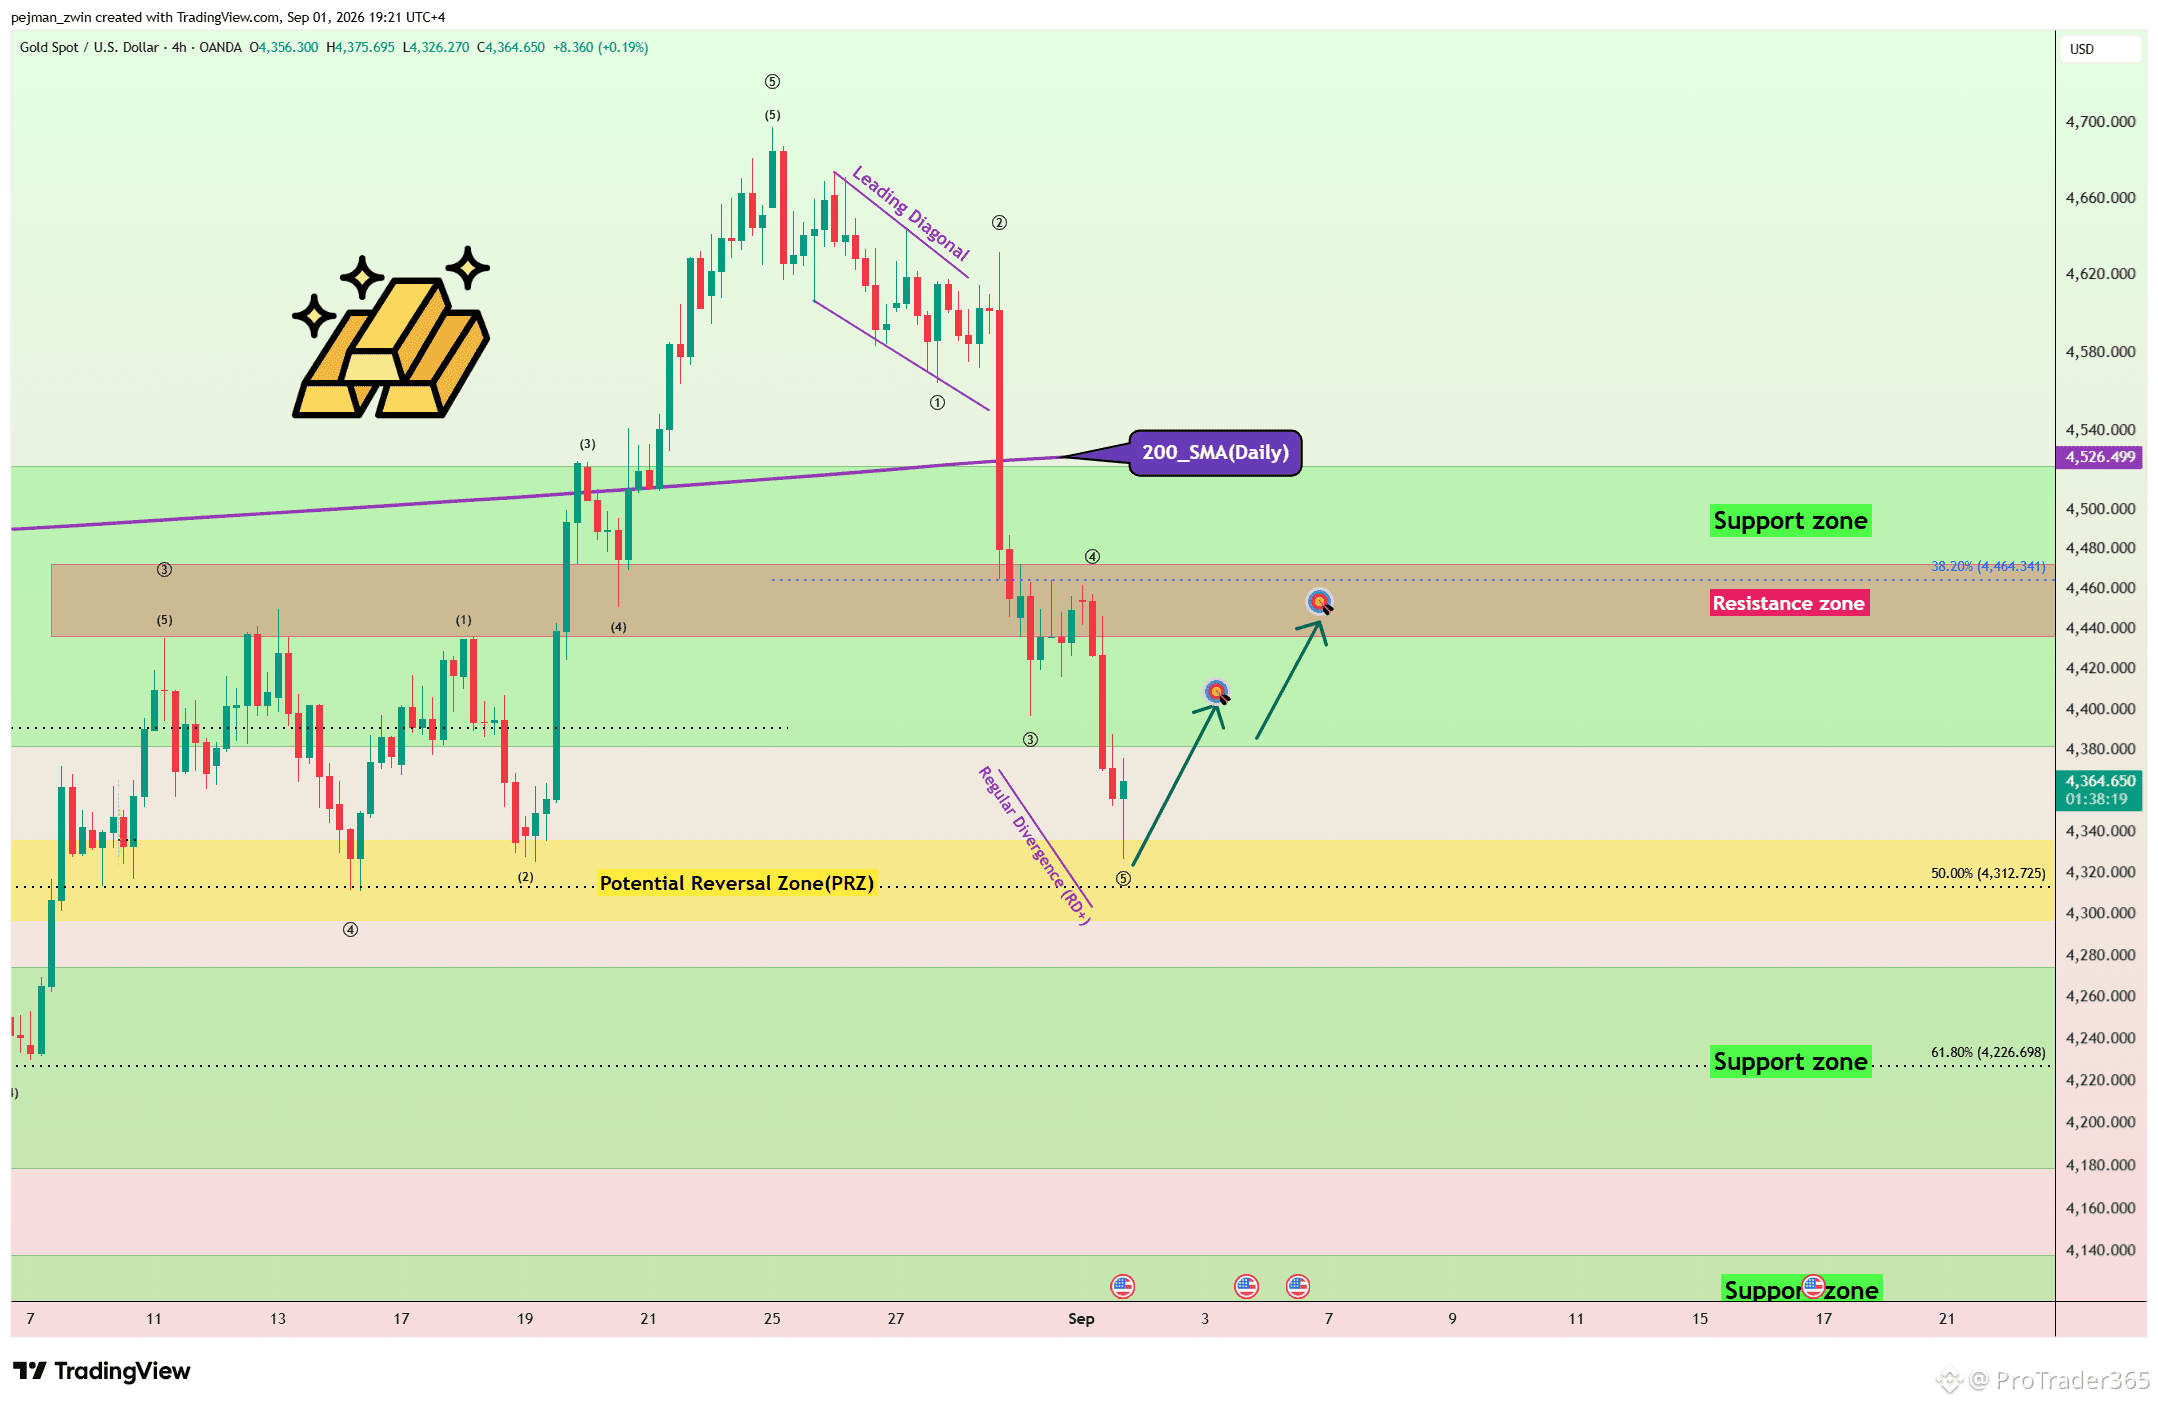
$XAUt Rebounds From the PRZ — Can Gold Reclaim $4,390? Gold reacted well to the Potential Reversal Zone(PRZ)[$4,336-$4,296] and has started to move higher. However, price remains below the 200_SMA(Daily), keeping the risk of a deeper correction alive. Technical Analysis From an Elliott Wave perspective, gold appears to be completing its fifth bearish wave, suggesting that the current downward sequence could be nearing completion. A Positive Regular Divergence(RD+) is also visible between two Consecutive Valleys, indicating that bearish momentum may be weakening. I expect gold to continue higher from the PRZ. A break above the key trading level of $4,390 could open the way toward $4,411 and then $4,441 near the Resistance Zone. Stop Loss(SL): $4,285 Can gold reclaim $4,390 and extend the recovery, or is this bounce only temporary? #Gold
Ver tradução
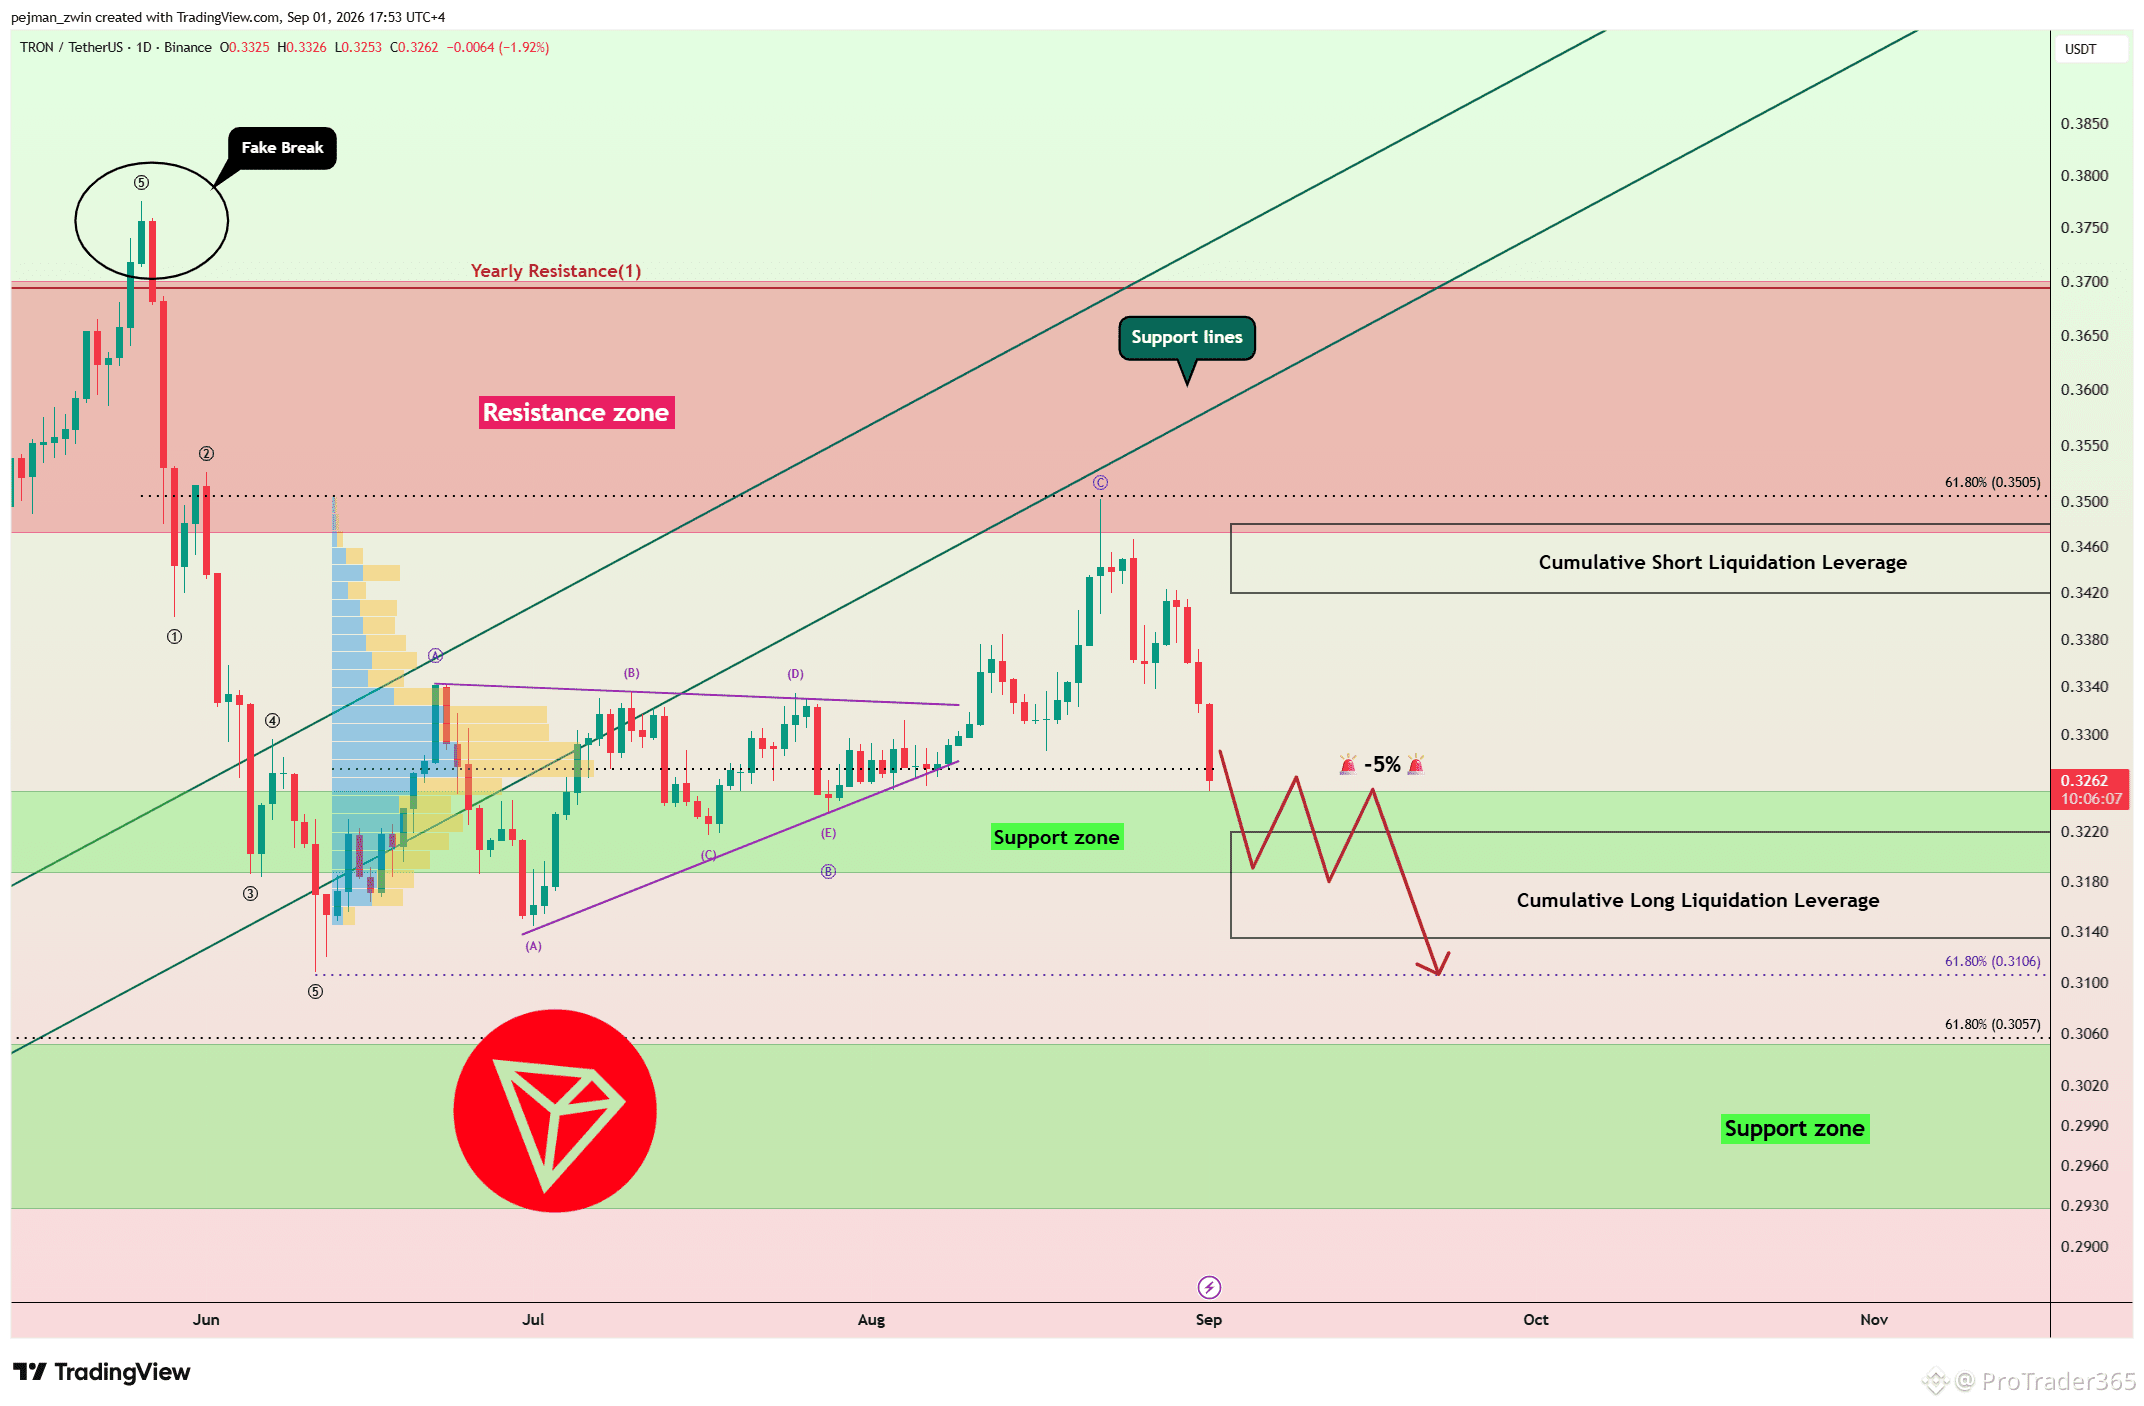
$TRX Could Extend Its Decline After Losing Key Support Lines TRX failed to break above the Resistance Zone and subsequently lost its key Support Lines. Over the past few days, price has also completed its pullback toward the broken structure, keeping the broader setup bearish. From an Elliott Wave perspective, the current structure suggests that additional bearish waves could still develop. I expect TRX to potentially decline by at least 5% after a confirmed breakdown of the Support Zone. However, the Cumulative Long Liquidation Leverage($0.313-$0.322) could create temporary upside volatility or a short-term reaction as price approaches this area. Despite possible rebounds, I expect the bearish trend to continue unless the broken support structure is successfully reclaimed. Will TRX break the Support Zone first, or rebound from the liquidation area?
Ver tradução
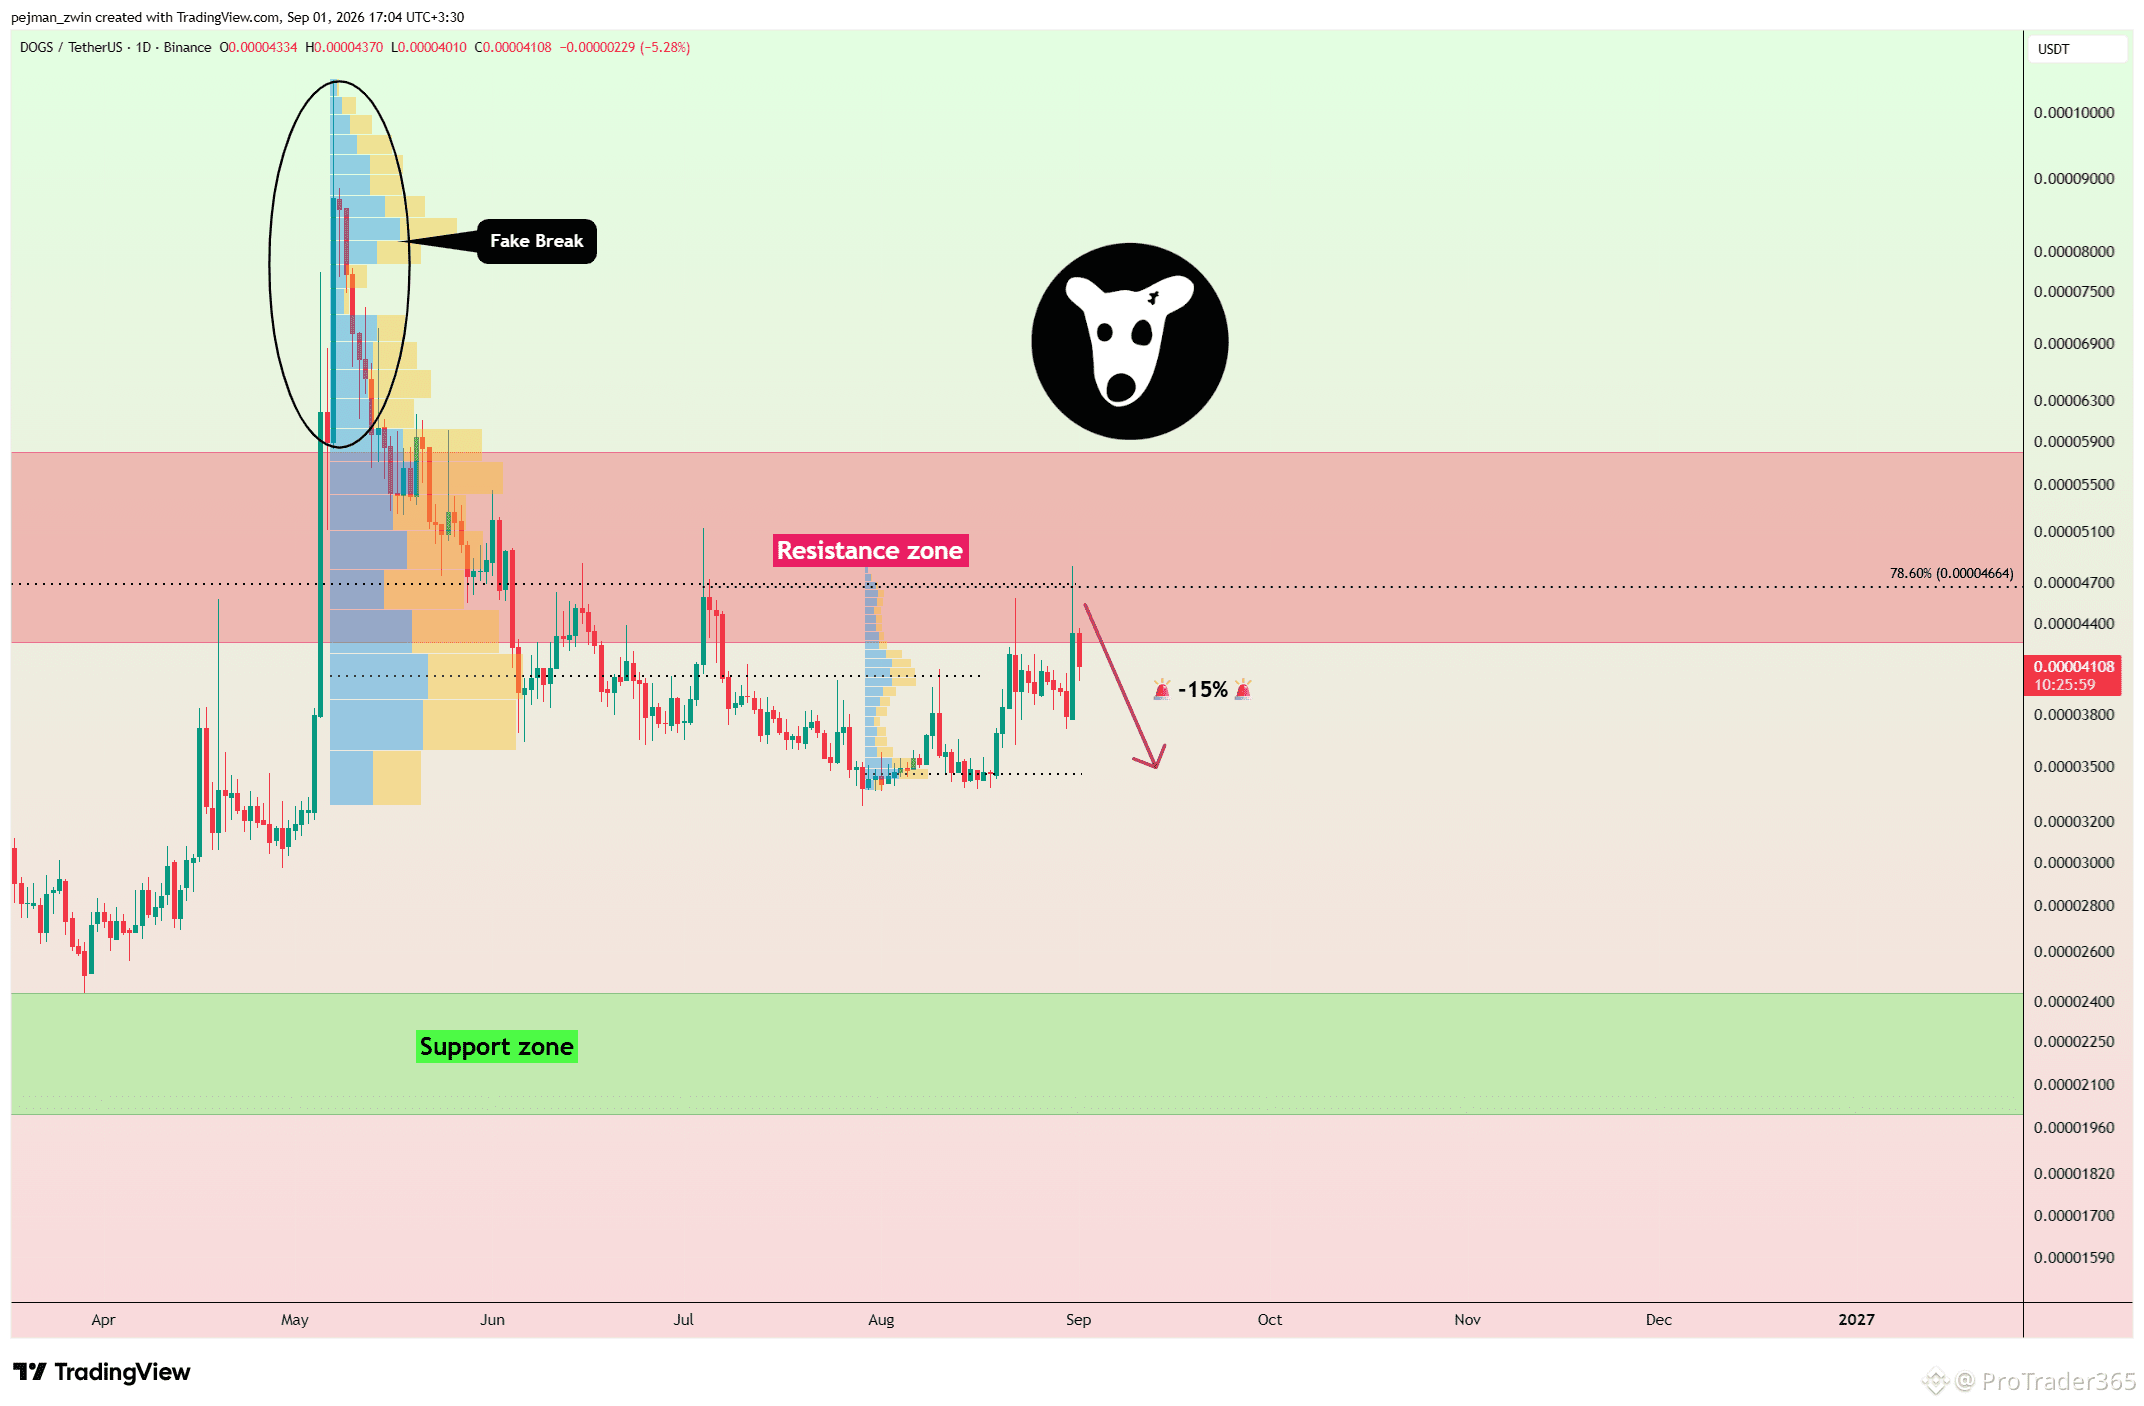
$DOGS Fake Breakout Could Trigger Another 15% Correction DOGS failed to break above the Resistance Zone and instead formed a Fake Breakout, pushing price back below the resistance area and the key $0.000047 trading level. More importantly, the previous daily candle also failed to close back above $0.000047, suggesting that sellers are still controlling the current price structure. As long as DOGS remains below the Resistance Zone and the $0.000047 level, I expect the corrective move to continue. From the current structure, DOGS could potentially decline by at least 15% toward the important $0.000035 trading level. A successful reclaim of $0.000047 would be the first sign that the bearish scenario is weakening. Do you think DOGS reaches $0.000035 first, or reclaims $0.000047? #DOGS #Meme Alpha#
Ver tradução
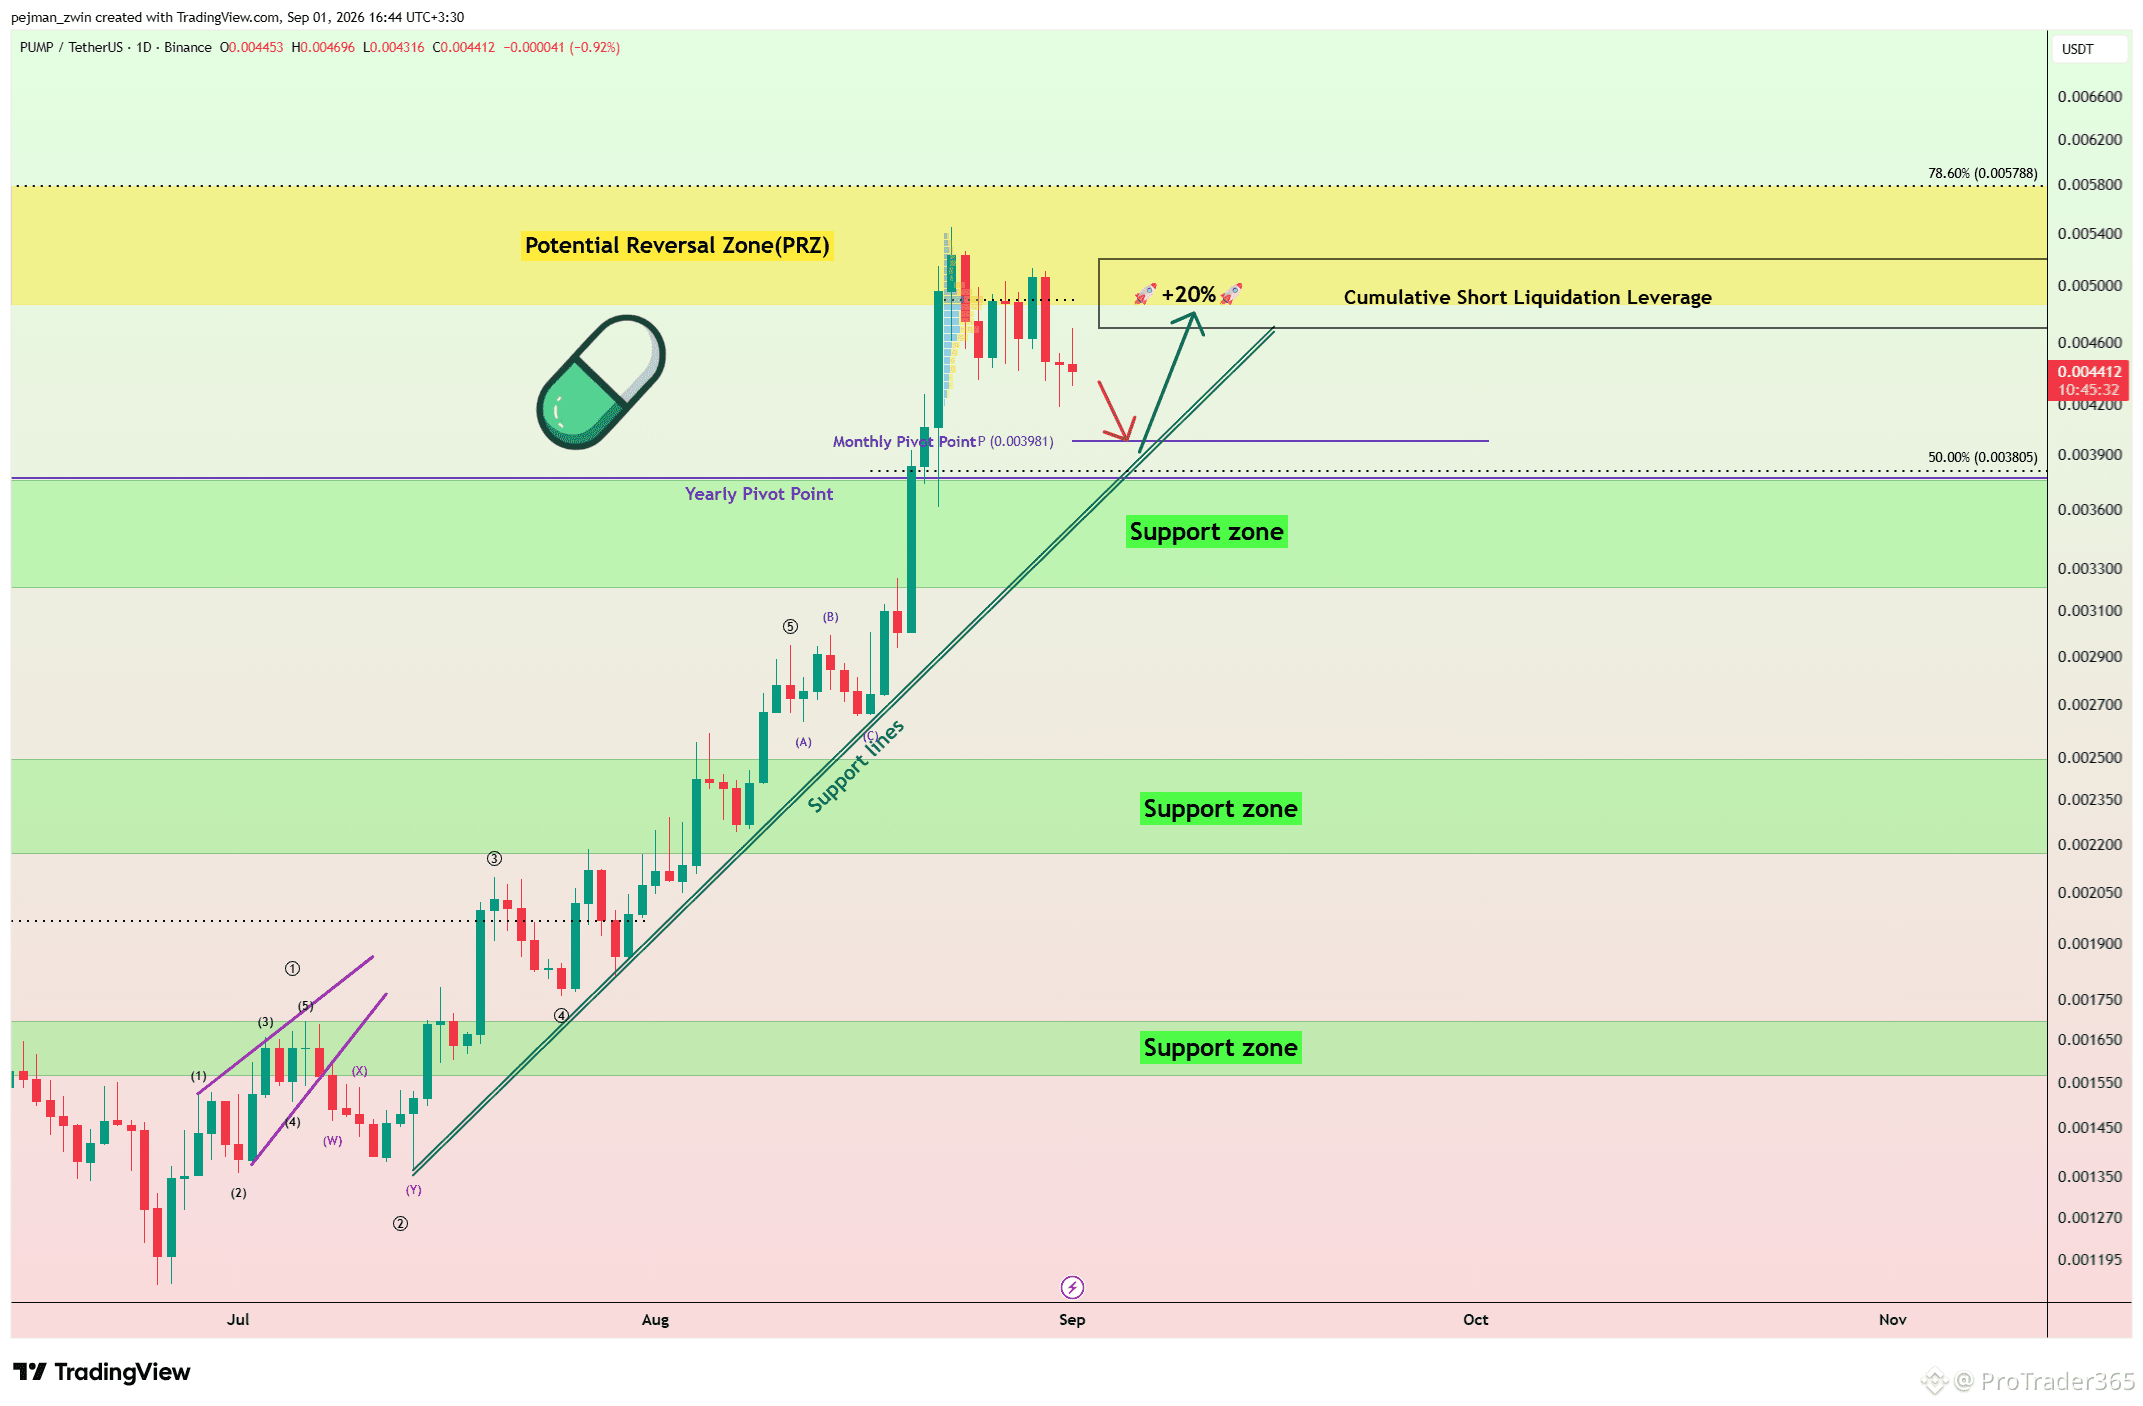
$PUMP Could Be Setting Up for a 20% Recovery Move PUMP experienced a strong pump before entering a corrective phase, and over the past 10 days the token has been moving in a short-term downtrend as part of this correction. Despite the pullback, the broader bullish momentum remains important. I expect the next bullish move to potentially begin from around the Support Lines, Monthly Pivot Point, and Yearly Pivot Point. If buyers react strongly from these areas, PUMP could recover by at least 20% and move toward the important trading levels at $0.0049 and $0.0051, as well as the Cumulative Short Liquidation Leverage($0.0047-$0.0052). As long as these key support areas remain intact, the current correction could become the foundation for the next bullish move. Do you think PUMP will start its next bullish move from these support areas? #pumpfun
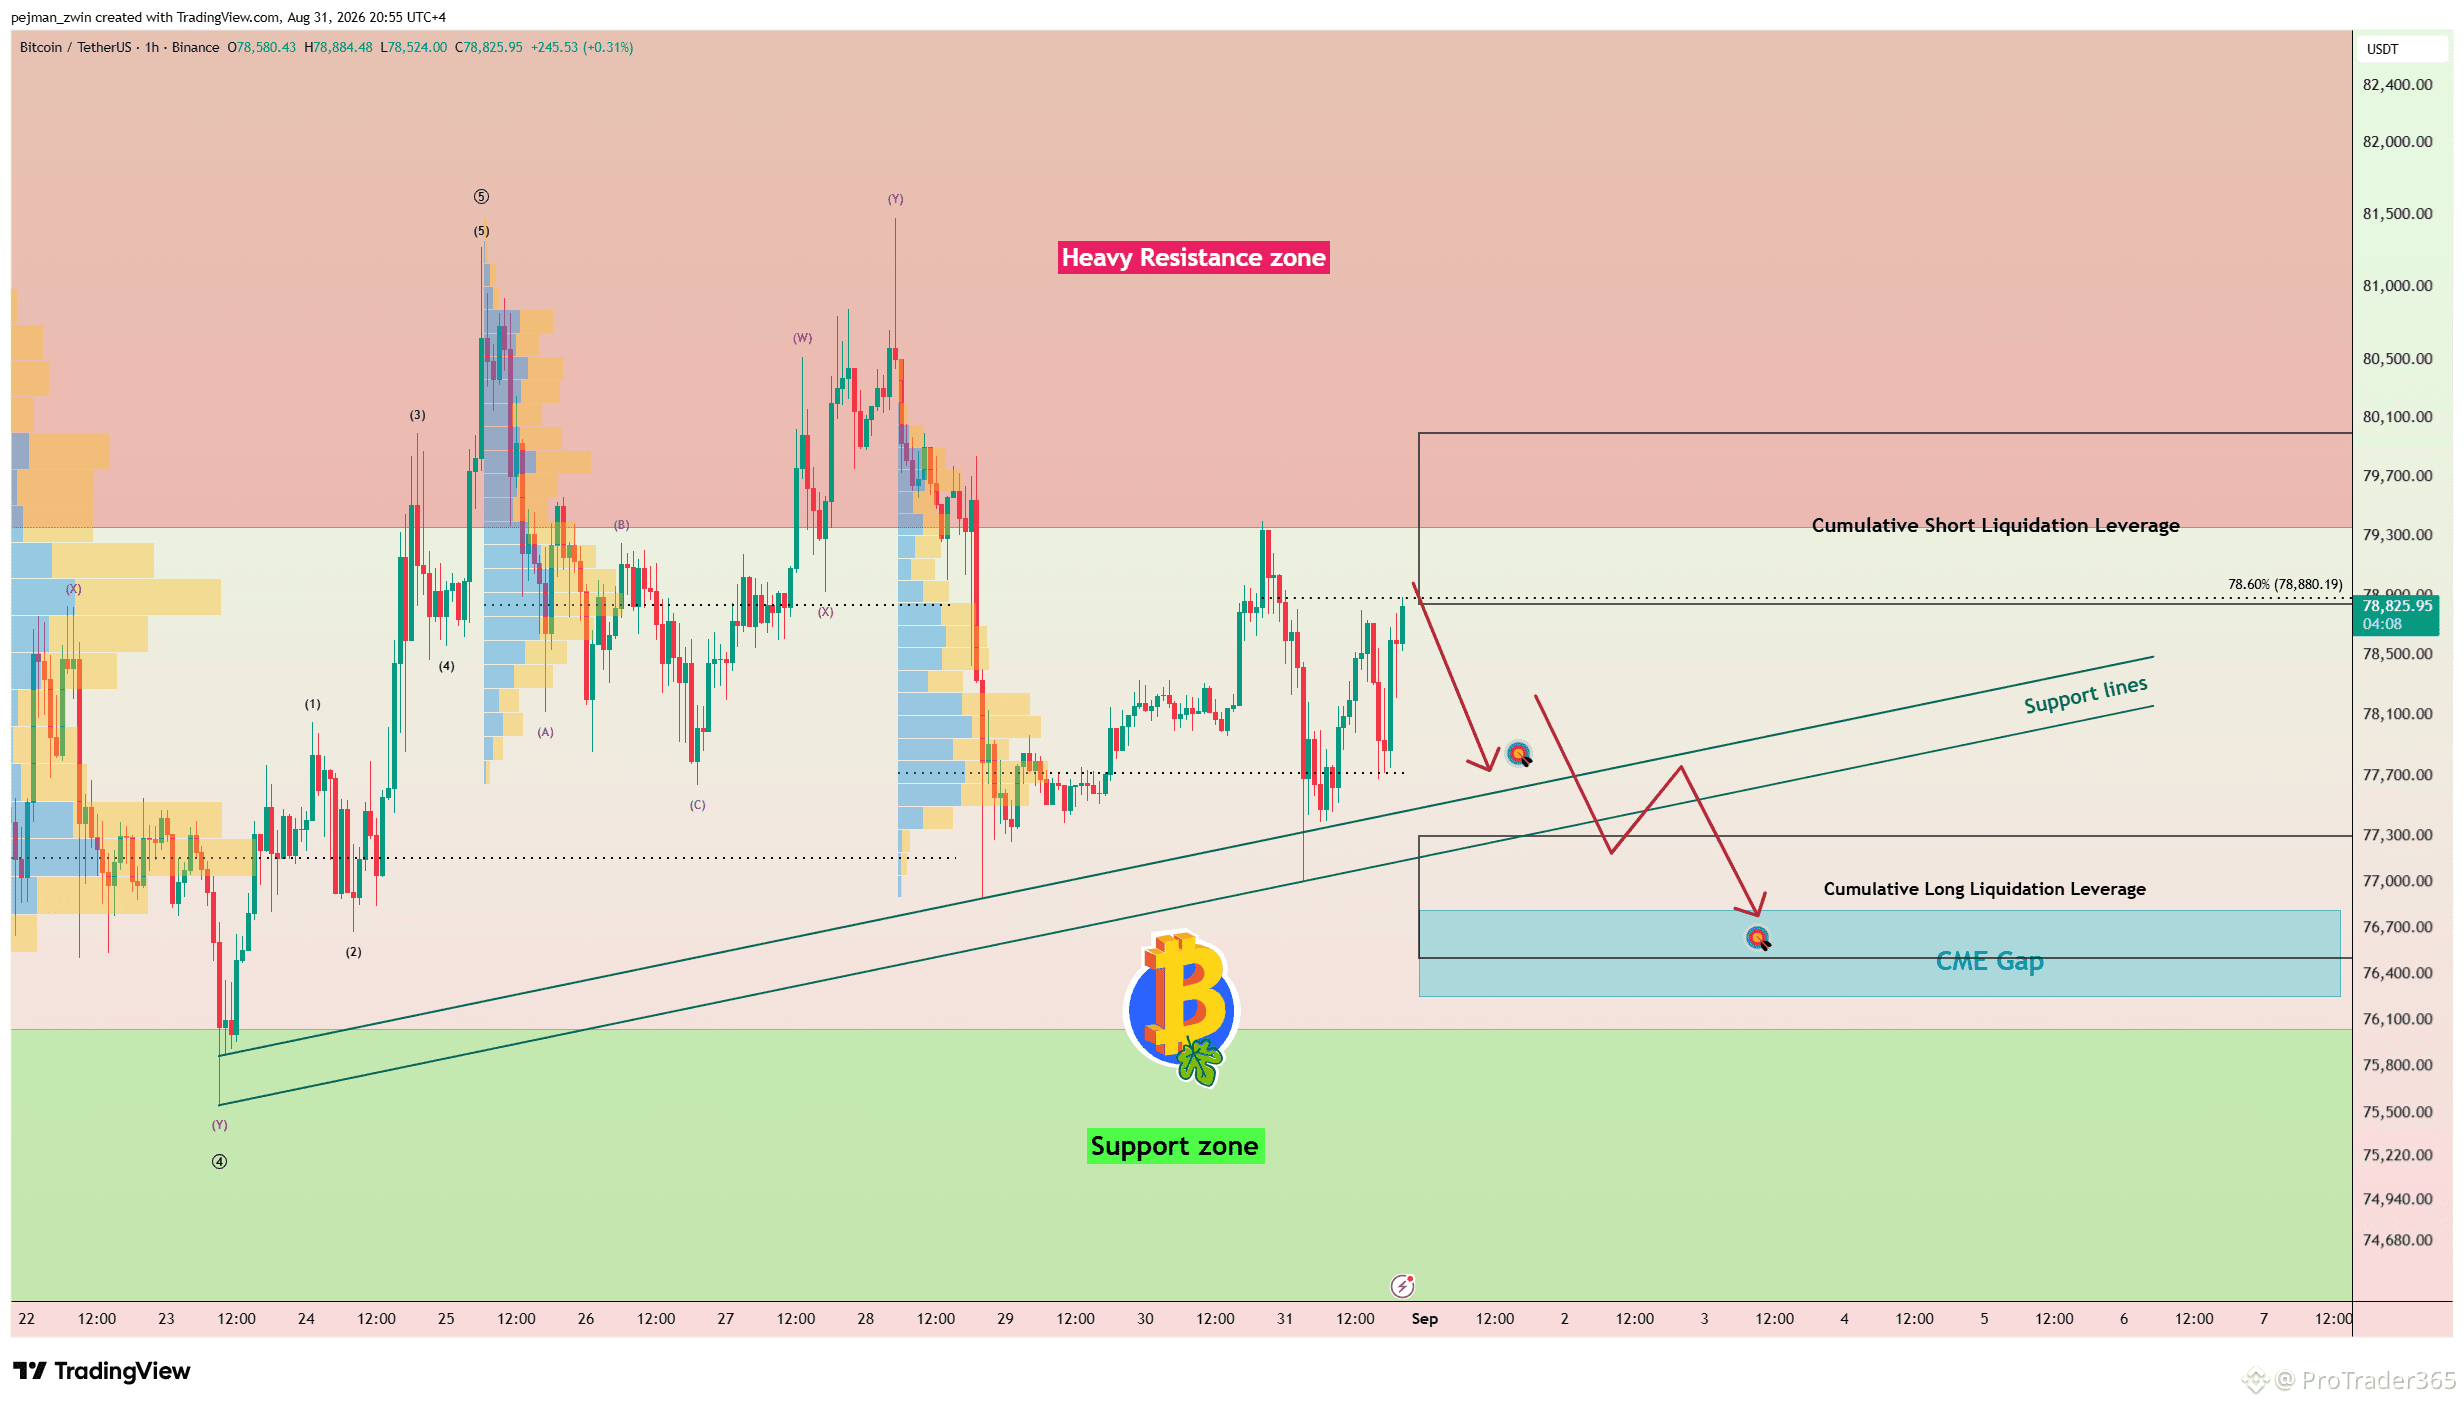
$BTC Enfrenta um Maior Risco de Correção Abaixo de $80.000 O Bitcoin não conseguiu romper acima da importante faixa de negociação de $80.000 e começou a cair à medida que os comentários mais hawkish de Warsh sobre a inflação fortaleceram o dólar e impulsionaram a alta do rendimento do Tesouro dos EUA de 10 anos. Análise Técnica Atualmente, o Bitcoin está negociando perto da Alavancagem de Liquidação Curta Acumulada ($80.000-$78.840) e do nível-chave de negociação de $78.800. Espero que o Bitcoin comece a cair a partir dessa região em direção a $77.720. Se o momentum de baixa aumentar, o preço poderá romper abaixo das Linhas de Suporte e do crucial nível de negociação de $77.000, abrindo caminho para a Alavancagem de Liquidação Longa Acumulada ($77.300-$76.500) e possivelmente preenchendo a Lacuna do CME inferior ($76.810-$76.255). Primeiro Take Profit (TP): $77.720 Stop Loss (SL): $80.080 Em qual nível o Bitcoin deve chegar primeiro: $76.500 ou $80.080? #Análise do Preço do BTC# #Qual é sua Previsão de Preço do Bitcoin?#
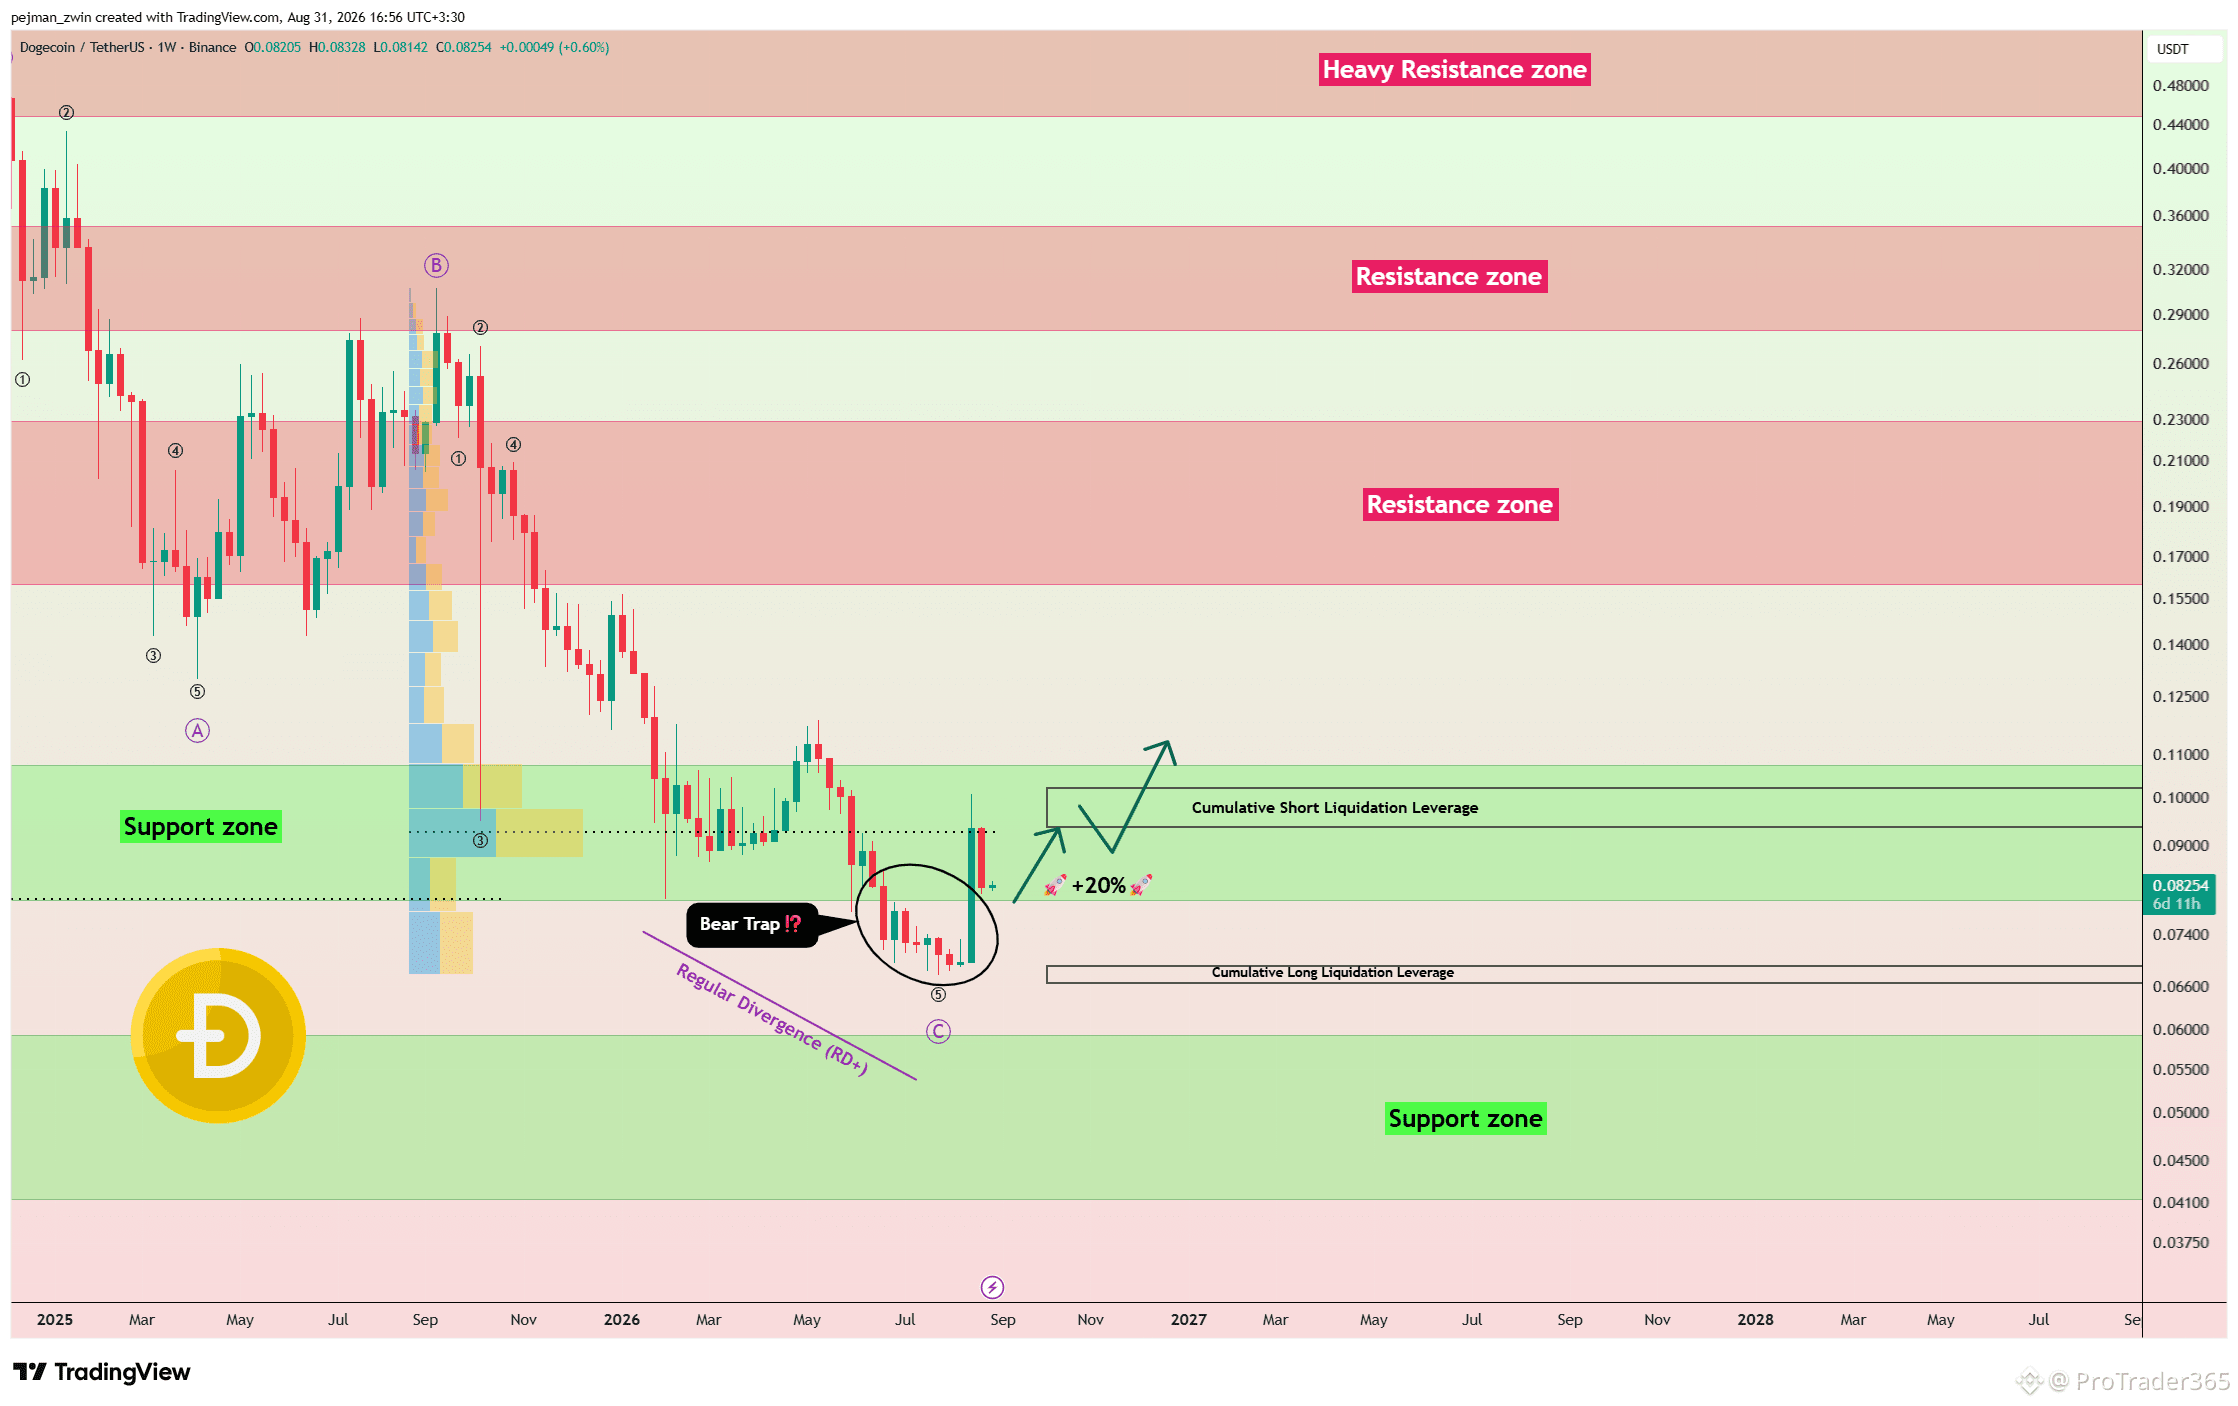
$DOGE A Armadilha de Urso Pode Acionar o Próximo Movimento Altista de 20% O $DOGE parece estar se recuperando de uma Bear Trap formada abaixo do importante nível de negociação de US$ 0,080 e da Zona de Suporte. Quando uma armadilha é confirmada, o preço muitas vezes pode reagir de forma forte na direção oposta, com maior impulso. Na perspectiva das Ondas de Elliott, a estrutura corretiva Zigzag semanal parece estar concluída, potencialmente abrindo caminho para uma onda altista impulsiva no curto prazo. Divergência positiva também é claramente visível entre mínimas consecutivas, adicionando ainda mais confirmação de que o impulso altista pode estar se desenvolvendo. Enquanto a estrutura atual de suporte permanecer intacta, espero que o DOGE possa ganhar pelo menos 20% em direção ao nível de negociação de US$ 0,0925 e à Alavancagem de Liquidação Curta Acumulada (US$ 0,0937–US$ 0,102). O DOGE consegue romper acima dessa zona de liquidez e estender o movimento altista ainda mais? #DOGE
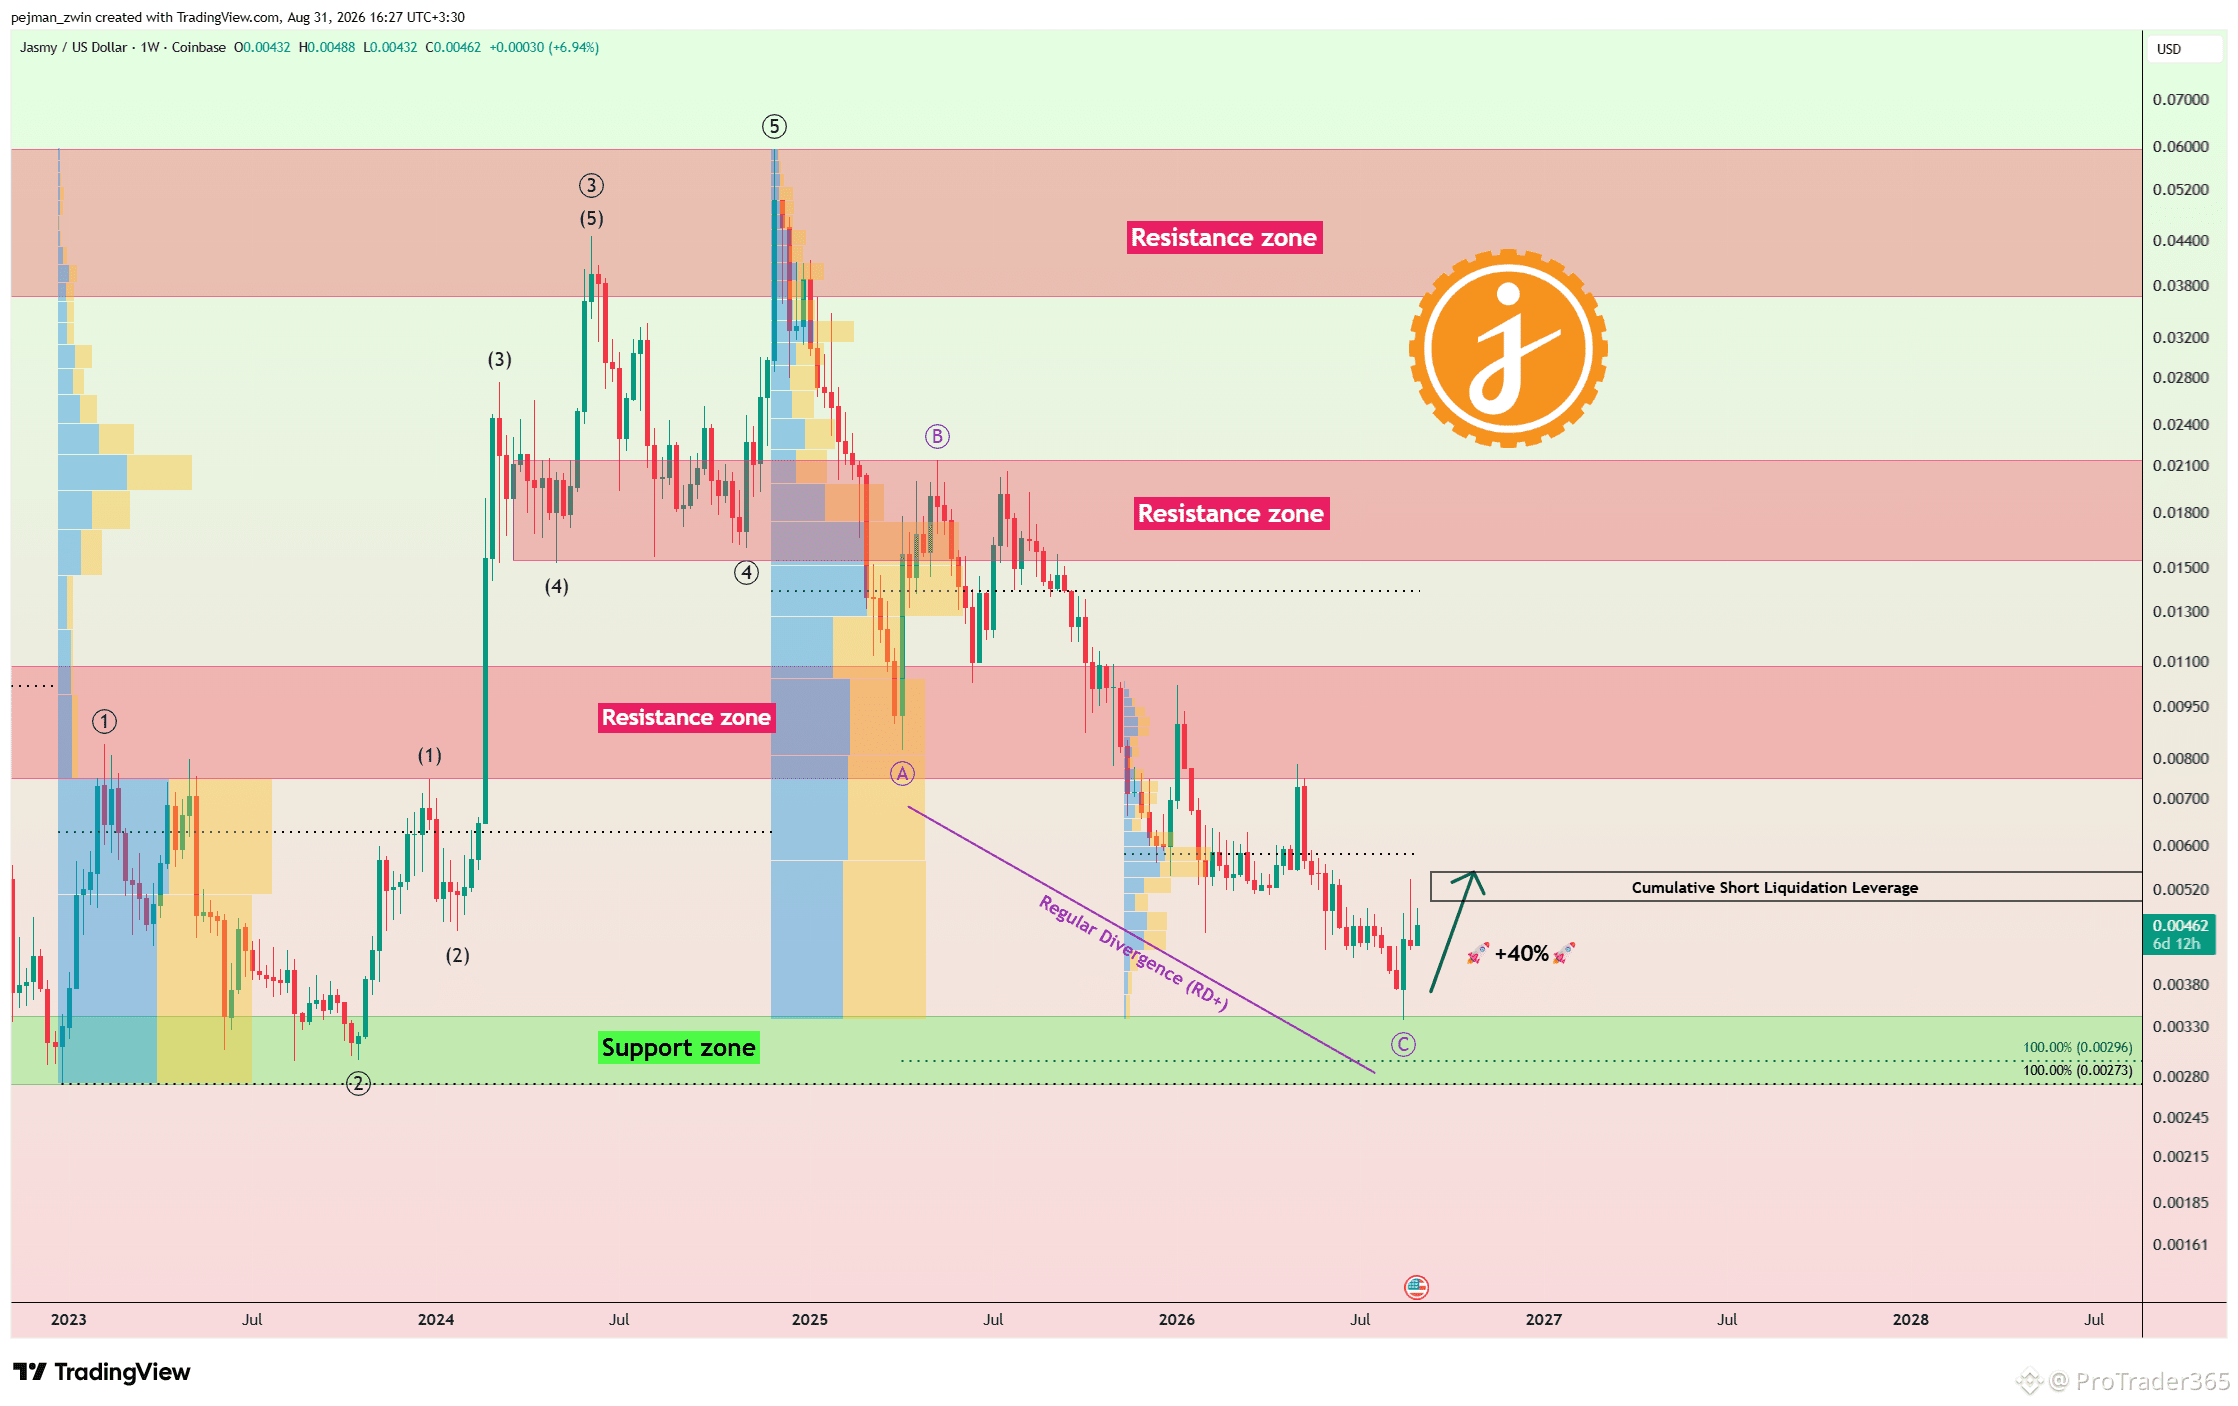
$JASMY Pode estar construindo uma configuração de recuperação de 40% Os fundamentos do JASMY estão mostrando sinais mistos, mas em melhora. Catalisadores positivos incluem a colaboração entre Jasmy, Panasonic Advanced Technology e Jasmy Lab no serviço de GPU distribuído Smart Render, enquanto cerca de 98,9% da oferta máxima de 50B já está em circulação, reduzindo o risco de diluição futura. No entanto, a adoção do JasmyChain ainda é limitada, a concentração de baleias continua alta e o cancelamento de listagem da Upbit e da Bithumb, agendado para 14 de setembro, pode aumentar a volatilidade no curto prazo. Do ponto de vista técnico, o JASMY reagiu fortemente a partir da Zona de Suporte. Com base na Teoria das Ondas de Elliott, a estrutura Zigzag corretiva semanal pode já estar concluída, enquanto Divergência Positiva é visível em relação ao preço, volume e vários indicadores. Enquanto a Zona de Suporte se mantiver, espero um potencial ganho de 40% nos próximos dias e semanas. Níveis-chave: $0,0058 e $0,0063. Uma ruptura pode abrir caminho para $0,0073. O JASMY conseguirá romper esses Níveis-chave antes que a volatilidade do cancelamento de listagens se intensifique? #JASMY
Ver tradução
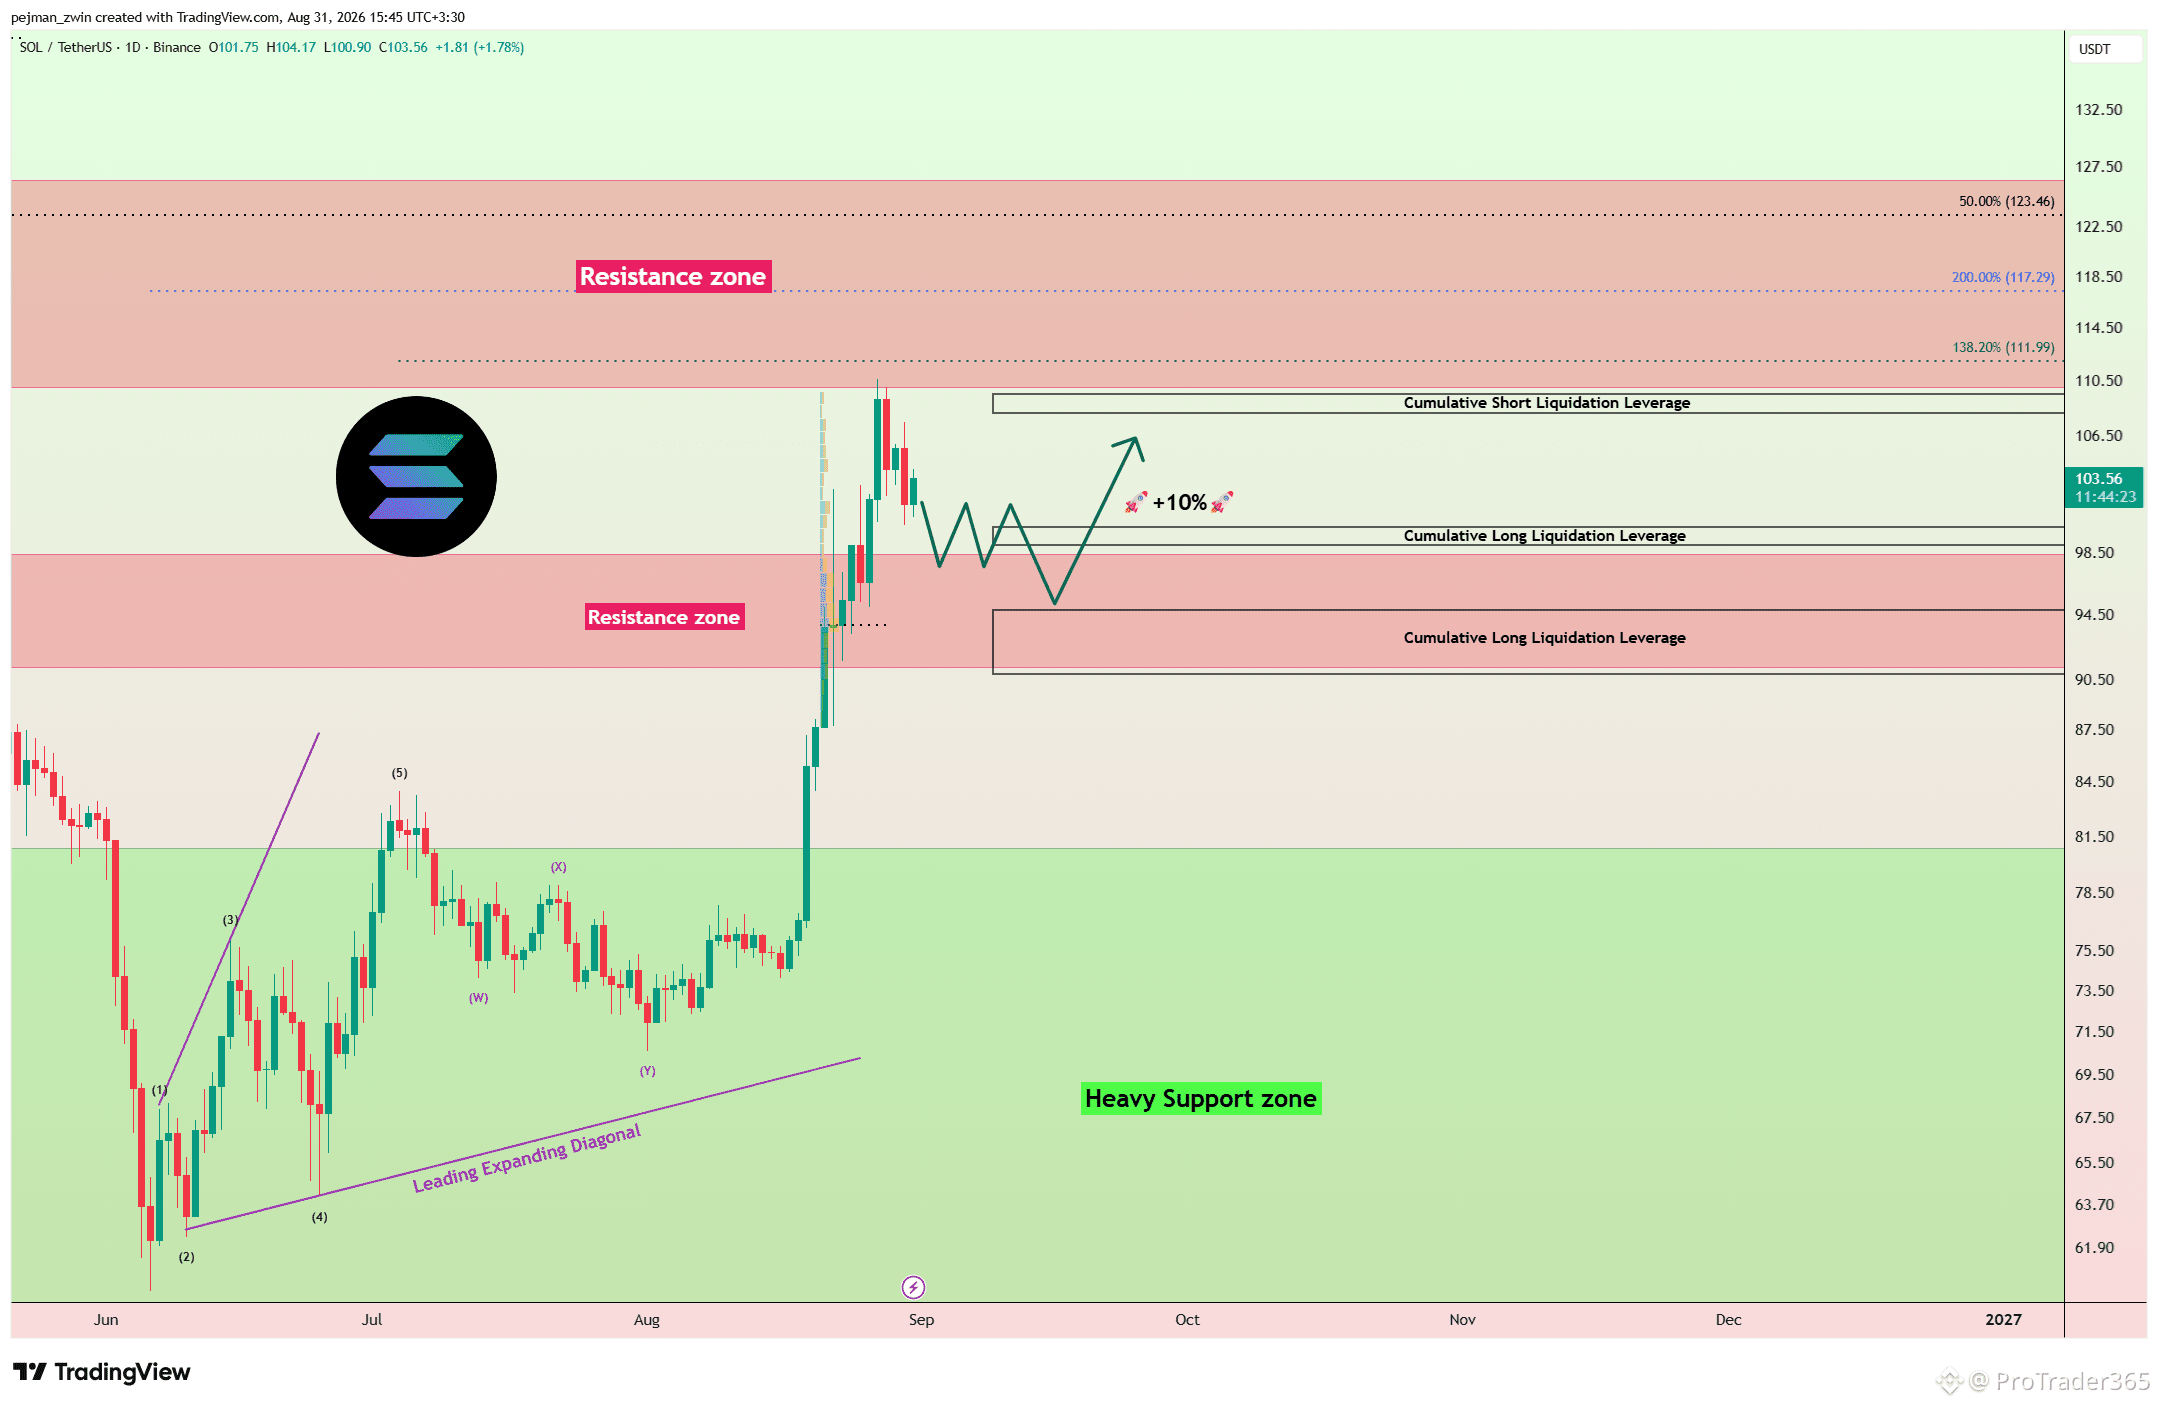
$SOL Pullback Could Set Up the Next 10% Bullish Move Solana broke above the Resistance Zone with strong volume, confirming significant buying pressure. Price is now pulling back toward the breakout area and approaching the Cumulative Long Liquidation Leverage($99.00-$100.20) and the deeper Cumulative Long Liquidation Leverage($90.80-$94.80). The $94 level remains an important trading level for maintaining the broader bullish structure. I expect Solana to potentially complete its pullback around these liquidity areas before starting another bullish move. If buyers successfully defend the support zones, price could gain at least 10% and target the Cumulative Short Liquidation Leverage($108.20-$109.50). Do you think Solana completes the pullback above $94 and starts the next bullish leg? #SOL #Solana
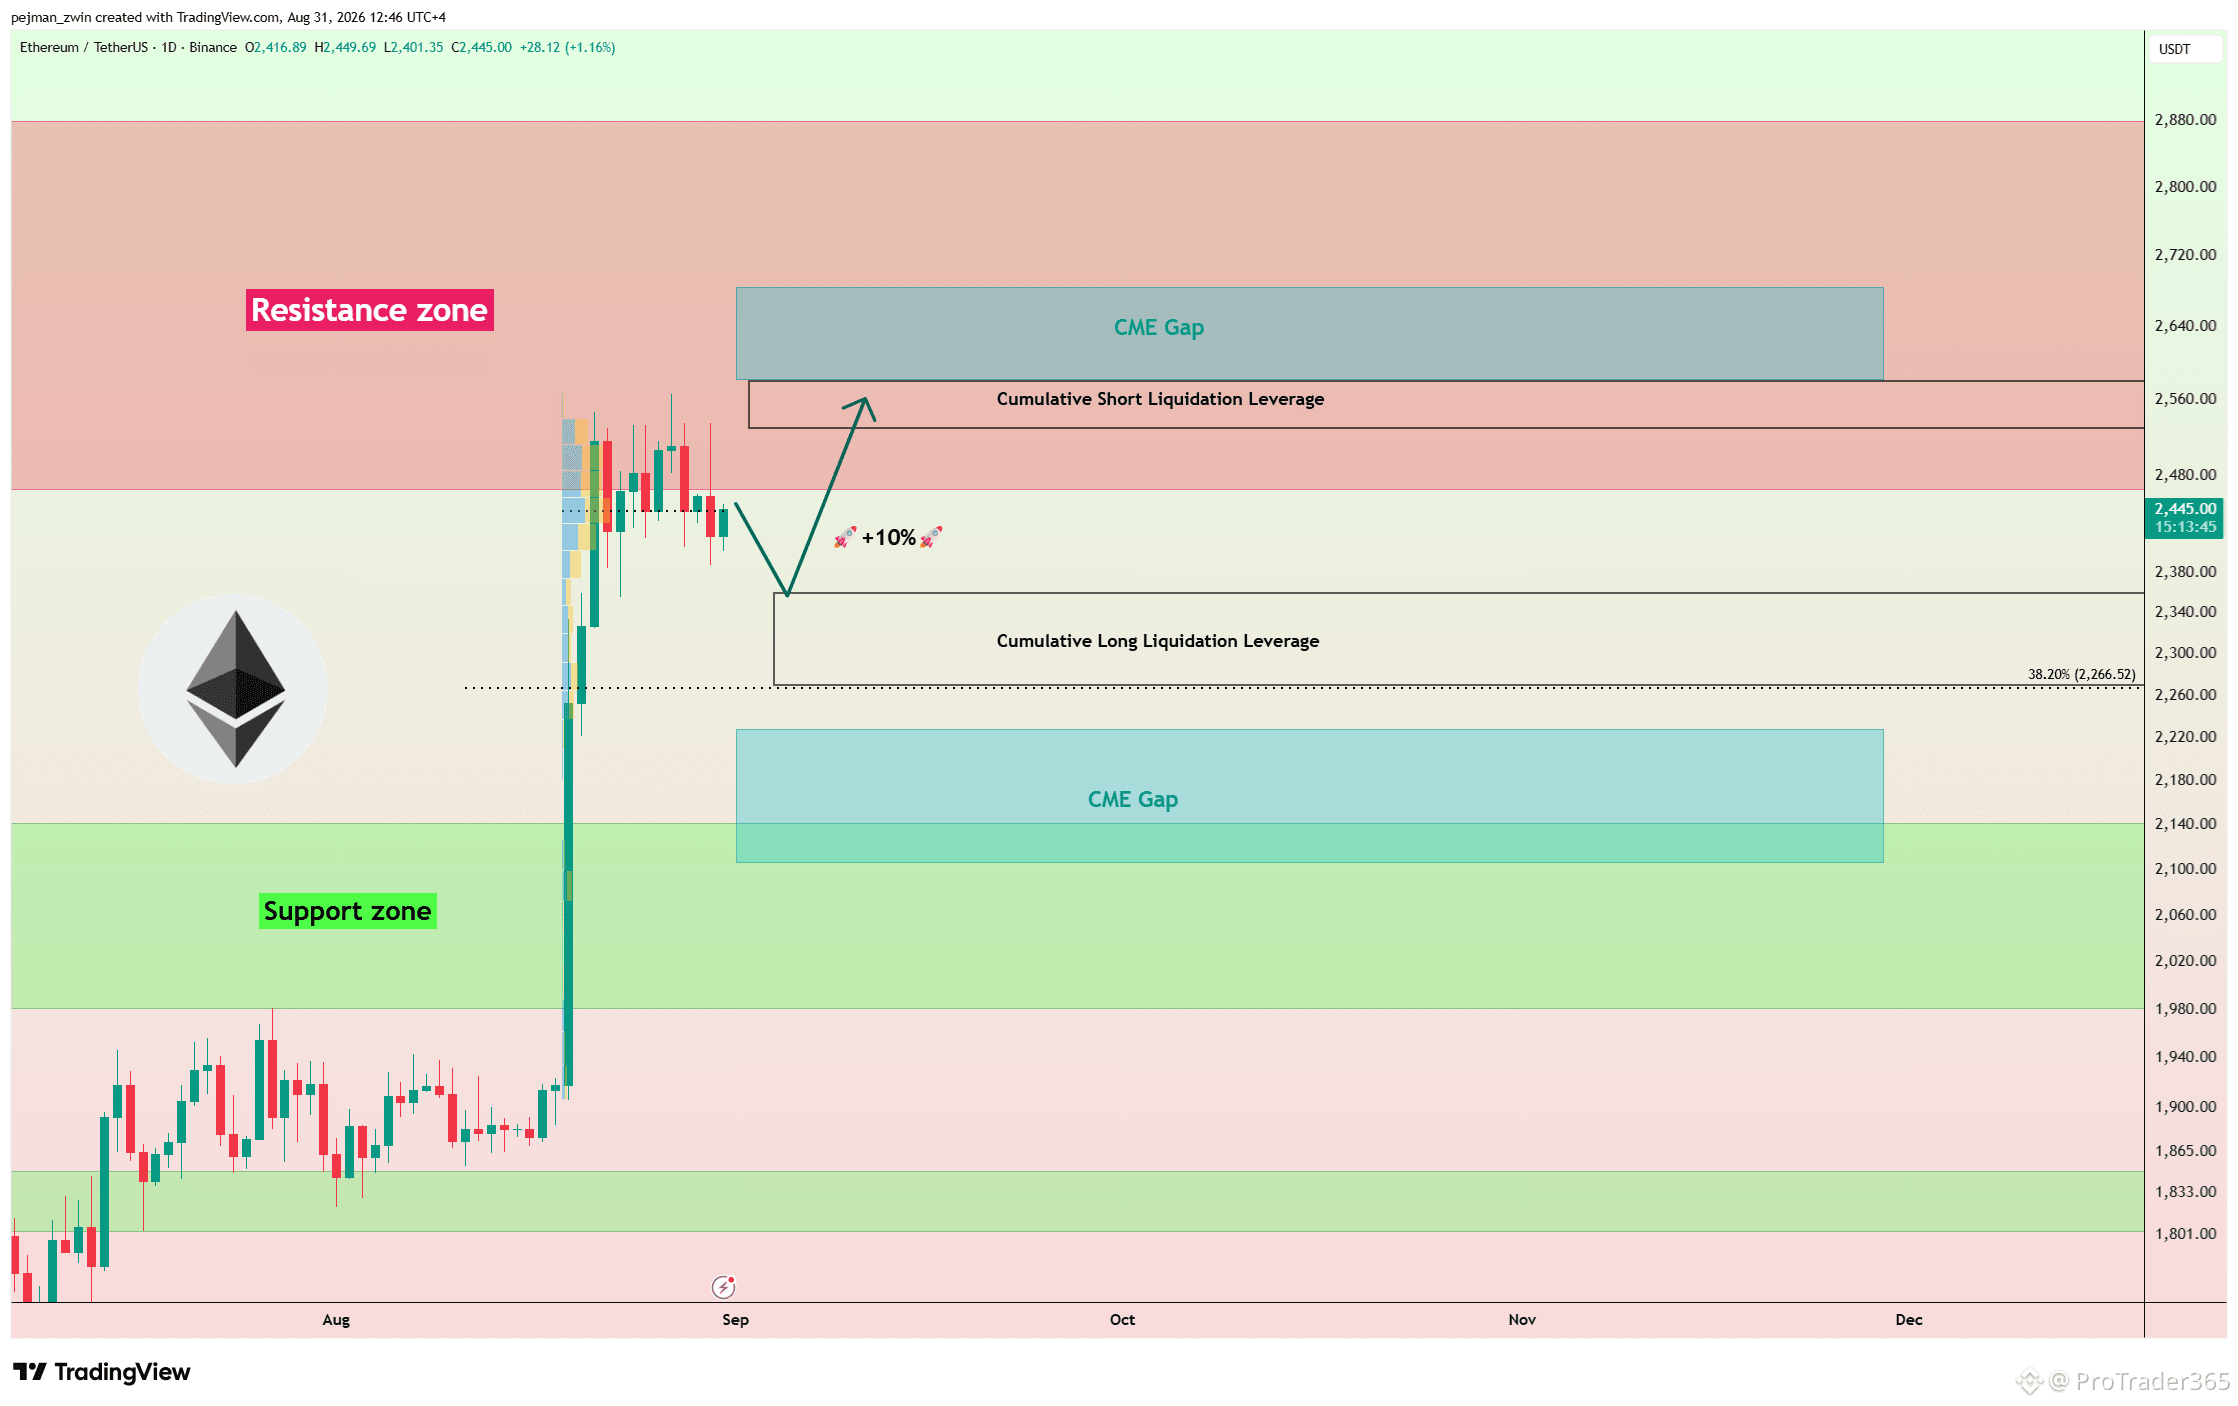
$ETH O Ethereum pode superar o Bitcoin no próximo movimento altista O Ethereum parece estar em uma posição mais forte do que o Bitcoin, enquanto o gráfico ETH/BTC continua a mostrar força altista. Essa força relativa também pode criar oportunidades em projetos de alto potencial dentro do ecossistema Ethereum. No momento, o Ethereum está sendo negociado perto de uma Zona de Resistência importante. Espero que o Ethereum possa iniciar mais um movimento altista a partir da Alavancagem de Liquidação Longa Acumulada ($2.270-$2.360) e ganhar pelo menos 10%, mirando a Alavancagem de Liquidação Curta Acumulada ($2.530-$2.580). Se o impulso altista continuar forte, o Ethereum pode seguir subindo e potencialmente preencher a Lacuna CME superior ($2.582-$2.684,5). O Ethereum conseguirá manter sua força relativa contra o Bitcoin e alcançar a Lacuna CME superior durante o próximo movimento altista? #ETH #Ethereum
Ver tradução
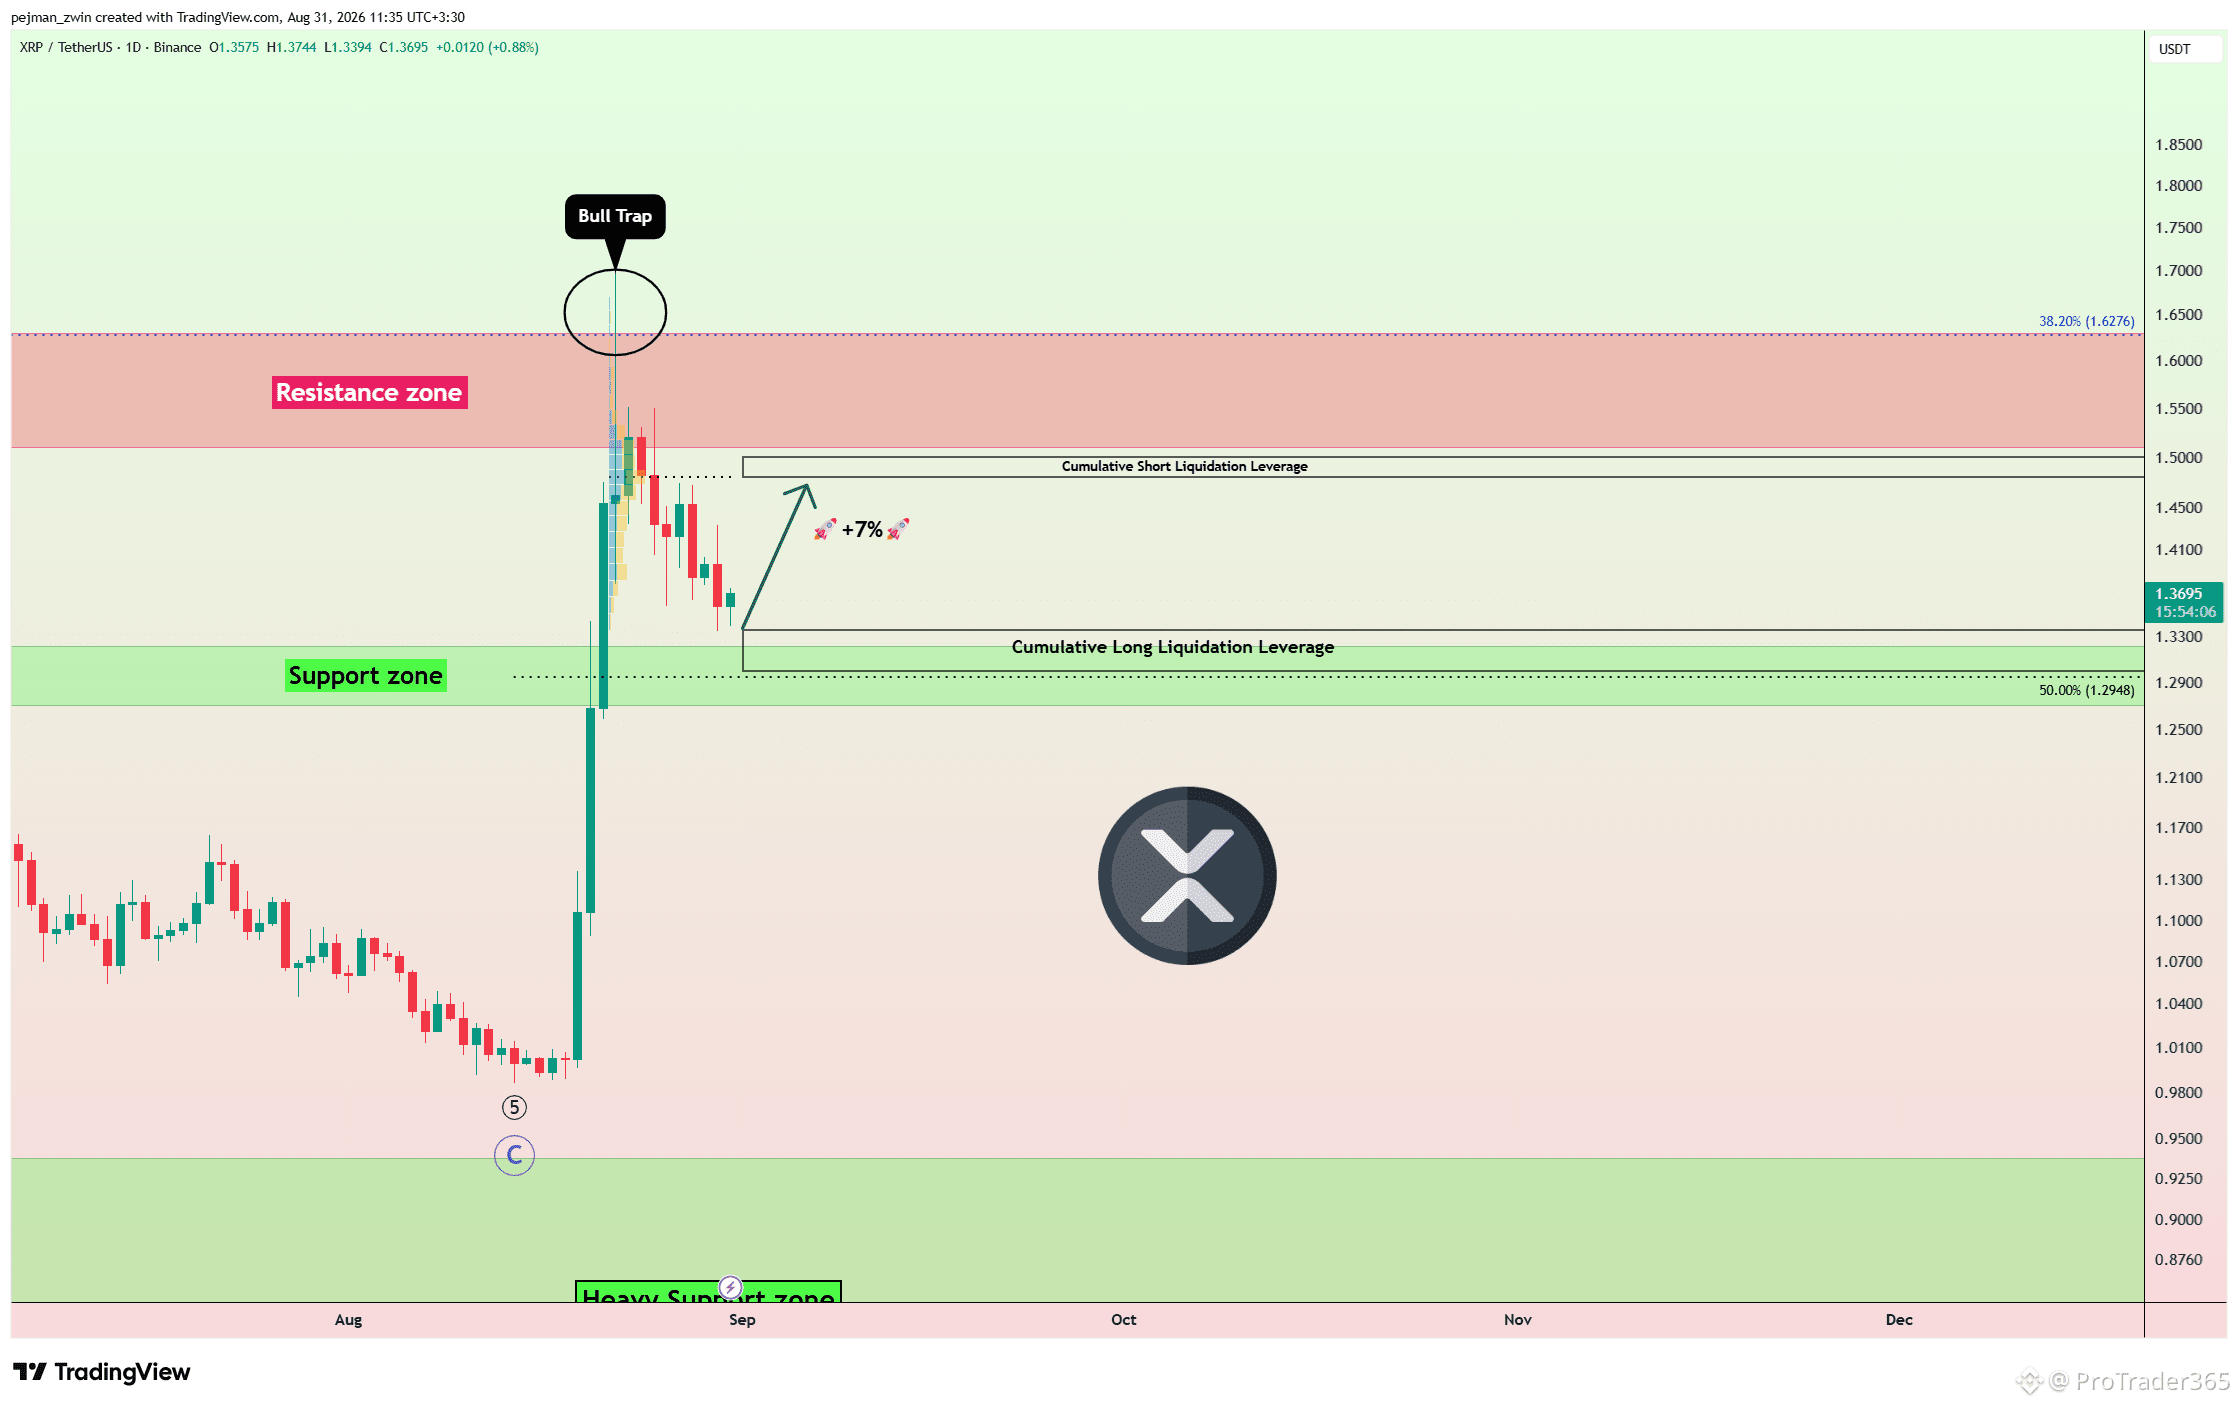
$XRP Tests a Key Support Confluence After a Bull Trap XRP failed to break above the Resistance Zone and formed a Bull Trap above it, triggering the current corrective phase. The price is now trading near an important support confluence formed by the Support Zone and the Cumulative Long Liquidation Leverage($1.30-$1.336). If buyers successfully defend this area, I expect XRP to begin another bullish move and gain at least 7%, targeting the important trading level at $1.48 and the Cumulative Short Liquidation Leverage($1.48-$1.50). The liquidity clustered around $1.48-$1.50 could become the next major target if bullish momentum returns. Do you think XRP can rebound from the current support area and reach $1.48 next? #XRP #Ripple
$BTC Enfrenta um Teste de Alta Volatilidade enquanto o presidente do Fed, Warsh, Discursa Restam menos de 15 minutos até o presidente do Fed, Warsh, falar, e a volatilidade pode subir acentuadamente em Bitcoin, Ouro e no Dólar dos EUA. Um tom levemente mais hawkish provavelmente apoiaria o USD e pressionaria inicialmente Bitcoin e Ouro. Uma mensagem fortemente hawkish poderia desencadear um movimento mais acentuado de aversão ao risco, enquanto uma surpresa dovish provavelmente enfraqueceria o USD e sustentaria ambos os ativos. Porém, a primeira reação do mercado pode ser enganosa. O Chicago PMI, o Índice de Confiança da Universidade de Michigan e, potencialmente, revisões na folha de pagamentos também estão previstos para o mesmo período, aumentando significativamente o risco de “whipsaw” (movimentos bruscos e contrários). O ponto principal é evitar reagir cegamente ao primeiro candle e esperar o mercado separar a mensagem de Warsh dos dados econômicos. Você espera que Warsh soe hawkish ou traga uma surpresa dovish? #FedRate #BTC Price Analysis#
Inicia sessão para explorar mais conteúdos