

Reed Ratulowski bMen
328 Publicações

Reed Ratulowski bMen
Denunciar
Bloquear Utilizador
Crypto Analyst & Strategist - Expert in market, Passionate about blockchain. Renowned for precise, actionable insights. Connect for market analysis.
0 A seguir
8 Seguidores
1 Gostaram
Publicações
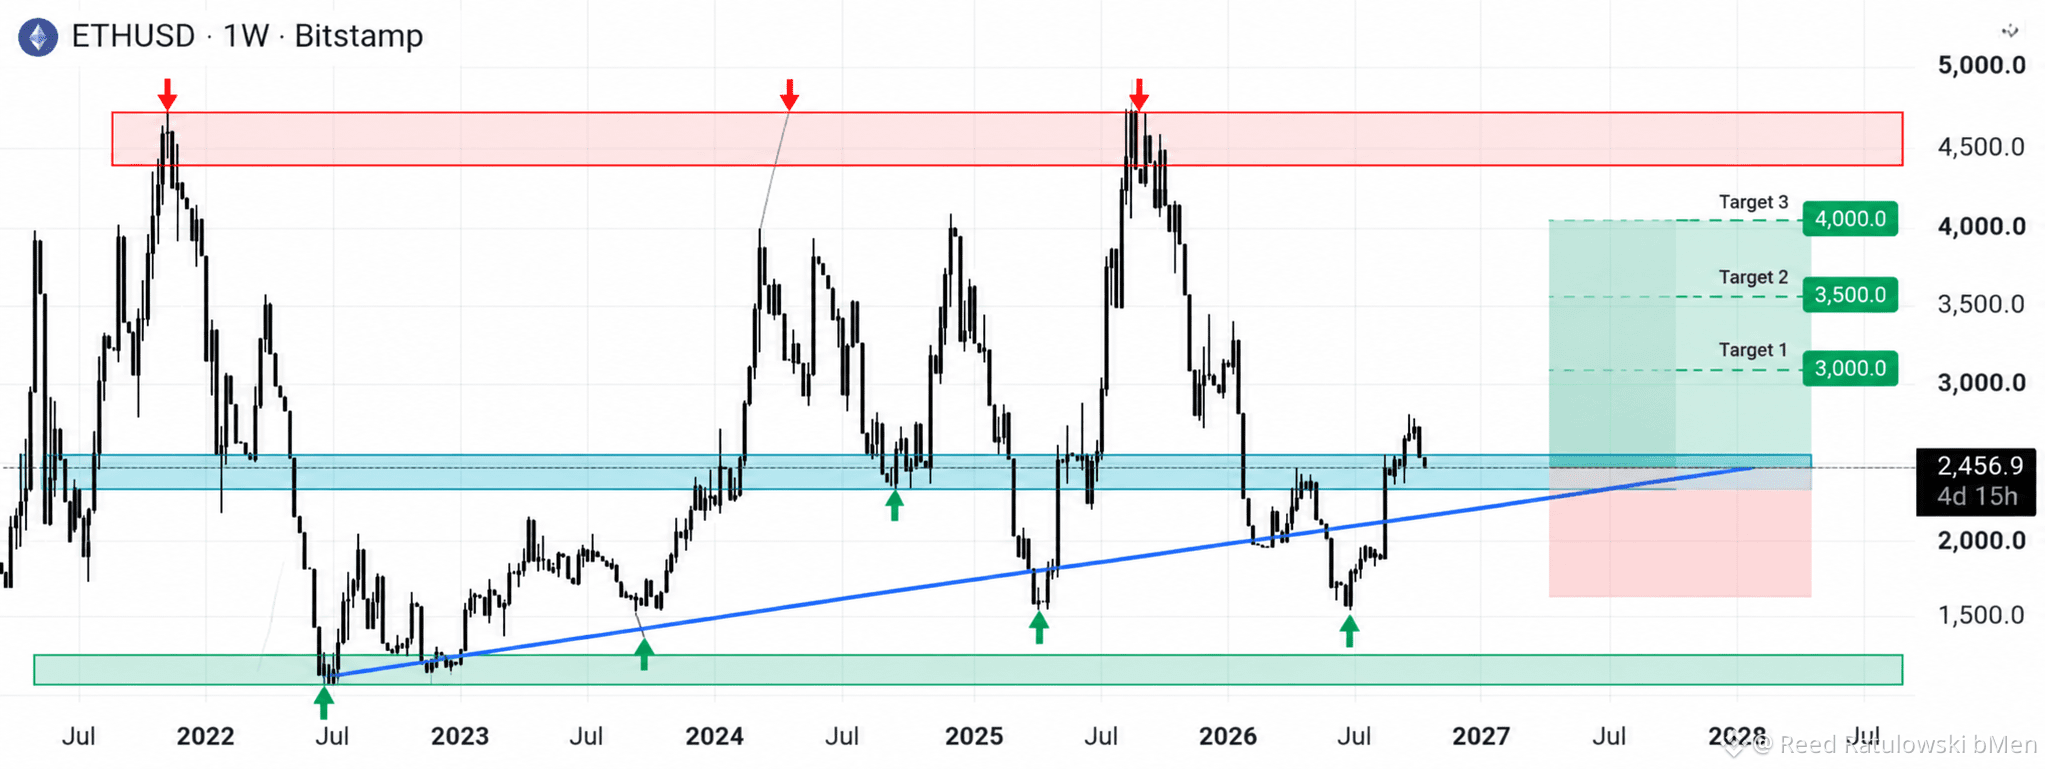
$ETH Touros! Próximo alvo: US$ 3.000 ou US$ 4.000? O ETH está testando uma importante zona semanal de suporte e resistência entre US$ 2.400 e US$ 2.500, enquanto uma linha de tendência ascendente de longo prazo reforça o cenário de alta. Um forte fechamento semanal acima de US$ 2.500 pode abrir caminho para US$ 3.000, seguido por US$ 3.500 e até US$ 4.000. Enquanto o ETH se mantiver acima da linha de tendência ascendente, continuo atento a uma recuperação mais forte. Uma queda abaixo de US$ 2.300 enfraqueceria esse cenário.
$ETH Touros! Próximo alvo: US$ 3.000 ou US$ 4.000? O ETH está testando uma importante zona semanal de suporte e resistência entre US$ 2.400 e US$ 2.500, enquanto uma linha de tendência ascendente de longo prazo reforça o cenário de alta. Um forte fechamento semanal acima de US$ 2.500 pode abrir caminho para US$ 3.000, seguido por US$ 3.500 e até US$ 4.000. Enquanto o ETH se mantiver acima da linha de tendência ascendente, continuo atento a uma recuperação mais forte. Uma queda abaixo de US$ 2.300 enfraqueceria esse cenário.
63
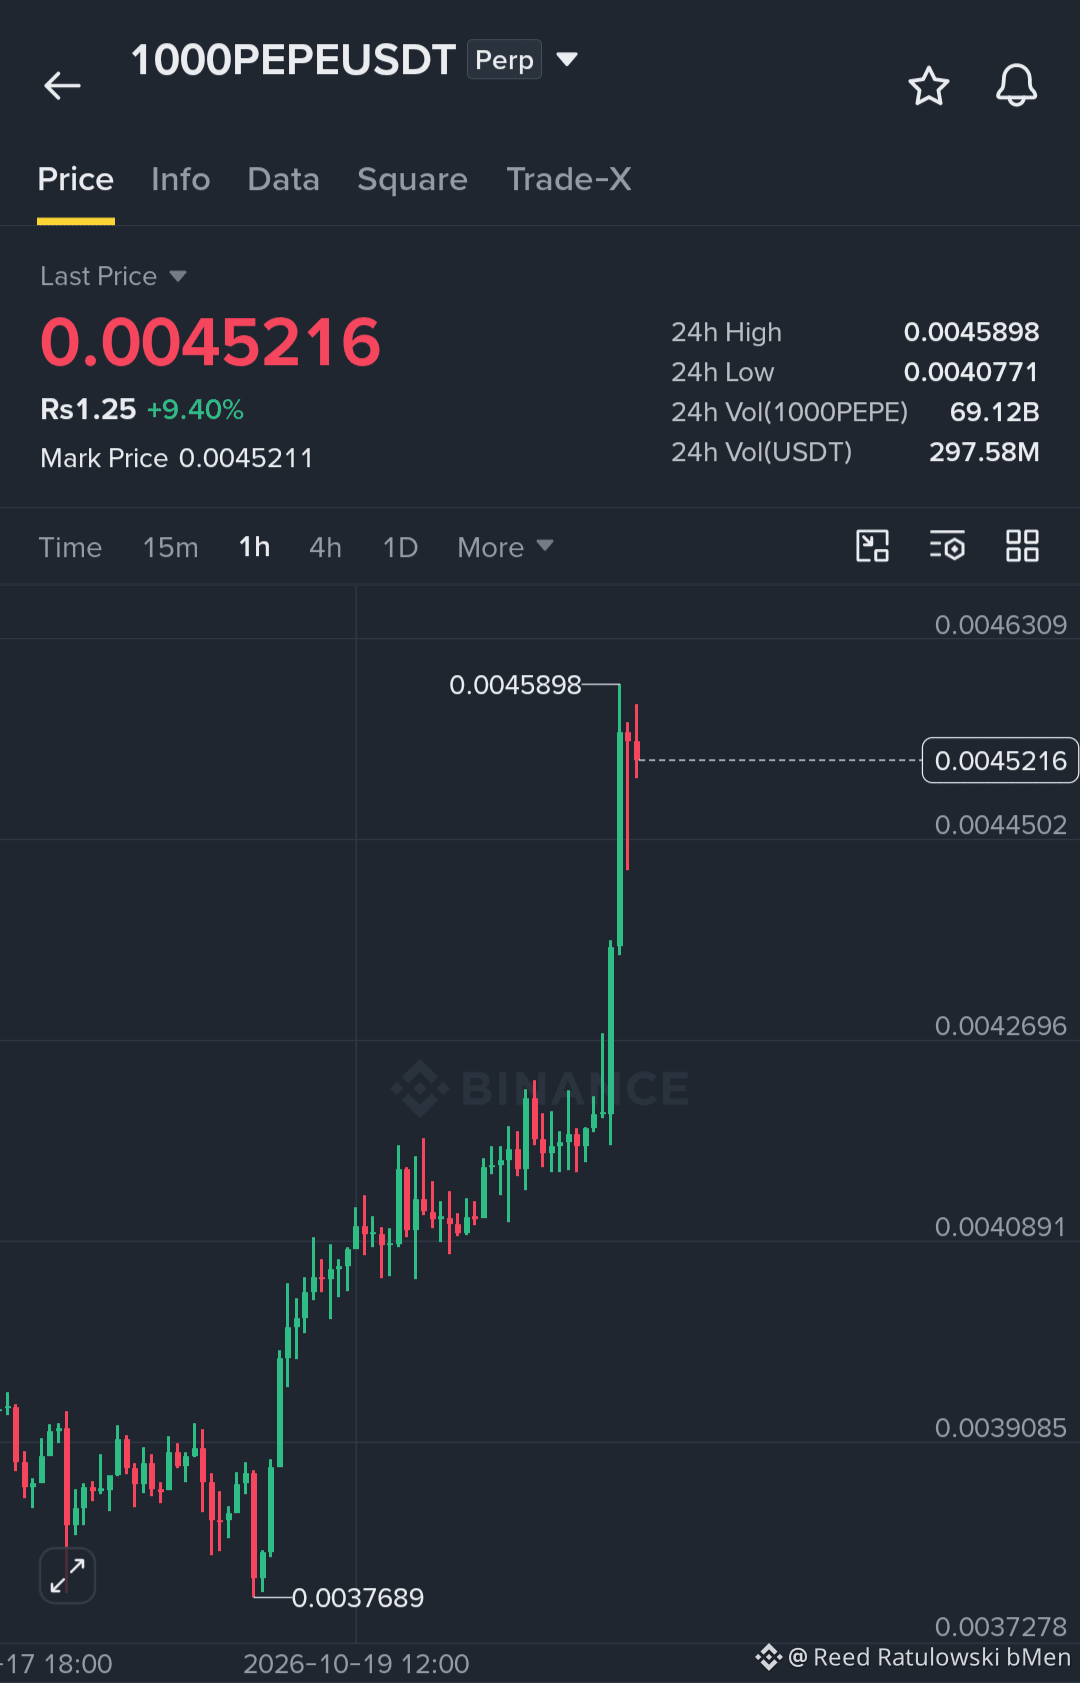
$PEPE Alta massiva... Agora vejo uma boa oportunidade de short Já subiu 9% hoje Forte resistência perto de 0.00459 Entrada no short: 0.00452 - 0.00459 TP1: 0.00430 TP2: 0.00410 Alvo final: 0.00390 SL: 0.00470 Se o preço não conseguir ultrapassar 0.00459, espero uma boa correção Não abra posições máximas... Tem de usar stop loss
$PEPE Alta massiva... Agora vejo uma boa oportunidade de short Já subiu 9% hoje Forte resistência perto de 0.00459 Entrada no short: 0.00452 - 0.00459 TP1: 0.00430 TP2: 0.00410 Alvo final: 0.00390 SL: 0.00470 Se o preço não conseguir ultrapassar 0.00459, espero uma boa correção Não abra posições máximas... Tem de usar stop loss
45
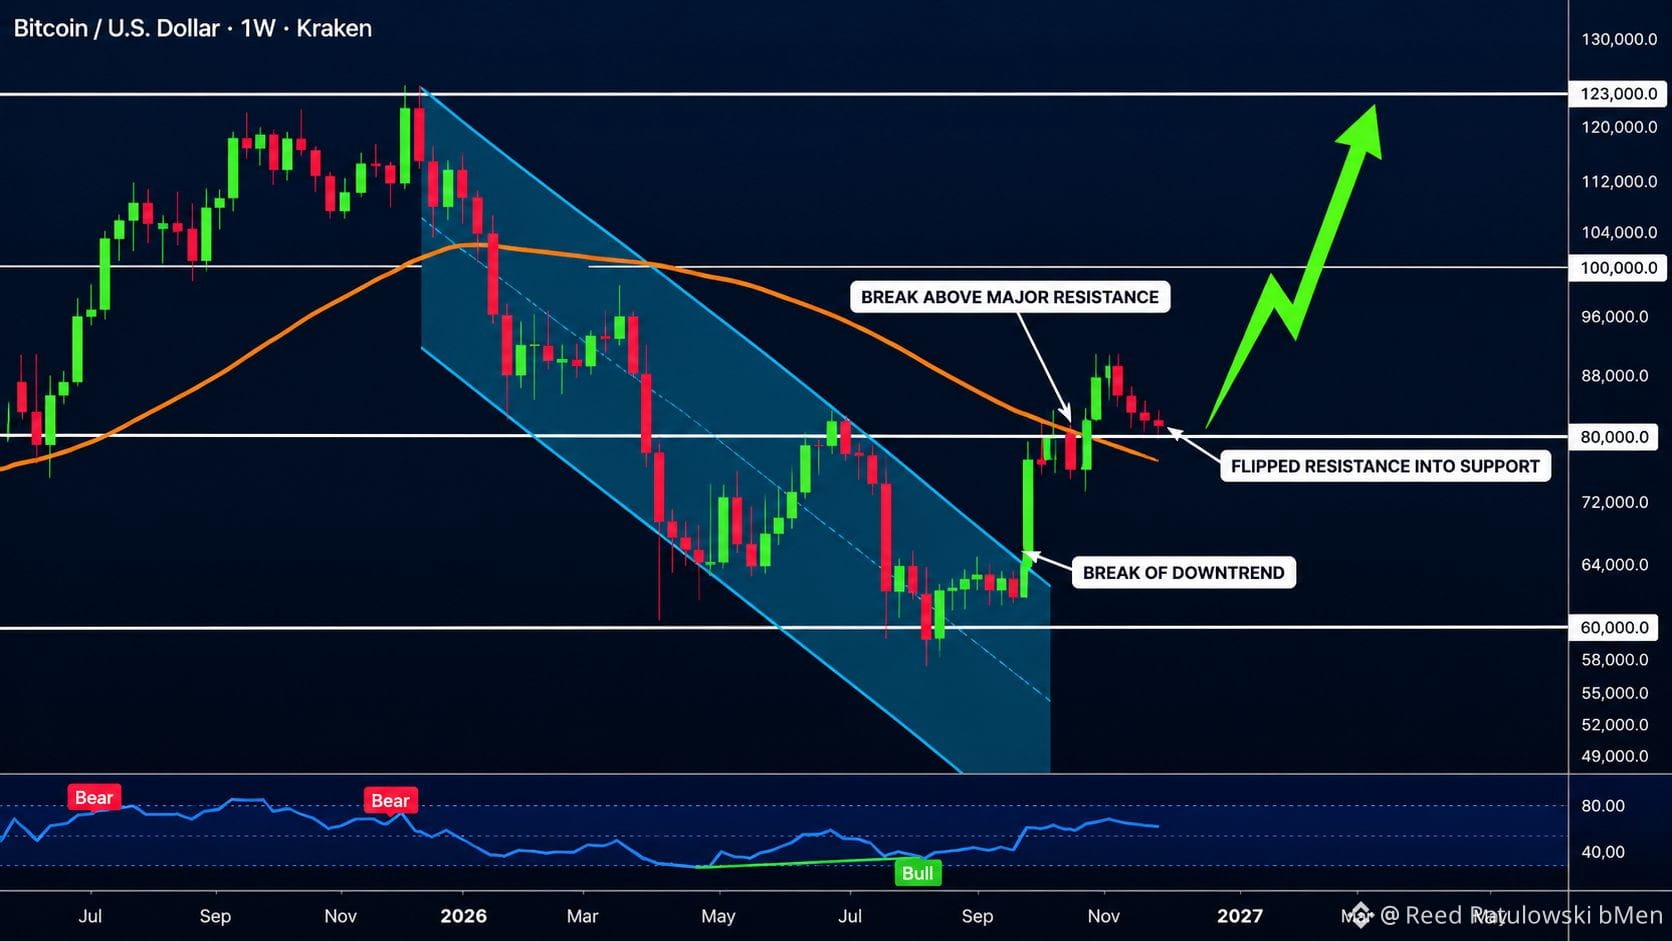
$BTC 🟠 Por mais que muitos de vocês, ursos que estão de fora, queiram continuar "pessimistas"... tecnicamente, o gráfico está gritando que "esta é sua última chance". O Bitcoin rompeu claramente a estrutura, virou para uma tendência de alta em agosto, rompeu uma grande resistência nos US$ 80 mil em setembro e agora estamos testando novamente esse mesmo nível como suporte em outubro. Na minha opinião, continuamos nessa tendência de alta e, em breve, voltaremos às máximas históricas. Não dá para impedir o que vem pela frente.
$BTC 🟠 Por mais que muitos de vocês, ursos que estão de fora, queiram continuar "pessimistas"... tecnicamente, o gráfico está gritando que "esta é sua última chance". O Bitcoin rompeu claramente a estrutura, virou para uma tendência de alta em agosto, rompeu uma grande resistência nos US$ 80 mil em setembro e agora estamos testando novamente esse mesmo nível como suporte em outubro. Na minha opinião, continuamos nessa tendência de alta e, em breve, voltaremos às máximas históricas. Não dá para impedir o que vem pela frente.
64
Ganhámos o prémio de Melhor Criador em 2024, fomos distinguidos no Blockchain 100 da Binance em 2025… Agora é a vez de 2026 e, mais uma vez, preciso dos vossos votos, pessoal ♥️ Clique aqui para votar. https://app.binance.com/uni-qr/cact26user/743?uc=app_square_share_link&us=copylink
Ganhámos o prémio de Melhor Criador em 2024, fomos distinguidos no Blockchain 100 da Binance em 2025… Agora é a vez de 2026 e, mais uma vez, preciso dos vossos votos, pessoal ♥️ Clique aqui para votar. https://app.binance.com/uni-qr/cact26user/743?uc=app_square_share_link&us=copylink


65
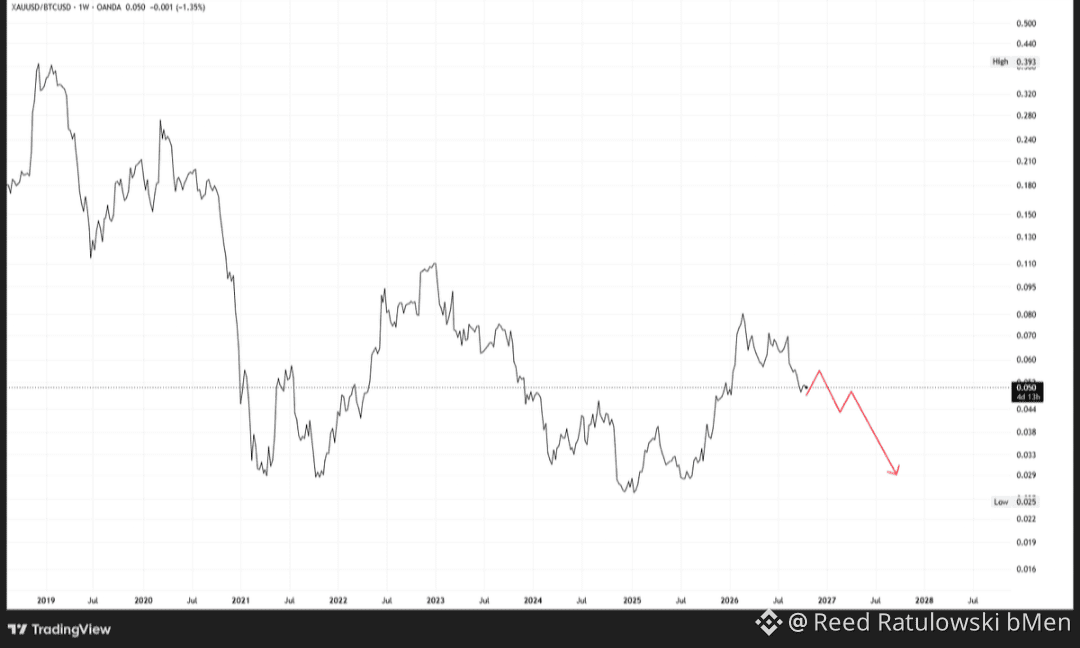
Você está prestando atenção? O $BTC vai superar o ouro. Eu te disse isso quando o ouro atingiu o topo e o BTC estava no fundo. Espero que você tenha ouvido...
Você está prestando atenção? O $BTC vai superar o ouro. Eu te disse isso quando o ouro atingiu o topo e o BTC estava no fundo. Espero que você tenha ouvido...
53
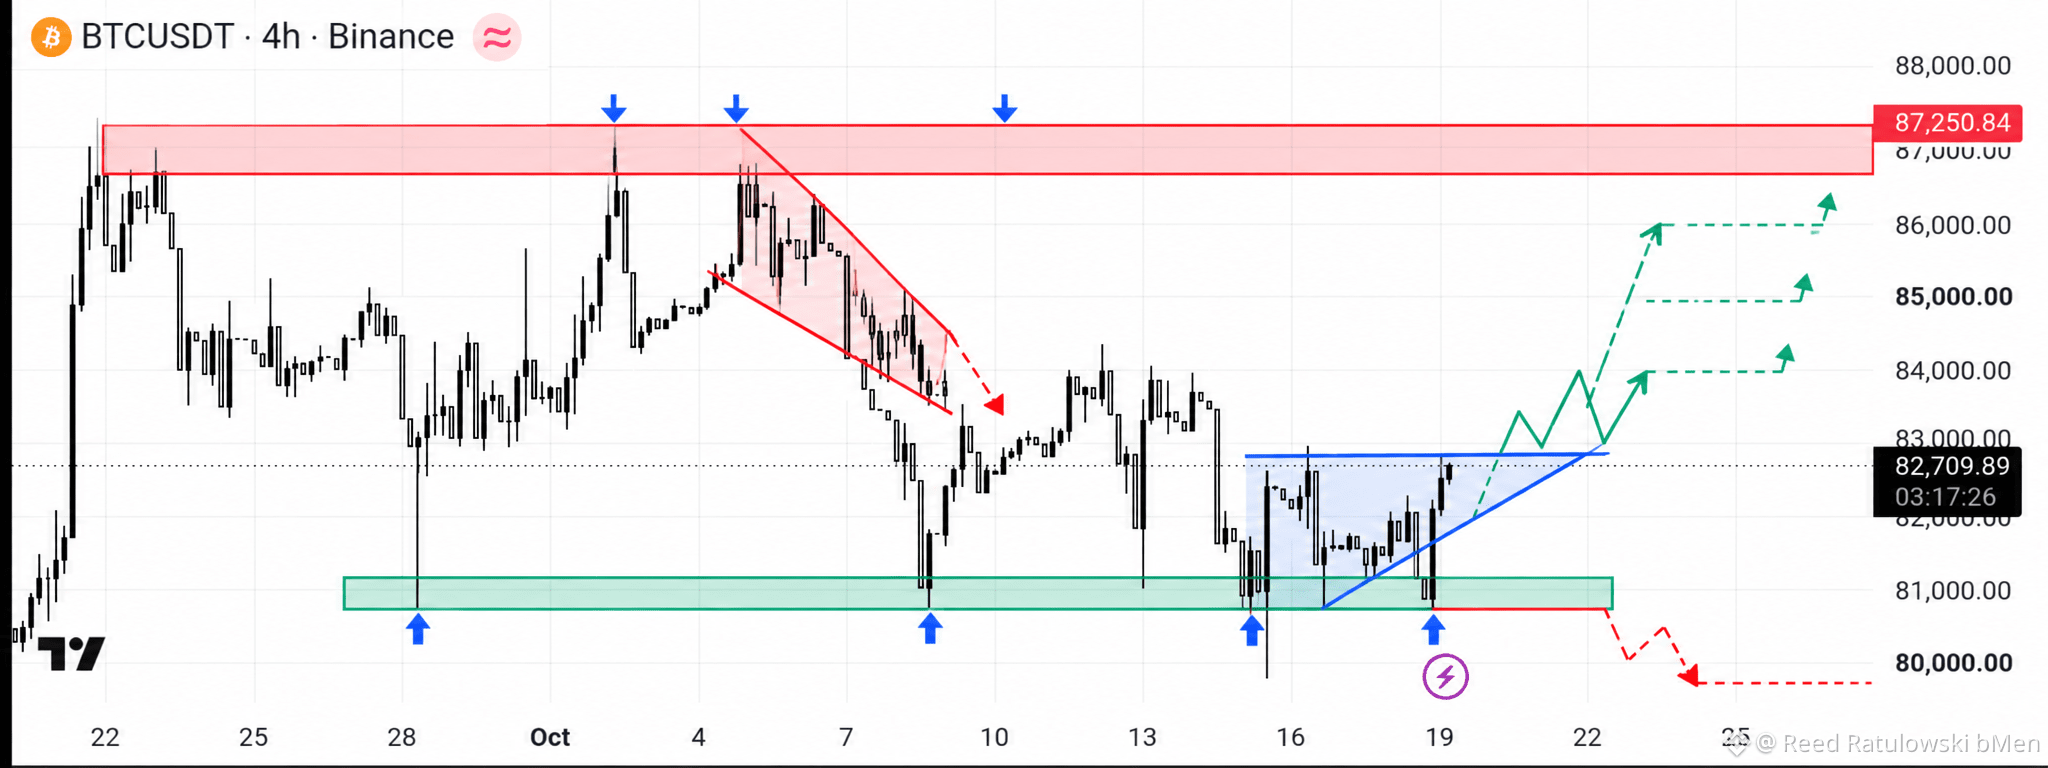
$BTC fechou acima de $80K no gráfico semanal novamente. O BTC está no verde, as altcoins estão no verde, mas uma armadilha de alta ainda é possível. Se romper os $83K, poderemos ver $84K, $85K e, depois, $87K. Se perder os $80,8K, é possível uma nova queda em direção aos $79,7K. Temos uma semana interessante pela frente. Vamos ver o que os touros conseguem fazer.
$BTC fechou acima de $80K no gráfico semanal novamente. O BTC está no verde, as altcoins estão no verde, mas uma armadilha de alta ainda é possível. Se romper os $83K, poderemos ver $84K, $85K e, depois, $87K. Se perder os $80,8K, é possível uma nova queda em direção aos $79,7K. Temos uma semana interessante pela frente. Vamos ver o que os touros conseguem fazer.
74
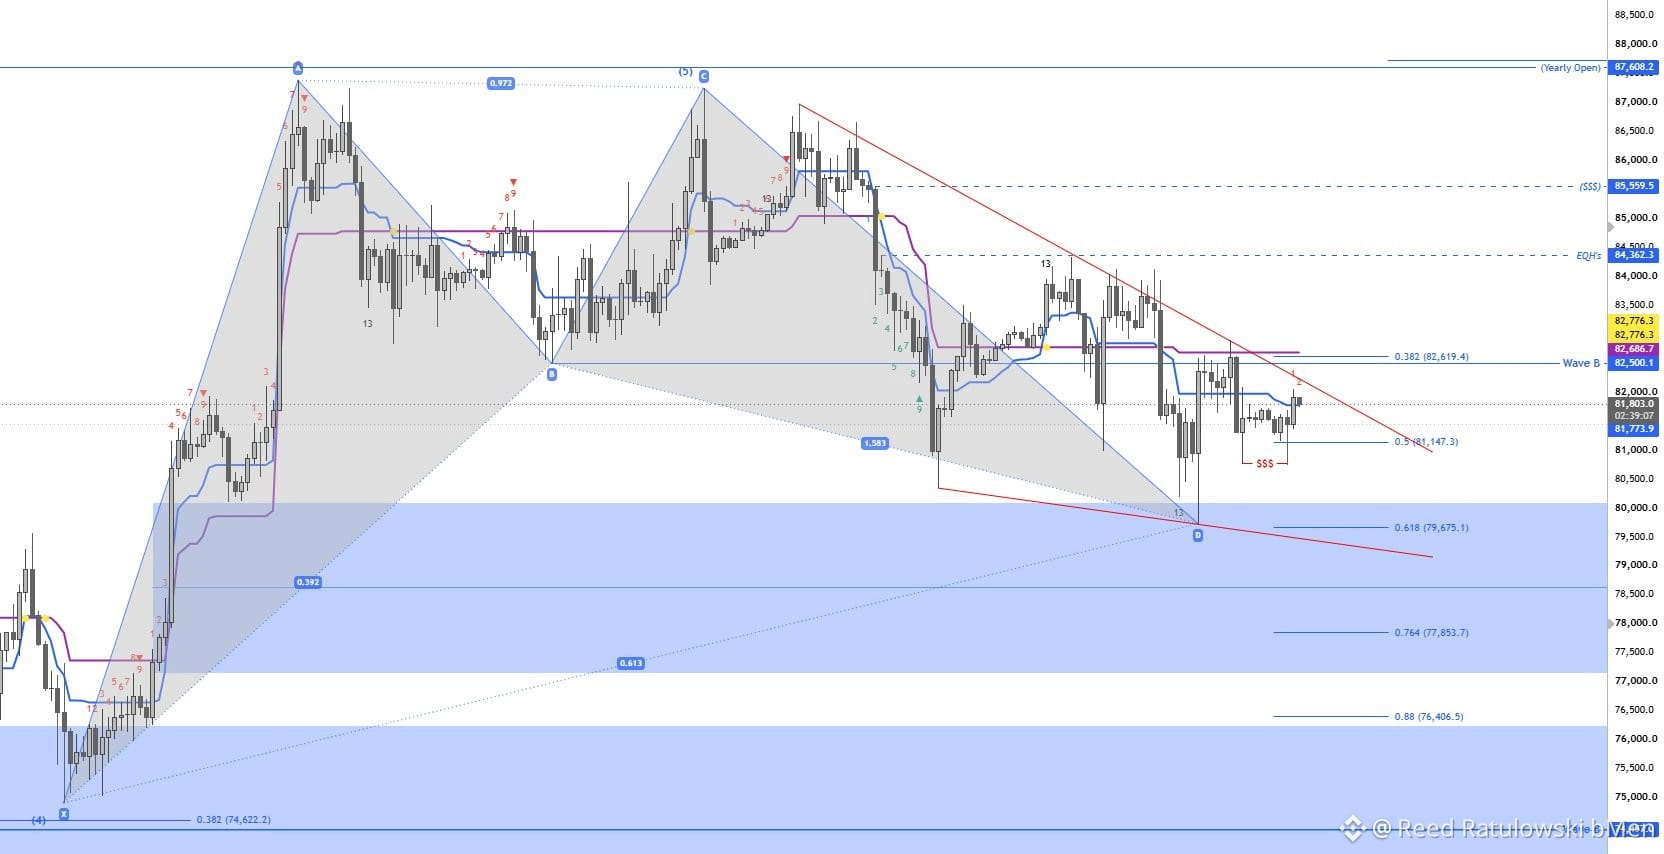
$BTC Nada de muito relevante acontecendo nos gráficos por enquanto. O ideal seria vermos uma retomada da região da Onda B / Kijun-Sen para continuar subindo. Se não conseguirmos, é provável que o próximo movimento seja uma varrida das mínimas atuais, com a região dos 76 mil entrando em jogo. A estrutura está confusa no LTF neste momento, então a melhor abordagem é operar de nível em nível. Também está se formando uma cunha descendente, e um rompimento de alta confirmaria o fundo. Isso porque há muita liquidez acumulada no meio do intervalo, em torno de 84,3 mil a 85,5 mil, o que poderia impulsionar o preço para cima, em direção ao bolsão de liquidez do HTF nos 87 mil a 89 mil. Se ficarmos abaixo da Onda B e continuarmos sendo rejeitados ali, espero uma última varrida abaixo das mínimas atuais em algum momento entre 20 e 24 de outubro para marcar o fundo, antes de retomarmos a tendência de alta.
$BTC Nada de muito relevante acontecendo nos gráficos por enquanto. O ideal seria vermos uma retomada da região da Onda B / Kijun-Sen para continuar subindo. Se não conseguirmos, é provável que o próximo movimento seja uma varrida das mínimas atuais, com a região dos 76 mil entrando em jogo. A estrutura está confusa no LTF neste momento, então a melhor abordagem é operar de nível em nível. Também está se formando uma cunha descendente, e um rompimento de alta confirmaria o fundo. Isso porque há muita liquidez acumulada no meio do intervalo, em torno de 84,3 mil a 85,5 mil, o que poderia impulsionar o preço para cima, em direção ao bolsão de liquidez do HTF nos 87 mil a 89 mil. Se ficarmos abaixo da Onda B e continuarmos sendo rejeitados ali, espero uma última varrida abaixo das mínimas atuais em algum momento entre 20 e 24 de outubro para marcar o fundo, antes de retomarmos a tendência de alta.
55
🚨 Os ETFs de $ETH registaram saídas líquidas de 319,97 milhões de dólares esta semana. A procura institucional por Ethereum enfrenta uma nova pressão, à medida que o capital sai dos produtos de investimento em ETH. Será este um sinal de alerta ou uma oportunidade de compra? #Ethereum #ETH
🚨 Os ETFs de $ETH registaram saídas líquidas de 319,97 milhões de dólares esta semana. A procura institucional por Ethereum enfrenta uma nova pressão, à medida que o capital sai dos produtos de investimento em ETH. Será este um sinal de alerta ou uma oportunidade de compra? #Ethereum #ETH

63
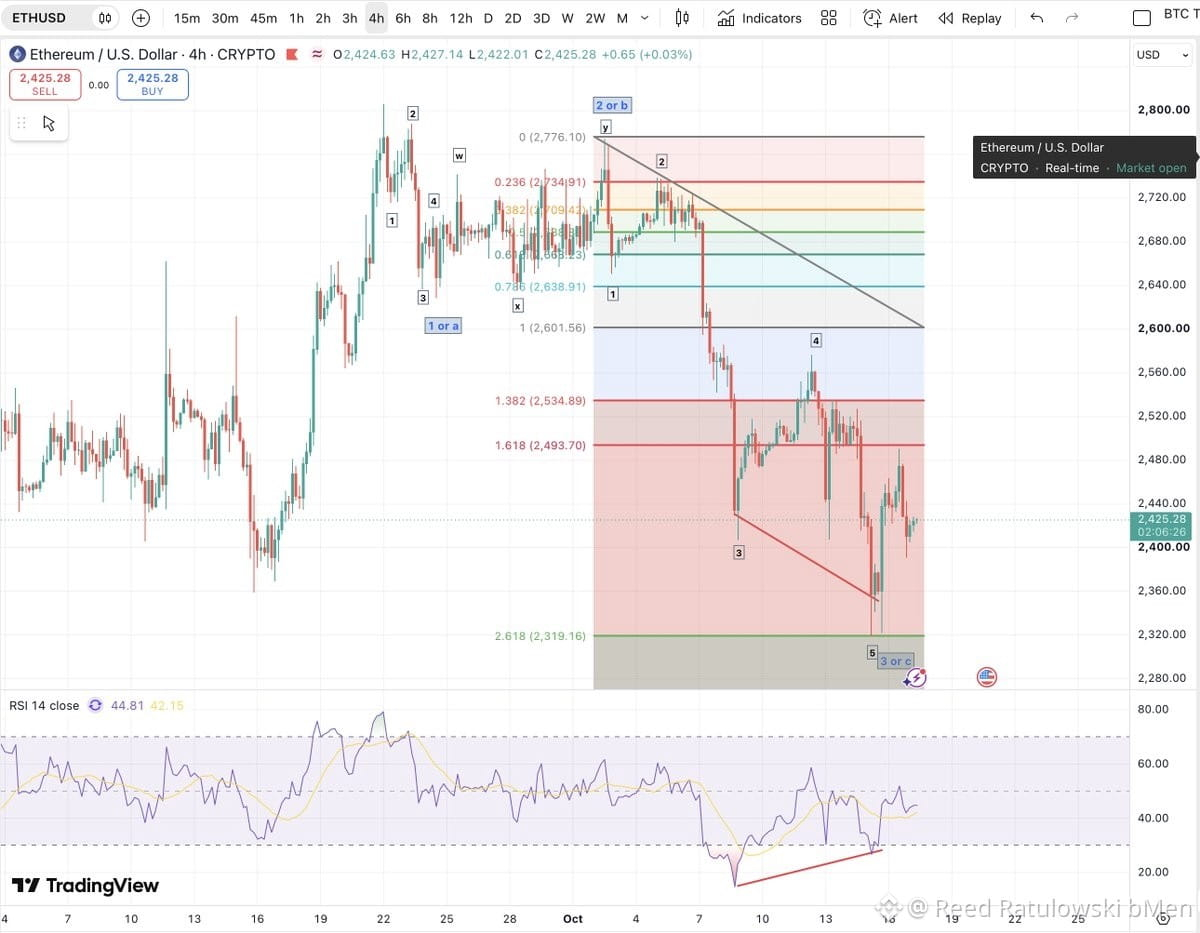
#ETH tem duas contagens possíveis. Minha interpretação preferida é uma correção ABC com uma onda C estendida. A projeção de 2,618 × A fica perto de US$ 2.319, embora C possa terminar antes de alcançá-la. A alternativa é uma sequência baixista 1–2–3, com a recuperação formando a onda 4 antes de outra queda. Uma quebra sustentada acima de US$ 2.630 favoreceria a interpretação corretiva. Uma nova mínima manteria ativo o risco de queda. Opere a estrutura em formação, gerencie o risco e mantenha-se aberto a ambas as possibilidades.
#ETH tem duas contagens possíveis. Minha interpretação preferida é uma correção ABC com uma onda C estendida. A projeção de 2,618 × A fica perto de US$ 2.319, embora C possa terminar antes de alcançá-la. A alternativa é uma sequência baixista 1–2–3, com a recuperação formando a onda 4 antes de outra queda. Uma quebra sustentada acima de US$ 2.630 favoreceria a interpretação corretiva. Uma nova mínima manteria ativo o risco de queda. Opere a estrutura em formação, gerencie o risco e mantenha-se aberto a ambas as possibilidades.
51
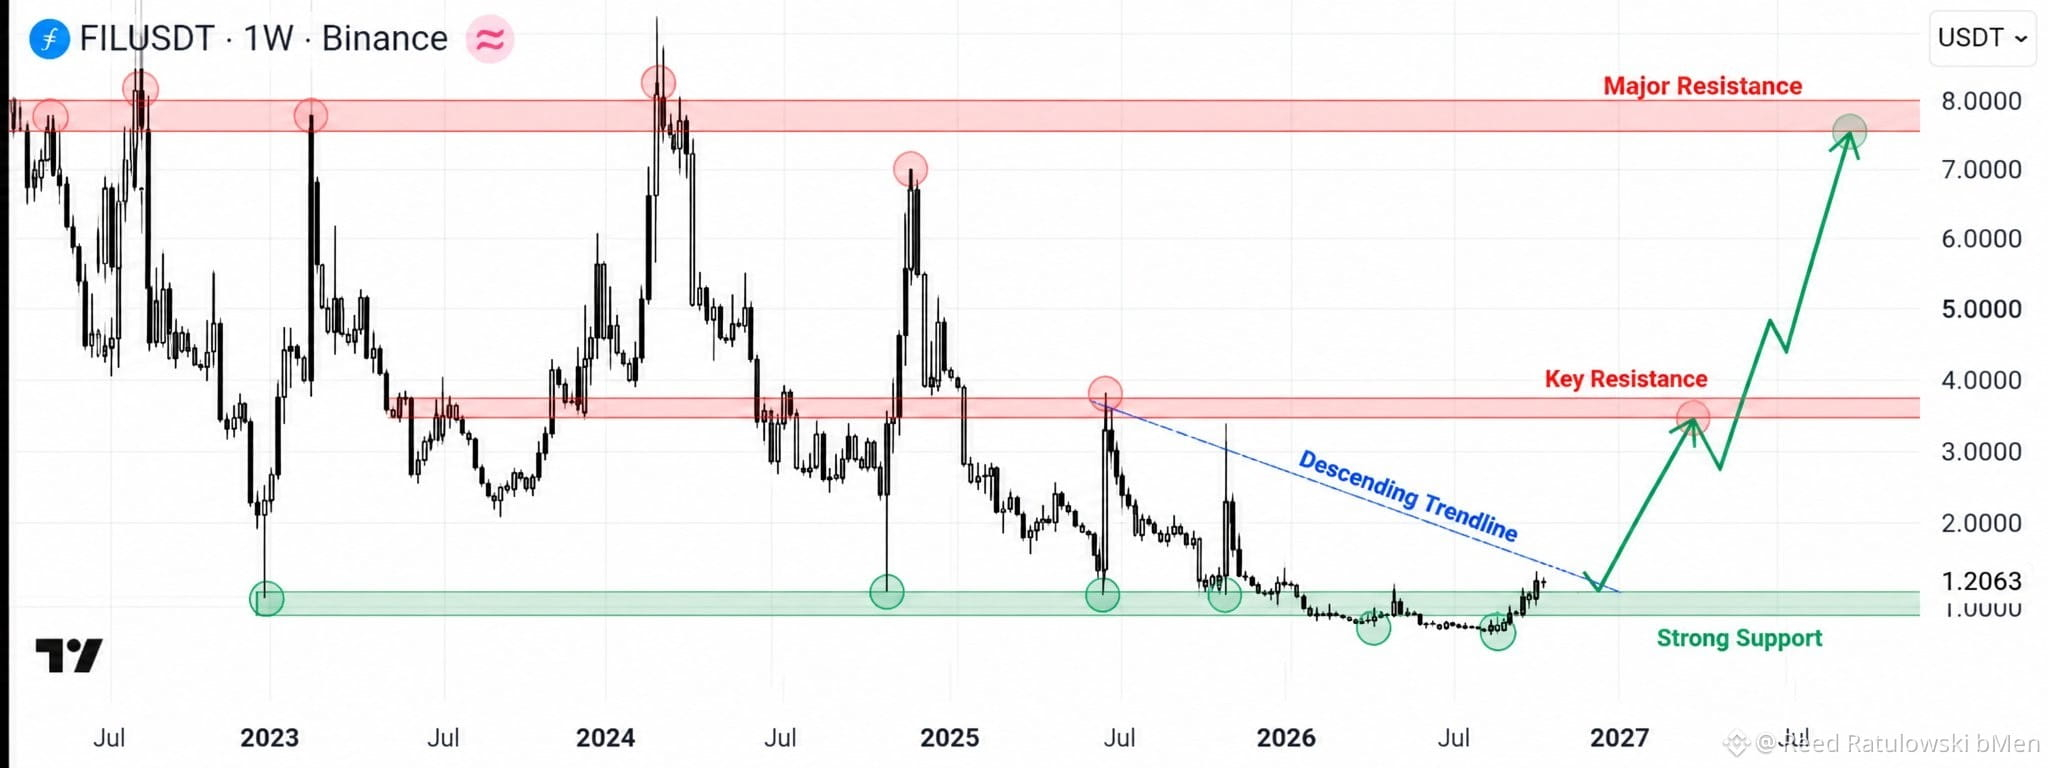
$FIL a $1.15! Uma grande recuperação está a caminho? Após anos de pressão vendedora, o $FIL está sendo negociado perto das mínimas históricas, mas o gráfico semanal está mostrando sinais de uma possível reversão. A zona de suporte entre $1.00 e $1.15 é crucial. Se os compradores conseguirem defendê-la e romper a linha de tendência descendente, uma forte recuperação poderá começar. Minhas metas: $2.00 → $3.70 → $7.50. Estas são metas de longo prazo, não movimentos garantidos. A maioria dos traders vê fraqueza. Esta poderia ser uma oportunidade antecipada?
$FIL a $1.15! Uma grande recuperação está a caminho? Após anos de pressão vendedora, o $FIL está sendo negociado perto das mínimas históricas, mas o gráfico semanal está mostrando sinais de uma possível reversão. A zona de suporte entre $1.00 e $1.15 é crucial. Se os compradores conseguirem defendê-la e romper a linha de tendência descendente, uma forte recuperação poderá começar. Minhas metas: $2.00 → $3.70 → $7.50. Estas são metas de longo prazo, não movimentos garantidos. A maioria dos traders vê fraqueza. Esta poderia ser uma oportunidade antecipada?
74
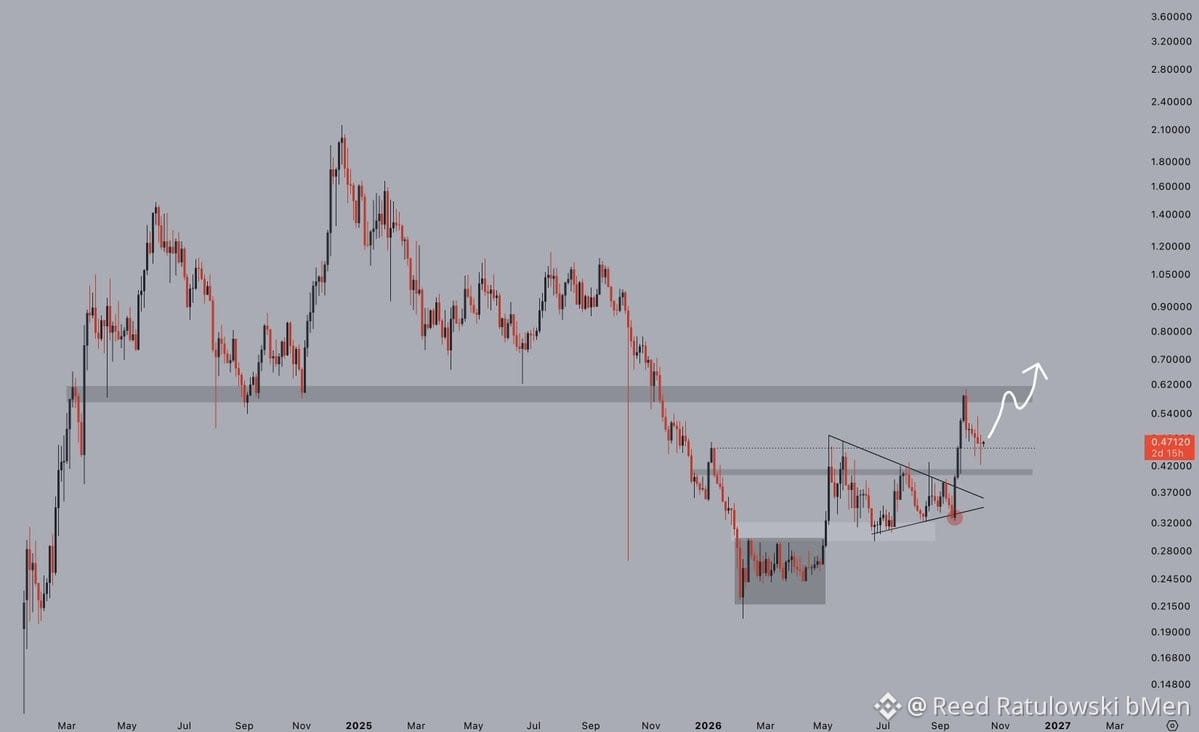
A tendência de tokenização está a acelerar, e o $ONDO continua a ser o principal candidato a conquistar esse mercado. Os máximos locais anteriores têm-se mantido até agora. Se ultrapassar os $0,62, podemos pôr isto em marcha. Tenho as malas feitas desde a zona dos $0,35 e não vou vender tão cedo.
A tendência de tokenização está a acelerar, e o $ONDO continua a ser o principal candidato a conquistar esse mercado. Os máximos locais anteriores têm-se mantido até agora. Se ultrapassar os $0,62, podemos pôr isto em marcha. Tenho as malas feitas desde a zona dos $0,35 e não vou vender tão cedo.
48
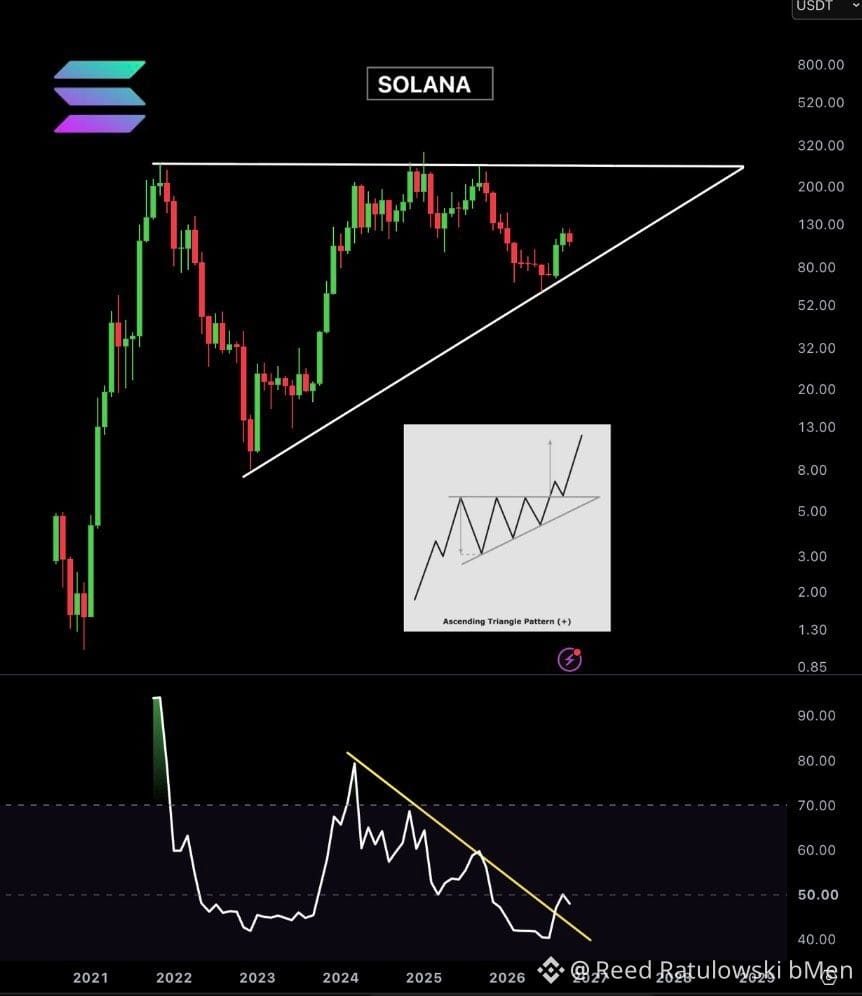
$SOL está formando uma enorme estrutura de alta no gráfico mensal. O preço está se comprimindo entre um suporte ascendente e uma importante resistência horizontal. Enquanto isso, o RSI está se aproximando do rompimento de uma linha de tendência importante. Um rompimento confirmado pode abrir caminho para a próxima grande alta da Solana. A estrutura está formada. Agora, aguardamos a confirmação.
$SOL está formando uma enorme estrutura de alta no gráfico mensal. O preço está se comprimindo entre um suporte ascendente e uma importante resistência horizontal. Enquanto isso, o RSI está se aproximando do rompimento de uma linha de tendência importante. Um rompimento confirmado pode abrir caminho para a próxima grande alta da Solana. A estrutura está formada. Agora, aguardamos a confirmação.
54
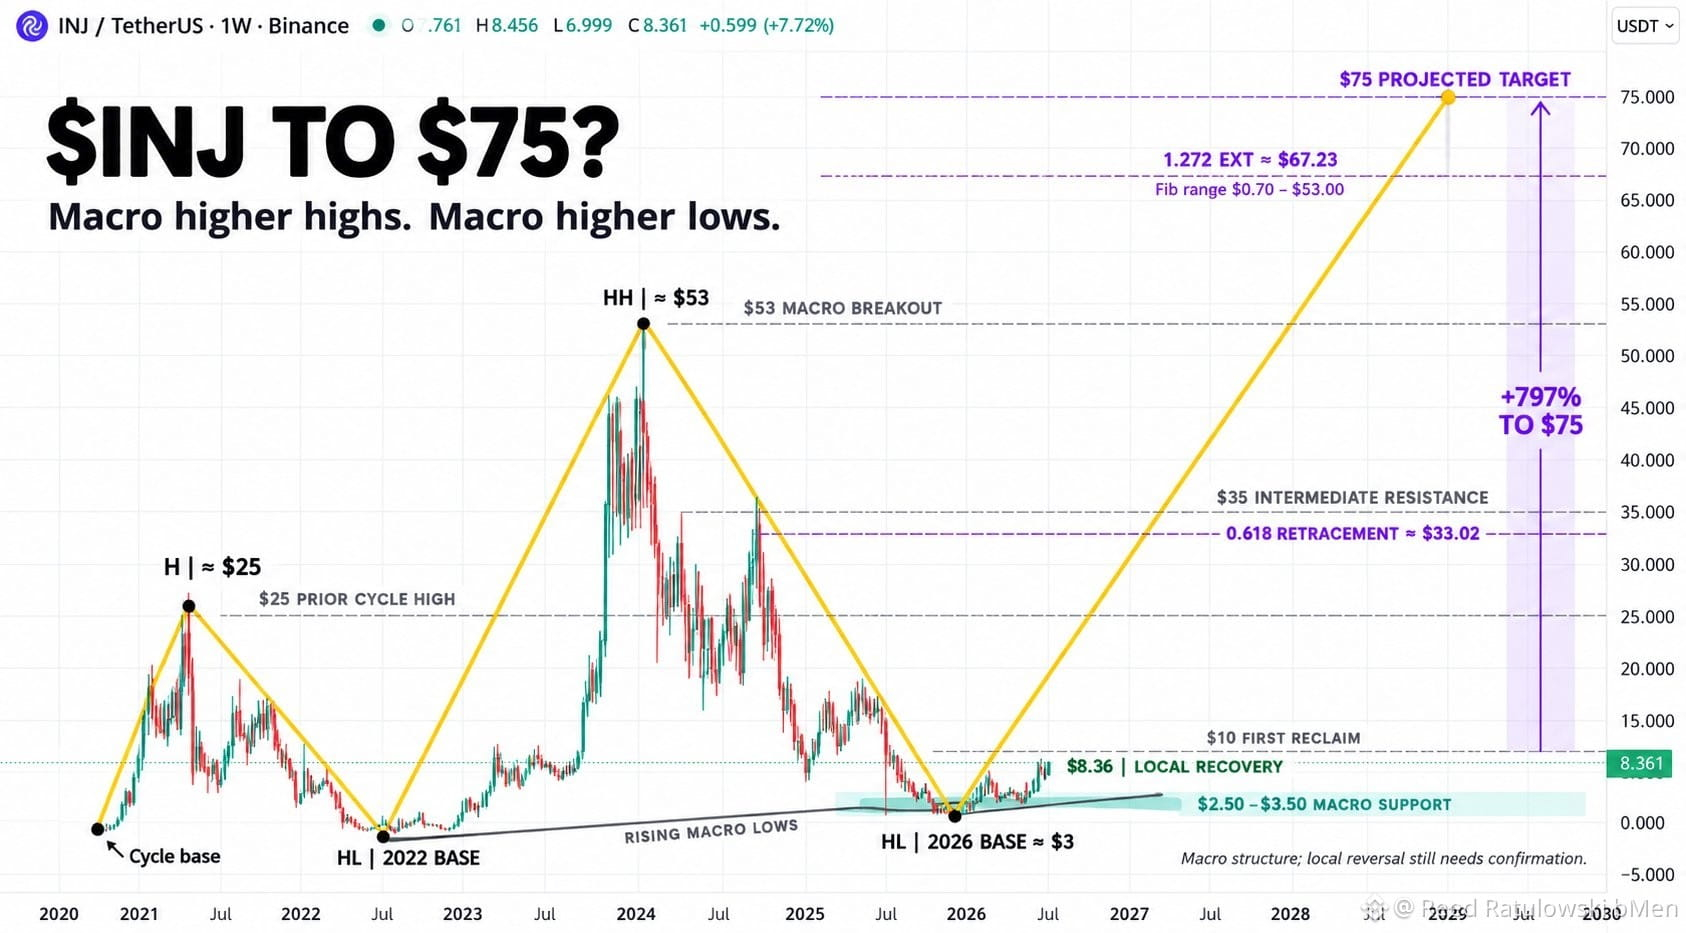
🚀 $INJ A US$75? Analisando o gráfico semanal: as principais oscilações do ciclo de $INJ mostram máximas e mínimas cada vez mais altas. O pico subiu de aproximadamente US$25 em 2021 para US$53 em 2024, enquanto a mínima de 2026 permanece acima da base de 2022. Isso favorece a tese macro de alta, mas a recuperação ainda precisa ser confirmada. Primeiro, vem US$10, seguido pelas resistências em torno de US$25, US$35 e US$53. Romper e se manter acima de US$53 fortaleceria a possibilidade de chegar a US$75, cerca de 797% acima de US$8,36. A base entre US$2,50 e US$3,50 continua sendo crucial para preservar a estrutura macro de mínimas mais altas.
🚀 $INJ A US$75? Analisando o gráfico semanal: as principais oscilações do ciclo de $INJ mostram máximas e mínimas cada vez mais altas. O pico subiu de aproximadamente US$25 em 2021 para US$53 em 2024, enquanto a mínima de 2026 permanece acima da base de 2022. Isso favorece a tese macro de alta, mas a recuperação ainda precisa ser confirmada. Primeiro, vem US$10, seguido pelas resistências em torno de US$25, US$35 e US$53. Romper e se manter acima de US$53 fortaleceria a possibilidade de chegar a US$75, cerca de 797% acima de US$8,36. A base entre US$2,50 e US$3,50 continua sendo crucial para preservar a estrutura macro de mínimas mais altas.
73
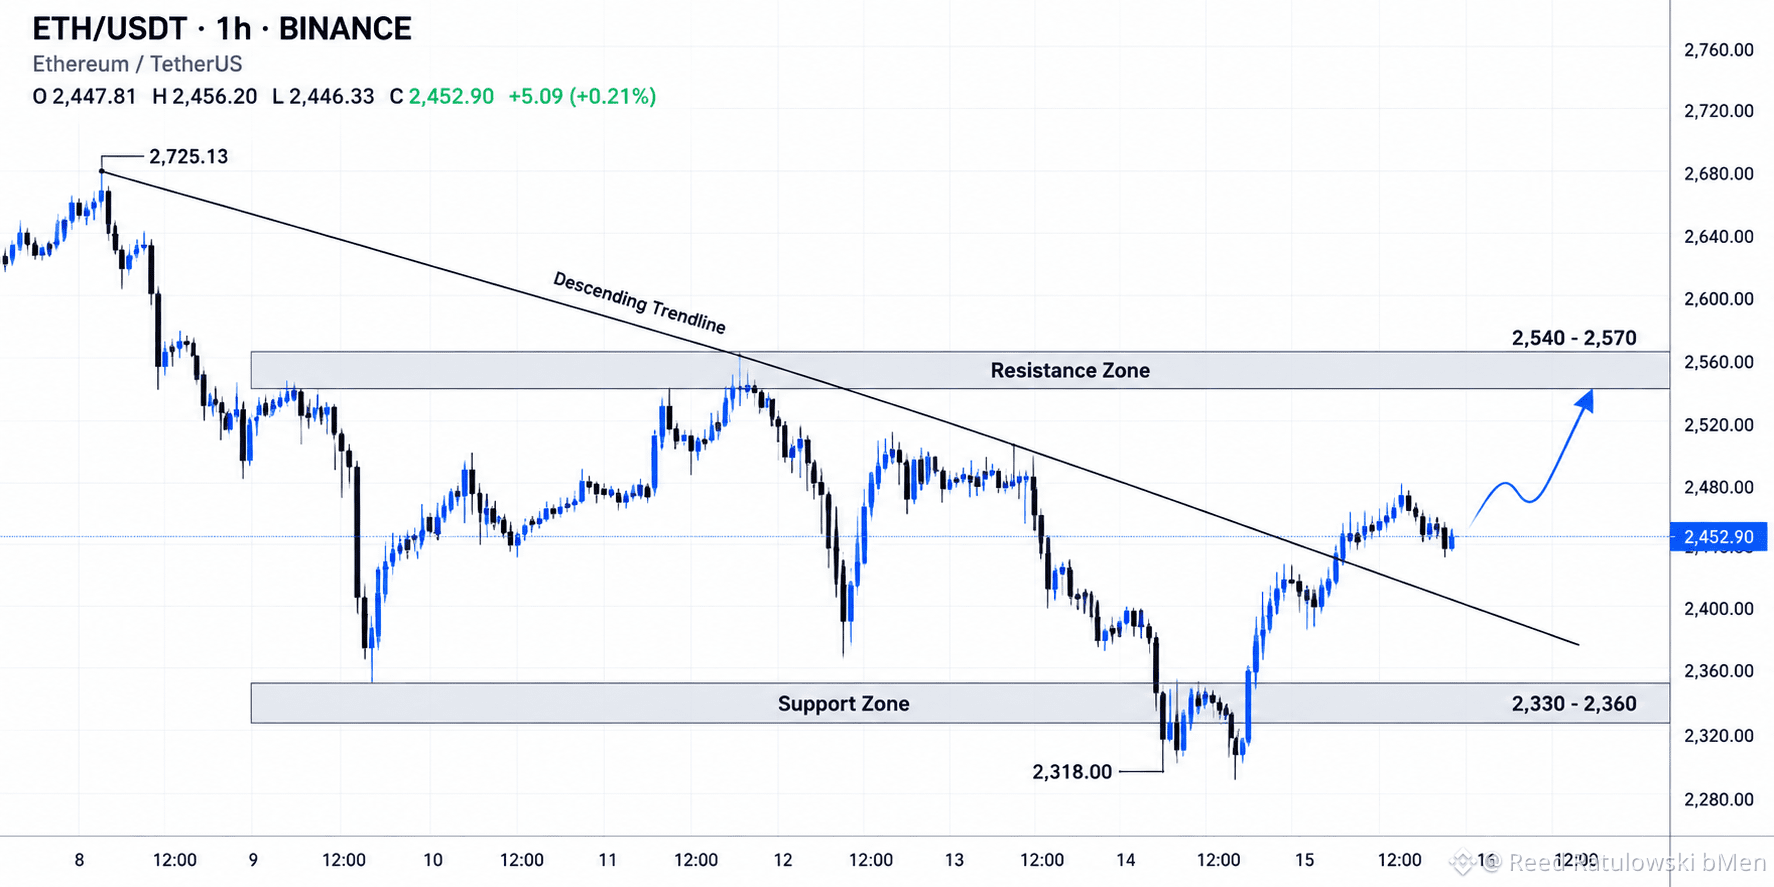
$ETH ROMPE A LINHA DE TENDÊNCIA DESCENDENTE ... AGORA, 2.540–2.570 É O VERDADEIRO TESTE. O ETH reagiu com força na zona de suporte dos 2.330–2.360 e já voltou a subir acima da linha de tendência descendente. Este é o primeiro sinal significativo de que os compradores estão a tentar recuperar o controlo.
$ETH ROMPE A LINHA DE TENDÊNCIA DESCENDENTE ... AGORA, 2.540–2.570 É O VERDADEIRO TESTE. O ETH reagiu com força na zona de suporte dos 2.330–2.360 e já voltou a subir acima da linha de tendência descendente. Este é o primeiro sinal significativo de que os compradores estão a tentar recuperar o controlo.
47
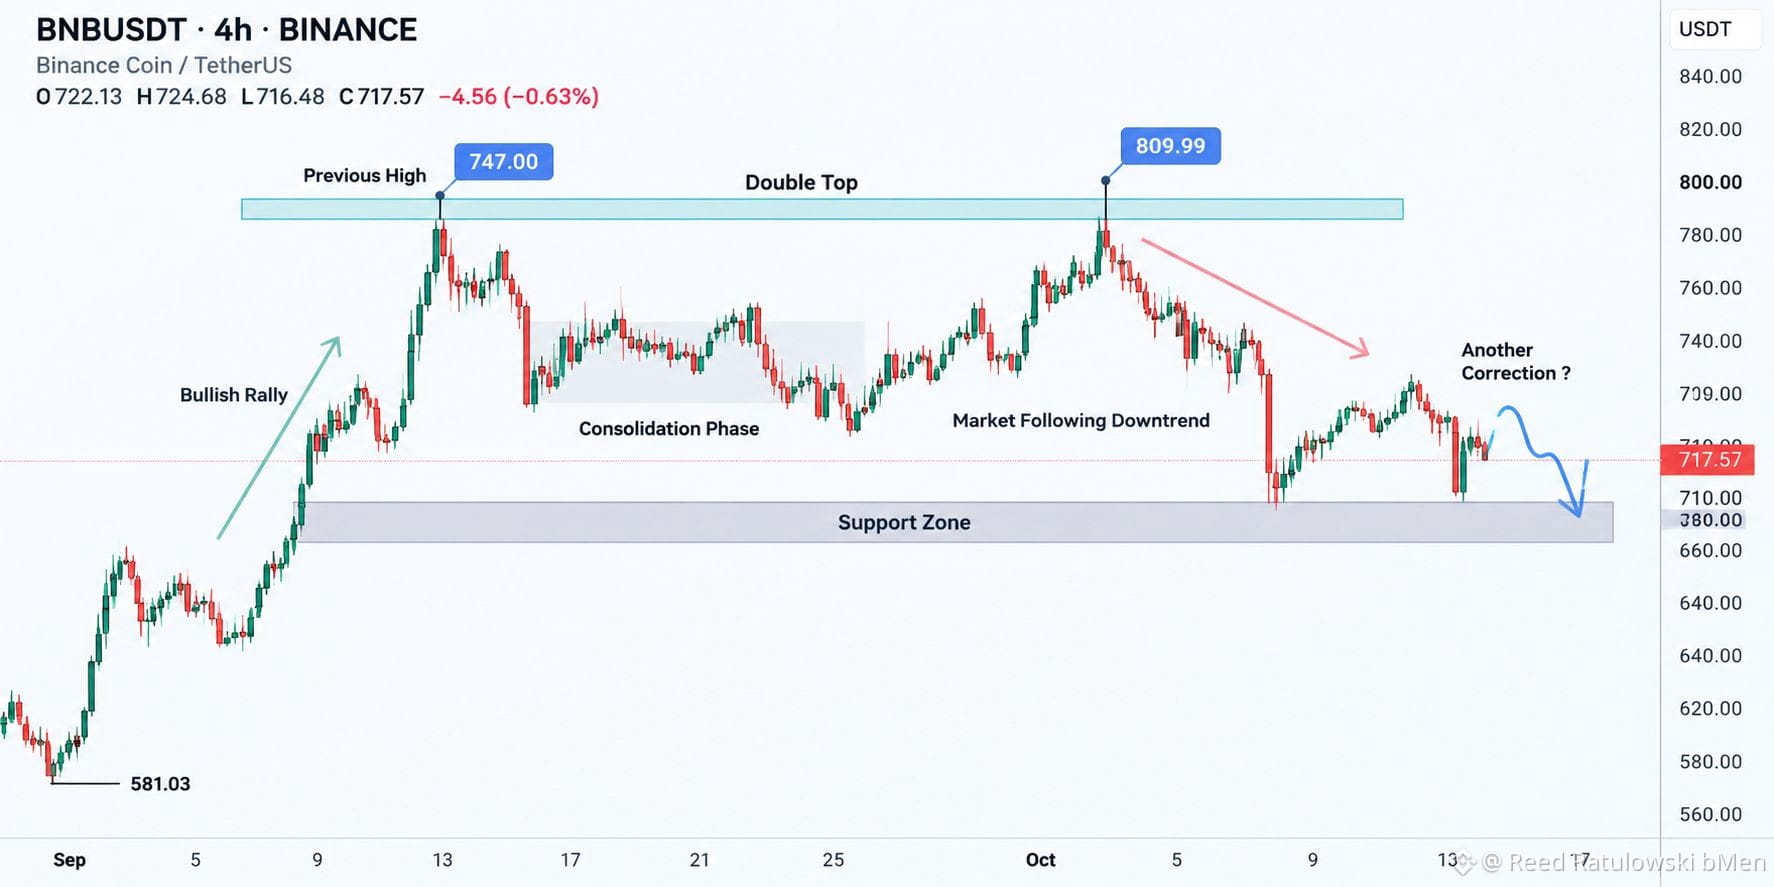
$BNB A ZONA DE OFERTA FAZ SEU TRABALHO MAIS UMA VEZ O BNB tocou a zona de oferta entre 790 e 810, sofreu uma rejeição clara e perdeu a linha de tendência ascendente. O preço está agora próximo da zona de suporte entre 700 e 710. Se esse suporte for rompido, uma queda mais profunda até 680–690 se torna provável. Por enquanto, estou de olho no suporte em 700 versus a recuperação de 740 para o próximo movimento. Você compraria no suporte ou esperaria por mais uma queda?
$BNB A ZONA DE OFERTA FAZ SEU TRABALHO MAIS UMA VEZ O BNB tocou a zona de oferta entre 790 e 810, sofreu uma rejeição clara e perdeu a linha de tendência ascendente. O preço está agora próximo da zona de suporte entre 700 e 710. Se esse suporte for rompido, uma queda mais profunda até 680–690 se torna provável. Por enquanto, estou de olho no suporte em 700 versus a recuperação de 740 para o próximo movimento. Você compraria no suporte ou esperaria por mais uma queda?
63
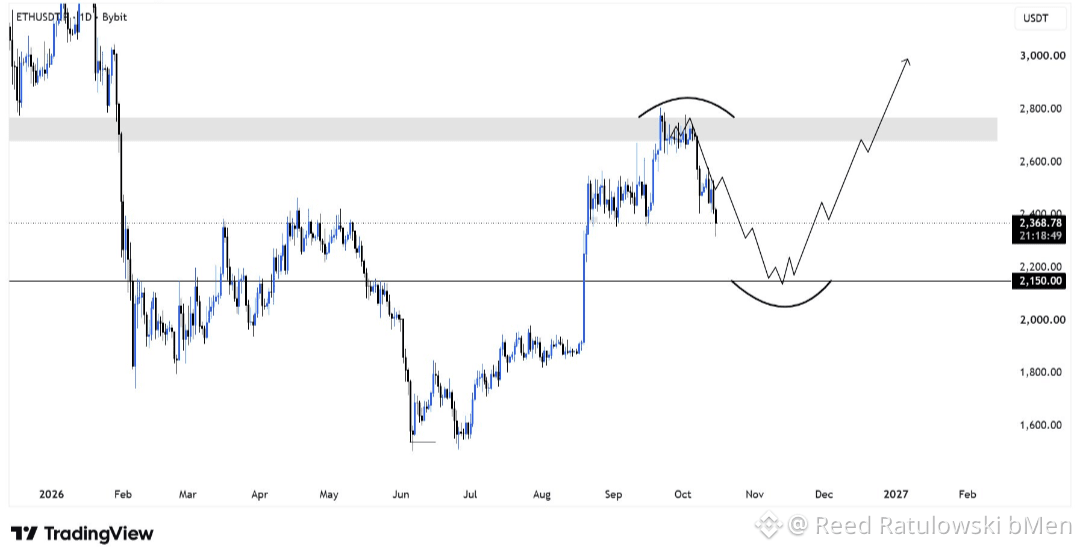
$ETH ainda é o rei das altcoins para mim. Ecossistema forte, desenvolvimento constante. Você está otimista em relação ao ETH no Q4? ETH Os preços baixos são uma boa oportunidade para entrar. Posicione-se cedo e aumente sua posição em etapas para reduzir o risco do investimento. A estratégia do bot de grid de futuros com IA divide os fundos em várias partes, comprando e vendendo em níveis de preço diferentes. Em comparação com investir tudo de uma vez, ela pode diversificar o risco de forma eficaz, sendo especialmente adequada para criptomoedas voláteis e outros ativos emergentes.
$ETH ainda é o rei das altcoins para mim. Ecossistema forte, desenvolvimento constante. Você está otimista em relação ao ETH no Q4? ETH Os preços baixos são uma boa oportunidade para entrar. Posicione-se cedo e aumente sua posição em etapas para reduzir o risco do investimento. A estratégia do bot de grid de futuros com IA divide os fundos em várias partes, comprando e vendendo em níveis de preço diferentes. Em comparação com investir tudo de uma vez, ela pode diversificar o risco de forma eficaz, sendo especialmente adequada para criptomoedas voláteis e outros ativos emergentes.
66
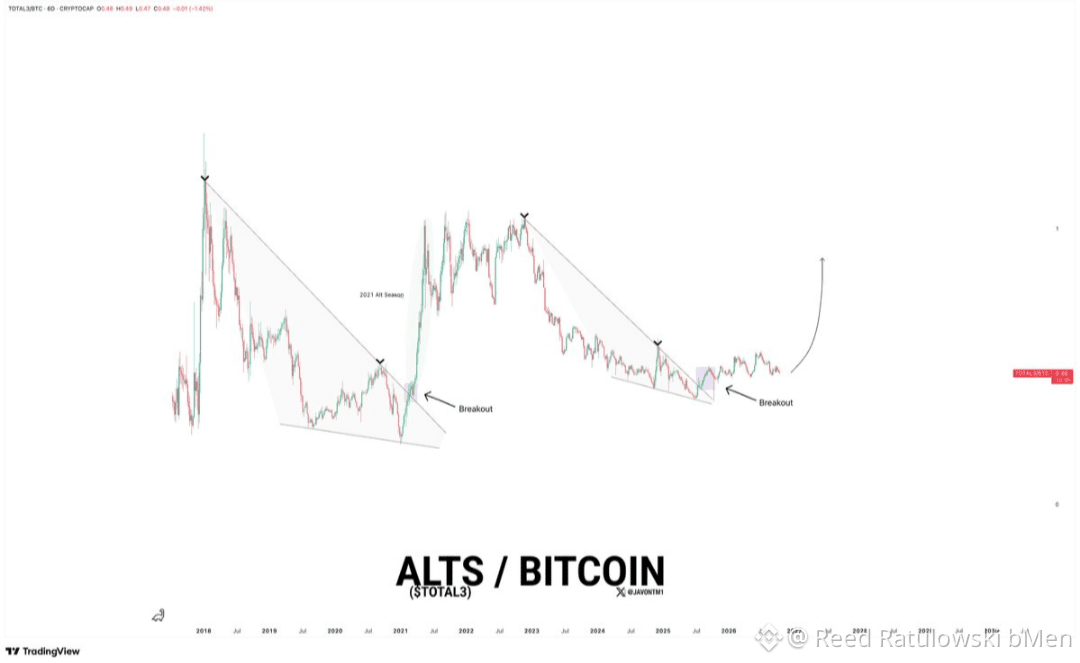
#Altcoins As altcoins continuam BEM ROMPIDAS em relação ao Bitcoin e parecem estar se consolidando aqui para um MOVIMENTO DE ALTA MASSIVO. O último rompimento registrado neste par resultou na temporada das altcoins de 2021, e outro rompimento se mantendo aqui pode significar que estamos no início de mais uma.
#Altcoins As altcoins continuam BEM ROMPIDAS em relação ao Bitcoin e parecem estar se consolidando aqui para um MOVIMENTO DE ALTA MASSIVO. O último rompimento registrado neste par resultou na temporada das altcoins de 2021, e outro rompimento se mantendo aqui pode significar que estamos no início de mais uma.
29
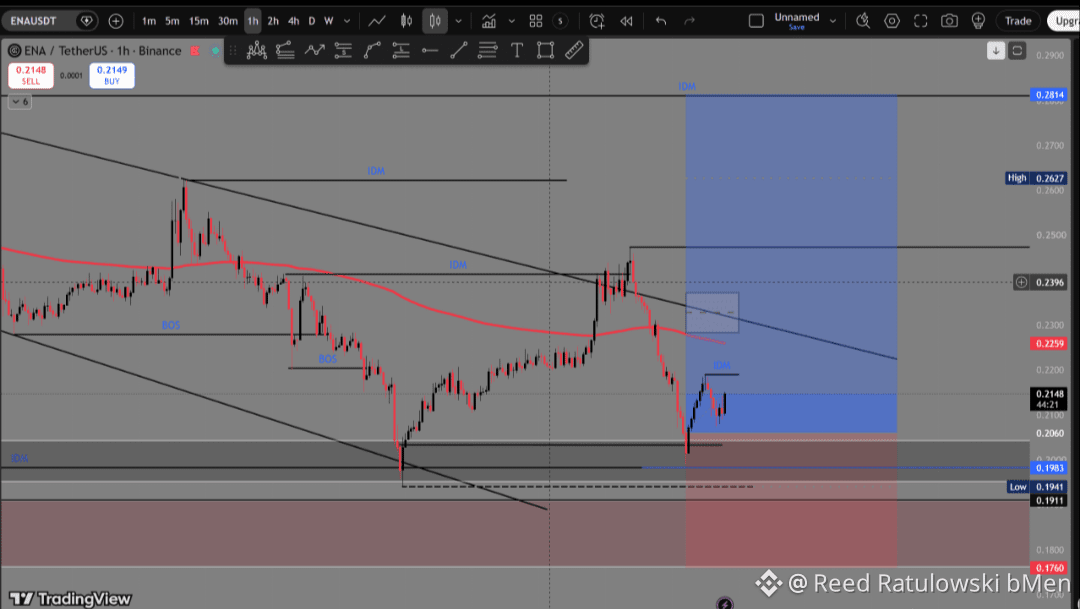
$ENA O fundo duplo será confirmado depois que fecharmos acima daquela máxima de swing recente... E a tendência de 1 hora também voltará a ser de alta... E a estrutura atual do M15 ficará mais forte se fecharmos acima de 0,2200...
$ENA O fundo duplo será confirmado depois que fecharmos acima daquela máxima de swing recente... E a tendência de 1 hora também voltará a ser de alta... E a estrutura atual do M15 ficará mais forte se fecharmos acima de 0,2200...
28
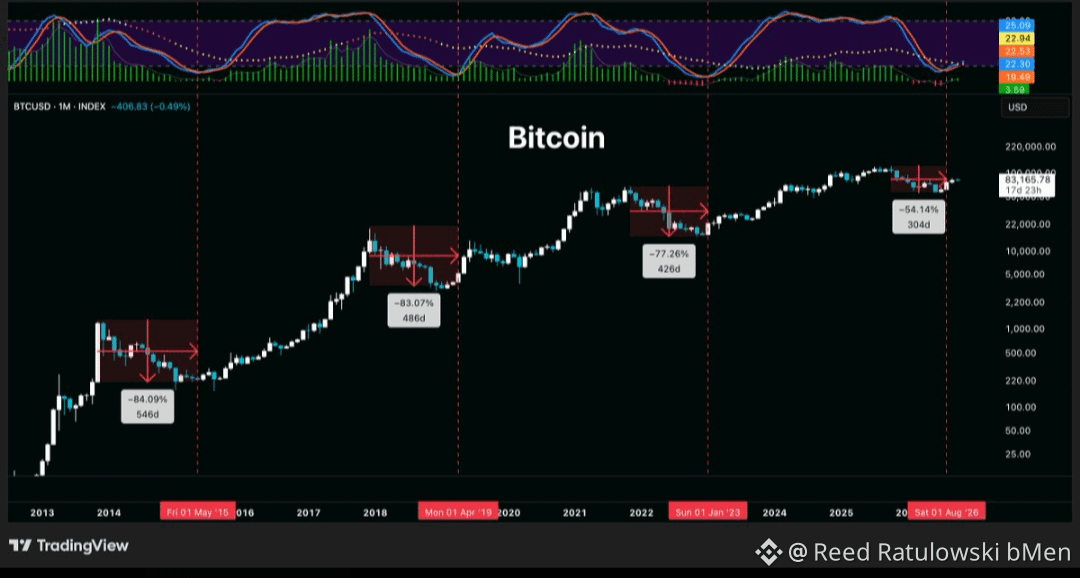
Algo que realmente me chamou a atenção nos últimos meses é que os mercados de baixa das criptomoedas, como o do $BTC, estão ficando mais curtos. Gosto de medir esses períodos de correção do topo do ciclo de preços até o fundo do estocástico mensal e o momento em que ele volta a ficar otimista. Como você pode ver, os períodos de correção macroeconômica nos mercados de baixa estão ficando cada vez menores. Esse padrão provavelmente vai mudar no futuro, com certeza, mas isso prova que a adoção das criptomoedas está acontecendo em tempo real, com menos volatilidade e menos quedas, especialmente no BTC e nas boas moedas com tecnologia sólida.
Algo que realmente me chamou a atenção nos últimos meses é que os mercados de baixa das criptomoedas, como o do $BTC, estão ficando mais curtos. Gosto de medir esses períodos de correção do topo do ciclo de preços até o fundo do estocástico mensal e o momento em que ele volta a ficar otimista. Como você pode ver, os períodos de correção macroeconômica nos mercados de baixa estão ficando cada vez menores. Esse padrão provavelmente vai mudar no futuro, com certeza, mas isso prova que a adoção das criptomoedas está acontecendo em tempo real, com menos volatilidade e menos quedas, especialmente no BTC e nas boas moedas com tecnologia sólida.
43
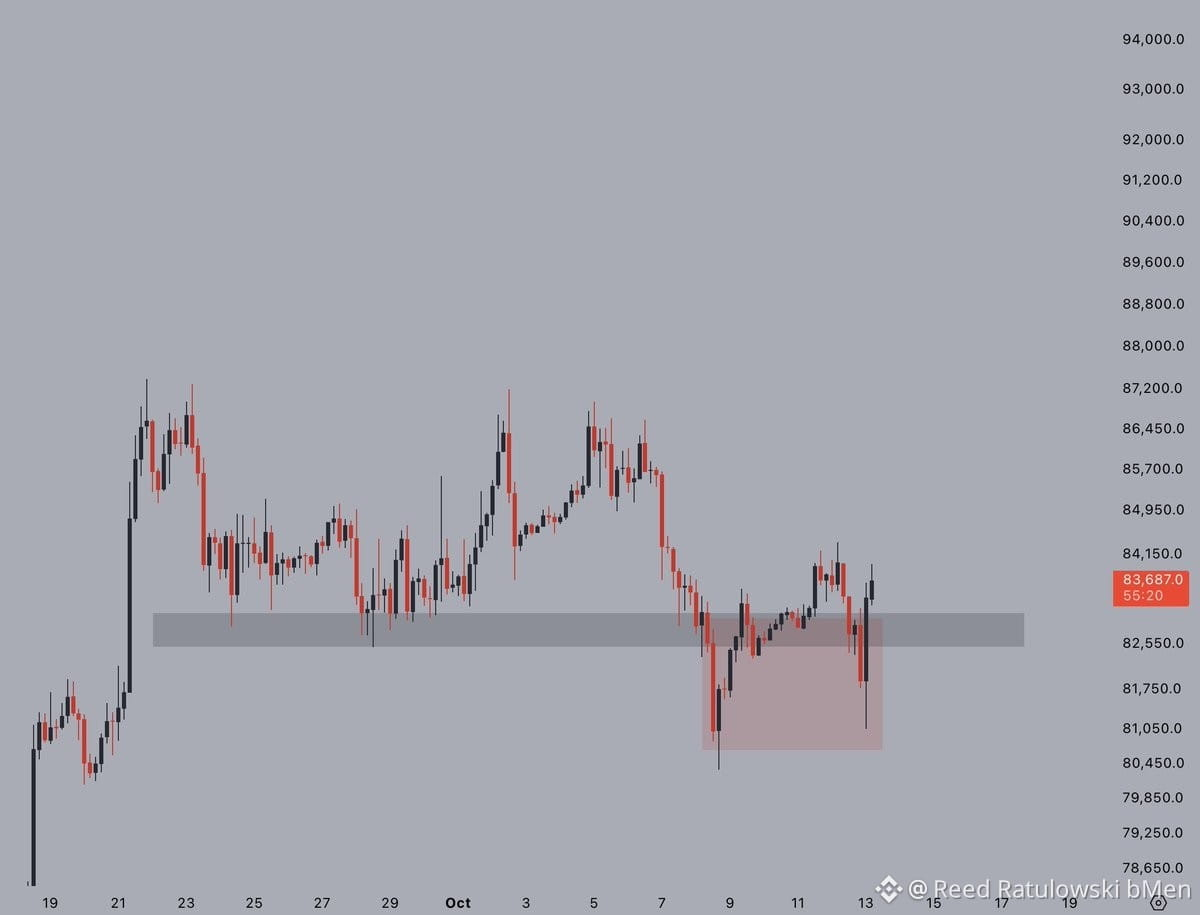
Os ursos tentaram provocar uma nova queda, mas o $BTC rapidamente voltou a ficar acima da zona de suporte crucial. Se mantiver os $82,5 mil a partir daqui, provavelmente voltaremos a nos aproximar das máximas locais nos próximos dias. De olho nos 87 mil. #Bitcoin
Os ursos tentaram provocar uma nova queda, mas o $BTC rapidamente voltou a ficar acima da zona de suporte crucial. Se mantiver os $82,5 mil a partir daqui, provavelmente voltaremos a nos aproximar das máximas locais nos próximos dias. De olho nos 87 mil. #Bitcoin
58
Inicia sessão para explorar mais conteúdos
Junta-te a utilizadores de criptomoedas de todo o mundo na Binance Square
⚡️ Obtém informações úteis e recentes sobre criptomoedas.
💬 Com a confiança da maior exchange de criptomoedas do mundo.
👍 Descobre perspetivas reais de criadores verificados.
E-mail/Número de telefone
Tópicos em Tendência
BinancePick
2.6M visualizações
140,919 a discutir
Participe da #TemporadaDeResultados: preveja resultados no Binance Pick e compartilhe sua opinião no Binance Square!
Binance Square Official
·401 gostos
·338.3k visualizações
EarningsSeason
5M visualizações
24,292 a discutir
FranklinTempletonFilesForTwoDividendToBitcoinETFs
1,001 visualizações
61 a discutir