
Mukhtiar_Ali_55
11.4k Posting

Mukhtiar_Ali_55
Laporkan
Blokir Pengguna
32 Mengikuti
433 Pengikut
4.2K+ Disukai
Posting
Semua
Kuotasi
Lihat terjemahan
Zcash (ZEC) Climbs Over 6% and Holds Above Key Moving Averages Near $1,335
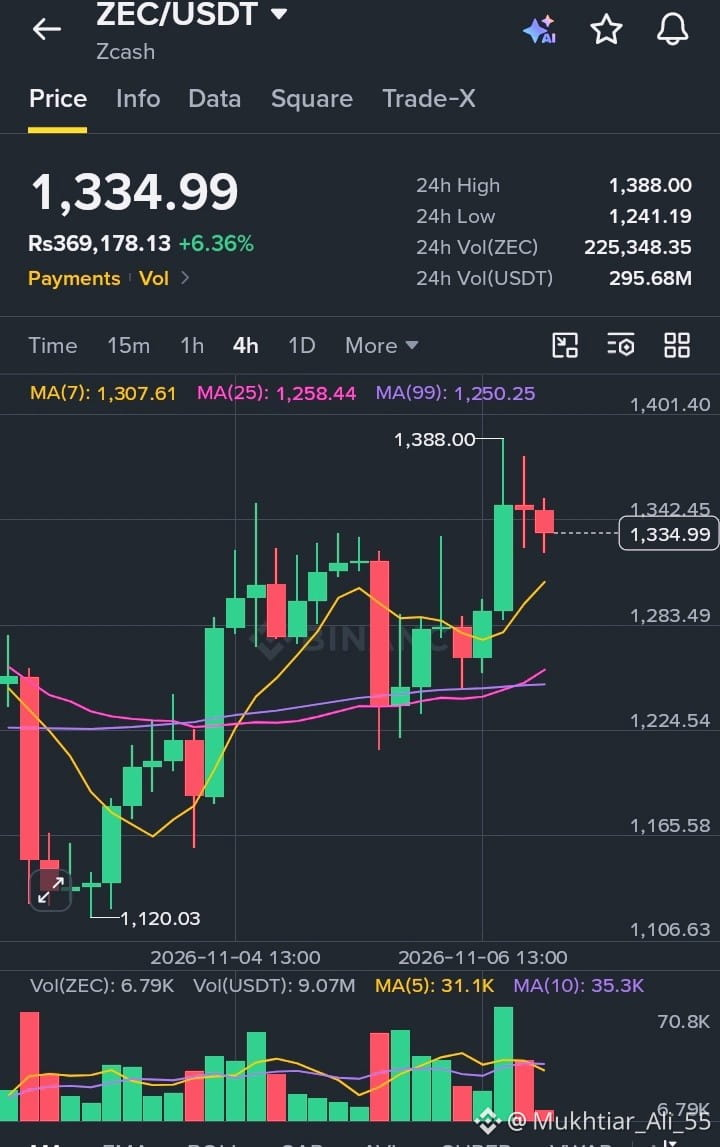
Zcash (ZEC/USDT) is trading at $1,334.99, up 6.36% over the last 24 hours. After a strong push toward the $1,388 area, the price has cooled slightly but is still holding comfortably above its major trend lines.
The numbers at a glance:
24h High: $1,388.00
24h Low: $1,241.19
24h Volume (ZEC): 225,348.35
24h Volume (USDT): $295.68M
Local price: Rs369,178.13
What the 4-hour chart shows:
ZEC recovered from a low of $1,120.03 and has built a steady series of higher lows since. The latest rally lifted it to $1,388.00, where sellers stepped in and left a long upper wick, and the price has since eased back into the $1,335 range. It now trades above the MA(7) at 1,307.61, the MA(25) at 1,258.44 and the MA(99) at 1,250.25. The MA(7) is rising sharply, while the MA(25) has just crossed above the MA(99), a constructive sign for the medium-term trend.
Volume picked up on the breakout candle, which suggests real buying interest behind the move. The last two candles are red and on lighter volume, which looks like a normal pause after a strong run rather than a change in direction.
Things worth keeping in mind:
The price is now stretched above its moving averages, so a pullback toward the MA(7) would not be unusual. With nearly $296M traded in 24 hours, liquidity is deep compared with smaller altcoins, which helps make price action more reliable, though sharp moves can still happen in volatile markets.
The first level to watch on the upside is the $1,388 high. A close above it would open the door to further gains. On the downside, the MA(7) near $1,308 is the first support, followed by the $1,258 to $1,250 zone where the two longer averages sit. As always, do your own research and manage your risk.
$ZEC
{spot}(ZECUSDT)
Zcash (ZEC) Climbs Over 6% and Holds Above Key Moving Averages Near $1,335
Zcash (ZEC/USDT) is trading at $1,334.99, up 6.36% over the last 24 hours. After a strong push toward the $1,388 area, the price has cooled slightly but is still holding comfortably above its major trend lines.
The numbers at a glance:
24h High: $1,388.00
24h Low: $1,241.19
24h Volume (ZEC): 225,348.35
24h Volume (USDT): $295.68M
Local price: Rs369,178.13
What the 4-hour chart shows:
ZEC recovered from a low of $1,120.03 and has built a steady series of higher lows since. The latest rally lifted it to $1,388.00, where sellers stepped in and left a long upper wick, and the price has since eased back into the $1,335 range. It now trades above the MA(7) at 1,307.61, the MA(25) at 1,258.44 and the MA(99) at 1,250.25. The MA(7) is rising sharply, while the MA(25) has just crossed above the MA(99), a constructive sign for the medium-term trend.
Volume picked up on the breakout candle, which suggests real buying interest behind the move. The last two candles are red and on lighter volume, which looks like a normal pause after a strong run rather than a change in direction.
Things worth keeping in mind:
The price is now stretched above its moving averages, so a pullback toward the MA(7) would not be unusual. With nearly $296M traded in 24 hours, liquidity is deep compared with smaller altcoins, which helps make price action more reliable, though sharp moves can still happen in volatile markets.
The first level to watch on the upside is the $1,388 high. A close above it would open the door to further gains. On the downside, the MA(7) near $1,308 is the first support, followed by the $1,258 to $1,250 zone where the two longer averages sit. As always, do your own research and manage your risk.
$ZEC
Zcash (ZEC/USDT) is trading at $1,334.99, up 6.36% over the last 24 hours. After a strong push toward the $1,388 area, the price has cooled slightly but is still holding comfortably above its major trend lines.
The numbers at a glance:
24h High: $1,388.00
24h Low: $1,241.19
24h Volume (ZEC): 225,348.35
24h Volume (USDT): $295.68M
Local price: Rs369,178.13
What the 4-hour chart shows:
ZEC recovered from a low of $1,120.03 and has built a steady series of higher lows since. The latest rally lifted it to $1,388.00, where sellers stepped in and left a long upper wick, and the price has since eased back into the $1,335 range. It now trades above the MA(7) at 1,307.61, the MA(25) at 1,258.44 and the MA(99) at 1,250.25. The MA(7) is rising sharply, while the MA(25) has just crossed above the MA(99), a constructive sign for the medium-term trend.
Volume picked up on the breakout candle, which suggests real buying interest behind the move. The last two candles are red and on lighter volume, which looks like a normal pause after a strong run rather than a change in direction.
Things worth keeping in mind:
The price is now stretched above its moving averages, so a pullback toward the MA(7) would not be unusual. With nearly $296M traded in 24 hours, liquidity is deep compared with smaller altcoins, which helps make price action more reliable, though sharp moves can still happen in volatile markets.
The first level to watch on the upside is the $1,388 high. A close above it would open the door to further gains. On the downside, the MA(7) near $1,308 is the first support, followed by the $1,258 to $1,250 zone where the two longer averages sit. As always, do your own research and manage your risk.
$ZEC
12
River (RIVER) Pulih Lebih dari 9% Setelah Aksi Jual Tajam, tetapi Resistensi Membayangi
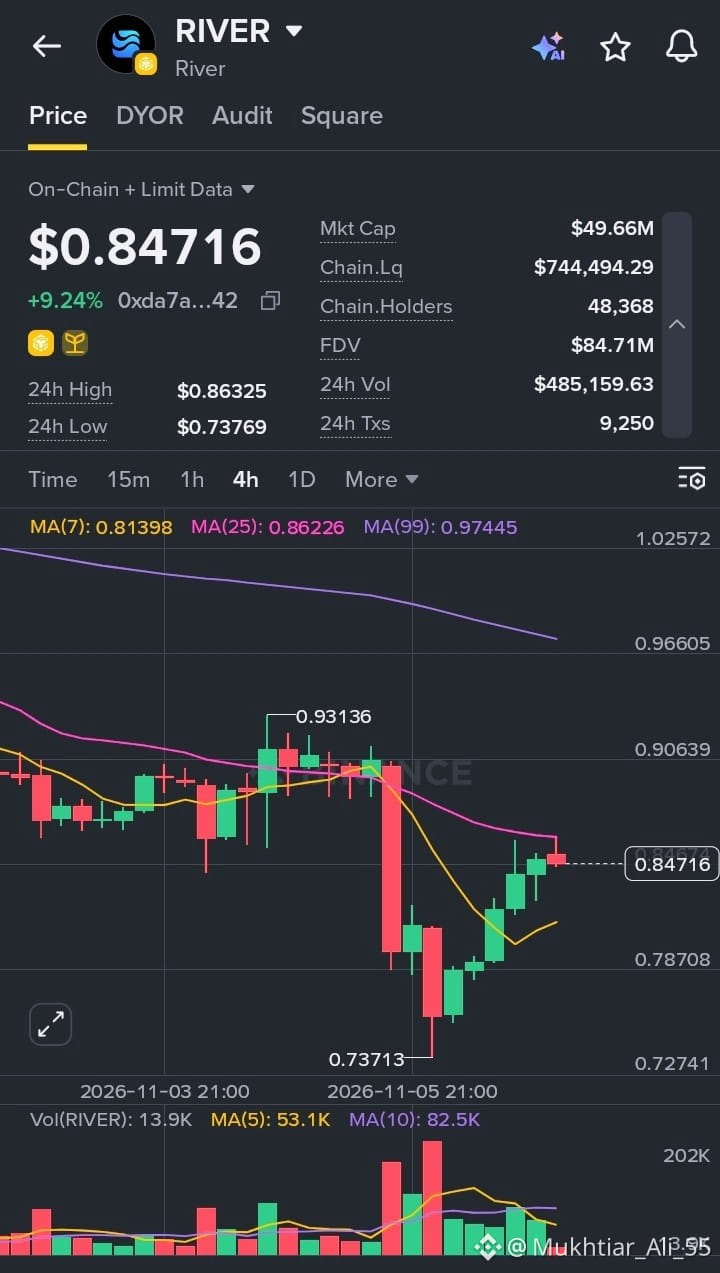
River (RIVER) diperdagangkan pada harga $0.84716, naik 9.24% dalam 24 jam terakhir. Setelah turun tajam pada awal sesi, harga berangsur naik kembali dan kini menguji rata-rata bergerak penting dari bawah.
Ringkasan angka:
Tertinggi 24 jam: $0.86325
Terendah 24 jam: $0.73769
Kapitalisasi Pasar: $49.66M
Valuasi Terdilusi Penuh: $84.71M
Volume 24 jam: $485,159.63
Likuiditas On-chain: $744,494.29
Pemegang On-chain: 48,368
Transaksi 24 jam: 9,250
Yang ditunjukkan grafik 4 jam:
RIVER mencapai puncak di sekitar $0.93136 sebelum sebuah candle merah besar menyeretnya turun ke titik terendah $0.73713. Pembeli segera masuk, dan serangkaian candle hijau mendorong harga kembali ke area $0.85. Kini harganya berada di atas MA(7) di 0.81398, yang mulai melengkung ke atas, tetapi tertahan di MA(25) pada 0.86226 dan masih jauh di bawah MA(99) pada 0.97445. Kedua rata-rata jangka panjang tersebut masih menurun, sehingga tren yang lebih luas belum berbalik bullish.
Volume melonjak selama aksi jual dan terus menurun setelahnya. Candle terbaru berwarna merah kecil tepat di bawah MA(25), yang menunjukkan bahwa pantulan harga menghadapi resistensi dan pasar sedang menentukan arah selanjutnya.
Hal-hal yang perlu diperhatikan:
Likuiditas on-chain sekitar $744,000 terbilang terbatas, sehingga pesanan berukuran besar dapat menggerakkan harga secara signifikan. Volume harian sekitar $485K juga relatif rendah dibandingkan kapitalisasi pasar sebesar $49.66M. Selisih antara kapitalisasi pasar dan FDV sebesar $84.71M membuat pasokan token di masa depan layak untuk terus dipantau.
Level pertama yang perlu diperhatikan adalah MA(25) di sekitar $0.862, yang bertepatan dengan harga tertinggi 24 jam di $0.863. Penutupan yang meyakinkan di atas level tersebut akan menjadi pertanda positif, sementara penurunan di bawah MA(7) sekitar $0.814 dapat kembali mengarahkan perhatian pada titik terendah terbaru. Seperti biasa, lakukan riset sendiri dan kelola risiko Anda.
$RIVER
{future}(RIVERUSDT)
River (RIVER) Pulih Lebih dari 9% Setelah Aksi Jual Tajam, tetapi Resistensi Membayangi
River (RIVER) diperdagangkan pada harga $0.84716, naik 9.24% dalam 24 jam terakhir. Setelah turun tajam pada awal sesi, harga berangsur naik kembali dan kini menguji rata-rata bergerak penting dari bawah.
Ringkasan angka:
Tertinggi 24 jam: $0.86325
Terendah 24 jam: $0.73769
Kapitalisasi Pasar: $49.66M
Valuasi Terdilusi Penuh: $84.71M
Volume 24 jam: $485,159.63
Likuiditas On-chain: $744,494.29
Pemegang On-chain: 48,368
Transaksi 24 jam: 9,250
Yang ditunjukkan grafik 4 jam:
RIVER mencapai puncak di sekitar $0.93136 sebelum sebuah candle merah besar menyeretnya turun ke titik terendah $0.73713. Pembeli segera masuk, dan serangkaian candle hijau mendorong harga kembali ke area $0.85. Kini harganya berada di atas MA(7) di 0.81398, yang mulai melengkung ke atas, tetapi tertahan di MA(25) pada 0.86226 dan masih jauh di bawah MA(99) pada 0.97445. Kedua rata-rata jangka panjang tersebut masih menurun, sehingga tren yang lebih luas belum berbalik bullish.
Volume melonjak selama aksi jual dan terus menurun setelahnya. Candle terbaru berwarna merah kecil tepat di bawah MA(25), yang menunjukkan bahwa pantulan harga menghadapi resistensi dan pasar sedang menentukan arah selanjutnya.
Hal-hal yang perlu diperhatikan:
Likuiditas on-chain sekitar $744,000 terbilang terbatas, sehingga pesanan berukuran besar dapat menggerakkan harga secara signifikan. Volume harian sekitar $485K juga relatif rendah dibandingkan kapitalisasi pasar sebesar $49.66M. Selisih antara kapitalisasi pasar dan FDV sebesar $84.71M membuat pasokan token di masa depan layak untuk terus dipantau.
Level pertama yang perlu diperhatikan adalah MA(25) di sekitar $0.862, yang bertepatan dengan harga tertinggi 24 jam di $0.863. Penutupan yang meyakinkan di atas level tersebut akan menjadi pertanda positif, sementara penurunan di bawah MA(7) sekitar $0.814 dapat kembali mengarahkan perhatian pada titik terendah terbaru. Seperti biasa, lakukan riset sendiri dan kelola risiko Anda.
$RIVER
River (RIVER) diperdagangkan pada harga $0.84716, naik 9.24% dalam 24 jam terakhir. Setelah turun tajam pada awal sesi, harga berangsur naik kembali dan kini menguji rata-rata bergerak penting dari bawah.
Ringkasan angka:
Tertinggi 24 jam: $0.86325
Terendah 24 jam: $0.73769
Kapitalisasi Pasar: $49.66M
Valuasi Terdilusi Penuh: $84.71M
Volume 24 jam: $485,159.63
Likuiditas On-chain: $744,494.29
Pemegang On-chain: 48,368
Transaksi 24 jam: 9,250
Yang ditunjukkan grafik 4 jam:
RIVER mencapai puncak di sekitar $0.93136 sebelum sebuah candle merah besar menyeretnya turun ke titik terendah $0.73713. Pembeli segera masuk, dan serangkaian candle hijau mendorong harga kembali ke area $0.85. Kini harganya berada di atas MA(7) di 0.81398, yang mulai melengkung ke atas, tetapi tertahan di MA(25) pada 0.86226 dan masih jauh di bawah MA(99) pada 0.97445. Kedua rata-rata jangka panjang tersebut masih menurun, sehingga tren yang lebih luas belum berbalik bullish.
Volume melonjak selama aksi jual dan terus menurun setelahnya. Candle terbaru berwarna merah kecil tepat di bawah MA(25), yang menunjukkan bahwa pantulan harga menghadapi resistensi dan pasar sedang menentukan arah selanjutnya.
Hal-hal yang perlu diperhatikan:
Likuiditas on-chain sekitar $744,000 terbilang terbatas, sehingga pesanan berukuran besar dapat menggerakkan harga secara signifikan. Volume harian sekitar $485K juga relatif rendah dibandingkan kapitalisasi pasar sebesar $49.66M. Selisih antara kapitalisasi pasar dan FDV sebesar $84.71M membuat pasokan token di masa depan layak untuk terus dipantau.
Level pertama yang perlu diperhatikan adalah MA(25) di sekitar $0.862, yang bertepatan dengan harga tertinggi 24 jam di $0.863. Penutupan yang meyakinkan di atas level tersebut akan menjadi pertanda positif, sementara penurunan di bawah MA(7) sekitar $0.814 dapat kembali mengarahkan perhatian pada titik terendah terbaru. Seperti biasa, lakukan riset sendiri dan kelola risiko Anda.
$RIVER
7
Lihat terjemahan
SIREN Edges Up 2% as Price Consolidates Around Key Moving Averages
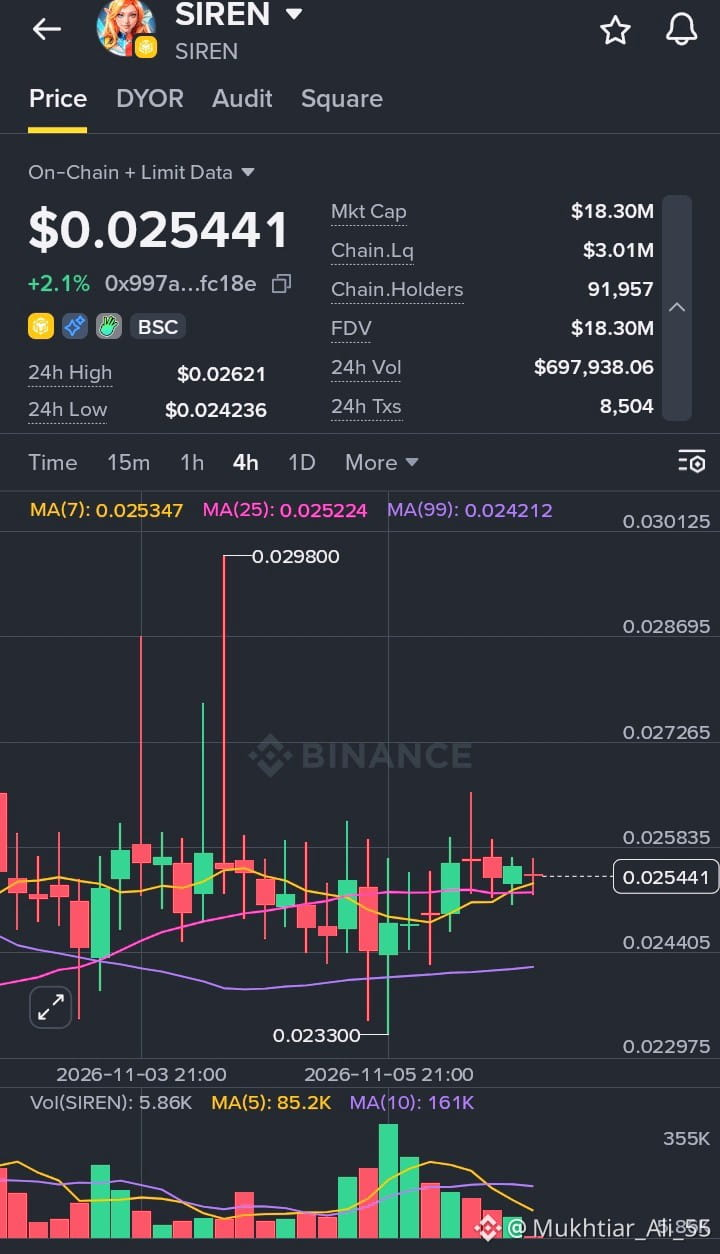
SIREN is trading at $0.025441, up 2.1% over the last 24 hours. After a volatile few days that included a sharp spike, the price has settled into a tight range and is moving sideways right on top of its short-term trend lines.
The numbers at a glance:
24h High: $0.02621
24h Low: $0.024236
Market Cap: $18.30M
Fully Diluted Valuation: $18.30M
24h Volume: $697,938.06
On-chain Liquidity: $3.01M
On-chain Holders: 91,957
24h Transactions: 8,504
What the 4-hour chart shows:
SIREN printed a sharp wick up to $0.0298 earlier in the week and a low of $0.0233, but the price has since compressed into a narrow band between roughly $0.0244 and $0.0258. It is now sitting almost exactly on the MA(7) at 0.025347 and the MA(25) at 0.025224, with the MA(99) at 0.024212 just below, curving gently upward. When price and all three averages sit this close together, it usually signals a market in balance, waiting for a catalyst to pick a direction.
Volume has been fading over the last several sessions, and the latest candles are small with mixed colors. That points to low conviction on both sides for now.
Things worth keeping in mind:
Market cap and FDV are identical at $18.30M, which means the full supply is already in circulation and there is no future unlock pressure to factor in. On-chain liquidity of about $3.01M is healthy relative to the $697K in daily volume, and a holder base of nearly 92,000 shows broad participation. The long wicks seen earlier in the week are a reminder that sudden spikes can happen even when conditions look quiet.
The levels to watch are the $0.0262 daily high on the upside and the MA(99) near $0.0242 on the downside. A decisive break of either side of this range would likely set the next move. As always, do your own research and manage your risk.
$SIREN
{future}(SIRENUSDT)
SIREN Edges Up 2% as Price Consolidates Around Key Moving Averages
SIREN is trading at $0.025441, up 2.1% over the last 24 hours. After a volatile few days that included a sharp spike, the price has settled into a tight range and is moving sideways right on top of its short-term trend lines.
The numbers at a glance:
24h High: $0.02621
24h Low: $0.024236
Market Cap: $18.30M
Fully Diluted Valuation: $18.30M
24h Volume: $697,938.06
On-chain Liquidity: $3.01M
On-chain Holders: 91,957
24h Transactions: 8,504
What the 4-hour chart shows:
SIREN printed a sharp wick up to $0.0298 earlier in the week and a low of $0.0233, but the price has since compressed into a narrow band between roughly $0.0244 and $0.0258. It is now sitting almost exactly on the MA(7) at 0.025347 and the MA(25) at 0.025224, with the MA(99) at 0.024212 just below, curving gently upward. When price and all three averages sit this close together, it usually signals a market in balance, waiting for a catalyst to pick a direction.
Volume has been fading over the last several sessions, and the latest candles are small with mixed colors. That points to low conviction on both sides for now.
Things worth keeping in mind:
Market cap and FDV are identical at $18.30M, which means the full supply is already in circulation and there is no future unlock pressure to factor in. On-chain liquidity of about $3.01M is healthy relative to the $697K in daily volume, and a holder base of nearly 92,000 shows broad participation. The long wicks seen earlier in the week are a reminder that sudden spikes can happen even when conditions look quiet.
The levels to watch are the $0.0262 daily high on the upside and the MA(99) near $0.0242 on the downside. A decisive break of either side of this range would likely set the next move. As always, do your own research and manage your risk.
$SIREN
SIREN is trading at $0.025441, up 2.1% over the last 24 hours. After a volatile few days that included a sharp spike, the price has settled into a tight range and is moving sideways right on top of its short-term trend lines.
The numbers at a glance:
24h High: $0.02621
24h Low: $0.024236
Market Cap: $18.30M
Fully Diluted Valuation: $18.30M
24h Volume: $697,938.06
On-chain Liquidity: $3.01M
On-chain Holders: 91,957
24h Transactions: 8,504
What the 4-hour chart shows:
SIREN printed a sharp wick up to $0.0298 earlier in the week and a low of $0.0233, but the price has since compressed into a narrow band between roughly $0.0244 and $0.0258. It is now sitting almost exactly on the MA(7) at 0.025347 and the MA(25) at 0.025224, with the MA(99) at 0.024212 just below, curving gently upward. When price and all three averages sit this close together, it usually signals a market in balance, waiting for a catalyst to pick a direction.
Volume has been fading over the last several sessions, and the latest candles are small with mixed colors. That points to low conviction on both sides for now.
Things worth keeping in mind:
Market cap and FDV are identical at $18.30M, which means the full supply is already in circulation and there is no future unlock pressure to factor in. On-chain liquidity of about $3.01M is healthy relative to the $697K in daily volume, and a holder base of nearly 92,000 shows broad participation. The long wicks seen earlier in the week are a reminder that sudden spikes can happen even when conditions look quiet.
The levels to watch are the $0.0262 daily high on the upside and the MA(99) near $0.0242 on the downside. A decisive break of either side of this range would likely set the next move. As always, do your own research and manage your risk.
$SIREN
5
Lihat terjemahan
BNB Attestation (BAS) Rallies Over 10% After a Sharp Dip, Faces Resistance Near $0.016
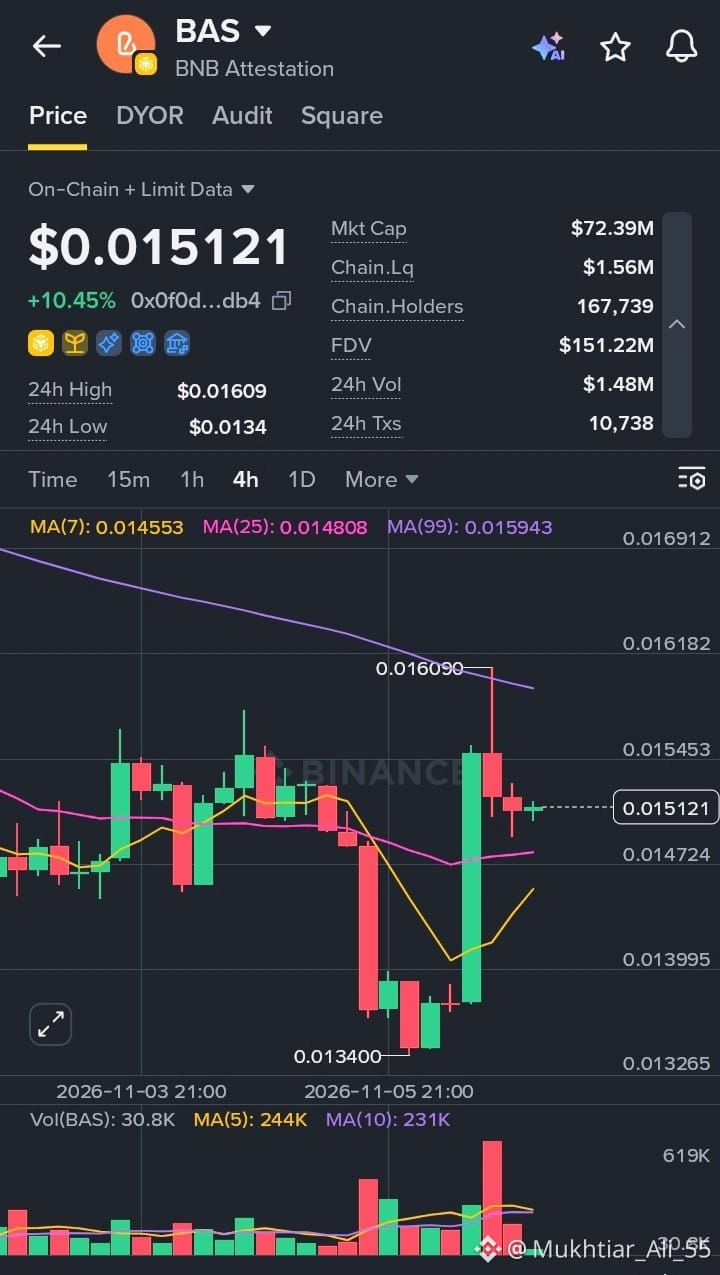
BNB Attestation (BAS) is trading at $0.015121, up 10.45% over the last 24 hours. After a steep sell-off earlier in the session, buyers stepped in with force and pushed the price back above its short-term moving averages.
The numbers at a glance:
24h High: $0.01609
24h Low: $0.0134
Market Cap: $72.39M
Fully Diluted Valuation: $151.22M
24h Volume: $1.48M
On-chain Liquidity: $1.56M
On-chain Holders: 167,739
24h Transactions: 10,738
What the 4-hour chart shows:
BAS dropped to a low of $0.0134 before a large green candle drove it all the way up to $0.01609. That push was rejected by the MA(99) at 0.015943, leaving a long upper wick, and the price has since settled back near $0.0151. It is currently sitting above the MA(7) at 0.014553 and the MA(25) at 0.014808, with the MA(7) curving upward. The MA(99) is still sloping down overhead, so the broader trend has not fully flipped bullish yet.
Volume spiked on both the sell-off and the recovery candle, then cooled in the latest sessions. The small, indecisive candles now suggest the market is pausing and deciding its next move.
Things worth keeping in mind:
A holder base of more than 167,000 shows wide participation, but on-chain liquidity of about $1.56M is modest against a $72.39M market cap, so price can swing sharply on larger trades. The gap between market cap and the $151.22M FDV also means future token supply is worth tracking.
The key upside level is the $0.0159 to $0.0161 zone, where the MA(99) and the recent wick high meet. On the downside, the MA(25) near $0.0148 is the area buyers will want to defend. As always, do your own research and manage your risk.
$BAS
{future}(BASUSDT)
BNB Attestation (BAS) Rallies Over 10% After a Sharp Dip, Faces Resistance Near $0.016
BNB Attestation (BAS) is trading at $0.015121, up 10.45% over the last 24 hours. After a steep sell-off earlier in the session, buyers stepped in with force and pushed the price back above its short-term moving averages.
The numbers at a glance:
24h High: $0.01609
24h Low: $0.0134
Market Cap: $72.39M
Fully Diluted Valuation: $151.22M
24h Volume: $1.48M
On-chain Liquidity: $1.56M
On-chain Holders: 167,739
24h Transactions: 10,738
What the 4-hour chart shows:
BAS dropped to a low of $0.0134 before a large green candle drove it all the way up to $0.01609. That push was rejected by the MA(99) at 0.015943, leaving a long upper wick, and the price has since settled back near $0.0151. It is currently sitting above the MA(7) at 0.014553 and the MA(25) at 0.014808, with the MA(7) curving upward. The MA(99) is still sloping down overhead, so the broader trend has not fully flipped bullish yet.
Volume spiked on both the sell-off and the recovery candle, then cooled in the latest sessions. The small, indecisive candles now suggest the market is pausing and deciding its next move.
Things worth keeping in mind:
A holder base of more than 167,000 shows wide participation, but on-chain liquidity of about $1.56M is modest against a $72.39M market cap, so price can swing sharply on larger trades. The gap between market cap and the $151.22M FDV also means future token supply is worth tracking.
The key upside level is the $0.0159 to $0.0161 zone, where the MA(99) and the recent wick high meet. On the downside, the MA(25) near $0.0148 is the area buyers will want to defend. As always, do your own research and manage your risk.
$BAS
BNB Attestation (BAS) is trading at $0.015121, up 10.45% over the last 24 hours. After a steep sell-off earlier in the session, buyers stepped in with force and pushed the price back above its short-term moving averages.
The numbers at a glance:
24h High: $0.01609
24h Low: $0.0134
Market Cap: $72.39M
Fully Diluted Valuation: $151.22M
24h Volume: $1.48M
On-chain Liquidity: $1.56M
On-chain Holders: 167,739
24h Transactions: 10,738
What the 4-hour chart shows:
BAS dropped to a low of $0.0134 before a large green candle drove it all the way up to $0.01609. That push was rejected by the MA(99) at 0.015943, leaving a long upper wick, and the price has since settled back near $0.0151. It is currently sitting above the MA(7) at 0.014553 and the MA(25) at 0.014808, with the MA(7) curving upward. The MA(99) is still sloping down overhead, so the broader trend has not fully flipped bullish yet.
Volume spiked on both the sell-off and the recovery candle, then cooled in the latest sessions. The small, indecisive candles now suggest the market is pausing and deciding its next move.
Things worth keeping in mind:
A holder base of more than 167,000 shows wide participation, but on-chain liquidity of about $1.56M is modest against a $72.39M market cap, so price can swing sharply on larger trades. The gap between market cap and the $151.22M FDV also means future token supply is worth tracking.
The key upside level is the $0.0159 to $0.0161 zone, where the MA(99) and the recent wick high meet. On the downside, the MA(25) near $0.0148 is the area buyers will want to defend. As always, do your own research and manage your risk.
$BAS
Lihat terjemahan
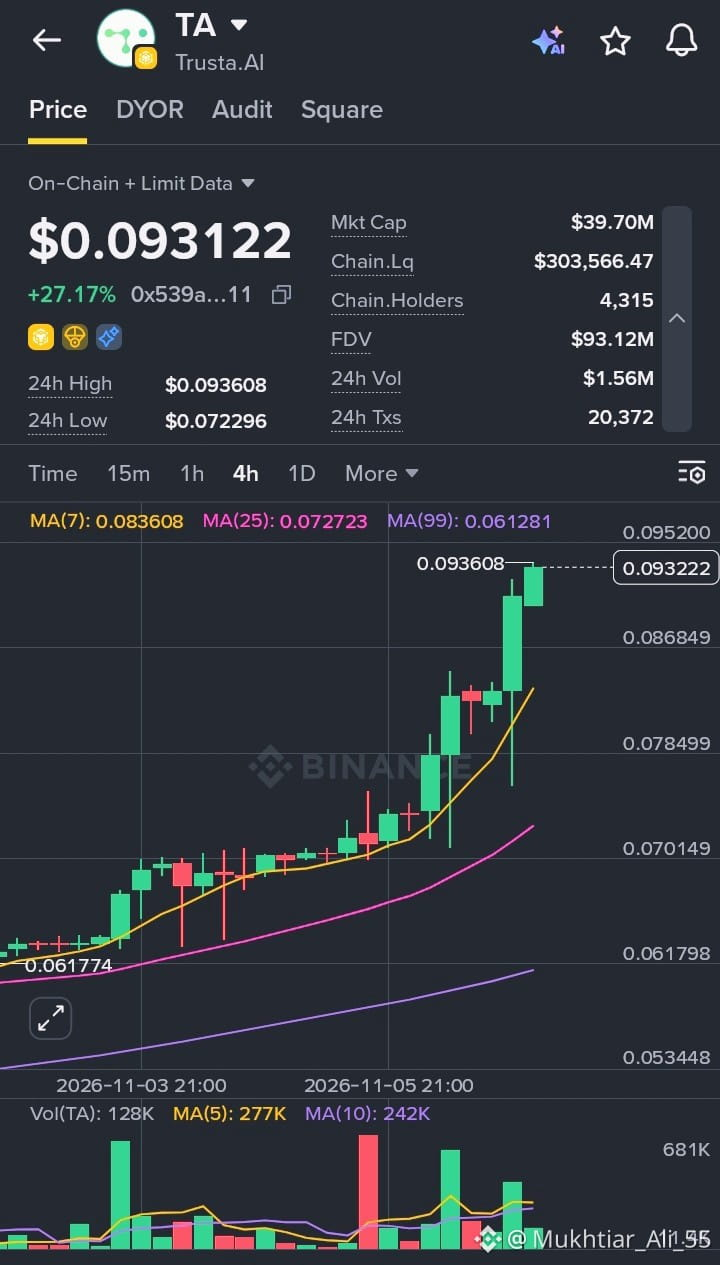
Trusta.AI (TA) Surges Over 27% and Pushes to a Fresh High
Trusta.AI (TA) is trading at $0.093122, up 27.17% over the last 24 hours. After a steady climb, the price has broken out strongly and is now pressing right against its 24h high.
The numbers at a glance:
24h High: $0.093608
24h Low: $0.072296
Market Cap: $39.70M
Fully Diluted Valuation: $93.12M
24h Volume: $1.56M
On-chain Liquidity: $303,566.47
On-chain Holders: 4,315
24h Transactions: 20,372
What the 4-hour chart shows:
TA has been trending upward from the $0.0618 area, with higher lows building for several sessions. The last few candles show a sharp acceleration, with the price pushing through $0.09 and printing a high of $0.093608. It sits well above the MA(7) at 0.083608, the MA(25) at 0.072723 and the MA(99) at 0.061281, and all three are sloping upward, which confirms a clean uptrend across short and medium timeframes. One candle left a long lower wick during the climb, showing buyers quickly absorbed a brief dip.
Volume has been building alongside the move, with the latest green candles supported by solid participation. The price is also noticeably stretched above the MA(7), so a short pause or pullback would be normal after a run like this.
Things worth keeping in mind:
The holder count of 4,315 is small compared to the market cap, which suggests ownership may be concentrated, and on-chain liquidity of roughly $303,000 is thin against a $39.70M market cap. Price can move sharply in either direction on modest trades. The gap between market cap and the $93.12M FDV also means future token supply deserves attention.
The immediate level to watch is the $0.0936 high. A hold above it would signal continued strength, while a pullback toward the MA(7) near $0.084 would be the first real test for buyers. As always, do your own research and manage your risk.
$TA
{future}(TAUSDT)
Trusta.AI (TA) Surges Over 27% and Pushes to a Fresh High
Trusta.AI (TA) is trading at $0.093122, up 27.17% over the last 24 hours. After a steady climb, the price has broken out strongly and is now pressing right against its 24h high.
The numbers at a glance:
24h High: $0.093608
24h Low: $0.072296
Market Cap: $39.70M
Fully Diluted Valuation: $93.12M
24h Volume: $1.56M
On-chain Liquidity: $303,566.47
On-chain Holders: 4,315
24h Transactions: 20,372
What the 4-hour chart shows:
TA has been trending upward from the $0.0618 area, with higher lows building for several sessions. The last few candles show a sharp acceleration, with the price pushing through $0.09 and printing a high of $0.093608. It sits well above the MA(7) at 0.083608, the MA(25) at 0.072723 and the MA(99) at 0.061281, and all three are sloping upward, which confirms a clean uptrend across short and medium timeframes. One candle left a long lower wick during the climb, showing buyers quickly absorbed a brief dip.
Volume has been building alongside the move, with the latest green candles supported by solid participation. The price is also noticeably stretched above the MA(7), so a short pause or pullback would be normal after a run like this.
Things worth keeping in mind:
The holder count of 4,315 is small compared to the market cap, which suggests ownership may be concentrated, and on-chain liquidity of roughly $303,000 is thin against a $39.70M market cap. Price can move sharply in either direction on modest trades. The gap between market cap and the $93.12M FDV also means future token supply deserves attention.
The immediate level to watch is the $0.0936 high. A hold above it would signal continued strength, while a pullback toward the MA(7) near $0.084 would be the first real test for buyers. As always, do your own research and manage your risk.
$TA
Trusta.AI (TA) is trading at $0.093122, up 27.17% over the last 24 hours. After a steady climb, the price has broken out strongly and is now pressing right against its 24h high.
The numbers at a glance:
24h High: $0.093608
24h Low: $0.072296
Market Cap: $39.70M
Fully Diluted Valuation: $93.12M
24h Volume: $1.56M
On-chain Liquidity: $303,566.47
On-chain Holders: 4,315
24h Transactions: 20,372
What the 4-hour chart shows:
TA has been trending upward from the $0.0618 area, with higher lows building for several sessions. The last few candles show a sharp acceleration, with the price pushing through $0.09 and printing a high of $0.093608. It sits well above the MA(7) at 0.083608, the MA(25) at 0.072723 and the MA(99) at 0.061281, and all three are sloping upward, which confirms a clean uptrend across short and medium timeframes. One candle left a long lower wick during the climb, showing buyers quickly absorbed a brief dip.
Volume has been building alongside the move, with the latest green candles supported by solid participation. The price is also noticeably stretched above the MA(7), so a short pause or pullback would be normal after a run like this.
Things worth keeping in mind:
The holder count of 4,315 is small compared to the market cap, which suggests ownership may be concentrated, and on-chain liquidity of roughly $303,000 is thin against a $39.70M market cap. Price can move sharply in either direction on modest trades. The gap between market cap and the $93.12M FDV also means future token supply deserves attention.
The immediate level to watch is the $0.0936 high. A hold above it would signal continued strength, while a pullback toward the MA(7) near $0.084 would be the first real test for buyers. As always, do your own research and manage your risk.
$TA
5
Lihat terjemahan
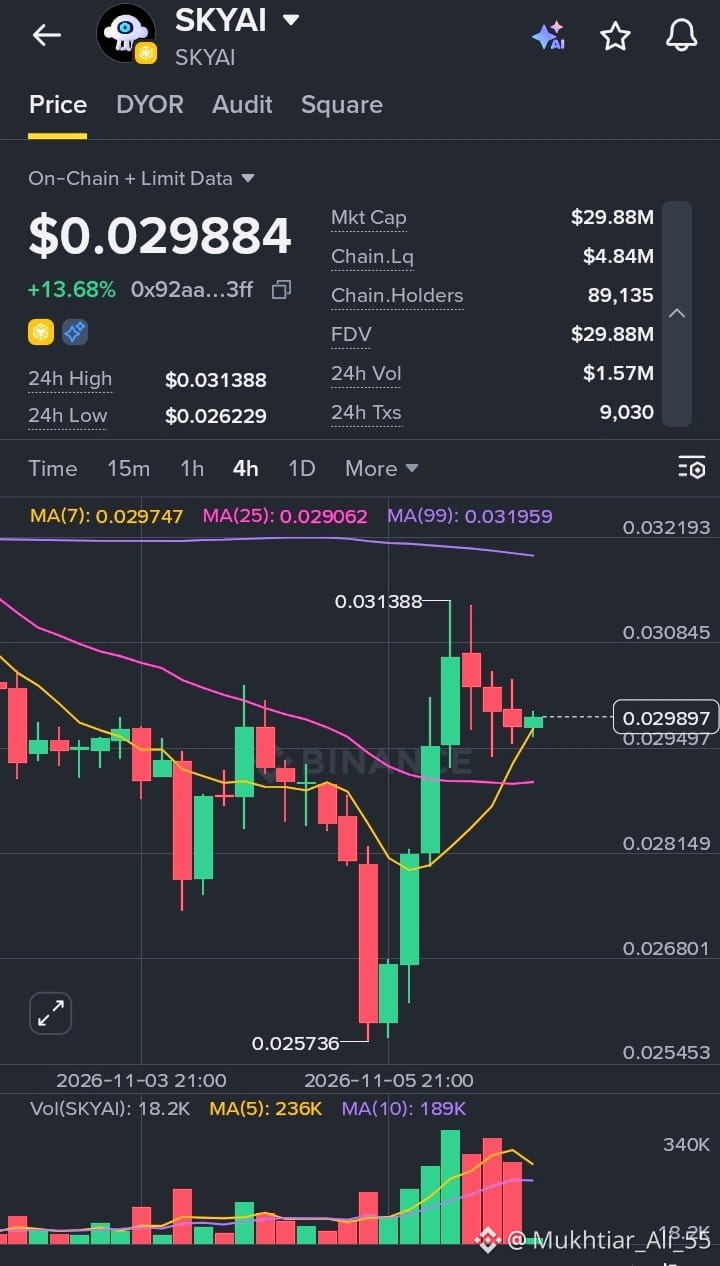
SKYAI Jumps Over 13% and Reclaims Its Short-Term Moving Averages
SKYAI is trading at $0.029884, up 13.68% over the last 24 hours. After a sharp dip earlier in the week, the price has rebounded strongly and is now sitting right on top of its short-term trend lines.
The numbers at a glance:
24h High: $0.031388
24h Low: $0.026229
Market Cap: $29.88M
Fully Diluted Valuation: $29.88M
24h Volume: $1.57M
On-chain Liquidity: $4.84M
On-chain Holders: 89,135
24h Transactions: 9,030
What the 4-hour chart shows:
SKYAI fell to a low of $0.025736 before buyers stepped in with a run of strong green candles, lifting the price to a peak of $0.031388. Since then, it has pulled back slightly and is consolidating just under $0.030. The price is now hovering around the MA(7) at 0.029747 and holding above the MA(25) at 0.029062, with the MA(7) curving sharply upward. The MA(99) at 0.031959 is still sloping down overhead, so the longer-term trend has yet to turn fully bullish.
Volume rose noticeably during the recovery and has been tapering off over the last few candles. That suggests the market is cooling after the bounce and waiting for its next catalyst.
Things worth keeping in mind:
Market cap and FDV are identical at $29.88M, which means the full token supply is already in circulation, so there is no hidden unlock pressure to worry about. On-chain liquidity of about $4.84M is solid relative to the daily volume, and a holder base of more than 89,000 points to wide participation.
The key level on the upside is the $0.0314 high, with the MA(99) near $0.032 as the bigger hurdle. On the downside, the MA(25) around $0.029 is the area buyers will want to defend to keep the recovery intact. As always, do your own research and manage your risk.
$SKYAI
{future}(SKYAIUSDT)
SKYAI Jumps Over 13% and Reclaims Its Short-Term Moving Averages
SKYAI is trading at $0.029884, up 13.68% over the last 24 hours. After a sharp dip earlier in the week, the price has rebounded strongly and is now sitting right on top of its short-term trend lines.
The numbers at a glance:
24h High: $0.031388
24h Low: $0.026229
Market Cap: $29.88M
Fully Diluted Valuation: $29.88M
24h Volume: $1.57M
On-chain Liquidity: $4.84M
On-chain Holders: 89,135
24h Transactions: 9,030
What the 4-hour chart shows:
SKYAI fell to a low of $0.025736 before buyers stepped in with a run of strong green candles, lifting the price to a peak of $0.031388. Since then, it has pulled back slightly and is consolidating just under $0.030. The price is now hovering around the MA(7) at 0.029747 and holding above the MA(25) at 0.029062, with the MA(7) curving sharply upward. The MA(99) at 0.031959 is still sloping down overhead, so the longer-term trend has yet to turn fully bullish.
Volume rose noticeably during the recovery and has been tapering off over the last few candles. That suggests the market is cooling after the bounce and waiting for its next catalyst.
Things worth keeping in mind:
Market cap and FDV are identical at $29.88M, which means the full token supply is already in circulation, so there is no hidden unlock pressure to worry about. On-chain liquidity of about $4.84M is solid relative to the daily volume, and a holder base of more than 89,000 points to wide participation.
The key level on the upside is the $0.0314 high, with the MA(99) near $0.032 as the bigger hurdle. On the downside, the MA(25) around $0.029 is the area buyers will want to defend to keep the recovery intact. As always, do your own research and manage your risk.
$SKYAI
SKYAI is trading at $0.029884, up 13.68% over the last 24 hours. After a sharp dip earlier in the week, the price has rebounded strongly and is now sitting right on top of its short-term trend lines.
The numbers at a glance:
24h High: $0.031388
24h Low: $0.026229
Market Cap: $29.88M
Fully Diluted Valuation: $29.88M
24h Volume: $1.57M
On-chain Liquidity: $4.84M
On-chain Holders: 89,135
24h Transactions: 9,030
What the 4-hour chart shows:
SKYAI fell to a low of $0.025736 before buyers stepped in with a run of strong green candles, lifting the price to a peak of $0.031388. Since then, it has pulled back slightly and is consolidating just under $0.030. The price is now hovering around the MA(7) at 0.029747 and holding above the MA(25) at 0.029062, with the MA(7) curving sharply upward. The MA(99) at 0.031959 is still sloping down overhead, so the longer-term trend has yet to turn fully bullish.
Volume rose noticeably during the recovery and has been tapering off over the last few candles. That suggests the market is cooling after the bounce and waiting for its next catalyst.
Things worth keeping in mind:
Market cap and FDV are identical at $29.88M, which means the full token supply is already in circulation, so there is no hidden unlock pressure to worry about. On-chain liquidity of about $4.84M is solid relative to the daily volume, and a holder base of more than 89,000 points to wide participation.
The key level on the upside is the $0.0314 high, with the MA(99) near $0.032 as the bigger hurdle. On the downside, the MA(25) around $0.029 is the area buyers will want to defend to keep the recovery intact. As always, do your own research and manage your risk.
$SKYAI
4
Lihat terjemahan
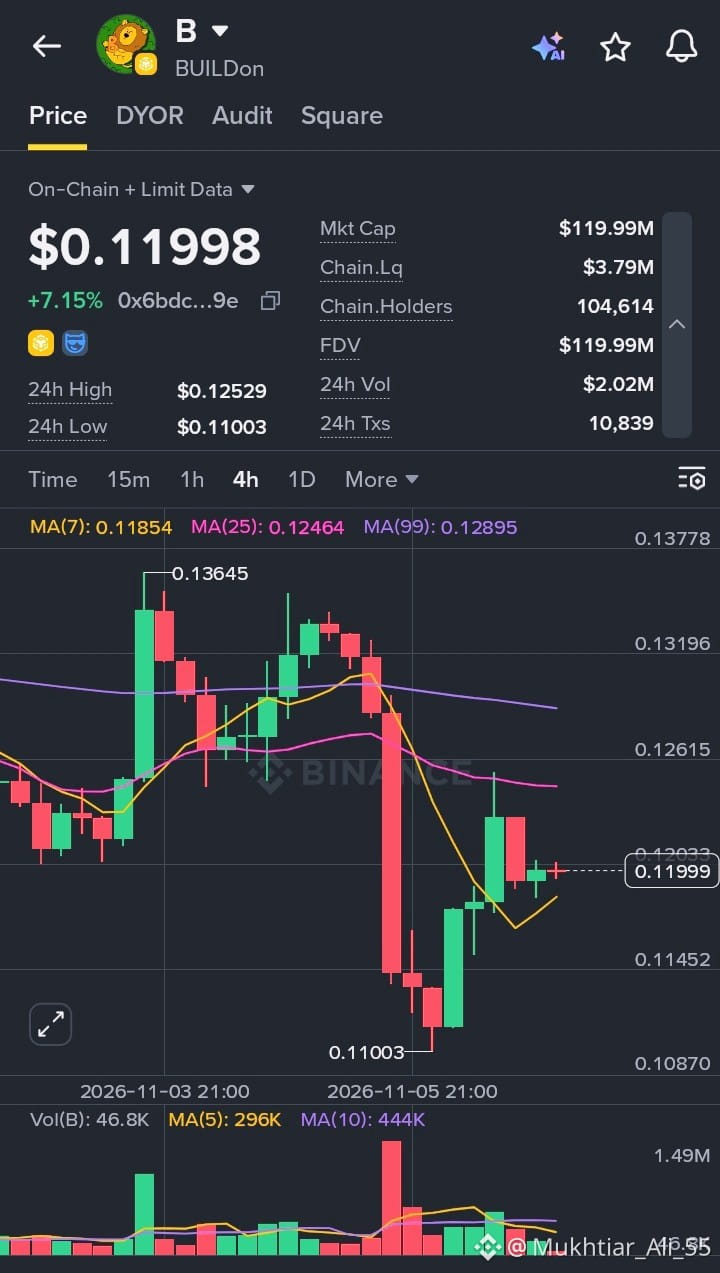
BUILDon (B) Bounces Over 7% After a Sharp Dip, Eyes the $0.12 Zone
BUILDon (B) is trading at $0.11998, up 7.15% over the last 24 hours. After a steep sell-off earlier in the session, the price has recovered steadily and is now consolidating just below $0.12.
The numbers at a glance:
24h High: $0.12529
24h Low: $0.11003
Market Cap: $119.99M
Fully Diluted Valuation: $119.99M
24h Volume: $2.02M
On-chain Liquidity: $3.79M
On-chain Holders: 104,614
24h Transactions: 10,839
What the 4-hour chart shows:
B peaked near $0.13645 before a large red candle dragged it down to a low of $0.11003. Buyers responded quickly, and the price has since climbed back to the $0.12 area. It now sits just above the MA(7) at 0.11854, which has started to curve upward, but remains below the MA(25) at 0.12464 and the MA(99) at 0.12895. Both of those longer averages are still sloping down, so the broader structure needs more confirmation before it can be called a reversal.
Volume surged during the drop and has faded since, with the latest candles showing small, indecisive bodies. That points to a market taking a pause after the bounce rather than making a decisive move.
Things worth keeping in mind:
The market cap and FDV are identical at $119.99M, which means the full token supply is already in circulation. That removes the risk of future unlock pressure, which is a real positive. Liquidity of around $3.79M is healthy relative to daily volume, and a holder base above 104,000 shows broad participation.
The first level to watch is the MA(25) near $0.1246, which lines up with the recent rejection wick. A clean move above it would be encouraging, while a slip below the MA(7) could bring the $0.11 low back into focus. As always, do your own research and manage your risk.
$B
{future}(BUSDT)
BUILDon (B) Bounces Over 7% After a Sharp Dip, Eyes the $0.12 Zone
BUILDon (B) is trading at $0.11998, up 7.15% over the last 24 hours. After a steep sell-off earlier in the session, the price has recovered steadily and is now consolidating just below $0.12.
The numbers at a glance:
24h High: $0.12529
24h Low: $0.11003
Market Cap: $119.99M
Fully Diluted Valuation: $119.99M
24h Volume: $2.02M
On-chain Liquidity: $3.79M
On-chain Holders: 104,614
24h Transactions: 10,839
What the 4-hour chart shows:
B peaked near $0.13645 before a large red candle dragged it down to a low of $0.11003. Buyers responded quickly, and the price has since climbed back to the $0.12 area. It now sits just above the MA(7) at 0.11854, which has started to curve upward, but remains below the MA(25) at 0.12464 and the MA(99) at 0.12895. Both of those longer averages are still sloping down, so the broader structure needs more confirmation before it can be called a reversal.
Volume surged during the drop and has faded since, with the latest candles showing small, indecisive bodies. That points to a market taking a pause after the bounce rather than making a decisive move.
Things worth keeping in mind:
The market cap and FDV are identical at $119.99M, which means the full token supply is already in circulation. That removes the risk of future unlock pressure, which is a real positive. Liquidity of around $3.79M is healthy relative to daily volume, and a holder base above 104,000 shows broad participation.
The first level to watch is the MA(25) near $0.1246, which lines up with the recent rejection wick. A clean move above it would be encouraging, while a slip below the MA(7) could bring the $0.11 low back into focus. As always, do your own research and manage your risk.
$B
BUILDon (B) is trading at $0.11998, up 7.15% over the last 24 hours. After a steep sell-off earlier in the session, the price has recovered steadily and is now consolidating just below $0.12.
The numbers at a glance:
24h High: $0.12529
24h Low: $0.11003
Market Cap: $119.99M
Fully Diluted Valuation: $119.99M
24h Volume: $2.02M
On-chain Liquidity: $3.79M
On-chain Holders: 104,614
24h Transactions: 10,839
What the 4-hour chart shows:
B peaked near $0.13645 before a large red candle dragged it down to a low of $0.11003. Buyers responded quickly, and the price has since climbed back to the $0.12 area. It now sits just above the MA(7) at 0.11854, which has started to curve upward, but remains below the MA(25) at 0.12464 and the MA(99) at 0.12895. Both of those longer averages are still sloping down, so the broader structure needs more confirmation before it can be called a reversal.
Volume surged during the drop and has faded since, with the latest candles showing small, indecisive bodies. That points to a market taking a pause after the bounce rather than making a decisive move.
Things worth keeping in mind:
The market cap and FDV are identical at $119.99M, which means the full token supply is already in circulation. That removes the risk of future unlock pressure, which is a real positive. Liquidity of around $3.79M is healthy relative to daily volume, and a holder base above 104,000 shows broad participation.
The first level to watch is the MA(25) near $0.1246, which lines up with the recent rejection wick. A clean move above it would be encouraging, while a slip below the MA(7) could bring the $0.11 low back into focus. As always, do your own research and manage your risk.
$B
Lihat terjemahan
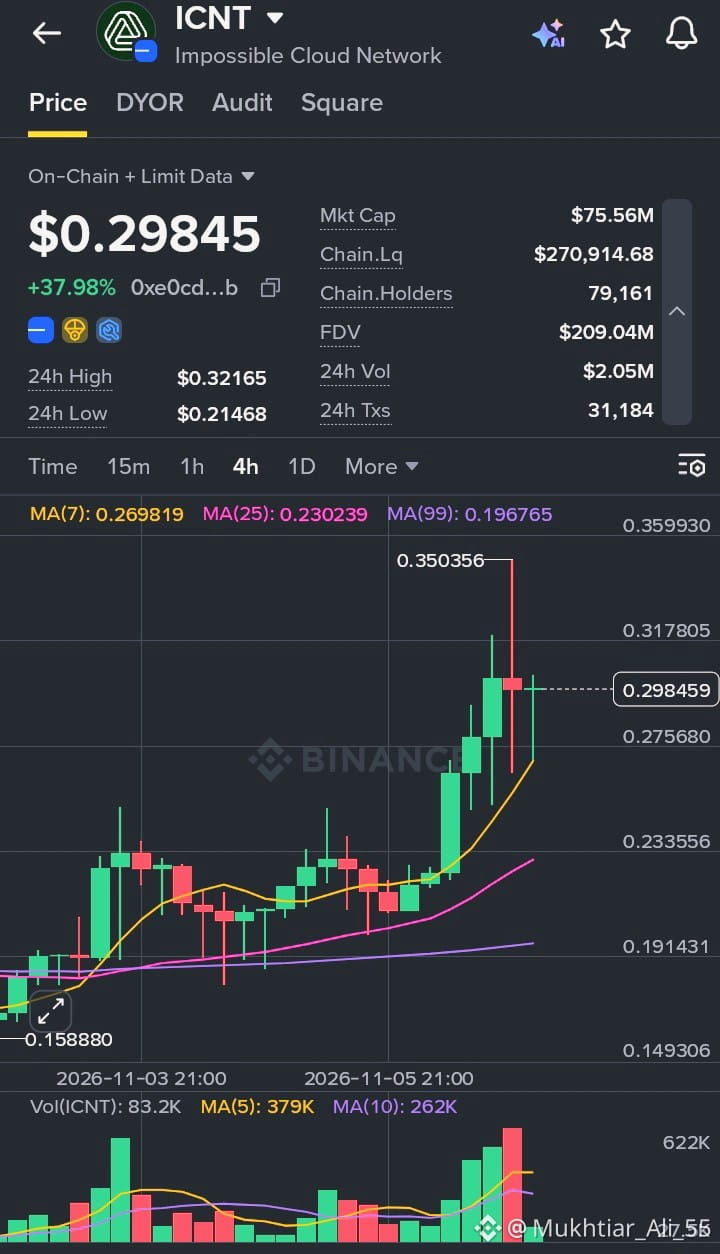
Impossible Cloud Network (ICNT) Rockets Nearly 38% as Momentum Builds
Impossible Cloud Network (ICNT) is trading at $0.29845, up 37.98% over the last 24 hours. After a steady climb, the price has made a powerful breakout and is now holding well above all of its major moving averages.
The numbers at a glance:
24h High: $0.32165
24h Low: $0.21468
Market Cap: $75.56M
Fully Diluted Valuation: $209.04M
24h Volume: $2.05M
On-chain Liquidity: $270,914.68
On-chain Holders: 79,161
24h Transactions: 31,184
What the 4-hour chart shows:
ICNT built a base around the $0.21 to $0.23 zone before a run of strong green candles lifted it to a peak of $0.350356. That spike was followed by a long upper wick and a sharp pullback, but buyers stepped back in quickly and pushed the price back toward $0.30. The MA(7) at 0.269819 is rising steeply and acting as support, while the MA(25) at 0.230239 and the MA(99) at 0.196765 both continue to slope upward, which confirms a clear short and medium-term uptrend.
Volume expanded significantly during the rally, so the move had real participation behind it. The large red candle at the top shows heavy selling near the highs, which is worth watching, but the quick recovery afterward is an encouraging sign.
Things worth keeping in mind:
After a gain of this size, the price is stretched well above its moving averages, so a cooldown or pullback would not be unusual. On-chain liquidity of roughly $271,000 is thin compared to the $75.56M market cap, which means price can move sharply on relatively small trades. The gap between market cap and FDV also suggests future token supply is worth tracking.
The first level to watch on the upside is the $0.32 area, with the $0.35 wick high as the bigger test. On the downside, the MA(7) near $0.27 is the key zone for buyers to defend. As always, do your own research and manage your risk.
$ICNT
{future}(ICNTUSDT)
Impossible Cloud Network (ICNT) Rockets Nearly 38% as Momentum Builds
Impossible Cloud Network (ICNT) is trading at $0.29845, up 37.98% over the last 24 hours. After a steady climb, the price has made a powerful breakout and is now holding well above all of its major moving averages.
The numbers at a glance:
24h High: $0.32165
24h Low: $0.21468
Market Cap: $75.56M
Fully Diluted Valuation: $209.04M
24h Volume: $2.05M
On-chain Liquidity: $270,914.68
On-chain Holders: 79,161
24h Transactions: 31,184
What the 4-hour chart shows:
ICNT built a base around the $0.21 to $0.23 zone before a run of strong green candles lifted it to a peak of $0.350356. That spike was followed by a long upper wick and a sharp pullback, but buyers stepped back in quickly and pushed the price back toward $0.30. The MA(7) at 0.269819 is rising steeply and acting as support, while the MA(25) at 0.230239 and the MA(99) at 0.196765 both continue to slope upward, which confirms a clear short and medium-term uptrend.
Volume expanded significantly during the rally, so the move had real participation behind it. The large red candle at the top shows heavy selling near the highs, which is worth watching, but the quick recovery afterward is an encouraging sign.
Things worth keeping in mind:
After a gain of this size, the price is stretched well above its moving averages, so a cooldown or pullback would not be unusual. On-chain liquidity of roughly $271,000 is thin compared to the $75.56M market cap, which means price can move sharply on relatively small trades. The gap between market cap and FDV also suggests future token supply is worth tracking.
The first level to watch on the upside is the $0.32 area, with the $0.35 wick high as the bigger test. On the downside, the MA(7) near $0.27 is the key zone for buyers to defend. As always, do your own research and manage your risk.
$ICNT
Impossible Cloud Network (ICNT) is trading at $0.29845, up 37.98% over the last 24 hours. After a steady climb, the price has made a powerful breakout and is now holding well above all of its major moving averages.
The numbers at a glance:
24h High: $0.32165
24h Low: $0.21468
Market Cap: $75.56M
Fully Diluted Valuation: $209.04M
24h Volume: $2.05M
On-chain Liquidity: $270,914.68
On-chain Holders: 79,161
24h Transactions: 31,184
What the 4-hour chart shows:
ICNT built a base around the $0.21 to $0.23 zone before a run of strong green candles lifted it to a peak of $0.350356. That spike was followed by a long upper wick and a sharp pullback, but buyers stepped back in quickly and pushed the price back toward $0.30. The MA(7) at 0.269819 is rising steeply and acting as support, while the MA(25) at 0.230239 and the MA(99) at 0.196765 both continue to slope upward, which confirms a clear short and medium-term uptrend.
Volume expanded significantly during the rally, so the move had real participation behind it. The large red candle at the top shows heavy selling near the highs, which is worth watching, but the quick recovery afterward is an encouraging sign.
Things worth keeping in mind:
After a gain of this size, the price is stretched well above its moving averages, so a cooldown or pullback would not be unusual. On-chain liquidity of roughly $271,000 is thin compared to the $75.56M market cap, which means price can move sharply on relatively small trades. The gap between market cap and FDV also suggests future token supply is worth tracking.
The first level to watch on the upside is the $0.32 area, with the $0.35 wick high as the bigger test. On the downside, the MA(7) near $0.27 is the key zone for buyers to defend. As always, do your own research and manage your risk.
$ICNT
2
Lihat terjemahan
Based (BASED) Rebounds Nearly 8% After a Sharp Drop, but Key Resistance Remains
Based (BASED) is trading at $0.045845, up 7.98% over the last 24 hours. After a steep sell-off earlier in the session, the price has recovered a good portion of the loss, though it is still working below some important moving averages.
The numbers at a glance:
24h High: $0.047513
24h Low: $0.041494
Market Cap: $10.77M
Fully Diluted Valuation: $45.85M
24h Volume: $2.54M
On-chain Liquidity: $888,460.21
On-chain Holders: 36,007
24h Transactions: 15,892
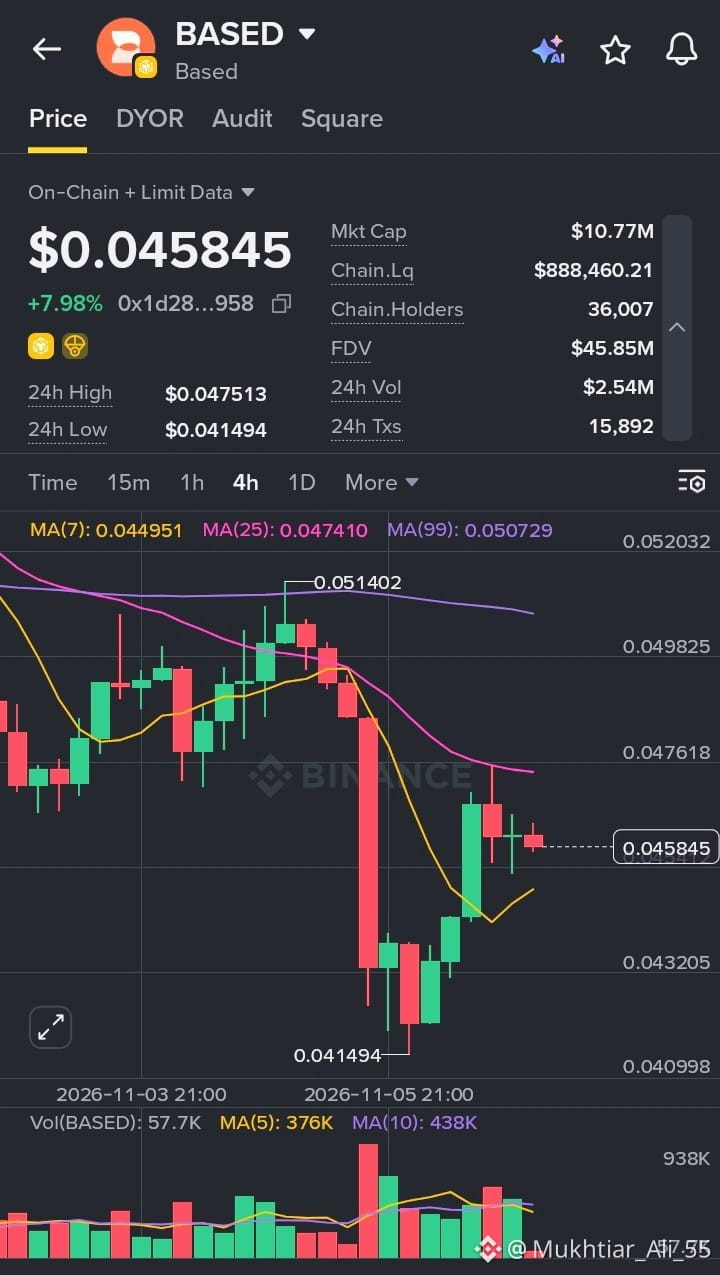
What the 4-hour chart shows:
BASED topped out near $0.0514 before a large red candle pushed it down to a low of $0.041494. Buyers stepped in quickly, and the price has since climbed back into the $0.045 to $0.047 range. It now sits above the MA(7) at 0.044951, which is curving upward, but remains under the MA(25) at 0.047410 and the MA(99) at 0.050729. Both of those are still sloping down, so the broader structure has not turned bullish yet.
Volume spiked during the sell-off and has since cooled, with the latest candles showing smaller, indecisive moves. That suggests the market is pausing after the bounce and deciding its next direction.
Things worth keeping in mind:
On-chain liquidity of about $888,000 is reasonable for this market cap, but it is still modest, so larger orders can move the price. The gap between the $10.77M market cap and the $45.85M FDV is also worth watching, since future supply could add selling pressure over time.
The zone around $0.0474 is the first hurdle, where the MA(25) and the recent rejection wick meet. A close above it would be an encouraging sign, while a slip below the MA(7) could put the recent low back in play. As always, do your own research and manage your risk.
$BASED
{future}(BASEDUSDT)
Based (BASED) Rebounds Nearly 8% After a Sharp Drop, but Key Resistance Remains
Based (BASED) is trading at $0.045845, up 7.98% over the last 24 hours. After a steep sell-off earlier in the session, the price has recovered a good portion of the loss, though it is still working below some important moving averages.
The numbers at a glance:
24h High: $0.047513
24h Low: $0.041494
Market Cap: $10.77M
Fully Diluted Valuation: $45.85M
24h Volume: $2.54M
On-chain Liquidity: $888,460.21
On-chain Holders: 36,007
24h Transactions: 15,892
What the 4-hour chart shows:
BASED topped out near $0.0514 before a large red candle pushed it down to a low of $0.041494. Buyers stepped in quickly, and the price has since climbed back into the $0.045 to $0.047 range. It now sits above the MA(7) at 0.044951, which is curving upward, but remains under the MA(25) at 0.047410 and the MA(99) at 0.050729. Both of those are still sloping down, so the broader structure has not turned bullish yet.
Volume spiked during the sell-off and has since cooled, with the latest candles showing smaller, indecisive moves. That suggests the market is pausing after the bounce and deciding its next direction.
Things worth keeping in mind:
On-chain liquidity of about $888,000 is reasonable for this market cap, but it is still modest, so larger orders can move the price. The gap between the $10.77M market cap and the $45.85M FDV is also worth watching, since future supply could add selling pressure over time.
The zone around $0.0474 is the first hurdle, where the MA(25) and the recent rejection wick meet. A close above it would be an encouraging sign, while a slip below the MA(7) could put the recent low back in play. As always, do your own research and manage your risk.
$BASED
Based (BASED) is trading at $0.045845, up 7.98% over the last 24 hours. After a steep sell-off earlier in the session, the price has recovered a good portion of the loss, though it is still working below some important moving averages.
The numbers at a glance:
24h High: $0.047513
24h Low: $0.041494
Market Cap: $10.77M
Fully Diluted Valuation: $45.85M
24h Volume: $2.54M
On-chain Liquidity: $888,460.21
On-chain Holders: 36,007
24h Transactions: 15,892
What the 4-hour chart shows:
BASED topped out near $0.0514 before a large red candle pushed it down to a low of $0.041494. Buyers stepped in quickly, and the price has since climbed back into the $0.045 to $0.047 range. It now sits above the MA(7) at 0.044951, which is curving upward, but remains under the MA(25) at 0.047410 and the MA(99) at 0.050729. Both of those are still sloping down, so the broader structure has not turned bullish yet.
Volume spiked during the sell-off and has since cooled, with the latest candles showing smaller, indecisive moves. That suggests the market is pausing after the bounce and deciding its next direction.
Things worth keeping in mind:
On-chain liquidity of about $888,000 is reasonable for this market cap, but it is still modest, so larger orders can move the price. The gap between the $10.77M market cap and the $45.85M FDV is also worth watching, since future supply could add selling pressure over time.
The zone around $0.0474 is the first hurdle, where the MA(25) and the recent rejection wick meet. A close above it would be an encouraging sign, while a slip below the MA(7) could put the recent low back in play. As always, do your own research and manage your risk.
$BASED
4
Lihat terjemahan
Everlyn AI (LYN) Climbs Over 10% and Holds Above Key Moving Averages
Everlyn AI (LYN) is trading at $0.023482, up 10.17% over the last 24 hours. After a sharp rally and a rejection near the top, the price is consolidating while staying above its short-term trend lines.
The numbers at a glance:
24h High: $0.027559
24h Low: $0.018416
Market Cap: $6.00M
Fully Diluted Valuation: $23.48M
24h Volume: $3.32M
On-chain Liquidity: $112,560.95
On-chain Holders: 24,772
24h Transactions: 47,527
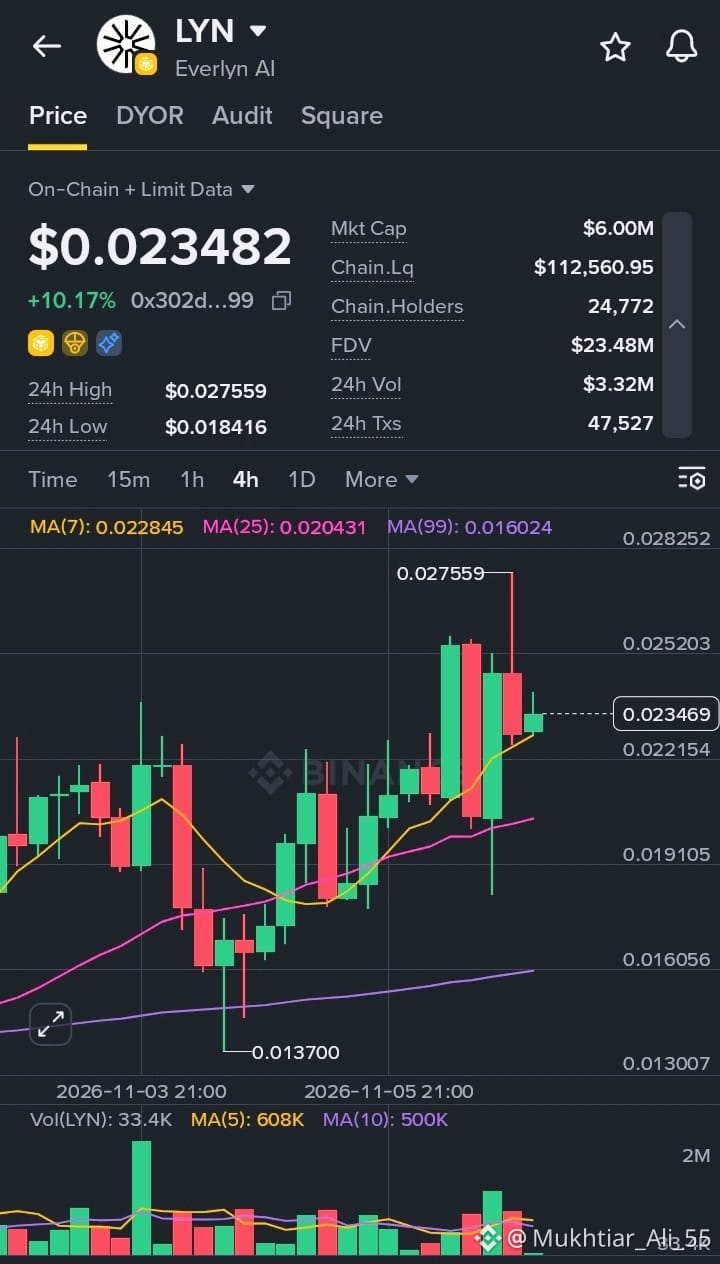
What the 4-hour chart shows:
LYN has recovered strongly from its recent low of $0.0137 and pushed up to $0.027559 before sellers stepped in, leaving a long upper wick on that candle. Since then, price has pulled back and is now sitting right on the MA(7) at 0.022845, with the MA(25) at 0.020431 rising beneath it. The MA(99) at 0.016024 continues to slope upward, which supports a broader recovery structure.
Volume picked up noticeably during the rally, showing that the move had real participation. The latest candles are quieter, which suggests the market is catching its breath rather than reversing.
Things worth keeping in mind:
Liquidity is the main concern here. At roughly $112,000 on-chain, the pool is very thin relative to the $3.32M in daily volume, so slippage can be significant and price can swing quickly in either direction. The gap between the $6.00M market cap and the $23.48M FDV also means future token supply deserves attention.
The $0.0275 high is the level to watch on the upside, while the MA(7) and MA(25) zone is the area where buyers will need to defend to keep the structure intact. As always, do your own research and manage your risk.
$LYN
{future}(LYNUSDT)
Everlyn AI (LYN) Climbs Over 10% and Holds Above Key Moving Averages
Everlyn AI (LYN) is trading at $0.023482, up 10.17% over the last 24 hours. After a sharp rally and a rejection near the top, the price is consolidating while staying above its short-term trend lines.
The numbers at a glance:
24h High: $0.027559
24h Low: $0.018416
Market Cap: $6.00M
Fully Diluted Valuation: $23.48M
24h Volume: $3.32M
On-chain Liquidity: $112,560.95
On-chain Holders: 24,772
24h Transactions: 47,527
What the 4-hour chart shows:
LYN has recovered strongly from its recent low of $0.0137 and pushed up to $0.027559 before sellers stepped in, leaving a long upper wick on that candle. Since then, price has pulled back and is now sitting right on the MA(7) at 0.022845, with the MA(25) at 0.020431 rising beneath it. The MA(99) at 0.016024 continues to slope upward, which supports a broader recovery structure.
Volume picked up noticeably during the rally, showing that the move had real participation. The latest candles are quieter, which suggests the market is catching its breath rather than reversing.
Things worth keeping in mind:
Liquidity is the main concern here. At roughly $112,000 on-chain, the pool is very thin relative to the $3.32M in daily volume, so slippage can be significant and price can swing quickly in either direction. The gap between the $6.00M market cap and the $23.48M FDV also means future token supply deserves attention.
The $0.0275 high is the level to watch on the upside, while the MA(7) and MA(25) zone is the area where buyers will need to defend to keep the structure intact. As always, do your own research and manage your risk.
$LYN
Everlyn AI (LYN) is trading at $0.023482, up 10.17% over the last 24 hours. After a sharp rally and a rejection near the top, the price is consolidating while staying above its short-term trend lines.
The numbers at a glance:
24h High: $0.027559
24h Low: $0.018416
Market Cap: $6.00M
Fully Diluted Valuation: $23.48M
24h Volume: $3.32M
On-chain Liquidity: $112,560.95
On-chain Holders: 24,772
24h Transactions: 47,527
What the 4-hour chart shows:
LYN has recovered strongly from its recent low of $0.0137 and pushed up to $0.027559 before sellers stepped in, leaving a long upper wick on that candle. Since then, price has pulled back and is now sitting right on the MA(7) at 0.022845, with the MA(25) at 0.020431 rising beneath it. The MA(99) at 0.016024 continues to slope upward, which supports a broader recovery structure.
Volume picked up noticeably during the rally, showing that the move had real participation. The latest candles are quieter, which suggests the market is catching its breath rather than reversing.
Things worth keeping in mind:
Liquidity is the main concern here. At roughly $112,000 on-chain, the pool is very thin relative to the $3.32M in daily volume, so slippage can be significant and price can swing quickly in either direction. The gap between the $6.00M market cap and the $23.48M FDV also means future token supply deserves attention.
The $0.0275 high is the level to watch on the upside, while the MA(7) and MA(25) zone is the area where buyers will need to defend to keep the structure intact. As always, do your own research and manage your risk.
$LYN
6
Lihat terjemahan
MEET48 Token (IDOL) Surges Over 14% as Buyers Take Control
MEET48 Token (IDOL) is trading at $0.024706, up 14.44% over the last 24 hours. After a period of sideways movement, the price has pushed decisively higher and is now holding well above its key moving averages.
The numbers at a glance:
24h High: $0.028013
24h Low: $0.018857
Market Cap: $46.64M
Fully Diluted Valuation: $118.56M
24h Volume: $16.09M
On-chain Liquidity: $1.33M
On-chain Holders: 315,201
24h Transactions: 85,247
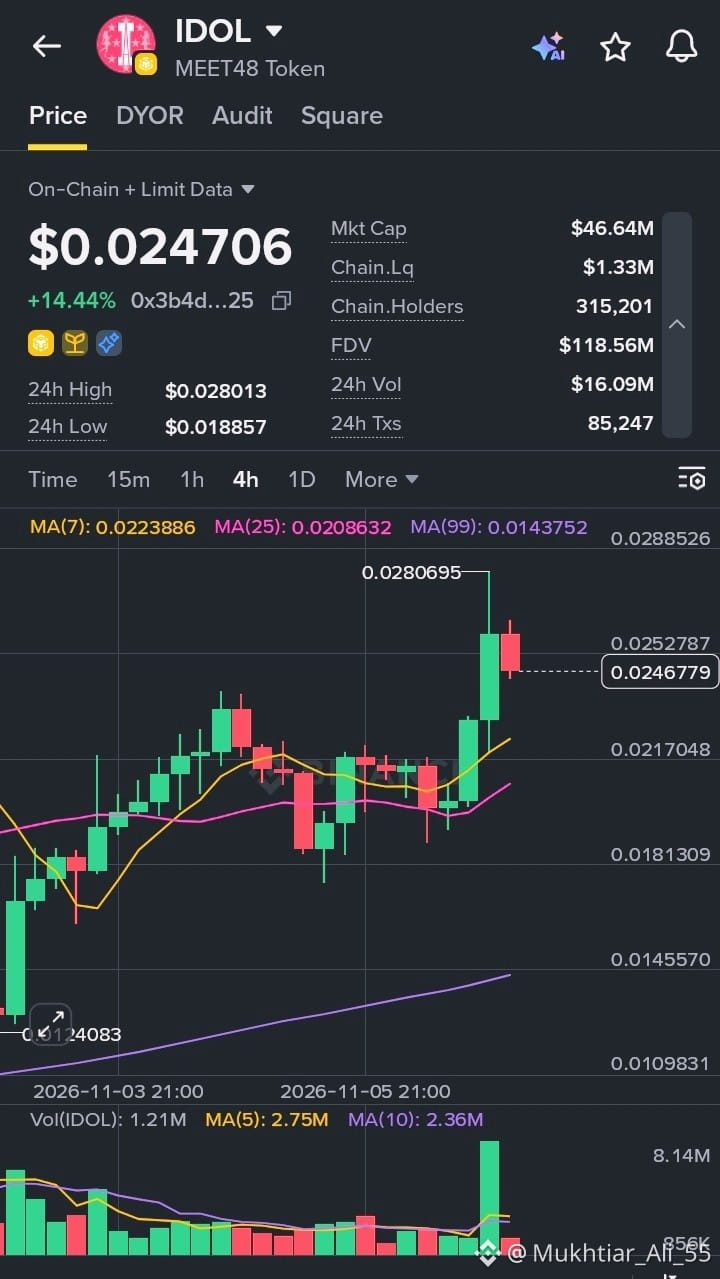
What the 4-hour chart shows:
IDOL climbed from the $0.0124 area to a recent peak near $0.02807 before pulling back slightly. The price now sits above the MA(7) at 0.0223886 and the MA(25) at 0.0208632, both of which are turning upward. The MA(99) at 0.0143752 is rising steadily far below, which supports the case for a broader uptrend.
The breakout candle came with a clear spike in volume, which is a healthy sign that the move had real participation behind it. The small red candle after the peak looks like normal profit-taking rather than a reversal, though that is something to monitor.
Things worth keeping in mind:
A holder base of more than 315,000 is impressive for a token of this size and points to a strong community. That said, on-chain liquidity of around $1.33M is relatively thin, so sharp swings in either direction are possible. The gap between market cap and FDV also suggests future supply is worth keeping an eye on.
The first area to watch is the $0.028 high. A move above it would signal continued strength, while a pullback toward the MA(7) could offer a test of whether buyers are still in control. As always, do your own research and manage your risk.
$IDOL
{future}(IDOLUSDT)
MEET48 Token (IDOL) Surges Over 14% as Buyers Take Control
MEET48 Token (IDOL) is trading at $0.024706, up 14.44% over the last 24 hours. After a period of sideways movement, the price has pushed decisively higher and is now holding well above its key moving averages.
The numbers at a glance:
24h High: $0.028013
24h Low: $0.018857
Market Cap: $46.64M
Fully Diluted Valuation: $118.56M
24h Volume: $16.09M
On-chain Liquidity: $1.33M
On-chain Holders: 315,201
24h Transactions: 85,247
What the 4-hour chart shows:
IDOL climbed from the $0.0124 area to a recent peak near $0.02807 before pulling back slightly. The price now sits above the MA(7) at 0.0223886 and the MA(25) at 0.0208632, both of which are turning upward. The MA(99) at 0.0143752 is rising steadily far below, which supports the case for a broader uptrend.
The breakout candle came with a clear spike in volume, which is a healthy sign that the move had real participation behind it. The small red candle after the peak looks like normal profit-taking rather than a reversal, though that is something to monitor.
Things worth keeping in mind:
A holder base of more than 315,000 is impressive for a token of this size and points to a strong community. That said, on-chain liquidity of around $1.33M is relatively thin, so sharp swings in either direction are possible. The gap between market cap and FDV also suggests future supply is worth keeping an eye on.
The first area to watch is the $0.028 high. A move above it would signal continued strength, while a pullback toward the MA(7) could offer a test of whether buyers are still in control. As always, do your own research and manage your risk.
$IDOL
MEET48 Token (IDOL) is trading at $0.024706, up 14.44% over the last 24 hours. After a period of sideways movement, the price has pushed decisively higher and is now holding well above its key moving averages.
The numbers at a glance:
24h High: $0.028013
24h Low: $0.018857
Market Cap: $46.64M
Fully Diluted Valuation: $118.56M
24h Volume: $16.09M
On-chain Liquidity: $1.33M
On-chain Holders: 315,201
24h Transactions: 85,247
What the 4-hour chart shows:
IDOL climbed from the $0.0124 area to a recent peak near $0.02807 before pulling back slightly. The price now sits above the MA(7) at 0.0223886 and the MA(25) at 0.0208632, both of which are turning upward. The MA(99) at 0.0143752 is rising steadily far below, which supports the case for a broader uptrend.
The breakout candle came with a clear spike in volume, which is a healthy sign that the move had real participation behind it. The small red candle after the peak looks like normal profit-taking rather than a reversal, though that is something to monitor.
Things worth keeping in mind:
A holder base of more than 315,000 is impressive for a token of this size and points to a strong community. That said, on-chain liquidity of around $1.33M is relatively thin, so sharp swings in either direction are possible. The gap between market cap and FDV also suggests future supply is worth keeping an eye on.
The first area to watch is the $0.028 high. A move above it would signal continued strength, while a pullback toward the MA(7) could offer a test of whether buyers are still in control. As always, do your own research and manage your risk.
$IDOL
9
Lihat terjemahan
Concrete (CT) Holds Ground Near $0.12 After a Volatile Week
Concrete (CT) is trading at $0.12456, up 3.07% in the last 24 hours. After a steady slide over the past several days, the price is trying to find a floor.
The numbers at a glance:
24h High: $0.13057
24h Low: $0.11395
Market Cap: $23.71M
Fully Diluted Valuation: $124.78M
24h Volume: $978.56M
On-chain Liquidity: $1.06M
On-chain Holders: 20,231
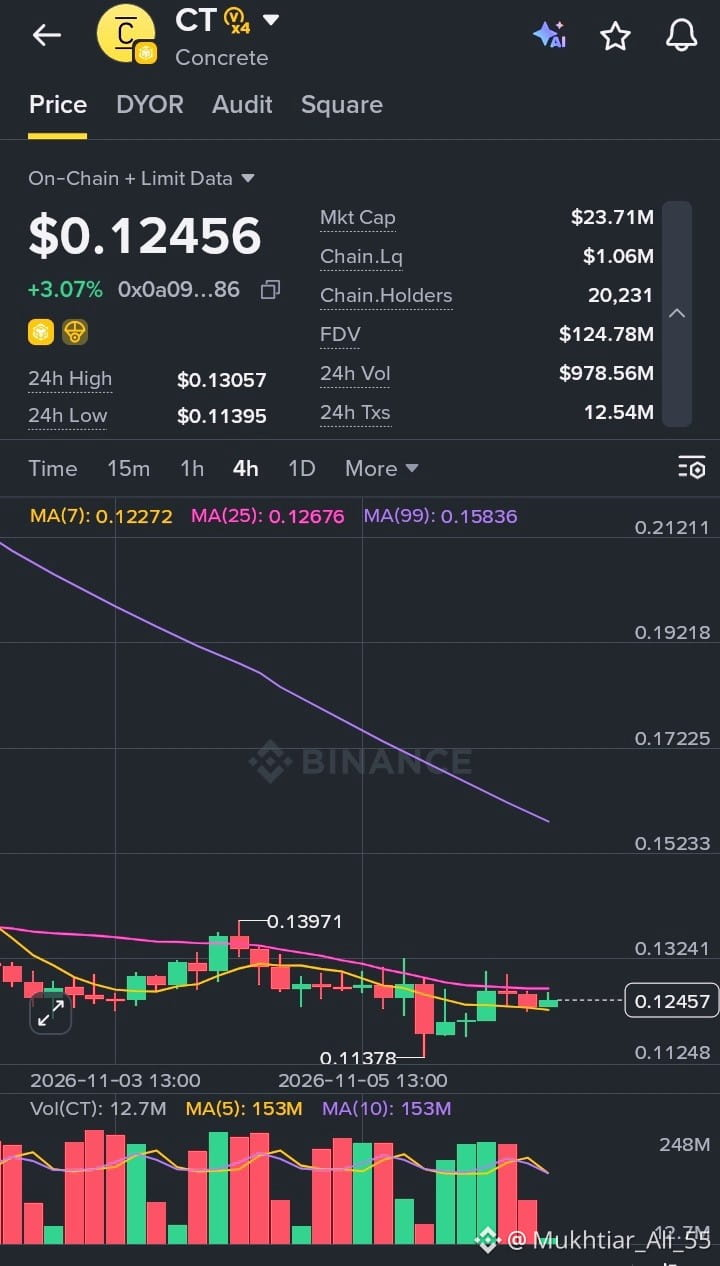
What the 4-hour chart shows:
CT dropped to a recent low of $0.11378 and has bounced back since, forming a series of higher candles. The price is now hovering around the MA(7) at 0.12272 and the MA(25) at 0.12676, which makes that zone the one to watch. The MA(99) sits well above at 0.15836 and is still sloping down, so the longer-term trend remains bearish until price can reclaim it.
Volume tells a mixed story. The recent selling pressure has eased, with the last few sessions showing calmer, greener candles, but buyers haven’t yet shown the strength needed to confirm a full reversal.
Things worth keeping in mind:
The gap between market cap ($23.71M) and FDV ($124.78M) is significant, so token unlocks and future supply are worth factoring in. On-chain liquidity is also fairly thin at about $1.06M, which means price can move sharply on relatively small trades.
For now, CT looks like it’s consolidating after a pullback. A clean break above the MA(25) could signal momentum returning, while a drop below the recent low would put the bounce in question. As always, do your own research and manage your risk.
$CT
{future}(CTUSDT)
Concrete (CT) Holds Ground Near $0.12 After a Volatile Week
Concrete (CT) is trading at $0.12456, up 3.07% in the last 24 hours. After a steady slide over the past several days, the price is trying to find a floor.
The numbers at a glance:
24h High: $0.13057
24h Low: $0.11395
Market Cap: $23.71M
Fully Diluted Valuation: $124.78M
24h Volume: $978.56M
On-chain Liquidity: $1.06M
On-chain Holders: 20,231
What the 4-hour chart shows:
CT dropped to a recent low of $0.11378 and has bounced back since, forming a series of higher candles. The price is now hovering around the MA(7) at 0.12272 and the MA(25) at 0.12676, which makes that zone the one to watch. The MA(99) sits well above at 0.15836 and is still sloping down, so the longer-term trend remains bearish until price can reclaim it.
Volume tells a mixed story. The recent selling pressure has eased, with the last few sessions showing calmer, greener candles, but buyers haven’t yet shown the strength needed to confirm a full reversal.
Things worth keeping in mind:
The gap between market cap ($23.71M) and FDV ($124.78M) is significant, so token unlocks and future supply are worth factoring in. On-chain liquidity is also fairly thin at about $1.06M, which means price can move sharply on relatively small trades.
For now, CT looks like it’s consolidating after a pullback. A clean break above the MA(25) could signal momentum returning, while a drop below the recent low would put the bounce in question. As always, do your own research and manage your risk.
$CT
Concrete (CT) is trading at $0.12456, up 3.07% in the last 24 hours. After a steady slide over the past several days, the price is trying to find a floor.
The numbers at a glance:
24h High: $0.13057
24h Low: $0.11395
Market Cap: $23.71M
Fully Diluted Valuation: $124.78M
24h Volume: $978.56M
On-chain Liquidity: $1.06M
On-chain Holders: 20,231
What the 4-hour chart shows:
CT dropped to a recent low of $0.11378 and has bounced back since, forming a series of higher candles. The price is now hovering around the MA(7) at 0.12272 and the MA(25) at 0.12676, which makes that zone the one to watch. The MA(99) sits well above at 0.15836 and is still sloping down, so the longer-term trend remains bearish until price can reclaim it.
Volume tells a mixed story. The recent selling pressure has eased, with the last few sessions showing calmer, greener candles, but buyers haven’t yet shown the strength needed to confirm a full reversal.
Things worth keeping in mind:
The gap between market cap ($23.71M) and FDV ($124.78M) is significant, so token unlocks and future supply are worth factoring in. On-chain liquidity is also fairly thin at about $1.06M, which means price can move sharply on relatively small trades.
For now, CT looks like it’s consolidating after a pullback. A clean break above the MA(25) could signal momentum returning, while a drop below the recent low would put the bounce in question. As always, do your own research and manage your risk.
$CT
6
Lihat terjemahan
龙虾 Rockets 15% and Reclaims the MA(99): Can the Breakout Hold?
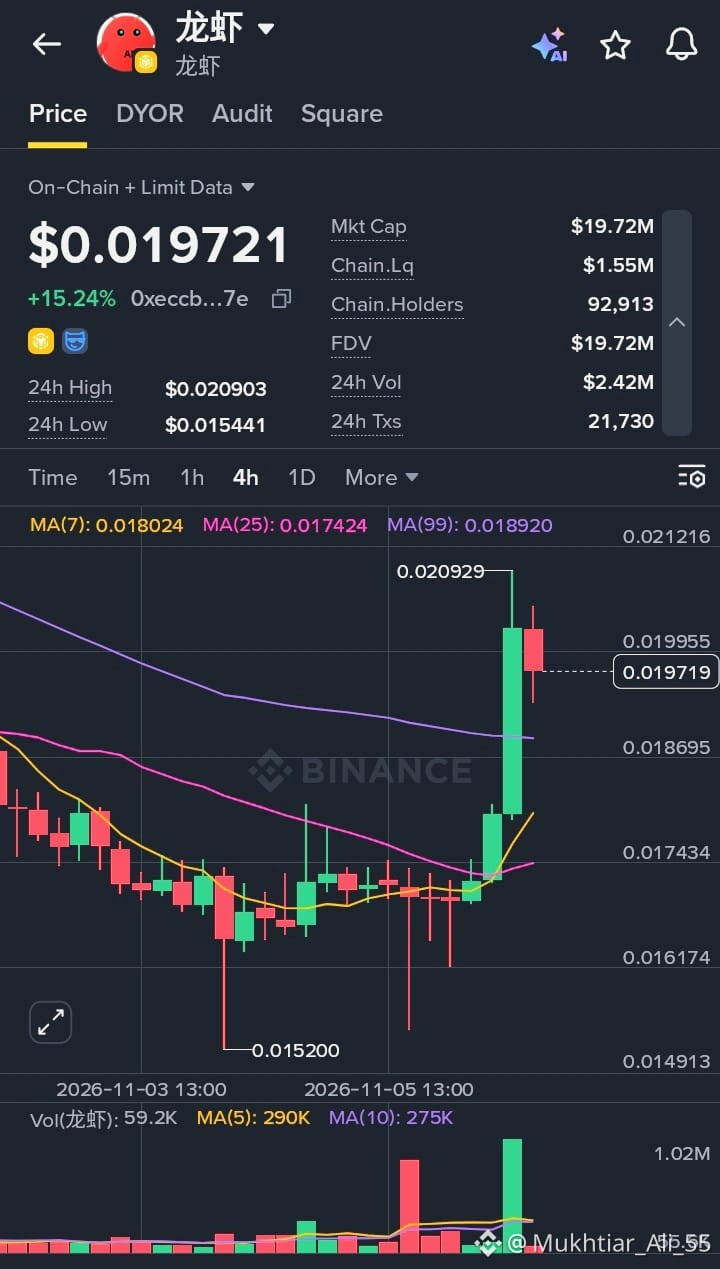
$龙虾 is making a loud move. The token is trading at $0.019721, up 15.24% over the last 24 hours, with a high of $0.020903 and a low of $0.015441.
The 4H chart shows a long, patient base followed by a sudden breakout. Price bottomed near $0.015200, then spent days chopping sideways between roughly $0.016 and $0.018 while the moving averages flattened out. A single large green candle then broke through everything, carrying price up to a peak of $0.020929. The latest candle is red, which looks like a natural cooldown after such a vertical move, with price still holding near $0.0197.
Key numbers at a glance:
Market Cap: $19.72M
FDV: $19.72M
24h Volume: $2.42M
24h Transactions: 21,730
On-chain Holders: 92,913
On-chain Liquidity: $1.55M
Price is now above the MA(7) at 0.018024, the MA(25) at 0.017424 and the MA(99) at 0.018920. Reclaiming the MA(99) is a meaningful step, since it had acted as overhead resistance during the earlier decline. The shorter averages are also turning upward, which supports the case for a trend change. Volume on the breakout candle was the largest on the chart, so the move had real force behind it, but the latest bars are quiet, which means follow-through still needs confirmation.
Market cap and FDV are identical at $19.72M, which suggests the full supply is already in circulation, so there is no big unlock overhang to worry about. A holder base of nearly 93,000 is also impressive for a token this size. Liquidity of $1.55M is modest though, and after a 15% day, a retest of the breakout zone near $0.0189 to $0.0180 would be a normal and even healthy development.
If you’re watching 龙虾, it may be wiser to wait for price to confirm support above the MA(99) or to break cleanly above $0.0209 on strong volume, rather than chasing the spike. Keep your position sizes reasonable and only risk what you can afford to lose. This is not financial advice, just my read of the chart.
#龙虾 #CryptoAnalysis #BinanceSquare
Trade here
$龙虾
{future}(龙虾USDT)
龙虾 Rockets 15% and Reclaims the MA(99): Can the Breakout Hold?
$龙虾 is making a loud move. The token is trading at $0.019721, up 15.24% over the last 24 hours, with a high of $0.020903 and a low of $0.015441.
The 4H chart shows a long, patient base followed by a sudden breakout. Price bottomed near $0.015200, then spent days chopping sideways between roughly $0.016 and $0.018 while the moving averages flattened out. A single large green candle then broke through everything, carrying price up to a peak of $0.020929. The latest candle is red, which looks like a natural cooldown after such a vertical move, with price still holding near $0.0197.
Key numbers at a glance:
Market Cap: $19.72M
FDV: $19.72M
24h Volume: $2.42M
24h Transactions: 21,730
On-chain Holders: 92,913
On-chain Liquidity: $1.55M
Price is now above the MA(7) at 0.018024, the MA(25) at 0.017424 and the MA(99) at 0.018920. Reclaiming the MA(99) is a meaningful step, since it had acted as overhead resistance during the earlier decline. The shorter averages are also turning upward, which supports the case for a trend change. Volume on the breakout candle was the largest on the chart, so the move had real force behind it, but the latest bars are quiet, which means follow-through still needs confirmation.
Market cap and FDV are identical at $19.72M, which suggests the full supply is already in circulation, so there is no big unlock overhang to worry about. A holder base of nearly 93,000 is also impressive for a token this size. Liquidity of $1.55M is modest though, and after a 15% day, a retest of the breakout zone near $0.0189 to $0.0180 would be a normal and even healthy development.
If you’re watching 龙虾, it may be wiser to wait for price to confirm support above the MA(99) or to break cleanly above $0.0209 on strong volume, rather than chasing the spike. Keep your position sizes reasonable and only risk what you can afford to lose. This is not financial advice, just my read of the chart.
#龙虾 #CryptoAnalysis #BinanceSquare
Trade here
$龙虾
$龙虾 is making a loud move. The token is trading at $0.019721, up 15.24% over the last 24 hours, with a high of $0.020903 and a low of $0.015441.
The 4H chart shows a long, patient base followed by a sudden breakout. Price bottomed near $0.015200, then spent days chopping sideways between roughly $0.016 and $0.018 while the moving averages flattened out. A single large green candle then broke through everything, carrying price up to a peak of $0.020929. The latest candle is red, which looks like a natural cooldown after such a vertical move, with price still holding near $0.0197.
Key numbers at a glance:
Market Cap: $19.72M
FDV: $19.72M
24h Volume: $2.42M
24h Transactions: 21,730
On-chain Holders: 92,913
On-chain Liquidity: $1.55M
Price is now above the MA(7) at 0.018024, the MA(25) at 0.017424 and the MA(99) at 0.018920. Reclaiming the MA(99) is a meaningful step, since it had acted as overhead resistance during the earlier decline. The shorter averages are also turning upward, which supports the case for a trend change. Volume on the breakout candle was the largest on the chart, so the move had real force behind it, but the latest bars are quiet, which means follow-through still needs confirmation.
Market cap and FDV are identical at $19.72M, which suggests the full supply is already in circulation, so there is no big unlock overhang to worry about. A holder base of nearly 93,000 is also impressive for a token this size. Liquidity of $1.55M is modest though, and after a 15% day, a retest of the breakout zone near $0.0189 to $0.0180 would be a normal and even healthy development.
If you’re watching 龙虾, it may be wiser to wait for price to confirm support above the MA(99) or to break cleanly above $0.0209 on strong volume, rather than chasing the spike. Keep your position sizes reasonable and only risk what you can afford to lose. This is not financial advice, just my read of the chart.
#龙虾 #CryptoAnalysis #BinanceSquare
Trade here
$龙虾
25
BTW Melonjak 14,5% dan Membentuk Basis: Bisakah Menantang MA(99)?
Bitway (BTW) menunjukkan pemulihan yang solid. Token ini diperdagangkan pada harga $1.18081, naik 14.55% dalam 24 jam terakhir, dengan harga tertinggi $1.21057 dan terendah $0.96734.
Grafik 4 jam menunjukkan harga mencapai titik terendah di dekat $0.87116 sebelum bergerak mendatar dalam rentang panjang di sekitar zona $1.00 hingga $1.05. Rentang tersebut bertahan, dan para pembeli akhirnya mendorong harga menembusnya dengan candle hijau yang kuat hingga mencapai level tertinggi baru-baru ini di $1.21057. Candle terbaru berwarna hijau kecil dan berada tepat di bawah level tertinggi tersebut, yang menunjukkan bahwa kenaikan sejauh ini masih bertahan.
Angka-angka penting sekilas:
Kapitalisasi Pasar: $3.54B
FDV: $11.76B
Volume 24 jam: $2.43M
Transaksi 24 jam: 33,987
Pemegang On-chain: 43,672
Likuiditas On-chain: $3.17M
Harga diperdagangkan di atas MA(7) pada 1.11270 dan MA(25) pada 1.04514, dan keduanya mulai bergerak naik. Ini merupakan perubahan yang menggembirakan setelah periode pelemahan yang panjang. MA(99) di 1.40397 masih menurun dan berada jauh di atas harga, sehingga tren yang lebih luas belum berbalik. Level tersebut menjadi hambatan besar yang perlu diperhatikan jika reli berlanjut.
Volume patut dicermati. Batang volume terbaru rendah dan rata-rata jangka pendek berada di bawah rata-rata jangka panjang, sehingga pantulan ini membutuhkan partisipasi yang lebih kuat untuk mengonfirmasi kenaikan. Ada juga kesenjangan yang cukup mencolok antara kapitalisasi pasar sebesar $3.54B dan FDV sebesar $11.76B, yang berarti sebagian besar pasokan belum beredar. Hal ini dapat menambah tekanan seiring waktu, sehingga perlu diperhatikan. Likuiditas on-chain sebesar $3.17M juga tipis dibandingkan kapitalisasi pasar, sehingga harga dapat bergerak tajam ke arah mana pun.
Jika Anda mengikuti BTW, mungkin lebih bijak untuk menunggu penembusan yang meyakinkan di atas $1.21 dengan volume yang meningkat, atau pengujian ulang yang tenang di area MA(7), daripada mengejar pantulan ini. Kelola risiko Anda dan investasikan hanya dana yang sanggup Anda tanggung jika hilang. Ini bukan nasihat keuangan, hanya pembacaan saya terhadap grafik.
#BTW #Bitway #CryptoAnalysis #BinanceSquare #PriceAction
$BTW
{future}(BTWUSDT)
BTW Melonjak 14,5% dan Membentuk Basis: Bisakah Menantang MA(99)?
Bitway (BTW) menunjukkan pemulihan yang solid. Token ini diperdagangkan pada harga $1.18081, naik 14.55% dalam 24 jam terakhir, dengan harga tertinggi $1.21057 dan terendah $0.96734.
Grafik 4 jam menunjukkan harga mencapai titik terendah di dekat $0.87116 sebelum bergerak mendatar dalam rentang panjang di sekitar zona $1.00 hingga $1.05. Rentang tersebut bertahan, dan para pembeli akhirnya mendorong harga menembusnya dengan candle hijau yang kuat hingga mencapai level tertinggi baru-baru ini di $1.21057. Candle terbaru berwarna hijau kecil dan berada tepat di bawah level tertinggi tersebut, yang menunjukkan bahwa kenaikan sejauh ini masih bertahan.
Angka-angka penting sekilas:
Kapitalisasi Pasar: $3.54B
FDV: $11.76B
Volume 24 jam: $2.43M
Transaksi 24 jam: 33,987
Pemegang On-chain: 43,672
Likuiditas On-chain: $3.17M
Harga diperdagangkan di atas MA(7) pada 1.11270 dan MA(25) pada 1.04514, dan keduanya mulai bergerak naik. Ini merupakan perubahan yang menggembirakan setelah periode pelemahan yang panjang. MA(99) di 1.40397 masih menurun dan berada jauh di atas harga, sehingga tren yang lebih luas belum berbalik. Level tersebut menjadi hambatan besar yang perlu diperhatikan jika reli berlanjut.
Volume patut dicermati. Batang volume terbaru rendah dan rata-rata jangka pendek berada di bawah rata-rata jangka panjang, sehingga pantulan ini membutuhkan partisipasi yang lebih kuat untuk mengonfirmasi kenaikan. Ada juga kesenjangan yang cukup mencolok antara kapitalisasi pasar sebesar $3.54B dan FDV sebesar $11.76B, yang berarti sebagian besar pasokan belum beredar. Hal ini dapat menambah tekanan seiring waktu, sehingga perlu diperhatikan. Likuiditas on-chain sebesar $3.17M juga tipis dibandingkan kapitalisasi pasar, sehingga harga dapat bergerak tajam ke arah mana pun.
Jika Anda mengikuti BTW, mungkin lebih bijak untuk menunggu penembusan yang meyakinkan di atas $1.21 dengan volume yang meningkat, atau pengujian ulang yang tenang di area MA(7), daripada mengejar pantulan ini. Kelola risiko Anda dan investasikan hanya dana yang sanggup Anda tanggung jika hilang. Ini bukan nasihat keuangan, hanya pembacaan saya terhadap grafik.
#BTW #Bitway #CryptoAnalysis #BinanceSquare #PriceAction
$BTW
Bitway (BTW) menunjukkan pemulihan yang solid. Token ini diperdagangkan pada harga $1.18081, naik 14.55% dalam 24 jam terakhir, dengan harga tertinggi $1.21057 dan terendah $0.96734.
Grafik 4 jam menunjukkan harga mencapai titik terendah di dekat $0.87116 sebelum bergerak mendatar dalam rentang panjang di sekitar zona $1.00 hingga $1.05. Rentang tersebut bertahan, dan para pembeli akhirnya mendorong harga menembusnya dengan candle hijau yang kuat hingga mencapai level tertinggi baru-baru ini di $1.21057. Candle terbaru berwarna hijau kecil dan berada tepat di bawah level tertinggi tersebut, yang menunjukkan bahwa kenaikan sejauh ini masih bertahan.
Angka-angka penting sekilas:
Kapitalisasi Pasar: $3.54B
FDV: $11.76B
Volume 24 jam: $2.43M
Transaksi 24 jam: 33,987
Pemegang On-chain: 43,672
Likuiditas On-chain: $3.17M
Harga diperdagangkan di atas MA(7) pada 1.11270 dan MA(25) pada 1.04514, dan keduanya mulai bergerak naik. Ini merupakan perubahan yang menggembirakan setelah periode pelemahan yang panjang. MA(99) di 1.40397 masih menurun dan berada jauh di atas harga, sehingga tren yang lebih luas belum berbalik. Level tersebut menjadi hambatan besar yang perlu diperhatikan jika reli berlanjut.
Volume patut dicermati. Batang volume terbaru rendah dan rata-rata jangka pendek berada di bawah rata-rata jangka panjang, sehingga pantulan ini membutuhkan partisipasi yang lebih kuat untuk mengonfirmasi kenaikan. Ada juga kesenjangan yang cukup mencolok antara kapitalisasi pasar sebesar $3.54B dan FDV sebesar $11.76B, yang berarti sebagian besar pasokan belum beredar. Hal ini dapat menambah tekanan seiring waktu, sehingga perlu diperhatikan. Likuiditas on-chain sebesar $3.17M juga tipis dibandingkan kapitalisasi pasar, sehingga harga dapat bergerak tajam ke arah mana pun.
Jika Anda mengikuti BTW, mungkin lebih bijak untuk menunggu penembusan yang meyakinkan di atas $1.21 dengan volume yang meningkat, atau pengujian ulang yang tenang di area MA(7), daripada mengejar pantulan ini. Kelola risiko Anda dan investasikan hanya dana yang sanggup Anda tanggung jika hilang. Ini bukan nasihat keuangan, hanya pembacaan saya terhadap grafik.
#BTW #Bitway #CryptoAnalysis #BinanceSquare #PriceAction
$BTW
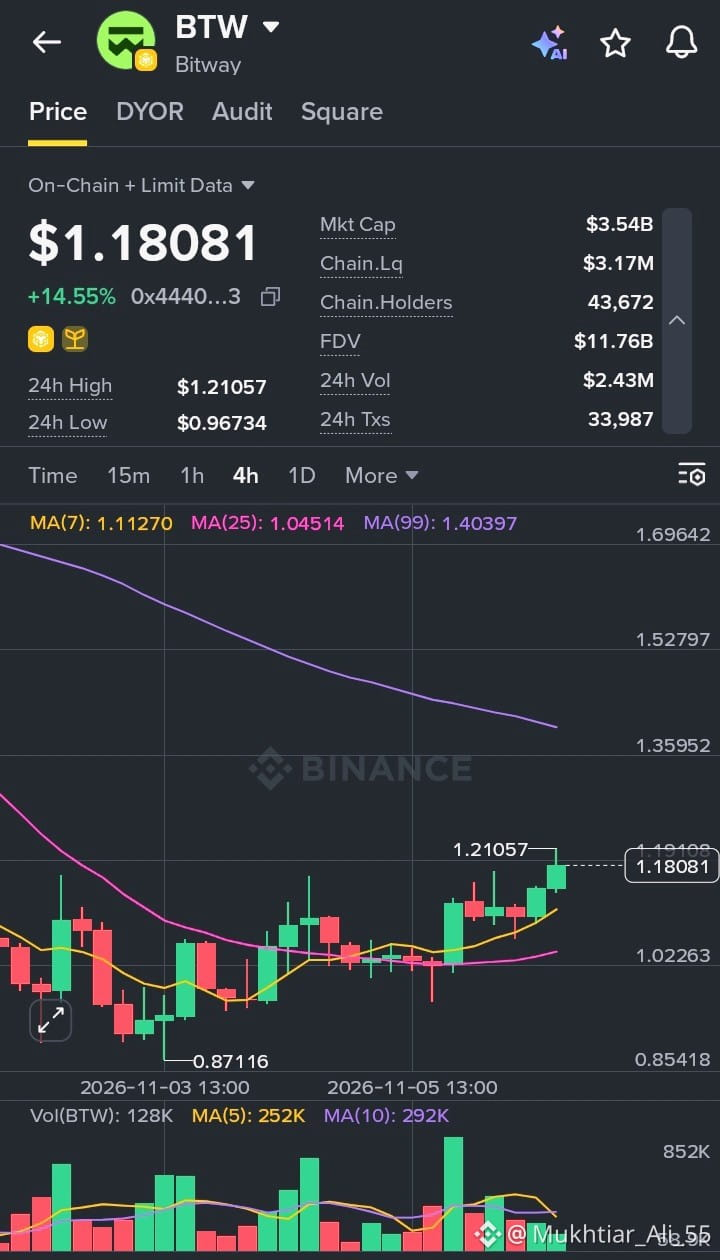
10
Lihat terjemahan
BSB Pushes Up 4% and Tests the MA(99): Is a Breakout Brewing?
Block Street (BSB) is showing a steady recovery. The token is trading at $0.094959, up 4.13% over the last 24 hours, with a high of $0.095504 and a low of $0.083797.
The 4H chart shows a sharp dip followed by a firm bounce. Price fell to around $0.082017, then buyers stepped in with a run of green candles that carried it up to a recent high of $0.095580. The latest candle is sitting right at the MA(99) line near 0.094979, which makes this a key decision zone.
Key numbers at a glance:
Market Cap: $24.38M
FDV: $94.95M
24h Volume: $2.80M
24h Transactions: 14,027
On-chain Holders: 59,001
On-chain Liquidity: $1.36M
Price has moved well above the MA(7) at 0.088891 and the MA(25) at 0.088843, and those two averages are now tightly bunched and turning upward, which is an early constructive sign. The real test is the MA(99): price has pressed into it, and a clean close above on solid volume would strengthen the bullish case. Volume on the last bar is light, though, and the recent average is lower than the heavy bars seen earlier, so the move still needs more participation to be convincing.
A rejection here would not be surprising, given the wick near $0.0955. In that case, the $0.0888 area where the shorter moving averages sit would be the first support to watch. With liquidity of about $1.36M against a $24.38M market cap, price can swing quickly in either direction, though a holder base of over 59,000 shows healthy community interest.
If you’re watching BSB, it may be smarter to wait for a confirmed break above the MA(99) with rising volume, or a calm pullback to support, rather than buying into resistance. Size your positions sensibly and only risk what you can afford to lose. This is not financial advice, just my read of the chart.
#BSB #BlockStreet #CryptoAnalysis #BinanceSquare #PriceAction
$BSB
{future}(BSBUSDT)
BSB Pushes Up 4% and Tests the MA(99): Is a Breakout Brewing?
Block Street (BSB) is showing a steady recovery. The token is trading at $0.094959, up 4.13% over the last 24 hours, with a high of $0.095504 and a low of $0.083797.
The 4H chart shows a sharp dip followed by a firm bounce. Price fell to around $0.082017, then buyers stepped in with a run of green candles that carried it up to a recent high of $0.095580. The latest candle is sitting right at the MA(99) line near 0.094979, which makes this a key decision zone.
Key numbers at a glance:
Market Cap: $24.38M
FDV: $94.95M
24h Volume: $2.80M
24h Transactions: 14,027
On-chain Holders: 59,001
On-chain Liquidity: $1.36M
Price has moved well above the MA(7) at 0.088891 and the MA(25) at 0.088843, and those two averages are now tightly bunched and turning upward, which is an early constructive sign. The real test is the MA(99): price has pressed into it, and a clean close above on solid volume would strengthen the bullish case. Volume on the last bar is light, though, and the recent average is lower than the heavy bars seen earlier, so the move still needs more participation to be convincing.
A rejection here would not be surprising, given the wick near $0.0955. In that case, the $0.0888 area where the shorter moving averages sit would be the first support to watch. With liquidity of about $1.36M against a $24.38M market cap, price can swing quickly in either direction, though a holder base of over 59,000 shows healthy community interest.
If you’re watching BSB, it may be smarter to wait for a confirmed break above the MA(99) with rising volume, or a calm pullback to support, rather than buying into resistance. Size your positions sensibly and only risk what you can afford to lose. This is not financial advice, just my read of the chart.
#BSB #BlockStreet #CryptoAnalysis #BinanceSquare #PriceAction
$BSB
Block Street (BSB) is showing a steady recovery. The token is trading at $0.094959, up 4.13% over the last 24 hours, with a high of $0.095504 and a low of $0.083797.
The 4H chart shows a sharp dip followed by a firm bounce. Price fell to around $0.082017, then buyers stepped in with a run of green candles that carried it up to a recent high of $0.095580. The latest candle is sitting right at the MA(99) line near 0.094979, which makes this a key decision zone.
Key numbers at a glance:
Market Cap: $24.38M
FDV: $94.95M
24h Volume: $2.80M
24h Transactions: 14,027
On-chain Holders: 59,001
On-chain Liquidity: $1.36M
Price has moved well above the MA(7) at 0.088891 and the MA(25) at 0.088843, and those two averages are now tightly bunched and turning upward, which is an early constructive sign. The real test is the MA(99): price has pressed into it, and a clean close above on solid volume would strengthen the bullish case. Volume on the last bar is light, though, and the recent average is lower than the heavy bars seen earlier, so the move still needs more participation to be convincing.
A rejection here would not be surprising, given the wick near $0.0955. In that case, the $0.0888 area where the shorter moving averages sit would be the first support to watch. With liquidity of about $1.36M against a $24.38M market cap, price can swing quickly in either direction, though a holder base of over 59,000 shows healthy community interest.
If you’re watching BSB, it may be smarter to wait for a confirmed break above the MA(99) with rising volume, or a calm pullback to support, rather than buying into resistance. Size your positions sensibly and only risk what you can afford to lose. This is not financial advice, just my read of the chart.
#BSB #BlockStreet #CryptoAnalysis #BinanceSquare #PriceAction
$BSB
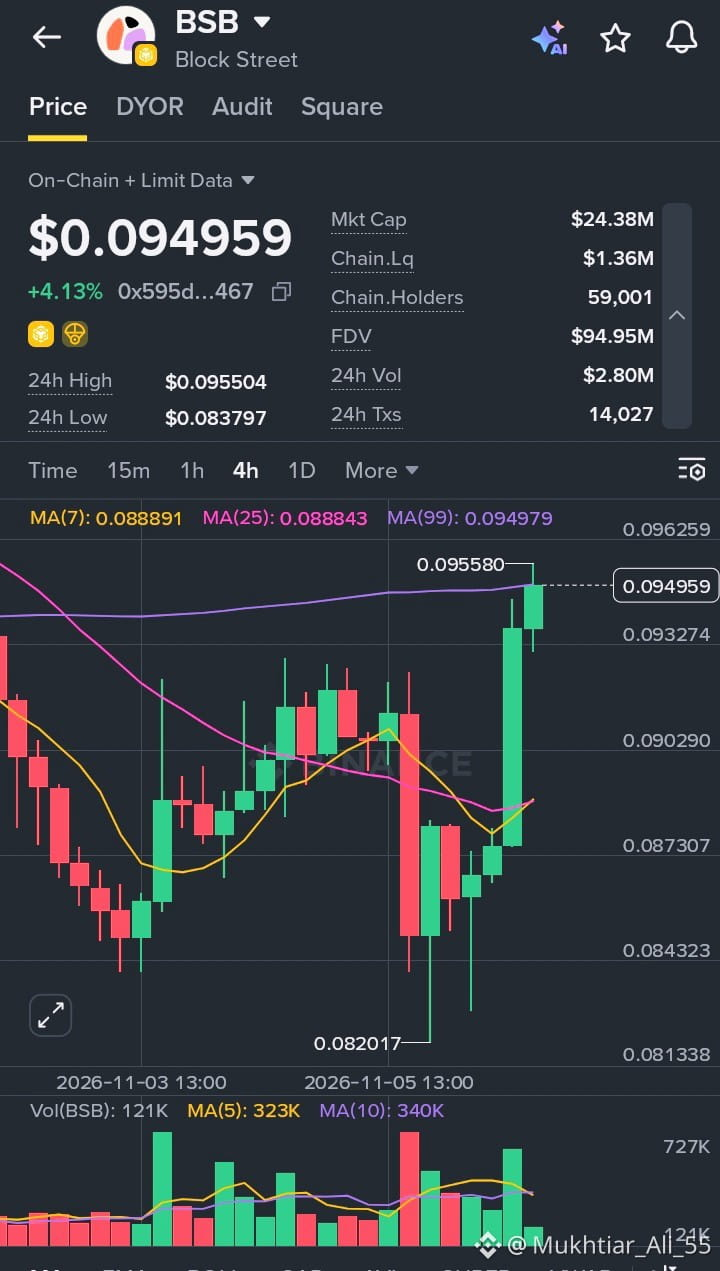
7
LAB Pulih Hampir 8% Setelah Turun Tajam: Inilah yang Ditunjukkan Grafik 4H
LAB sedang bangkit kembali. Token ini diperdagangkan pada $0.04675, naik 7.78% dalam 24 jam terakhir, dengan harga tertinggi $0.050165 dan terendah $0.040102.
Grafik 4H menunjukkan penurunan yang diikuti pemulihan kuat. Harga turun melewati bagian tengah kisaran dan mencapai titik terendah di dekat $0.040229, lalu pembeli masuk dengan serangkaian candle hijau yang kuat dan mendorongnya kembali ke level tertinggi terbaru di $0.048008. Candle terbaru berupa candle merah kecil di dekat $0.0468, yang tampak seperti jeda singkat setelah pergerakan cepat, bukan pembalikan arah.
Angka-angka penting sekilas:
Kapitalisasi Pasar: $33.87M
FDV: $46.75M
Volume 24 jam: $3.20M
Transaksi 24 jam: 45,624
Pemegang on-chain: 30,733
Likuiditas on-chain: $1.03M
Harga telah kembali naik di atas MA(7) pada 0.044196, MA(25) pada 0.044815, dan MA(99) pada 0.043402. Ini merupakan sinyal yang konstruktif setelah sebelumnya turun di bawah level-level tersebut. MA(7) kini mulai melengkung ke atas dan mendekati MA(25), sehingga persilangan bullish mungkin sedang terbentuk jika momentum bertahan. Volume tinggi saat aksi jual dan kembali meningkat saat pemulihan, yang menunjukkan kedua pihak sama-sama aktif. Namun, bar terbaru volumenya kecil, sehingga kelanjutan pergerakan masih perlu dikonfirmasi.
Area di sekitar $0.048 hingga $0.050 menjadi ujian berikutnya, karena sebelumnya penjual menolak harga di sana. Di sisi bawah, zona $0.0448 hingga $0.0442, tempat rata-rata bergerak berkumpul, menjadi area pertama yang perlu dipantau sebagai support. Dengan likuiditas sekitar $1.03M dibandingkan kapitalisasi pasar $33.87M, harga dapat bergerak cepat ke arah mana pun.
Jika Anda memantau LAB, mungkin lebih baik menunggu penembusan yang meyakinkan di atas $0.048 dengan volume yang meningkat, atau menunggu pengujian ulang yang tenang terhadap rata-rata bergerak, daripada mengejar pantulan harga. Kendalikan risiko Anda dan hanya gunakan dana yang sanggup Anda relakan jika hilang. Ini bukan nasihat keuangan, hanya pembacaan saya terhadap grafik.
#LAB #CryptoAnalysis #BinanceSquare #PriceAction #AltcoinWatch
$LAB
{future}(LABUSDT)
LAB Pulih Hampir 8% Setelah Turun Tajam: Inilah yang Ditunjukkan Grafik 4H
LAB sedang bangkit kembali. Token ini diperdagangkan pada $0.04675, naik 7.78% dalam 24 jam terakhir, dengan harga tertinggi $0.050165 dan terendah $0.040102.
Grafik 4H menunjukkan penurunan yang diikuti pemulihan kuat. Harga turun melewati bagian tengah kisaran dan mencapai titik terendah di dekat $0.040229, lalu pembeli masuk dengan serangkaian candle hijau yang kuat dan mendorongnya kembali ke level tertinggi terbaru di $0.048008. Candle terbaru berupa candle merah kecil di dekat $0.0468, yang tampak seperti jeda singkat setelah pergerakan cepat, bukan pembalikan arah.
Angka-angka penting sekilas:
Kapitalisasi Pasar: $33.87M
FDV: $46.75M
Volume 24 jam: $3.20M
Transaksi 24 jam: 45,624
Pemegang on-chain: 30,733
Likuiditas on-chain: $1.03M
Harga telah kembali naik di atas MA(7) pada 0.044196, MA(25) pada 0.044815, dan MA(99) pada 0.043402. Ini merupakan sinyal yang konstruktif setelah sebelumnya turun di bawah level-level tersebut. MA(7) kini mulai melengkung ke atas dan mendekati MA(25), sehingga persilangan bullish mungkin sedang terbentuk jika momentum bertahan. Volume tinggi saat aksi jual dan kembali meningkat saat pemulihan, yang menunjukkan kedua pihak sama-sama aktif. Namun, bar terbaru volumenya kecil, sehingga kelanjutan pergerakan masih perlu dikonfirmasi.
Area di sekitar $0.048 hingga $0.050 menjadi ujian berikutnya, karena sebelumnya penjual menolak harga di sana. Di sisi bawah, zona $0.0448 hingga $0.0442, tempat rata-rata bergerak berkumpul, menjadi area pertama yang perlu dipantau sebagai support. Dengan likuiditas sekitar $1.03M dibandingkan kapitalisasi pasar $33.87M, harga dapat bergerak cepat ke arah mana pun.
Jika Anda memantau LAB, mungkin lebih baik menunggu penembusan yang meyakinkan di atas $0.048 dengan volume yang meningkat, atau menunggu pengujian ulang yang tenang terhadap rata-rata bergerak, daripada mengejar pantulan harga. Kendalikan risiko Anda dan hanya gunakan dana yang sanggup Anda relakan jika hilang. Ini bukan nasihat keuangan, hanya pembacaan saya terhadap grafik.
#LAB #CryptoAnalysis #BinanceSquare #PriceAction #AltcoinWatch
$LAB
LAB sedang bangkit kembali. Token ini diperdagangkan pada $0.04675, naik 7.78% dalam 24 jam terakhir, dengan harga tertinggi $0.050165 dan terendah $0.040102.
Grafik 4H menunjukkan penurunan yang diikuti pemulihan kuat. Harga turun melewati bagian tengah kisaran dan mencapai titik terendah di dekat $0.040229, lalu pembeli masuk dengan serangkaian candle hijau yang kuat dan mendorongnya kembali ke level tertinggi terbaru di $0.048008. Candle terbaru berupa candle merah kecil di dekat $0.0468, yang tampak seperti jeda singkat setelah pergerakan cepat, bukan pembalikan arah.
Angka-angka penting sekilas:
Kapitalisasi Pasar: $33.87M
FDV: $46.75M
Volume 24 jam: $3.20M
Transaksi 24 jam: 45,624
Pemegang on-chain: 30,733
Likuiditas on-chain: $1.03M
Harga telah kembali naik di atas MA(7) pada 0.044196, MA(25) pada 0.044815, dan MA(99) pada 0.043402. Ini merupakan sinyal yang konstruktif setelah sebelumnya turun di bawah level-level tersebut. MA(7) kini mulai melengkung ke atas dan mendekati MA(25), sehingga persilangan bullish mungkin sedang terbentuk jika momentum bertahan. Volume tinggi saat aksi jual dan kembali meningkat saat pemulihan, yang menunjukkan kedua pihak sama-sama aktif. Namun, bar terbaru volumenya kecil, sehingga kelanjutan pergerakan masih perlu dikonfirmasi.
Area di sekitar $0.048 hingga $0.050 menjadi ujian berikutnya, karena sebelumnya penjual menolak harga di sana. Di sisi bawah, zona $0.0448 hingga $0.0442, tempat rata-rata bergerak berkumpul, menjadi area pertama yang perlu dipantau sebagai support. Dengan likuiditas sekitar $1.03M dibandingkan kapitalisasi pasar $33.87M, harga dapat bergerak cepat ke arah mana pun.
Jika Anda memantau LAB, mungkin lebih baik menunggu penembusan yang meyakinkan di atas $0.048 dengan volume yang meningkat, atau menunggu pengujian ulang yang tenang terhadap rata-rata bergerak, daripada mengejar pantulan harga. Kendalikan risiko Anda dan hanya gunakan dana yang sanggup Anda relakan jika hilang. Ini bukan nasihat keuangan, hanya pembacaan saya terhadap grafik.
#LAB #CryptoAnalysis #BinanceSquare #PriceAction #AltcoinWatch
$LAB
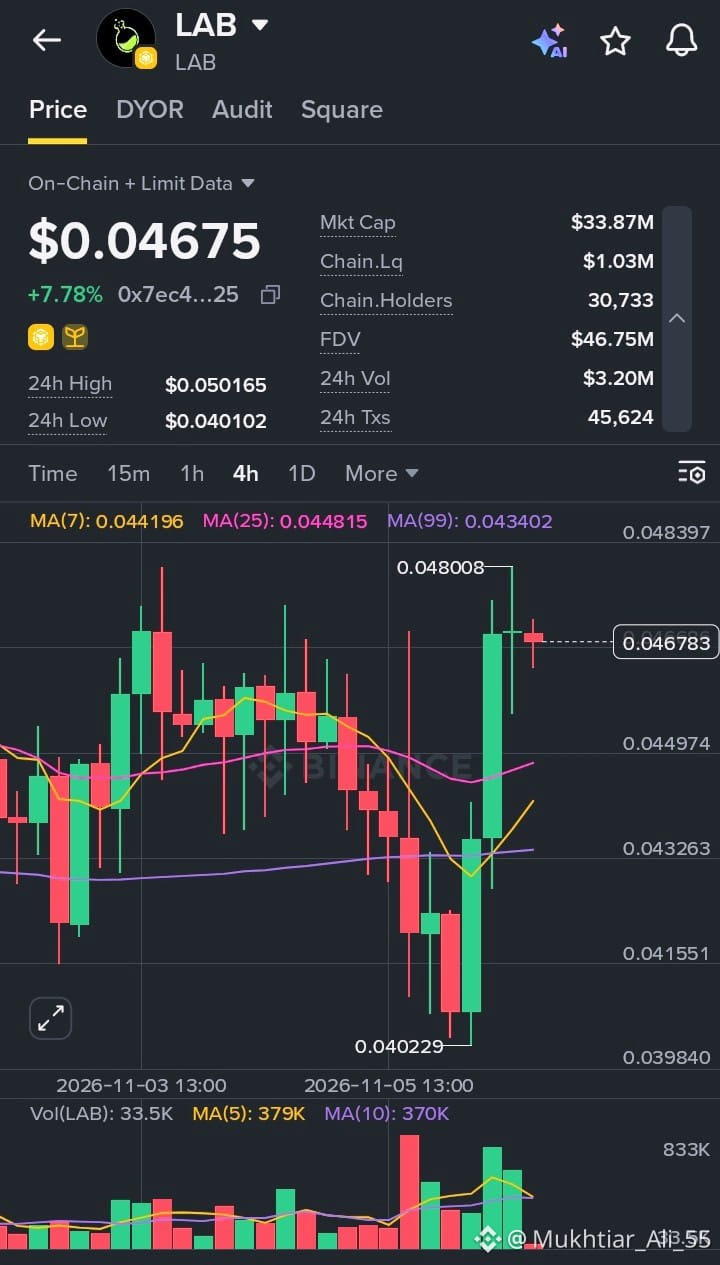
10
PIEVERSE Naik Hampir 8% dan Bertahan Dekat Level Tertinggi: Membaca Grafik 4 Jam
Pieverse (PIEVERSE) terus menunjukkan kekuatan. Token ini diperdagangkan di harga $1.41392, naik 7.81% dalam 24 jam terakhir, dengan level tertinggi $1.43386 dan terendah $1.22762.
Grafik 4 jam menunjukkan tren naik yang tersusun rapi. Harga membentuk dasar di dekat $1.02, lalu bergerak naik secara bertahap, dengan jeda-jeda kecil di sepanjang pergerakan sebelum setiap kenaikan. Kenaikan terbaru ditandai oleh candle hijau yang kuat, membawa harga dari sekitar $1.27 ke area $1.41. Beberapa candle terakhir berukuran kecil dan rapat, tepat di bawah level tertinggi terbaru $1.43433, yang tampak lebih seperti konsolidasi daripada pelemahan.
Angka-angka penting sekilas:
Kapitalisasi Pasar: $437.61M
FDV: $1.41B
Volume 24 jam: $6.22M
Transaksi 24 jam: 33,316
Pemegang on-chain: 348,906
Likuiditas on-chain: $2.34M
Harga berada cukup jauh di atas MA(7) di 1.32124, MA(25) di 1.20902, dan MA(99) di 1.07829. Ketiganya juga menanjak, mendukung struktur bullish. Namun, jarak antara harga dan MA(7) cukup lebar, sehingga koreksi menuju level tersebut akan menjadi penyesuaian yang wajar dan sehat.
Satu hal yang patut diperhatikan adalah volume. Batang volume terbaru lebih rendah daripada batang yang memicu breakout, jadi kelanjutan kenaikan kemungkinan membutuhkan minat beli baru untuk menembus $1.43. Dengan basis pemegang yang besar, hampir 349 ribu, dan kapitalisasi pasar di atas $437M, proyek ini memiliki partisipasi yang luas. Namun, likuiditas on-chain sebesar $2.34M tergolong kecil untuk ukuran tersebut, sehingga pergerakan tajam masih bisa terjadi.
Jika Anda mengikuti PIEVERSE, mungkin lebih bijak untuk menunggu penembusan bersih di atas level tertinggi terbaru dengan volume kuat, atau menunggu pengujian ulang area support yang tenang, alih-alih mengejar harga di puncak. Kelola risiko Anda dan hanya gunakan dana yang sanggup Anda tanggung jika hilang. Ini bukan nasihat keuangan, hanya pembacaan saya terhadap grafik.
#PIEVERSE #Pieverse #CryptoAnalysis #BinanceSquare #PriceAction
$PIEVERSE
{future}(PIEVERSEUSDT)
PIEVERSE Naik Hampir 8% dan Bertahan Dekat Level Tertinggi: Membaca Grafik 4 Jam
Pieverse (PIEVERSE) terus menunjukkan kekuatan. Token ini diperdagangkan di harga $1.41392, naik 7.81% dalam 24 jam terakhir, dengan level tertinggi $1.43386 dan terendah $1.22762.
Grafik 4 jam menunjukkan tren naik yang tersusun rapi. Harga membentuk dasar di dekat $1.02, lalu bergerak naik secara bertahap, dengan jeda-jeda kecil di sepanjang pergerakan sebelum setiap kenaikan. Kenaikan terbaru ditandai oleh candle hijau yang kuat, membawa harga dari sekitar $1.27 ke area $1.41. Beberapa candle terakhir berukuran kecil dan rapat, tepat di bawah level tertinggi terbaru $1.43433, yang tampak lebih seperti konsolidasi daripada pelemahan.
Angka-angka penting sekilas:
Kapitalisasi Pasar: $437.61M
FDV: $1.41B
Volume 24 jam: $6.22M
Transaksi 24 jam: 33,316
Pemegang on-chain: 348,906
Likuiditas on-chain: $2.34M
Harga berada cukup jauh di atas MA(7) di 1.32124, MA(25) di 1.20902, dan MA(99) di 1.07829. Ketiganya juga menanjak, mendukung struktur bullish. Namun, jarak antara harga dan MA(7) cukup lebar, sehingga koreksi menuju level tersebut akan menjadi penyesuaian yang wajar dan sehat.
Satu hal yang patut diperhatikan adalah volume. Batang volume terbaru lebih rendah daripada batang yang memicu breakout, jadi kelanjutan kenaikan kemungkinan membutuhkan minat beli baru untuk menembus $1.43. Dengan basis pemegang yang besar, hampir 349 ribu, dan kapitalisasi pasar di atas $437M, proyek ini memiliki partisipasi yang luas. Namun, likuiditas on-chain sebesar $2.34M tergolong kecil untuk ukuran tersebut, sehingga pergerakan tajam masih bisa terjadi.
Jika Anda mengikuti PIEVERSE, mungkin lebih bijak untuk menunggu penembusan bersih di atas level tertinggi terbaru dengan volume kuat, atau menunggu pengujian ulang area support yang tenang, alih-alih mengejar harga di puncak. Kelola risiko Anda dan hanya gunakan dana yang sanggup Anda tanggung jika hilang. Ini bukan nasihat keuangan, hanya pembacaan saya terhadap grafik.
#PIEVERSE #Pieverse #CryptoAnalysis #BinanceSquare #PriceAction
$PIEVERSE
Pieverse (PIEVERSE) terus menunjukkan kekuatan. Token ini diperdagangkan di harga $1.41392, naik 7.81% dalam 24 jam terakhir, dengan level tertinggi $1.43386 dan terendah $1.22762.
Grafik 4 jam menunjukkan tren naik yang tersusun rapi. Harga membentuk dasar di dekat $1.02, lalu bergerak naik secara bertahap, dengan jeda-jeda kecil di sepanjang pergerakan sebelum setiap kenaikan. Kenaikan terbaru ditandai oleh candle hijau yang kuat, membawa harga dari sekitar $1.27 ke area $1.41. Beberapa candle terakhir berukuran kecil dan rapat, tepat di bawah level tertinggi terbaru $1.43433, yang tampak lebih seperti konsolidasi daripada pelemahan.
Angka-angka penting sekilas:
Kapitalisasi Pasar: $437.61M
FDV: $1.41B
Volume 24 jam: $6.22M
Transaksi 24 jam: 33,316
Pemegang on-chain: 348,906
Likuiditas on-chain: $2.34M
Harga berada cukup jauh di atas MA(7) di 1.32124, MA(25) di 1.20902, dan MA(99) di 1.07829. Ketiganya juga menanjak, mendukung struktur bullish. Namun, jarak antara harga dan MA(7) cukup lebar, sehingga koreksi menuju level tersebut akan menjadi penyesuaian yang wajar dan sehat.
Satu hal yang patut diperhatikan adalah volume. Batang volume terbaru lebih rendah daripada batang yang memicu breakout, jadi kelanjutan kenaikan kemungkinan membutuhkan minat beli baru untuk menembus $1.43. Dengan basis pemegang yang besar, hampir 349 ribu, dan kapitalisasi pasar di atas $437M, proyek ini memiliki partisipasi yang luas. Namun, likuiditas on-chain sebesar $2.34M tergolong kecil untuk ukuran tersebut, sehingga pergerakan tajam masih bisa terjadi.
Jika Anda mengikuti PIEVERSE, mungkin lebih bijak untuk menunggu penembusan bersih di atas level tertinggi terbaru dengan volume kuat, atau menunggu pengujian ulang area support yang tenang, alih-alih mengejar harga di puncak. Kelola risiko Anda dan hanya gunakan dana yang sanggup Anda tanggung jika hilang. Ini bukan nasihat keuangan, hanya pembacaan saya terhadap grafik.
#PIEVERSE #Pieverse #CryptoAnalysis #BinanceSquare #PriceAction
$PIEVERSE
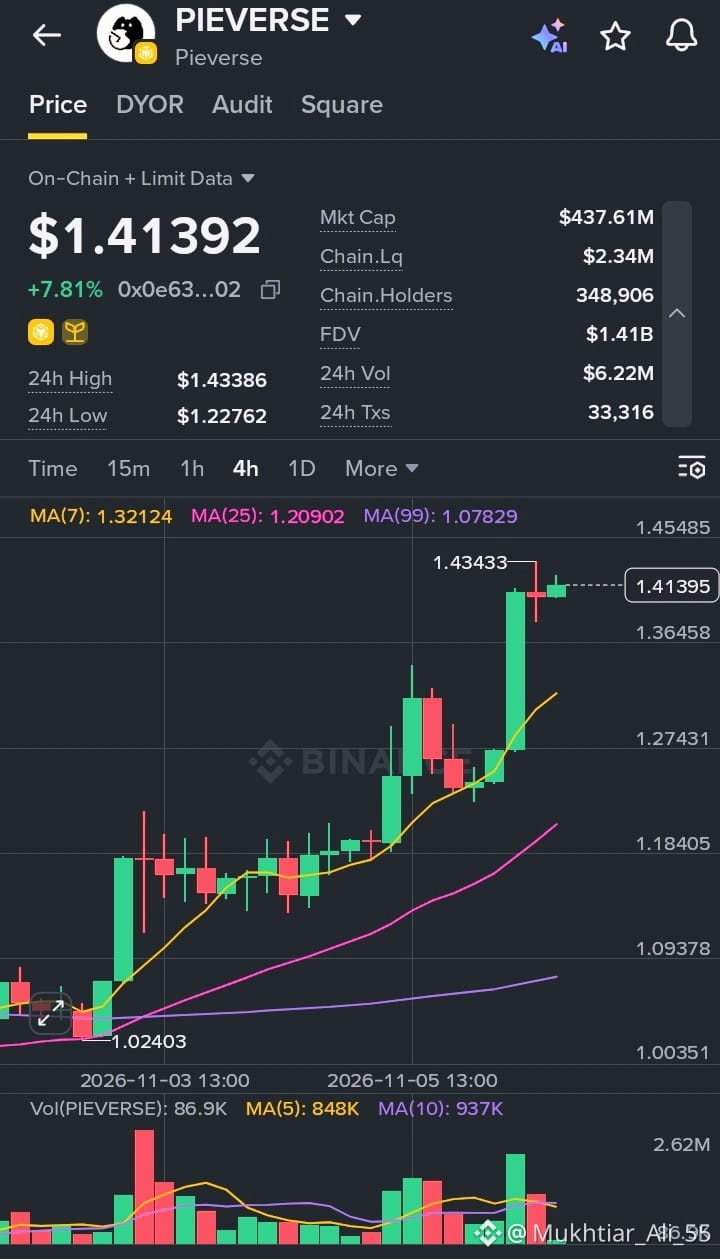
31
BIRB Melonjak 32% saat Pembeli Menguasai Pasar: Menilik Grafik 4 Jam
Moonbirds (BIRB) mencatat sesi yang kuat. Token ini diperdagangkan pada harga $0.11205, naik 32.67% dalam 24 jam terakhir, dengan harga tertinggi $0.13359 dan terendah $0.084376.
Grafik 4 jam menunjukkan kenaikan yang stabil dan jelas. Setelah bergerak sideways di kisaran $0.08 hingga $0.09, harga mulai membentuk titik terendah yang semakin tinggi, lalu melesat tajam. Ekor lilin terbaru sempat mencapai $0.124285 sebelum sedikit terkoreksi, tetapi lilin terakhir ditutup dengan kuat di zona hijau, menandakan pembeli masih mempertahankan kenaikan ini.
Angka penting sekilas:
Kapitalisasi Pasar: $31.93M
FDV: $112.03M
Volume 24 jam: $9.05M
Transaksi 24 jam: 188,658
Pemegang On-chain: 16,523
Likuiditas On-chain: $1.83M
Harga diperdagangkan jauh di atas MA(7) pada 0.096151, MA(25) pada 0.085874, dan MA(99) pada 0.079563, dengan ketiganya bergerak menanjak. Susunan ini menjadi sinyal yang sehat bagi tren jangka pendek. Volume juga meningkat pada setiap lilin hijau, dan batang terbaru menjadi yang terbesar di grafik. Ini menunjukkan reli tersebut didukung oleh partisipasi yang nyata, bukan sekadar lonjakan tipis.
Meski begitu, kenaikan 32% dalam sehari sering kali mengundang aksi ambil untung. Ekor atas yang panjang di dekat $0.124 menunjukkan bahwa sebagian penjual masuk pada level yang lebih tinggi, sehingga koreksi menuju MA(7) bukan hal yang mengejutkan. Likuiditas sebesar $1.83M dibandingkan kapitalisasi pasar sekitar $32M tergolong moderat, sehingga volatilitas bisa tetap tinggi ke dua arah.
Jika Anda memantau BIRB, bersabar lebih baik daripada mengejar lilin hijau. Biarkan harga mengonfirmasi level dukungan jika terjadi penurunan, atur ukuran posisi dengan bijak, dan jangan pernah mengambil risiko melebihi kemampuan Anda untuk menanggung kerugian. Ini bukan nasihat keuangan, hanya pandangan saya terhadap grafik.
#BIRB #Moonbirds #CryptoAnalysis #BinanceSquare #PriceAction
$BIRB
{future}(BIRBUSDT)
BIRB Melonjak 32% saat Pembeli Menguasai Pasar: Menilik Grafik 4 Jam
Moonbirds (BIRB) mencatat sesi yang kuat. Token ini diperdagangkan pada harga $0.11205, naik 32.67% dalam 24 jam terakhir, dengan harga tertinggi $0.13359 dan terendah $0.084376.
Grafik 4 jam menunjukkan kenaikan yang stabil dan jelas. Setelah bergerak sideways di kisaran $0.08 hingga $0.09, harga mulai membentuk titik terendah yang semakin tinggi, lalu melesat tajam. Ekor lilin terbaru sempat mencapai $0.124285 sebelum sedikit terkoreksi, tetapi lilin terakhir ditutup dengan kuat di zona hijau, menandakan pembeli masih mempertahankan kenaikan ini.
Angka penting sekilas:
Kapitalisasi Pasar: $31.93M
FDV: $112.03M
Volume 24 jam: $9.05M
Transaksi 24 jam: 188,658
Pemegang On-chain: 16,523
Likuiditas On-chain: $1.83M
Harga diperdagangkan jauh di atas MA(7) pada 0.096151, MA(25) pada 0.085874, dan MA(99) pada 0.079563, dengan ketiganya bergerak menanjak. Susunan ini menjadi sinyal yang sehat bagi tren jangka pendek. Volume juga meningkat pada setiap lilin hijau, dan batang terbaru menjadi yang terbesar di grafik. Ini menunjukkan reli tersebut didukung oleh partisipasi yang nyata, bukan sekadar lonjakan tipis.
Meski begitu, kenaikan 32% dalam sehari sering kali mengundang aksi ambil untung. Ekor atas yang panjang di dekat $0.124 menunjukkan bahwa sebagian penjual masuk pada level yang lebih tinggi, sehingga koreksi menuju MA(7) bukan hal yang mengejutkan. Likuiditas sebesar $1.83M dibandingkan kapitalisasi pasar sekitar $32M tergolong moderat, sehingga volatilitas bisa tetap tinggi ke dua arah.
Jika Anda memantau BIRB, bersabar lebih baik daripada mengejar lilin hijau. Biarkan harga mengonfirmasi level dukungan jika terjadi penurunan, atur ukuran posisi dengan bijak, dan jangan pernah mengambil risiko melebihi kemampuan Anda untuk menanggung kerugian. Ini bukan nasihat keuangan, hanya pandangan saya terhadap grafik.
#BIRB #Moonbirds #CryptoAnalysis #BinanceSquare #PriceAction
$BIRB
Moonbirds (BIRB) mencatat sesi yang kuat. Token ini diperdagangkan pada harga $0.11205, naik 32.67% dalam 24 jam terakhir, dengan harga tertinggi $0.13359 dan terendah $0.084376.
Grafik 4 jam menunjukkan kenaikan yang stabil dan jelas. Setelah bergerak sideways di kisaran $0.08 hingga $0.09, harga mulai membentuk titik terendah yang semakin tinggi, lalu melesat tajam. Ekor lilin terbaru sempat mencapai $0.124285 sebelum sedikit terkoreksi, tetapi lilin terakhir ditutup dengan kuat di zona hijau, menandakan pembeli masih mempertahankan kenaikan ini.
Angka penting sekilas:
Kapitalisasi Pasar: $31.93M
FDV: $112.03M
Volume 24 jam: $9.05M
Transaksi 24 jam: 188,658
Pemegang On-chain: 16,523
Likuiditas On-chain: $1.83M
Harga diperdagangkan jauh di atas MA(7) pada 0.096151, MA(25) pada 0.085874, dan MA(99) pada 0.079563, dengan ketiganya bergerak menanjak. Susunan ini menjadi sinyal yang sehat bagi tren jangka pendek. Volume juga meningkat pada setiap lilin hijau, dan batang terbaru menjadi yang terbesar di grafik. Ini menunjukkan reli tersebut didukung oleh partisipasi yang nyata, bukan sekadar lonjakan tipis.
Meski begitu, kenaikan 32% dalam sehari sering kali mengundang aksi ambil untung. Ekor atas yang panjang di dekat $0.124 menunjukkan bahwa sebagian penjual masuk pada level yang lebih tinggi, sehingga koreksi menuju MA(7) bukan hal yang mengejutkan. Likuiditas sebesar $1.83M dibandingkan kapitalisasi pasar sekitar $32M tergolong moderat, sehingga volatilitas bisa tetap tinggi ke dua arah.
Jika Anda memantau BIRB, bersabar lebih baik daripada mengejar lilin hijau. Biarkan harga mengonfirmasi level dukungan jika terjadi penurunan, atur ukuran posisi dengan bijak, dan jangan pernah mengambil risiko melebihi kemampuan Anda untuk menanggung kerugian. Ini bukan nasihat keuangan, hanya pandangan saya terhadap grafik.
#BIRB #Moonbirds #CryptoAnalysis #BinanceSquare #PriceAction
$BIRB
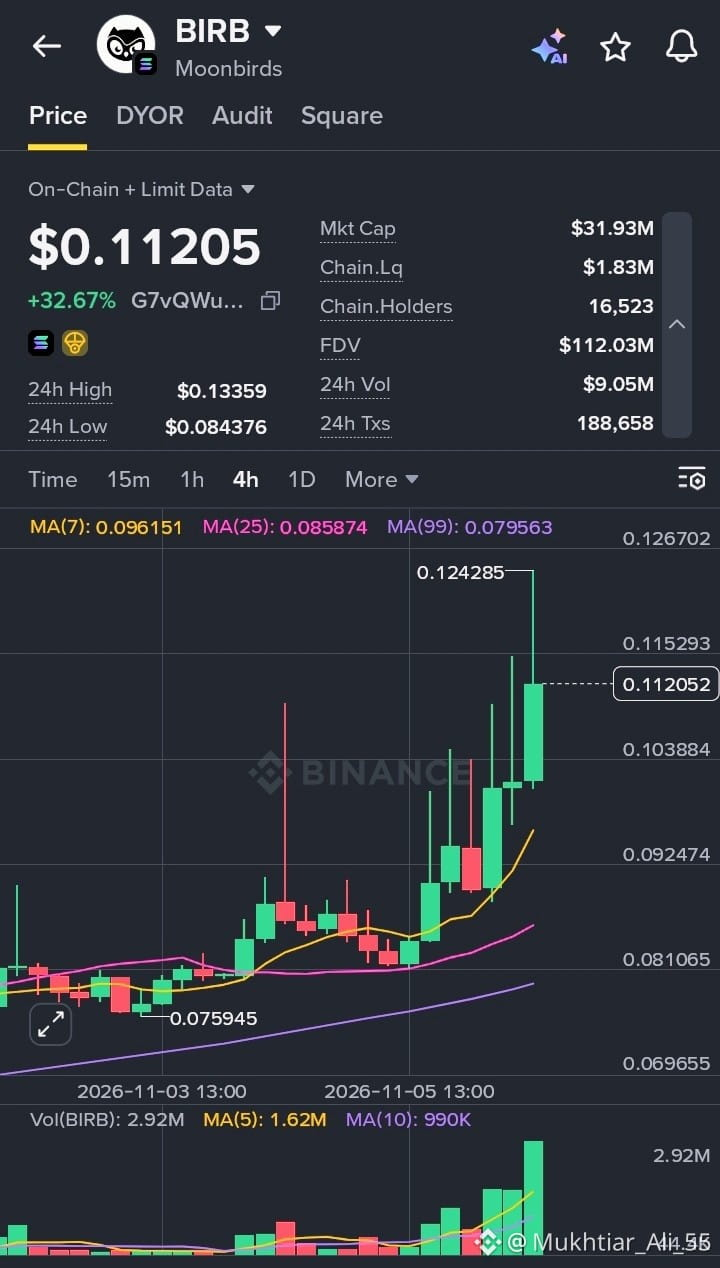
29
Lihat terjemahan
AIN Takes a 63% Hit in 24 Hours: What the Chart Is Telling Us
Infinity Ground (AIN) has had a rough 24 hours. The token is trading at $0.10203, down 63.14% on the day, after touching a 24h high of $0.37956 and a low of $0.093212.
The 4H chart shows how quickly things turned. AIN spent days consolidating around the $0.25 to $0.34 range, then peaked near $0.3405 before a sharp sell-off began. One large red candle wiped out most of the structure, and price found a short-term low at $0.0977523 before stabilizing around $0.102.
Here are the numbers worth noting:
Market Cap: $45.79M
FDV: $102.03M
24h Volume: $39.44M
24h Transactions: 1.11M
On-chain Holders: 19,220
On-chain Liquidity: $702,099.50
Volume spiked heavily during the drop, which points to aggressive selling and panic exits rather than a slow bleed. Price is now well below the MA(7), MA(25) and MA(99), so the short-term trend remains bearish. The most recent candles are small, which suggests sellers may be losing momentum, but there is no confirmed reversal yet.
Liquidity of roughly $702K against a $45M market cap is also thin, which means moves in either direction can stay sharp and volatile.
For anyone watching AIN, patience matters more than speed right now. Wait for a clear base and rising buy volume before making decisions, and never risk more than you can afford to lose. This is not financial advice, just a read of the chart.
#AIN #InfinityGround #CryptoAnalysis #BinanceSquare #PriceAction
Trade here 👇 👇 👇
$AIN
{future}(AINUSDT)
AIN Takes a 63% Hit in 24 Hours: What the Chart Is Telling Us
Infinity Ground (AIN) has had a rough 24 hours. The token is trading at $0.10203, down 63.14% on the day, after touching a 24h high of $0.37956 and a low of $0.093212.
The 4H chart shows how quickly things turned. AIN spent days consolidating around the $0.25 to $0.34 range, then peaked near $0.3405 before a sharp sell-off began. One large red candle wiped out most of the structure, and price found a short-term low at $0.0977523 before stabilizing around $0.102.
Here are the numbers worth noting:
Market Cap: $45.79M
FDV: $102.03M
24h Volume: $39.44M
24h Transactions: 1.11M
On-chain Holders: 19,220
On-chain Liquidity: $702,099.50
Volume spiked heavily during the drop, which points to aggressive selling and panic exits rather than a slow bleed. Price is now well below the MA(7), MA(25) and MA(99), so the short-term trend remains bearish. The most recent candles are small, which suggests sellers may be losing momentum, but there is no confirmed reversal yet.
Liquidity of roughly $702K against a $45M market cap is also thin, which means moves in either direction can stay sharp and volatile.
For anyone watching AIN, patience matters more than speed right now. Wait for a clear base and rising buy volume before making decisions, and never risk more than you can afford to lose. This is not financial advice, just a read of the chart.
#AIN #InfinityGround #CryptoAnalysis #BinanceSquare #PriceAction
Trade here 👇 👇 👇
$AIN
Infinity Ground (AIN) has had a rough 24 hours. The token is trading at $0.10203, down 63.14% on the day, after touching a 24h high of $0.37956 and a low of $0.093212.
The 4H chart shows how quickly things turned. AIN spent days consolidating around the $0.25 to $0.34 range, then peaked near $0.3405 before a sharp sell-off began. One large red candle wiped out most of the structure, and price found a short-term low at $0.0977523 before stabilizing around $0.102.
Here are the numbers worth noting:
Market Cap: $45.79M
FDV: $102.03M
24h Volume: $39.44M
24h Transactions: 1.11M
On-chain Holders: 19,220
On-chain Liquidity: $702,099.50
Volume spiked heavily during the drop, which points to aggressive selling and panic exits rather than a slow bleed. Price is now well below the MA(7), MA(25) and MA(99), so the short-term trend remains bearish. The most recent candles are small, which suggests sellers may be losing momentum, but there is no confirmed reversal yet.
Liquidity of roughly $702K against a $45M market cap is also thin, which means moves in either direction can stay sharp and volatile.
For anyone watching AIN, patience matters more than speed right now. Wait for a clear base and rising buy volume before making decisions, and never risk more than you can afford to lose. This is not financial advice, just a read of the chart.
#AIN #InfinityGround #CryptoAnalysis #BinanceSquare #PriceAction
Trade here 👇 👇 👇
$AIN
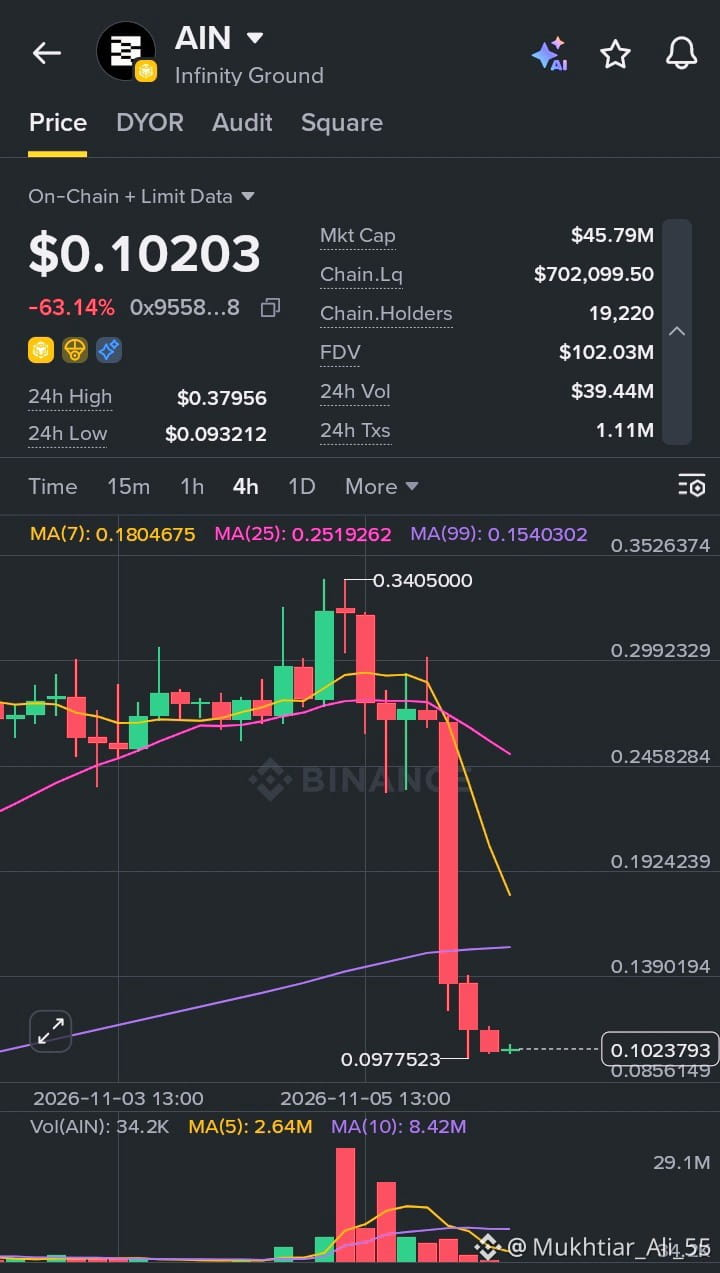
39
Lihat terjemahan
$UAI Surges +88% in 24h: Strong Breakout, But Resistance Is Close
$UAI (UnifAI Network) is making noise today. Price is trading at $0.18903, up 88.34% over the last 24 hours, after bouncing from a low of $0.088563 and pushing up to a high of $0.193.
Here’s what the 4H chart is showing:
Real participation behind the move. 24h volume is $28.54M across 97,097 transactions, against a market cap of $74.14M. The largest volume bars line up with the breakout candles, which is what you want to see in a genuine move.
Momentum has shifted. Price has cleared both the MA(7) at 0.139949 and the MA(25) at 0.116155, and the MA(7) is now curling sharply upward. The strong green candles from the 0.07 to 0.08 zone made that shift clear.
Resistance is right overhead. The recent high near 0.1932 has already been rejected once, with a red candle forming just below it. Beyond that, the MA(99) sits at 0.227207, and the long-term average is still sloping down.
Liquidity is thin. On-chain liquidity is about $921K with 7,792 holders, while FDV is $189.03M. That gap means price can swing hard in both directions, especially if volume cools off.
My take: this is a convincing recovery from the 0.073 low, and the volume supports it. But after an 88% day, the smart move is patience. I’m watching for a clean break and hold above 0.193 for continuation, or a healthy pullback toward the 0.14 area that holds the MA(7). A fade in volume near resistance would be an early warning sign.
#UAI #UnifAI #Crypto #Altcoins #BinanceSquare
$UAI
{future}(UAIUSDT)
$UAI Surges +88% in 24h: Strong Breakout, But Resistance Is Close
$UAI (UnifAI Network) is making noise today. Price is trading at $0.18903, up 88.34% over the last 24 hours, after bouncing from a low of $0.088563 and pushing up to a high of $0.193.
Here’s what the 4H chart is showing:
Real participation behind the move. 24h volume is $28.54M across 97,097 transactions, against a market cap of $74.14M. The largest volume bars line up with the breakout candles, which is what you want to see in a genuine move.
Momentum has shifted. Price has cleared both the MA(7) at 0.139949 and the MA(25) at 0.116155, and the MA(7) is now curling sharply upward. The strong green candles from the 0.07 to 0.08 zone made that shift clear.
Resistance is right overhead. The recent high near 0.1932 has already been rejected once, with a red candle forming just below it. Beyond that, the MA(99) sits at 0.227207, and the long-term average is still sloping down.
Liquidity is thin. On-chain liquidity is about $921K with 7,792 holders, while FDV is $189.03M. That gap means price can swing hard in both directions, especially if volume cools off.
My take: this is a convincing recovery from the 0.073 low, and the volume supports it. But after an 88% day, the smart move is patience. I’m watching for a clean break and hold above 0.193 for continuation, or a healthy pullback toward the 0.14 area that holds the MA(7). A fade in volume near resistance would be an early warning sign.
#UAI #UnifAI #Crypto #Altcoins #BinanceSquare
$UAI
$UAI (UnifAI Network) is making noise today. Price is trading at $0.18903, up 88.34% over the last 24 hours, after bouncing from a low of $0.088563 and pushing up to a high of $0.193.
Here’s what the 4H chart is showing:
Real participation behind the move. 24h volume is $28.54M across 97,097 transactions, against a market cap of $74.14M. The largest volume bars line up with the breakout candles, which is what you want to see in a genuine move.
Momentum has shifted. Price has cleared both the MA(7) at 0.139949 and the MA(25) at 0.116155, and the MA(7) is now curling sharply upward. The strong green candles from the 0.07 to 0.08 zone made that shift clear.
Resistance is right overhead. The recent high near 0.1932 has already been rejected once, with a red candle forming just below it. Beyond that, the MA(99) sits at 0.227207, and the long-term average is still sloping down.
Liquidity is thin. On-chain liquidity is about $921K with 7,792 holders, while FDV is $189.03M. That gap means price can swing hard in both directions, especially if volume cools off.
My take: this is a convincing recovery from the 0.073 low, and the volume supports it. But after an 88% day, the smart move is patience. I’m watching for a clean break and hold above 0.193 for continuation, or a healthy pullback toward the 0.14 area that holds the MA(7). A fade in volume near resistance would be an early warning sign.
#UAI #UnifAI #Crypto #Altcoins #BinanceSquare
$UAI
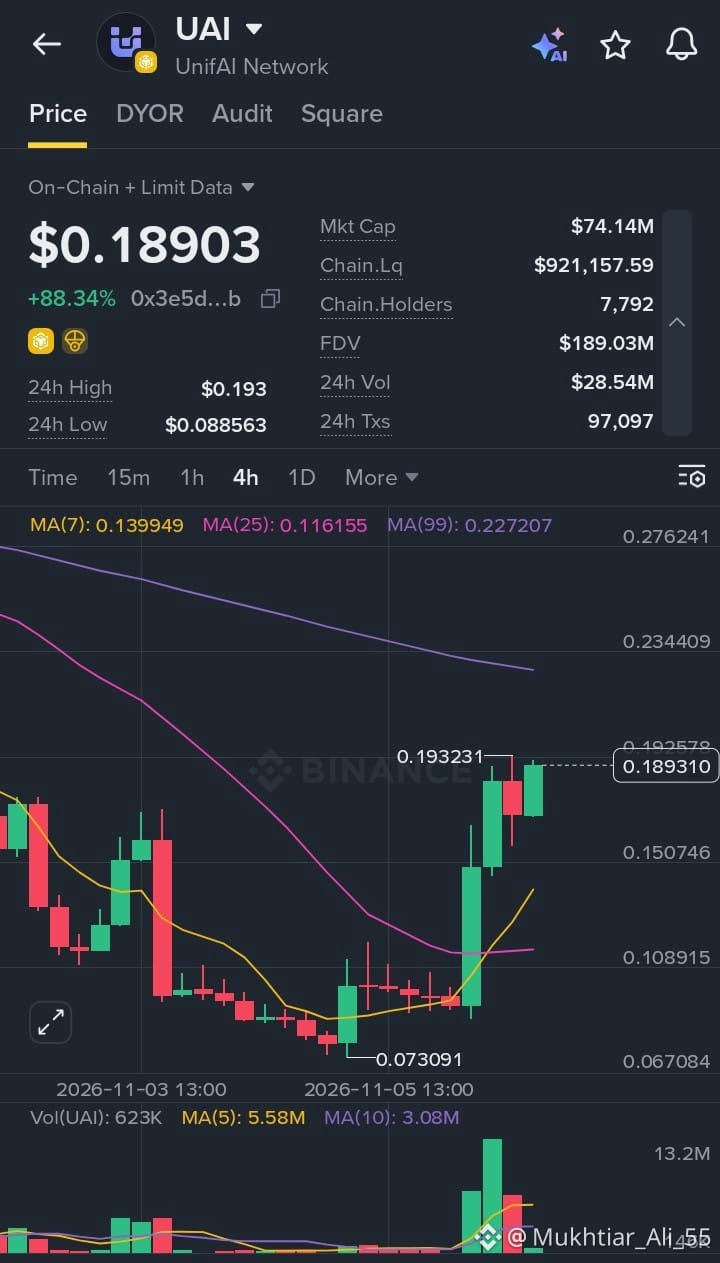
56
Masuk untuk menjelajahi konten lainnya
Bergabunglah dengan pengguna kripto global di Binance Square
⚡️ Dapatkan informasi terbaru dan berguna tentang kripto.
💬 Dipercayai oleh bursa kripto terbesar di dunia.
👍 Temukan wawasan nyata dari kreator terverifikasi.
Email/Nomor Ponsel
Topik Sedang Tren
BitcoinRebounds$75KAsChipsLead
10,318 penayangan
146 Berdiskusi
Market Watch | Bitcoin Pulih ke $75.600 Setelah Turun di Bawah $75.000, Saham Chip Pimpin Reli Usai Data Ketenagakerjaan Lampaui Perkiraan
Binance News
·Disukai 17 Kali
·5.1k penayangan
JobsReportRaisesHikeOdds
133,256 penayangan
1,171 Berdiskusi
US Data Center Rules May Constrain AI Expansion
19,750 penayangan
110 Berdiskusi