
#usstocks
usstocks
202,024 penayangan
842 Berdiskusi
Populer
Terbaru

·
--
Artikel
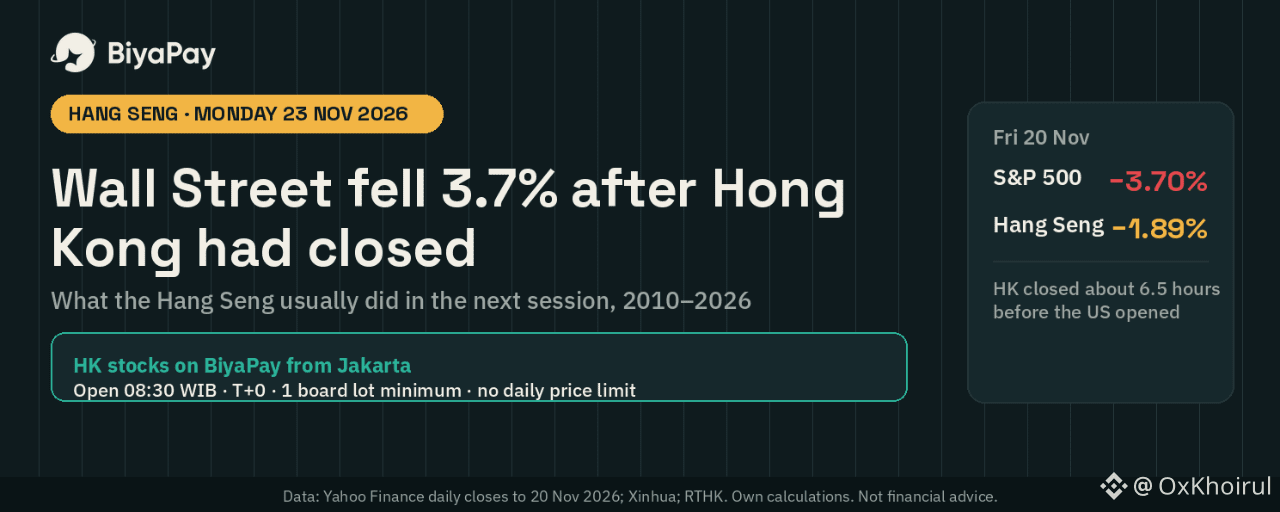
Wall Street Turun 3,7% Setelah Hong Kong Tutup: Apa yang Biasanya Terjadi pada Hang Seng di Sesi Berikutnya?Pernyataan: Ini bukan nasihat keuangan
Penurunan pada hari Jumat terjadi setelah Hong Kong tutup
Pada Jumat, 20 November 2026, S&P 500 turun 3,70% menjadi 6.910,39 dan Nasdaq Composite turun 5,28% menjadi 22.617,73, menurut laporan penutupan Xinhua. Sektor teknologi menjadi sektor dengan kinerja terburuk, turun 7,11%.
Hong Kong sudah menutup pekannya saat itu. Indeks Hang Seng ditutup turun 1,89% ke 22.410,80 pada Jumat sore, sementara Indeks Hang Seng Tech turun 3,8% ke 3.511, lapor RTHK.
Hang Seng ditutup pukul 16.00 waktu Hong Kong. Saat itu pukul 03.00 di New York, enam setengah jam sebelum pasar AS dibuka. Jadi, penurunan 1,89% di Hong Kong pada Jumat merupakan reaksi terhadap perdagangan AS pada Kamis, saat S&P 500 turun 2,02%. Penurunan 3,70% pada Jumat sama sekali belum tercermin dalam perdagangan di Hong Kong. Kesempatan pertama untuk itu adalah Senin, 23 November, pukul 09.30 waktu Hong Kong.
Wall Street Turun 3,7% Setelah Hong Kong Tutup: Apa yang Biasanya Terjadi pada Hang Seng di Sesi Berikutnya?
Pernyataan: Ini bukan nasihat keuangan
Penurunan pada hari Jumat terjadi setelah Hong Kong tutup
Pada Jumat, 20 November 2026, S&P 500 turun 3,70% menjadi 6.910,39 dan Nasdaq Composite turun 5,28% menjadi 22.617,73, menurut laporan penutupan Xinhua. Sektor teknologi menjadi sektor dengan kinerja terburuk, turun 7,11%.
Hong Kong sudah menutup pekannya saat itu. Indeks Hang Seng ditutup turun 1,89% ke 22.410,80 pada Jumat sore, sementara Indeks Hang Seng Tech turun 3,8% ke 3.511, lapor RTHK.
Hang Seng ditutup pukul 16.00 waktu Hong Kong. Saat itu pukul 03.00 di New York, enam setengah jam sebelum pasar AS dibuka. Jadi, penurunan 1,89% di Hong Kong pada Jumat merupakan reaksi terhadap perdagangan AS pada Kamis, saat S&P 500 turun 2,02%. Penurunan 3,70% pada Jumat sama sekali belum tercermin dalam perdagangan di Hong Kong. Kesempatan pertama untuk itu adalah Senin, 23 November, pukul 09.30 waktu Hong Kong.
Penurunan pada hari Jumat terjadi setelah Hong Kong tutup
Pada Jumat, 20 November 2026, S&P 500 turun 3,70% menjadi 6.910,39 dan Nasdaq Composite turun 5,28% menjadi 22.617,73, menurut laporan penutupan Xinhua. Sektor teknologi menjadi sektor dengan kinerja terburuk, turun 7,11%.
Hong Kong sudah menutup pekannya saat itu. Indeks Hang Seng ditutup turun 1,89% ke 22.410,80 pada Jumat sore, sementara Indeks Hang Seng Tech turun 3,8% ke 3.511, lapor RTHK.
Hang Seng ditutup pukul 16.00 waktu Hong Kong. Saat itu pukul 03.00 di New York, enam setengah jam sebelum pasar AS dibuka. Jadi, penurunan 1,89% di Hong Kong pada Jumat merupakan reaksi terhadap perdagangan AS pada Kamis, saat S&P 500 turun 2,02%. Penurunan 3,70% pada Jumat sama sekali belum tercermin dalam perdagangan di Hong Kong. Kesempatan pertama untuk itu adalah Senin, 23 November, pukul 09.30 waktu Hong Kong.
SPY+0,41%
EWHETF-2,49%
292


·
--
Sebagian Benar
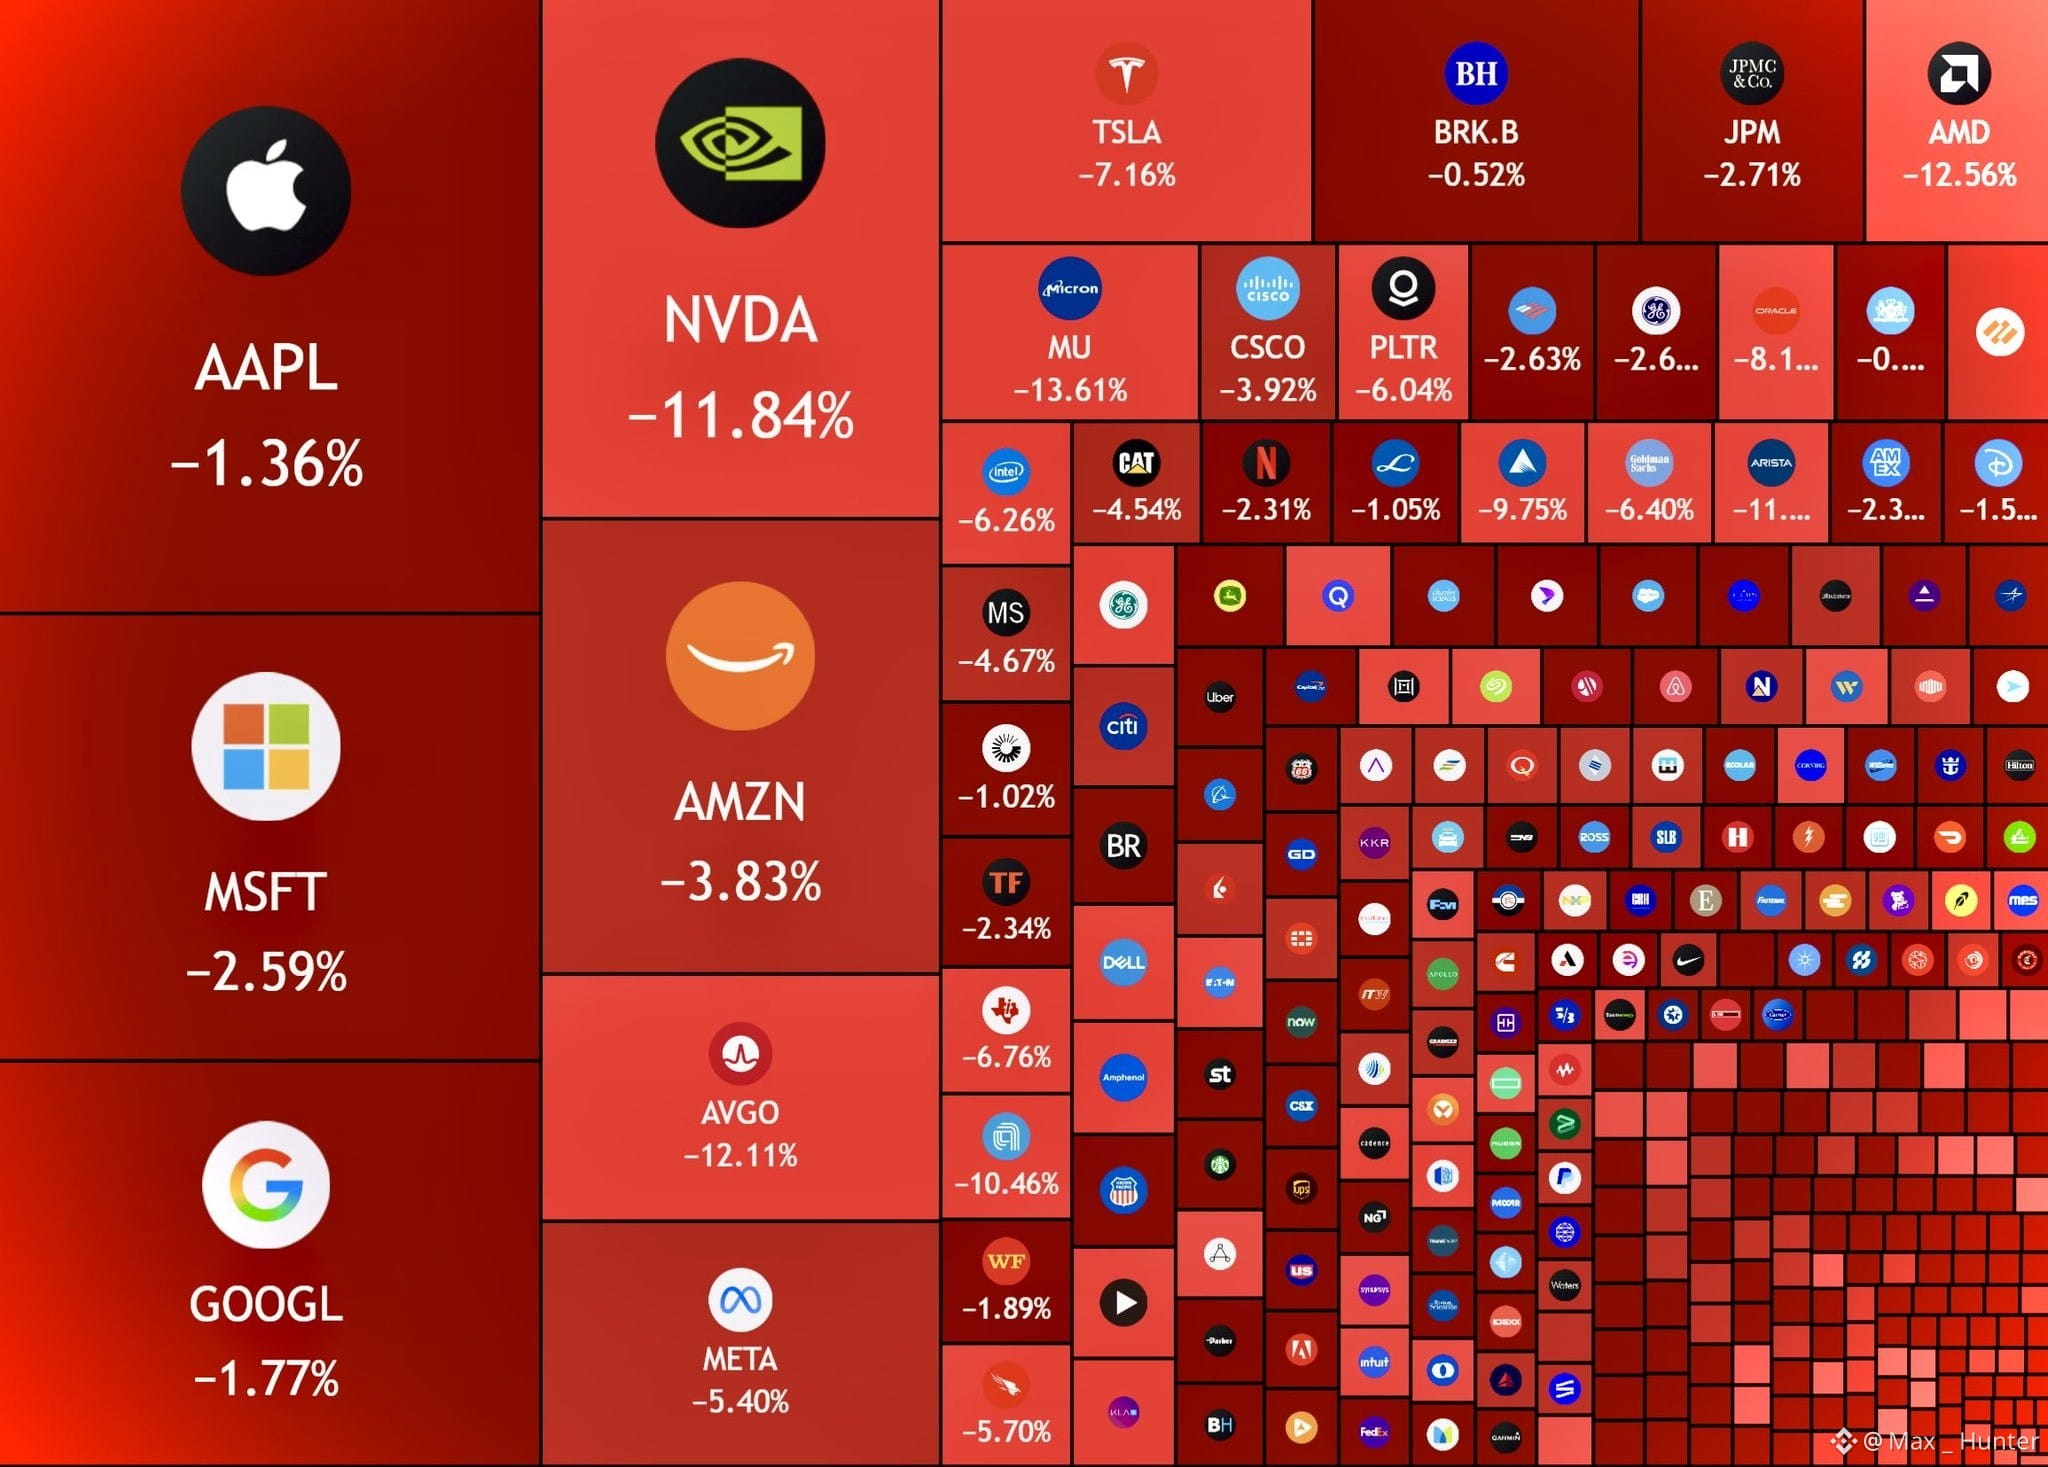
🚨 KEKAYAAN BESAR-BESARAN LENYAP DI PASAR SAHAM AS! 🇺🇸
Angkanya semakin sulit untuk diabaikan.
Menurut angka yang beredar, sekitar $8,9 triliun telah lenyap dari pasar saham AS selama 45 hari terakhir, dengan tambahan $2,5 triliun dilaporkan lenyap hari ini saja.
Itu adalah nilai pasar yang sangat besar yang menghilang dalam waktu sangat singkat.
Hal ini menimbulkan pertanyaan yang lebih besar: Apakah ini sekadar koreksi sementara, atau para investor mulai memikirkan kembali eksposur mereka terhadap pasar keuangan tradisional?
Ketika ketidakpastian meningkat, kepercayaan menjadi sama pentingnya dengan modal. Beberapa minggu ke depan dapat menunjukkan apakah tekanan ini hanya berlangsung singkat atau merupakan bagian dari pergeseran sentimen pasar yang lebih mendalam.
Satu hal yang jelas: pasar keuangan perlu dicermati dengan saksama saat ini. 👀
Apakah ini koreksi yang normal atau sesuatu yang jauh lebih besar?
#StockMarket #USStocks #breakingnews s#Crypto #MarketUpdate
🚨 KEKAYAAN BESAR-BESARAN LENYAP DI PASAR SAHAM AS! 🇺🇸
Angkanya semakin sulit untuk diabaikan.
Menurut angka yang beredar, sekitar $8,9 triliun telah lenyap dari pasar saham AS selama 45 hari terakhir, dengan tambahan $2,5 triliun dilaporkan lenyap hari ini saja.
Itu adalah nilai pasar yang sangat besar yang menghilang dalam waktu sangat singkat.
Hal ini menimbulkan pertanyaan yang lebih besar: Apakah ini sekadar koreksi sementara, atau para investor mulai memikirkan kembali eksposur mereka terhadap pasar keuangan tradisional?
Ketika ketidakpastian meningkat, kepercayaan menjadi sama pentingnya dengan modal. Beberapa minggu ke depan dapat menunjukkan apakah tekanan ini hanya berlangsung singkat atau merupakan bagian dari pergeseran sentimen pasar yang lebih mendalam.
Satu hal yang jelas: pasar keuangan perlu dicermati dengan saksama saat ini. 👀
Apakah ini koreksi yang normal atau sesuatu yang jauh lebih besar?
#StockMarket #USStocks #breakingnews s#Crypto #MarketUpdate
Angkanya semakin sulit untuk diabaikan.
Menurut angka yang beredar, sekitar $8,9 triliun telah lenyap dari pasar saham AS selama 45 hari terakhir, dengan tambahan $2,5 triliun dilaporkan lenyap hari ini saja.
Itu adalah nilai pasar yang sangat besar yang menghilang dalam waktu sangat singkat.
Hal ini menimbulkan pertanyaan yang lebih besar: Apakah ini sekadar koreksi sementara, atau para investor mulai memikirkan kembali eksposur mereka terhadap pasar keuangan tradisional?
Ketika ketidakpastian meningkat, kepercayaan menjadi sama pentingnya dengan modal. Beberapa minggu ke depan dapat menunjukkan apakah tekanan ini hanya berlangsung singkat atau merupakan bagian dari pergeseran sentimen pasar yang lebih mendalam.
Satu hal yang jelas: pasar keuangan perlu dicermati dengan saksama saat ini. 👀
Apakah ini koreksi yang normal atau sesuatu yang jauh lebih besar?
#StockMarket #USStocks #breakingnews s#Crypto #MarketUpdate
1.1k
·
--
Sebagian Benar
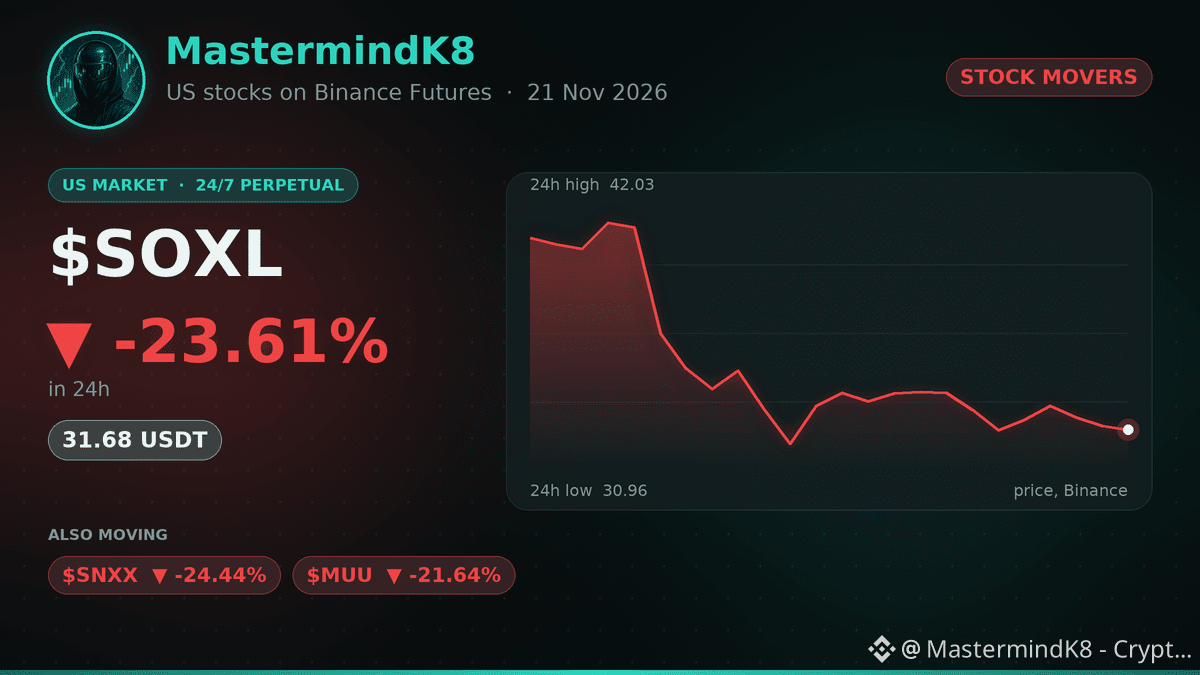
📉 $SOXL turun -23.61% dalam 24 jam 😬
Seorang trader mengurangi eksposurnya di SOXL, dengan alasan saham unggulan semikonduktor yang tertinggal dan penurunan nilai ETF, lalu beralih ke saham semikonduktor lainnya. ⚡
SOXL adalah ETF semikonduktor dengan leverage 3x, jadi pergerakannya beberapa kali lipat dari indeksnya.
SOXL diperdagangkan 24/7 di Binance Futures sebagai kontrak perpetual USDT. 🕒
Apakah pergerakan ini mengubah pandangan Anda terhadap ETF semikonduktor berleverage? 🤔
📊 Yang juga bergerak: $SNXX -24.44%, $MUU -21.64%
Ikuti saya untuk mengetahui saham AS yang bergerak setiap hari 🔔
#USStocks #TradFi #StockMarket
📉 $SOXL turun -23.61% dalam 24 jam 😬
Seorang trader mengurangi eksposurnya di SOXL, dengan alasan saham unggulan semikonduktor yang tertinggal dan penurunan nilai ETF, lalu beralih ke saham semikonduktor lainnya. ⚡
SOXL adalah ETF semikonduktor dengan leverage 3x, jadi pergerakannya beberapa kali lipat dari indeksnya.
SOXL diperdagangkan 24/7 di Binance Futures sebagai kontrak perpetual USDT. 🕒
Apakah pergerakan ini mengubah pandangan Anda terhadap ETF semikonduktor berleverage? 🤔
📊 Yang juga bergerak: $SNXX -24.44%, $MUU -21.64%
Ikuti saya untuk mengetahui saham AS yang bergerak setiap hari 🔔
#USStocks #TradFi #StockMarket
Seorang trader mengurangi eksposurnya di SOXL, dengan alasan saham unggulan semikonduktor yang tertinggal dan penurunan nilai ETF, lalu beralih ke saham semikonduktor lainnya. ⚡
SOXL adalah ETF semikonduktor dengan leverage 3x, jadi pergerakannya beberapa kali lipat dari indeksnya.
SOXL diperdagangkan 24/7 di Binance Futures sebagai kontrak perpetual USDT. 🕒
Apakah pergerakan ini mengubah pandangan Anda terhadap ETF semikonduktor berleverage? 🤔
📊 Yang juga bergerak: $SNXX -24.44%, $MUU -21.64%
Ikuti saya untuk mengetahui saham AS yang bergerak setiap hari 🔔
#USStocks #TradFi #StockMarket
1
1k

Kondisi pasar terkuat menggabungkan kinerja, partisipasi, dan keberlanjutan pergerakan.
Saham — Kinerja & Tren Teratas:
$WMT | $CVX | $XOM | AAPL | LLY | DIS | MSFT | GOOGL | NFLX | BA
Analisis WPO:
Walmart memimpin kelompok saham likuid dengan kenaikan +1.51% pada sesi pemantauan terbaru dan penurunan -0.74% selama sampel lima sesi. 3 dari 5 saham teratas mencatat kenaikan, sehingga partisipasi pasar masih selektif. Kepemimpinan terbagi di antara kelompok teratas; volume mencapai 2.2x laju terbarunya.
Momentum dapat berbalik dengan cepat, jadi konfirmasi lebih penting daripada antusiasme.
#wpo_report #USStocks #RisetPasar
Kondisi pasar terkuat menggabungkan kinerja, partisipasi, dan keberlanjutan pergerakan.
Saham — Kinerja & Tren Teratas:
$WMT | $CVX | $XOM | AAPL | LLY | DIS | MSFT | GOOGL | NFLX | BA
Analisis WPO:
Walmart memimpin kelompok saham likuid dengan kenaikan +1.51% pada sesi pemantauan terbaru dan penurunan -0.74% selama sampel lima sesi. 3 dari 5 saham teratas mencatat kenaikan, sehingga partisipasi pasar masih selektif. Kepemimpinan terbagi di antara kelompok teratas; volume mencapai 2.2x laju terbarunya.
Momentum dapat berbalik dengan cepat, jadi konfirmasi lebih penting daripada antusiasme.
#wpo_report #USStocks #RisetPasar
Saham — Kinerja & Tren Teratas:
$WMT | $CVX | $XOM | AAPL | LLY | DIS | MSFT | GOOGL | NFLX | BA
Analisis WPO:
Walmart memimpin kelompok saham likuid dengan kenaikan +1.51% pada sesi pemantauan terbaru dan penurunan -0.74% selama sampel lima sesi. 3 dari 5 saham teratas mencatat kenaikan, sehingga partisipasi pasar masih selektif. Kepemimpinan terbagi di antara kelompok teratas; volume mencapai 2.2x laju terbarunya.
Momentum dapat berbalik dengan cepat, jadi konfirmasi lebih penting daripada antusiasme.
#wpo_report #USStocks #RisetPasar
251

·
--
Sebagian Benar
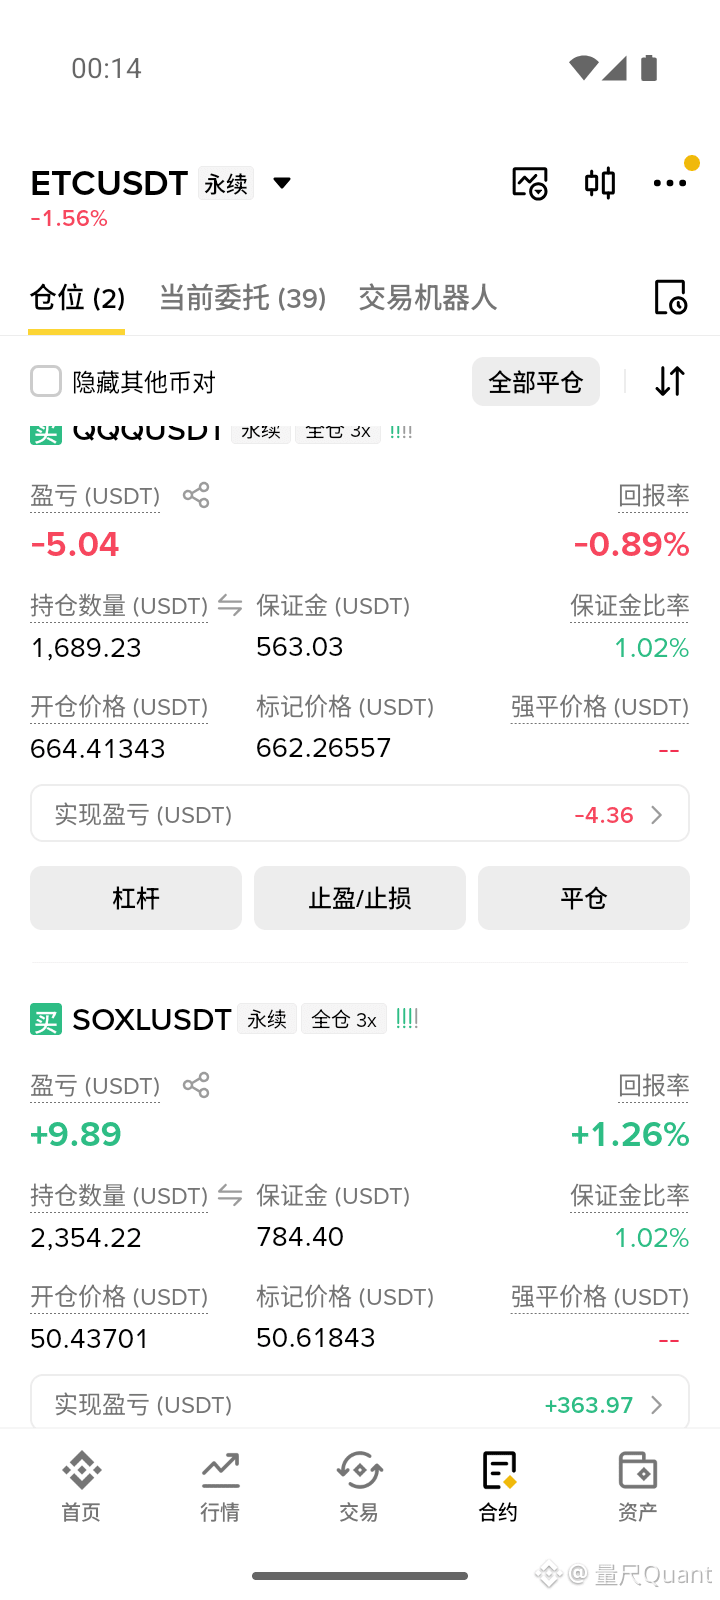
Kenaikan saham semikonduktor kali ini terus berlanjut. Strategi grid menjual sedikit demi sedikit saat harga naik, jadi saya sendiri tidak banyak turun tangan. Baru saja saya cek akun: posisi SOXL ini sudah merealisasikan keuntungan sebesar +363.97, sementara harga saat ini sebenarnya masih bergerak di sekitar harga modal. Jujur, makin jelas kenaikannya, makin saya tidak berani menambah posisi. Untuk posisi inti yang tersisa, saya tahan dulu; kalau harga turun kembali ke area modal, baru saya pertimbangkan untuk menambah. Kalau benar-benar menembus titik terendah sebelumnya, saya akan memangkas setengahnya dulu. Kalian yang berinvestasi di produk 3x, lebih memilih mengamankan keuntungan atau tetap bertahan untuk mengikuti tren? Catatan transaksi nyata · Hari ke-10 #Semiconductors #USStocks
Kenaikan saham semikonduktor kali ini terus berlanjut. Strategi grid menjual sedikit demi sedikit saat harga naik, jadi saya sendiri tidak banyak turun tangan. Baru saja saya cek akun: posisi SOXL ini sudah merealisasikan keuntungan sebesar +363.97, sementara harga saat ini sebenarnya masih bergerak di sekitar harga modal. Jujur, makin jelas kenaikannya, makin saya tidak berani menambah posisi. Untuk posisi inti yang tersisa, saya tahan dulu; kalau harga turun kembali ke area modal, baru saya pertimbangkan untuk menambah. Kalau benar-benar menembus titik terendah sebelumnya, saya akan memangkas setengahnya dulu. Kalian yang berinvestasi di produk 3x, lebih memilih mengamankan keuntungan atau tetap bertahan untuk mengikuti tren? Catatan transaksi nyata · Hari ke-10 #Semiconductors #USStocks
1.1k

·
--
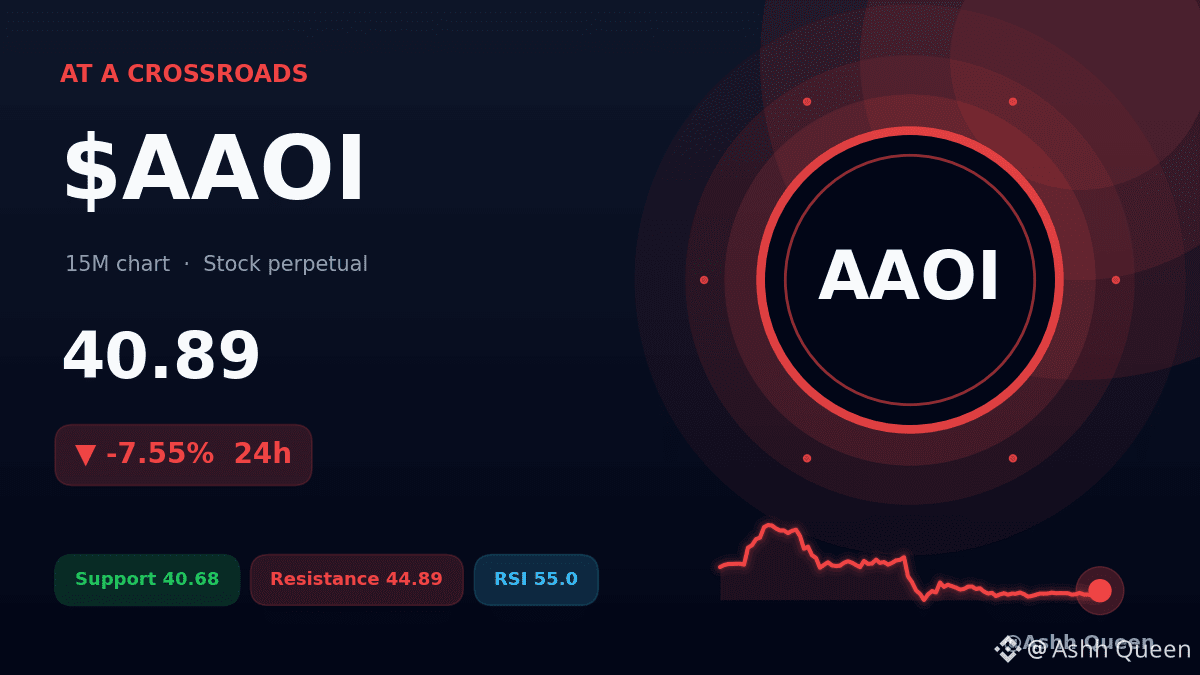
Satu level yang tidak boleh diabaikan trader $AAOI hari ini. ⚠️
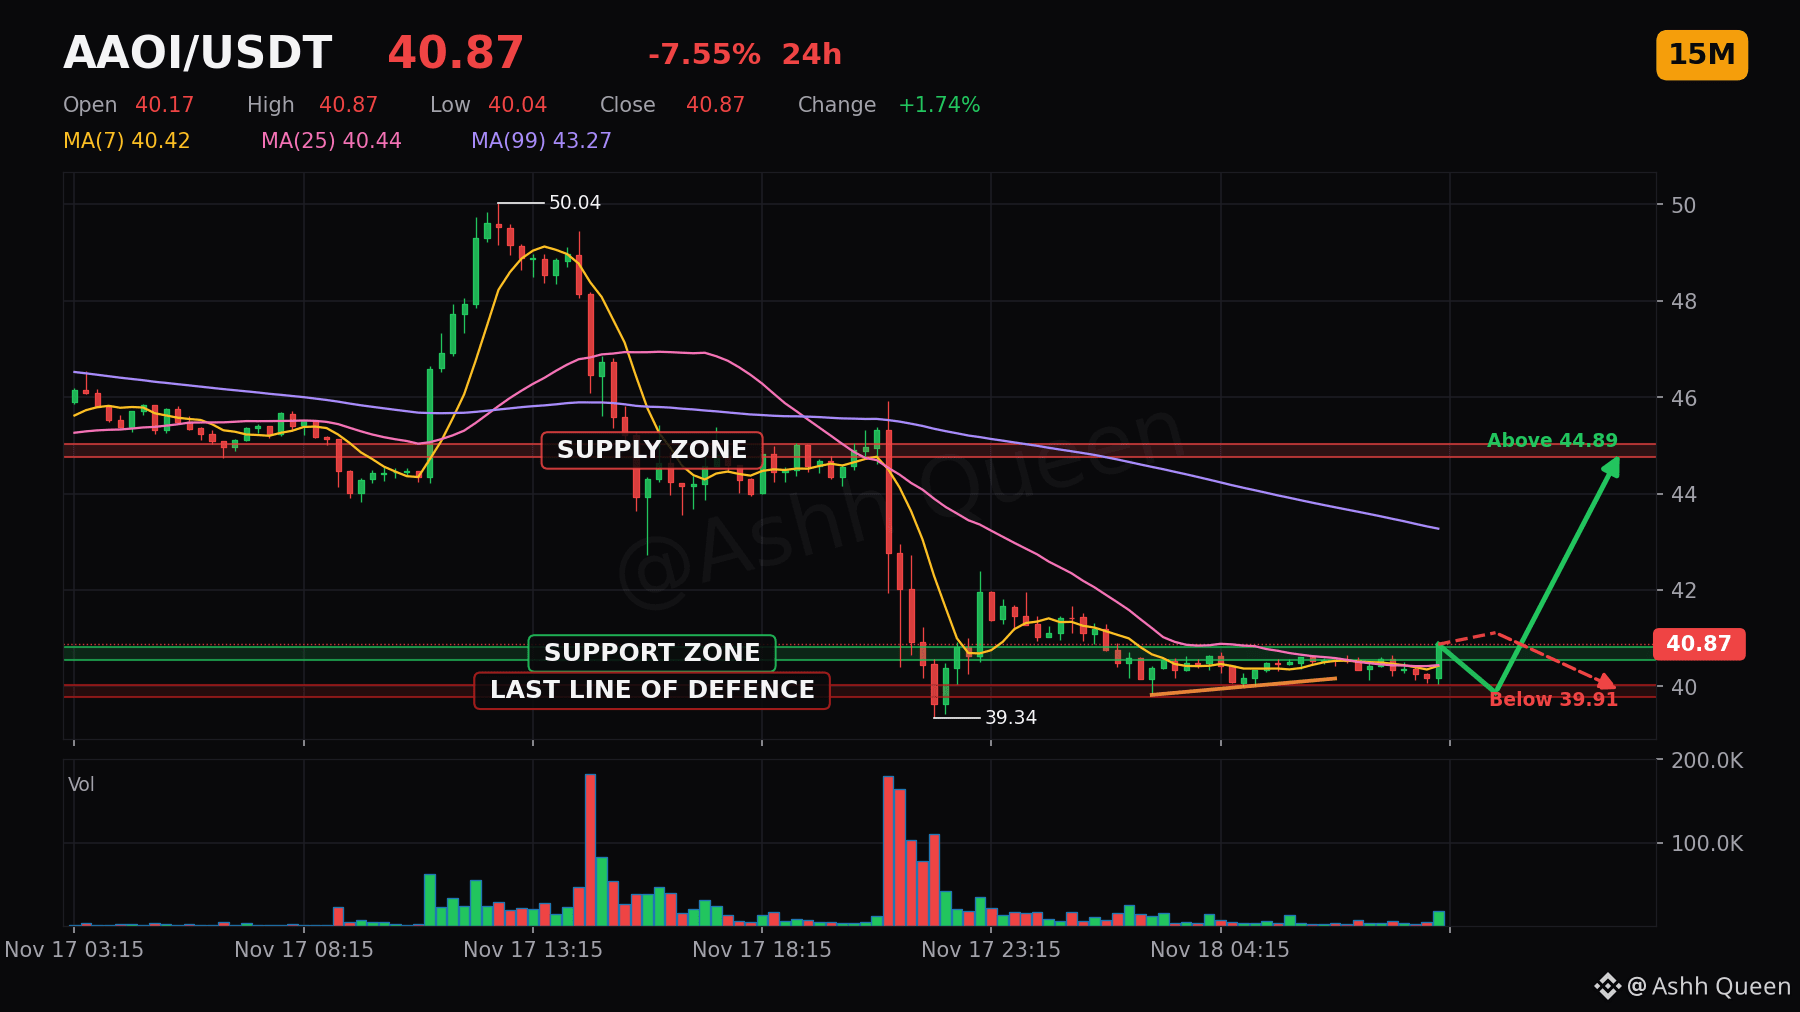
Kontrak perpetual ini mengalami PERGERAKAN sebesar +1.74% dalam satu jam terakhir, mendorong harga ke 40.89 pada grafik 15m. 🧐
Saat ini harga bertahan di atas VWAP di 40.67 dan EMA20 di 40.51, tetapi aset ini masih jauh di bawah EMA50 di 41.26. Jika support di 40.68 bertahan, kita mungkin mengincar resistance di 44.89. Jika ditembus, kemungkinan harga akan menguji kembali support di 39.91. 🛡️
Bagaimana Anda membaca pergeseran ini, dan indikator apa yang mendasari pandangan Anda?
#AAOI #USStocks #StockMarket #BinanceSquare
⚠️ Kontrak perpetual adalah derivatif berleverage, bukan saham atau komoditas itu sendiri.
Catatan risiko: leverage memperbesar kerugian. Rencanakan kapan keluar sebelum masuk.
Satu level yang tidak boleh diabaikan trader $AAOI hari ini. ⚠️
Kontrak perpetual ini mengalami PERGERAKAN sebesar +1.74% dalam satu jam terakhir, mendorong harga ke 40.89 pada grafik 15m. 🧐
Saat ini harga bertahan di atas VWAP di 40.67 dan EMA20 di 40.51, tetapi aset ini masih jauh di bawah EMA50 di 41.26. Jika support di 40.68 bertahan, kita mungkin mengincar resistance di 44.89. Jika ditembus, kemungkinan harga akan menguji kembali support di 39.91. 🛡️
Bagaimana Anda membaca pergeseran ini, dan indikator apa yang mendasari pandangan Anda?
#AAOI #USStocks #StockMarket #BinanceSquare
⚠️ Kontrak perpetual adalah derivatif berleverage, bukan saham atau komoditas itu sendiri.
Catatan risiko: leverage memperbesar kerugian. Rencanakan kapan keluar sebelum masuk.
Kontrak perpetual ini mengalami PERGERAKAN sebesar +1.74% dalam satu jam terakhir, mendorong harga ke 40.89 pada grafik 15m. 🧐
Saat ini harga bertahan di atas VWAP di 40.67 dan EMA20 di 40.51, tetapi aset ini masih jauh di bawah EMA50 di 41.26. Jika support di 40.68 bertahan, kita mungkin mengincar resistance di 44.89. Jika ditembus, kemungkinan harga akan menguji kembali support di 39.91. 🛡️
Bagaimana Anda membaca pergeseran ini, dan indikator apa yang mendasari pandangan Anda?
#AAOI #USStocks #StockMarket #BinanceSquare
⚠️ Kontrak perpetual adalah derivatif berleverage, bukan saham atau komoditas itu sendiri.
Catatan risiko: leverage memperbesar kerugian. Rencanakan kapan keluar sebelum masuk.
4
·
--
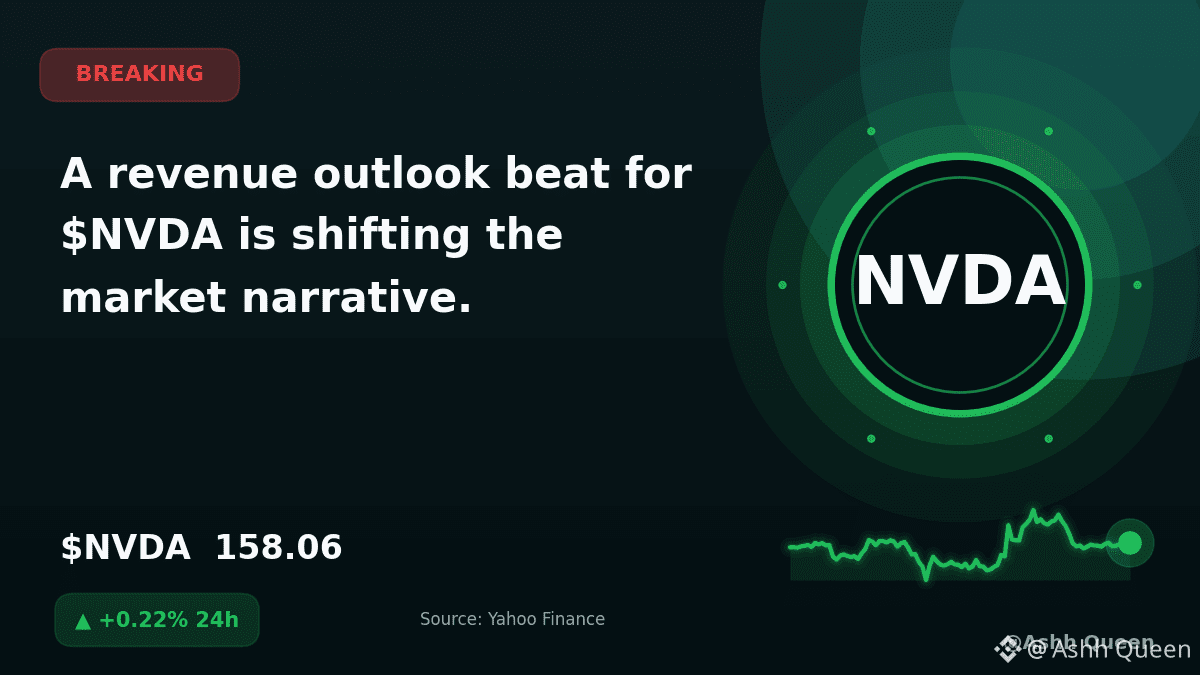
Prospek pendapatan yang melampaui perkiraan untuk $NVDA mengubah narasi pasar.
Menurut Yahoo Finance, kontrak berjangka saham AS bangkit kembali setelah perusahaan melaporkan hasil pendapatan yang lebih kuat dari perkiraan. Ini terjadi saat pasar yang lebih luas baru-baru ini mengalami kemunduran, dengan S&P 500 dan Nasdaq mencatat penurunan selama empat hari berturut-turut.
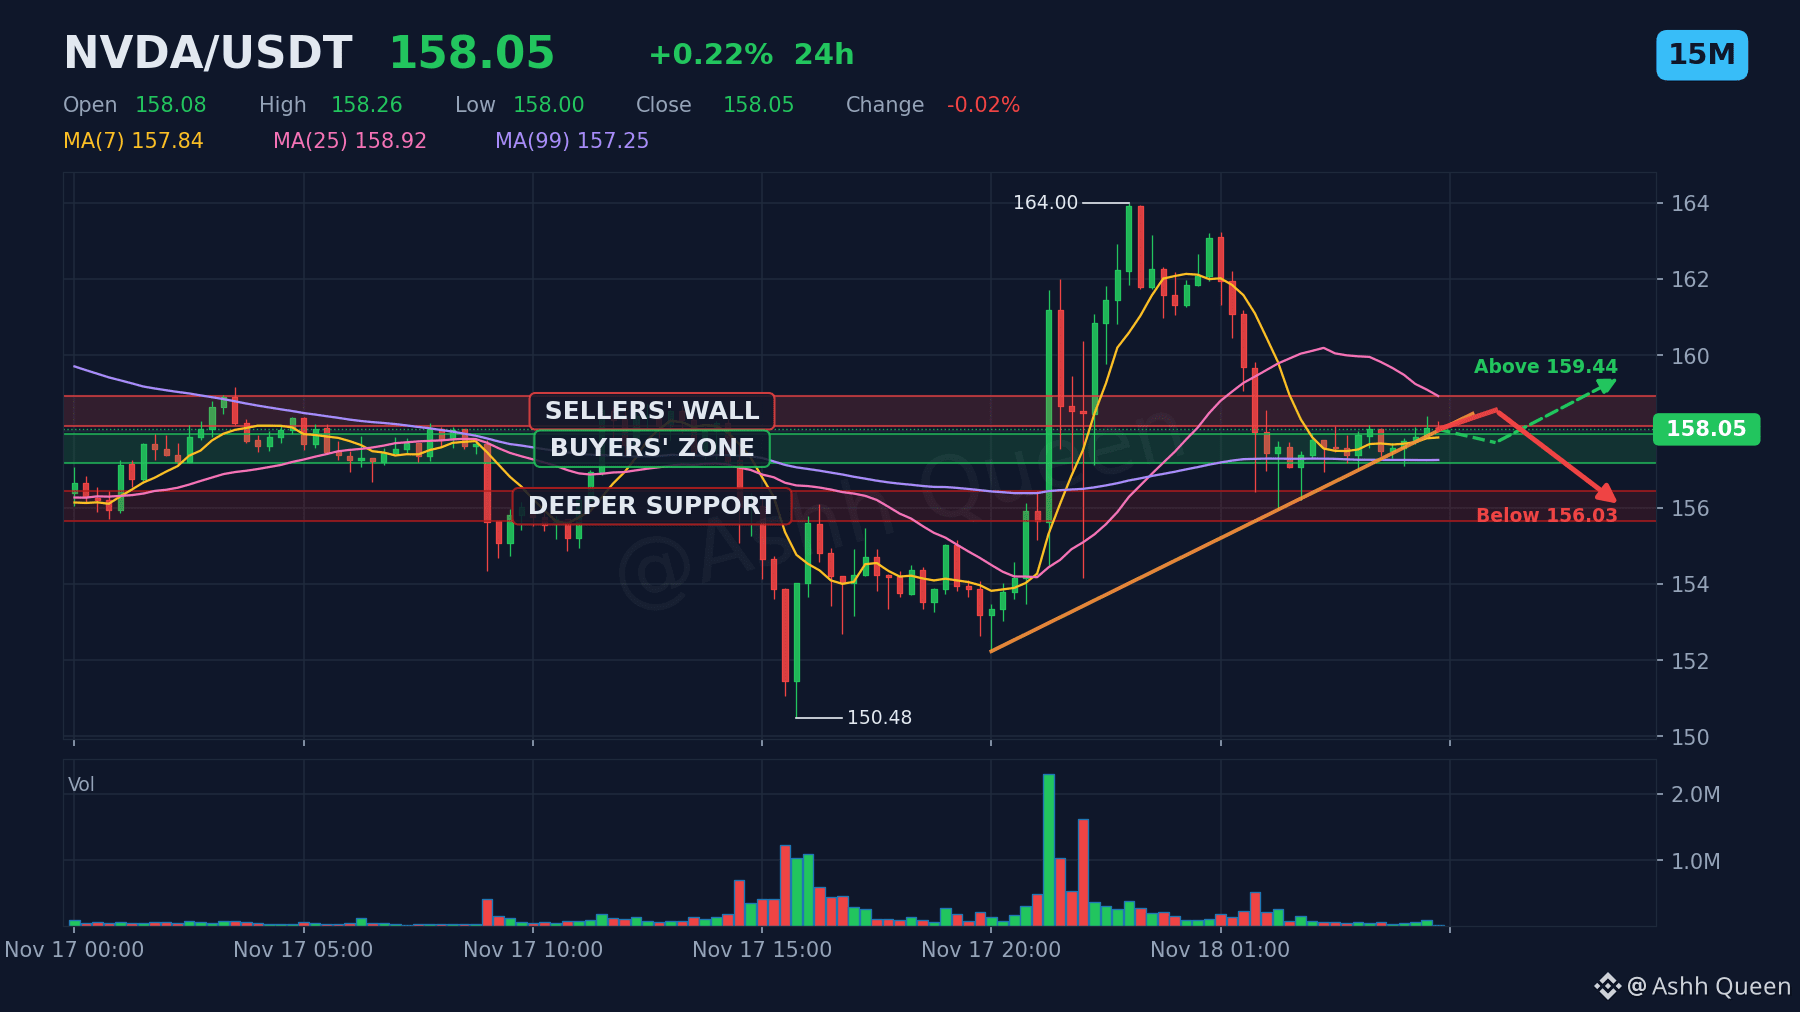
Kontrak perpetual $NVDA saat ini diperdagangkan pada harga 158.06, dengan perubahan 24 jam sebesar +0.22%. Aset ini bergerak di dekat level support 157.54 dan level resistance 158.53.
Menurut Anda, bagaimana laporan pendapatan ini akan memengaruhi sentimen sektor teknologi yang lebih luas dalam beberapa sesi mendatang? 🔥⚡🚀
#NVDA #USStocks #MarketNews
⚠️ Kontrak perpetual adalah derivatif dengan leverage, bukan saham atau komoditas itu sendiri.
Lakukan riset Anda sendiri (DYOR). Atur ukuran posisi dengan cermat dan jangan pernah bertransaksi dengan uang yang Anda tidak sanggup kehilangan.
Prospek pendapatan yang melampaui perkiraan untuk $NVDA mengubah narasi pasar.
Menurut Yahoo Finance, kontrak berjangka saham AS bangkit kembali setelah perusahaan melaporkan hasil pendapatan yang lebih kuat dari perkiraan. Ini terjadi saat pasar yang lebih luas baru-baru ini mengalami kemunduran, dengan S&P 500 dan Nasdaq mencatat penurunan selama empat hari berturut-turut.
Kontrak perpetual $NVDA saat ini diperdagangkan pada harga 158.06, dengan perubahan 24 jam sebesar +0.22%. Aset ini bergerak di dekat level support 157.54 dan level resistance 158.53.
Menurut Anda, bagaimana laporan pendapatan ini akan memengaruhi sentimen sektor teknologi yang lebih luas dalam beberapa sesi mendatang? 🔥⚡🚀
#NVDA #USStocks #MarketNews
⚠️ Kontrak perpetual adalah derivatif dengan leverage, bukan saham atau komoditas itu sendiri.
Lakukan riset Anda sendiri (DYOR). Atur ukuran posisi dengan cermat dan jangan pernah bertransaksi dengan uang yang Anda tidak sanggup kehilangan.
Menurut Yahoo Finance, kontrak berjangka saham AS bangkit kembali setelah perusahaan melaporkan hasil pendapatan yang lebih kuat dari perkiraan. Ini terjadi saat pasar yang lebih luas baru-baru ini mengalami kemunduran, dengan S&P 500 dan Nasdaq mencatat penurunan selama empat hari berturut-turut.
Kontrak perpetual $NVDA saat ini diperdagangkan pada harga 158.06, dengan perubahan 24 jam sebesar +0.22%. Aset ini bergerak di dekat level support 157.54 dan level resistance 158.53.
Menurut Anda, bagaimana laporan pendapatan ini akan memengaruhi sentimen sektor teknologi yang lebih luas dalam beberapa sesi mendatang? 🔥⚡🚀
#NVDA #USStocks #MarketNews
⚠️ Kontrak perpetual adalah derivatif dengan leverage, bukan saham atau komoditas itu sendiri.
Lakukan riset Anda sendiri (DYOR). Atur ukuran posisi dengan cermat dan jangan pernah bertransaksi dengan uang yang Anda tidak sanggup kehilangan.
6
·
--
Terverifikasi
Artikel
Lihat terjemahan
Nasdaq's Top Three "Gainers" on 17 Nov All Did Reverse Splits: What the Split-Adjusted Prices ShowDisclosure: It is not financial advice
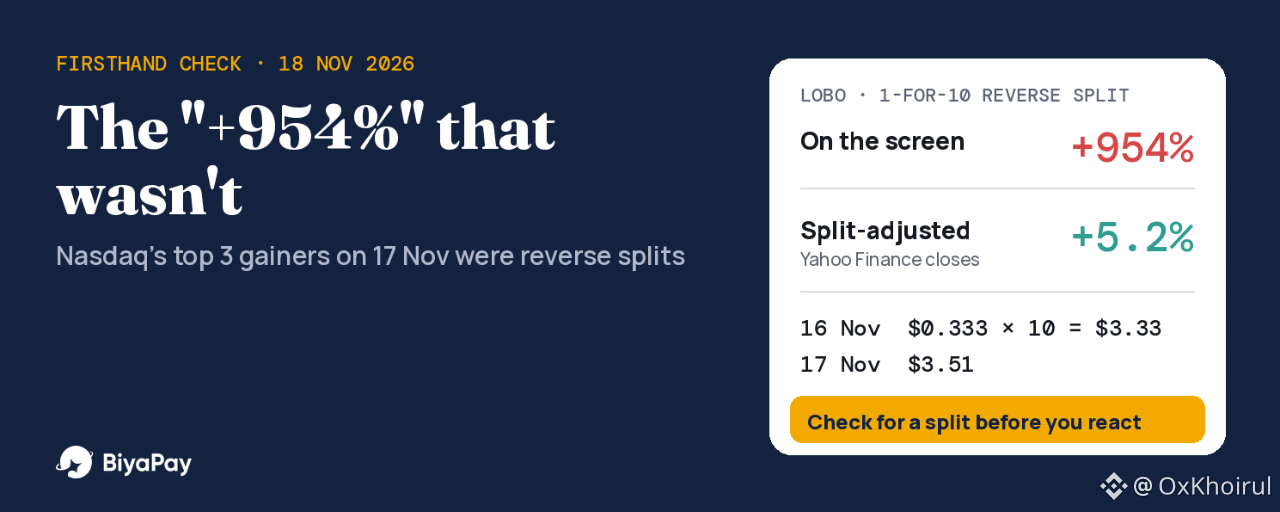
On Tuesday 17 November, Investing.com's market-close report listed the best performers on the Nasdaq Composite: Lobo Technologies (LOBO) up 954.08% to $3.51, Edible Garden (EDBL) up 384.31% to $2.47, and Forcendra (FCDH) up 366.39% to $2.56. If you saw that list on a quick scan, you could be forgiven for thinking three stocks had just tripled or better in a day.
I checked each one against company announcements and a split-adjusted price history. All three had done a reverse stock split that same week. None of them actually rose more than 6%. Two of them fell.
This is a screen problem, not a stock problem, and it matters because there is a mirror-image version coming this week for a very large company. I will get to that below.
What a reverse split does to the price on your screen
A reverse split combines shares. In a 1-for-10 split, ten old shares become one new share, and the price per share is multiplied by ten. The company is worth the same before and after; only the number of shares and the price per share change.
The trouble starts when a data feed compares today's post-split price with yesterday's pre-split close without adjusting it. A stock that was $0.33 yesterday and is $3.51 today looks like +954%. It is really $3.33 yesterday (after multiplying by 10) and $3.51 today.
The three names, checked
LOBO: 1-for-10 consolidation, effective 17 November (company release of 12 Nov and a Nasdaq Trader corporate-actions alert of 13 Nov). Shares outstanding went from 15,041,938 to about 1,504,194.EDBL: 1-for-5 reverse split, effective 12:01 a.m. ET on 17 November (company 8-K).FCDH: 1-for-5 reverse share split, effective 16 November, with split-adjusted trading from 17 November (company release of 13 Nov).
To get the real daily change, I did it two ways. First, I took the screen's own numbers: the implied prior close is the new price divided by (1 + the screen's percentage), then multiplied by the split ratio. Second, I compared Yahoo Finance's split-adjusted closes for 16 and 17 November.
LOBO: screen +954.08%. Implied prior close $0.333, adjusted to $3.33, so about +5.4%. Yahoo adjusted: $3.336 to $3.510, +5.2%.EDBL: screen +384.31%. Implied prior close $0.51, adjusted to $2.55, so about -3.1%. Yahoo adjusted: $2.649 to $2.470, -6.8%.FCDH: screen +366.39%. Implied prior close $0.549, adjusted to $2.74, so about -6.7%. Yahoo adjusted: $2.655 to $2.560, -3.6%.
The two methods disagree by a few points on EDBL and FCDH, which is what you would expect when two data vendors record slightly different closing prints for a thinly traded stock. They agree on the part that matters: single-digit moves, not triple-digit gains.
One more number puts it in perspective. LOBO has about 1.5 million shares after the split. At $3.51 that is a market value of roughly $5.3 million. Before the split it was 15.04 million shares at about $0.33, which is roughly $5.0 million. The company's size did not change by a factor of ten. The label on each share did.
Not every extreme number is an illusion
The same Investing.com report listed three big losers: Golden Heaven (GDHG) down 81.57% to $0.29, Cue Biopharma (CUE) down 79.93% to $2.83, and Scilex (SCLX) down 48.64% to $0.64. I checked Yahoo Finance's split records for those three and found no splits. Those moves look real. I did not research why they happened, so I will not guess.
That is the point of the check. A huge percentage is a reason to look, not a reason to conclude either way. Sometimes it is an artifact, and sometimes the stock really did lose most of its value in a day.
Why companies do reverse splits
SunPower (SPWR) is a current example. It announced a 1-for-35 reverse split effective at 4:01 p.m. ET on 17 November, with split-adjusted trading starting today, 18 November, and said the purpose is to regain compliance with the $1.00 minimum bid price on Nasdaq. Accuray said much the same about its 1-for-40 split on 9 November.
SPWR closed at $0.0968 on 17 November. Multiply by 35 and the equivalent post-split price is about $3.39. A screen that does not adjust would be able to show a gain of roughly 3,400% for a company whose value did not move because of the split. I expect to see that on some lists soon.
The forward split mirror image: Sandisk on 20 November
Forward splits do the opposite. Sandisk announced an 8-for-1 forward split, effective after the Nasdaq close on 19 November, with trading expected to begin on a split-adjusted basis when the market opens on 20 November. Its own FAQ says the price per share is expected to fall to one-eighth of the pre-split value, the number of shares will be multiplied by eight, and the total value of your holding stays equal.
SNDK closed at $797.24 on 17 November. Here is the arithmetic, using that close as an example (not a forecast of where it will trade):
100 shares at $797.24 = $79,724After the split: 800 shares at about $99.66 = $79,724Price per share change: -87.5%Value of your holding because of the split: $0
A platform or chart that does not adjust for the split would show an 87.5% one-day drop on 20 November. If you only glance at the percentage, it looks like a crash. It is not one.
Fractions are treated differently by different companies
This part is easy to miss. In the LOBO and EDBL announcements, fractional shares are rounded up to the next whole share. In SunPower's announcement, holders who would receive a fraction get a cash payment instead, based on the 17 November closing price.
Take 100 shares of SPWR. Divided by 35, that is 2.857 shares. Under cash-in-lieu you end up with 2 shares plus cash for the 0.857. Under a round-up rule like LOBO's 1-for-10, a holder of 7 shares would end up with 1 share, and a holder of 12 shares would end up with 2 (1.2 rounded up). Small holders are the ones affected, and the rule is set in each company's announcement, not by a general standard. Read the notice for how fractions are handled in your account.
Holding a split stock on BiyaPay
On BiyaPay, a split works the same way it does at the company level: the share count and the price per share in your position are adjusted, and the total market value stays the same. Using the Sandisk example, 100 SNDK shares at $797.24 become 800 shares at about $99.66 from 20 November, and the holding is still about $79,724.
Two things are worth doing around a split date. First, BiyaPay runs night, pre-market and after-hours sessions for US stocks (20:00–04:00, 04:00–09:30 and 16:00–20:00 ET), so the first split-adjusted prices can appear in a thin session before the regular open. A limit order keeps you from paying a wide spread there. Second, BiyaPay's minimum fee is $0.99 per order. On a small reverse-split name like LOBO at $3.51, 10 shares cost $35.10, so the minimum fee is about 2.8% of the trade before the stock moves at all.
My opinion
I treat any one-day move above about 100% as a question, not a signal. The first thing I check is whether there was a split or another corporate action, and the quickest places are the company's press release and the exchange's corporate-actions notices. Only after that do I look at the move itself.
The risk runs both ways. Reading an adjusted-away "gain" as momentum can pull you into a stock that actually fell that day. Reading Sandisk's split on 20 November as a collapse could push you to sell something whose value did not change because of the split.
When this applies, and when it does not
This applies to any stock that has a split or reverse split on the date you are looking at, and to screens, alerts and top-gainer lists that compare raw closing prices. It does not apply to a stock with no split on the calendar. For those, a move of that size is real, whatever caused it. It also says nothing about whether a split is good or bad for the company. A reverse split is often done because the price fell below an exchange's minimum, which is a fact about the past, not a prediction.
Checklist I use
If a move is above 100% in a day, search for the company's press release and the exchange's corporate-actions notice firstUse a split-adjusted chart, not a one-line percentageDo the math yourself: new price multiplied by the split ratio (reverse) or divided by it (forward), compared with yesterday's closeCompare market value before and after; it should not jump because of the splitRead how fractions are handled before you hold a small number of sharesAfter the effective date, check your own share count and cost price in your account. A split leaves the market cap unchanged; what you should see is a new share count and a new cost price that still add up to the same holding value
#BiyaPay #USStocks #StockSplit
Nasdaq's Top Three "Gainers" on 17 Nov All Did Reverse Splits: What the Split-Adjusted Prices Show
Disclosure: It is not financial advice
On Tuesday 17 November, Investing.com's market-close report listed the best performers on the Nasdaq Composite: Lobo Technologies (LOBO) up 954.08% to $3.51, Edible Garden (EDBL) up 384.31% to $2.47, and Forcendra (FCDH) up 366.39% to $2.56. If you saw that list on a quick scan, you could be forgiven for thinking three stocks had just tripled or better in a day.
I checked each one against company announcements and a split-adjusted price history. All three had done a reverse stock split that same week. None of them actually rose more than 6%. Two of them fell.
This is a screen problem, not a stock problem, and it matters because there is a mirror-image version coming this week for a very large company. I will get to that below.
What a reverse split does to the price on your screen
A reverse split combines shares. In a 1-for-10 split, ten old shares become one new share, and the price per share is multiplied by ten. The company is worth the same before and after; only the number of shares and the price per share change.
The trouble starts when a data feed compares today's post-split price with yesterday's pre-split close without adjusting it. A stock that was $0.33 yesterday and is $3.51 today looks like +954%. It is really $3.33 yesterday (after multiplying by 10) and $3.51 today.
The three names, checked
LOBO: 1-for-10 consolidation, effective 17 November (company release of 12 Nov and a Nasdaq Trader corporate-actions alert of 13 Nov). Shares outstanding went from 15,041,938 to about 1,504,194.EDBL: 1-for-5 reverse split, effective 12:01 a.m. ET on 17 November (company 8-K).FCDH: 1-for-5 reverse share split, effective 16 November, with split-adjusted trading from 17 November (company release of 13 Nov).
To get the real daily change, I did it two ways. First, I took the screen's own numbers: the implied prior close is the new price divided by (1 + the screen's percentage), then multiplied by the split ratio. Second, I compared Yahoo Finance's split-adjusted closes for 16 and 17 November.
LOBO: screen +954.08%. Implied prior close $0.333, adjusted to $3.33, so about +5.4%. Yahoo adjusted: $3.336 to $3.510, +5.2%.EDBL: screen +384.31%. Implied prior close $0.51, adjusted to $2.55, so about -3.1%. Yahoo adjusted: $2.649 to $2.470, -6.8%.FCDH: screen +366.39%. Implied prior close $0.549, adjusted to $2.74, so about -6.7%. Yahoo adjusted: $2.655 to $2.560, -3.6%.
The two methods disagree by a few points on EDBL and FCDH, which is what you would expect when two data vendors record slightly different closing prints for a thinly traded stock. They agree on the part that matters: single-digit moves, not triple-digit gains.
One more number puts it in perspective. LOBO has about 1.5 million shares after the split. At $3.51 that is a market value of roughly $5.3 million. Before the split it was 15.04 million shares at about $0.33, which is roughly $5.0 million. The company's size did not change by a factor of ten. The label on each share did.
Not every extreme number is an illusion
The same Investing.com report listed three big losers: Golden Heaven (GDHG) down 81.57% to $0.29, Cue Biopharma (CUE) down 79.93% to $2.83, and Scilex (SCLX) down 48.64% to $0.64. I checked Yahoo Finance's split records for those three and found no splits. Those moves look real. I did not research why they happened, so I will not guess.
That is the point of the check. A huge percentage is a reason to look, not a reason to conclude either way. Sometimes it is an artifact, and sometimes the stock really did lose most of its value in a day.
Why companies do reverse splits
SunPower (SPWR) is a current example. It announced a 1-for-35 reverse split effective at 4:01 p.m. ET on 17 November, with split-adjusted trading starting today, 18 November, and said the purpose is to regain compliance with the $1.00 minimum bid price on Nasdaq. Accuray said much the same about its 1-for-40 split on 9 November.
SPWR closed at $0.0968 on 17 November. Multiply by 35 and the equivalent post-split price is about $3.39. A screen that does not adjust would be able to show a gain of roughly 3,400% for a company whose value did not move because of the split. I expect to see that on some lists soon.
The forward split mirror image: Sandisk on 20 November
Forward splits do the opposite. Sandisk announced an 8-for-1 forward split, effective after the Nasdaq close on 19 November, with trading expected to begin on a split-adjusted basis when the market opens on 20 November. Its own FAQ says the price per share is expected to fall to one-eighth of the pre-split value, the number of shares will be multiplied by eight, and the total value of your holding stays equal.
SNDK closed at $797.24 on 17 November. Here is the arithmetic, using that close as an example (not a forecast of where it will trade):
100 shares at $797.24 = $79,724After the split: 800 shares at about $99.66 = $79,724Price per share change: -87.5%Value of your holding because of the split: $0
A platform or chart that does not adjust for the split would show an 87.5% one-day drop on 20 November. If you only glance at the percentage, it looks like a crash. It is not one.
Fractions are treated differently by different companies
This part is easy to miss. In the LOBO and EDBL announcements, fractional shares are rounded up to the next whole share. In SunPower's announcement, holders who would receive a fraction get a cash payment instead, based on the 17 November closing price.
Take 100 shares of SPWR. Divided by 35, that is 2.857 shares. Under cash-in-lieu you end up with 2 shares plus cash for the 0.857. Under a round-up rule like LOBO's 1-for-10, a holder of 7 shares would end up with 1 share, and a holder of 12 shares would end up with 2 (1.2 rounded up). Small holders are the ones affected, and the rule is set in each company's announcement, not by a general standard. Read the notice for how fractions are handled in your account.
Holding a split stock on BiyaPay
On BiyaPay, a split works the same way it does at the company level: the share count and the price per share in your position are adjusted, and the total market value stays the same. Using the Sandisk example, 100 SNDK shares at $797.24 become 800 shares at about $99.66 from 20 November, and the holding is still about $79,724.
Two things are worth doing around a split date. First, BiyaPay runs night, pre-market and after-hours sessions for US stocks (20:00–04:00, 04:00–09:30 and 16:00–20:00 ET), so the first split-adjusted prices can appear in a thin session before the regular open. A limit order keeps you from paying a wide spread there. Second, BiyaPay's minimum fee is $0.99 per order. On a small reverse-split name like LOBO at $3.51, 10 shares cost $35.10, so the minimum fee is about 2.8% of the trade before the stock moves at all.
My opinion
I treat any one-day move above about 100% as a question, not a signal. The first thing I check is whether there was a split or another corporate action, and the quickest places are the company's press release and the exchange's corporate-actions notices. Only after that do I look at the move itself.
The risk runs both ways. Reading an adjusted-away "gain" as momentum can pull you into a stock that actually fell that day. Reading Sandisk's split on 20 November as a collapse could push you to sell something whose value did not change because of the split.
When this applies, and when it does not
This applies to any stock that has a split or reverse split on the date you are looking at, and to screens, alerts and top-gainer lists that compare raw closing prices. It does not apply to a stock with no split on the calendar. For those, a move of that size is real, whatever caused it. It also says nothing about whether a split is good or bad for the company. A reverse split is often done because the price fell below an exchange's minimum, which is a fact about the past, not a prediction.
Checklist I use
If a move is above 100% in a day, search for the company's press release and the exchange's corporate-actions notice firstUse a split-adjusted chart, not a one-line percentageDo the math yourself: new price multiplied by the split ratio (reverse) or divided by it (forward), compared with yesterday's closeCompare market value before and after; it should not jump because of the splitRead how fractions are handled before you hold a small number of sharesAfter the effective date, check your own share count and cost price in your account. A split leaves the market cap unchanged; what you should see is a new share count and a new cost price that still add up to the same holding value
#BiyaPay #USStocks #StockSplit
On Tuesday 17 November, Investing.com's market-close report listed the best performers on the Nasdaq Composite: Lobo Technologies (LOBO) up 954.08% to $3.51, Edible Garden (EDBL) up 384.31% to $2.47, and Forcendra (FCDH) up 366.39% to $2.56. If you saw that list on a quick scan, you could be forgiven for thinking three stocks had just tripled or better in a day.
I checked each one against company announcements and a split-adjusted price history. All three had done a reverse stock split that same week. None of them actually rose more than 6%. Two of them fell.
This is a screen problem, not a stock problem, and it matters because there is a mirror-image version coming this week for a very large company. I will get to that below.
What a reverse split does to the price on your screen
A reverse split combines shares. In a 1-for-10 split, ten old shares become one new share, and the price per share is multiplied by ten. The company is worth the same before and after; only the number of shares and the price per share change.
The trouble starts when a data feed compares today's post-split price with yesterday's pre-split close without adjusting it. A stock that was $0.33 yesterday and is $3.51 today looks like +954%. It is really $3.33 yesterday (after multiplying by 10) and $3.51 today.
The three names, checked
LOBO: 1-for-10 consolidation, effective 17 November (company release of 12 Nov and a Nasdaq Trader corporate-actions alert of 13 Nov). Shares outstanding went from 15,041,938 to about 1,504,194.EDBL: 1-for-5 reverse split, effective 12:01 a.m. ET on 17 November (company 8-K).FCDH: 1-for-5 reverse share split, effective 16 November, with split-adjusted trading from 17 November (company release of 13 Nov).
To get the real daily change, I did it two ways. First, I took the screen's own numbers: the implied prior close is the new price divided by (1 + the screen's percentage), then multiplied by the split ratio. Second, I compared Yahoo Finance's split-adjusted closes for 16 and 17 November.
LOBO: screen +954.08%. Implied prior close $0.333, adjusted to $3.33, so about +5.4%. Yahoo adjusted: $3.336 to $3.510, +5.2%.EDBL: screen +384.31%. Implied prior close $0.51, adjusted to $2.55, so about -3.1%. Yahoo adjusted: $2.649 to $2.470, -6.8%.FCDH: screen +366.39%. Implied prior close $0.549, adjusted to $2.74, so about -6.7%. Yahoo adjusted: $2.655 to $2.560, -3.6%.
The two methods disagree by a few points on EDBL and FCDH, which is what you would expect when two data vendors record slightly different closing prints for a thinly traded stock. They agree on the part that matters: single-digit moves, not triple-digit gains.
One more number puts it in perspective. LOBO has about 1.5 million shares after the split. At $3.51 that is a market value of roughly $5.3 million. Before the split it was 15.04 million shares at about $0.33, which is roughly $5.0 million. The company's size did not change by a factor of ten. The label on each share did.
Not every extreme number is an illusion
The same Investing.com report listed three big losers: Golden Heaven (GDHG) down 81.57% to $0.29, Cue Biopharma (CUE) down 79.93% to $2.83, and Scilex (SCLX) down 48.64% to $0.64. I checked Yahoo Finance's split records for those three and found no splits. Those moves look real. I did not research why they happened, so I will not guess.
That is the point of the check. A huge percentage is a reason to look, not a reason to conclude either way. Sometimes it is an artifact, and sometimes the stock really did lose most of its value in a day.
Why companies do reverse splits
SunPower (SPWR) is a current example. It announced a 1-for-35 reverse split effective at 4:01 p.m. ET on 17 November, with split-adjusted trading starting today, 18 November, and said the purpose is to regain compliance with the $1.00 minimum bid price on Nasdaq. Accuray said much the same about its 1-for-40 split on 9 November.
SPWR closed at $0.0968 on 17 November. Multiply by 35 and the equivalent post-split price is about $3.39. A screen that does not adjust would be able to show a gain of roughly 3,400% for a company whose value did not move because of the split. I expect to see that on some lists soon.
The forward split mirror image: Sandisk on 20 November
Forward splits do the opposite. Sandisk announced an 8-for-1 forward split, effective after the Nasdaq close on 19 November, with trading expected to begin on a split-adjusted basis when the market opens on 20 November. Its own FAQ says the price per share is expected to fall to one-eighth of the pre-split value, the number of shares will be multiplied by eight, and the total value of your holding stays equal.
SNDK closed at $797.24 on 17 November. Here is the arithmetic, using that close as an example (not a forecast of where it will trade):
100 shares at $797.24 = $79,724After the split: 800 shares at about $99.66 = $79,724Price per share change: -87.5%Value of your holding because of the split: $0
A platform or chart that does not adjust for the split would show an 87.5% one-day drop on 20 November. If you only glance at the percentage, it looks like a crash. It is not one.
Fractions are treated differently by different companies
This part is easy to miss. In the LOBO and EDBL announcements, fractional shares are rounded up to the next whole share. In SunPower's announcement, holders who would receive a fraction get a cash payment instead, based on the 17 November closing price.
Take 100 shares of SPWR. Divided by 35, that is 2.857 shares. Under cash-in-lieu you end up with 2 shares plus cash for the 0.857. Under a round-up rule like LOBO's 1-for-10, a holder of 7 shares would end up with 1 share, and a holder of 12 shares would end up with 2 (1.2 rounded up). Small holders are the ones affected, and the rule is set in each company's announcement, not by a general standard. Read the notice for how fractions are handled in your account.
Holding a split stock on BiyaPay
On BiyaPay, a split works the same way it does at the company level: the share count and the price per share in your position are adjusted, and the total market value stays the same. Using the Sandisk example, 100 SNDK shares at $797.24 become 800 shares at about $99.66 from 20 November, and the holding is still about $79,724.
Two things are worth doing around a split date. First, BiyaPay runs night, pre-market and after-hours sessions for US stocks (20:00–04:00, 04:00–09:30 and 16:00–20:00 ET), so the first split-adjusted prices can appear in a thin session before the regular open. A limit order keeps you from paying a wide spread there. Second, BiyaPay's minimum fee is $0.99 per order. On a small reverse-split name like LOBO at $3.51, 10 shares cost $35.10, so the minimum fee is about 2.8% of the trade before the stock moves at all.
My opinion
I treat any one-day move above about 100% as a question, not a signal. The first thing I check is whether there was a split or another corporate action, and the quickest places are the company's press release and the exchange's corporate-actions notices. Only after that do I look at the move itself.
The risk runs both ways. Reading an adjusted-away "gain" as momentum can pull you into a stock that actually fell that day. Reading Sandisk's split on 20 November as a collapse could push you to sell something whose value did not change because of the split.
When this applies, and when it does not
This applies to any stock that has a split or reverse split on the date you are looking at, and to screens, alerts and top-gainer lists that compare raw closing prices. It does not apply to a stock with no split on the calendar. For those, a move of that size is real, whatever caused it. It also says nothing about whether a split is good or bad for the company. A reverse split is often done because the price fell below an exchange's minimum, which is a fact about the past, not a prediction.
Checklist I use
If a move is above 100% in a day, search for the company's press release and the exchange's corporate-actions notice firstUse a split-adjusted chart, not a one-line percentageDo the math yourself: new price multiplied by the split ratio (reverse) or divided by it (forward), compared with yesterday's closeCompare market value before and after; it should not jump because of the splitRead how fractions are handled before you hold a small number of sharesAfter the effective date, check your own share count and cost price in your account. A split leaves the market cap unchanged; what you should see is a new share count and a new cost price that still add up to the same holding value
#BiyaPay #USStocks #StockSplit
SNDK+2,99%
FCDHUS+2,53%
2
2.1k

·
--
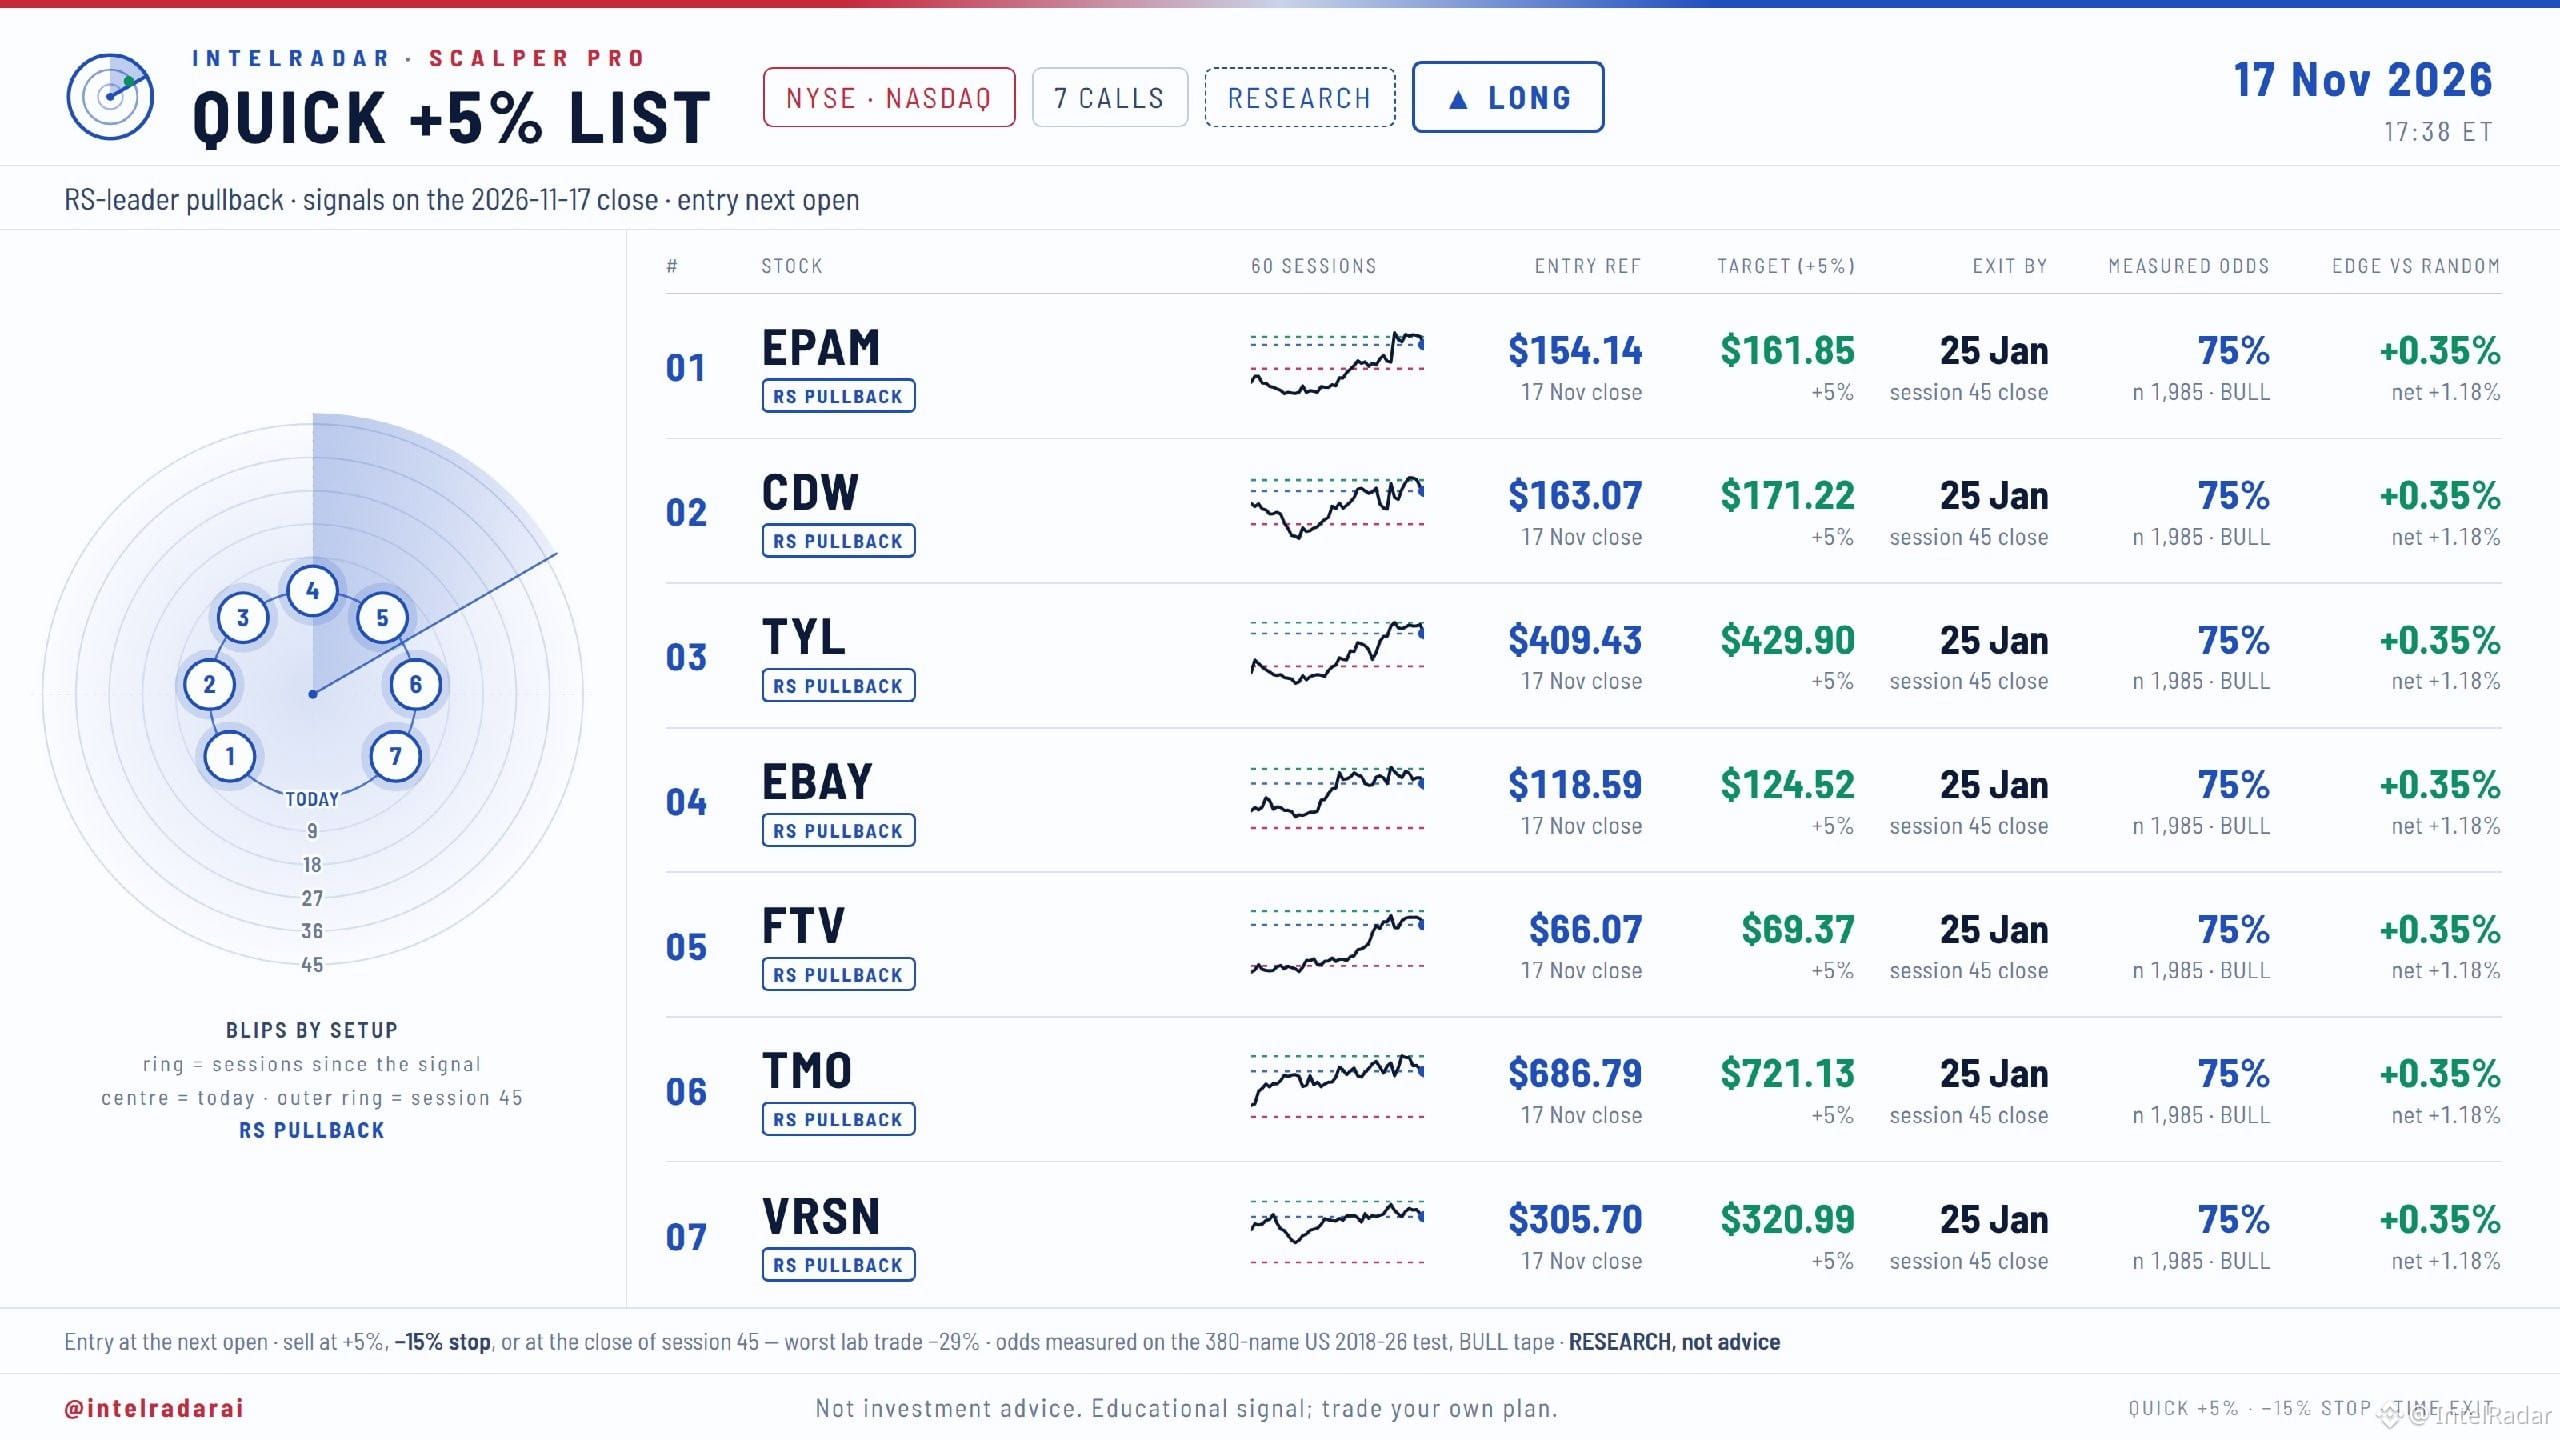
Daftar cepat +5% | Penutupan 17 Nov
Pullback saham pemimpin RS, 7 saham AS
Aturan:
Masuk saat pembukaan berikutnya
Target +5%
Stop -15%
Keluar berdasarkan waktu saat penutupan sesi ke-45 (25 Jan)
Acuan masuk → target:
$EPAM.US 154.14 → 161.85
$CDW.US 163.07 → 171.22
$TYL.US 409.43 → 429.90
$EBAY 118.59 → 124.52
$FTV 66.07 → 69.37
$TMO 686.79 → 721.13
$VRSN 305.70 → 320.99
Peluang berdasarkan pengujian historis (sama untuk semua 7 saham):
75% mencapai +5%
380 saham, 2018–26, pasar bullish
Transaksi terburuk dalam pengujian: -29%
Riset, bukan saran. Hasil pengujian historis, bukan hasil perdagangan langsung.
Mana yang akan Anda hindari, dan mengapa?
#Stocks #USStocks
Daftar cepat +5% | Penutupan 17 Nov
Pullback saham pemimpin RS, 7 saham AS
Aturan:
Masuk saat pembukaan berikutnya
Target +5%
Stop -15%
Keluar berdasarkan waktu saat penutupan sesi ke-45 (25 Jan)
Acuan masuk → target:
$EPAM.US 154.14 → 161.85
$CDW.US 163.07 → 171.22
$TYL.US 409.43 → 429.90
$EBAY 118.59 → 124.52
$FTV 66.07 → 69.37
$TMO 686.79 → 721.13
$VRSN 305.70 → 320.99
Peluang berdasarkan pengujian historis (sama untuk semua 7 saham):
75% mencapai +5%
380 saham, 2018–26, pasar bullish
Transaksi terburuk dalam pengujian: -29%
Riset, bukan saran. Hasil pengujian historis, bukan hasil perdagangan langsung.
Mana yang akan Anda hindari, dan mengapa?
#Stocks #USStocks
Pullback saham pemimpin RS, 7 saham AS
Aturan:
Masuk saat pembukaan berikutnya
Target +5%
Stop -15%
Keluar berdasarkan waktu saat penutupan sesi ke-45 (25 Jan)
Acuan masuk → target:
$EPAM.US 154.14 → 161.85
$CDW.US 163.07 → 171.22
$TYL.US 409.43 → 429.90
$EBAY 118.59 → 124.52
$FTV 66.07 → 69.37
$TMO 686.79 → 721.13
$VRSN 305.70 → 320.99
Peluang berdasarkan pengujian historis (sama untuk semua 7 saham):
75% mencapai +5%
380 saham, 2018–26, pasar bullish
Transaksi terburuk dalam pengujian: -29%
Riset, bukan saran. Hasil pengujian historis, bukan hasil perdagangan langsung.
Mana yang akan Anda hindari, dan mengapa?
#Stocks #USStocks
CDWUS-4,50%
EPAMUS-0,38%
TYLUS+0,06%
83
Momentum layak diperhatikan ketika beberapa kerangka waktu menunjukkan arah yang sama.
Saham — Kinerja & Tren Teratas:
$ARM | $AVGO | $CVX | XOM | WMT | RDDT | AAPL | AMZN | DIS | TSLA
Analisis WPO:
Arm memimpin kelompok saham likuid dengan kenaikan +4.76% pada sesi terbaru yang dipantau dan penurunan -7.30% selama sampel lima sesi. Sebanyak 3 dari 5 saham teratas menguat, sehingga penguatan pasar hanya terjadi pada saham tertentu. Kepemimpinan terbagi di antara kelompok teratas; volume mencapai 1.3x laju terbarunya.
Bandingkan pergerakan ini dengan berita perusahaan dan pasar yang lebih luas sebelum bertindak.
#wpo_report #USStocks #RisetPasar
Momentum layak diperhatikan ketika beberapa kerangka waktu menunjukkan arah yang sama.
Saham — Kinerja & Tren Teratas:
$ARM | $AVGO | $CVX | XOM | WMT | RDDT | AAPL | AMZN | DIS | TSLA
Analisis WPO:
Arm memimpin kelompok saham likuid dengan kenaikan +4.76% pada sesi terbaru yang dipantau dan penurunan -7.30% selama sampel lima sesi. Sebanyak 3 dari 5 saham teratas menguat, sehingga penguatan pasar hanya terjadi pada saham tertentu. Kepemimpinan terbagi di antara kelompok teratas; volume mencapai 1.3x laju terbarunya.
Bandingkan pergerakan ini dengan berita perusahaan dan pasar yang lebih luas sebelum bertindak.
#wpo_report #USStocks #RisetPasar
Saham — Kinerja & Tren Teratas:
$ARM | $AVGO | $CVX | XOM | WMT | RDDT | AAPL | AMZN | DIS | TSLA
Analisis WPO:
Arm memimpin kelompok saham likuid dengan kenaikan +4.76% pada sesi terbaru yang dipantau dan penurunan -7.30% selama sampel lima sesi. Sebanyak 3 dari 5 saham teratas menguat, sehingga penguatan pasar hanya terjadi pada saham tertentu. Kepemimpinan terbagi di antara kelompok teratas; volume mencapai 1.3x laju terbarunya.
Bandingkan pergerakan ini dengan berita perusahaan dan pasar yang lebih luas sebelum bertindak.
#wpo_report #USStocks #RisetPasar
216
·
--
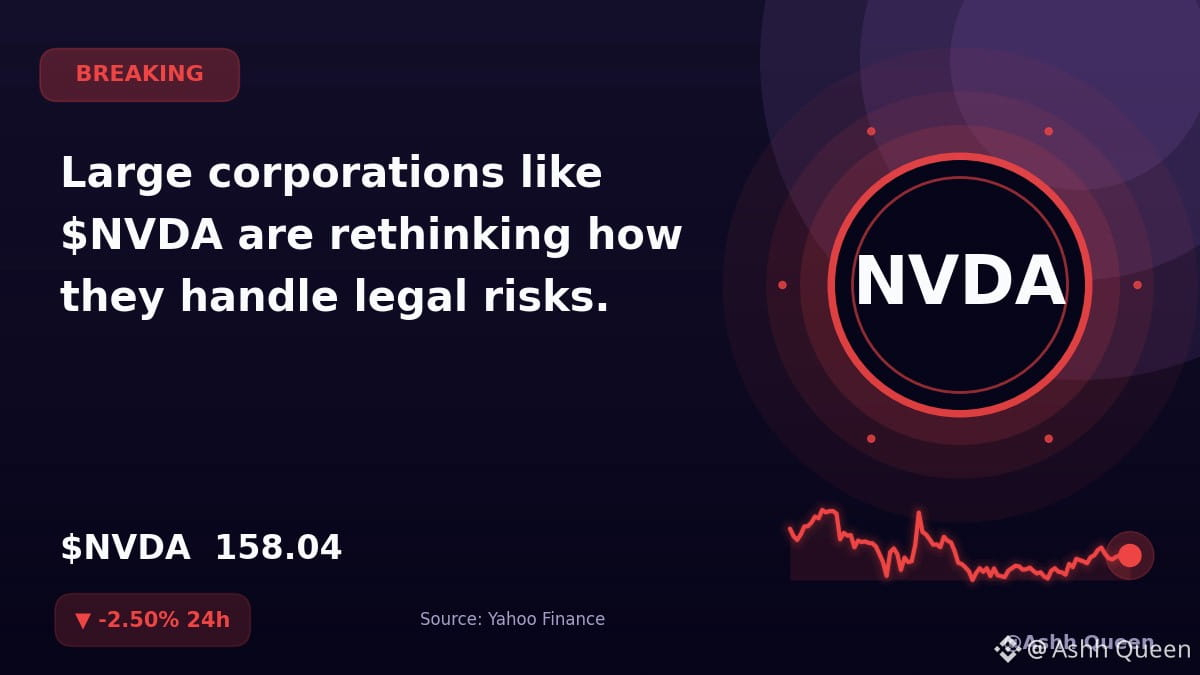
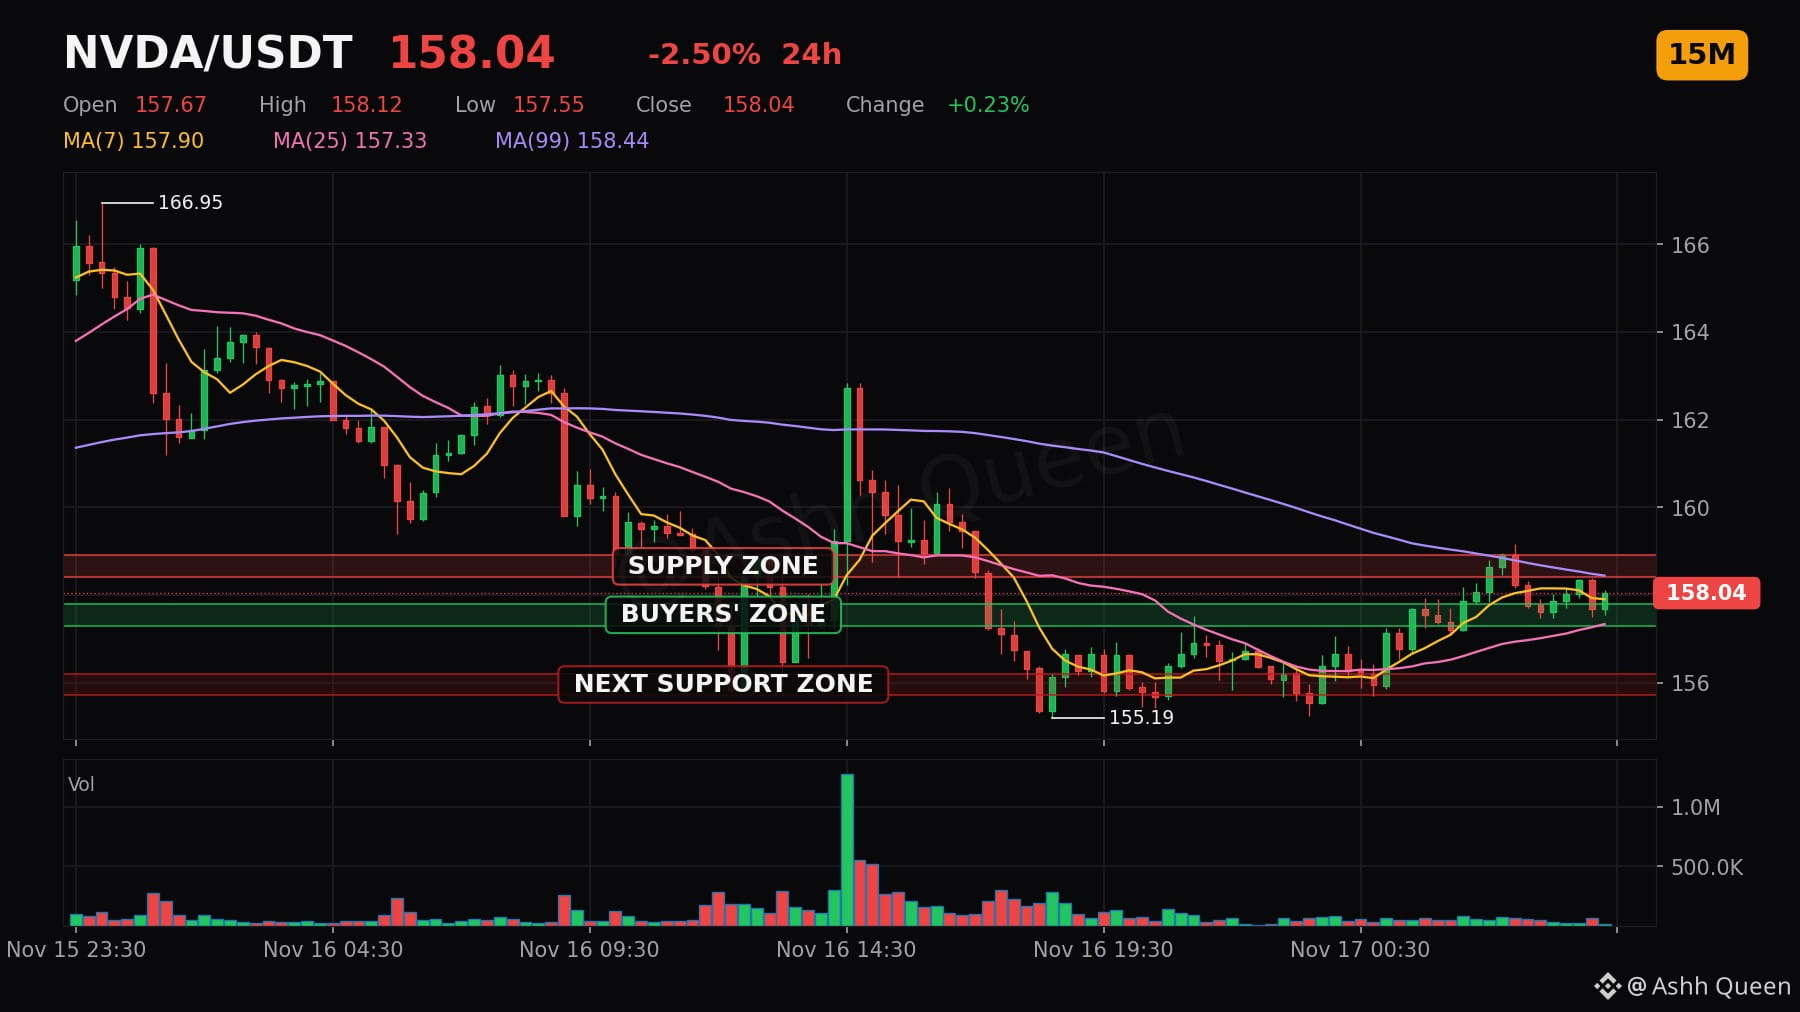
Perusahaan besar seperti $NVDA tengah memikirkan ulang cara mereka menangani risiko hukum.
Yahoo Finance melaporkan bahwa perusahaan tersebut memiliki asuransi direktur dan pejabat sebesar $900 juta, tetapi menangani gugatan pemegang saham perusahaan menggunakan cadangan kasnya sendiri.
Analis menyebut pendekatan ini sebagai strategi terukur bagi perusahaan dengan struktur permodalan seperti ini.
Kontrak perpetual $NVDA saat ini diperdagangkan di harga 158.04, turun -2.50% dalam 24 jam terakhir. Harganya bertahan di dekat level support 157.54.
Bagaimana Anda menyesuaikan strategi manajemen risiko saat menghadapi aset yang memiliki tantangan litigasi perusahaan yang unik? ⚔️🐂
#NVDA #NVDAStock #USStocks
⚠️ Kontrak perpetual adalah derivatif berleverage, bukan saham atau komoditas itu sendiri.
Ini bukan saran keuangan. Utamakan perlindungan modal Anda; peluang berikutnya pasti akan datang.
Perusahaan besar seperti $NVDA tengah memikirkan ulang cara mereka menangani risiko hukum.
Yahoo Finance melaporkan bahwa perusahaan tersebut memiliki asuransi direktur dan pejabat sebesar $900 juta, tetapi menangani gugatan pemegang saham perusahaan menggunakan cadangan kasnya sendiri.
Analis menyebut pendekatan ini sebagai strategi terukur bagi perusahaan dengan struktur permodalan seperti ini.
Kontrak perpetual $NVDA saat ini diperdagangkan di harga 158.04, turun -2.50% dalam 24 jam terakhir. Harganya bertahan di dekat level support 157.54.
Bagaimana Anda menyesuaikan strategi manajemen risiko saat menghadapi aset yang memiliki tantangan litigasi perusahaan yang unik? ⚔️🐂
#NVDA #NVDAStock #USStocks
⚠️ Kontrak perpetual adalah derivatif berleverage, bukan saham atau komoditas itu sendiri.
Ini bukan saran keuangan. Utamakan perlindungan modal Anda; peluang berikutnya pasti akan datang.
Yahoo Finance melaporkan bahwa perusahaan tersebut memiliki asuransi direktur dan pejabat sebesar $900 juta, tetapi menangani gugatan pemegang saham perusahaan menggunakan cadangan kasnya sendiri.
Analis menyebut pendekatan ini sebagai strategi terukur bagi perusahaan dengan struktur permodalan seperti ini.
Kontrak perpetual $NVDA saat ini diperdagangkan di harga 158.04, turun -2.50% dalam 24 jam terakhir. Harganya bertahan di dekat level support 157.54.
Bagaimana Anda menyesuaikan strategi manajemen risiko saat menghadapi aset yang memiliki tantangan litigasi perusahaan yang unik? ⚔️🐂
#NVDA #NVDAStock #USStocks
⚠️ Kontrak perpetual adalah derivatif berleverage, bukan saham atau komoditas itu sendiri.
Ini bukan saran keuangan. Utamakan perlindungan modal Anda; peluang berikutnya pasti akan datang.
7
·
--
Terverifikasi
Artikel
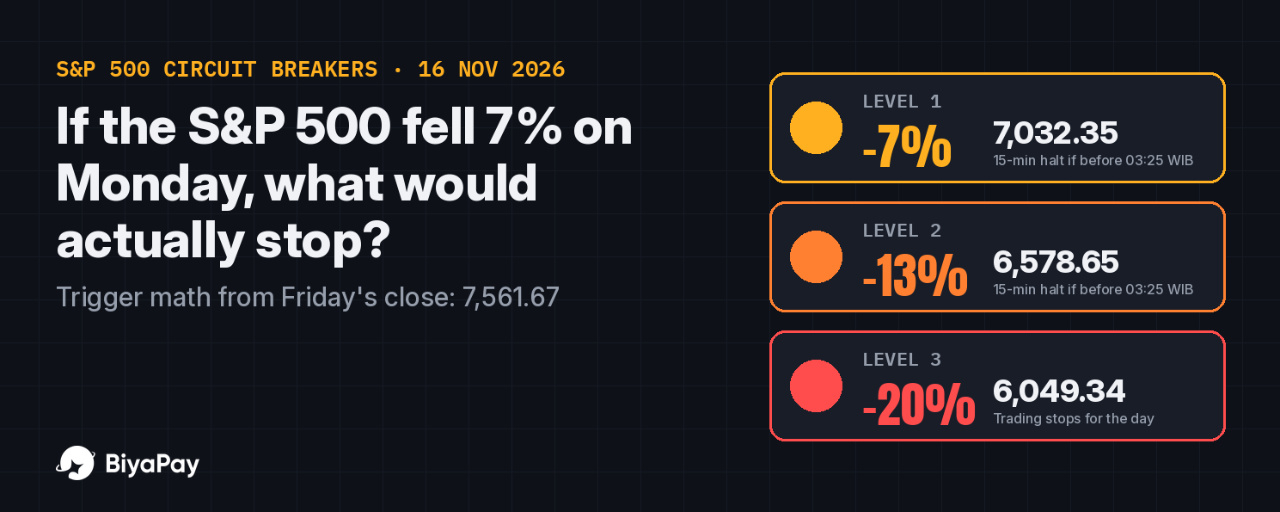
Jika S&P 500 Turun 7% pada Hari Senin, Apa yang Sebenarnya Akan Dihentikan? Perhitungan Pemutus Sirkuit pada Level 7.561Pernyataan: Ini bukan nasihat keuangan.
Hari Jumat menjadi pengingat bahwa "pasar naik sepanjang pekan" dan "layar saya terlihat tenang" adalah dua hal yang berbeda. Pada Jumat, 13 November 2026, S&P 500 turun 0,40% dan ditutup pada 7.561,67, Nasdaq Composite turun 0,91%, dan Philadelphia Semiconductor Index merosot 3,4%. Menurut Reuters, AMD turun 8,8% dan Broadcom 4,8% dalam satu sesi. VIX naik ke 19,35 (Anadolu Agency), imbal hasil obligasi Treasury 10 tahun berada di atas 5,1%, dan para pedagang memperhitungkan bahwa kenaikan suku bunga Fed pada Desember hampir pasti terjadi.
Jika S&P 500 Turun 7% pada Hari Senin, Apa yang Sebenarnya Akan Dihentikan? Perhitungan Pemutus Sirkuit pada Level 7.561
Pernyataan: Ini bukan nasihat keuangan.
Hari Jumat menjadi pengingat bahwa "pasar naik sepanjang pekan" dan "layar saya terlihat tenang" adalah dua hal yang berbeda. Pada Jumat, 13 November 2026, S&P 500 turun 0,40% dan ditutup pada 7.561,67, Nasdaq Composite turun 0,91%, dan Philadelphia Semiconductor Index merosot 3,4%. Menurut Reuters, AMD turun 8,8% dan Broadcom 4,8% dalam satu sesi. VIX naik ke 19,35 (Anadolu Agency), imbal hasil obligasi Treasury 10 tahun berada di atas 5,1%, dan para pedagang memperhitungkan bahwa kenaikan suku bunga Fed pada Desember hampir pasti terjadi.
Hari Jumat menjadi pengingat bahwa "pasar naik sepanjang pekan" dan "layar saya terlihat tenang" adalah dua hal yang berbeda. Pada Jumat, 13 November 2026, S&P 500 turun 0,40% dan ditutup pada 7.561,67, Nasdaq Composite turun 0,91%, dan Philadelphia Semiconductor Index merosot 3,4%. Menurut Reuters, AMD turun 8,8% dan Broadcom 4,8% dalam satu sesi. VIX naik ke 19,35 (Anadolu Agency), imbal hasil obligasi Treasury 10 tahun berada di atas 5,1%, dan para pedagang memperhitungkan bahwa kenaikan suku bunga Fed pada Desember hampir pasti terjadi.
596
Pergerakan pasar terkuat memadukan kinerja, partisipasi, dan keberlanjutan.
Saham — Kinerja & Tren Teratas:
$META | $CVX | $WMT | LLY | UBER | JPM | XOM | BAC | DIS | AAPL
Analisis WPO:
Meta Platforms memimpin saham-saham likuid dengan kenaikan +2.90% pada sesi pemantauan terbaru dan +0.58% selama sampel lima sesi. Kelima saham teratas mencatat kenaikan, sehingga penguatan pasar meluas. Kepemimpinan terbagi di antara kelompok teratas; volume mencapai 1.3x dari laju terkini.
Momentum dapat berbalik dengan cepat, jadi konfirmasi lebih penting daripada antusiasme.
#wpo_report #USStocks #RisetPasar
Pergerakan pasar terkuat memadukan kinerja, partisipasi, dan keberlanjutan.
Saham — Kinerja & Tren Teratas:
$META | $CVX | $WMT | LLY | UBER | JPM | XOM | BAC | DIS | AAPL
Analisis WPO:
Meta Platforms memimpin saham-saham likuid dengan kenaikan +2.90% pada sesi pemantauan terbaru dan +0.58% selama sampel lima sesi. Kelima saham teratas mencatat kenaikan, sehingga penguatan pasar meluas. Kepemimpinan terbagi di antara kelompok teratas; volume mencapai 1.3x dari laju terkini.
Momentum dapat berbalik dengan cepat, jadi konfirmasi lebih penting daripada antusiasme.
#wpo_report #USStocks #RisetPasar
Saham — Kinerja & Tren Teratas:
$META | $CVX | $WMT | LLY | UBER | JPM | XOM | BAC | DIS | AAPL
Analisis WPO:
Meta Platforms memimpin saham-saham likuid dengan kenaikan +2.90% pada sesi pemantauan terbaru dan +0.58% selama sampel lima sesi. Kelima saham teratas mencatat kenaikan, sehingga penguatan pasar meluas. Kepemimpinan terbagi di antara kelompok teratas; volume mencapai 1.3x dari laju terkini.
Momentum dapat berbalik dengan cepat, jadi konfirmasi lebih penting daripada antusiasme.
#wpo_report #USStocks #RisetPasar
224
·
--
Terverifikasi
Artikel
Lihat terjemahan
Five Stocks or One Index ETF? What Friday's Chip Sell-Off Means for a $1,000 AccountDisclosure: It is not financial advice
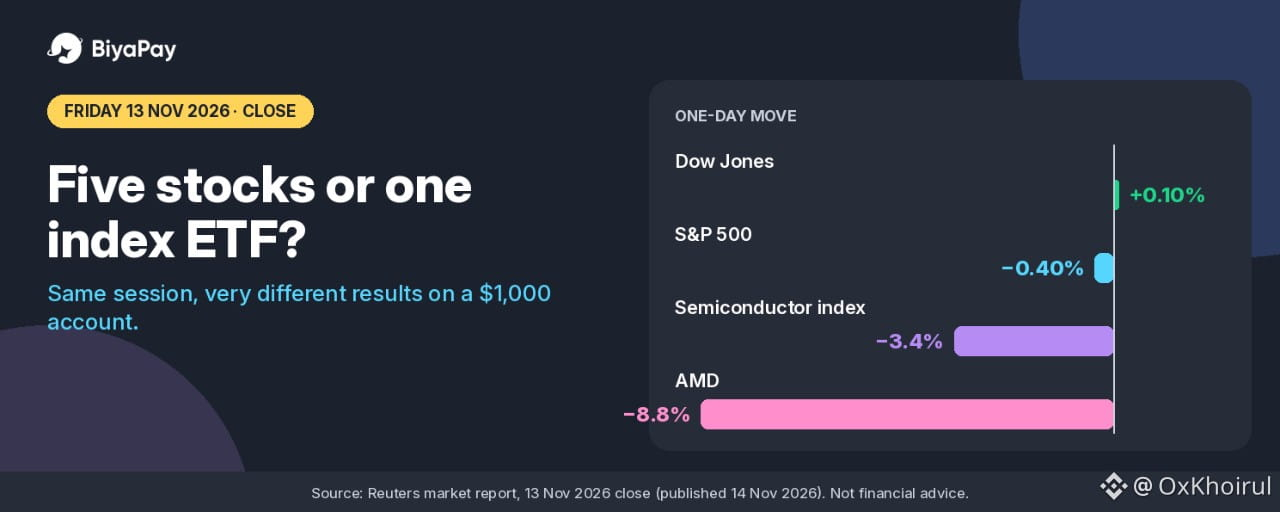
On Friday, 13 November 2026, the S&P 500 closed down 0.40 percent. On the same day, Advanced Micro Devices fell 8.8 percent, Broadcom fell 4.8 percent, and the Philadelphia Semiconductor Index fell 3.4 percent, according to Reuters. The Dow Jones Industrial Average actually closed 0.10 percent higher.
Same market, same session, very different results. The gap between those numbers is the whole argument of this article.
A common piece of advice for small accounts is "just split your money across five stocks and you are diversified." A second one is "buy one index ETF, it is always the cheaper choice." Friday's numbers, and the fee arithmetic on a 1,000 dollar account, suggest both claims are only half true.
This is a worked comparison using official and reputable figures, with a 1,000 dollar example that is an illustration, not a suggested order size.
What one session did to 1,000 dollars
Take 1,000 dollars and put it to work three different ways, using Friday's actual closing moves.
All of it in one chip stock that fell 8.8 percent: the position loses 88 dollars in one session.
Split into five equal 200 dollar positions, where one of them is that same stock and the other four are unchanged: the account loses 17.60 dollars, or 1.76 percent. The one bad position still hurts, but it is one fifth of the damage.
All of it tracking the S&P 500, which fell 0.40 percent: the account loses about 4 dollars, before any tracking difference or fund costs.
That middle case comes with a catch that is easy to miss. "Five stocks" only spreads risk if the five stocks do not all react to the same news. Five chip names are closer to one bet with five tickers. On Friday the semiconductor index as a whole fell 3.4 percent, which on 1,000 dollars is 34 dollars, more than eight times the S&P 500's move.
The index does not avoid chip stocks either
The opposite mistake is to think an index fund simply sidesteps a sector sell-off. It does not. It holds the sector at whatever weight the index gives it.
State Street's official page for the SPDR S&P 500 ETF Trust (SPY), with holdings as of 12 November 2026, lists the index weight of Nvidia at 6.15 percent and Broadcom at 2.65 percent. Information Technology is 36.15 percent of the index.
A rough contribution estimate: Nvidia fell 2 percent on Friday and Broadcom fell 4.8 percent, according to Reuters. At those weights, Nvidia's move takes about 0.12 percentage points off the index, and Broadcom's takes about 0.13 points. Together that is roughly 0.25 points of the index's 0.40 percent decline, from just two companies. Weights shift during the day, so treat this as an approximation, not an official attribution.
So the index ETF did not dodge Friday. It diluted it. That is a real difference, but it is not immunity. In a broad market decline the index falls too, and with 36 percent in technology, a tech-led sell-off reaches an index holder more than the word "diversified" suggests.
What order fees add to a $1,000 account
Here is where the "five stocks" approach has a cost that a 1,000 dollar account feels more than a large one.
On BiyaPay, US stock commission is 0 dollars, while the platform fee is 0.005 dollars per share, with a minimum of 0.99 dollars per order and a maximum of 1 percent of the transaction value. External institution fees, trading activity fees, and sell-related items are added on top of the platform fee. Some US stocks on BiyaPay support fractional trading: an order below one share is charged a 1 percent platform fee capped at 1 dollar, with no commission and no external institution fees.
On small orders the per-share calculation is usually below the minimum, so the 0.99 dollar minimum is what applies. On a 200 dollar order, 1 percent is 2 dollars, so the cap does not bring it lower. Using only that platform-fee minimum:
One order of 1,000 dollars: 0.99 dollars to buy, 1.98 dollars to buy and later sell. That is about 0.2 percent of the account for the round trip.
Five orders of 200 dollars: 4.95 dollars to buy, 9.90 dollars to buy and later sell. That is about 0.99 percent of the account, five times as much, before any external fees.
Now scale the same split to 10,000 dollars. If each order is still under 198 shares, so the per-share calculation stays below the minimum, five orders of 2,000 dollars still cost 9.90 dollars for a round trip, which is about 0.1 percent of the account. The fee did not change. The account size did.
The index ETF has its own cost, and it is a different kind. State Street lists SPY's gross expense ratio at 0.0945 percent a year, as of 14 November 2026. On 1,000 dollars that is about 0.95 dollars a year, taken inside the fund rather than charged per order. It is small, but it repeats every year you hold, while an order fee is paid once per trade.
There is one more practical detail. SPY closed at 757.12 dollars on 12 November 2026, according to State Street. A 1,000 dollar account can buy one whole share and has about 243 dollars left over, which is below one share and would be a fractional order.
So the choice is not only about risk. It is also about how many orders a 1,000 dollar account has to pay for.
When five single stocks make sense, and when they do not
Five single stocks can make sense when:
The account is large enough that the minimum fee is a small slice of each position. At 0.99 dollars per order, a 495 dollar position keeps the minimum at about 0.2 percent per side.
The five companies are genuinely different businesses that do not move on the same headline. A bank, a retailer, a drug maker, an energy company, and a software company spread risk. Five chip makers do not.
You actually want to avoid what the index is heavy in. With 36 percent of the S&P 500 in technology, someone who wants less tech exposure cannot get that from the index alone.
They make less sense when:
The account is small and every position is under a few hundred dollars. The minimum fee then becomes a meaningful percentage before the stock has moved at all.
The five picks are really one theme. That is concentration with extra fees.
You plan to rebalance or trade often. Each trade on each name pays the minimum again.
And the index ETF is not automatically right either. It cannot outperform the market it tracks, it charges an annual expense ratio, and it fell on Friday along with everything it holds.
My view
In my view, the first 1,000 dollars of a US stock account is not the place to build a five-stock portfolio. The numbers say the five-order version costs about five times as much in platform-fee minimums, and the protection it buys depends entirely on whether the five stocks are truly different. Friday showed what happens when they are not.
I would rather start with one broad position, accept that it holds tech at the index weight, and add single names only when each new position is large enough that the 0.99 dollar minimum stays near 0.2 percent per side. That works out to roughly 500 dollars per position or more. That is a rule I would set for myself.
A short checklist I would use before splitting money across stocks:
Divide 0.99 by the planned position size. If the result is above about 0.2 percent per side, the position is small relative to the minimum fee.Ask whether the stocks would all fall on the same headline. If yes, count them as one bet.If using an index ETF, read its official holdings and sector weights, so you know what it already contains.
Sources: Reuters market report on 13 November 2026 trading, published 14 November 2026; State Street Investment Management, SPDR S&P 500 ETF Trust (SPY) page: top holdings and sector weights as of 12 November 2026, closing price as of 12 November 2026, gross expense ratio as of 14 November 2026. All checked on 15 November 2026 (Asia/Jakarta, UTC+7).
#BiyaPay #USStocks #ETF
Five Stocks or One Index ETF? What Friday's Chip Sell-Off Means for a $1,000 Account
Disclosure: It is not financial advice
On Friday, 13 November 2026, the S&P 500 closed down 0.40 percent. On the same day, Advanced Micro Devices fell 8.8 percent, Broadcom fell 4.8 percent, and the Philadelphia Semiconductor Index fell 3.4 percent, according to Reuters. The Dow Jones Industrial Average actually closed 0.10 percent higher.
Same market, same session, very different results. The gap between those numbers is the whole argument of this article.
A common piece of advice for small accounts is "just split your money across five stocks and you are diversified." A second one is "buy one index ETF, it is always the cheaper choice." Friday's numbers, and the fee arithmetic on a 1,000 dollar account, suggest both claims are only half true.
This is a worked comparison using official and reputable figures, with a 1,000 dollar example that is an illustration, not a suggested order size.
What one session did to 1,000 dollars
Take 1,000 dollars and put it to work three different ways, using Friday's actual closing moves.
All of it in one chip stock that fell 8.8 percent: the position loses 88 dollars in one session.
Split into five equal 200 dollar positions, where one of them is that same stock and the other four are unchanged: the account loses 17.60 dollars, or 1.76 percent. The one bad position still hurts, but it is one fifth of the damage.
All of it tracking the S&P 500, which fell 0.40 percent: the account loses about 4 dollars, before any tracking difference or fund costs.
That middle case comes with a catch that is easy to miss. "Five stocks" only spreads risk if the five stocks do not all react to the same news. Five chip names are closer to one bet with five tickers. On Friday the semiconductor index as a whole fell 3.4 percent, which on 1,000 dollars is 34 dollars, more than eight times the S&P 500's move.
The index does not avoid chip stocks either
The opposite mistake is to think an index fund simply sidesteps a sector sell-off. It does not. It holds the sector at whatever weight the index gives it.
State Street's official page for the SPDR S&P 500 ETF Trust (SPY), with holdings as of 12 November 2026, lists the index weight of Nvidia at 6.15 percent and Broadcom at 2.65 percent. Information Technology is 36.15 percent of the index.
A rough contribution estimate: Nvidia fell 2 percent on Friday and Broadcom fell 4.8 percent, according to Reuters. At those weights, Nvidia's move takes about 0.12 percentage points off the index, and Broadcom's takes about 0.13 points. Together that is roughly 0.25 points of the index's 0.40 percent decline, from just two companies. Weights shift during the day, so treat this as an approximation, not an official attribution.
So the index ETF did not dodge Friday. It diluted it. That is a real difference, but it is not immunity. In a broad market decline the index falls too, and with 36 percent in technology, a tech-led sell-off reaches an index holder more than the word "diversified" suggests.
What order fees add to a $1,000 account
Here is where the "five stocks" approach has a cost that a 1,000 dollar account feels more than a large one.
On BiyaPay, US stock commission is 0 dollars, while the platform fee is 0.005 dollars per share, with a minimum of 0.99 dollars per order and a maximum of 1 percent of the transaction value. External institution fees, trading activity fees, and sell-related items are added on top of the platform fee. Some US stocks on BiyaPay support fractional trading: an order below one share is charged a 1 percent platform fee capped at 1 dollar, with no commission and no external institution fees.
On small orders the per-share calculation is usually below the minimum, so the 0.99 dollar minimum is what applies. On a 200 dollar order, 1 percent is 2 dollars, so the cap does not bring it lower. Using only that platform-fee minimum:
One order of 1,000 dollars: 0.99 dollars to buy, 1.98 dollars to buy and later sell. That is about 0.2 percent of the account for the round trip.
Five orders of 200 dollars: 4.95 dollars to buy, 9.90 dollars to buy and later sell. That is about 0.99 percent of the account, five times as much, before any external fees.
Now scale the same split to 10,000 dollars. If each order is still under 198 shares, so the per-share calculation stays below the minimum, five orders of 2,000 dollars still cost 9.90 dollars for a round trip, which is about 0.1 percent of the account. The fee did not change. The account size did.
The index ETF has its own cost, and it is a different kind. State Street lists SPY's gross expense ratio at 0.0945 percent a year, as of 14 November 2026. On 1,000 dollars that is about 0.95 dollars a year, taken inside the fund rather than charged per order. It is small, but it repeats every year you hold, while an order fee is paid once per trade.
There is one more practical detail. SPY closed at 757.12 dollars on 12 November 2026, according to State Street. A 1,000 dollar account can buy one whole share and has about 243 dollars left over, which is below one share and would be a fractional order.
So the choice is not only about risk. It is also about how many orders a 1,000 dollar account has to pay for.
When five single stocks make sense, and when they do not
Five single stocks can make sense when:
The account is large enough that the minimum fee is a small slice of each position. At 0.99 dollars per order, a 495 dollar position keeps the minimum at about 0.2 percent per side.
The five companies are genuinely different businesses that do not move on the same headline. A bank, a retailer, a drug maker, an energy company, and a software company spread risk. Five chip makers do not.
You actually want to avoid what the index is heavy in. With 36 percent of the S&P 500 in technology, someone who wants less tech exposure cannot get that from the index alone.
They make less sense when:
The account is small and every position is under a few hundred dollars. The minimum fee then becomes a meaningful percentage before the stock has moved at all.
The five picks are really one theme. That is concentration with extra fees.
You plan to rebalance or trade often. Each trade on each name pays the minimum again.
And the index ETF is not automatically right either. It cannot outperform the market it tracks, it charges an annual expense ratio, and it fell on Friday along with everything it holds.
My view
In my view, the first 1,000 dollars of a US stock account is not the place to build a five-stock portfolio. The numbers say the five-order version costs about five times as much in platform-fee minimums, and the protection it buys depends entirely on whether the five stocks are truly different. Friday showed what happens when they are not.
I would rather start with one broad position, accept that it holds tech at the index weight, and add single names only when each new position is large enough that the 0.99 dollar minimum stays near 0.2 percent per side. That works out to roughly 500 dollars per position or more. That is a rule I would set for myself.
A short checklist I would use before splitting money across stocks:
Divide 0.99 by the planned position size. If the result is above about 0.2 percent per side, the position is small relative to the minimum fee.Ask whether the stocks would all fall on the same headline. If yes, count them as one bet.If using an index ETF, read its official holdings and sector weights, so you know what it already contains.
Sources: Reuters market report on 13 November 2026 trading, published 14 November 2026; State Street Investment Management, SPDR S&P 500 ETF Trust (SPY) page: top holdings and sector weights as of 12 November 2026, closing price as of 12 November 2026, gross expense ratio as of 14 November 2026. All checked on 15 November 2026 (Asia/Jakarta, UTC+7).
#BiyaPay #USStocks #ETF
On Friday, 13 November 2026, the S&P 500 closed down 0.40 percent. On the same day, Advanced Micro Devices fell 8.8 percent, Broadcom fell 4.8 percent, and the Philadelphia Semiconductor Index fell 3.4 percent, according to Reuters. The Dow Jones Industrial Average actually closed 0.10 percent higher.
Same market, same session, very different results. The gap between those numbers is the whole argument of this article.
A common piece of advice for small accounts is "just split your money across five stocks and you are diversified." A second one is "buy one index ETF, it is always the cheaper choice." Friday's numbers, and the fee arithmetic on a 1,000 dollar account, suggest both claims are only half true.
This is a worked comparison using official and reputable figures, with a 1,000 dollar example that is an illustration, not a suggested order size.
What one session did to 1,000 dollars
Take 1,000 dollars and put it to work three different ways, using Friday's actual closing moves.
All of it in one chip stock that fell 8.8 percent: the position loses 88 dollars in one session.
Split into five equal 200 dollar positions, where one of them is that same stock and the other four are unchanged: the account loses 17.60 dollars, or 1.76 percent. The one bad position still hurts, but it is one fifth of the damage.
All of it tracking the S&P 500, which fell 0.40 percent: the account loses about 4 dollars, before any tracking difference or fund costs.
That middle case comes with a catch that is easy to miss. "Five stocks" only spreads risk if the five stocks do not all react to the same news. Five chip names are closer to one bet with five tickers. On Friday the semiconductor index as a whole fell 3.4 percent, which on 1,000 dollars is 34 dollars, more than eight times the S&P 500's move.
The index does not avoid chip stocks either
The opposite mistake is to think an index fund simply sidesteps a sector sell-off. It does not. It holds the sector at whatever weight the index gives it.
State Street's official page for the SPDR S&P 500 ETF Trust (SPY), with holdings as of 12 November 2026, lists the index weight of Nvidia at 6.15 percent and Broadcom at 2.65 percent. Information Technology is 36.15 percent of the index.
A rough contribution estimate: Nvidia fell 2 percent on Friday and Broadcom fell 4.8 percent, according to Reuters. At those weights, Nvidia's move takes about 0.12 percentage points off the index, and Broadcom's takes about 0.13 points. Together that is roughly 0.25 points of the index's 0.40 percent decline, from just two companies. Weights shift during the day, so treat this as an approximation, not an official attribution.
So the index ETF did not dodge Friday. It diluted it. That is a real difference, but it is not immunity. In a broad market decline the index falls too, and with 36 percent in technology, a tech-led sell-off reaches an index holder more than the word "diversified" suggests.
What order fees add to a $1,000 account
Here is where the "five stocks" approach has a cost that a 1,000 dollar account feels more than a large one.
On BiyaPay, US stock commission is 0 dollars, while the platform fee is 0.005 dollars per share, with a minimum of 0.99 dollars per order and a maximum of 1 percent of the transaction value. External institution fees, trading activity fees, and sell-related items are added on top of the platform fee. Some US stocks on BiyaPay support fractional trading: an order below one share is charged a 1 percent platform fee capped at 1 dollar, with no commission and no external institution fees.
On small orders the per-share calculation is usually below the minimum, so the 0.99 dollar minimum is what applies. On a 200 dollar order, 1 percent is 2 dollars, so the cap does not bring it lower. Using only that platform-fee minimum:
One order of 1,000 dollars: 0.99 dollars to buy, 1.98 dollars to buy and later sell. That is about 0.2 percent of the account for the round trip.
Five orders of 200 dollars: 4.95 dollars to buy, 9.90 dollars to buy and later sell. That is about 0.99 percent of the account, five times as much, before any external fees.
Now scale the same split to 10,000 dollars. If each order is still under 198 shares, so the per-share calculation stays below the minimum, five orders of 2,000 dollars still cost 9.90 dollars for a round trip, which is about 0.1 percent of the account. The fee did not change. The account size did.
The index ETF has its own cost, and it is a different kind. State Street lists SPY's gross expense ratio at 0.0945 percent a year, as of 14 November 2026. On 1,000 dollars that is about 0.95 dollars a year, taken inside the fund rather than charged per order. It is small, but it repeats every year you hold, while an order fee is paid once per trade.
There is one more practical detail. SPY closed at 757.12 dollars on 12 November 2026, according to State Street. A 1,000 dollar account can buy one whole share and has about 243 dollars left over, which is below one share and would be a fractional order.
So the choice is not only about risk. It is also about how many orders a 1,000 dollar account has to pay for.
When five single stocks make sense, and when they do not
Five single stocks can make sense when:
The account is large enough that the minimum fee is a small slice of each position. At 0.99 dollars per order, a 495 dollar position keeps the minimum at about 0.2 percent per side.
The five companies are genuinely different businesses that do not move on the same headline. A bank, a retailer, a drug maker, an energy company, and a software company spread risk. Five chip makers do not.
You actually want to avoid what the index is heavy in. With 36 percent of the S&P 500 in technology, someone who wants less tech exposure cannot get that from the index alone.
They make less sense when:
The account is small and every position is under a few hundred dollars. The minimum fee then becomes a meaningful percentage before the stock has moved at all.
The five picks are really one theme. That is concentration with extra fees.
You plan to rebalance or trade often. Each trade on each name pays the minimum again.
And the index ETF is not automatically right either. It cannot outperform the market it tracks, it charges an annual expense ratio, and it fell on Friday along with everything it holds.
My view
In my view, the first 1,000 dollars of a US stock account is not the place to build a five-stock portfolio. The numbers say the five-order version costs about five times as much in platform-fee minimums, and the protection it buys depends entirely on whether the five stocks are truly different. Friday showed what happens when they are not.
I would rather start with one broad position, accept that it holds tech at the index weight, and add single names only when each new position is large enough that the 0.99 dollar minimum stays near 0.2 percent per side. That works out to roughly 500 dollars per position or more. That is a rule I would set for myself.
A short checklist I would use before splitting money across stocks:
Divide 0.99 by the planned position size. If the result is above about 0.2 percent per side, the position is small relative to the minimum fee.Ask whether the stocks would all fall on the same headline. If yes, count them as one bet.If using an index ETF, read its official holdings and sector weights, so you know what it already contains.
Sources: Reuters market report on 13 November 2026 trading, published 14 November 2026; State Street Investment Management, SPDR S&P 500 ETF Trust (SPY) page: top holdings and sector weights as of 12 November 2026, closing price as of 12 November 2026, gross expense ratio as of 14 November 2026. All checked on 15 November 2026 (Asia/Jakarta, UTC+7).
#BiyaPay #USStocks #ETF
476
·
--
Apakah masa depan $NVDA tidak pasti tanpa kepemimpinan saat ini?
Yahoo Finance melaporkan bahwa nilai saham perusahaan turun hampir 13% minggu ini. Sementara itu, Decrypt mencatat bahwa dewan direksi dikabarkan telah menghubungi CEO Arm sebagai calon pengganti Jensen Huang.
Anda dapat memantau kontrak perpetual ini pada harga 162.33, dengan perubahan 24 jam sebesar -2.66%. Level support saat ini berada di 161.40.
⚠️ 🧐
Apakah Anda lebih suka memperdagangkan kontrak perpetual ini dalam jangka waktu pendek atau lebih panjang?
#NVDA #USStocks #Stocks
⚠️ Kontrak perpetual adalah derivatif dengan leverage, bukan saham atau komoditas itu sendiri.
Ini adalah analisis, bukan rekomendasi. Utamakan pengelolaan risiko, baru kemudian keuntungan.
Apakah masa depan $NVDA tidak pasti tanpa kepemimpinan saat ini?
Yahoo Finance melaporkan bahwa nilai saham perusahaan turun hampir 13% minggu ini. Sementara itu, Decrypt mencatat bahwa dewan direksi dikabarkan telah menghubungi CEO Arm sebagai calon pengganti Jensen Huang.
Anda dapat memantau kontrak perpetual ini pada harga 162.33, dengan perubahan 24 jam sebesar -2.66%. Level support saat ini berada di 161.40.
⚠️ 🧐
Apakah Anda lebih suka memperdagangkan kontrak perpetual ini dalam jangka waktu pendek atau lebih panjang?
#NVDA #USStocks #Stocks
⚠️ Kontrak perpetual adalah derivatif dengan leverage, bukan saham atau komoditas itu sendiri.
Ini adalah analisis, bukan rekomendasi. Utamakan pengelolaan risiko, baru kemudian keuntungan.
Yahoo Finance melaporkan bahwa nilai saham perusahaan turun hampir 13% minggu ini. Sementara itu, Decrypt mencatat bahwa dewan direksi dikabarkan telah menghubungi CEO Arm sebagai calon pengganti Jensen Huang.
Anda dapat memantau kontrak perpetual ini pada harga 162.33, dengan perubahan 24 jam sebesar -2.66%. Level support saat ini berada di 161.40.
⚠️ 🧐
Apakah Anda lebih suka memperdagangkan kontrak perpetual ini dalam jangka waktu pendek atau lebih panjang?
#NVDA #USStocks #Stocks
⚠️ Kontrak perpetual adalah derivatif dengan leverage, bukan saham atau komoditas itu sendiri.
Ini adalah analisis, bukan rekomendasi. Utamakan pengelolaan risiko, baru kemudian keuntungan.
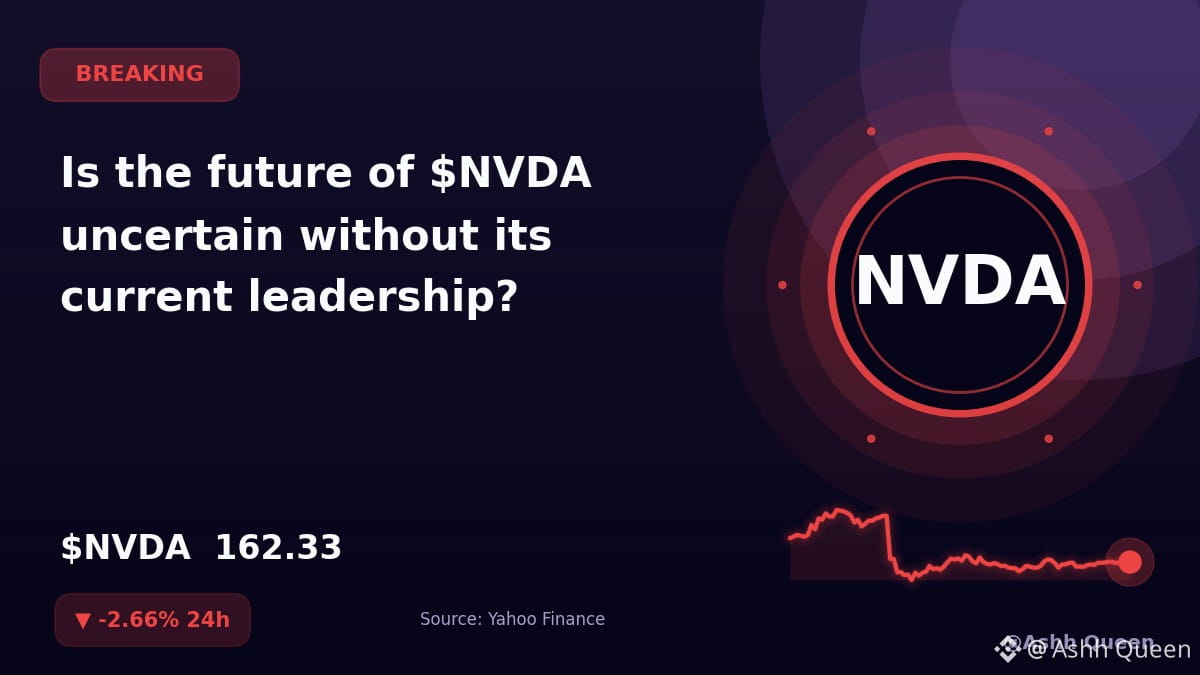
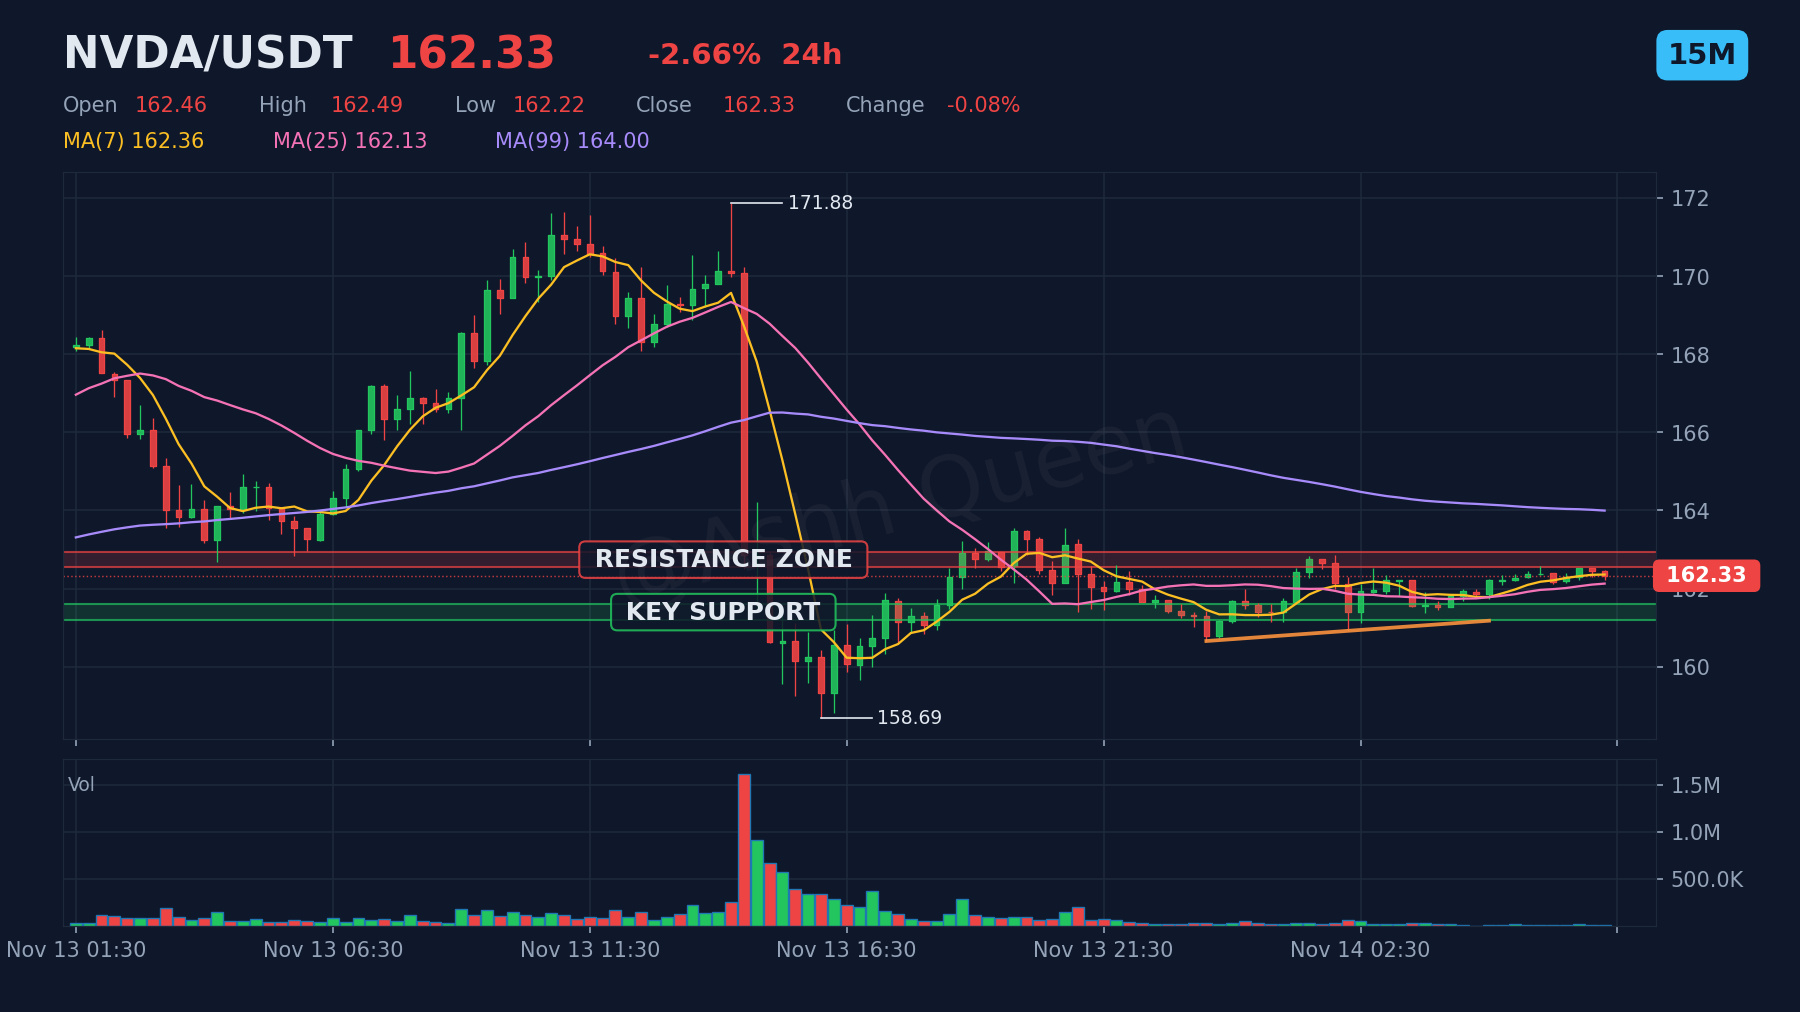
53
·
--
Para trader pada $NVDA sebaiknya memperhatikan level support di 161.40.
Menurut Yahoo Finance, perusahaan Jim Simons telah melepas posisinya di produsen cip tersebut. Laporan dari media yang sama menyebutkan bahwa perusahaan itu mengungkap kepemilikan saham bernilai miliaran dolar di sejumlah perusahaan teknologi lainnya.
Kontrak perpetual $NVDA saat ini diperdagangkan di 162.16, dengan perubahan 24 jam sebesar -1.07%.
📈 📉 📊
Sinyal pasar atau perubahan fundamental spesifik apa yang dapat mengubah prospek Anda saat ini terhadap aset ini?
#NVDA #NVDAStock #StockMarketNews #USStocks
⚠️ Kontrak perpetual adalah derivatif dengan leverage, bukan saham atau komoditas itu sendiri.
Bukan nasihat keuangan. Pasar bergejolak, jadi gunakan stop-loss dan pertaruhkan hanya dana yang sanggup Anda tanggung jika hilang.
Para trader pada $NVDA sebaiknya memperhatikan level support di 161.40.
Menurut Yahoo Finance, perusahaan Jim Simons telah melepas posisinya di produsen cip tersebut. Laporan dari media yang sama menyebutkan bahwa perusahaan itu mengungkap kepemilikan saham bernilai miliaran dolar di sejumlah perusahaan teknologi lainnya.
Kontrak perpetual $NVDA saat ini diperdagangkan di 162.16, dengan perubahan 24 jam sebesar -1.07%.
📈 📉 📊
Sinyal pasar atau perubahan fundamental spesifik apa yang dapat mengubah prospek Anda saat ini terhadap aset ini?
#NVDA #NVDAStock #StockMarketNews #USStocks
⚠️ Kontrak perpetual adalah derivatif dengan leverage, bukan saham atau komoditas itu sendiri.
Bukan nasihat keuangan. Pasar bergejolak, jadi gunakan stop-loss dan pertaruhkan hanya dana yang sanggup Anda tanggung jika hilang.
Menurut Yahoo Finance, perusahaan Jim Simons telah melepas posisinya di produsen cip tersebut. Laporan dari media yang sama menyebutkan bahwa perusahaan itu mengungkap kepemilikan saham bernilai miliaran dolar di sejumlah perusahaan teknologi lainnya.
Kontrak perpetual $NVDA saat ini diperdagangkan di 162.16, dengan perubahan 24 jam sebesar -1.07%.
📈 📉 📊
Sinyal pasar atau perubahan fundamental spesifik apa yang dapat mengubah prospek Anda saat ini terhadap aset ini?
#NVDA #NVDAStock #StockMarketNews #USStocks
⚠️ Kontrak perpetual adalah derivatif dengan leverage, bukan saham atau komoditas itu sendiri.
Bukan nasihat keuangan. Pasar bergejolak, jadi gunakan stop-loss dan pertaruhkan hanya dana yang sanggup Anda tanggung jika hilang.
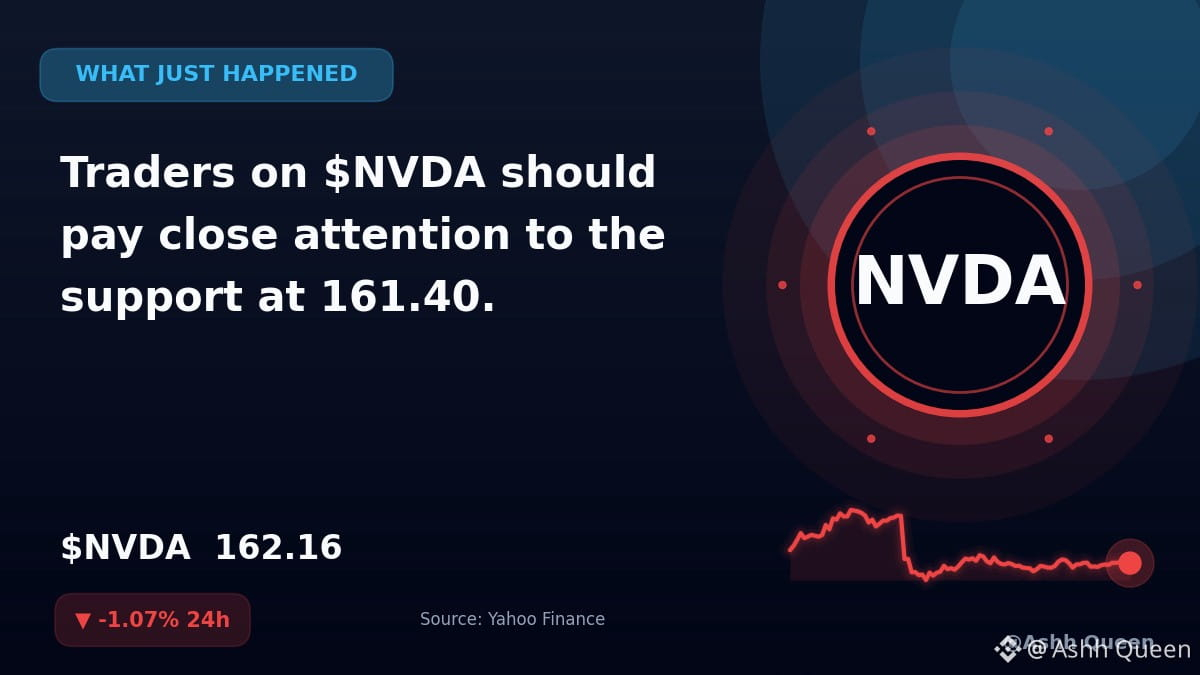
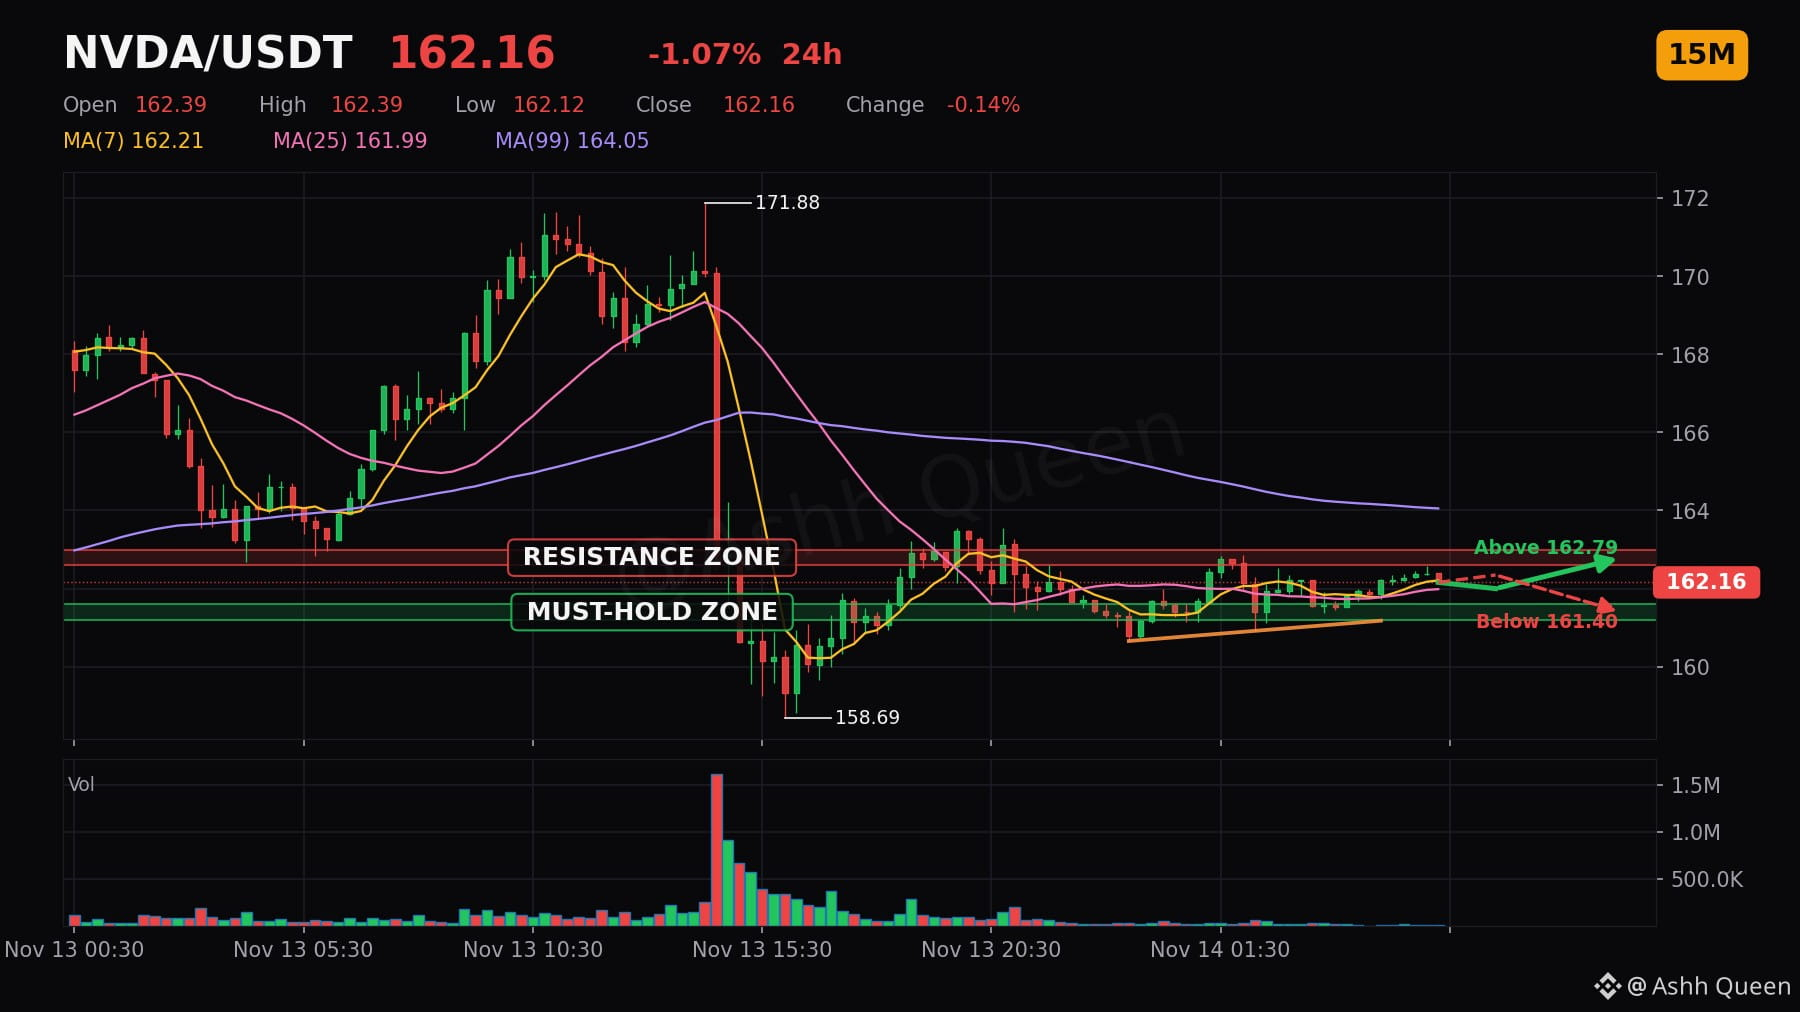
47
·
--
$AAPL mencapai ketinggian baru.
Yahoo Finance melaporkan bahwa aset ini mencapai level tertinggi baru, meskipun prospeknya menunjukkan masih ada potensi kenaikan lebih lanjut.
Kontrak perpetual AAPLUSDT ini saat ini diperdagangkan di harga 355.94, dengan perubahan 24 jam sebesar -0.35%. Level resistansi saat ini berada di 356.42. 🎯 👀 🧭
Level mana yang sedang Anda pantau di grafik, dan mengapa?
#AAPL #AAPLStock #SahamAS
⚠️ Kontrak perpetual adalah derivatif dengan leverage, bukan saham atau komoditas itu sendiri.
Ini bukan nasihat keuangan. Pasar bersifat volatil, jadi gunakan stop-loss dan hanya pertaruhkan dana yang Anda sanggup kehilangan.
$AAPL mencapai ketinggian baru.
Yahoo Finance melaporkan bahwa aset ini mencapai level tertinggi baru, meskipun prospeknya menunjukkan masih ada potensi kenaikan lebih lanjut.
Kontrak perpetual AAPLUSDT ini saat ini diperdagangkan di harga 355.94, dengan perubahan 24 jam sebesar -0.35%. Level resistansi saat ini berada di 356.42. 🎯 👀 🧭
Level mana yang sedang Anda pantau di grafik, dan mengapa?
#AAPL #AAPLStock #SahamAS
⚠️ Kontrak perpetual adalah derivatif dengan leverage, bukan saham atau komoditas itu sendiri.
Ini bukan nasihat keuangan. Pasar bersifat volatil, jadi gunakan stop-loss dan hanya pertaruhkan dana yang Anda sanggup kehilangan.
Yahoo Finance melaporkan bahwa aset ini mencapai level tertinggi baru, meskipun prospeknya menunjukkan masih ada potensi kenaikan lebih lanjut.
Kontrak perpetual AAPLUSDT ini saat ini diperdagangkan di harga 355.94, dengan perubahan 24 jam sebesar -0.35%. Level resistansi saat ini berada di 356.42. 🎯 👀 🧭
Level mana yang sedang Anda pantau di grafik, dan mengapa?
#AAPL #AAPLStock #SahamAS
⚠️ Kontrak perpetual adalah derivatif dengan leverage, bukan saham atau komoditas itu sendiri.
Ini bukan nasihat keuangan. Pasar bersifat volatil, jadi gunakan stop-loss dan hanya pertaruhkan dana yang Anda sanggup kehilangan.
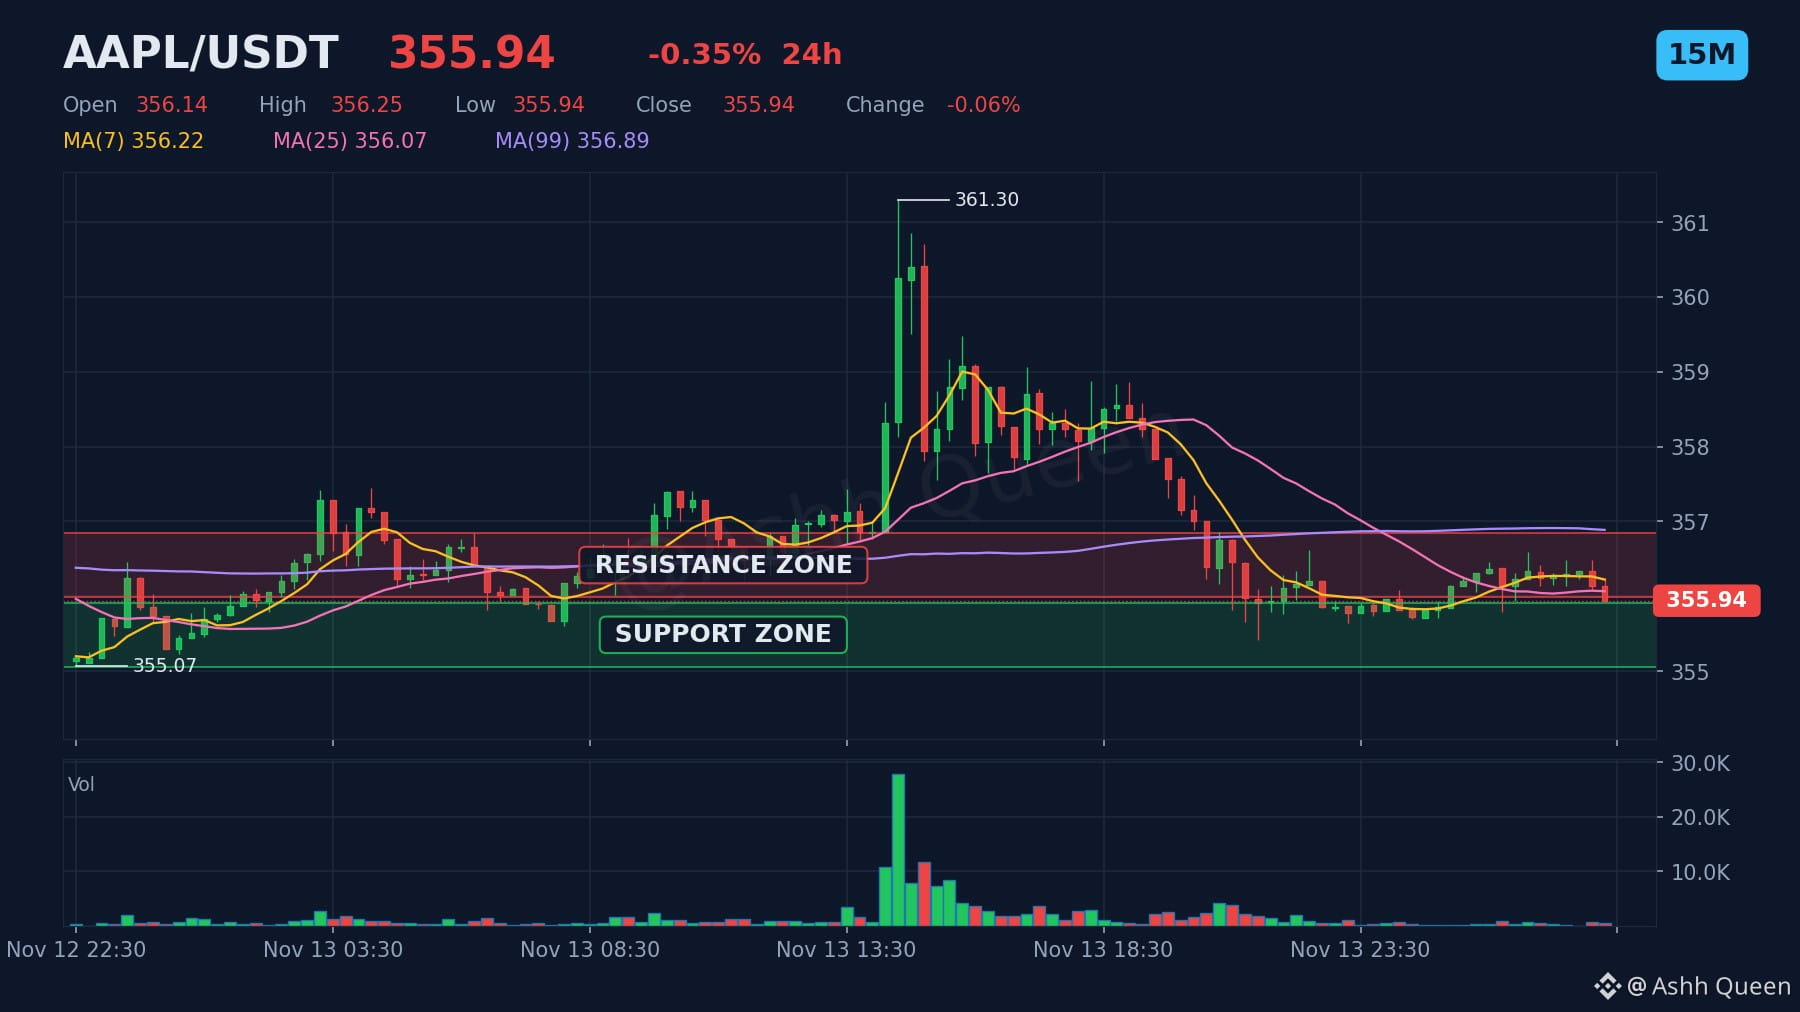
71
·
--
Terverifikasi
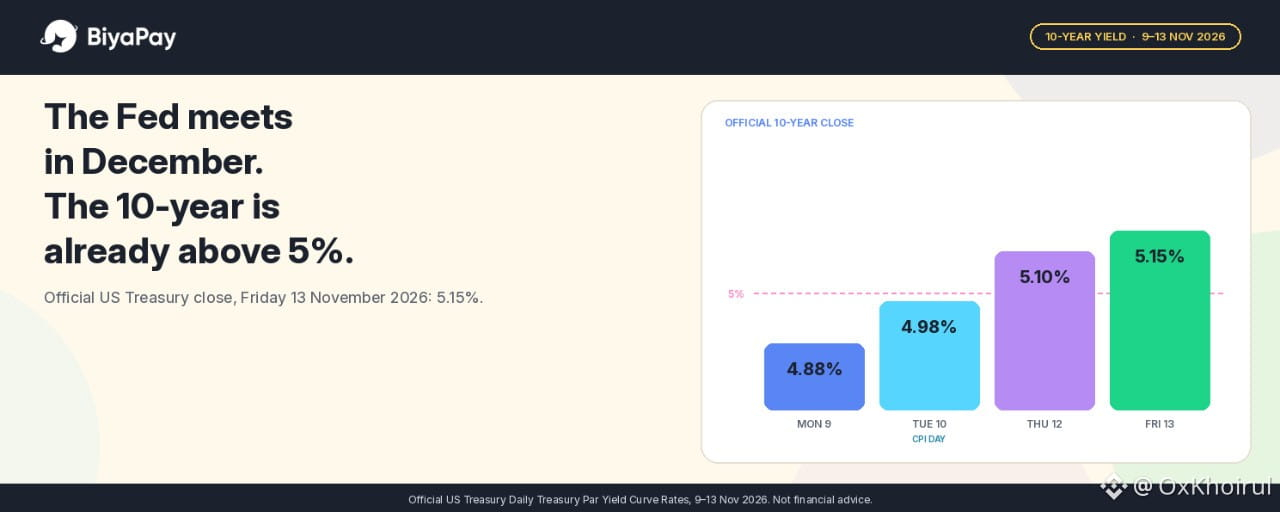
Artikel
The Fed Bertemu pada Desember. Imbal Hasil 10 Tahun Sudah di Atas 5%Pengungkapan: Ini bukan nasihat keuangan
Rapat kebijakan Federal Reserve berikutnya masih beberapa minggu lagi. Imbal hasil Treasury AS 10 tahun tidak menunggu.
Pada Selasa, 10 November 2026, Biro Statistik Tenaga Kerja AS melaporkan bahwa indeks harga konsumen naik 0,4 persen pada Oktober setelah disesuaikan secara musiman, lebih tinggi daripada kenaikan 0,3 persen yang diperkirakan para ekonom, menurut Reuters dan CNBC. CPI inti, yang tidak mencakup pangan dan energi, naik 0,3 persen, juga lebih tinggi daripada perkiraan. BLS tidak menerbitkan tingkat inflasi tahunan dibandingkan tahun sebelumnya karena penutupan pemerintahan pada 2025 membuat tidak adanya basis pembanding untuk Oktober.
The Fed Bertemu pada Desember. Imbal Hasil 10 Tahun Sudah di Atas 5%
Pengungkapan: Ini bukan nasihat keuangan
Rapat kebijakan Federal Reserve berikutnya masih beberapa minggu lagi. Imbal hasil Treasury AS 10 tahun tidak menunggu.
Pada Selasa, 10 November 2026, Biro Statistik Tenaga Kerja AS melaporkan bahwa indeks harga konsumen naik 0,4 persen pada Oktober setelah disesuaikan secara musiman, lebih tinggi daripada kenaikan 0,3 persen yang diperkirakan para ekonom, menurut Reuters dan CNBC. CPI inti, yang tidak mencakup pangan dan energi, naik 0,3 persen, juga lebih tinggi daripada perkiraan. BLS tidak menerbitkan tingkat inflasi tahunan dibandingkan tahun sebelumnya karena penutupan pemerintahan pada 2025 membuat tidak adanya basis pembanding untuk Oktober.
Rapat kebijakan Federal Reserve berikutnya masih beberapa minggu lagi. Imbal hasil Treasury AS 10 tahun tidak menunggu.
Pada Selasa, 10 November 2026, Biro Statistik Tenaga Kerja AS melaporkan bahwa indeks harga konsumen naik 0,4 persen pada Oktober setelah disesuaikan secara musiman, lebih tinggi daripada kenaikan 0,3 persen yang diperkirakan para ekonom, menurut Reuters dan CNBC. CPI inti, yang tidak mencakup pangan dan energi, naik 0,3 persen, juga lebih tinggi daripada perkiraan. BLS tidak menerbitkan tingkat inflasi tahunan dibandingkan tahun sebelumnya karena penutupan pemerintahan pada 2025 membuat tidak adanya basis pembanding untuk Oktober.
2
2
1.1k

Jumat yang tak biasa di Wall Street.
Dow hampir tidak berubah (+0,1%), tetapi Nasdaq dan saham-saham chip terpukul keras karena Inflasi Grosir Oktober (PPI) naik menjadi 6,5% YoY, kenaikan terbesar sejak 2022. Meski demikian, ketiga indeks utama ditutup positif selama sepekan, menunjukkan bahwa sektor teknologi yang paling terdampak.
Setiap kali Nasdaq bersin, $BTC cenderung ikut terserang flu. Apakah Anda menggunakan saham untuk menentukan arah kripto, atau menjauh dari Wall Street hingga Desember? 👇
$BTC #USStocks #Nasdaq #Inflation #Macro
Jumat yang tak biasa di Wall Street.
Dow hampir tidak berubah (+0,1%), tetapi Nasdaq dan saham-saham chip terpukul keras karena Inflasi Grosir Oktober (PPI) naik menjadi 6,5% YoY, kenaikan terbesar sejak 2022. Meski demikian, ketiga indeks utama ditutup positif selama sepekan, menunjukkan bahwa sektor teknologi yang paling terdampak.
Setiap kali Nasdaq bersin, $BTC cenderung ikut terserang flu. Apakah Anda menggunakan saham untuk menentukan arah kripto, atau menjauh dari Wall Street hingga Desember? 👇
$BTC #USStocks #Nasdaq #Inflation #Macro
Dow hampir tidak berubah (+0,1%), tetapi Nasdaq dan saham-saham chip terpukul keras karena Inflasi Grosir Oktober (PPI) naik menjadi 6,5% YoY, kenaikan terbesar sejak 2022. Meski demikian, ketiga indeks utama ditutup positif selama sepekan, menunjukkan bahwa sektor teknologi yang paling terdampak.
Setiap kali Nasdaq bersin, $BTC cenderung ikut terserang flu. Apakah Anda menggunakan saham untuk menentukan arah kripto, atau menjauh dari Wall Street hingga Desember? 👇
$BTC #USStocks #Nasdaq #Inflation #Macro
58

·
--
Bearish
🚨 BERITA TERKINI: $1,2 TRILIUN LENYAP DARI SAHAM AS HANYA DALAM 40 MENIT. WALL STREET MELAKUKAN AKSI JUAL SECARA AGRESIF.
Tekanan jual menyebar ke seluruh pasar ekuitas AS.
📉 S&P 500: -1,56%
📉 Nasdaq: -2,28%
📉 Semikonduktor (SOXX): -6,02%
Namun, inilah yang membuat aksi jual ini sangat menarik:
Imbal hasil Treasury AS TURUN tajam pada obligasi bertenor 10, 20, dan 30 tahun.
Ini mengindikasikan bahwa di tengah ketidakpastian yang meningkat, investor mungkin beralih ke obligasi pemerintah yang relatif lebih aman.
Dua kekhawatiran utama membebani sentimen pasar:
Valuasi AI dan kekhawatiran tentang imbal hasil di masa mendatang.
Ketidakpastian inflasi dan potensi dampaknya terhadap kebijakan moneter.
Pertanyaan besarnya: Apakah ini koreksi sementara atau awal dari pergerakan penghindaran risiko yang lebih dalam?
Cermati imbal hasil Treasury, saham teknologi, dan kinerja semikonduktor.
Jika aksi jual semakin cepat, volatilitas di pasar global dapat meningkat secara signifikan.
#StockMarket #WallStreet #USStocks #BondMarket #GlobalMarkets
🚨 BERITA TERKINI: $1,2 TRILIUN LENYAP DARI SAHAM AS HANYA DALAM 40 MENIT. WALL STREET MELAKUKAN AKSI JUAL SECARA AGRESIF.
Tekanan jual menyebar ke seluruh pasar ekuitas AS.
📉 S&P 500: -1,56%
📉 Nasdaq: -2,28%
📉 Semikonduktor (SOXX): -6,02%
Namun, inilah yang membuat aksi jual ini sangat menarik:
Imbal hasil Treasury AS TURUN tajam pada obligasi bertenor 10, 20, dan 30 tahun.
Ini mengindikasikan bahwa di tengah ketidakpastian yang meningkat, investor mungkin beralih ke obligasi pemerintah yang relatif lebih aman.
Dua kekhawatiran utama membebani sentimen pasar:
Valuasi AI dan kekhawatiran tentang imbal hasil di masa mendatang.
Ketidakpastian inflasi dan potensi dampaknya terhadap kebijakan moneter.
Pertanyaan besarnya: Apakah ini koreksi sementara atau awal dari pergerakan penghindaran risiko yang lebih dalam?
Cermati imbal hasil Treasury, saham teknologi, dan kinerja semikonduktor.
Jika aksi jual semakin cepat, volatilitas di pasar global dapat meningkat secara signifikan.
#StockMarket #WallStreet #USStocks #BondMarket #GlobalMarkets
Tekanan jual menyebar ke seluruh pasar ekuitas AS.
📉 S&P 500: -1,56%
📉 Nasdaq: -2,28%
📉 Semikonduktor (SOXX): -6,02%
Namun, inilah yang membuat aksi jual ini sangat menarik:
Imbal hasil Treasury AS TURUN tajam pada obligasi bertenor 10, 20, dan 30 tahun.
Ini mengindikasikan bahwa di tengah ketidakpastian yang meningkat, investor mungkin beralih ke obligasi pemerintah yang relatif lebih aman.
Dua kekhawatiran utama membebani sentimen pasar:
Valuasi AI dan kekhawatiran tentang imbal hasil di masa mendatang.
Ketidakpastian inflasi dan potensi dampaknya terhadap kebijakan moneter.
Pertanyaan besarnya: Apakah ini koreksi sementara atau awal dari pergerakan penghindaran risiko yang lebih dalam?
Cermati imbal hasil Treasury, saham teknologi, dan kinerja semikonduktor.
Jika aksi jual semakin cepat, volatilitas di pasar global dapat meningkat secara signifikan.
#StockMarket #WallStreet #USStocks #BondMarket #GlobalMarkets
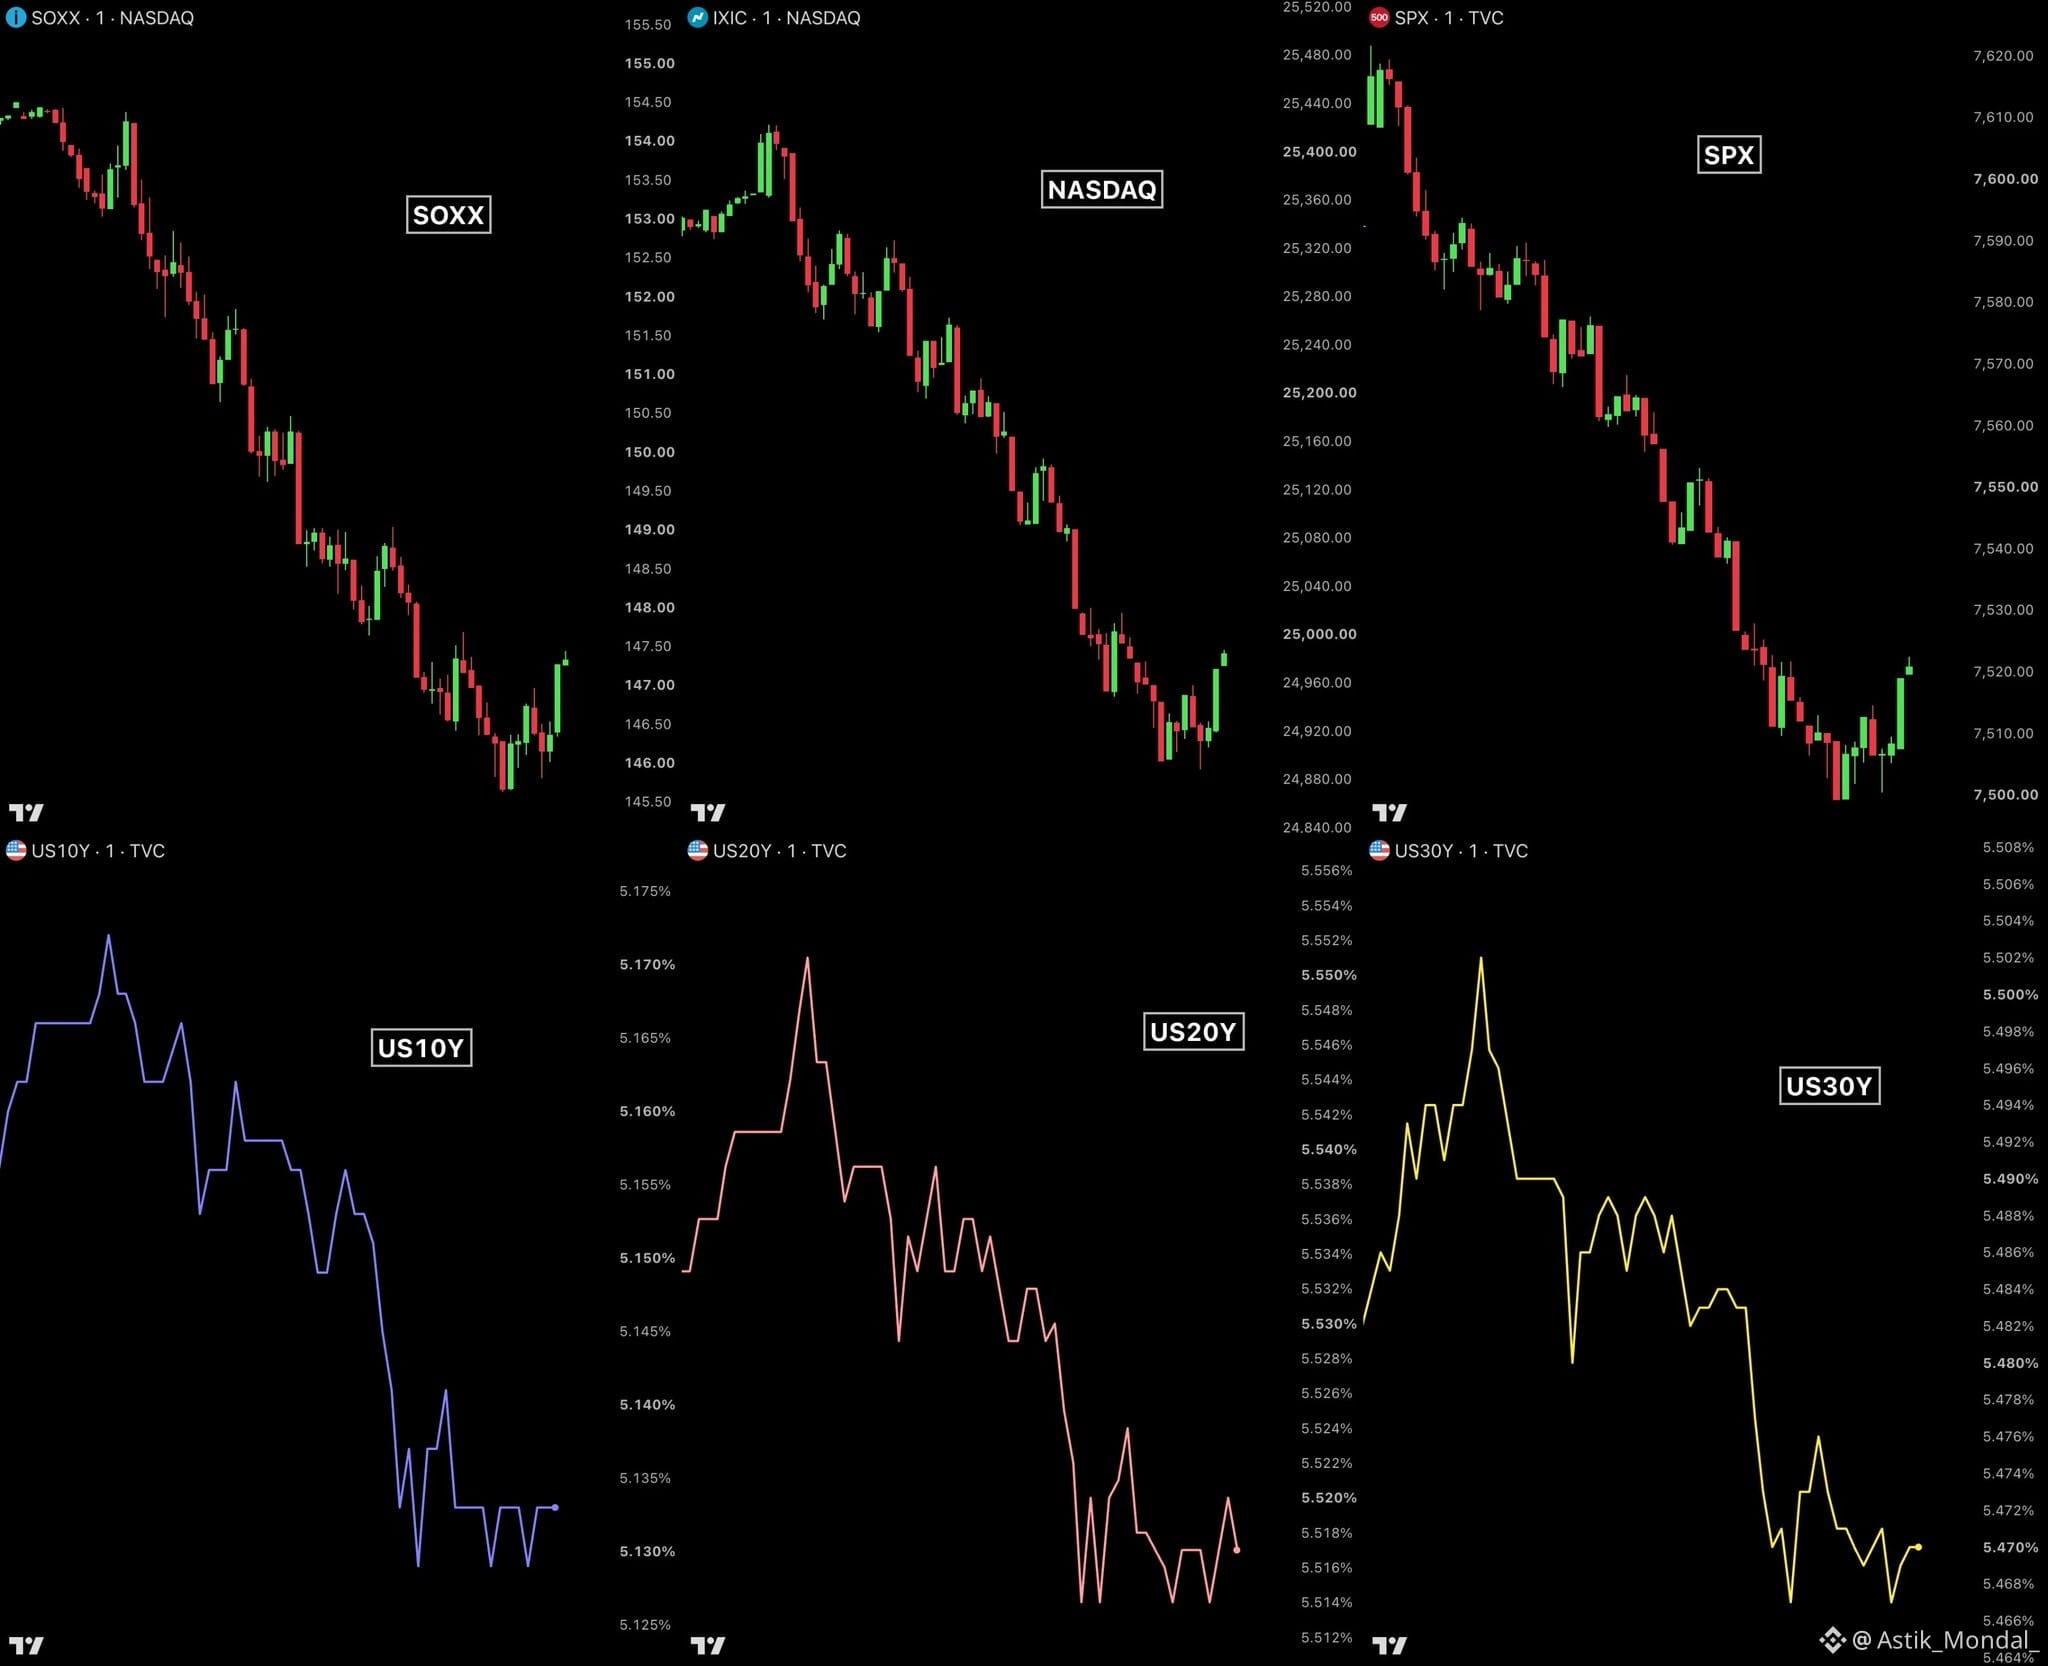
1
249
Masuk untuk menjelajahi konten lainnya
Bergabunglah dengan pengguna kripto global di Binance Square
⚡️ Dapatkan informasi terbaru dan berguna tentang kripto.
💬 Dipercayai oleh bursa kripto terbesar di dunia.
👍 Temukan wawasan nyata dari kreator terverifikasi.
Email/Nomor Ponsel
Topik Sedang Tren
1
#BTCReboundsAbove$60KAmidWhaleDipBuying
42,689 penayangan
232 Berdiskusi
2
#SolanaSets2027RoadmapToDoubleComputeCapacity
27,123 penayangan
582 Berdiskusi
3
#CaliforniaNvidiaProbeExaminesPotentialCriminalViolations
6,770 penayangan
79 Berdiskusi
4
#BlackRockLaunchesHKDollarDigitalLiquidityFund
22,146 penayangan
480 Berdiskusi
5
#NvidiaLoses$2.7TrillionInMonthAndAHalf
65,013 penayangan
274 Berdiskusi
6
#GlobalStocksFaceLongestLosingStreakSince2023
511,017 penayangan
3,204 Berdiskusi
7
#BlackRockIBITPostsRecord$541MSingleDayOutflow
82,603 penayangan
163 Berdiskusi
8
#AnthropicPlungesTowardIPOPriceonDay2
278,680 penayangan
2,132 Berdiskusi
9
#TwentyOneCapitalAdds172.25BTC
143,146 penayangan
1,466 Berdiskusi
10
#HKBillWouldExcludeTokenizedDepositsFromVirtualAssets
16,878 penayangan
97 Berdiskusi