

Zuby - PK
4.9k Publications

Zuby - PK
 Compte Square Vérifié+
Signaler
Bloquer l’utilisateur
X GirlZubiCrypto Crypto Curious Learner, Crypto Trader and Analyst, live streamer and content writer.
161 Suivis
40.4K+ Abonnés
18.8K+ J’aime
Publications
Tous
Citations
Direct
PINNED
·
--

Article
Binance Crypto Pulse: Strong Altcoin Gains Despite Mixed Market📊 Binance Crypto Market Analysis — October 6, 2026
🌐 Overall Crypto Market Snapshot
🟢 Total crypto market capitalization: approximately $2.9 trillion
🟢 24-hour market volume: approximately $85 billion
🟢 BTC dominance: 59.01%
🟢 Fear & Greed Index: 68 — Greed
🟢 Altcoin Season Index: 63/100
🔴 24-hour total market change: approximately -0.36%.
🟡 Bitcoin is around $85,948, down roughly 0.37% on Binance, while Ethereum is near $2,716, down about 0.35%. BNB is around $789 and Solana around $121.
🔥 Top 5 Altcoin Gainers
🥇 RLC: $0.7797 | +113.62% | $155.90M volume
🥈 RAD: $0.345 | +30.19% | $65.69M
🥉 ORCA: $2.42 | +18.08% | $106.66M
4️⃣ EDU: $0.0626 | +17.89% | $29.88M
5️⃣ MOVR: $1.99 | +17.72% | $97.97M
😂 Memecoin market: Meme coins are much weaker than altcoins, with gains mostly limited to around 1–2%.
🐸 Top 5 Memecoin Gainers
🥇 牛来: $0.07859 | +1.75%
🥈 MARSCOIN: $0.1082 | +1.69%
🥉 MUBARAK: $0.07444 | +1.07%
4️⃣ 1MBABYDOGE: $0.0004149 | -0.05%
5️⃣ SHIB: $0.00000587 | -0.34%
📊 Altcoins vs. Memecoins: What Today's Data Shows
🟢 The biggest story is the large performance gap between altcoins and meme tokens.
🟢 The five supplied altcoin gainers average roughly +39.5%, heavily boosted by RLC's extraordinary +113.62% move.
🟡 The five meme tokens average only around +0.82%.
📈 This suggests today's Binance market is experiencing stronger rotation toward individual altcoin opportunities rather than broad-based meme speculation.
🟢 The combined 24-hour volume of the five highlighted altcoin gainers is approximately $456M.
🟢 The five highlighted meme tokens represent approximately $242M in combined 24-hour volume.
⚠️ However, meme-token volume remains concentrated in established names such as SHIB and MUBARAK rather than translating into broad price appreciation.
🧭 What the Broader Market Is Saying
🟢 BTC around $86K: Bitcoin remains the market's primary directional indicator. Binance currently shows BTC near $85,948, while recent market coverage identifies $87K–$87.5K as an important resistance area.
🟢 ETH around $2.7K: Ethereum is relatively stable, with the market watching the October 6 Sepolia testnet activation of the Glamsterdam upgrade. The testnet event is not itself a mainnet upgrade, and no mainnet date has been fixed yet.
🟢 Altcoin breadth: Binance's live rankings show RLC, RAD, NIL, ORCA and MOVR among the strongest gainers, confirming that today's strength is not isolated to one token.
🟢 Market sentiment: A Fear & Greed reading of 68 indicates greed rather than extreme fear, while the 63/100 Altcoin Season Index points toward meaningful altcoin participation.
🟡 Macro backdrop: Citi recently raised its 12-month Bitcoin forecast to $113,000 and its Ether forecast to $3,028, citing stronger crypto activity, supportive macro conditions and renewed ETF inflows.
🎯 Today's Market Outlook
🟢 Bullish scenario: If BTC successfully breaks and holds above $87K–$87.5K, broader risk appetite could increase and today's altcoin leaders could attempt another leg higher.
🟡 Consolidation scenario: If BTC remains below resistance, capital may continue rotating selectively into high-momentum altcoins rather than producing a broad market rally.
🔴 Bearish scenario: If BTC loses its recent support structure while leverage expands, today's high-flying small caps could experience significantly larger percentage declines than BTC.
📌 The most important lesson today: the market is not showing a uniform crypto-wide pump. Instead, it is showing selective altcoin momentum, with RLC and RAD leading aggressively while major meme coins remain comparatively subdued.
🎯 Key levels: Bitcoin holding above the mid-$80K region would support continued altcoin rotation, while a break above roughly $87K–$87.5K could strengthen the broader bullish setup.
⚠️ Risk: Avoid chasing extreme pumps such as RLC's +113%; wait for confirmation or consolidation.
Disclaimer: Binance prices, rankings and volumes change continuously. This analysis is based on the supplied Binance snapshots and is for informational purposes only, not financial advice.
$RLC $RAD $ORCA
{spot}(ORCAUSDT)
{spot}(RADUSDT)
{spot}(RLCUSDT)
#BinanceCryptoMarketAnalysis #AltcoinGainersToday #CryptoMarketMomentum #TopBinanceGainers
Binance Crypto Pulse: Strong Altcoin Gains Despite Mixed Market
📊 Binance Crypto Market Analysis — October 6, 2026
🌐 Overall Crypto Market Snapshot
🟢 Total crypto market capitalization: approximately $2.9 trillion
🟢 24-hour market volume: approximately $85 billion
🟢 BTC dominance: 59.01%
🟢 Fear & Greed Index: 68 — Greed
🟢 Altcoin Season Index: 63/100
🔴 24-hour total market change: approximately -0.36%.
🟡 Bitcoin is around $85,948, down roughly 0.37% on Binance, while Ethereum is near $2,716, down about 0.35%. BNB is around $789 and Solana around $121.
🔥 Top 5 Altcoin Gainers
🥇 RLC: $0.7797 | +113.62% | $155.90M volume
🥈 RAD: $0.345 | +30.19% | $65.69M
🥉 ORCA: $2.42 | +18.08% | $106.66M
4️⃣ EDU: $0.0626 | +17.89% | $29.88M
5️⃣ MOVR: $1.99 | +17.72% | $97.97M
😂 Memecoin market: Meme coins are much weaker than altcoins, with gains mostly limited to around 1–2%.
🐸 Top 5 Memecoin Gainers
🥇 牛来: $0.07859 | +1.75%
🥈 MARSCOIN: $0.1082 | +1.69%
🥉 MUBARAK: $0.07444 | +1.07%
4️⃣ 1MBABYDOGE: $0.0004149 | -0.05%
5️⃣ SHIB: $0.00000587 | -0.34%
📊 Altcoins vs. Memecoins: What Today's Data Shows
🟢 The biggest story is the large performance gap between altcoins and meme tokens.
🟢 The five supplied altcoin gainers average roughly +39.5%, heavily boosted by RLC's extraordinary +113.62% move.
🟡 The five meme tokens average only around +0.82%.
📈 This suggests today's Binance market is experiencing stronger rotation toward individual altcoin opportunities rather than broad-based meme speculation.
🟢 The combined 24-hour volume of the five highlighted altcoin gainers is approximately $456M.
🟢 The five highlighted meme tokens represent approximately $242M in combined 24-hour volume.
⚠️ However, meme-token volume remains concentrated in established names such as SHIB and MUBARAK rather than translating into broad price appreciation.
🧭 What the Broader Market Is Saying
🟢 BTC around $86K: Bitcoin remains the market's primary directional indicator. Binance currently shows BTC near $85,948, while recent market coverage identifies $87K–$87.5K as an important resistance area.
🟢 ETH around $2.7K: Ethereum is relatively stable, with the market watching the October 6 Sepolia testnet activation of the Glamsterdam upgrade. The testnet event is not itself a mainnet upgrade, and no mainnet date has been fixed yet.
🟢 Altcoin breadth: Binance's live rankings show RLC, RAD, NIL, ORCA and MOVR among the strongest gainers, confirming that today's strength is not isolated to one token.
🟢 Market sentiment: A Fear & Greed reading of 68 indicates greed rather than extreme fear, while the 63/100 Altcoin Season Index points toward meaningful altcoin participation.
🟡 Macro backdrop: Citi recently raised its 12-month Bitcoin forecast to $113,000 and its Ether forecast to $3,028, citing stronger crypto activity, supportive macro conditions and renewed ETF inflows.
🎯 Today's Market Outlook
🟢 Bullish scenario: If BTC successfully breaks and holds above $87K–$87.5K, broader risk appetite could increase and today's altcoin leaders could attempt another leg higher.
🟡 Consolidation scenario: If BTC remains below resistance, capital may continue rotating selectively into high-momentum altcoins rather than producing a broad market rally.
🔴 Bearish scenario: If BTC loses its recent support structure while leverage expands, today's high-flying small caps could experience significantly larger percentage declines than BTC.
📌 The most important lesson today: the market is not showing a uniform crypto-wide pump. Instead, it is showing selective altcoin momentum, with RLC and RAD leading aggressively while major meme coins remain comparatively subdued.
🎯 Key levels: Bitcoin holding above the mid-$80K region would support continued altcoin rotation, while a break above roughly $87K–$87.5K could strengthen the broader bullish setup.
⚠️ Risk: Avoid chasing extreme pumps such as RLC's +113%; wait for confirmation or consolidation.
Disclaimer: Binance prices, rankings and volumes change continuously. This analysis is based on the supplied Binance snapshots and is for informational purposes only, not financial advice.
$RLC $RAD $ORCA
#BinanceCryptoMarketAnalysis #AltcoinGainersToday #CryptoMarketMomentum #TopBinanceGainers
🌐 Overall Crypto Market Snapshot
🟢 Total crypto market capitalization: approximately $2.9 trillion
🟢 24-hour market volume: approximately $85 billion
🟢 BTC dominance: 59.01%
🟢 Fear & Greed Index: 68 — Greed
🟢 Altcoin Season Index: 63/100
🔴 24-hour total market change: approximately -0.36%.
🟡 Bitcoin is around $85,948, down roughly 0.37% on Binance, while Ethereum is near $2,716, down about 0.35%. BNB is around $789 and Solana around $121.
🔥 Top 5 Altcoin Gainers
🥇 RLC: $0.7797 | +113.62% | $155.90M volume
🥈 RAD: $0.345 | +30.19% | $65.69M
🥉 ORCA: $2.42 | +18.08% | $106.66M
4️⃣ EDU: $0.0626 | +17.89% | $29.88M
5️⃣ MOVR: $1.99 | +17.72% | $97.97M
😂 Memecoin market: Meme coins are much weaker than altcoins, with gains mostly limited to around 1–2%.
🐸 Top 5 Memecoin Gainers
🥇 牛来: $0.07859 | +1.75%
🥈 MARSCOIN: $0.1082 | +1.69%
🥉 MUBARAK: $0.07444 | +1.07%
4️⃣ 1MBABYDOGE: $0.0004149 | -0.05%
5️⃣ SHIB: $0.00000587 | -0.34%
📊 Altcoins vs. Memecoins: What Today's Data Shows
🟢 The biggest story is the large performance gap between altcoins and meme tokens.
🟢 The five supplied altcoin gainers average roughly +39.5%, heavily boosted by RLC's extraordinary +113.62% move.
🟡 The five meme tokens average only around +0.82%.
📈 This suggests today's Binance market is experiencing stronger rotation toward individual altcoin opportunities rather than broad-based meme speculation.
🟢 The combined 24-hour volume of the five highlighted altcoin gainers is approximately $456M.
🟢 The five highlighted meme tokens represent approximately $242M in combined 24-hour volume.
⚠️ However, meme-token volume remains concentrated in established names such as SHIB and MUBARAK rather than translating into broad price appreciation.
🧭 What the Broader Market Is Saying
🟢 BTC around $86K: Bitcoin remains the market's primary directional indicator. Binance currently shows BTC near $85,948, while recent market coverage identifies $87K–$87.5K as an important resistance area.
🟢 ETH around $2.7K: Ethereum is relatively stable, with the market watching the October 6 Sepolia testnet activation of the Glamsterdam upgrade. The testnet event is not itself a mainnet upgrade, and no mainnet date has been fixed yet.
🟢 Altcoin breadth: Binance's live rankings show RLC, RAD, NIL, ORCA and MOVR among the strongest gainers, confirming that today's strength is not isolated to one token.
🟢 Market sentiment: A Fear & Greed reading of 68 indicates greed rather than extreme fear, while the 63/100 Altcoin Season Index points toward meaningful altcoin participation.
🟡 Macro backdrop: Citi recently raised its 12-month Bitcoin forecast to $113,000 and its Ether forecast to $3,028, citing stronger crypto activity, supportive macro conditions and renewed ETF inflows.
🎯 Today's Market Outlook
🟢 Bullish scenario: If BTC successfully breaks and holds above $87K–$87.5K, broader risk appetite could increase and today's altcoin leaders could attempt another leg higher.
🟡 Consolidation scenario: If BTC remains below resistance, capital may continue rotating selectively into high-momentum altcoins rather than producing a broad market rally.
🔴 Bearish scenario: If BTC loses its recent support structure while leverage expands, today's high-flying small caps could experience significantly larger percentage declines than BTC.
📌 The most important lesson today: the market is not showing a uniform crypto-wide pump. Instead, it is showing selective altcoin momentum, with RLC and RAD leading aggressively while major meme coins remain comparatively subdued.
🎯 Key levels: Bitcoin holding above the mid-$80K region would support continued altcoin rotation, while a break above roughly $87K–$87.5K could strengthen the broader bullish setup.
⚠️ Risk: Avoid chasing extreme pumps such as RLC's +113%; wait for confirmation or consolidation.
Disclaimer: Binance prices, rankings and volumes change continuously. This analysis is based on the supplied Binance snapshots and is for informational purposes only, not financial advice.
$RLC $RAD $ORCA
#BinanceCryptoMarketAnalysis #AltcoinGainersToday #CryptoMarketMomentum #TopBinanceGainers
3
2
9
2.1k
·
--
fida Ahpun
fida Ahpun

Fida Ahpun
·
--
🎁Hy you🫵 claim reward fast👉 🎁 and👇
🎁like
🪺comment
✅share
#GIVEAWAY🎁 #growwithahpun
🎁like
🪺comment
✅share
#GIVEAWAY🎁 #growwithahpun

246
·
--
shaheen bhai
shaheen bhai

Shaheen 69
·
--
Crypto moves fast, but there is no need to chase every candle.
I prefer waiting for confirmation, support, and a clear invalidation level.
Patience is part of trading.
$NIGHT $SAND $GALA
I prefer waiting for confirmation, support, and a clear invalidation level.
Patience is part of trading.
$NIGHT $SAND $GALA

107


·
--
maraish go
maraish go

maraishh
·
--
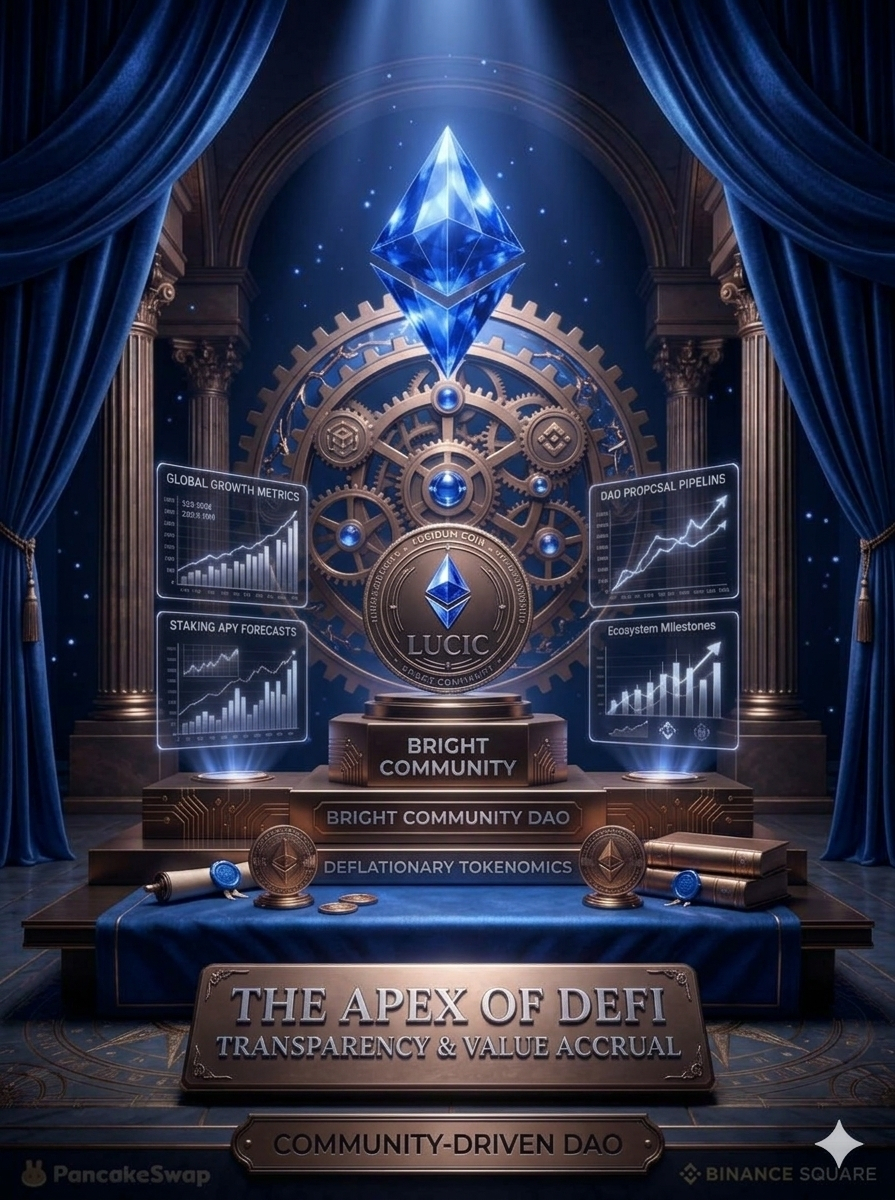
What exactly is Lucidum Coin ($LUCIC)? At its core, it’s a BEP-20 token that combines the viral appeal of meme culture with serious decentralized utility. It addresses common DeFi trust issues by implementing an automatic 1% token burn to reduce supply over time and introducing governance-based NFTs that provide payment bonuses. Through a collective DAO, every holder has a say in the project’s direction
228

·
--
Sophia sis
Sophia sis

苏菲亚 Sophia
·
--
幽林彎月,紅玫瑰環繞珍珠與星鑽。佳人手捧巨鑽,碎鑽簇擁閃耀。玫瑰寄託熾熱情意,鑽石象徵恆久堅定。漫天星點飄落,光暈溫柔籠罩。所有璀璨皆經歷漫長淬煉,歷盡時光洗禮,方能綻放獨屬於自己的永恆光華。
$AMZNB $BTC $SOL
#美联储10月维持利率概率升至82.3% #以太坊Q3涨70%流动性下降 #SHIB通过Sunrise上线Solana
$AMZNB $BTC $SOL
#美联储10月维持利率概率升至82.3% #以太坊Q3涨70%流动性下降 #SHIB通过Sunrise上线Solana

1
193
·
--
block rayne bhai
block rayne bhai

BLOCK Rayne
·
--
🎁🎁Reply today to receive the red envelope 🎁🎁$SOL
🌹Thank you for helping to share and spread the word THS🌹
🌹Thank you for helping to share and spread the word THS🌹

1
191
·
--
hitmans lounge
hitmans lounge

Hitmans Lounge
·
--
Haussier🔥 $HYPE UNLOCK DAY: $340M DROPS, BUT NOT ON YOUR ORDER BOOK 🔥
3.75M $HYPE (~$340M) unlocks on October 6, and this isn't your typical "brace for the dump" event.
👀 The twist: the entire batch goes OTC to ONE institutional buyer. No flood of sell orders and no panic on the order books, at least on paper.
Meanwhile:
🔥 Hyperliquid's buybacks keep running
🔥 Another ~$10M in $HYPE just got burned
📊 Bloomberg Terminal now carries Hyperliquid market data
Supply is coming in while the protocol keeps soaking it up, and Wall Street's terminals are now watching.
The real questions:
1️⃣ Does the OTC buyer hold, or quietly distribute later?
2️⃣ Do buybacks keep outpacing new supply?
3️⃣ Will traders front-run the fear anyway?
Big unlocks usually mean fear. This one is built differently, but the market doesn't always care about structure. 😏
Where do you stand? 👇
🟢 OTC = contained, bullish
🔴 Fear still wins, price dips
⚪ Waiting for the dust to settle
#HYPE #Hyperliquid #TokenUnlock #BinanceLaunchesBinanceIntelligence #EvernorthXRPTreasuryCompletesSPACMerger
3.75M $HYPE (~$340M) unlocks on October 6, and this isn't your typical "brace for the dump" event.
👀 The twist: the entire batch goes OTC to ONE institutional buyer. No flood of sell orders and no panic on the order books, at least on paper.
Meanwhile:
🔥 Hyperliquid's buybacks keep running
🔥 Another ~$10M in $HYPE just got burned
📊 Bloomberg Terminal now carries Hyperliquid market data
Supply is coming in while the protocol keeps soaking it up, and Wall Street's terminals are now watching.
The real questions:
1️⃣ Does the OTC buyer hold, or quietly distribute later?
2️⃣ Do buybacks keep outpacing new supply?
3️⃣ Will traders front-run the fear anyway?
Big unlocks usually mean fear. This one is built differently, but the market doesn't always care about structure. 😏
Where do you stand? 👇
🟢 OTC = contained, bullish
🔴 Fear still wins, price dips
⚪ Waiting for the dust to settle
#HYPE #Hyperliquid #TokenUnlock #BinanceLaunchesBinanceIntelligence #EvernorthXRPTreasuryCompletesSPACMerger

177
·
--
Ezra bro
Ezra bro

Ezra_Insight
·
--
🚨 BTC is setting the tone for the whole market.
Bitcoin is holding its key zone, and the next confirmed move could decide where the liquidity flows next. I’m watching the breakout side closely but no blind entries, confirmation first.
🎁 REWARD BOX 🏆 Join the Red Package
💰 Win exciting rewards
🔥 Trade • Participate • Earn
📈 Bullish: BTC reclaims resistance and holds
📉 Bearish: BTC loses key support with strong selling
BTC moves first.
Altcoins follow. ⚡
#BTC☀ #Bitcoin $BTC
Bitcoin is holding its key zone, and the next confirmed move could decide where the liquidity flows next. I’m watching the breakout side closely but no blind entries, confirmation first.
🎁 REWARD BOX 🏆 Join the Red Package
💰 Win exciting rewards
🔥 Trade • Participate • Earn
📈 Bullish: BTC reclaims resistance and holds
📉 Bearish: BTC loses key support with strong selling
BTC moves first.
Altcoins follow. ⚡
#BTC☀ #Bitcoin $BTC

177
·
--
SNM khan
SNM khan

SNM Khan
·
--
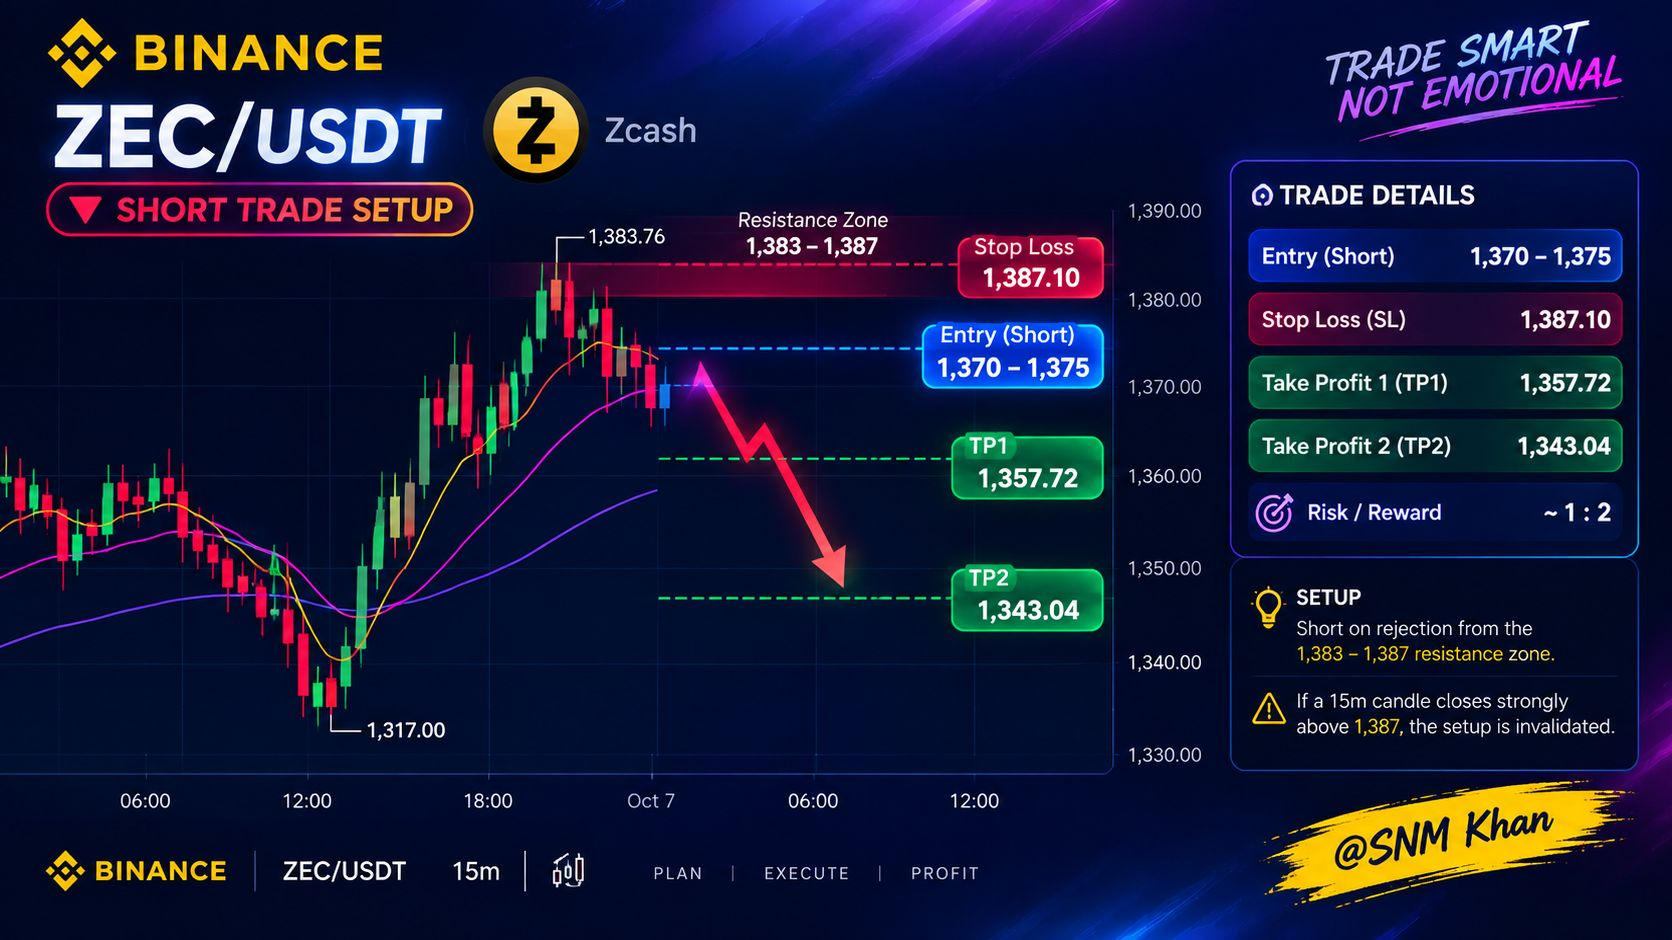
ZEC/USDT — SHORT TRADE SETUP
Entry: 1,370–1,375
Stop Loss: 1,387.10
TP1: 1,357.72
TP2: 1,343.04
Risk/Reward: ~1:2
Setup: Short on rejection from the 1,383–1,387 resistance zone. If a 15m candle closes strongly above 1,387, the setup is invalidated.
⚠️ Chart-based setup only. Trade with proper risk management. #SNM_Khan $ZEC Trade Here 👇 DYOR 👈
Entry: 1,370–1,375
Stop Loss: 1,387.10
TP1: 1,357.72
TP2: 1,343.04
Risk/Reward: ~1:2
Setup: Short on rejection from the 1,383–1,387 resistance zone. If a 15m candle closes strongly above 1,387, the setup is invalidated.
⚠️ Chart-based setup only. Trade with proper risk management. #SNM_Khan $ZEC Trade Here 👇 DYOR 👈
117
·
--
bobby bro
bobby bro

Bobbypk
·
--
Haussier🤷♂️Dear friends very important information that I want to share with you:
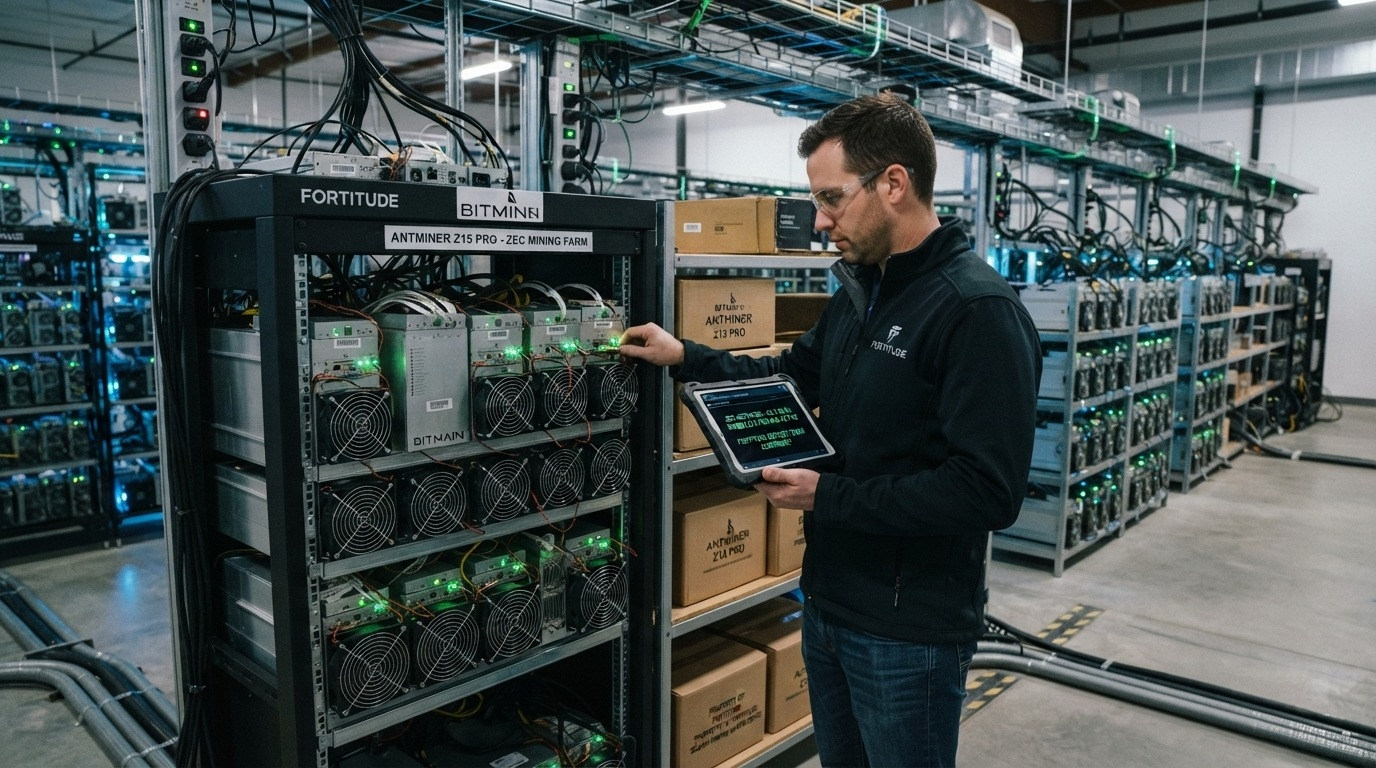
Fortitude just locked in a deal with BITMAIN for priority access to the next generation of Zcash miners up to $100 million worth, no less. And that's on top of an order for 9,000 Z15 Pros.
Here’s why this is interesting: a DCG spinout is stacking its platform around ZEC, with more than 60 MW of contracted power and a $20 million refundable deposit (DCG's supposed to fund that in ZEC). That’s a pretty strong sign institutional money sees privacy tech as a real opportunity.
You can see the momentum gathering around privacy infrastructure. The question now is: will confidential compliance win out, or will standard EVM chains keep their lead?
#BinanceLaunchesBinanceIntelligence
#RLC
#c98
Fortitude just locked in a deal with BITMAIN for priority access to the next generation of Zcash miners up to $100 million worth, no less. And that's on top of an order for 9,000 Z15 Pros.
Here’s why this is interesting: a DCG spinout is stacking its platform around ZEC, with more than 60 MW of contracted power and a $20 million refundable deposit (DCG's supposed to fund that in ZEC). That’s a pretty strong sign institutional money sees privacy tech as a real opportunity.
You can see the momentum gathering around privacy infrastructure. The question now is: will confidential compliance win out, or will standard EVM chains keep their lead?
#BinanceLaunchesBinanceIntelligence
#RLC
#c98
327
·
--
🚀 SpaceX Stock Surges as Musk Rebrands AI Unit to “SpaceXSI”
📈 Stock Jumps on Strong Investor Sentiment
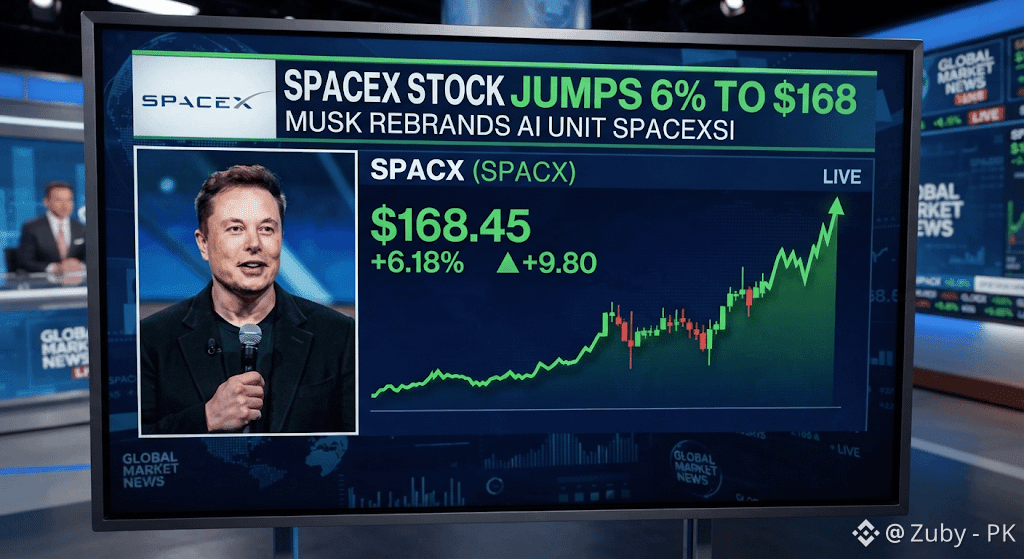
🚀 SpaceX (NASDAQ: SPCX) surged more than 6% on Monday, reaching around $168–$169, as investors reacted to renewed Wall Street optimism and Elon Musk’s rebranding of the company’s AI division.
💰 Morgan Stanley Targets $300
🏦 Morgan Stanley reiterated its Overweight rating and $300 price target, arguing that SpaceX looks relatively attractive when its expected growth is considered.
📊 The bank estimates SpaceX trades at about 30× expected 2028 EV/EBIT, versus roughly 16× for comparable mega-cap AI companies, but its growth-adjusted valuation is considerably lower.
🤖 SpaceXAI Becomes SpaceXSI
🧠 Elon Musk announced that SpaceX’s AI division, SpaceXAI, will be renamed SpaceXSI, with “SI” referring to Super Intelligence.
🚀 The move highlights SpaceX’s expanding ambitions beyond rockets and satellites into AI and computing infrastructure.
🛰️ Starship Flight 15 in Focus
🔥 Investors are now watching Starship Flight 15, which Morgan Stanley views as an important potential catalyst.
🎯 A successful mission milestone, particularly progress toward a “ship catch,” could provide another boost to investor confidence.
⚠️ Valuation Still Raises Questions
⚠️ Despite the bullish outlook, SpaceX carries a very high valuation, making execution critical.
📉 Risks include Starship delays, high capital requirements, AI monetization challenges and uncertainty over how quickly its expanding technology businesses can generate returns.
📊 Key Takeaway
🚀 SPCX: around $168–$171 after Monday’s rally
🎯 Morgan Stanley target: $300
🛰️ Major catalyst: Starship Flight 15
🤖 New AI branding: SpaceXSI
⚠️ Main concern: Extremely high valuation and execution risk
The $300 target is Morgan Stanley’s estimate, not a guaranteed future price.
🔥 #SpaceXStock #SPCXStock #TechStockMomentum
$SPCXB $SPCX
{future}(SPCXUSDT)
{spot}(SPCXBUSDT)
🚀 SpaceX Stock Surges as Musk Rebrands AI Unit to “SpaceXSI”
📈 Stock Jumps on Strong Investor Sentiment
🚀 SpaceX (NASDAQ: SPCX) surged more than 6% on Monday, reaching around $168–$169, as investors reacted to renewed Wall Street optimism and Elon Musk’s rebranding of the company’s AI division.
💰 Morgan Stanley Targets $300
🏦 Morgan Stanley reiterated its Overweight rating and $300 price target, arguing that SpaceX looks relatively attractive when its expected growth is considered.
📊 The bank estimates SpaceX trades at about 30× expected 2028 EV/EBIT, versus roughly 16× for comparable mega-cap AI companies, but its growth-adjusted valuation is considerably lower.
🤖 SpaceXAI Becomes SpaceXSI
🧠 Elon Musk announced that SpaceX’s AI division, SpaceXAI, will be renamed SpaceXSI, with “SI” referring to Super Intelligence.
🚀 The move highlights SpaceX’s expanding ambitions beyond rockets and satellites into AI and computing infrastructure.
🛰️ Starship Flight 15 in Focus
🔥 Investors are now watching Starship Flight 15, which Morgan Stanley views as an important potential catalyst.
🎯 A successful mission milestone, particularly progress toward a “ship catch,” could provide another boost to investor confidence.
⚠️ Valuation Still Raises Questions
⚠️ Despite the bullish outlook, SpaceX carries a very high valuation, making execution critical.
📉 Risks include Starship delays, high capital requirements, AI monetization challenges and uncertainty over how quickly its expanding technology businesses can generate returns.
📊 Key Takeaway
🚀 SPCX: around $168–$171 after Monday’s rally
🎯 Morgan Stanley target: $300
🛰️ Major catalyst: Starship Flight 15
🤖 New AI branding: SpaceXSI
⚠️ Main concern: Extremely high valuation and execution risk
The $300 target is Morgan Stanley’s estimate, not a guaranteed future price.
🔥 #SpaceXStock #SPCXStock #TechStockMomentum
$SPCXB $SPCX
📈 Stock Jumps on Strong Investor Sentiment
🚀 SpaceX (NASDAQ: SPCX) surged more than 6% on Monday, reaching around $168–$169, as investors reacted to renewed Wall Street optimism and Elon Musk’s rebranding of the company’s AI division.
💰 Morgan Stanley Targets $300
🏦 Morgan Stanley reiterated its Overweight rating and $300 price target, arguing that SpaceX looks relatively attractive when its expected growth is considered.
📊 The bank estimates SpaceX trades at about 30× expected 2028 EV/EBIT, versus roughly 16× for comparable mega-cap AI companies, but its growth-adjusted valuation is considerably lower.
🤖 SpaceXAI Becomes SpaceXSI
🧠 Elon Musk announced that SpaceX’s AI division, SpaceXAI, will be renamed SpaceXSI, with “SI” referring to Super Intelligence.
🚀 The move highlights SpaceX’s expanding ambitions beyond rockets and satellites into AI and computing infrastructure.
🛰️ Starship Flight 15 in Focus
🔥 Investors are now watching Starship Flight 15, which Morgan Stanley views as an important potential catalyst.
🎯 A successful mission milestone, particularly progress toward a “ship catch,” could provide another boost to investor confidence.
⚠️ Valuation Still Raises Questions
⚠️ Despite the bullish outlook, SpaceX carries a very high valuation, making execution critical.
📉 Risks include Starship delays, high capital requirements, AI monetization challenges and uncertainty over how quickly its expanding technology businesses can generate returns.
📊 Key Takeaway
🚀 SPCX: around $168–$171 after Monday’s rally
🎯 Morgan Stanley target: $300
🛰️ Major catalyst: Starship Flight 15
🤖 New AI branding: SpaceXSI
⚠️ Main concern: Extremely high valuation and execution risk
The $300 target is Morgan Stanley’s estimate, not a guaranteed future price.
🔥 #SpaceXStock #SPCXStock #TechStockMomentum
$SPCXB $SPCX
2
185
·
--
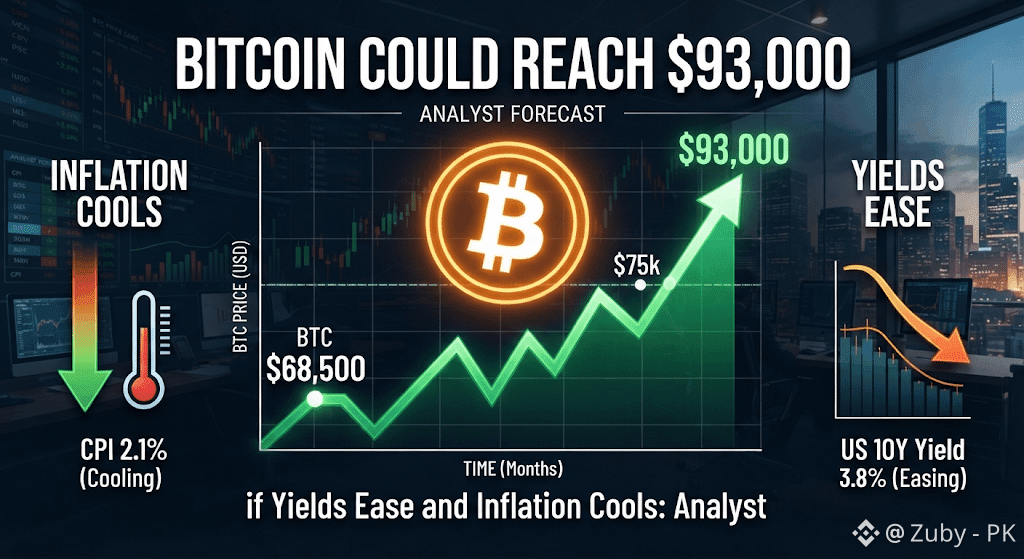
📈 Bitcoin Could Reach $93K If Yields Ease
🚀 $90K–$93K Upside Target
🔹 Bitget Wallet Research Lead Lacie Zhang says Bitcoin could climb toward $90,000–$93,000 if Treasury yields decline and inflation data remains supportive.
🔹 A sustained daily or weekly close above $87,400 could provide stronger confirmation of a breakout.
📉 Fed Rate-Hike Odds Fall
🔹 October Fed rate-hike expectations reportedly dropped to around 23% from 64% in one week.
🔹 Weak September payroll growth of just 29,000 jobs helped reduce expectations for further tightening.
💰 ETF Demand Supports Bitcoin
🔹 U.S. spot Bitcoin ETFs reportedly attracted around $2.65 billion in September, with another $134 million during the first two October trading sessions.
🔹 However, ETF buying has not yet been strong enough to overcome selling pressure around $87,000.
⚠️ Key Risks
🔹 Stronger-than-expected CPI or PPI data could revive inflation concerns and Fed tightening expectations.
🔹 Rising oil prices, hawkish Fed guidance, or higher Treasury yields could push Bitcoin toward $84,000, with $82,000 as another major support.
🎯 Key Bitcoin Levels
🔹 🟢 Breakout: $87,400
🔹 🚀 Targets: $90,000–$93,000
🔹 🟡 Support: $84,000
🔹 🔴 Major Support: $82,000
📊 Market Outlook
🔹 Bitcoin’s next major move will likely depend on Treasury yields, inflation data, ETF flows, and Federal Reserve expectations.
🔹 A sustained move above $87,400 combined with stronger spot and ETF buying could strengthen the bullish case toward $93,000.
#BitcoinBullishBreakoutPotential #BTCKeySupportAndResistance #BitcoinMarketMomentumAnalysis
$BTC
{spot}(BTCUSDT)
📈 Bitcoin Could Reach $93K If Yields Ease
🚀 $90K–$93K Upside Target
🔹 Bitget Wallet Research Lead Lacie Zhang says Bitcoin could climb toward $90,000–$93,000 if Treasury yields decline and inflation data remains supportive.
🔹 A sustained daily or weekly close above $87,400 could provide stronger confirmation of a breakout.
📉 Fed Rate-Hike Odds Fall
🔹 October Fed rate-hike expectations reportedly dropped to around 23% from 64% in one week.
🔹 Weak September payroll growth of just 29,000 jobs helped reduce expectations for further tightening.
💰 ETF Demand Supports Bitcoin
🔹 U.S. spot Bitcoin ETFs reportedly attracted around $2.65 billion in September, with another $134 million during the first two October trading sessions.
🔹 However, ETF buying has not yet been strong enough to overcome selling pressure around $87,000.
⚠️ Key Risks
🔹 Stronger-than-expected CPI or PPI data could revive inflation concerns and Fed tightening expectations.
🔹 Rising oil prices, hawkish Fed guidance, or higher Treasury yields could push Bitcoin toward $84,000, with $82,000 as another major support.
🎯 Key Bitcoin Levels
🔹 🟢 Breakout: $87,400
🔹 🚀 Targets: $90,000–$93,000
🔹 🟡 Support: $84,000
🔹 🔴 Major Support: $82,000
📊 Market Outlook
🔹 Bitcoin’s next major move will likely depend on Treasury yields, inflation data, ETF flows, and Federal Reserve expectations.
🔹 A sustained move above $87,400 combined with stronger spot and ETF buying could strengthen the bullish case toward $93,000.
#BitcoinBullishBreakoutPotential #BTCKeySupportAndResistance #BitcoinMarketMomentumAnalysis
$BTC
🚀 $90K–$93K Upside Target
🔹 Bitget Wallet Research Lead Lacie Zhang says Bitcoin could climb toward $90,000–$93,000 if Treasury yields decline and inflation data remains supportive.
🔹 A sustained daily or weekly close above $87,400 could provide stronger confirmation of a breakout.
📉 Fed Rate-Hike Odds Fall
🔹 October Fed rate-hike expectations reportedly dropped to around 23% from 64% in one week.
🔹 Weak September payroll growth of just 29,000 jobs helped reduce expectations for further tightening.
💰 ETF Demand Supports Bitcoin
🔹 U.S. spot Bitcoin ETFs reportedly attracted around $2.65 billion in September, with another $134 million during the first two October trading sessions.
🔹 However, ETF buying has not yet been strong enough to overcome selling pressure around $87,000.
⚠️ Key Risks
🔹 Stronger-than-expected CPI or PPI data could revive inflation concerns and Fed tightening expectations.
🔹 Rising oil prices, hawkish Fed guidance, or higher Treasury yields could push Bitcoin toward $84,000, with $82,000 as another major support.
🎯 Key Bitcoin Levels
🔹 🟢 Breakout: $87,400
🔹 🚀 Targets: $90,000–$93,000
🔹 🟡 Support: $84,000
🔹 🔴 Major Support: $82,000
📊 Market Outlook
🔹 Bitcoin’s next major move will likely depend on Treasury yields, inflation data, ETF flows, and Federal Reserve expectations.
🔹 A sustained move above $87,400 combined with stronger spot and ETF buying could strengthen the bullish case toward $93,000.
#BitcoinBullishBreakoutPotential #BTCKeySupportAndResistance #BitcoinMarketMomentumAnalysis
$BTC
2
125
·
--
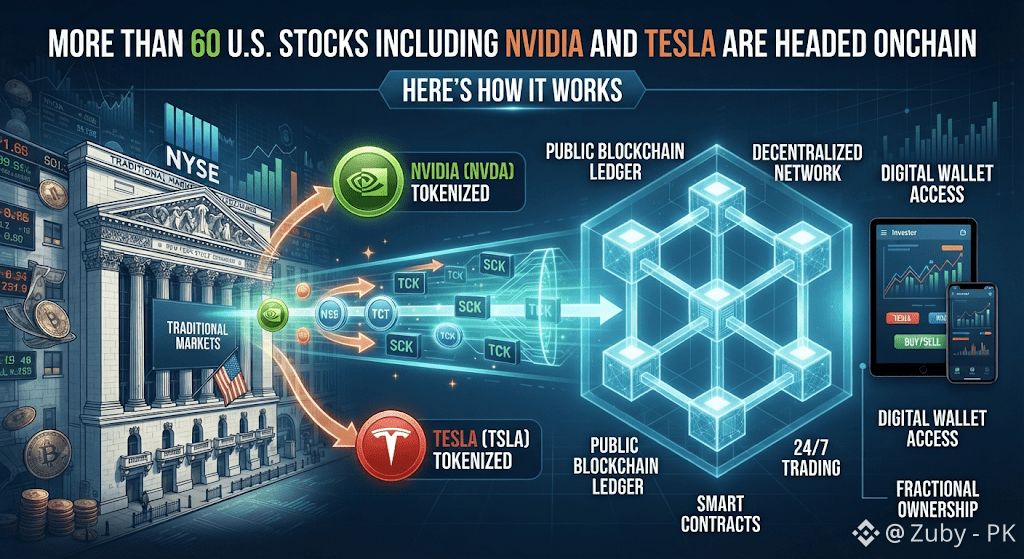
🚀 U.S. Stocks Are Going Onchain
🏦 OKX and ICE, the owner of the New York Stock Exchange, are planning a 24/7 blockchain-based market for tokenized U.S. stocks.
📈 More than 60 companies could be included, such as Nvidia, Tesla, Apple, Microsoft, Amazon and Alphabet, along with Coinbase, Circle and Robinhood.
🔗 How Tokenized Stocks Work
🪙 Instead of buying traditional shares through a brokerage, investors would buy digital tokens representing real stocks.
🔒 The underlying shares would reportedly be held 1:1 by a registered broker-dealer, with token holders receiving economic and shareholder rights such as dividends and voting.
💵 Stablecoins Instead of Dollars
💰 Trading would use USDC, USDT and USDG rather than traditional dollars.
🌐 The platform would operate on XLayer, OKX’s blockchain, using liquidity-pool technology similar to decentralized exchanges.
🔄 24/7 Trading
⏰ Unlike traditional U.S. stock markets, the platform is designed to operate around the clock, including nights and weekends.
📊 Prices would be determined by blockchain-based liquidity pools and automated market makers rather than a traditional stock-market order book.
⚠️ Major Challenges
🚨 Not every stock listed in the filing is guaranteed to launch, and companies can object to being included.
⚖️ Regulatory uncertainty also remains a major concern, while institutional investors may see limited immediate benefits because traditional stock markets already provide efficient access.
🌍 Why It Matters
🔥 OKXICE could become an important real-world test for whether tokenized equities can scale on blockchain infrastructure.
🚀 If successful, 24/7 trading, stablecoin settlement and blockchain-based liquidity could push traditional stocks deeper into the digital-asset ecosystem.
🏷️#TokenizedUSStocksAndBlockchainMarkets
#OnchainEquitiesAnd24HourStockTrading
#BlockchainPoweredGlobalEquityMarkets
#StablecoinPoweredStockTradingFuture
$NVDAB $AAPLB $MSFTB
{spot}(MSFTBUSDT)
{spot}(AAPLBUSDT)
{spot}(NVDABUSDT)
🚀 U.S. Stocks Are Going Onchain
🏦 OKX and ICE, the owner of the New York Stock Exchange, are planning a 24/7 blockchain-based market for tokenized U.S. stocks.
📈 More than 60 companies could be included, such as Nvidia, Tesla, Apple, Microsoft, Amazon and Alphabet, along with Coinbase, Circle and Robinhood.
🔗 How Tokenized Stocks Work
🪙 Instead of buying traditional shares through a brokerage, investors would buy digital tokens representing real stocks.
🔒 The underlying shares would reportedly be held 1:1 by a registered broker-dealer, with token holders receiving economic and shareholder rights such as dividends and voting.
💵 Stablecoins Instead of Dollars
💰 Trading would use USDC, USDT and USDG rather than traditional dollars.
🌐 The platform would operate on XLayer, OKX’s blockchain, using liquidity-pool technology similar to decentralized exchanges.
🔄 24/7 Trading
⏰ Unlike traditional U.S. stock markets, the platform is designed to operate around the clock, including nights and weekends.
📊 Prices would be determined by blockchain-based liquidity pools and automated market makers rather than a traditional stock-market order book.
⚠️ Major Challenges
🚨 Not every stock listed in the filing is guaranteed to launch, and companies can object to being included.
⚖️ Regulatory uncertainty also remains a major concern, while institutional investors may see limited immediate benefits because traditional stock markets already provide efficient access.
🌍 Why It Matters
🔥 OKXICE could become an important real-world test for whether tokenized equities can scale on blockchain infrastructure.
🚀 If successful, 24/7 trading, stablecoin settlement and blockchain-based liquidity could push traditional stocks deeper into the digital-asset ecosystem.
🏷️#TokenizedUSStocksAndBlockchainMarkets
#OnchainEquitiesAnd24HourStockTrading
#BlockchainPoweredGlobalEquityMarkets
#StablecoinPoweredStockTradingFuture
$NVDAB $AAPLB $MSFTB
🏦 OKX and ICE, the owner of the New York Stock Exchange, are planning a 24/7 blockchain-based market for tokenized U.S. stocks.
📈 More than 60 companies could be included, such as Nvidia, Tesla, Apple, Microsoft, Amazon and Alphabet, along with Coinbase, Circle and Robinhood.
🔗 How Tokenized Stocks Work
🪙 Instead of buying traditional shares through a brokerage, investors would buy digital tokens representing real stocks.
🔒 The underlying shares would reportedly be held 1:1 by a registered broker-dealer, with token holders receiving economic and shareholder rights such as dividends and voting.
💵 Stablecoins Instead of Dollars
💰 Trading would use USDC, USDT and USDG rather than traditional dollars.
🌐 The platform would operate on XLayer, OKX’s blockchain, using liquidity-pool technology similar to decentralized exchanges.
🔄 24/7 Trading
⏰ Unlike traditional U.S. stock markets, the platform is designed to operate around the clock, including nights and weekends.
📊 Prices would be determined by blockchain-based liquidity pools and automated market makers rather than a traditional stock-market order book.
⚠️ Major Challenges
🚨 Not every stock listed in the filing is guaranteed to launch, and companies can object to being included.
⚖️ Regulatory uncertainty also remains a major concern, while institutional investors may see limited immediate benefits because traditional stock markets already provide efficient access.
🌍 Why It Matters
🔥 OKXICE could become an important real-world test for whether tokenized equities can scale on blockchain infrastructure.
🚀 If successful, 24/7 trading, stablecoin settlement and blockchain-based liquidity could push traditional stocks deeper into the digital-asset ecosystem.
🏷️#TokenizedUSStocksAndBlockchainMarkets
#OnchainEquitiesAnd24HourStockTrading
#BlockchainPoweredGlobalEquityMarkets
#StablecoinPoweredStockTradingFuture
$NVDAB $AAPLB $MSFTB
2
107
·
--
⚖️ This Week in Crypto Law — October 4, 2026
🇺🇸 OCC Crypto Bank Charters: The Independent Community Bankers of America sued the OCC over its crypto trust-bank framework, potentially creating uncertainty for crypto firms pursuing national trust charters.
💵 Tether Under Scrutiny: Senate investigators renewed questions about Tether’s sanctions controls after reviewing 846 Iran-linked wallets. Tether said it has cooperated with authorities and frozen about $550 million in related assets during 2026.
🇪🇺 MiCA Expansion: ESMA proposed stronger MiCA oversight covering DeFi access, staking, lending, borrowing, stablecoins, marketing, and enforcement. These are recommendations, not yet new laws.
🇬🇧 UK Crypto Licensing: The FCA opened applications under the UK's new crypto regime. Firms can apply through February 28, 2027, ahead of the planned October 25, 2027 launch.
📌 Key Takeaway: Crypto businesses should increasingly focus on licensing, sanctions compliance, stablecoin exposure, DeFi activities, and regulatory documentation as global oversight becomes stricter.
⚠️ Disclaimer: This content is for informational and educational purposes only and does not constitute legal, financial, investment, trading, or regulatory advice.
#GlobalCryptocurrencyRegulatoryDevelopments
#USCryptoRegulationAndEnforcement
#EuropeanMiCARegulatoryDevelopments
#UKCryptoAuthorizationAndLicensing
⚖️ This Week in Crypto Law — October 4, 2026
🇺🇸 OCC Crypto Bank Charters: The Independent Community Bankers of America sued the OCC over its crypto trust-bank framework, potentially creating uncertainty for crypto firms pursuing national trust charters.
💵 Tether Under Scrutiny: Senate investigators renewed questions about Tether’s sanctions controls after reviewing 846 Iran-linked wallets. Tether said it has cooperated with authorities and frozen about $550 million in related assets during 2026.
🇪🇺 MiCA Expansion: ESMA proposed stronger MiCA oversight covering DeFi access, staking, lending, borrowing, stablecoins, marketing, and enforcement. These are recommendations, not yet new laws.
🇬🇧 UK Crypto Licensing: The FCA opened applications under the UK's new crypto regime. Firms can apply through February 28, 2027, ahead of the planned October 25, 2027 launch.
📌 Key Takeaway: Crypto businesses should increasingly focus on licensing, sanctions compliance, stablecoin exposure, DeFi activities, and regulatory documentation as global oversight becomes stricter.
⚠️ Disclaimer: This content is for informational and educational purposes only and does not constitute legal, financial, investment, trading, or regulatory advice.
#GlobalCryptocurrencyRegulatoryDevelopments
#USCryptoRegulationAndEnforcement
#EuropeanMiCARegulatoryDevelopments
#UKCryptoAuthorizationAndLicensing
🇺🇸 OCC Crypto Bank Charters: The Independent Community Bankers of America sued the OCC over its crypto trust-bank framework, potentially creating uncertainty for crypto firms pursuing national trust charters.
💵 Tether Under Scrutiny: Senate investigators renewed questions about Tether’s sanctions controls after reviewing 846 Iran-linked wallets. Tether said it has cooperated with authorities and frozen about $550 million in related assets during 2026.
🇪🇺 MiCA Expansion: ESMA proposed stronger MiCA oversight covering DeFi access, staking, lending, borrowing, stablecoins, marketing, and enforcement. These are recommendations, not yet new laws.
🇬🇧 UK Crypto Licensing: The FCA opened applications under the UK's new crypto regime. Firms can apply through February 28, 2027, ahead of the planned October 25, 2027 launch.
📌 Key Takeaway: Crypto businesses should increasingly focus on licensing, sanctions compliance, stablecoin exposure, DeFi activities, and regulatory documentation as global oversight becomes stricter.
⚠️ Disclaimer: This content is for informational and educational purposes only and does not constitute legal, financial, investment, trading, or regulatory advice.
#GlobalCryptocurrencyRegulatoryDevelopments
#USCryptoRegulationAndEnforcement
#EuropeanMiCARegulatoryDevelopments
#UKCryptoAuthorizationAndLicensing

5
310
·
--
Article
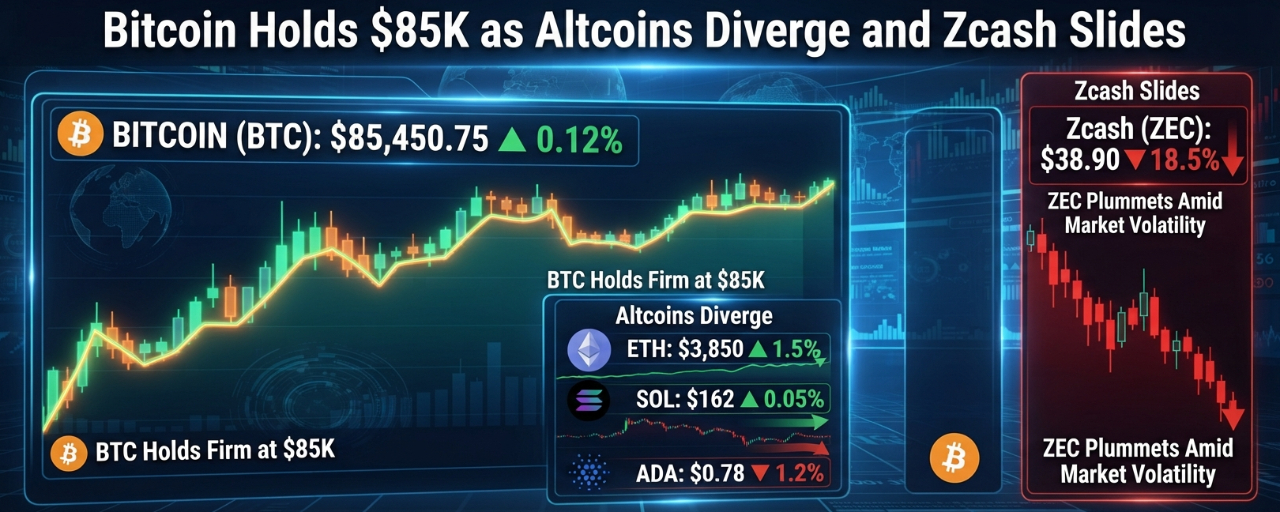
Bitcoin Holds $85K as Altcoins Diverge and Zcash Slides📊 Crypto Weekly Market Recap
🟢 Market Recovery: The crypto market finished the week nearly flat after recovering from a Sept. 29 sell-off that wiped out roughly $50 billion in total market value.
🛢️ Macro Pressure: Rising oil prices and higher U.S. Treasury yields initially pushed total crypto capitalization down toward $2.95 trillion.
₿ Bitcoin: BTC ended September with a 7% monthly gain, while its year-to-date decline narrowed to around 4%. After dipping below $83,000, Bitcoin briefly climbed to $87,217 on Oct. 2 before falling back toward $84,250. A weekend rebound lifted BTC to about $85,500, giving it a weekly gain of nearly 1% and a market cap above $1.7 trillion.
🔷 Ethereum: ETH remained largely range-bound, reaching around $2,754 before retreating and recovering toward $2,700. It finished the week approximately 0.4% higher.
🟡 BNB: BNB showed relative strength, rising from roughly $778 to $789, gaining more than 1% for the week.
🚀 Strong Altcoins: Quant (QNT) jumped approximately 39%, while Hedera (HBAR) gained around 9%, making them standout performers among major altcoins.
🔴 Zcash: ZEC suffered one of the sharpest reversals, falling about 17% from above $1,600 to around $1,332, despite being one of September’s strongest high-cap performers.
📉 Other Losers: RAIN declined around 9%, NEAR dropped 8.6%, UNI lost 7.3%, and BCH fell approximately 5.2%.
📊 Altcoin Market Cap: The combined market capitalization of major altcoins declined from around $1.3 trillion to $1.285 trillion during the week.
🔎 Key Takeaway
📌 Bitcoin and Ethereum are continuing to hold important support zones, but the market remains highly sensitive to oil prices, Treasury yields, macroeconomic expectations and risk sentiment.
⚠️ Disclaimer: This content is for informational and educational purposes only and does not constitute financial, investment, trading, or legal advice.
#CryptoMarketWeeklyUpdate #BitcoinAndEthereumAnalysis #AltcoinMarketPerformance
#AltcoinTradingMarketUpdate #BlockchainMarketWeeklyReview
$BTC $ETH $ZEC
{spot}(ZECUSDT)
{spot}(ETHUSDT)
{spot}(BTCUSDT)
Bitcoin Holds $85K as Altcoins Diverge and Zcash Slides
📊 Crypto Weekly Market Recap
🟢 Market Recovery: The crypto market finished the week nearly flat after recovering from a Sept. 29 sell-off that wiped out roughly $50 billion in total market value.
🛢️ Macro Pressure: Rising oil prices and higher U.S. Treasury yields initially pushed total crypto capitalization down toward $2.95 trillion.
₿ Bitcoin: BTC ended September with a 7% monthly gain, while its year-to-date decline narrowed to around 4%. After dipping below $83,000, Bitcoin briefly climbed to $87,217 on Oct. 2 before falling back toward $84,250. A weekend rebound lifted BTC to about $85,500, giving it a weekly gain of nearly 1% and a market cap above $1.7 trillion.
🔷 Ethereum: ETH remained largely range-bound, reaching around $2,754 before retreating and recovering toward $2,700. It finished the week approximately 0.4% higher.
🟡 BNB: BNB showed relative strength, rising from roughly $778 to $789, gaining more than 1% for the week.
🚀 Strong Altcoins: Quant (QNT) jumped approximately 39%, while Hedera (HBAR) gained around 9%, making them standout performers among major altcoins.
🔴 Zcash: ZEC suffered one of the sharpest reversals, falling about 17% from above $1,600 to around $1,332, despite being one of September’s strongest high-cap performers.
📉 Other Losers: RAIN declined around 9%, NEAR dropped 8.6%, UNI lost 7.3%, and BCH fell approximately 5.2%.
📊 Altcoin Market Cap: The combined market capitalization of major altcoins declined from around $1.3 trillion to $1.285 trillion during the week.
🔎 Key Takeaway
📌 Bitcoin and Ethereum are continuing to hold important support zones, but the market remains highly sensitive to oil prices, Treasury yields, macroeconomic expectations and risk sentiment.
⚠️ Disclaimer: This content is for informational and educational purposes only and does not constitute financial, investment, trading, or legal advice.
#CryptoMarketWeeklyUpdate #BitcoinAndEthereumAnalysis #AltcoinMarketPerformance
#AltcoinTradingMarketUpdate #BlockchainMarketWeeklyReview
$BTC $ETH $ZEC
🟢 Market Recovery: The crypto market finished the week nearly flat after recovering from a Sept. 29 sell-off that wiped out roughly $50 billion in total market value.
🛢️ Macro Pressure: Rising oil prices and higher U.S. Treasury yields initially pushed total crypto capitalization down toward $2.95 trillion.
₿ Bitcoin: BTC ended September with a 7% monthly gain, while its year-to-date decline narrowed to around 4%. After dipping below $83,000, Bitcoin briefly climbed to $87,217 on Oct. 2 before falling back toward $84,250. A weekend rebound lifted BTC to about $85,500, giving it a weekly gain of nearly 1% and a market cap above $1.7 trillion.
🔷 Ethereum: ETH remained largely range-bound, reaching around $2,754 before retreating and recovering toward $2,700. It finished the week approximately 0.4% higher.
🟡 BNB: BNB showed relative strength, rising from roughly $778 to $789, gaining more than 1% for the week.
🚀 Strong Altcoins: Quant (QNT) jumped approximately 39%, while Hedera (HBAR) gained around 9%, making them standout performers among major altcoins.
🔴 Zcash: ZEC suffered one of the sharpest reversals, falling about 17% from above $1,600 to around $1,332, despite being one of September’s strongest high-cap performers.
📉 Other Losers: RAIN declined around 9%, NEAR dropped 8.6%, UNI lost 7.3%, and BCH fell approximately 5.2%.
📊 Altcoin Market Cap: The combined market capitalization of major altcoins declined from around $1.3 trillion to $1.285 trillion during the week.
🔎 Key Takeaway
📌 Bitcoin and Ethereum are continuing to hold important support zones, but the market remains highly sensitive to oil prices, Treasury yields, macroeconomic expectations and risk sentiment.
⚠️ Disclaimer: This content is for informational and educational purposes only and does not constitute financial, investment, trading, or legal advice.
#CryptoMarketWeeklyUpdate #BitcoinAndEthereumAnalysis #AltcoinMarketPerformance
#AltcoinTradingMarketUpdate #BlockchainMarketWeeklyReview
$BTC $ETH $ZEC
3
342
·
--
Article
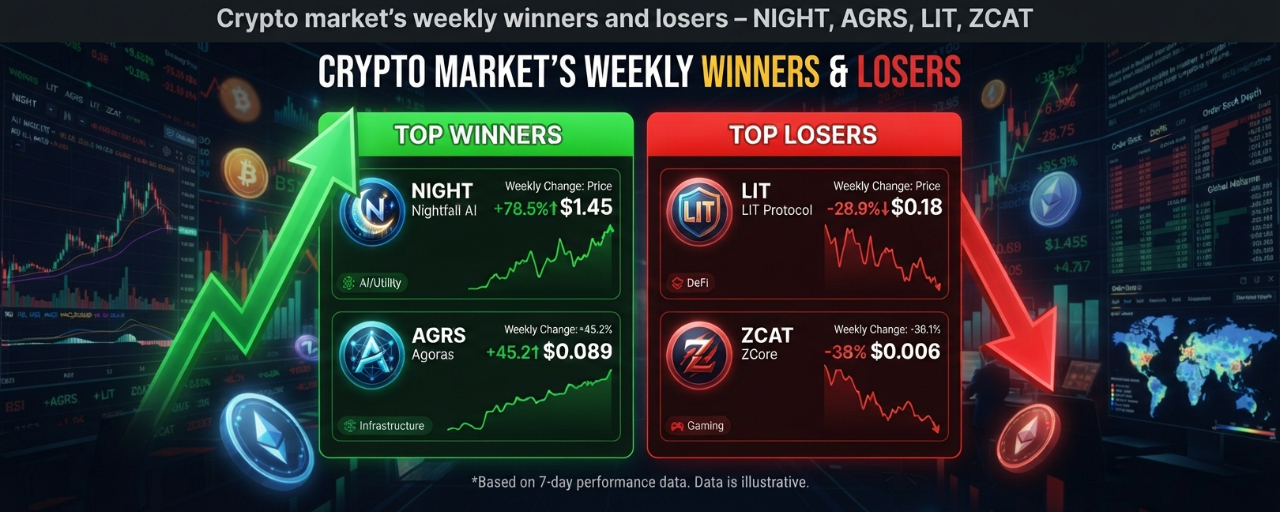
Crypto Market Weekly Report: The Biggest Movers You Need to Watch📊 Crypto Market Weekly Winners & Losers
🌐 Market Overview
📈 Bitcoin briefly climbed above $87K before slipping below $84K, while Citi raised its 12-month BTC target to $113K.
🔄 Altcoin performance was mixed, with several mid-caps outperforming while major assets struggled to maintain momentum.
🚀 Weekly Winners
🌙 Midnight (NIGHT) — +85%
🔥 NIGHT posted its fifth straight weekly gain, returning near the $0.05 zone.
📊 RSI remains supportive without reaching extreme overbought levels.
🎯 Holding above $0.05 could open the door to further upside, while profit-taking remains a risk.
⚡ Quant (QNT) — +50%
📈 QNT continued its strong rally after a massive previous-week surge.
⚠️ However, its weekly RSI signals heavily overbought conditions.
🎯 Holding around $260 could support another move toward $300.
🐸 Pump.fun (PUMP) — +25%
📈 PUMP gained for the third consecutive week and returned toward the $0.06 area.
💪 RSI remains below overbought territory, suggesting room for additional upside.
🚀 A breakout above $0.06 could potentially push PUMP toward $0.08.
🏆 Other Winners
🚀 AGRS surged 278%, POD gained 163%, while HOOKR jumped 113%.
📉 Weekly Losers
🔻 Lighter (LIT) — -20%
⚠️ LIT suffered its biggest weekly correction after reaching above $5.
🎯 The $3.50 area is now crucial support. Losing it could trigger further downside, while a defense could set up another recovery.
🛡️ Zcash (ZEC) — -16.7%
📉 ZEC entered a cooldown after its strong previous rally.
📊 RSI remains relatively moderate, keeping the possibility of another recovery wave alive.
🚀 Its broader bullish structure remains intact for now.
💰 Dash (DASH) — -12%
📊 DASH continues consolidating between $55–$60.
💪 Cooling RSI could give bulls room to recover.
🎯 A breakout above $60 could signal renewed bullish momentum.
🔻 Other Losers
🐱 ZCAT plunged 58%, AI dropped 55%, and BR declined 52% as momentum weakened sharply.
🧭 Key Takeaway
🔥 NIGHT, QNT and PUMP were among the strongest performers.
⚠️ LIT, ZEC and DASH faced notable corrections but still have important technical levels to watch.
📌 Overall, the market remains highly volatile, making risk management and confirmation essential.
📢 This content is for informational and educational purposes only and does not constitute financial, investment, trading, or legal advice. ⚠️
🏷️#CryptoMarketWeeklyWinnersAndLosers #AltcoinWinnersAndLosersWeeklyAnalysis #CryptoMarketMomentumAndTrendAnalysis
$ZEC $PUMP $LIT
{future}(LITUSDT)
{spot}(PUMPUSDT)
{spot}(ZECUSDT)
Crypto Market Weekly Report: The Biggest Movers You Need to Watch
📊 Crypto Market Weekly Winners & Losers
🌐 Market Overview
📈 Bitcoin briefly climbed above $87K before slipping below $84K, while Citi raised its 12-month BTC target to $113K.
🔄 Altcoin performance was mixed, with several mid-caps outperforming while major assets struggled to maintain momentum.
🚀 Weekly Winners
🌙 Midnight (NIGHT) — +85%
🔥 NIGHT posted its fifth straight weekly gain, returning near the $0.05 zone.
📊 RSI remains supportive without reaching extreme overbought levels.
🎯 Holding above $0.05 could open the door to further upside, while profit-taking remains a risk.
⚡ Quant (QNT) — +50%
📈 QNT continued its strong rally after a massive previous-week surge.
⚠️ However, its weekly RSI signals heavily overbought conditions.
🎯 Holding around $260 could support another move toward $300.
🐸 Pump.fun (PUMP) — +25%
📈 PUMP gained for the third consecutive week and returned toward the $0.06 area.
💪 RSI remains below overbought territory, suggesting room for additional upside.
🚀 A breakout above $0.06 could potentially push PUMP toward $0.08.
🏆 Other Winners
🚀 AGRS surged 278%, POD gained 163%, while HOOKR jumped 113%.
📉 Weekly Losers
🔻 Lighter (LIT) — -20%
⚠️ LIT suffered its biggest weekly correction after reaching above $5.
🎯 The $3.50 area is now crucial support. Losing it could trigger further downside, while a defense could set up another recovery.
🛡️ Zcash (ZEC) — -16.7%
📉 ZEC entered a cooldown after its strong previous rally.
📊 RSI remains relatively moderate, keeping the possibility of another recovery wave alive.
🚀 Its broader bullish structure remains intact for now.
💰 Dash (DASH) — -12%
📊 DASH continues consolidating between $55–$60.
💪 Cooling RSI could give bulls room to recover.
🎯 A breakout above $60 could signal renewed bullish momentum.
🔻 Other Losers
🐱 ZCAT plunged 58%, AI dropped 55%, and BR declined 52% as momentum weakened sharply.
🧭 Key Takeaway
🔥 NIGHT, QNT and PUMP were among the strongest performers.
⚠️ LIT, ZEC and DASH faced notable corrections but still have important technical levels to watch.
📌 Overall, the market remains highly volatile, making risk management and confirmation essential.
📢 This content is for informational and educational purposes only and does not constitute financial, investment, trading, or legal advice. ⚠️
🏷️#CryptoMarketWeeklyWinnersAndLosers #AltcoinWinnersAndLosersWeeklyAnalysis #CryptoMarketMomentumAndTrendAnalysis
$ZEC $PUMP $LIT
🌐 Market Overview
📈 Bitcoin briefly climbed above $87K before slipping below $84K, while Citi raised its 12-month BTC target to $113K.
🔄 Altcoin performance was mixed, with several mid-caps outperforming while major assets struggled to maintain momentum.
🚀 Weekly Winners
🌙 Midnight (NIGHT) — +85%
🔥 NIGHT posted its fifth straight weekly gain, returning near the $0.05 zone.
📊 RSI remains supportive without reaching extreme overbought levels.
🎯 Holding above $0.05 could open the door to further upside, while profit-taking remains a risk.
⚡ Quant (QNT) — +50%
📈 QNT continued its strong rally after a massive previous-week surge.
⚠️ However, its weekly RSI signals heavily overbought conditions.
🎯 Holding around $260 could support another move toward $300.
🐸 Pump.fun (PUMP) — +25%
📈 PUMP gained for the third consecutive week and returned toward the $0.06 area.
💪 RSI remains below overbought territory, suggesting room for additional upside.
🚀 A breakout above $0.06 could potentially push PUMP toward $0.08.
🏆 Other Winners
🚀 AGRS surged 278%, POD gained 163%, while HOOKR jumped 113%.
📉 Weekly Losers
🔻 Lighter (LIT) — -20%
⚠️ LIT suffered its biggest weekly correction after reaching above $5.
🎯 The $3.50 area is now crucial support. Losing it could trigger further downside, while a defense could set up another recovery.
🛡️ Zcash (ZEC) — -16.7%
📉 ZEC entered a cooldown after its strong previous rally.
📊 RSI remains relatively moderate, keeping the possibility of another recovery wave alive.
🚀 Its broader bullish structure remains intact for now.
💰 Dash (DASH) — -12%
📊 DASH continues consolidating between $55–$60.
💪 Cooling RSI could give bulls room to recover.
🎯 A breakout above $60 could signal renewed bullish momentum.
🔻 Other Losers
🐱 ZCAT plunged 58%, AI dropped 55%, and BR declined 52% as momentum weakened sharply.
🧭 Key Takeaway
🔥 NIGHT, QNT and PUMP were among the strongest performers.
⚠️ LIT, ZEC and DASH faced notable corrections but still have important technical levels to watch.
📌 Overall, the market remains highly volatile, making risk management and confirmation essential.
📢 This content is for informational and educational purposes only and does not constitute financial, investment, trading, or legal advice. ⚠️
🏷️#CryptoMarketWeeklyWinnersAndLosers #AltcoinWinnersAndLosersWeeklyAnalysis #CryptoMarketMomentumAndTrendAnalysis
$ZEC $PUMP $LIT
2
950
·
--
Article
Binance Market Surge: Altcoins & Memecoins Take the Spotlight📊 Crypto Market Analysis — October 5, 2026
🔥 Binance Altcoin & Memecoin Gainers Today
Binance’s live market page currently shows a risk-on crypto environment: total market capitalization is around $2.9T, up about 1.7%–1.8% over 24 hours, while BTC dominance is around 59.1%. Binance’s Fear & Greed Index is 70 (Greed) and its Altcoin Season Index is 59/100, suggesting improving risk appetite but not yet a broad, full-scale altcoin season.
Market Overview & Macro Context
📈 The broader crypto market is currently experiencing localized sector rotations and aggressive speculative plays.🌐 Bitcoin and major layer-1 assets are hovering around their established ranges, keeping overall market cap stability high.💡 Liquidity is selectively flowing into high-beta altcoins and narrative-driven memecoins, creating explosive double-digit daily breakouts among smaller-cap assets.
Top 5 Altcoin Gainers
🚀 GTC (Gitcoin)📊 24h Change: +96.68%💵 Price: $0.22895📈 24h Volume: $74.71M💼 Market Cap: $22.37M📝 Analysis: GTC led the pack with a massive nearly 100% surge. Given its low relative market cap, even moderate inflows triggered a sharp vertical breakout.⚡ BEAMX (Beam)📊 24h Change: +16.94%💵 Price: $0.002492📈 24h Volume: $91.37M💼 Market Cap: $128.66M📝 Analysis: Beam exhibits strong gaming and ecosystem liquidity with high trading volume relative to its valuation.💧 NILE (Nillion)📊 24h Change: +15.38%💵 Price: $0.09428📈 24h Volume: $24.73M💼 Market Cap: $52.84M📝 Analysis: Steady mid-tier push backed by privacy and computation narrative interest.🧠 FET (Artificial Superintelligence Alliance)📊 24h Change: +15.12%💵 Price: $0.2581📈 24h Volume: $305.54M💼 Market Cap: $698.68M📝 Analysis: FET stands out as a high-cap leader with immense volume, indicating genuine institutional and retail capital moving into AI utility tokens.🐋 ORCA (Killer whale / Orca)📊 24h Change: +13.20%💵 Price: $2.04📈 24h Volume: $85.43M💼 Market Cap: $123.90M📝 Analysis: Solid decentralized exchange token performance reflecting robust trading activity on underlying networks.
Top 5 Memecoin Gainers
🧪 TST (Test)📊 24h Change: +8.55%💵 Price: $0.01866📈 24h Volume: $21.72M💼 Market Cap: $17.61M📝 Analysis: TST leads the meme category with steady momentum, though low market capitalization makes it highly volatile.🐧 PENGU (Pudgy Penguins)📊 24h Change: +6.73%💵 Price: $0.009806📈 24h Volume: $140.38M💼 Market Cap: $617.79M📝 Analysis: PENGU continues to prove its status as a premier IP-backed brand token with elite daily trading volume supporting its valuation.🥦 BROCCOLI714 (CZ's Dog)📊 24h Change: +6.33%💵 Price: $0.0277📈 24h Volume: $5.83M💼 Market Cap: $26.76M📝 Analysis: Narrative-driven community token tied to ecosystem lore, experiencing minor capital rotation upside.🐕 FLOKI (Floki)📊 24h Change: +6.30%💵 Price: $0.00002904📈 24h Volume: $44.91M💼 Market Cap: $278.97M📝 Analysis: FLOKI blends utility features with meme branding, maintaining a stable mid-cap presence.🎉 MUBARAK (Happy)📊 24h Change: +4.78%💵 Price: $0.06726📈 24h Volume: $104.75M💼 Market Cap: $67.09M📝 Analysis: Supported by strong, speculative volume relative to its market cap, indicating active short-term trader participation.
Actionable Takeaways & Risk Management
🌊 Liquidity Divergence: High volume anchors like FET and PENGU show that capital is prioritizing tokens with established ecosystems and deep liquidity pools rather than blind micro-cap gambling.⚠️ Volatility Warning: Extreme gainers like GTC (+96%) carry immense reversal risk; profit-taking can occur rapidly after parabolic single-day moves
📈 What the Market Is Saying Today
🟢 1. Risk appetite is returning
A $2.9T market cap, roughly +1.7% 24-hour market growth, and a 70 Fear & Greed reading point toward a clearly risk-on environment.
🟡 2. Bitcoin still controls the market
BTC dominance around 59.1% means capital has not completely rotated into altcoins. This is important: the current environment looks more like Bitcoin-led strength followed by selective altcoin rotation than a classic broad altseason.
Recent market data also shows Bitcoin around $86K–$87K, while Ethereum is around $2.7K, reinforcing the broader recovery tone.
🔥 3. Altcoin participation is improving
The 59/100 Altcoin Season Index is particularly notable. It suggests that a meaningful portion of the market is outperforming Bitcoin, but the market has not yet reached the kind of widespread altcoin participation normally associated with an extreme altseason.
🐸 4. Memecoin speculation is returning selectively
The strongest meme-oriented moves are substantially larger than many established altcoins. However, several of these tokens have market caps below $10M, meaning low liquidity can exaggerate percentage gains and losses.
That makes volume more important than percentage gain alone.
⚠️ 5. Today's biggest warning: chasing vertical pumps
A coin such as GTC at +53% or a micro-cap meme token above +50% can continue higher—but it can also experience a sharp retracement once early buyers take profits.
📌 Key takeaway
Today's market is bullish, but it is not yet a “buy everything” environment. The strongest signal is the combination of rising total market capitalization, Greed sentiment, and increasing altcoin participation. At the same time, BTC dominance near 59% tells us that Bitcoin remains firmly in control.
For traders, GTC, BEAM, AXS, ORCA and FET are the more meaningful altcoin momentum names today, while the meme sector is producing much sharper—but considerably riskier—moves.
⚠️ Disclaimer: Cryptocurrency prices and Binance gainer rankings change continuously. This is market analysis, not financial advice. High-percentage gainers, especially low-market-cap memecoins, carry substantial volatility and liquidity risk. Always conduct your own research and use appropriate risk management.
#BinanceGainersToday #AltcoinMarketAnalysis #MemecoinMarketMomentum
$GTC $BEAMX $NIL
{spot}(NILUSDT)
{spot}(BEAMXUSDT)
{spot}(GTCUSDT)
Binance Market Surge: Altcoins & Memecoins Take the Spotlight
📊 Crypto Market Analysis — October 5, 2026
🔥 Binance Altcoin & Memecoin Gainers Today
Binance’s live market page currently shows a risk-on crypto environment: total market capitalization is around $2.9T, up about 1.7%–1.8% over 24 hours, while BTC dominance is around 59.1%. Binance’s Fear & Greed Index is 70 (Greed) and its Altcoin Season Index is 59/100, suggesting improving risk appetite but not yet a broad, full-scale altcoin season.
Market Overview & Macro Context
📈 The broader crypto market is currently experiencing localized sector rotations and aggressive speculative plays.🌐 Bitcoin and major layer-1 assets are hovering around their established ranges, keeping overall market cap stability high.💡 Liquidity is selectively flowing into high-beta altcoins and narrative-driven memecoins, creating explosive double-digit daily breakouts among smaller-cap assets.
Top 5 Altcoin Gainers
🚀 GTC (Gitcoin)📊 24h Change: +96.68%💵 Price: $0.22895📈 24h Volume: $74.71M💼 Market Cap: $22.37M📝 Analysis: GTC led the pack with a massive nearly 100% surge. Given its low relative market cap, even moderate inflows triggered a sharp vertical breakout.⚡ BEAMX (Beam)📊 24h Change: +16.94%💵 Price: $0.002492📈 24h Volume: $91.37M💼 Market Cap: $128.66M📝 Analysis: Beam exhibits strong gaming and ecosystem liquidity with high trading volume relative to its valuation.💧 NILE (Nillion)📊 24h Change: +15.38%💵 Price: $0.09428📈 24h Volume: $24.73M💼 Market Cap: $52.84M📝 Analysis: Steady mid-tier push backed by privacy and computation narrative interest.🧠 FET (Artificial Superintelligence Alliance)📊 24h Change: +15.12%💵 Price: $0.2581📈 24h Volume: $305.54M💼 Market Cap: $698.68M📝 Analysis: FET stands out as a high-cap leader with immense volume, indicating genuine institutional and retail capital moving into AI utility tokens.🐋 ORCA (Killer whale / Orca)📊 24h Change: +13.20%💵 Price: $2.04📈 24h Volume: $85.43M💼 Market Cap: $123.90M📝 Analysis: Solid decentralized exchange token performance reflecting robust trading activity on underlying networks.
Top 5 Memecoin Gainers
🧪 TST (Test)📊 24h Change: +8.55%💵 Price: $0.01866📈 24h Volume: $21.72M💼 Market Cap: $17.61M📝 Analysis: TST leads the meme category with steady momentum, though low market capitalization makes it highly volatile.🐧 PENGU (Pudgy Penguins)📊 24h Change: +6.73%💵 Price: $0.009806📈 24h Volume: $140.38M💼 Market Cap: $617.79M📝 Analysis: PENGU continues to prove its status as a premier IP-backed brand token with elite daily trading volume supporting its valuation.🥦 BROCCOLI714 (CZ's Dog)📊 24h Change: +6.33%💵 Price: $0.0277📈 24h Volume: $5.83M💼 Market Cap: $26.76M📝 Analysis: Narrative-driven community token tied to ecosystem lore, experiencing minor capital rotation upside.🐕 FLOKI (Floki)📊 24h Change: +6.30%💵 Price: $0.00002904📈 24h Volume: $44.91M💼 Market Cap: $278.97M📝 Analysis: FLOKI blends utility features with meme branding, maintaining a stable mid-cap presence.🎉 MUBARAK (Happy)📊 24h Change: +4.78%💵 Price: $0.06726📈 24h Volume: $104.75M💼 Market Cap: $67.09M📝 Analysis: Supported by strong, speculative volume relative to its market cap, indicating active short-term trader participation.
Actionable Takeaways & Risk Management
🌊 Liquidity Divergence: High volume anchors like FET and PENGU show that capital is prioritizing tokens with established ecosystems and deep liquidity pools rather than blind micro-cap gambling.⚠️ Volatility Warning: Extreme gainers like GTC (+96%) carry immense reversal risk; profit-taking can occur rapidly after parabolic single-day moves
📈 What the Market Is Saying Today
🟢 1. Risk appetite is returning
A $2.9T market cap, roughly +1.7% 24-hour market growth, and a 70 Fear & Greed reading point toward a clearly risk-on environment.
🟡 2. Bitcoin still controls the market
BTC dominance around 59.1% means capital has not completely rotated into altcoins. This is important: the current environment looks more like Bitcoin-led strength followed by selective altcoin rotation than a classic broad altseason.
Recent market data also shows Bitcoin around $86K–$87K, while Ethereum is around $2.7K, reinforcing the broader recovery tone.
🔥 3. Altcoin participation is improving
The 59/100 Altcoin Season Index is particularly notable. It suggests that a meaningful portion of the market is outperforming Bitcoin, but the market has not yet reached the kind of widespread altcoin participation normally associated with an extreme altseason.
🐸 4. Memecoin speculation is returning selectively
The strongest meme-oriented moves are substantially larger than many established altcoins. However, several of these tokens have market caps below $10M, meaning low liquidity can exaggerate percentage gains and losses.
That makes volume more important than percentage gain alone.
⚠️ 5. Today's biggest warning: chasing vertical pumps
A coin such as GTC at +53% or a micro-cap meme token above +50% can continue higher—but it can also experience a sharp retracement once early buyers take profits.
📌 Key takeaway
Today's market is bullish, but it is not yet a “buy everything” environment. The strongest signal is the combination of rising total market capitalization, Greed sentiment, and increasing altcoin participation. At the same time, BTC dominance near 59% tells us that Bitcoin remains firmly in control.
For traders, GTC, BEAM, AXS, ORCA and FET are the more meaningful altcoin momentum names today, while the meme sector is producing much sharper—but considerably riskier—moves.
⚠️ Disclaimer: Cryptocurrency prices and Binance gainer rankings change continuously. This is market analysis, not financial advice. High-percentage gainers, especially low-market-cap memecoins, carry substantial volatility and liquidity risk. Always conduct your own research and use appropriate risk management.
#BinanceGainersToday #AltcoinMarketAnalysis #MemecoinMarketMomentum
$GTC $BEAMX $NIL
🔥 Binance Altcoin & Memecoin Gainers Today
Binance’s live market page currently shows a risk-on crypto environment: total market capitalization is around $2.9T, up about 1.7%–1.8% over 24 hours, while BTC dominance is around 59.1%. Binance’s Fear & Greed Index is 70 (Greed) and its Altcoin Season Index is 59/100, suggesting improving risk appetite but not yet a broad, full-scale altcoin season.
Market Overview & Macro Context
📈 The broader crypto market is currently experiencing localized sector rotations and aggressive speculative plays.🌐 Bitcoin and major layer-1 assets are hovering around their established ranges, keeping overall market cap stability high.💡 Liquidity is selectively flowing into high-beta altcoins and narrative-driven memecoins, creating explosive double-digit daily breakouts among smaller-cap assets.
Top 5 Altcoin Gainers
🚀 GTC (Gitcoin)📊 24h Change: +96.68%💵 Price: $0.22895📈 24h Volume: $74.71M💼 Market Cap: $22.37M📝 Analysis: GTC led the pack with a massive nearly 100% surge. Given its low relative market cap, even moderate inflows triggered a sharp vertical breakout.⚡ BEAMX (Beam)📊 24h Change: +16.94%💵 Price: $0.002492📈 24h Volume: $91.37M💼 Market Cap: $128.66M📝 Analysis: Beam exhibits strong gaming and ecosystem liquidity with high trading volume relative to its valuation.💧 NILE (Nillion)📊 24h Change: +15.38%💵 Price: $0.09428📈 24h Volume: $24.73M💼 Market Cap: $52.84M📝 Analysis: Steady mid-tier push backed by privacy and computation narrative interest.🧠 FET (Artificial Superintelligence Alliance)📊 24h Change: +15.12%💵 Price: $0.2581📈 24h Volume: $305.54M💼 Market Cap: $698.68M📝 Analysis: FET stands out as a high-cap leader with immense volume, indicating genuine institutional and retail capital moving into AI utility tokens.🐋 ORCA (Killer whale / Orca)📊 24h Change: +13.20%💵 Price: $2.04📈 24h Volume: $85.43M💼 Market Cap: $123.90M📝 Analysis: Solid decentralized exchange token performance reflecting robust trading activity on underlying networks.
Top 5 Memecoin Gainers
🧪 TST (Test)📊 24h Change: +8.55%💵 Price: $0.01866📈 24h Volume: $21.72M💼 Market Cap: $17.61M📝 Analysis: TST leads the meme category with steady momentum, though low market capitalization makes it highly volatile.🐧 PENGU (Pudgy Penguins)📊 24h Change: +6.73%💵 Price: $0.009806📈 24h Volume: $140.38M💼 Market Cap: $617.79M📝 Analysis: PENGU continues to prove its status as a premier IP-backed brand token with elite daily trading volume supporting its valuation.🥦 BROCCOLI714 (CZ's Dog)📊 24h Change: +6.33%💵 Price: $0.0277📈 24h Volume: $5.83M💼 Market Cap: $26.76M📝 Analysis: Narrative-driven community token tied to ecosystem lore, experiencing minor capital rotation upside.🐕 FLOKI (Floki)📊 24h Change: +6.30%💵 Price: $0.00002904📈 24h Volume: $44.91M💼 Market Cap: $278.97M📝 Analysis: FLOKI blends utility features with meme branding, maintaining a stable mid-cap presence.🎉 MUBARAK (Happy)📊 24h Change: +4.78%💵 Price: $0.06726📈 24h Volume: $104.75M💼 Market Cap: $67.09M📝 Analysis: Supported by strong, speculative volume relative to its market cap, indicating active short-term trader participation.
Actionable Takeaways & Risk Management
🌊 Liquidity Divergence: High volume anchors like FET and PENGU show that capital is prioritizing tokens with established ecosystems and deep liquidity pools rather than blind micro-cap gambling.⚠️ Volatility Warning: Extreme gainers like GTC (+96%) carry immense reversal risk; profit-taking can occur rapidly after parabolic single-day moves
📈 What the Market Is Saying Today
🟢 1. Risk appetite is returning
A $2.9T market cap, roughly +1.7% 24-hour market growth, and a 70 Fear & Greed reading point toward a clearly risk-on environment.
🟡 2. Bitcoin still controls the market
BTC dominance around 59.1% means capital has not completely rotated into altcoins. This is important: the current environment looks more like Bitcoin-led strength followed by selective altcoin rotation than a classic broad altseason.
Recent market data also shows Bitcoin around $86K–$87K, while Ethereum is around $2.7K, reinforcing the broader recovery tone.
🔥 3. Altcoin participation is improving
The 59/100 Altcoin Season Index is particularly notable. It suggests that a meaningful portion of the market is outperforming Bitcoin, but the market has not yet reached the kind of widespread altcoin participation normally associated with an extreme altseason.
🐸 4. Memecoin speculation is returning selectively
The strongest meme-oriented moves are substantially larger than many established altcoins. However, several of these tokens have market caps below $10M, meaning low liquidity can exaggerate percentage gains and losses.
That makes volume more important than percentage gain alone.
⚠️ 5. Today's biggest warning: chasing vertical pumps
A coin such as GTC at +53% or a micro-cap meme token above +50% can continue higher—but it can also experience a sharp retracement once early buyers take profits.
📌 Key takeaway
Today's market is bullish, but it is not yet a “buy everything” environment. The strongest signal is the combination of rising total market capitalization, Greed sentiment, and increasing altcoin participation. At the same time, BTC dominance near 59% tells us that Bitcoin remains firmly in control.
For traders, GTC, BEAM, AXS, ORCA and FET are the more meaningful altcoin momentum names today, while the meme sector is producing much sharper—but considerably riskier—moves.
⚠️ Disclaimer: Cryptocurrency prices and Binance gainer rankings change continuously. This is market analysis, not financial advice. High-percentage gainers, especially low-market-cap memecoins, carry substantial volatility and liquidity risk. Always conduct your own research and use appropriate risk management.
#BinanceGainersToday #AltcoinMarketAnalysis #MemecoinMarketMomentum
$GTC $BEAMX $NIL
1
838
Connectez-vous pour découvrir plus de contenu
Rejoignez la communauté mondiale des adeptes de cryptomonnaies sur Binance Square
⚡️ Suviez les dernières informations importantes sur les cryptomonnaies.
💬 Jugé digne de confiance par la plus grande plateforme d’échange de cryptomonnaies au monde.
👍 Découvrez les connaissances que partagent les créateurs vérifiés.
Adresse e-mail/Nº de téléphone
Sujets d’actualité
BinanceLaunchesBinanceIntelligence
534,035 vues
3,467 mentions
Picture this: you are juggling five different analytics tabs, watching order books flicker, and trying to decipher whether a sudden price spike is genuine volume or just another liquidity trap.
Most traders end up losing money not because they lack passion, but because they are constantly drowning in noisy data and entering positions five minutes too late. When information is fragmented across dozens of complex dashboards, retail investors usually end up holding the bag while faster players front-run the actionable insights.
The rollout of Binance Intelligence feels very similar to the early days when on-chain analytics first went mainstream. Back in previous cycles, tracking wallet movements or sentiment shifts required specialized technical setups. Having deep market analytics and pattern recognition integrated directly into the core trading interface changes the dynamic, much like when real-time order flow data became accessible to everyday holders of $BNB and $BTC.
When retail gets access to structured intelligence directly at the point of execution, the edge shifts from who has the fastest raw data feeds to who can actually interpret market context better. We saw a similar maturation curve with $ETH analytics years ago, where better data transparency gradually reduced blind FOMO and forced traders to develop disciplined risk management.
Do you think integrated intelligence tools will actually level the playing field for retail traders, or will sophisticated algorithms always stay one step ahead?
#BinanceLaunchesBinanceIntelligence #BitcoinTargets2026OpenAt #ETHUp70
Evonne Dashiell
·1 mentions J’aime
·154 vues
BitcoinTargets2026OpenAt$87570
4,407 vues
102 mentions
BitcoinRejectedAt$87KThirdTime
3,544 vues
79 mentions