

The Crypto Basic
7.7k Publications

The Crypto Basic
 Compte Square Vérifié+
Signaler
Bloquer l’utilisateur
Your Ultimate Crypto News Source
0 Suivis
36.4K+ Abonnés
165.9K+ J’aime
Publications
Article
"This Week Could Decide ADA Next Target as Cardano Breaks Multi-Year Resistance"Popular Cardano stake pool operator Sssebi has highlighted a major development on ADA’s weekly chart, noting that the token has finally broken above a key multi-year resistance level.
In a post on X, Sssebi pointed to Cardano’s weekly close above a resistance zone that had constrained ADA price for years. Based on his accompanying chart, the key level sits around $0.24, which previously served as a major barrier during ADA’s prolonged downtrend and consolidation.
ADA ultimately closed the week above that level, with the chart showing the token reaching $0.248. This weekly close is notable because it shows that buyers managed to push ADA through a price area that had previously rejected attempts to move higher.
Nevertheless, Sssebi did not treat the move as a confirmed breakout. Instead, he argued that ADA’s performance this week will help determine whether the move represents genuine trend continuation or a temporary breach of resistance.
This Week Could Confirm or Reject the Breakout
Sssebi specifically warned that ADA’s move above resistance could still become a fakeout. A fakeout occurs when an asset breaks through an important support or resistance level but subsequently reverses and falls back below it.
Therefore, ADA’s ability to remain above the former resistance zone could prove crucial. If the token holds the breakout area and continues to attract buyers, the move could reinforce the bullish setup highlighted by Sssebi.
Conversely, a return below $0.24 would weaken the breakout and raise questions about whether ADA has genuinely escaped its multi-year trading range.
Sssebi Identifies $0.30 and $0.40+ as Upside Targets
Notably, Sssebi’s chart identifies $0.30 as the first upside target if the breakout holds. At ADA’s current price of $0.2438, reaching $0.30 would represent a 23.05% gain.
The chart then points to $0.40+ as a longer-term target. From $0.2438, reaching $0.40 would require roughly a 64.06% advance. These levels have also appeared in other recent Cardano analyses. A recent The Crypto Basic analysis highlighted ADA’s potential to reach $0.30, citing increased trading volume and rising moving averages.
Meanwhile, market analyst Dan Gambardello has also argued that ADA could potentially reach $0.40, urging market participants not to dismiss Cardano’s long-term price potential.
ADA Remains Above $0.24 Despite Market Weakness
Meanwhile, ADA has pulled back slightly from the $0.248 level shown on Sssebi’s chart amid broader weakness across the cryptocurrency market. However, it remains above the $0.24 resistance at the time of writing.
ADA currently trades at $0.2438, down 2.60% over the past 24 hours and 4.22% over the past week. Its 24-hour trading volume has also declined by 28% to $505.36 million.
Despite the recent weakness, ADA remains the 14th-largest cryptocurrency by market cap, with a market value of $8.99 billion.
The coming trading sessions could therefore provide an important test for the breakout: holding above $0.24 would preserve the setup highlighted by Sssebi, while a move back below the level could undermine it.
#CryptoNewsCommunity
"This Week Could Decide ADA Next Target as Cardano Breaks Multi-Year Resistance"
Popular Cardano stake pool operator Sssebi has highlighted a major development on ADA’s weekly chart, noting that the token has finally broken above a key multi-year resistance level.
In a post on X, Sssebi pointed to Cardano’s weekly close above a resistance zone that had constrained ADA price for years. Based on his accompanying chart, the key level sits around $0.24, which previously served as a major barrier during ADA’s prolonged downtrend and consolidation.
ADA ultimately closed the week above that level, with the chart showing the token reaching $0.248. This weekly close is notable because it shows that buyers managed to push ADA through a price area that had previously rejected attempts to move higher.
Nevertheless, Sssebi did not treat the move as a confirmed breakout. Instead, he argued that ADA’s performance this week will help determine whether the move represents genuine trend continuation or a temporary breach of resistance.
This Week Could Confirm or Reject the Breakout
Sssebi specifically warned that ADA’s move above resistance could still become a fakeout. A fakeout occurs when an asset breaks through an important support or resistance level but subsequently reverses and falls back below it.
Therefore, ADA’s ability to remain above the former resistance zone could prove crucial. If the token holds the breakout area and continues to attract buyers, the move could reinforce the bullish setup highlighted by Sssebi.
Conversely, a return below $0.24 would weaken the breakout and raise questions about whether ADA has genuinely escaped its multi-year trading range.
Sssebi Identifies $0.30 and $0.40+ as Upside Targets
Notably, Sssebi’s chart identifies $0.30 as the first upside target if the breakout holds. At ADA’s current price of $0.2438, reaching $0.30 would represent a 23.05% gain.
The chart then points to $0.40+ as a longer-term target. From $0.2438, reaching $0.40 would require roughly a 64.06% advance. These levels have also appeared in other recent Cardano analyses. A recent The Crypto Basic analysis highlighted ADA’s potential to reach $0.30, citing increased trading volume and rising moving averages.
Meanwhile, market analyst Dan Gambardello has also argued that ADA could potentially reach $0.40, urging market participants not to dismiss Cardano’s long-term price potential.
ADA Remains Above $0.24 Despite Market Weakness
Meanwhile, ADA has pulled back slightly from the $0.248 level shown on Sssebi’s chart amid broader weakness across the cryptocurrency market. However, it remains above the $0.24 resistance at the time of writing.
ADA currently trades at $0.2438, down 2.60% over the past 24 hours and 4.22% over the past week. Its 24-hour trading volume has also declined by 28% to $505.36 million.
Despite the recent weakness, ADA remains the 14th-largest cryptocurrency by market cap, with a market value of $8.99 billion.
The coming trading sessions could therefore provide an important test for the breakout: holding above $0.24 would preserve the setup highlighted by Sssebi, while a move back below the level could undermine it.
#CryptoNewsCommunity
In a post on X, Sssebi pointed to Cardano’s weekly close above a resistance zone that had constrained ADA price for years. Based on his accompanying chart, the key level sits around $0.24, which previously served as a major barrier during ADA’s prolonged downtrend and consolidation.
ADA ultimately closed the week above that level, with the chart showing the token reaching $0.248. This weekly close is notable because it shows that buyers managed to push ADA through a price area that had previously rejected attempts to move higher.
Nevertheless, Sssebi did not treat the move as a confirmed breakout. Instead, he argued that ADA’s performance this week will help determine whether the move represents genuine trend continuation or a temporary breach of resistance.
This Week Could Confirm or Reject the Breakout
Sssebi specifically warned that ADA’s move above resistance could still become a fakeout. A fakeout occurs when an asset breaks through an important support or resistance level but subsequently reverses and falls back below it.
Therefore, ADA’s ability to remain above the former resistance zone could prove crucial. If the token holds the breakout area and continues to attract buyers, the move could reinforce the bullish setup highlighted by Sssebi.
Conversely, a return below $0.24 would weaken the breakout and raise questions about whether ADA has genuinely escaped its multi-year trading range.
Sssebi Identifies $0.30 and $0.40+ as Upside Targets
Notably, Sssebi’s chart identifies $0.30 as the first upside target if the breakout holds. At ADA’s current price of $0.2438, reaching $0.30 would represent a 23.05% gain.
The chart then points to $0.40+ as a longer-term target. From $0.2438, reaching $0.40 would require roughly a 64.06% advance. These levels have also appeared in other recent Cardano analyses. A recent The Crypto Basic analysis highlighted ADA’s potential to reach $0.30, citing increased trading volume and rising moving averages.
Meanwhile, market analyst Dan Gambardello has also argued that ADA could potentially reach $0.40, urging market participants not to dismiss Cardano’s long-term price potential.
ADA Remains Above $0.24 Despite Market Weakness
Meanwhile, ADA has pulled back slightly from the $0.248 level shown on Sssebi’s chart amid broader weakness across the cryptocurrency market. However, it remains above the $0.24 resistance at the time of writing.
ADA currently trades at $0.2438, down 2.60% over the past 24 hours and 4.22% over the past week. Its 24-hour trading volume has also declined by 28% to $505.36 million.
Despite the recent weakness, ADA remains the 14th-largest cryptocurrency by market cap, with a market value of $8.99 billion.
The coming trading sessions could therefore provide an important test for the breakout: holding above $0.24 would preserve the setup highlighted by Sssebi, while a move back below the level could undermine it.
#CryptoNewsCommunity
33
Article
"Ripple Stablecoin RLUSD Crosses $2.5B Amid $790M Deployment"RLUSD has now crossed the $2.5 billion valuation mark, as Ripple mints $790 million worth of the stablecoin in a month.
While XRP and the broader crypto market have struggled this year, the Ripple stablecoin, RLUSD, has continued to grow in valuation, as the company ramps up minting amid increased adoption and investor demand.
Ripple Mints $790M, Burns $638M
According to data provided by a community-driven RLUSD supply tracker, Ripple has minted $790 million worth of the stablecoin over the past 30 days across both the Ethereum network and the XRP Ledger.
Most of this supply activity started last week, as minting activity picked up on Sept. 17 and has remained high since then. Notably, since Sept. 17, Ripple has deployed $419 million worth of RLUSD on Ethereum and the XRPL, over 53% of the 30-day total.
However, despite the increased activity, intraday mint figures have remained mostly below $50 million, with occasional spikes on certain days, such as $76.3 million on Sept. 21 and $130.3 million on Sept. 25.
Before this renewed daily activity, Ripple minted a massive $153.2 million in RLUSD on Sept. 1, the largest single-day mint in the past 30 days.
Besides these mints, Ripple has also burned a substantial amount of RLUSD in the past 30 days, though net supply change has been positive. Within the same period, the firm has burned $638 million in RLUSD, bringing the net supply change over the last 30 days to $152 million.
RLUSD Surpasses $2.5B
Amid this recent supply growth, the RLUSD stablecoin has now surpassed the $2.5 billion mark in terms of existing valuation, as it continues its push to become a top 5 stablecoin.
At press time, RLUSD now boasts a market cap of $2.521 billion, up from $2.369 billion a month ago. This currently makes it the eighth-largest stablecoin in the market. The recent $2.5 billion milestone comes a little over a month after RLUSD crossed the $2 billion milestone on Aug. 26.
This means RLUSD has added over $500 million to its market cap within five weeks. This $2.5 billion milestone also comes 21 months after the launch of the stablecoin in December 2024. If RLUSD maintains this pace, it could cross the $3 billion mark before it clocks 2 years by the end of this year.
Ethereum Maintains Lead Over XRPL
Further data shows that the Ethereum network has maintained its lead over the XRP Ledger as the network with the larger RLUSD supply, boasting a supply of $1.396 billion, which is $272 million larger than the $1.124 billion residing on the XRPL.
Ethereum has maintained its lead despite XRPL seeing more supply activity over the past 30 days. Specifically, of the $790 million minted within this period, about $470 million has been deployed on the XRP Ledger. Meanwhile, Ethereum has only seen about $315 million.
However, the XRPL has also recorded higher burns than Ethereum, which has balanced the equation. Notably, within the past 30 days, Ripple has burned $395.7 million worth of RLUSD on XRPL, but only $242.3 million on Ethereum. This translates to about a +$72 million net supply change on each network in the last 30 days.
#CryptoNewsCommunity
"Ripple Stablecoin RLUSD Crosses $2.5B Amid $790M Deployment"
RLUSD has now crossed the $2.5 billion valuation mark, as Ripple mints $790 million worth of the stablecoin in a month.
While XRP and the broader crypto market have struggled this year, the Ripple stablecoin, RLUSD, has continued to grow in valuation, as the company ramps up minting amid increased adoption and investor demand.
Ripple Mints $790M, Burns $638M
According to data provided by a community-driven RLUSD supply tracker, Ripple has minted $790 million worth of the stablecoin over the past 30 days across both the Ethereum network and the XRP Ledger.
Most of this supply activity started last week, as minting activity picked up on Sept. 17 and has remained high since then. Notably, since Sept. 17, Ripple has deployed $419 million worth of RLUSD on Ethereum and the XRPL, over 53% of the 30-day total.
However, despite the increased activity, intraday mint figures have remained mostly below $50 million, with occasional spikes on certain days, such as $76.3 million on Sept. 21 and $130.3 million on Sept. 25.
Before this renewed daily activity, Ripple minted a massive $153.2 million in RLUSD on Sept. 1, the largest single-day mint in the past 30 days.
Besides these mints, Ripple has also burned a substantial amount of RLUSD in the past 30 days, though net supply change has been positive. Within the same period, the firm has burned $638 million in RLUSD, bringing the net supply change over the last 30 days to $152 million.
RLUSD Surpasses $2.5B
Amid this recent supply growth, the RLUSD stablecoin has now surpassed the $2.5 billion mark in terms of existing valuation, as it continues its push to become a top 5 stablecoin.
At press time, RLUSD now boasts a market cap of $2.521 billion, up from $2.369 billion a month ago. This currently makes it the eighth-largest stablecoin in the market. The recent $2.5 billion milestone comes a little over a month after RLUSD crossed the $2 billion milestone on Aug. 26.
This means RLUSD has added over $500 million to its market cap within five weeks. This $2.5 billion milestone also comes 21 months after the launch of the stablecoin in December 2024. If RLUSD maintains this pace, it could cross the $3 billion mark before it clocks 2 years by the end of this year.
Ethereum Maintains Lead Over XRPL
Further data shows that the Ethereum network has maintained its lead over the XRP Ledger as the network with the larger RLUSD supply, boasting a supply of $1.396 billion, which is $272 million larger than the $1.124 billion residing on the XRPL.
Ethereum has maintained its lead despite XRPL seeing more supply activity over the past 30 days. Specifically, of the $790 million minted within this period, about $470 million has been deployed on the XRP Ledger. Meanwhile, Ethereum has only seen about $315 million.
However, the XRPL has also recorded higher burns than Ethereum, which has balanced the equation. Notably, within the past 30 days, Ripple has burned $395.7 million worth of RLUSD on XRPL, but only $242.3 million on Ethereum. This translates to about a +$72 million net supply change on each network in the last 30 days.
#CryptoNewsCommunity
While XRP and the broader crypto market have struggled this year, the Ripple stablecoin, RLUSD, has continued to grow in valuation, as the company ramps up minting amid increased adoption and investor demand.
Ripple Mints $790M, Burns $638M
According to data provided by a community-driven RLUSD supply tracker, Ripple has minted $790 million worth of the stablecoin over the past 30 days across both the Ethereum network and the XRP Ledger.
Most of this supply activity started last week, as minting activity picked up on Sept. 17 and has remained high since then. Notably, since Sept. 17, Ripple has deployed $419 million worth of RLUSD on Ethereum and the XRPL, over 53% of the 30-day total.
However, despite the increased activity, intraday mint figures have remained mostly below $50 million, with occasional spikes on certain days, such as $76.3 million on Sept. 21 and $130.3 million on Sept. 25.
Before this renewed daily activity, Ripple minted a massive $153.2 million in RLUSD on Sept. 1, the largest single-day mint in the past 30 days.
Besides these mints, Ripple has also burned a substantial amount of RLUSD in the past 30 days, though net supply change has been positive. Within the same period, the firm has burned $638 million in RLUSD, bringing the net supply change over the last 30 days to $152 million.
RLUSD Surpasses $2.5B
Amid this recent supply growth, the RLUSD stablecoin has now surpassed the $2.5 billion mark in terms of existing valuation, as it continues its push to become a top 5 stablecoin.
At press time, RLUSD now boasts a market cap of $2.521 billion, up from $2.369 billion a month ago. This currently makes it the eighth-largest stablecoin in the market. The recent $2.5 billion milestone comes a little over a month after RLUSD crossed the $2 billion milestone on Aug. 26.
This means RLUSD has added over $500 million to its market cap within five weeks. This $2.5 billion milestone also comes 21 months after the launch of the stablecoin in December 2024. If RLUSD maintains this pace, it could cross the $3 billion mark before it clocks 2 years by the end of this year.
Ethereum Maintains Lead Over XRPL
Further data shows that the Ethereum network has maintained its lead over the XRP Ledger as the network with the larger RLUSD supply, boasting a supply of $1.396 billion, which is $272 million larger than the $1.124 billion residing on the XRPL.
Ethereum has maintained its lead despite XRPL seeing more supply activity over the past 30 days. Specifically, of the $790 million minted within this period, about $470 million has been deployed on the XRP Ledger. Meanwhile, Ethereum has only seen about $315 million.
However, the XRPL has also recorded higher burns than Ethereum, which has balanced the equation. Notably, within the past 30 days, Ripple has burned $395.7 million worth of RLUSD on XRPL, but only $242.3 million on Ethereum. This translates to about a +$72 million net supply change on each network in the last 30 days.
#CryptoNewsCommunity
147
Article
"XRP Between $1.45 and $1.65: Everything Else Is Noise"#XRP is at an important point, and analyst EGRAG says traders are focusing too much on small price movements instead of the bigger picture.
He says XRP is currently trading between $1.45 and $1.65. Until the price clearly breaks above or below this range, these smaller movements are mostly noise.
“Everything Else Is Noise”
In a post on X, EGRAG said XRP is stuck in a narrow range within a larger market trend. He identifies $1.45 as support and $1.65 as resistance. A clear move beyond either level will signal XRP’s next major direction.
XRP is currently trading around $1.50, putting it near the lower end of this range. The coin briefly soared to $1.70 last month before quickly dipping below $1.30. Meanwhile, in September, it surged to $1.68 before falling back to around $1.50.
As this price action frustrates holders expecting explosive moves, EGRAG urged them to focus on XRP’s broader price trend instead of reacting to every small movement.
As long as XRP remains between $1.45 and $1.65, he sees no major reason to change his overall view.
Above $1.65: A breakout would signal a stronger recovery and weaken the bearish outlook.
Below $1.45: A breakdown would increase the risk of a deeper price drop.
For long-term holders, EGRAG sees the current price area as an opportunity to accumulate XRP. However, he says this does not mean a new bullish trend has started.
XRP Chart Shows Possible Downside Targets
Meanwhile, the accompanying chart shows XRP trading inside a larger downward channel. XRP is around $1.5062 and is testing several important price levels.
Key levels to watch include $1.4997, which currently acts as support. XRP would need to break above $1.5545 and $1.5952 to strengthen its recovery. The key level is $1.6583, which closely matches EGRAG’s $1.65 upper range boundary.
The chart also shows two sharp price spikes near $1.65. These show that XRP has moved higher into this area before but failed to sustain a breakout.
EGRAG’s chart follows an ABC correction pattern:
A: The first drop.
B: The recovery.
C: The second drop.
If the C-wave develops, EGRAG points to downside levels around $1.40, $1.37, $1.32, $1.28, and $1.22.
EGRAG Plans to Buy More XRP Below $1.30
Even though EGRAG sees further downside for XRP, he has not changed his long-term strategy. He said he would consider buying more XRP if the price falls to $1.30 or lower. This means he views a deeper decline as a buying opportunity, as he believes XRP’s long-term prospects remain promising.
EGRAG is a well-known XRP bull who has previously projected several double-digit price targets for XRP, making the $1 range an opportunity, in his view, to accumulate more of the coin.
In sum, EGRAG believes traders should avoid overreacting to small price movements and instead focus on the larger market structure.
#CryptoNewss
"XRP Between $1.45 and $1.65: Everything Else Is Noise"
#XRP is at an important point, and analyst EGRAG says traders are focusing too much on small price movements instead of the bigger picture.
He says XRP is currently trading between $1.45 and $1.65. Until the price clearly breaks above or below this range, these smaller movements are mostly noise.
“Everything Else Is Noise”
In a post on X, EGRAG said XRP is stuck in a narrow range within a larger market trend. He identifies $1.45 as support and $1.65 as resistance. A clear move beyond either level will signal XRP’s next major direction.
XRP is currently trading around $1.50, putting it near the lower end of this range. The coin briefly soared to $1.70 last month before quickly dipping below $1.30. Meanwhile, in September, it surged to $1.68 before falling back to around $1.50.
As this price action frustrates holders expecting explosive moves, EGRAG urged them to focus on XRP’s broader price trend instead of reacting to every small movement.
As long as XRP remains between $1.45 and $1.65, he sees no major reason to change his overall view.
Above $1.65: A breakout would signal a stronger recovery and weaken the bearish outlook.
Below $1.45: A breakdown would increase the risk of a deeper price drop.
For long-term holders, EGRAG sees the current price area as an opportunity to accumulate XRP. However, he says this does not mean a new bullish trend has started.
XRP Chart Shows Possible Downside Targets
Meanwhile, the accompanying chart shows XRP trading inside a larger downward channel. XRP is around $1.5062 and is testing several important price levels.
Key levels to watch include $1.4997, which currently acts as support. XRP would need to break above $1.5545 and $1.5952 to strengthen its recovery. The key level is $1.6583, which closely matches EGRAG’s $1.65 upper range boundary.
The chart also shows two sharp price spikes near $1.65. These show that XRP has moved higher into this area before but failed to sustain a breakout.
EGRAG’s chart follows an ABC correction pattern:
A: The first drop.
B: The recovery.
C: The second drop.
If the C-wave develops, EGRAG points to downside levels around $1.40, $1.37, $1.32, $1.28, and $1.22.
EGRAG Plans to Buy More XRP Below $1.30
Even though EGRAG sees further downside for XRP, he has not changed his long-term strategy. He said he would consider buying more XRP if the price falls to $1.30 or lower. This means he views a deeper decline as a buying opportunity, as he believes XRP’s long-term prospects remain promising.
EGRAG is a well-known XRP bull who has previously projected several double-digit price targets for XRP, making the $1 range an opportunity, in his view, to accumulate more of the coin.
In sum, EGRAG believes traders should avoid overreacting to small price movements and instead focus on the larger market structure.
#CryptoNewss
He says XRP is currently trading between $1.45 and $1.65. Until the price clearly breaks above or below this range, these smaller movements are mostly noise.
“Everything Else Is Noise”
In a post on X, EGRAG said XRP is stuck in a narrow range within a larger market trend. He identifies $1.45 as support and $1.65 as resistance. A clear move beyond either level will signal XRP’s next major direction.
XRP is currently trading around $1.50, putting it near the lower end of this range. The coin briefly soared to $1.70 last month before quickly dipping below $1.30. Meanwhile, in September, it surged to $1.68 before falling back to around $1.50.
As this price action frustrates holders expecting explosive moves, EGRAG urged them to focus on XRP’s broader price trend instead of reacting to every small movement.
As long as XRP remains between $1.45 and $1.65, he sees no major reason to change his overall view.
Above $1.65: A breakout would signal a stronger recovery and weaken the bearish outlook.
Below $1.45: A breakdown would increase the risk of a deeper price drop.
For long-term holders, EGRAG sees the current price area as an opportunity to accumulate XRP. However, he says this does not mean a new bullish trend has started.
XRP Chart Shows Possible Downside Targets
Meanwhile, the accompanying chart shows XRP trading inside a larger downward channel. XRP is around $1.5062 and is testing several important price levels.
Key levels to watch include $1.4997, which currently acts as support. XRP would need to break above $1.5545 and $1.5952 to strengthen its recovery. The key level is $1.6583, which closely matches EGRAG’s $1.65 upper range boundary.
The chart also shows two sharp price spikes near $1.65. These show that XRP has moved higher into this area before but failed to sustain a breakout.
EGRAG’s chart follows an ABC correction pattern:
A: The first drop.
B: The recovery.
C: The second drop.
If the C-wave develops, EGRAG points to downside levels around $1.40, $1.37, $1.32, $1.28, and $1.22.
EGRAG Plans to Buy More XRP Below $1.30
Even though EGRAG sees further downside for XRP, he has not changed his long-term strategy. He said he would consider buying more XRP if the price falls to $1.30 or lower. This means he views a deeper decline as a buying opportunity, as he believes XRP’s long-term prospects remain promising.
EGRAG is a well-known XRP bull who has previously projected several double-digit price targets for XRP, making the $1 range an opportunity, in his view, to accumulate more of the coin.
In sum, EGRAG believes traders should avoid overreacting to small price movements and instead focus on the larger market structure.
#CryptoNewss
1
1
2.1k
Vérifié
Capricor Therapeutics Inc. (NASDAQ: CAPR) shares jumped 13.54% to $9.73 in Wednesday pre-market trading amid the opening of the World Muscle Society’s 2026 congress, where Capricor’s late-breaking HOPE-3 open-label-extension poster on Deramiocel was available to registered delegates on the virtual platform.
The rally extended a sharp move that began after Tuesday’s regular session. CAPR closed at $8.57, down 1.61%, before rising to $10.28 in after-hours trading.
WMS opened its virtual congress platform to registered delegates on Sept. 29, and its programme lists late-breaking poster presentations as available online. Capricor’s poster covers a cross-phase delayed-start analysis and a two-year comparison with natural history. WMS’s press policy keeps late-breaking abstracts under embargo until the final day of the congress even when related content is accessible beforehand.
#Crypto
Capricor Therapeutics Inc. (NASDAQ: CAPR) shares jumped 13.54% to $9.73 in Wednesday pre-market trading amid the opening of the World Muscle Society’s 2026 congress, where Capricor’s late-breaking HOPE-3 open-label-extension poster on Deramiocel was available to registered delegates on the virtual platform.
The rally extended a sharp move that began after Tuesday’s regular session. CAPR closed at $8.57, down 1.61%, before rising to $10.28 in after-hours trading.
WMS opened its virtual congress platform to registered delegates on Sept. 29, and its programme lists late-breaking poster presentations as available online. Capricor’s poster covers a cross-phase delayed-start analysis and a two-year comparison with natural history. WMS’s press policy keeps late-breaking abstracts under embargo until the final day of the congress even when related content is accessible beforehand.
#Crypto
The rally extended a sharp move that began after Tuesday’s regular session. CAPR closed at $8.57, down 1.61%, before rising to $10.28 in after-hours trading.
WMS opened its virtual congress platform to registered delegates on Sept. 29, and its programme lists late-breaking poster presentations as available online. Capricor’s poster covers a cross-phase delayed-start analysis and a two-year comparison with natural history. WMS’s press policy keeps late-breaking abstracts under embargo until the final day of the congress even when related content is accessible beforehand.
#Crypto
1
2.6k
Article
"Cardano Could Be Approaching a Major ADA Breakout After Nine Years of Price Compression"Cardano is showing signs of a potential major macro breakout despite continued criticism that the cryptocurrency has become a dead coin, according to market analyst Eric Van Tassel.
After reviewing Cardano’s long-term chart, Van Tassel argued that the asset is forming a massive multi-year compression structure. He noted that the pattern resembles structures developing across several other cryptocurrencies, potentially signaling a broader expansion phase for the altcoin market.
ADA Maintains Nine-Year Rising Support
In a recent X post, Van Tassel highlighted that, excluding the sharp market disruption caused by the COVID-19 crash, ADA has respected a rising macro support trend for roughly nine years.
At the same time, it has remained below a descending resistance line established after its 2021 peak. Together, these trendlines have created a large compression structure as rising support and descending resistance gradually converge.
The chart showed ADA trading around $0.25 as the two trendlines approach their apex. Van Tassel divided the structure into four key phases:
2018–2021: Major price expansion
2021–2026: Multi-year compression
2025: Failed or false breakout
2026: Support holding alongside another breakout attempt
Notably, ADA previously moved above the descending resistance in 2025 and climbed above $1. However, the breakout failed, sending the price back inside the long-term structure.
At the time of the analysis, Cardano was attempting to break above the upper trendline, which Van Tassel considers significant.
However, he does not regard the latest move as a confirmed breakout. Instead, he argued that ADA would need to post a sustained weekly close above the descending resistance and successfully retest that level as support to provide stronger confirmation.
Van Tassel Challenges the Dead Coin Narrative
Another notable feature of the chart is the increase in trading volume as ADA approaches the apex of its long-term structure. The displayed volume reached $307 million, highlighting increased activity as ADA tests major macro resistance.
Based on ADA’s long-term structure, Van Tassel does not view the cryptocurrency’s prolonged underperformance as evidence that it is a dead coin.
Instead, he highlighted similar multi-year structures across several crypto assets. In his view, the similarities could indicate that altcoins are approaching a period of increased market activity.
He also linked this broader development to the continued growth of blockchain applications and decentralized finance. According to him, wider adoption could expand the utility of blockchain networks beyond Bitcoin’s primary role as a store of value.
Meanwhile, ADA remains above the $0.25 psychological level. At the current price of $0.2516, ADA is up 3.17% over the past 24 hours and 1.66% over the past week. Its 24-hour trading volume has also climbed 41.98% to $721.44 million, indicating increased market activity around the current breakout attempt.
#CryptoNews🚀🔥V
"Cardano Could Be Approaching a Major ADA Breakout After Nine Years of Price Compression"
Cardano is showing signs of a potential major macro breakout despite continued criticism that the cryptocurrency has become a dead coin, according to market analyst Eric Van Tassel.
After reviewing Cardano’s long-term chart, Van Tassel argued that the asset is forming a massive multi-year compression structure. He noted that the pattern resembles structures developing across several other cryptocurrencies, potentially signaling a broader expansion phase for the altcoin market.
ADA Maintains Nine-Year Rising Support
In a recent X post, Van Tassel highlighted that, excluding the sharp market disruption caused by the COVID-19 crash, ADA has respected a rising macro support trend for roughly nine years.
At the same time, it has remained below a descending resistance line established after its 2021 peak. Together, these trendlines have created a large compression structure as rising support and descending resistance gradually converge.
The chart showed ADA trading around $0.25 as the two trendlines approach their apex. Van Tassel divided the structure into four key phases:
2018–2021: Major price expansion
2021–2026: Multi-year compression
2025: Failed or false breakout
2026: Support holding alongside another breakout attempt
Notably, ADA previously moved above the descending resistance in 2025 and climbed above $1. However, the breakout failed, sending the price back inside the long-term structure.
At the time of the analysis, Cardano was attempting to break above the upper trendline, which Van Tassel considers significant.
However, he does not regard the latest move as a confirmed breakout. Instead, he argued that ADA would need to post a sustained weekly close above the descending resistance and successfully retest that level as support to provide stronger confirmation.
Van Tassel Challenges the Dead Coin Narrative
Another notable feature of the chart is the increase in trading volume as ADA approaches the apex of its long-term structure. The displayed volume reached $307 million, highlighting increased activity as ADA tests major macro resistance.
Based on ADA’s long-term structure, Van Tassel does not view the cryptocurrency’s prolonged underperformance as evidence that it is a dead coin.
Instead, he highlighted similar multi-year structures across several crypto assets. In his view, the similarities could indicate that altcoins are approaching a period of increased market activity.
He also linked this broader development to the continued growth of blockchain applications and decentralized finance. According to him, wider adoption could expand the utility of blockchain networks beyond Bitcoin’s primary role as a store of value.
Meanwhile, ADA remains above the $0.25 psychological level. At the current price of $0.2516, ADA is up 3.17% over the past 24 hours and 1.66% over the past week. Its 24-hour trading volume has also climbed 41.98% to $721.44 million, indicating increased market activity around the current breakout attempt.
#CryptoNews🚀🔥V
After reviewing Cardano’s long-term chart, Van Tassel argued that the asset is forming a massive multi-year compression structure. He noted that the pattern resembles structures developing across several other cryptocurrencies, potentially signaling a broader expansion phase for the altcoin market.
ADA Maintains Nine-Year Rising Support
In a recent X post, Van Tassel highlighted that, excluding the sharp market disruption caused by the COVID-19 crash, ADA has respected a rising macro support trend for roughly nine years.
At the same time, it has remained below a descending resistance line established after its 2021 peak. Together, these trendlines have created a large compression structure as rising support and descending resistance gradually converge.
The chart showed ADA trading around $0.25 as the two trendlines approach their apex. Van Tassel divided the structure into four key phases:
2018–2021: Major price expansion
2021–2026: Multi-year compression
2025: Failed or false breakout
2026: Support holding alongside another breakout attempt
Notably, ADA previously moved above the descending resistance in 2025 and climbed above $1. However, the breakout failed, sending the price back inside the long-term structure.
At the time of the analysis, Cardano was attempting to break above the upper trendline, which Van Tassel considers significant.
However, he does not regard the latest move as a confirmed breakout. Instead, he argued that ADA would need to post a sustained weekly close above the descending resistance and successfully retest that level as support to provide stronger confirmation.
Van Tassel Challenges the Dead Coin Narrative
Another notable feature of the chart is the increase in trading volume as ADA approaches the apex of its long-term structure. The displayed volume reached $307 million, highlighting increased activity as ADA tests major macro resistance.
Based on ADA’s long-term structure, Van Tassel does not view the cryptocurrency’s prolonged underperformance as evidence that it is a dead coin.
Instead, he highlighted similar multi-year structures across several crypto assets. In his view, the similarities could indicate that altcoins are approaching a period of increased market activity.
He also linked this broader development to the continued growth of blockchain applications and decentralized finance. According to him, wider adoption could expand the utility of blockchain networks beyond Bitcoin’s primary role as a store of value.
Meanwhile, ADA remains above the $0.25 psychological level. At the current price of $0.2516, ADA is up 3.17% over the past 24 hours and 1.66% over the past week. Its 24-hour trading volume has also climbed 41.98% to $721.44 million, indicating increased market activity around the current breakout attempt.
#CryptoNews🚀🔥V
1
1.1k
Article
"AMD Stock Rises in First Session After $8.2B World Labs Deal; Analysts Reaffirm Buy Ratings"Advanced Micro Devices Inc. (NASDAQ: AMD) shares rose 1.34% to $616.02 at 10:27 a.m. ET Tuesday, strengthening from premarket levels in the first regular trading session after the company announced an agreement to acquire World Labs.
AMD closed Monday at $607.87, down 3.61%. The company announced the transaction after Monday’s closing bell.
AMD agreed to acquire World Labs, a spatial-intelligence and simulation technology company led by AI researcher Dr. Fei-Fei Li, in an all-stock transaction valued at approximately $8.2 billion.
Rosenblatt and Stifel both reiterated Buy ratings Tuesday, focusing on how World Labs could broaden AMD’s AI capabilities, particularly in spatial intelligence and robotics.
Rosenblatt, Stifel See Broader AI Capabilities
Rosenblatt maintained its Buy rating and $700 price target, viewing the transaction in part as an acceleration of technology investment AMD might otherwise have needed to make internally. The firm said World Labs adds AI software, modeling and simulation expertise that could support AMD’s development of broader system-level AI platforms and applications including robotics.
Stifel maintained its Buy rating and $635 price target, emphasizing the transaction’s potential relevance to robotics. The firm said limited real-world training data can constrain the development of general-purpose robots and pointed to World Labs’ Atlas technology as a way to reconstruct physical environments and generate observations for simulated robot sensors. World Labs says Atlas can reconstruct spaces from sparse image inputs and generate RGB and depth data corresponding to what a simulated robot would observe.
Stifel also said World Labs adds spatial and world-model capabilities to an AMD open-model portfolio that has focused on text and video. The firm noted that World Labs remains early in its commercial development and that AMD has not disclosed the transaction’s expected financial or profit-and-loss impact.
World Labs Brings Spatial-Intelligence Research to AMD
The deal is expected to close by the end of 2026, subject to regulatory approvals and customary closing conditions.
World Labs develops spatial-intelligence models that generate, reconstruct and simulate interactive 3D environments from text, image and video inputs, along with technology for robotic learning and simulation. AMD said the research will give it deeper insight into evolving AI workloads as it develops future hardware, software and systems.
After the transaction closes, Li is set to join AMD as executive vice president and chief scientist, reporting to CEO Lisa Su. World Labs and AMD had already worked together on model training and inference optimization using AMD GPUs before the agreement.
Meanwhile, Advanced Micro Devices Tokenized bStocks (AMDB) was down 0.27% over the prior 24 hours at $611.43, according to CoinMarketCap.
#CryptoNewsFlash
"AMD Stock Rises in First Session After $8.2B World Labs Deal; Analysts Reaffirm Buy Ratings"
Advanced Micro Devices Inc. (NASDAQ: AMD) shares rose 1.34% to $616.02 at 10:27 a.m. ET Tuesday, strengthening from premarket levels in the first regular trading session after the company announced an agreement to acquire World Labs.
AMD closed Monday at $607.87, down 3.61%. The company announced the transaction after Monday’s closing bell.
AMD agreed to acquire World Labs, a spatial-intelligence and simulation technology company led by AI researcher Dr. Fei-Fei Li, in an all-stock transaction valued at approximately $8.2 billion.
Rosenblatt and Stifel both reiterated Buy ratings Tuesday, focusing on how World Labs could broaden AMD’s AI capabilities, particularly in spatial intelligence and robotics.
Rosenblatt, Stifel See Broader AI Capabilities
Rosenblatt maintained its Buy rating and $700 price target, viewing the transaction in part as an acceleration of technology investment AMD might otherwise have needed to make internally. The firm said World Labs adds AI software, modeling and simulation expertise that could support AMD’s development of broader system-level AI platforms and applications including robotics.
Stifel maintained its Buy rating and $635 price target, emphasizing the transaction’s potential relevance to robotics. The firm said limited real-world training data can constrain the development of general-purpose robots and pointed to World Labs’ Atlas technology as a way to reconstruct physical environments and generate observations for simulated robot sensors. World Labs says Atlas can reconstruct spaces from sparse image inputs and generate RGB and depth data corresponding to what a simulated robot would observe.
Stifel also said World Labs adds spatial and world-model capabilities to an AMD open-model portfolio that has focused on text and video. The firm noted that World Labs remains early in its commercial development and that AMD has not disclosed the transaction’s expected financial or profit-and-loss impact.
World Labs Brings Spatial-Intelligence Research to AMD
The deal is expected to close by the end of 2026, subject to regulatory approvals and customary closing conditions.
World Labs develops spatial-intelligence models that generate, reconstruct and simulate interactive 3D environments from text, image and video inputs, along with technology for robotic learning and simulation. AMD said the research will give it deeper insight into evolving AI workloads as it develops future hardware, software and systems.
After the transaction closes, Li is set to join AMD as executive vice president and chief scientist, reporting to CEO Lisa Su. World Labs and AMD had already worked together on model training and inference optimization using AMD GPUs before the agreement.
Meanwhile, Advanced Micro Devices Tokenized bStocks (AMDB) was down 0.27% over the prior 24 hours at $611.43, according to CoinMarketCap.
#CryptoNewsFlash
AMD closed Monday at $607.87, down 3.61%. The company announced the transaction after Monday’s closing bell.
AMD agreed to acquire World Labs, a spatial-intelligence and simulation technology company led by AI researcher Dr. Fei-Fei Li, in an all-stock transaction valued at approximately $8.2 billion.
Rosenblatt and Stifel both reiterated Buy ratings Tuesday, focusing on how World Labs could broaden AMD’s AI capabilities, particularly in spatial intelligence and robotics.
Rosenblatt, Stifel See Broader AI Capabilities
Rosenblatt maintained its Buy rating and $700 price target, viewing the transaction in part as an acceleration of technology investment AMD might otherwise have needed to make internally. The firm said World Labs adds AI software, modeling and simulation expertise that could support AMD’s development of broader system-level AI platforms and applications including robotics.
Stifel maintained its Buy rating and $635 price target, emphasizing the transaction’s potential relevance to robotics. The firm said limited real-world training data can constrain the development of general-purpose robots and pointed to World Labs’ Atlas technology as a way to reconstruct physical environments and generate observations for simulated robot sensors. World Labs says Atlas can reconstruct spaces from sparse image inputs and generate RGB and depth data corresponding to what a simulated robot would observe.
Stifel also said World Labs adds spatial and world-model capabilities to an AMD open-model portfolio that has focused on text and video. The firm noted that World Labs remains early in its commercial development and that AMD has not disclosed the transaction’s expected financial or profit-and-loss impact.
World Labs Brings Spatial-Intelligence Research to AMD
The deal is expected to close by the end of 2026, subject to regulatory approvals and customary closing conditions.
World Labs develops spatial-intelligence models that generate, reconstruct and simulate interactive 3D environments from text, image and video inputs, along with technology for robotic learning and simulation. AMD said the research will give it deeper insight into evolving AI workloads as it develops future hardware, software and systems.
After the transaction closes, Li is set to join AMD as executive vice president and chief scientist, reporting to CEO Lisa Su. World Labs and AMD had already worked together on model training and inference optimization using AMD GPUs before the agreement.
Meanwhile, Advanced Micro Devices Tokenized bStocks (AMDB) was down 0.27% over the prior 24 hours at $611.43, according to CoinMarketCap.
#CryptoNewsFlash
70
Article
"XRP Sellers Face Liquidation Risk Up to $158M at Just a 3% Price Rise"#XRP sees cumulative short liquidation leverage of more than $158 million all the way to $1.55, just a 3% increase from current prices.
After rising to a local top above $1.65 on Sept. 23, XRP faced a pullback along with the rest of the crypto market. A rebound followed immediately, pushing prices above $1.60 before XRP retreated again to $1.50 at press time.
XRP Sellers Face $158M Liquidation Leverage at $1.55
Amid the latest price retreat, market data shows that most investors have turned to opening shorts in anticipation of further declines. XRP had dropped to $1.46 earlier today before rebounding to $1.50, yet market participants believe steeper declines may be on the horizon.
According to derivatives data provided by Coinglass, a leading market analytics platform, XRP sellers have ramped up cumulative short liquidation leverage of up to $158.82 million from the current price of $1.50 to the $1.553 high on the 7-day timeline.
This indicates that if the XRP price recovers just 3% from the current $1.50 level to $1.553, traders with XRP short positions could witness cumulative liquidation of nearly $159 million at different price levels up until the $1.553 area.
Further data shows that, exactly at the $1.553 mark, traders on Binance, the world’s largest crypto exchange by trade volume, could face liquidations to the tune of $6.03 million, while liquidations impacting OKX traders may reach $2.37 million. Meanwhile, Bybit leads with about $8.04 million in liquidation leverage at $1.553.
Short Liquidation Leverage Exceeds Longs by $200M
This confirms the high concentration of short positions stacked above the current XRP price. More importantly, Coinglass reveals that from the current price to $1.639, the XRP derivatives market features cumulative short liquidation leverage up to $392.83 million. For context, this is just a price difference of 8.6%.
Meanwhile, at the other end of the spectrum, from the current price to $1.373, an 8.46% drop, the cumulative long liquidation leverage sits at $193 million. This means the cumulative short liquidation exposure surpasses long liquidation exposure by a whopping $200 million at the same price spread.
Such situations can put pressure on bulls, especially if buying pressure starts to disappear from the market. However, if buyers return and the price recovers rapidly, it would create the perfect condition for a potential short squeeze, where the concentration of shorts could be forced to buy XRP to maintain their positions or face massive liquidations.
#CryptonewswithJack
"XRP Sellers Face Liquidation Risk Up to $158M at Just a 3% Price Rise"
#XRP sees cumulative short liquidation leverage of more than $158 million all the way to $1.55, just a 3% increase from current prices.
After rising to a local top above $1.65 on Sept. 23, XRP faced a pullback along with the rest of the crypto market. A rebound followed immediately, pushing prices above $1.60 before XRP retreated again to $1.50 at press time.
XRP Sellers Face $158M Liquidation Leverage at $1.55
Amid the latest price retreat, market data shows that most investors have turned to opening shorts in anticipation of further declines. XRP had dropped to $1.46 earlier today before rebounding to $1.50, yet market participants believe steeper declines may be on the horizon.
According to derivatives data provided by Coinglass, a leading market analytics platform, XRP sellers have ramped up cumulative short liquidation leverage of up to $158.82 million from the current price of $1.50 to the $1.553 high on the 7-day timeline.
This indicates that if the XRP price recovers just 3% from the current $1.50 level to $1.553, traders with XRP short positions could witness cumulative liquidation of nearly $159 million at different price levels up until the $1.553 area.
Further data shows that, exactly at the $1.553 mark, traders on Binance, the world’s largest crypto exchange by trade volume, could face liquidations to the tune of $6.03 million, while liquidations impacting OKX traders may reach $2.37 million. Meanwhile, Bybit leads with about $8.04 million in liquidation leverage at $1.553.
Short Liquidation Leverage Exceeds Longs by $200M
This confirms the high concentration of short positions stacked above the current XRP price. More importantly, Coinglass reveals that from the current price to $1.639, the XRP derivatives market features cumulative short liquidation leverage up to $392.83 million. For context, this is just a price difference of 8.6%.
Meanwhile, at the other end of the spectrum, from the current price to $1.373, an 8.46% drop, the cumulative long liquidation leverage sits at $193 million. This means the cumulative short liquidation exposure surpasses long liquidation exposure by a whopping $200 million at the same price spread.
Such situations can put pressure on bulls, especially if buying pressure starts to disappear from the market. However, if buyers return and the price recovers rapidly, it would create the perfect condition for a potential short squeeze, where the concentration of shorts could be forced to buy XRP to maintain their positions or face massive liquidations.
#CryptonewswithJack
After rising to a local top above $1.65 on Sept. 23, XRP faced a pullback along with the rest of the crypto market. A rebound followed immediately, pushing prices above $1.60 before XRP retreated again to $1.50 at press time.
XRP Sellers Face $158M Liquidation Leverage at $1.55
Amid the latest price retreat, market data shows that most investors have turned to opening shorts in anticipation of further declines. XRP had dropped to $1.46 earlier today before rebounding to $1.50, yet market participants believe steeper declines may be on the horizon.
According to derivatives data provided by Coinglass, a leading market analytics platform, XRP sellers have ramped up cumulative short liquidation leverage of up to $158.82 million from the current price of $1.50 to the $1.553 high on the 7-day timeline.
This indicates that if the XRP price recovers just 3% from the current $1.50 level to $1.553, traders with XRP short positions could witness cumulative liquidation of nearly $159 million at different price levels up until the $1.553 area.
Further data shows that, exactly at the $1.553 mark, traders on Binance, the world’s largest crypto exchange by trade volume, could face liquidations to the tune of $6.03 million, while liquidations impacting OKX traders may reach $2.37 million. Meanwhile, Bybit leads with about $8.04 million in liquidation leverage at $1.553.
Short Liquidation Leverage Exceeds Longs by $200M
This confirms the high concentration of short positions stacked above the current XRP price. More importantly, Coinglass reveals that from the current price to $1.639, the XRP derivatives market features cumulative short liquidation leverage up to $392.83 million. For context, this is just a price difference of 8.6%.
Meanwhile, at the other end of the spectrum, from the current price to $1.373, an 8.46% drop, the cumulative long liquidation leverage sits at $193 million. This means the cumulative short liquidation exposure surpasses long liquidation exposure by a whopping $200 million at the same price spread.
Such situations can put pressure on bulls, especially if buying pressure starts to disappear from the market. However, if buyers return and the price recovers rapidly, it would create the perfect condition for a potential short squeeze, where the concentration of shorts could be forced to buy XRP to maintain their positions or face massive liquidations.
#CryptonewswithJack
1
1
910
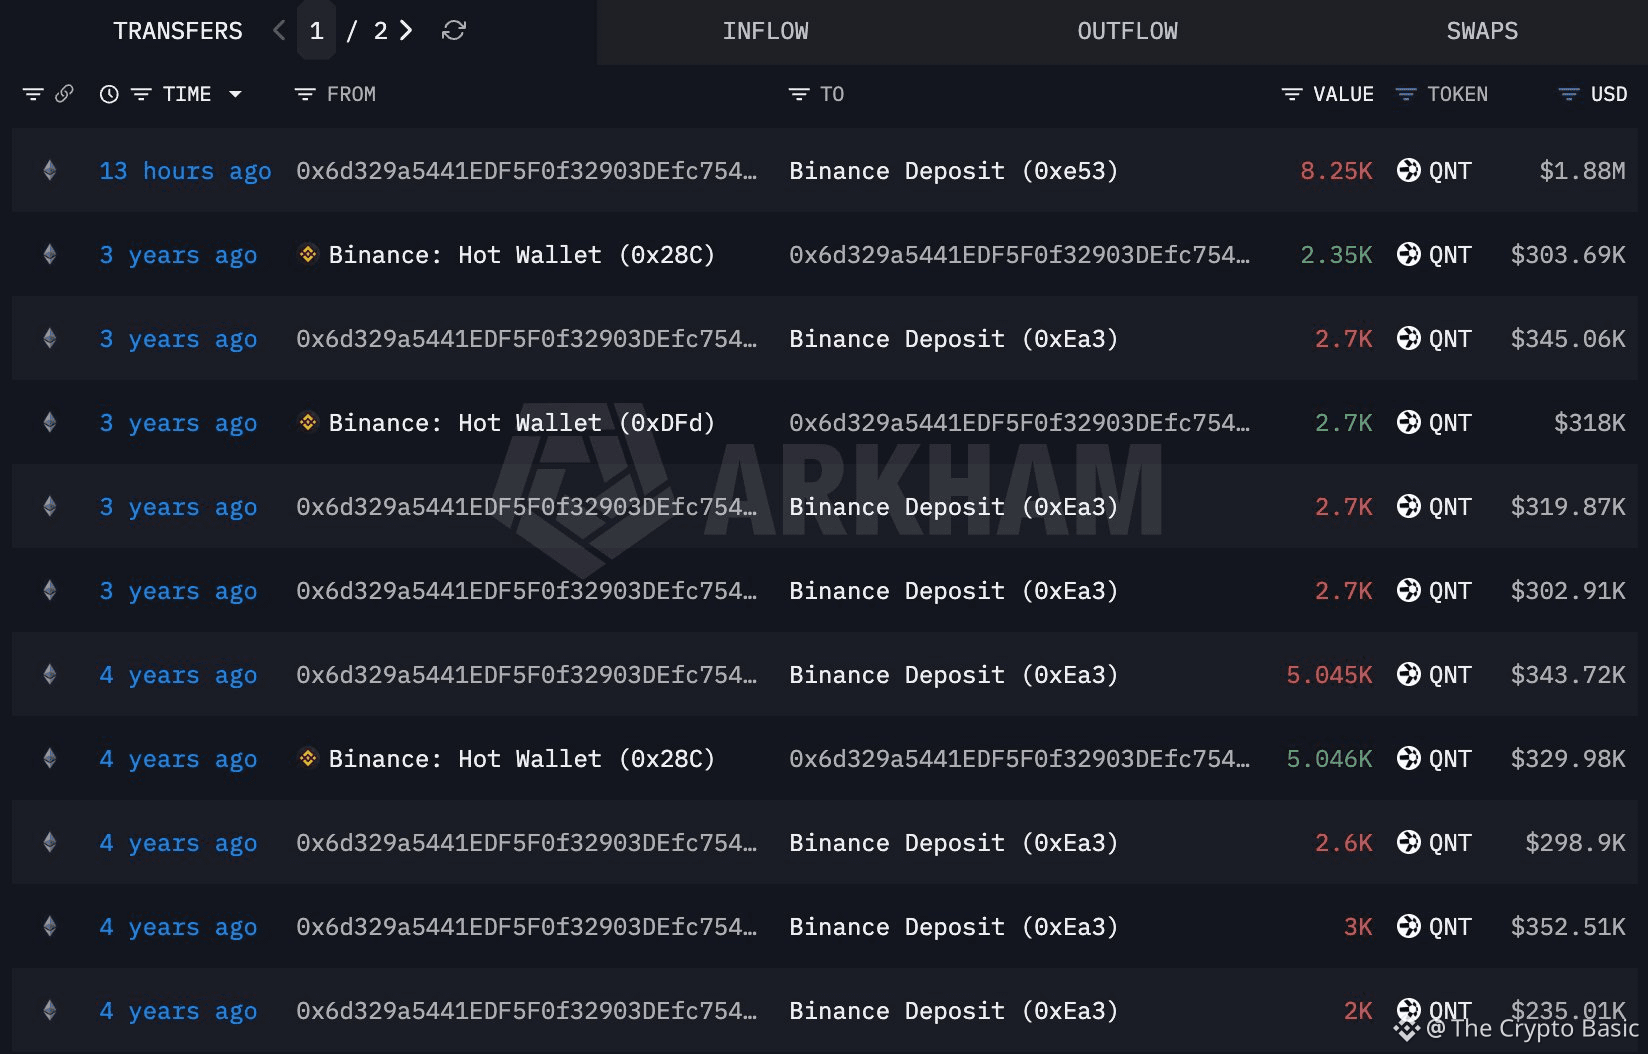
Dormant QNT whales moved 42,450 tokens worth nearly $10 million after more than three years, with part of the holdings deposited to major exchanges.
Long-dormant Quant wallets have started moving millions of dollars in QNT following the asset’s sharp price rally, with some of the tokens already reaching Binance, Coinbase, and Kraken, according to Lookonchain.
The activity involves two wallets that had remained largely inactive for more than three years. Combined, they moved 42,450 QNT worth roughly $10 million at the time of the transfers
The moves come as QNT trades around $247, up roughly 27.5% over the past 24 hours, according to CoinMarketCap. The asset has traded between $196.11 and $357 during the period, while 24-hour volume has climbed to about $1.55 billion.
#CryptonewswithJack
Dormant QNT whales moved 42,450 tokens worth nearly $10 million after more than three years, with part of the holdings deposited to major exchanges.
Long-dormant Quant wallets have started moving millions of dollars in QNT following the asset’s sharp price rally, with some of the tokens already reaching Binance, Coinbase, and Kraken, according to Lookonchain.
The activity involves two wallets that had remained largely inactive for more than three years. Combined, they moved 42,450 QNT worth roughly $10 million at the time of the transfers
The moves come as QNT trades around $247, up roughly 27.5% over the past 24 hours, according to CoinMarketCap. The asset has traded between $196.11 and $357 during the period, while 24-hour volume has climbed to about $1.55 billion.
#CryptonewswithJack
Long-dormant Quant wallets have started moving millions of dollars in QNT following the asset’s sharp price rally, with some of the tokens already reaching Binance, Coinbase, and Kraken, according to Lookonchain.
The activity involves two wallets that had remained largely inactive for more than three years. Combined, they moved 42,450 QNT worth roughly $10 million at the time of the transfers
The moves come as QNT trades around $247, up roughly 27.5% over the past 24 hours, according to CoinMarketCap. The asset has traded between $196.11 and $357 during the period, while 24-hour volume has climbed to about $1.55 billion.
#CryptonewswithJack
2
1.1k
Navitas Semiconductor Corporation (NASDAQ: $NVTS
) shares remained up double digits in Tuesday pre-market trading after a sharp after-hours rally following Monday’s post-close announcement that the U.S. Army selected the company for the ALATTIS program.
NVTS was up 9.29% at $12.82 at approximately 8:41 a.m. ET Tuesday, after closing Monday at $11.73. The stock had fallen 3.85% during Monday’s regular session.
Shares initially rose about 20% in Monday after-hours trading after Navitas disclosed the award. By early Tuesday, the gain had eased from that initial spike but remained above 9.29% from Monday’s close.
Navitas said the U.S. Army selected the company for the Accelerated, Large-Area, 10 kV SiC IGBT, or ALATTIS, program to develop next-generation ultra-high-voltage silicon-carbide power semiconductor technology.
The prototype project aims to develop and validate a domestic manufacturing process for silicon-carbide power semiconductor devices rated at 10 kV or higher through iterative design, fabrication, and testing. The Army Research Laboratory sponsors the project, while the Joint Experimentation and Technology Accelerator, or JETX, supports the program.
#CryptoNewss
Navitas Semiconductor Corporation (NASDAQ: $NVTS
) shares remained up double digits in Tuesday pre-market trading after a sharp after-hours rally following Monday’s post-close announcement that the U.S. Army selected the company for the ALATTIS program.
NVTS was up 9.29% at $12.82 at approximately 8:41 a.m. ET Tuesday, after closing Monday at $11.73. The stock had fallen 3.85% during Monday’s regular session.
Shares initially rose about 20% in Monday after-hours trading after Navitas disclosed the award. By early Tuesday, the gain had eased from that initial spike but remained above 9.29% from Monday’s close.
Navitas said the U.S. Army selected the company for the Accelerated, Large-Area, 10 kV SiC IGBT, or ALATTIS, program to develop next-generation ultra-high-voltage silicon-carbide power semiconductor technology.
The prototype project aims to develop and validate a domestic manufacturing process for silicon-carbide power semiconductor devices rated at 10 kV or higher through iterative design, fabrication, and testing. The Army Research Laboratory sponsors the project, while the Joint Experimentation and Technology Accelerator, or JETX, supports the program.
#CryptoNewss
) shares remained up double digits in Tuesday pre-market trading after a sharp after-hours rally following Monday’s post-close announcement that the U.S. Army selected the company for the ALATTIS program.
NVTS was up 9.29% at $12.82 at approximately 8:41 a.m. ET Tuesday, after closing Monday at $11.73. The stock had fallen 3.85% during Monday’s regular session.
Shares initially rose about 20% in Monday after-hours trading after Navitas disclosed the award. By early Tuesday, the gain had eased from that initial spike but remained above 9.29% from Monday’s close.
Navitas said the U.S. Army selected the company for the Accelerated, Large-Area, 10 kV SiC IGBT, or ALATTIS, program to develop next-generation ultra-high-voltage silicon-carbide power semiconductor technology.
The prototype project aims to develop and validate a domestic manufacturing process for silicon-carbide power semiconductor devices rated at 10 kV or higher through iterative design, fabrication, and testing. The Army Research Laboratory sponsors the project, while the Joint Experimentation and Technology Accelerator, or JETX, supports the program.
#CryptoNewss
107
Article
"24-Hour Crypto Market Update: What Happened in Crypto on September 29, 2026?"Catch up on the latest crypto market developments from September 29, 2026.
Coinbase cleared to run its own US derivatives clearinghouse: The CFTC registered Coinbase Clearing, so Coinbase now holds the three core CFTC licenses: exchange, broker, and clearinghouse. Posts say it can settle fully collateralized contracts with USDC, around the clock.
SEC issued guidance on token buybacks: CoinDesk says buyback announcements from issuers of decentralized assets are not automatically a Howey “managerial efforts” promise. The same buyback tied to yield on a non-functional network could be treated differently.
Morgan Stanley opened a Digital Asset Lab: Bloomberg-cited posts say the bank set up an internal lab to test stablecoins, tokenization, and DeFi without touching core banking systems.
Swift’s CEO at Sibos 2026: Javier Perez-Tasso said the question is no longer TradFi vs DeFi, and that Swift’s platform should move any regulated value — fiat or tokenized — at global scale.
Cboe and S&P Dow Jones extended their S&P 500 options license through 2051 and said they may explore tokenized options. No launch date.
Citi paper with Swift and DTCC is circulating: DTCC’s tokenization service is described as launching in October 2026 on Canton for tokenized Treasuries, equities, and ETFs, with a private collateral appchain and later Stellar/Circle work mentioned for 2027.
Bitget is still dealing with last week’s $388M hack: CEO Gracy Chen told Cointelegraph she believes a North Korea-linked group was behind it. After withdrawals reopened, Bloomberg-cited posts said the exchange saw large net outflows. CoinDesk later said ETH withdrawals restarted in a phased reopening; USDT withdrawals are scheduled for 30 September. NEAR Intents said its SHIELD system blocked some stolen funds.
Ethereum’s Glamsterdam upgrade is set to go live on the Sepolia testnet on 6 October, with built-in proposer-builder separation, block-level access lists, and gas changes. Mainnet timing is still open.
MoonPay launched MoonPay Korea, aiming at remittances, payments, and stablecoin settlement with Woori Bank, KB Financial Group, and KakaoBank.
Coinbase wrapped Cardano (cbADA) is being posted as live on Solana via Sunrise, with trading on Raydium.
Aave integrated Coinbase tokenized stocks. Founder Stani Kulechov said a token burn is being considered in Aavenomics 3.0.
Coinbase also teased phone-based trading-card “rip packs” backed by real physical cards, vaulted or shipped.
Belarus registered its first two crypto banks under its new framework.
The Smarter Web Company, a UK-listed Bitcoin treasury firm, said it plans preferred shares backed by BTC.
Democratic investigators are calling for closer scrutiny of Tether over alleged Iran-linked USDT use.
Goldman Sachs was reported to be taking a Treasury fund onchain via Avalanche-based Lynq.
#CryptoNewsCommunity
"24-Hour Crypto Market Update: What Happened in Crypto on September 29, 2026?"
Catch up on the latest crypto market developments from September 29, 2026.
Coinbase cleared to run its own US derivatives clearinghouse: The CFTC registered Coinbase Clearing, so Coinbase now holds the three core CFTC licenses: exchange, broker, and clearinghouse. Posts say it can settle fully collateralized contracts with USDC, around the clock.
SEC issued guidance on token buybacks: CoinDesk says buyback announcements from issuers of decentralized assets are not automatically a Howey “managerial efforts” promise. The same buyback tied to yield on a non-functional network could be treated differently.
Morgan Stanley opened a Digital Asset Lab: Bloomberg-cited posts say the bank set up an internal lab to test stablecoins, tokenization, and DeFi without touching core banking systems.
Swift’s CEO at Sibos 2026: Javier Perez-Tasso said the question is no longer TradFi vs DeFi, and that Swift’s platform should move any regulated value — fiat or tokenized — at global scale.
Cboe and S&P Dow Jones extended their S&P 500 options license through 2051 and said they may explore tokenized options. No launch date.
Citi paper with Swift and DTCC is circulating: DTCC’s tokenization service is described as launching in October 2026 on Canton for tokenized Treasuries, equities, and ETFs, with a private collateral appchain and later Stellar/Circle work mentioned for 2027.
Bitget is still dealing with last week’s $388M hack: CEO Gracy Chen told Cointelegraph she believes a North Korea-linked group was behind it. After withdrawals reopened, Bloomberg-cited posts said the exchange saw large net outflows. CoinDesk later said ETH withdrawals restarted in a phased reopening; USDT withdrawals are scheduled for 30 September. NEAR Intents said its SHIELD system blocked some stolen funds.
Ethereum’s Glamsterdam upgrade is set to go live on the Sepolia testnet on 6 October, with built-in proposer-builder separation, block-level access lists, and gas changes. Mainnet timing is still open.
MoonPay launched MoonPay Korea, aiming at remittances, payments, and stablecoin settlement with Woori Bank, KB Financial Group, and KakaoBank.
Coinbase wrapped Cardano (cbADA) is being posted as live on Solana via Sunrise, with trading on Raydium.
Aave integrated Coinbase tokenized stocks. Founder Stani Kulechov said a token burn is being considered in Aavenomics 3.0.
Coinbase also teased phone-based trading-card “rip packs” backed by real physical cards, vaulted or shipped.
Belarus registered its first two crypto banks under its new framework.
The Smarter Web Company, a UK-listed Bitcoin treasury firm, said it plans preferred shares backed by BTC.
Democratic investigators are calling for closer scrutiny of Tether over alleged Iran-linked USDT use.
Goldman Sachs was reported to be taking a Treasury fund onchain via Avalanche-based Lynq.
#CryptoNewsCommunity
Coinbase cleared to run its own US derivatives clearinghouse: The CFTC registered Coinbase Clearing, so Coinbase now holds the three core CFTC licenses: exchange, broker, and clearinghouse. Posts say it can settle fully collateralized contracts with USDC, around the clock.
SEC issued guidance on token buybacks: CoinDesk says buyback announcements from issuers of decentralized assets are not automatically a Howey “managerial efforts” promise. The same buyback tied to yield on a non-functional network could be treated differently.
Morgan Stanley opened a Digital Asset Lab: Bloomberg-cited posts say the bank set up an internal lab to test stablecoins, tokenization, and DeFi without touching core banking systems.
Swift’s CEO at Sibos 2026: Javier Perez-Tasso said the question is no longer TradFi vs DeFi, and that Swift’s platform should move any regulated value — fiat or tokenized — at global scale.
Cboe and S&P Dow Jones extended their S&P 500 options license through 2051 and said they may explore tokenized options. No launch date.
Citi paper with Swift and DTCC is circulating: DTCC’s tokenization service is described as launching in October 2026 on Canton for tokenized Treasuries, equities, and ETFs, with a private collateral appchain and later Stellar/Circle work mentioned for 2027.
Bitget is still dealing with last week’s $388M hack: CEO Gracy Chen told Cointelegraph she believes a North Korea-linked group was behind it. After withdrawals reopened, Bloomberg-cited posts said the exchange saw large net outflows. CoinDesk later said ETH withdrawals restarted in a phased reopening; USDT withdrawals are scheduled for 30 September. NEAR Intents said its SHIELD system blocked some stolen funds.
Ethereum’s Glamsterdam upgrade is set to go live on the Sepolia testnet on 6 October, with built-in proposer-builder separation, block-level access lists, and gas changes. Mainnet timing is still open.
MoonPay launched MoonPay Korea, aiming at remittances, payments, and stablecoin settlement with Woori Bank, KB Financial Group, and KakaoBank.
Coinbase wrapped Cardano (cbADA) is being posted as live on Solana via Sunrise, with trading on Raydium.
Aave integrated Coinbase tokenized stocks. Founder Stani Kulechov said a token burn is being considered in Aavenomics 3.0.
Coinbase also teased phone-based trading-card “rip packs” backed by real physical cards, vaulted or shipped.
Belarus registered its first two crypto banks under its new framework.
The Smarter Web Company, a UK-listed Bitcoin treasury firm, said it plans preferred shares backed by BTC.
Democratic investigators are calling for closer scrutiny of Tether over alleged Iran-linked USDT use.
Goldman Sachs was reported to be taking a Treasury fund onchain via Avalanche-based Lynq.
#CryptoNewsCommunity
350
Boeing Co. (NYSE: $BA
) shares were modestly higher in Tuesday pre-market trading after Monday’s sharp selloff tied to a new delay in Federal Aviation Administration certification of the 737 MAX 10.
Boeing was trading at $185.10 at 8:54 a.m. ET Tuesday, up 0.39% from Monday’s $184.39 close. The stock fell 6.91% Monday, with trading volume of about 18.05 million shares, nearly three times its roughly 6.07 million three-month average.
On Tuesday, Ryanair Holdings CEO Michael O’Leary said he hopes the MAX 10 certification setback will be a matter of “days, not weeks or months.” He also said Ryanair still expects to receive its first 15 MAX 10 aircraft in spring 2027.
The FAA said Monday it would hold off on certifying Boeing’s largest 737 MAX variant until a newly disclosed flight-management software issue is resolved.
FAA Administrator Bryan Bedford said the regulator would delay the MAX 10 until it is satisfied there is no unresolved issue. The FAA said the software can increase pilot workload during a go-around, when a landing attempt is aborted, and the aircraft climbs before another approach. Boeing has said the issue can prevent access to automated flight guidance in a specific landing scenario and that it is developing a software update.
Bedford did not provide an expected duration for the certification delay. Asked whether the software correction could take days, weeks or months, he said he did not know, while noting that work by supplier GE Aerospace could potentially accelerate the fix. The FAA has not said the delay will last only days.
#Crypto
Boeing Co. (NYSE: $BA
) shares were modestly higher in Tuesday pre-market trading after Monday’s sharp selloff tied to a new delay in Federal Aviation Administration certification of the 737 MAX 10.
Boeing was trading at $185.10 at 8:54 a.m. ET Tuesday, up 0.39% from Monday’s $184.39 close. The stock fell 6.91% Monday, with trading volume of about 18.05 million shares, nearly three times its roughly 6.07 million three-month average.
On Tuesday, Ryanair Holdings CEO Michael O’Leary said he hopes the MAX 10 certification setback will be a matter of “days, not weeks or months.” He also said Ryanair still expects to receive its first 15 MAX 10 aircraft in spring 2027.
The FAA said Monday it would hold off on certifying Boeing’s largest 737 MAX variant until a newly disclosed flight-management software issue is resolved.
FAA Administrator Bryan Bedford said the regulator would delay the MAX 10 until it is satisfied there is no unresolved issue. The FAA said the software can increase pilot workload during a go-around, when a landing attempt is aborted, and the aircraft climbs before another approach. Boeing has said the issue can prevent access to automated flight guidance in a specific landing scenario and that it is developing a software update.
Bedford did not provide an expected duration for the certification delay. Asked whether the software correction could take days, weeks or months, he said he did not know, while noting that work by supplier GE Aerospace could potentially accelerate the fix. The FAA has not said the delay will last only days.
#Crypto
) shares were modestly higher in Tuesday pre-market trading after Monday’s sharp selloff tied to a new delay in Federal Aviation Administration certification of the 737 MAX 10.
Boeing was trading at $185.10 at 8:54 a.m. ET Tuesday, up 0.39% from Monday’s $184.39 close. The stock fell 6.91% Monday, with trading volume of about 18.05 million shares, nearly three times its roughly 6.07 million three-month average.
On Tuesday, Ryanair Holdings CEO Michael O’Leary said he hopes the MAX 10 certification setback will be a matter of “days, not weeks or months.” He also said Ryanair still expects to receive its first 15 MAX 10 aircraft in spring 2027.
The FAA said Monday it would hold off on certifying Boeing’s largest 737 MAX variant until a newly disclosed flight-management software issue is resolved.
FAA Administrator Bryan Bedford said the regulator would delay the MAX 10 until it is satisfied there is no unresolved issue. The FAA said the software can increase pilot workload during a go-around, when a landing attempt is aborted, and the aircraft climbs before another approach. Boeing has said the issue can prevent access to automated flight guidance in a specific landing scenario and that it is developing a software update.
Bedford did not provide an expected duration for the certification delay. Asked whether the software correction could take days, weeks or months, he said he did not know, while noting that work by supplier GE Aerospace could potentially accelerate the fix. The FAA has not said the delay will last only days.
#Crypto
126
Vérifié
Article
"Analyst Who Urged Buying 1 BTC in 2013 Now Says Buy at Least 1 Quant (QNT)"Gold analyst Jan Nieuwenhuijs has issued a bullish outlook for Quant, urging investors to buy at least one token while highlighting a potential $10,000 upside.
In a recent post on X, Nieuwenhuijs advised his more than 121,000 followers to buy a minimum of one QNT token.
At the time, the token traded around $120. He framed the opportunity as a risk-reward bet, suggesting investors could lose $120 while potentially earning as much as $10,000 if his bullish thesis plays out.
However, Nieuwenhuijs did not provide a specific timeframe or detailed price model explaining how QNT could reach $10,000.
QNT Call Echoes His 2013 Bitcoin Prediction
Interestingly, Nieuwenhuijs’ latest QNT commentary mirrors a similar Bitcoin prediction he made in 2013.
At the time, he presented a comparable risk-reward scenario, suggesting that investors could lose $300 or potentially make $10,000 by buying Bitcoin.
Bitcoin subsequently moved far beyond the $10,000 level, eventually reaching an all-time high above $126,000. Nonetheless, Bitcoin’s historical performance does not guarantee that QNT will follow a similar trajectory.
QNT Surges 210% From the $120 Level
Meanwhile, QNT has already moved sharply higher since Nieuwenhuijs issued his latest call.
The token subsequently reached a record high near $372 yesterday, representing an increase of roughly 210% from the $120 level cited in his commentary.
The rally has also coincided with growing adoption of Quant’s technology in tokenized banking infrastructure. Last week, Quant was selected by The Clearing House to support the institution’s On-Chain Money Initiative, which aims to facilitate the clearing and settlement of tokenized deposits while connecting with payment networks such as RTP and CHIPS.
Meanwhile, Quant’s technology has supported the Great British Tokenised Deposit initiative, where seven UK banking institutions, including NatWest and Lloyds Banking Group, completed live customer transactions involving tokenized sterling deposits.
These developments provide a fundamental backdrop for the recent QNT rally.
QNT Extends Its Sharp Rally
At press time, QNT had retraced from its September 27 record high of $372 and was trading around $256.
Despite the pullback, the token remains up 45% over 24 hours and 288% over seven days. Furthermore, QNT’s market cap stood at around $3.1 billion, while its daily trading volume climbed to $1.25 billion, representing a 158% increase.
With Quant now involved in major tokenized-deposit initiatives in both the United States and the United Kingdom, market attention has increasingly focused on whether institutional adoption of its infrastructure could translate into sustained demand for QNT.
Still, the $10,000 projection remains Nieuwenhuijs’ personal bullish thesis. From $256, QNT would need to rise by roughly 3,806% to reach $10,000.
#CryptoNews🚀🔥V
"Analyst Who Urged Buying 1 BTC in 2013 Now Says Buy at Least 1 Quant (QNT)"
Gold analyst Jan Nieuwenhuijs has issued a bullish outlook for Quant, urging investors to buy at least one token while highlighting a potential $10,000 upside.
In a recent post on X, Nieuwenhuijs advised his more than 121,000 followers to buy a minimum of one QNT token.
At the time, the token traded around $120. He framed the opportunity as a risk-reward bet, suggesting investors could lose $120 while potentially earning as much as $10,000 if his bullish thesis plays out.
However, Nieuwenhuijs did not provide a specific timeframe or detailed price model explaining how QNT could reach $10,000.
QNT Call Echoes His 2013 Bitcoin Prediction
Interestingly, Nieuwenhuijs’ latest QNT commentary mirrors a similar Bitcoin prediction he made in 2013.
At the time, he presented a comparable risk-reward scenario, suggesting that investors could lose $300 or potentially make $10,000 by buying Bitcoin.
Bitcoin subsequently moved far beyond the $10,000 level, eventually reaching an all-time high above $126,000. Nonetheless, Bitcoin’s historical performance does not guarantee that QNT will follow a similar trajectory.
QNT Surges 210% From the $120 Level
Meanwhile, QNT has already moved sharply higher since Nieuwenhuijs issued his latest call.
The token subsequently reached a record high near $372 yesterday, representing an increase of roughly 210% from the $120 level cited in his commentary.
The rally has also coincided with growing adoption of Quant’s technology in tokenized banking infrastructure. Last week, Quant was selected by The Clearing House to support the institution’s On-Chain Money Initiative, which aims to facilitate the clearing and settlement of tokenized deposits while connecting with payment networks such as RTP and CHIPS.
Meanwhile, Quant’s technology has supported the Great British Tokenised Deposit initiative, where seven UK banking institutions, including NatWest and Lloyds Banking Group, completed live customer transactions involving tokenized sterling deposits.
These developments provide a fundamental backdrop for the recent QNT rally.
QNT Extends Its Sharp Rally
At press time, QNT had retraced from its September 27 record high of $372 and was trading around $256.
Despite the pullback, the token remains up 45% over 24 hours and 288% over seven days. Furthermore, QNT’s market cap stood at around $3.1 billion, while its daily trading volume climbed to $1.25 billion, representing a 158% increase.
With Quant now involved in major tokenized-deposit initiatives in both the United States and the United Kingdom, market attention has increasingly focused on whether institutional adoption of its infrastructure could translate into sustained demand for QNT.
Still, the $10,000 projection remains Nieuwenhuijs’ personal bullish thesis. From $256, QNT would need to rise by roughly 3,806% to reach $10,000.
#CryptoNews🚀🔥V
In a recent post on X, Nieuwenhuijs advised his more than 121,000 followers to buy a minimum of one QNT token.
At the time, the token traded around $120. He framed the opportunity as a risk-reward bet, suggesting investors could lose $120 while potentially earning as much as $10,000 if his bullish thesis plays out.
However, Nieuwenhuijs did not provide a specific timeframe or detailed price model explaining how QNT could reach $10,000.
QNT Call Echoes His 2013 Bitcoin Prediction
Interestingly, Nieuwenhuijs’ latest QNT commentary mirrors a similar Bitcoin prediction he made in 2013.
At the time, he presented a comparable risk-reward scenario, suggesting that investors could lose $300 or potentially make $10,000 by buying Bitcoin.
Bitcoin subsequently moved far beyond the $10,000 level, eventually reaching an all-time high above $126,000. Nonetheless, Bitcoin’s historical performance does not guarantee that QNT will follow a similar trajectory.
QNT Surges 210% From the $120 Level
Meanwhile, QNT has already moved sharply higher since Nieuwenhuijs issued his latest call.
The token subsequently reached a record high near $372 yesterday, representing an increase of roughly 210% from the $120 level cited in his commentary.
The rally has also coincided with growing adoption of Quant’s technology in tokenized banking infrastructure. Last week, Quant was selected by The Clearing House to support the institution’s On-Chain Money Initiative, which aims to facilitate the clearing and settlement of tokenized deposits while connecting with payment networks such as RTP and CHIPS.
Meanwhile, Quant’s technology has supported the Great British Tokenised Deposit initiative, where seven UK banking institutions, including NatWest and Lloyds Banking Group, completed live customer transactions involving tokenized sterling deposits.
These developments provide a fundamental backdrop for the recent QNT rally.
QNT Extends Its Sharp Rally
At press time, QNT had retraced from its September 27 record high of $372 and was trading around $256.
Despite the pullback, the token remains up 45% over 24 hours and 288% over seven days. Furthermore, QNT’s market cap stood at around $3.1 billion, while its daily trading volume climbed to $1.25 billion, representing a 158% increase.
With Quant now involved in major tokenized-deposit initiatives in both the United States and the United Kingdom, market attention has increasingly focused on whether institutional adoption of its infrastructure could translate into sustained demand for QNT.
Still, the $10,000 projection remains Nieuwenhuijs’ personal bullish thesis. From $256, QNT would need to rise by roughly 3,806% to reach $10,000.
#CryptoNews🚀🔥V
1
2k
NVIDIA Corporation (NASDAQ: $NVDA
) shares rose in Monday premarket trading after the chipmaker announced a $150 billion increase to its existing share-repurchase authorization.
NVDA was up 1.21% at $227.80 at 7:20 a.m. ET. The stock closed Friday’s regular session at $225.07, up 0.22%.
NVIDIA said its board authorized the additional $150 billion under the existing repurchase program, raising the total amount remaining under the authorization to $235 billion. The company expects to execute the remaining program through fiscal year 2028. NVIDIA described the $150 billion increase as the largest share-repurchase authorization increase in history.
NVIDIA Tokenized bStocks (NVDAB) was also trading higher, up 1.28% at $227.65, according to CoinMarketCap. CoinMarketCap describes NVDAB as a tokenized bStock providing economic exposure to NVIDIA shares.
The authorization figures require an important distinction: the $235 billion represents NVIDIA’s total remaining repurchase authority after the increase, rather than a commitment to repurchase $150 billion in shares immediately.
#CryptoNewss
NVIDIA Corporation (NASDAQ: $NVDA
) shares rose in Monday premarket trading after the chipmaker announced a $150 billion increase to its existing share-repurchase authorization.
NVDA was up 1.21% at $227.80 at 7:20 a.m. ET. The stock closed Friday’s regular session at $225.07, up 0.22%.
NVIDIA said its board authorized the additional $150 billion under the existing repurchase program, raising the total amount remaining under the authorization to $235 billion. The company expects to execute the remaining program through fiscal year 2028. NVIDIA described the $150 billion increase as the largest share-repurchase authorization increase in history.
NVIDIA Tokenized bStocks (NVDAB) was also trading higher, up 1.28% at $227.65, according to CoinMarketCap. CoinMarketCap describes NVDAB as a tokenized bStock providing economic exposure to NVIDIA shares.
The authorization figures require an important distinction: the $235 billion represents NVIDIA’s total remaining repurchase authority after the increase, rather than a commitment to repurchase $150 billion in shares immediately.
#CryptoNewss
) shares rose in Monday premarket trading after the chipmaker announced a $150 billion increase to its existing share-repurchase authorization.
NVDA was up 1.21% at $227.80 at 7:20 a.m. ET. The stock closed Friday’s regular session at $225.07, up 0.22%.
NVIDIA said its board authorized the additional $150 billion under the existing repurchase program, raising the total amount remaining under the authorization to $235 billion. The company expects to execute the remaining program through fiscal year 2028. NVIDIA described the $150 billion increase as the largest share-repurchase authorization increase in history.
NVIDIA Tokenized bStocks (NVDAB) was also trading higher, up 1.28% at $227.65, according to CoinMarketCap. CoinMarketCap describes NVDAB as a tokenized bStock providing economic exposure to NVIDIA shares.
The authorization figures require an important distinction: the $235 billion represents NVIDIA’s total remaining repurchase authority after the increase, rather than a commitment to repurchase $150 billion in shares immediately.
#CryptoNewss
253
Article
"Software Engineer Says XRP Could Climb in a “Saw-Tooth” Pattern, Predicts Price in 3 Years"Software engineer and #XRP community member Vincent Van Code believes XRP will reach $100 or more within the next three years.
In a recent post on X, he responded to people who argue that if XRP were capable of reaching $100, investors would already be buying heavily and pushing the price toward $20.
Van Code disagreed, pointing to Bitcoin and Ethereum as examples of cryptocurrencies that experienced extraordinary price increases as investor confidence grew.
For context, Bitcoin once traded at $0.05 before soaring to above $126,000. Similarly, Ethereum traded at $0.4209 at one point in its lifetime and later reached $4,900.
Meanwhile, XRP remains around $1, and many continue to hope that it will reach triple-digit prices like BTC and ETH did.
According to Van Code, stronger confidence in XRP will drive its price to $100 or beyond over the next three years.
Why Van Code Expects XRP to Rise Gradually
Van Code does not expect XRP to climb straight to $100. Instead, he expects the price to move upward in waves, with periods of gains followed by pullbacks.
His “sawtooth” comparison describes a market that experiences several sharp drops while continuing to trend higher overall. Bitcoin and Ethereum have followed similar patterns, recording major price increases alongside significant corrections.
Van Code also argues that a future price target does not have to be reflected in today’s price. Investor confidence can increase later as XRP gains adoption, utility, market access, and institutional interest.
However, his $100 target remains his personal prediction and is not a guaranteed outcome for XRP.
What Would XRP Need to Reach $100?
XRP has a circulating supply of approximately 63 billion tokens. At $100 per token, XRP’s market capitalization would be approximately $6.3 trillion.
Reaching that level would require substantially stronger demand for XRP. Greater institutional investment, increased use of the XRP Ledger, and deeper market liquidity could support such growth, although none of these factors guarantees a $100 price.
Even Higher XRP Price Predictions
While the community entertains $100 price outlooks, some members have proposed even higher targets.
Earlier this month, EasyA co-founder Dom Kwok said that XRP reaching $1,000 is now more possible than ever. His prediction was criticized by XRP analyst ChartNerd and X user Tarkan Aslaner, who said there was not enough evidence to support such a high price target.
While critics have called the trillion-dollar valuation unrealistic, Kwok insists that market capitalization alone should not limit XRP’s potential. He also said he believes XRP could reach $1,000 within four to five years.
#CryptoNewsCommunity
"Software Engineer Says XRP Could Climb in a “Saw-Tooth” Pattern, Predicts Price in 3 Years"
Software engineer and #XRP community member Vincent Van Code believes XRP will reach $100 or more within the next three years.
In a recent post on X, he responded to people who argue that if XRP were capable of reaching $100, investors would already be buying heavily and pushing the price toward $20.
Van Code disagreed, pointing to Bitcoin and Ethereum as examples of cryptocurrencies that experienced extraordinary price increases as investor confidence grew.
For context, Bitcoin once traded at $0.05 before soaring to above $126,000. Similarly, Ethereum traded at $0.4209 at one point in its lifetime and later reached $4,900.
Meanwhile, XRP remains around $1, and many continue to hope that it will reach triple-digit prices like BTC and ETH did.
According to Van Code, stronger confidence in XRP will drive its price to $100 or beyond over the next three years.
Why Van Code Expects XRP to Rise Gradually
Van Code does not expect XRP to climb straight to $100. Instead, he expects the price to move upward in waves, with periods of gains followed by pullbacks.
His “sawtooth” comparison describes a market that experiences several sharp drops while continuing to trend higher overall. Bitcoin and Ethereum have followed similar patterns, recording major price increases alongside significant corrections.
Van Code also argues that a future price target does not have to be reflected in today’s price. Investor confidence can increase later as XRP gains adoption, utility, market access, and institutional interest.
However, his $100 target remains his personal prediction and is not a guaranteed outcome for XRP.
What Would XRP Need to Reach $100?
XRP has a circulating supply of approximately 63 billion tokens. At $100 per token, XRP’s market capitalization would be approximately $6.3 trillion.
Reaching that level would require substantially stronger demand for XRP. Greater institutional investment, increased use of the XRP Ledger, and deeper market liquidity could support such growth, although none of these factors guarantees a $100 price.
Even Higher XRP Price Predictions
While the community entertains $100 price outlooks, some members have proposed even higher targets.
Earlier this month, EasyA co-founder Dom Kwok said that XRP reaching $1,000 is now more possible than ever. His prediction was criticized by XRP analyst ChartNerd and X user Tarkan Aslaner, who said there was not enough evidence to support such a high price target.
While critics have called the trillion-dollar valuation unrealistic, Kwok insists that market capitalization alone should not limit XRP’s potential. He also said he believes XRP could reach $1,000 within four to five years.
#CryptoNewsCommunity
In a recent post on X, he responded to people who argue that if XRP were capable of reaching $100, investors would already be buying heavily and pushing the price toward $20.
Van Code disagreed, pointing to Bitcoin and Ethereum as examples of cryptocurrencies that experienced extraordinary price increases as investor confidence grew.
For context, Bitcoin once traded at $0.05 before soaring to above $126,000. Similarly, Ethereum traded at $0.4209 at one point in its lifetime and later reached $4,900.
Meanwhile, XRP remains around $1, and many continue to hope that it will reach triple-digit prices like BTC and ETH did.
According to Van Code, stronger confidence in XRP will drive its price to $100 or beyond over the next three years.
Why Van Code Expects XRP to Rise Gradually
Van Code does not expect XRP to climb straight to $100. Instead, he expects the price to move upward in waves, with periods of gains followed by pullbacks.
His “sawtooth” comparison describes a market that experiences several sharp drops while continuing to trend higher overall. Bitcoin and Ethereum have followed similar patterns, recording major price increases alongside significant corrections.
Van Code also argues that a future price target does not have to be reflected in today’s price. Investor confidence can increase later as XRP gains adoption, utility, market access, and institutional interest.
However, his $100 target remains his personal prediction and is not a guaranteed outcome for XRP.
What Would XRP Need to Reach $100?
XRP has a circulating supply of approximately 63 billion tokens. At $100 per token, XRP’s market capitalization would be approximately $6.3 trillion.
Reaching that level would require substantially stronger demand for XRP. Greater institutional investment, increased use of the XRP Ledger, and deeper market liquidity could support such growth, although none of these factors guarantees a $100 price.
Even Higher XRP Price Predictions
While the community entertains $100 price outlooks, some members have proposed even higher targets.
Earlier this month, EasyA co-founder Dom Kwok said that XRP reaching $1,000 is now more possible than ever. His prediction was criticized by XRP analyst ChartNerd and X user Tarkan Aslaner, who said there was not enough evidence to support such a high price target.
While critics have called the trillion-dollar valuation unrealistic, Kwok insists that market capitalization alone should not limit XRP’s potential. He also said he believes XRP could reach $1,000 within four to five years.
#CryptoNewsCommunity
677
Article
"SK Hynix Stock Falls as Solidigm IPO Concerns Emerge"SK hynix Inc. (NASDAQ: SKHY) American Depositary Shares were indicated at $183.57 at 6:13 a.m. ET Monday, down 4.17% in premarket trading, after the company’s Seoul-listed shares fell 5.05% amid a broader semiconductor selloff.
Investors were also weighing separate concerns over a possible U.S. listing of SK hynix subsidiary Solidigm. Separately, the Nasdaq-listed ADSs continued to trade at a substantial premium to the equivalent value of the Korean common shares.
SKHY had closed Friday’s regular U.S. session at $191.56, up 2.78%. The ADSs have traded on the Nasdaq Global Select Market under the SKHY symbol on a regular-way basis since July.
Reuters reported Sept. 25 that Solidigm was considering an IPO as early as 2027 that could raise about $15 billion and value the business at as much as $150 billion. Bloomberg later reported a potential valuation of up to $100 billion, also citing people familiar with the matter. The unit had held pitch meetings with investment banks, although Reuters said the plans remained at an early stage and could change with market conditions.
SK hynix told Reuters that Solidigm was reviewing options to strengthen its competitiveness but said it had not confirmed any specific plans. Korean market coverage separately raised concerns that a Solidigm listing could create a duplicate-listing issue within the SK ownership structure and reduce benefits that might otherwise accrue to existing shareholders.
That stock-specific concern came alongside Monday’s broader weakness in Korean semiconductor shares rather than replacing it as the market backdrop.
Nasdaq ADSs Trade at About a 42% Premium to Seoul
SK hynix’s Korean shares closed Monday at KRW 1,768,000, down 5.05%. SK hynix final SEC prospectus states that each U.S. ADS represents one-tenth of one SK hynix common share.
Monday’s 3:30 p.m. Korean foreign-exchange reference rate was KRW 1,365.1 per U.S. dollar. At that rate, the Seoul closing price converts to about $1,295.14 for one Korean common share. Because one SKHY ADS represents 0.1 of a common share, the corresponding ADS-equivalent value is approximately $129.51.
Compared with the earlier $183.57 U.S. premarket quote, SKHY was trading at an approximately 41.7% premium to that Seoul-equivalent reference value.
The comparison uses the Korean closing price and 3:30 p.m. foreign-exchange reference rate, both established before the cited U.S. premarket quote. It therefore compares prices from different market timestamps rather than simultaneous executable quotes.
Foreign Selling and Broader Chip Weakness Pressure Seoul Shares
SK hynix opened at KRW 1,825,000 before weakening through Monday’s Seoul session. According to Yonhap, foreign investors sold a net KRW 1.7275 trillion worth of SK hynix shares, the largest foreign net selling total for any individual KOSPI stock. Meanwhile, institutions sold another KRW 491 billion worth of shares.
Across the KOSPI, foreign investors sold a net KRW 3.2403 trillion.
The broader Korean market also declined. The KOSPI finished 2.70% lower, while Samsung Electronics fell 5.43%, indicating that the weakness extended beyond SK hynix. Yonhap cited pressure on semiconductor shares from developments that accumulated during South Korea’s holiday break, including higher U.S. Treasury yields.
ADS Conversion Involves Procedures, Fees and Market Frictions
SK hynix’s deposit agreement provides for common shares to be deposited with the custodian for the issuance of ADSs and for ADS holders to surrender ADSs to withdraw the corresponding deposited securities.
Those processes are subject to documentation requirements, applicable laws, Korean clearing-system rules, fees, taxes, and other charges. The agreement also allows certain issuance or transfer processes to be temporarily suspended under specified circumstances.
These provisions govern the process for moving between the deposited Korean shares and the U.S.-listed ADS structure, separate from the cross-market price comparison calculated from the Seoul close and U.S. premarket quote.
As separate market context, a contemporaneous CoinMarketCap snapshot showed SK Hynix Tokenized bStocks (SKHYB) trading at $183.58, down 4.51% over the prior 24 hours. The tokenized-stock price is not part of the Seoul-versus-Nasdaq ADS parity calculation and does not establish a reference value for either listed security. CoinMarketCap identifies SKHYB as a separate tokenized-stock product.
#CryptonewswithJack
"SK Hynix Stock Falls as Solidigm IPO Concerns Emerge"
SK hynix Inc. (NASDAQ: SKHY) American Depositary Shares were indicated at $183.57 at 6:13 a.m. ET Monday, down 4.17% in premarket trading, after the company’s Seoul-listed shares fell 5.05% amid a broader semiconductor selloff.
Investors were also weighing separate concerns over a possible U.S. listing of SK hynix subsidiary Solidigm. Separately, the Nasdaq-listed ADSs continued to trade at a substantial premium to the equivalent value of the Korean common shares.
SKHY had closed Friday’s regular U.S. session at $191.56, up 2.78%. The ADSs have traded on the Nasdaq Global Select Market under the SKHY symbol on a regular-way basis since July.
Reuters reported Sept. 25 that Solidigm was considering an IPO as early as 2027 that could raise about $15 billion and value the business at as much as $150 billion. Bloomberg later reported a potential valuation of up to $100 billion, also citing people familiar with the matter. The unit had held pitch meetings with investment banks, although Reuters said the plans remained at an early stage and could change with market conditions.
SK hynix told Reuters that Solidigm was reviewing options to strengthen its competitiveness but said it had not confirmed any specific plans. Korean market coverage separately raised concerns that a Solidigm listing could create a duplicate-listing issue within the SK ownership structure and reduce benefits that might otherwise accrue to existing shareholders.
That stock-specific concern came alongside Monday’s broader weakness in Korean semiconductor shares rather than replacing it as the market backdrop.
Nasdaq ADSs Trade at About a 42% Premium to Seoul
SK hynix’s Korean shares closed Monday at KRW 1,768,000, down 5.05%. SK hynix final SEC prospectus states that each U.S. ADS represents one-tenth of one SK hynix common share.
Monday’s 3:30 p.m. Korean foreign-exchange reference rate was KRW 1,365.1 per U.S. dollar. At that rate, the Seoul closing price converts to about $1,295.14 for one Korean common share. Because one SKHY ADS represents 0.1 of a common share, the corresponding ADS-equivalent value is approximately $129.51.
Compared with the earlier $183.57 U.S. premarket quote, SKHY was trading at an approximately 41.7% premium to that Seoul-equivalent reference value.
The comparison uses the Korean closing price and 3:30 p.m. foreign-exchange reference rate, both established before the cited U.S. premarket quote. It therefore compares prices from different market timestamps rather than simultaneous executable quotes.
Foreign Selling and Broader Chip Weakness Pressure Seoul Shares
SK hynix opened at KRW 1,825,000 before weakening through Monday’s Seoul session. According to Yonhap, foreign investors sold a net KRW 1.7275 trillion worth of SK hynix shares, the largest foreign net selling total for any individual KOSPI stock. Meanwhile, institutions sold another KRW 491 billion worth of shares.
Across the KOSPI, foreign investors sold a net KRW 3.2403 trillion.
The broader Korean market also declined. The KOSPI finished 2.70% lower, while Samsung Electronics fell 5.43%, indicating that the weakness extended beyond SK hynix. Yonhap cited pressure on semiconductor shares from developments that accumulated during South Korea’s holiday break, including higher U.S. Treasury yields.
ADS Conversion Involves Procedures, Fees and Market Frictions
SK hynix’s deposit agreement provides for common shares to be deposited with the custodian for the issuance of ADSs and for ADS holders to surrender ADSs to withdraw the corresponding deposited securities.
Those processes are subject to documentation requirements, applicable laws, Korean clearing-system rules, fees, taxes, and other charges. The agreement also allows certain issuance or transfer processes to be temporarily suspended under specified circumstances.
These provisions govern the process for moving between the deposited Korean shares and the U.S.-listed ADS structure, separate from the cross-market price comparison calculated from the Seoul close and U.S. premarket quote.
As separate market context, a contemporaneous CoinMarketCap snapshot showed SK Hynix Tokenized bStocks (SKHYB) trading at $183.58, down 4.51% over the prior 24 hours. The tokenized-stock price is not part of the Seoul-versus-Nasdaq ADS parity calculation and does not establish a reference value for either listed security. CoinMarketCap identifies SKHYB as a separate tokenized-stock product.
#CryptonewswithJack
Investors were also weighing separate concerns over a possible U.S. listing of SK hynix subsidiary Solidigm. Separately, the Nasdaq-listed ADSs continued to trade at a substantial premium to the equivalent value of the Korean common shares.
SKHY had closed Friday’s regular U.S. session at $191.56, up 2.78%. The ADSs have traded on the Nasdaq Global Select Market under the SKHY symbol on a regular-way basis since July.
Reuters reported Sept. 25 that Solidigm was considering an IPO as early as 2027 that could raise about $15 billion and value the business at as much as $150 billion. Bloomberg later reported a potential valuation of up to $100 billion, also citing people familiar with the matter. The unit had held pitch meetings with investment banks, although Reuters said the plans remained at an early stage and could change with market conditions.
SK hynix told Reuters that Solidigm was reviewing options to strengthen its competitiveness but said it had not confirmed any specific plans. Korean market coverage separately raised concerns that a Solidigm listing could create a duplicate-listing issue within the SK ownership structure and reduce benefits that might otherwise accrue to existing shareholders.
That stock-specific concern came alongside Monday’s broader weakness in Korean semiconductor shares rather than replacing it as the market backdrop.
Nasdaq ADSs Trade at About a 42% Premium to Seoul
SK hynix’s Korean shares closed Monday at KRW 1,768,000, down 5.05%. SK hynix final SEC prospectus states that each U.S. ADS represents one-tenth of one SK hynix common share.
Monday’s 3:30 p.m. Korean foreign-exchange reference rate was KRW 1,365.1 per U.S. dollar. At that rate, the Seoul closing price converts to about $1,295.14 for one Korean common share. Because one SKHY ADS represents 0.1 of a common share, the corresponding ADS-equivalent value is approximately $129.51.
Compared with the earlier $183.57 U.S. premarket quote, SKHY was trading at an approximately 41.7% premium to that Seoul-equivalent reference value.
The comparison uses the Korean closing price and 3:30 p.m. foreign-exchange reference rate, both established before the cited U.S. premarket quote. It therefore compares prices from different market timestamps rather than simultaneous executable quotes.
Foreign Selling and Broader Chip Weakness Pressure Seoul Shares
SK hynix opened at KRW 1,825,000 before weakening through Monday’s Seoul session. According to Yonhap, foreign investors sold a net KRW 1.7275 trillion worth of SK hynix shares, the largest foreign net selling total for any individual KOSPI stock. Meanwhile, institutions sold another KRW 491 billion worth of shares.
Across the KOSPI, foreign investors sold a net KRW 3.2403 trillion.
The broader Korean market also declined. The KOSPI finished 2.70% lower, while Samsung Electronics fell 5.43%, indicating that the weakness extended beyond SK hynix. Yonhap cited pressure on semiconductor shares from developments that accumulated during South Korea’s holiday break, including higher U.S. Treasury yields.
ADS Conversion Involves Procedures, Fees and Market Frictions
SK hynix’s deposit agreement provides for common shares to be deposited with the custodian for the issuance of ADSs and for ADS holders to surrender ADSs to withdraw the corresponding deposited securities.
Those processes are subject to documentation requirements, applicable laws, Korean clearing-system rules, fees, taxes, and other charges. The agreement also allows certain issuance or transfer processes to be temporarily suspended under specified circumstances.
These provisions govern the process for moving between the deposited Korean shares and the U.S.-listed ADS structure, separate from the cross-market price comparison calculated from the Seoul close and U.S. premarket quote.
As separate market context, a contemporaneous CoinMarketCap snapshot showed SK Hynix Tokenized bStocks (SKHYB) trading at $183.58, down 4.51% over the prior 24 hours. The tokenized-stock price is not part of the Seoul-versus-Nasdaq ADS parity calculation and does not establish a reference value for either listed security. CoinMarketCap identifies SKHYB as a separate tokenized-stock product.
#CryptonewswithJack
72
Vérifié
Micron Technology Inc. (NASDAQ: $MU
) shares were down 1.32% at $1,068 in Monday premarket trading at about 8:36 a.m. ET, even as two Wall Street firms issued fresh commentary pointing to stronger memory-market conditions ahead of the company’s fiscal fourth-quarter results.
The move followed Friday’s regular-session close of $1,082.28, when Micron gained 0.16%. Baird raised its price target on the memory-chip maker, while JPMorgan reiterated its Overweight rating and said it expects Micron to exceed several August-quarter consensus estimates.
Baird increased its Micron price target to $1,520 from $1,280, citing stronger demand tied to agentic AI, a projected slowdown in industry DRAM supply-bit growth in 2027, and an improved margin outlook for high-bandwidth memory next year.
Separately, JPMorgan maintained its Overweight rating and $1,540 price target. The firm expects Micron’s August-quarter revenue, gross margin and earnings per share to exceed consensus estimates of $51.4 billion, 86.2% and $31.73, respectively.
JPMorgan said pricing momentum remained robust during the quarter. Micron had previously said its fiscal Q4 gross-margin outlook incorporated a meaningful moderation in the pace of price increases. JPMorgan attributed that moderation to efforts to preserve customer relationships and secure longer-term supply and capacity agreements rather than weakening demand.
Micron’s own fiscal Q4 guidance, issued in June, called for revenue of $50.0 billion, plus or minus $1.0 billion, gross margin of approximately 86%, and non-GAAP diluted EPS of $31.00, plus or minus $1.00.
Micron is scheduled to hold its fiscal fourth-quarter financial call on Wednesday, Sept. 30, at 2:30 p.m. Mountain Time, or 4:30 p.m. ET.
#Crypto
Micron Technology Inc. (NASDAQ: $MU
) shares were down 1.32% at $1,068 in Monday premarket trading at about 8:36 a.m. ET, even as two Wall Street firms issued fresh commentary pointing to stronger memory-market conditions ahead of the company’s fiscal fourth-quarter results.
The move followed Friday’s regular-session close of $1,082.28, when Micron gained 0.16%. Baird raised its price target on the memory-chip maker, while JPMorgan reiterated its Overweight rating and said it expects Micron to exceed several August-quarter consensus estimates.
Baird increased its Micron price target to $1,520 from $1,280, citing stronger demand tied to agentic AI, a projected slowdown in industry DRAM supply-bit growth in 2027, and an improved margin outlook for high-bandwidth memory next year.
Separately, JPMorgan maintained its Overweight rating and $1,540 price target. The firm expects Micron’s August-quarter revenue, gross margin and earnings per share to exceed consensus estimates of $51.4 billion, 86.2% and $31.73, respectively.
JPMorgan said pricing momentum remained robust during the quarter. Micron had previously said its fiscal Q4 gross-margin outlook incorporated a meaningful moderation in the pace of price increases. JPMorgan attributed that moderation to efforts to preserve customer relationships and secure longer-term supply and capacity agreements rather than weakening demand.
Micron’s own fiscal Q4 guidance, issued in June, called for revenue of $50.0 billion, plus or minus $1.0 billion, gross margin of approximately 86%, and non-GAAP diluted EPS of $31.00, plus or minus $1.00.
Micron is scheduled to hold its fiscal fourth-quarter financial call on Wednesday, Sept. 30, at 2:30 p.m. Mountain Time, or 4:30 p.m. ET.
#Crypto
) shares were down 1.32% at $1,068 in Monday premarket trading at about 8:36 a.m. ET, even as two Wall Street firms issued fresh commentary pointing to stronger memory-market conditions ahead of the company’s fiscal fourth-quarter results.
The move followed Friday’s regular-session close of $1,082.28, when Micron gained 0.16%. Baird raised its price target on the memory-chip maker, while JPMorgan reiterated its Overweight rating and said it expects Micron to exceed several August-quarter consensus estimates.
Baird increased its Micron price target to $1,520 from $1,280, citing stronger demand tied to agentic AI, a projected slowdown in industry DRAM supply-bit growth in 2027, and an improved margin outlook for high-bandwidth memory next year.
Separately, JPMorgan maintained its Overweight rating and $1,540 price target. The firm expects Micron’s August-quarter revenue, gross margin and earnings per share to exceed consensus estimates of $51.4 billion, 86.2% and $31.73, respectively.
JPMorgan said pricing momentum remained robust during the quarter. Micron had previously said its fiscal Q4 gross-margin outlook incorporated a meaningful moderation in the pace of price increases. JPMorgan attributed that moderation to efforts to preserve customer relationships and secure longer-term supply and capacity agreements rather than weakening demand.
Micron’s own fiscal Q4 guidance, issued in June, called for revenue of $50.0 billion, plus or minus $1.0 billion, gross margin of approximately 86%, and non-GAAP diluted EPS of $31.00, plus or minus $1.00.
Micron is scheduled to hold its fiscal fourth-quarter financial call on Wednesday, Sept. 30, at 2:30 p.m. Mountain Time, or 4:30 p.m. ET.
#Crypto
380
"XRP Price Scenarios Based on Previous RSI Cycle Rallies"XRP Monthly RSI Returns to Historical Recovery Zone as Key Crossover Remains Unconfirmed.
XRP’s monthly chart is showing an RSI configuration similar to conditions seen before two previous large price advances, but the technical signal highlighted in the setup has not yet been confirmed.
The XRP/USD monthly chart tracks the Relative Strength Index alongside a moving average of the indicator. The current RSI reading has fallen into a lower range that previously appeared during major corrective phases, while the RSI remains below its yellow moving-average line.
The key condition being monitored is a monthly RSI crossover back above that moving average. Until that occurs, the historical comparison remains incomplete.
Previous RSI Setups Preceded Major XRP Advances
The chart highlights earlier periods in which XRP’s monthly RSI dropped into a comparable zone before recovering.
During one previous cycle, XRP traded near $0.18 before later advancing to almost $2. A separate setup occurred when XRP was around $0.37, followed by an eventual move toward approximately $3.30.
In both cases, the RSI first declined into the lower highlighted region before turning higher. The green RSI line subsequently crossed or recovered above its yellow moving average as momentum improved.
The current configuration shows XRP’s RSI again positioned in that lower historical range. However, the green RSI line has only started to turn upward and remains below the yellow moving average on the monthly timeframe.
That difference is significant because the chart’s proposed confirmation condition has not yet occurred.
Using XRP’s current price near $1.54, the two historical scenarios would look like this:
$0.18 → $2.00: about an 11.11× move, or roughly +1,011%. Applied to $1.54, XRP would reach approximately $17.11.$0.37 → $3.30: about an 8.92× move, or roughly +792%. Applied to $1.54, XRP would reach approximately $13.74.
These figures are mathematical comparisons with previous rallies, not price forecasts.
XRP Price Also Remains Inside Its Broader Monthly Structure
The price panel shows XRP trading within a set of long-term moving-average bands following its latest pullback from the 2025 advance.
The chart marks comparable periods around 2017, 2021 and 2025, showing how XRP has previously moved through extended consolidation and correction phases while momentum reset on the monthly RSI.
The present setup does not establish that XRP will repeat the magnitude of earlier rallies. The historical moves began from different prices, occurred under different market conditions and unfolded over different periods.
For the current pattern, the next technical development is straightforward: the monthly RSI would need to cross back above its moving average to reproduce the confirmation seen in the earlier examples.
Until that crossover occurs, the setup remains a historical comparison rather than a completed momentum signal.
#CryptoNewsCommunity
"XRP Price Scenarios Based on Previous RSI Cycle Rallies"
XRP Monthly RSI Returns to Historical Recovery Zone as Key Crossover Remains Unconfirmed.
XRP’s monthly chart is showing an RSI configuration similar to conditions seen before two previous large price advances, but the technical signal highlighted in the setup has not yet been confirmed.
The XRP/USD monthly chart tracks the Relative Strength Index alongside a moving average of the indicator. The current RSI reading has fallen into a lower range that previously appeared during major corrective phases, while the RSI remains below its yellow moving-average line.
The key condition being monitored is a monthly RSI crossover back above that moving average. Until that occurs, the historical comparison remains incomplete.
Previous RSI Setups Preceded Major XRP Advances
The chart highlights earlier periods in which XRP’s monthly RSI dropped into a comparable zone before recovering.
During one previous cycle, XRP traded near $0.18 before later advancing to almost $2. A separate setup occurred when XRP was around $0.37, followed by an eventual move toward approximately $3.30.
In both cases, the RSI first declined into the lower highlighted region before turning higher. The green RSI line subsequently crossed or recovered above its yellow moving average as momentum improved.
The current configuration shows XRP’s RSI again positioned in that lower historical range. However, the green RSI line has only started to turn upward and remains below the yellow moving average on the monthly timeframe.
That difference is significant because the chart’s proposed confirmation condition has not yet occurred.
Using XRP’s current price near $1.54, the two historical scenarios would look like this:
$0.18 → $2.00: about an 11.11× move, or roughly +1,011%. Applied to $1.54, XRP would reach approximately $17.11.$0.37 → $3.30: about an 8.92× move, or roughly +792%. Applied to $1.54, XRP would reach approximately $13.74.
These figures are mathematical comparisons with previous rallies, not price forecasts.
XRP Price Also Remains Inside Its Broader Monthly Structure
The price panel shows XRP trading within a set of long-term moving-average bands following its latest pullback from the 2025 advance.
The chart marks comparable periods around 2017, 2021 and 2025, showing how XRP has previously moved through extended consolidation and correction phases while momentum reset on the monthly RSI.
The present setup does not establish that XRP will repeat the magnitude of earlier rallies. The historical moves began from different prices, occurred under different market conditions and unfolded over different periods.
For the current pattern, the next technical development is straightforward: the monthly RSI would need to cross back above its moving average to reproduce the confirmation seen in the earlier examples.
Until that crossover occurs, the setup remains a historical comparison rather than a completed momentum signal.
#CryptoNewsCommunity
XRP’s monthly chart is showing an RSI configuration similar to conditions seen before two previous large price advances, but the technical signal highlighted in the setup has not yet been confirmed.
The XRP/USD monthly chart tracks the Relative Strength Index alongside a moving average of the indicator. The current RSI reading has fallen into a lower range that previously appeared during major corrective phases, while the RSI remains below its yellow moving-average line.
The key condition being monitored is a monthly RSI crossover back above that moving average. Until that occurs, the historical comparison remains incomplete.
Previous RSI Setups Preceded Major XRP Advances
The chart highlights earlier periods in which XRP’s monthly RSI dropped into a comparable zone before recovering.
During one previous cycle, XRP traded near $0.18 before later advancing to almost $2. A separate setup occurred when XRP was around $0.37, followed by an eventual move toward approximately $3.30.
In both cases, the RSI first declined into the lower highlighted region before turning higher. The green RSI line subsequently crossed or recovered above its yellow moving average as momentum improved.
The current configuration shows XRP’s RSI again positioned in that lower historical range. However, the green RSI line has only started to turn upward and remains below the yellow moving average on the monthly timeframe.
That difference is significant because the chart’s proposed confirmation condition has not yet occurred.
Using XRP’s current price near $1.54, the two historical scenarios would look like this:
$0.18 → $2.00: about an 11.11× move, or roughly +1,011%. Applied to $1.54, XRP would reach approximately $17.11.$0.37 → $3.30: about an 8.92× move, or roughly +792%. Applied to $1.54, XRP would reach approximately $13.74.
These figures are mathematical comparisons with previous rallies, not price forecasts.
XRP Price Also Remains Inside Its Broader Monthly Structure
The price panel shows XRP trading within a set of long-term moving-average bands following its latest pullback from the 2025 advance.
The chart marks comparable periods around 2017, 2021 and 2025, showing how XRP has previously moved through extended consolidation and correction phases while momentum reset on the monthly RSI.
The present setup does not establish that XRP will repeat the magnitude of earlier rallies. The historical moves began from different prices, occurred under different market conditions and unfolded over different periods.
For the current pattern, the next technical development is straightforward: the monthly RSI would need to cross back above its moving average to reproduce the confirmation seen in the earlier examples.
Until that crossover occurs, the setup remains a historical comparison rather than a completed momentum signal.
#CryptoNewsCommunity
440
Article
"Cardano DEX Volume Rises 148% in a Week"Cardano’s decentralized finance (DeFi) activity has picked up recently, with decentralized exchanges recording a sharp increase in trading volume over the past week.
According to DeFiLlama data, Cardano’s DEX volume has surged 148% over the past seven days to $17.49 million. The increase points to stronger trading activity across Cardano-based DEXs.
Nonetheless, current volume remains well below the $101.89 million recorded in mid-August, when DEX volume surged 1,434% in a week.
While the latest increase signals renewed activity, it has not yet returned to the levels seen last month. Cardano currently records $2.18 million in 24-hour DEX volume, while its monthly volume stands at around $47.49 million.
SundaeSwap Leads Cardano DEX Activity
Among Cardano’s decentralized exchanges, SundaeSwap currently accounts for the largest share of trading activity across the daily, weekly, and monthly timeframes.
SundaeSwap processed $1.13 million in 24-hour volume, representing 51.83% of Cardano’s $2.18 million daily DEX volume.
Over the past seven days, the exchange recorded $7.66 million in volume, giving it a 43.79% share of Cardano’s $17.49 million weekly total. Meanwhile, SundaeSwap’s monthly volume stands at $19.36 million, accounting for 40.76% of the network’s $47.49 million total.
Other Cardano DEXs Contribute to Trading Activity
Other protocols have also contributed to Cardano’s recent trading activity. Dano Finance recorded $588,794 in 24-hour volume, followed by Minswap with $272,135, and WingRiders with $189,578. Splash Protocol recorded roughly $3,366.
Over the past week, the four protocols recorded $5.1 million, $2.96 million, $1.73 million, and $40,620, respectively.
Much of this trading activity centers on ADA-based pairs. For instance, WMTX/ADA on SundaeSwap, SNEK/ADA on Minswap, and USDM/ADA on WingRiders are among the pairs contributing to the reported volumes. As a result, ADA remains central to trading activity across Cardano’s DEX ecosystem.
Cardano DeFi TVL Soars Over 5% in 24 Hours
Meanwhile, Cardano’s broader DeFi market has also shown signs of improvement. DeFiLlama data puts the network’s total value locked (TVL) at $67.42 million, representing a 5.06% increase over the past 24 hours.
Minswap currently holds the largest share of Cardano’s TVL at $16.46 million. Liqwid follows with around $12.8 million, while Dano Finance has $6.7 million locked in its protocol.
"Cardano DEX Volume Rises 148% in a Week"
Cardano’s decentralized finance (DeFi) activity has picked up recently, with decentralized exchanges recording a sharp increase in trading volume over the past week.
According to DeFiLlama data, Cardano’s DEX volume has surged 148% over the past seven days to $17.49 million. The increase points to stronger trading activity across Cardano-based DEXs.
Nonetheless, current volume remains well below the $101.89 million recorded in mid-August, when DEX volume surged 1,434% in a week.
While the latest increase signals renewed activity, it has not yet returned to the levels seen last month. Cardano currently records $2.18 million in 24-hour DEX volume, while its monthly volume stands at around $47.49 million.
SundaeSwap Leads Cardano DEX Activity
Among Cardano’s decentralized exchanges, SundaeSwap currently accounts for the largest share of trading activity across the daily, weekly, and monthly timeframes.
SundaeSwap processed $1.13 million in 24-hour volume, representing 51.83% of Cardano’s $2.18 million daily DEX volume.
Over the past seven days, the exchange recorded $7.66 million in volume, giving it a 43.79% share of Cardano’s $17.49 million weekly total. Meanwhile, SundaeSwap’s monthly volume stands at $19.36 million, accounting for 40.76% of the network’s $47.49 million total.
Other Cardano DEXs Contribute to Trading Activity
Other protocols have also contributed to Cardano’s recent trading activity. Dano Finance recorded $588,794 in 24-hour volume, followed by Minswap with $272,135, and WingRiders with $189,578. Splash Protocol recorded roughly $3,366.
Over the past week, the four protocols recorded $5.1 million, $2.96 million, $1.73 million, and $40,620, respectively.
Much of this trading activity centers on ADA-based pairs. For instance, WMTX/ADA on SundaeSwap, SNEK/ADA on Minswap, and USDM/ADA on WingRiders are among the pairs contributing to the reported volumes. As a result, ADA remains central to trading activity across Cardano’s DEX ecosystem.
Cardano DeFi TVL Soars Over 5% in 24 Hours
Meanwhile, Cardano’s broader DeFi market has also shown signs of improvement. DeFiLlama data puts the network’s total value locked (TVL) at $67.42 million, representing a 5.06% increase over the past 24 hours.
Minswap currently holds the largest share of Cardano’s TVL at $16.46 million. Liqwid follows with around $12.8 million, while Dano Finance has $6.7 million locked in its protocol.
According to DeFiLlama data, Cardano’s DEX volume has surged 148% over the past seven days to $17.49 million. The increase points to stronger trading activity across Cardano-based DEXs.
Nonetheless, current volume remains well below the $101.89 million recorded in mid-August, when DEX volume surged 1,434% in a week.
While the latest increase signals renewed activity, it has not yet returned to the levels seen last month. Cardano currently records $2.18 million in 24-hour DEX volume, while its monthly volume stands at around $47.49 million.
SundaeSwap Leads Cardano DEX Activity
Among Cardano’s decentralized exchanges, SundaeSwap currently accounts for the largest share of trading activity across the daily, weekly, and monthly timeframes.
SundaeSwap processed $1.13 million in 24-hour volume, representing 51.83% of Cardano’s $2.18 million daily DEX volume.
Over the past seven days, the exchange recorded $7.66 million in volume, giving it a 43.79% share of Cardano’s $17.49 million weekly total. Meanwhile, SundaeSwap’s monthly volume stands at $19.36 million, accounting for 40.76% of the network’s $47.49 million total.
Other Cardano DEXs Contribute to Trading Activity
Other protocols have also contributed to Cardano’s recent trading activity. Dano Finance recorded $588,794 in 24-hour volume, followed by Minswap with $272,135, and WingRiders with $189,578. Splash Protocol recorded roughly $3,366.
Over the past week, the four protocols recorded $5.1 million, $2.96 million, $1.73 million, and $40,620, respectively.
Much of this trading activity centers on ADA-based pairs. For instance, WMTX/ADA on SundaeSwap, SNEK/ADA on Minswap, and USDM/ADA on WingRiders are among the pairs contributing to the reported volumes. As a result, ADA remains central to trading activity across Cardano’s DEX ecosystem.
Cardano DeFi TVL Soars Over 5% in 24 Hours
Meanwhile, Cardano’s broader DeFi market has also shown signs of improvement. DeFiLlama data puts the network’s total value locked (TVL) at $67.42 million, representing a 5.06% increase over the past 24 hours.
Minswap currently holds the largest share of Cardano’s TVL at $16.46 million. Liqwid follows with around $12.8 million, while Dano Finance has $6.7 million locked in its protocol.
1
418
Article
"XRP Faces Two Q4 Paths as Price Tests 50-Week EMA Near $1.56"#XRP is testing a key $1.50-$1.60 weekly resistance zone, with technical scenarios pointing either to a Q4 pullback or a move toward $1.80-$2.00.
XRP is trading around a key weekly resistance area as two technical scenarios come into focus for the coming weeks. The immediate decision zone sits between roughly $1.50 and $1.60, where XRP is testing its 50-week exponential moving average and a horizontal resistance level.
Chart analyst ChartNerd outlined two potential paths. The first involves XRP being rejected around the $1.50-$1.60 range, followed by a retracement during the fourth quarter. The second allows for a stronger extension toward $1.80-$2.00 before a deeper Q4 pullback.
The chart places XRP near $1.5625, while the 50-week EMA is shown around $1.5238. That leaves XRP only about 2.5% above the moving average, keeping the asset close to the technical level that separates the two scenarios.
XRP Needs to Clear $1.60 for the Higher Scenario
The first scenario would remain active if XRP fails to establish a sustained weekly move above the $1.50-$1.60 resistance zone. A rejection from this area would leave the broader corrective structure intact and could send price back toward lower support during Q4.
The chart does not assign a precise downside target to that retracement, so any lower level beyond the marked resistance area remains unconfirmed.
The second scenario requires XRP to move beyond the current resistance band and advance toward $1.80-$2.00. From the chart’s $1.5625 reference price, a move to $1.80 would represent an increase of approximately 15.2%, while $2.00 would require a gain of about 28%.
The $2 region is significant because it corresponds with a horizontal area that previously acted as support during 2025. Under this scenario, XRP would retest that former support zone from below before any larger pullback develops.
XRP Is at a Weekly Decision Point
The chart shows that XRP’s current position is directly around the declining 50-week EMA, which has moved lower since the 2025 peak. Price is also approaching the lower red resistance band near $1.60.
From a technical standpoint, the next confirmation would come from XRP’s behavior around this zone. A weekly close above $1.60 would weaken the immediate rejection scenario and increase the relevance of the $1.80-$2.00 range.
Conversely, failure to hold above the 50-week EMA would keep the lower Q4 retracement scenario open.
For now, neither path is confirmed. XRP remains inside the key $1.50-$1.60 decision area, making the weekly close and subsequent follow-through the main data points to watch.
#Crypto
"XRP Faces Two Q4 Paths as Price Tests 50-Week EMA Near $1.56"
#XRP is testing a key $1.50-$1.60 weekly resistance zone, with technical scenarios pointing either to a Q4 pullback or a move toward $1.80-$2.00.
XRP is trading around a key weekly resistance area as two technical scenarios come into focus for the coming weeks. The immediate decision zone sits between roughly $1.50 and $1.60, where XRP is testing its 50-week exponential moving average and a horizontal resistance level.
Chart analyst ChartNerd outlined two potential paths. The first involves XRP being rejected around the $1.50-$1.60 range, followed by a retracement during the fourth quarter. The second allows for a stronger extension toward $1.80-$2.00 before a deeper Q4 pullback.
The chart places XRP near $1.5625, while the 50-week EMA is shown around $1.5238. That leaves XRP only about 2.5% above the moving average, keeping the asset close to the technical level that separates the two scenarios.
XRP Needs to Clear $1.60 for the Higher Scenario
The first scenario would remain active if XRP fails to establish a sustained weekly move above the $1.50-$1.60 resistance zone. A rejection from this area would leave the broader corrective structure intact and could send price back toward lower support during Q4.
The chart does not assign a precise downside target to that retracement, so any lower level beyond the marked resistance area remains unconfirmed.
The second scenario requires XRP to move beyond the current resistance band and advance toward $1.80-$2.00. From the chart’s $1.5625 reference price, a move to $1.80 would represent an increase of approximately 15.2%, while $2.00 would require a gain of about 28%.
The $2 region is significant because it corresponds with a horizontal area that previously acted as support during 2025. Under this scenario, XRP would retest that former support zone from below before any larger pullback develops.
XRP Is at a Weekly Decision Point
The chart shows that XRP’s current position is directly around the declining 50-week EMA, which has moved lower since the 2025 peak. Price is also approaching the lower red resistance band near $1.60.
From a technical standpoint, the next confirmation would come from XRP’s behavior around this zone. A weekly close above $1.60 would weaken the immediate rejection scenario and increase the relevance of the $1.80-$2.00 range.
Conversely, failure to hold above the 50-week EMA would keep the lower Q4 retracement scenario open.
For now, neither path is confirmed. XRP remains inside the key $1.50-$1.60 decision area, making the weekly close and subsequent follow-through the main data points to watch.
#Crypto
XRP is trading around a key weekly resistance area as two technical scenarios come into focus for the coming weeks. The immediate decision zone sits between roughly $1.50 and $1.60, where XRP is testing its 50-week exponential moving average and a horizontal resistance level.
Chart analyst ChartNerd outlined two potential paths. The first involves XRP being rejected around the $1.50-$1.60 range, followed by a retracement during the fourth quarter. The second allows for a stronger extension toward $1.80-$2.00 before a deeper Q4 pullback.
The chart places XRP near $1.5625, while the 50-week EMA is shown around $1.5238. That leaves XRP only about 2.5% above the moving average, keeping the asset close to the technical level that separates the two scenarios.
XRP Needs to Clear $1.60 for the Higher Scenario
The first scenario would remain active if XRP fails to establish a sustained weekly move above the $1.50-$1.60 resistance zone. A rejection from this area would leave the broader corrective structure intact and could send price back toward lower support during Q4.
The chart does not assign a precise downside target to that retracement, so any lower level beyond the marked resistance area remains unconfirmed.
The second scenario requires XRP to move beyond the current resistance band and advance toward $1.80-$2.00. From the chart’s $1.5625 reference price, a move to $1.80 would represent an increase of approximately 15.2%, while $2.00 would require a gain of about 28%.
The $2 region is significant because it corresponds with a horizontal area that previously acted as support during 2025. Under this scenario, XRP would retest that former support zone from below before any larger pullback develops.
XRP Is at a Weekly Decision Point
The chart shows that XRP’s current position is directly around the declining 50-week EMA, which has moved lower since the 2025 peak. Price is also approaching the lower red resistance band near $1.60.
From a technical standpoint, the next confirmation would come from XRP’s behavior around this zone. A weekly close above $1.60 would weaken the immediate rejection scenario and increase the relevance of the $1.80-$2.00 range.
Conversely, failure to hold above the 50-week EMA would keep the lower Q4 retracement scenario open.
For now, neither path is confirmed. XRP remains inside the key $1.50-$1.60 decision area, making the weekly close and subsequent follow-through the main data points to watch.
#Crypto
290
Article
"Cardano Forms 2020-Like Base Setup as Analyst Eyes 1,049% ADA Rally"Javon Marks, a popular market commentator, suggests #Cardano could be entering a new accumulation phase similar to the 2020 setup that preceded ADA’s historic rally.
Notably, Marks shared a long-term technical analysis suggesting that Cardano has formed a base resembling the structure it developed before its major 2021 rally. Based on the historical comparison, he believes ADA could be in the early stages of another significant move.
Cardano Forms Base Similar to 2020 Structure
According to Marks, Cardano’s current price structure shares similarities with its 2020 market setup. At the time, ADA spent an extended period consolidating before breaking higher and entering a powerful uptrend.
The accompanying weekly TradingView chart highlights the similarities between the two structures. In particular, the chart shows ADA moving through a prolonged consolidation phase before recovering from a recent low.
Meanwhile, Marks projected that the similarities could trigger a potential move toward the $2.90 level. With ADA trading around $0.246, reaching that target would require a gain of roughly 1,050%. Marks described the potential move as another monstrous run.
ADA Rebounds From September Lows
Meanwhile, ADA has also recorded notable gains since mid-September. It traded around $0.19012 on September 16 before gradually recovering amid the broader market rally.
The rebound eventually pushed ADA to $0.262 this week. However, ADA later retraced and now traded at $0.246 at press time.
If ADA eventually reaches Marks’ $2.90 target, its market capitalization would rise to $106.62 billion, given its circulating supply of 36.76 billion ADA. Moreover, the projected price would place ADA relatively close to its previous peak price of $3.10.
ADA Previous Bull Rally
Cardano’s historical performance provides the basis for Marks’ comparison. ADA traded around $0.020 in early 2020 before entering a prolonged rally that eventually pushed the token to $3.10 on September 2, 2021.
Similarly, the current chart shows ADA spending an extended period within a broader consolidation structure before attempting to break higher.
Meanwhile, SongMarketCap founder Jure Karamarko has previously expressed confidence that ADA will revisit the $3 level. He argued that the key question is when, rather than whether, Cardano will return to that price.
Cardano founder Charles Hoskinson has also pointed to ADA’s historical rise from roughly $0.02 to $3.10 when discussing the cryptocurrency’s potential for another major rally.
While Marks believes ADA’s current setup could mirror its 2020–2021 rally and propel the token toward $2.90, historical patterns do not guarantee a repeat performance. Instead, the comparison highlights a potential accumulation phase similar to Cardano’s previous cycle.
#CryptoNews
"Cardano Forms 2020-Like Base Setup as Analyst Eyes 1,049% ADA Rally"
Javon Marks, a popular market commentator, suggests #Cardano could be entering a new accumulation phase similar to the 2020 setup that preceded ADA’s historic rally.
Notably, Marks shared a long-term technical analysis suggesting that Cardano has formed a base resembling the structure it developed before its major 2021 rally. Based on the historical comparison, he believes ADA could be in the early stages of another significant move.
Cardano Forms Base Similar to 2020 Structure
According to Marks, Cardano’s current price structure shares similarities with its 2020 market setup. At the time, ADA spent an extended period consolidating before breaking higher and entering a powerful uptrend.
The accompanying weekly TradingView chart highlights the similarities between the two structures. In particular, the chart shows ADA moving through a prolonged consolidation phase before recovering from a recent low.
Meanwhile, Marks projected that the similarities could trigger a potential move toward the $2.90 level. With ADA trading around $0.246, reaching that target would require a gain of roughly 1,050%. Marks described the potential move as another monstrous run.
ADA Rebounds From September Lows
Meanwhile, ADA has also recorded notable gains since mid-September. It traded around $0.19012 on September 16 before gradually recovering amid the broader market rally.
The rebound eventually pushed ADA to $0.262 this week. However, ADA later retraced and now traded at $0.246 at press time.
If ADA eventually reaches Marks’ $2.90 target, its market capitalization would rise to $106.62 billion, given its circulating supply of 36.76 billion ADA. Moreover, the projected price would place ADA relatively close to its previous peak price of $3.10.
ADA Previous Bull Rally
Cardano’s historical performance provides the basis for Marks’ comparison. ADA traded around $0.020 in early 2020 before entering a prolonged rally that eventually pushed the token to $3.10 on September 2, 2021.
Similarly, the current chart shows ADA spending an extended period within a broader consolidation structure before attempting to break higher.
Meanwhile, SongMarketCap founder Jure Karamarko has previously expressed confidence that ADA will revisit the $3 level. He argued that the key question is when, rather than whether, Cardano will return to that price.
Cardano founder Charles Hoskinson has also pointed to ADA’s historical rise from roughly $0.02 to $3.10 when discussing the cryptocurrency’s potential for another major rally.
While Marks believes ADA’s current setup could mirror its 2020–2021 rally and propel the token toward $2.90, historical patterns do not guarantee a repeat performance. Instead, the comparison highlights a potential accumulation phase similar to Cardano’s previous cycle.
#CryptoNews
Notably, Marks shared a long-term technical analysis suggesting that Cardano has formed a base resembling the structure it developed before its major 2021 rally. Based on the historical comparison, he believes ADA could be in the early stages of another significant move.
Cardano Forms Base Similar to 2020 Structure
According to Marks, Cardano’s current price structure shares similarities with its 2020 market setup. At the time, ADA spent an extended period consolidating before breaking higher and entering a powerful uptrend.
The accompanying weekly TradingView chart highlights the similarities between the two structures. In particular, the chart shows ADA moving through a prolonged consolidation phase before recovering from a recent low.
Meanwhile, Marks projected that the similarities could trigger a potential move toward the $2.90 level. With ADA trading around $0.246, reaching that target would require a gain of roughly 1,050%. Marks described the potential move as another monstrous run.
ADA Rebounds From September Lows
Meanwhile, ADA has also recorded notable gains since mid-September. It traded around $0.19012 on September 16 before gradually recovering amid the broader market rally.
The rebound eventually pushed ADA to $0.262 this week. However, ADA later retraced and now traded at $0.246 at press time.
If ADA eventually reaches Marks’ $2.90 target, its market capitalization would rise to $106.62 billion, given its circulating supply of 36.76 billion ADA. Moreover, the projected price would place ADA relatively close to its previous peak price of $3.10.
ADA Previous Bull Rally
Cardano’s historical performance provides the basis for Marks’ comparison. ADA traded around $0.020 in early 2020 before entering a prolonged rally that eventually pushed the token to $3.10 on September 2, 2021.
Similarly, the current chart shows ADA spending an extended period within a broader consolidation structure before attempting to break higher.
Meanwhile, SongMarketCap founder Jure Karamarko has previously expressed confidence that ADA will revisit the $3 level. He argued that the key question is when, rather than whether, Cardano will return to that price.
Cardano founder Charles Hoskinson has also pointed to ADA’s historical rise from roughly $0.02 to $3.10 when discussing the cryptocurrency’s potential for another major rally.
While Marks believes ADA’s current setup could mirror its 2020–2021 rally and propel the token toward $2.90, historical patterns do not guarantee a repeat performance. Instead, the comparison highlights a potential accumulation phase similar to Cardano’s previous cycle.
#CryptoNews
404
Connectez-vous pour découvrir plus de contenu
Rejoignez la communauté mondiale des adeptes de cryptomonnaies sur Binance Square
⚡️ Suviez les dernières informations importantes sur les cryptomonnaies.
💬 Jugé digne de confiance par la plus grande plateforme d’échange de cryptomonnaies au monde.
👍 Découvrez les connaissances que partagent les créateurs vérifiés.
Adresse e-mail/Nº de téléphone
Sujets d’actualité
BitcoinClears$85200
7,168 vues
179 mentions
We got the move, and $BTC is standing exactly where we were before the data. That’s what actual patience for a trade looks like.
The data came in mixed but with some important numbers. ADP Non-Farm Employment Change came at 90K vs 73K forecast, while Core PCE came in at 0.2% vs 0.3% expected. Final GDP was also stronger at 2.2% vs 1.5% forecast, while Personal Spending came in at 0.9% vs 0.8% expected. At the same time, Personal Income missed at 0.2% vs 0.5% forecast.
BTC initially surged to $85,600 and is now back where it needs to be. I’m still looking toward the lower ranges at $82,759 and the $80,000 liquidity, because the overhead liquidity is done and dusted.
We had a live session during the data, and during that session we saw the market at $83,800, then $85,600, and then back toward $83,000 and we still didn’t enter a trade.
That’s what patience is.
We can’t force an entry when the market has no clear direction. The same range is still in focus, and we’ll wait for the market to give us the setup.
Let me know, guys, how was the session? And should we have more regular sessions with our respected members so we can have proper discussions regarding the market?
#BitcoinClears$85200 #AltcoinSeasonIndexHoldsAbove60For5Days #USADPAdds90000JobsInSeptember #BitcoinSlipsBelow$84000 #SECToClarifyOnChainFundraisingRules
Crypto_LUX
·24 mentions J’aime
·13.7k vues
AltcoinSeasonIndexHoldsAbove60For5Days
38,837 vues
984 mentions
USADPAdds90000JobsInSeptember
17,534 vues
559 mentions