

SarwatAK
61 Publications

SarwatAK
Signaler
Bloquer l’utilisateur
✨ Beauty with Brains | Expert Trader
Follow to Trade Smarter, daily crypto analysis, Early Insider News to Boost your Knowledge and Bank Balance.
Ouvert au trading
Trade régulièrement
5.4 an(s)
22 Suivis
142 Abonnés
25 J’aime
Publications
Portefeuille
PINNED
·
--

Article
Bitcoin Flashes a Rare Signal vs Nasdaq: BTC Might Reach $100K as Earnings and the Fed Hit ?#CanMicrosoftDeliverOnAI $BTC
BITCOIN VS NASDAQ: A BULLISH SIGNAL MEETS THE BIGGEST WEEK OF EARNINGS SEASON
Yes, that's me on the cover - because behind the charts and the market breakdowns, there’s a real trader watching every candle. Now that we’ve cleared that up, let's talk about what matters: Bitcoin has slipped under $80,000 heading into Fed week and Big Tech earnings. Yet one chart watched by long-term analysts is flashing a signal that has historically preceded big moves: the Bitcoin-to-Nasdaq ratio. Is this a trap or the early stage of a recovery? Here is the full picture.
1️⃣ THE SIGNAL: BTC/NASDAQ RECLAIMS ITS 200-DAY AVERAGE
According to Bitcoin Magazine analyst Sean Hagan (as reported by Benzinga):
🔹 The Bitcoin-to-Nasdaq Composite ratio reclaimed its 200-day moving average on Sept. 18, after 235 consecutive trading sessions below it. It has held above that level despite the recent equity sell-off.
🔹 In five of six comparable signals since 2015, Bitcoin gained over the following year, with a median return of about 84%.
🔹 The ratio fell 62% through June 30. Earlier cycle drawdowns were 87% (2015), 83% (2019) and 69% (2022), so this one was shallower.
🔹 Bitcoin's 90-day beta to the Nasdaq is now 0.75, versus 1.43 before the failed 2021 signal. Lower beta suggests BTC is starting to move more independently of tech.
🔹 Since the Nasdaq's Oct. 6 record high, the index is down 5.8% while Bitcoin is down about 5%.
🔹 The analyst sees a possible move to $100,000 by year-end.
⚠️ THE INVALIDATION LEVEL: A close below the ratio's 200-day average, equal to roughly $76,000-$77,000 for Bitcoin, would cancel the bullish setup.
2️⃣ REALITY CHECK: WHERE BTC TRADES RIGHT NOW
The signal is encouraging, but price action is still shaky:
• BTC dipped under $80,000 on Monday, touching about $79,300, its lowest level since mid-September. It is down more than 3% on the week.
• U.S. spot Bitcoin ETFs saw about $773M in net outflows last week.
• Analysts want BTC to reclaim about $82,500 (the level lost last Thursday) before calling this dip a pause.
• Ether and XRP fell about 3% in the same session, a sign of broad de-risking.
📐 THE MATH: From about $80,000, $100,000 by year-end needs roughly a 25% gain in about nine weeks. The distance to the $76,000-$77,000 invalidation zone is only about 4-5%. Risk and reward are both large, so position sizing matters.
3️⃣ THIS WEEK'S CATALYSTS
Wed, Oct 28: Fed decision, then Microsoft and Alphabet earnings after the close
Thu, Oct 29: Amazon earnings, plus Coinbase after the close (Confirm times on each company's investor relations page.)
THE FED
• CME FedWatch showed about a 90.6% chance of a hold at 3.75%-4% and about a 9.4% chance of a hike.
• The real question is the tone of Chair Warsh's press conference. Traders are watching for hints of a December hike.
• Brent crude is near $114, a six-month high, which keeps inflation worries alive.
BIG TECH
• Meta fell about 7% last Thursday after its free cash flow turned negative on heavy AI spending. That triggered a Nasdaq sell-off.
• Microsoft is guided to about 45% Azure growth. Amazon's AWS grew 37% last quarter. Alphabet's cloud and AI search commentary is in focus.
• The market now wants proof that AI spending produces returns, not just bigger budgets.
4️⃣ HOW EARNINGS COULD MOVE BITCOIN
🟢 SCENARIO A: Strong cloud numbers, calm Fed Tech rebounds, risk appetite improves, and BTC could reclaim $82,500. This would support the bullish ratio signal.
🟡 SCENARIO B: Mixed results, hawkish Fed tone Volatility rises and BTC chops around $76,000-$82,000 while traders wait for clarity.
🔴 SCENARIO C: Capex fears return, rate-hike worries build A broader risk-off move could push BTC toward the $76,000-$77,000 zone. A daily close below it would weaken the bullish case.
The key point is that Bitcoin's falling beta to tech is a hopeful sign, but it has not proven independence yet. Both stocks and BTC are reacting to the same macro forces: rates, oil and AI sentiment.
5️⃣ TRADER'S CHECKLIST
✅ Watch the $82,500 reclaim and the $76,000-$77,000 invalidation zone.
✅ Expect volatility around the Fed press conference and after-hours earnings.
✅ Historical signals show a tendency, not a guarantee. Sample sizes are small, and a failed breakout remains possible.
✅ Track spot ETF flows for confirmation.
✅ Use defined risk. Gaps can skip stop-loss levels.
✅ If you trade tokenized stocks around earnings, check each product's rights, trading hours and liquidity first.
🎯 MY TAKE
The relative-strength signal is a genuine positive and the history is encouraging. But with BTC below $80K, ETF outflows, a possible hawkish Fed and shaky tech sentiment, $100K by year-end is an upside scenario, not a base case. This week gives us the first real evidence either way.
💬 YOUR TURN: Will Bitcoin hold above the $76K-$77K zone this week? Bullish or bearish, and what's your year-end target?
Drop your view below 👇 and test your earnings calls in the Finance Earnings section of Binance Pick.
Not financial advice. Always DYOR.
Like & Follow for Daily Trade Analytics & Insider News. @SarwatAK
#BTC #CanGoogleDefindItsCore #EarningsSeason
{spot}(ZECUSDT)
{spot}(BTCUSDT)
Bitcoin Flashes a Rare Signal vs Nasdaq: BTC Might Reach $100K as Earnings and the Fed Hit ?
#CanMicrosoftDeliverOnAI $BTC
BITCOIN VS NASDAQ: A BULLISH SIGNAL MEETS THE BIGGEST WEEK OF EARNINGS SEASON
Yes, that's me on the cover - because behind the charts and the market breakdowns, there’s a real trader watching every candle. Now that we’ve cleared that up, let's talk about what matters: Bitcoin has slipped under $80,000 heading into Fed week and Big Tech earnings. Yet one chart watched by long-term analysts is flashing a signal that has historically preceded big moves: the Bitcoin-to-Nasdaq ratio. Is this a trap or the early stage of a recovery? Here is the full picture.
1️⃣ THE SIGNAL: BTC/NASDAQ RECLAIMS ITS 200-DAY AVERAGE
According to Bitcoin Magazine analyst Sean Hagan (as reported by Benzinga):
🔹 The Bitcoin-to-Nasdaq Composite ratio reclaimed its 200-day moving average on Sept. 18, after 235 consecutive trading sessions below it. It has held above that level despite the recent equity sell-off.
🔹 In five of six comparable signals since 2015, Bitcoin gained over the following year, with a median return of about 84%.
🔹 The ratio fell 62% through June 30. Earlier cycle drawdowns were 87% (2015), 83% (2019) and 69% (2022), so this one was shallower.
🔹 Bitcoin's 90-day beta to the Nasdaq is now 0.75, versus 1.43 before the failed 2021 signal. Lower beta suggests BTC is starting to move more independently of tech.
🔹 Since the Nasdaq's Oct. 6 record high, the index is down 5.8% while Bitcoin is down about 5%.
🔹 The analyst sees a possible move to $100,000 by year-end.
⚠️ THE INVALIDATION LEVEL: A close below the ratio's 200-day average, equal to roughly $76,000-$77,000 for Bitcoin, would cancel the bullish setup.
2️⃣ REALITY CHECK: WHERE BTC TRADES RIGHT NOW
The signal is encouraging, but price action is still shaky:
• BTC dipped under $80,000 on Monday, touching about $79,300, its lowest level since mid-September. It is down more than 3% on the week.
• U.S. spot Bitcoin ETFs saw about $773M in net outflows last week.
• Analysts want BTC to reclaim about $82,500 (the level lost last Thursday) before calling this dip a pause.
• Ether and XRP fell about 3% in the same session, a sign of broad de-risking.
📐 THE MATH: From about $80,000, $100,000 by year-end needs roughly a 25% gain in about nine weeks. The distance to the $76,000-$77,000 invalidation zone is only about 4-5%. Risk and reward are both large, so position sizing matters.
3️⃣ THIS WEEK'S CATALYSTS
Wed, Oct 28: Fed decision, then Microsoft and Alphabet earnings after the close
Thu, Oct 29: Amazon earnings, plus Coinbase after the close (Confirm times on each company's investor relations page.)
THE FED
• CME FedWatch showed about a 90.6% chance of a hold at 3.75%-4% and about a 9.4% chance of a hike.
• The real question is the tone of Chair Warsh's press conference. Traders are watching for hints of a December hike.
• Brent crude is near $114, a six-month high, which keeps inflation worries alive.
BIG TECH
• Meta fell about 7% last Thursday after its free cash flow turned negative on heavy AI spending. That triggered a Nasdaq sell-off.
• Microsoft is guided to about 45% Azure growth. Amazon's AWS grew 37% last quarter. Alphabet's cloud and AI search commentary is in focus.
• The market now wants proof that AI spending produces returns, not just bigger budgets.
4️⃣ HOW EARNINGS COULD MOVE BITCOIN
🟢 SCENARIO A: Strong cloud numbers, calm Fed Tech rebounds, risk appetite improves, and BTC could reclaim $82,500. This would support the bullish ratio signal.
🟡 SCENARIO B: Mixed results, hawkish Fed tone Volatility rises and BTC chops around $76,000-$82,000 while traders wait for clarity.
🔴 SCENARIO C: Capex fears return, rate-hike worries build A broader risk-off move could push BTC toward the $76,000-$77,000 zone. A daily close below it would weaken the bullish case.
The key point is that Bitcoin's falling beta to tech is a hopeful sign, but it has not proven independence yet. Both stocks and BTC are reacting to the same macro forces: rates, oil and AI sentiment.
5️⃣ TRADER'S CHECKLIST
✅ Watch the $82,500 reclaim and the $76,000-$77,000 invalidation zone.
✅ Expect volatility around the Fed press conference and after-hours earnings.
✅ Historical signals show a tendency, not a guarantee. Sample sizes are small, and a failed breakout remains possible.
✅ Track spot ETF flows for confirmation.
✅ Use defined risk. Gaps can skip stop-loss levels.
✅ If you trade tokenized stocks around earnings, check each product's rights, trading hours and liquidity first.
🎯 MY TAKE
The relative-strength signal is a genuine positive and the history is encouraging. But with BTC below $80K, ETF outflows, a possible hawkish Fed and shaky tech sentiment, $100K by year-end is an upside scenario, not a base case. This week gives us the first real evidence either way.
💬 YOUR TURN: Will Bitcoin hold above the $76K-$77K zone this week? Bullish or bearish, and what's your year-end target?
Drop your view below 👇 and test your earnings calls in the Finance Earnings section of Binance Pick.
Not financial advice. Always DYOR.
Like & Follow for Daily Trade Analytics & Insider News. @SarwatAK
#BTC #CanGoogleDefindItsCore #EarningsSeason
1
50
·
--
Haussier
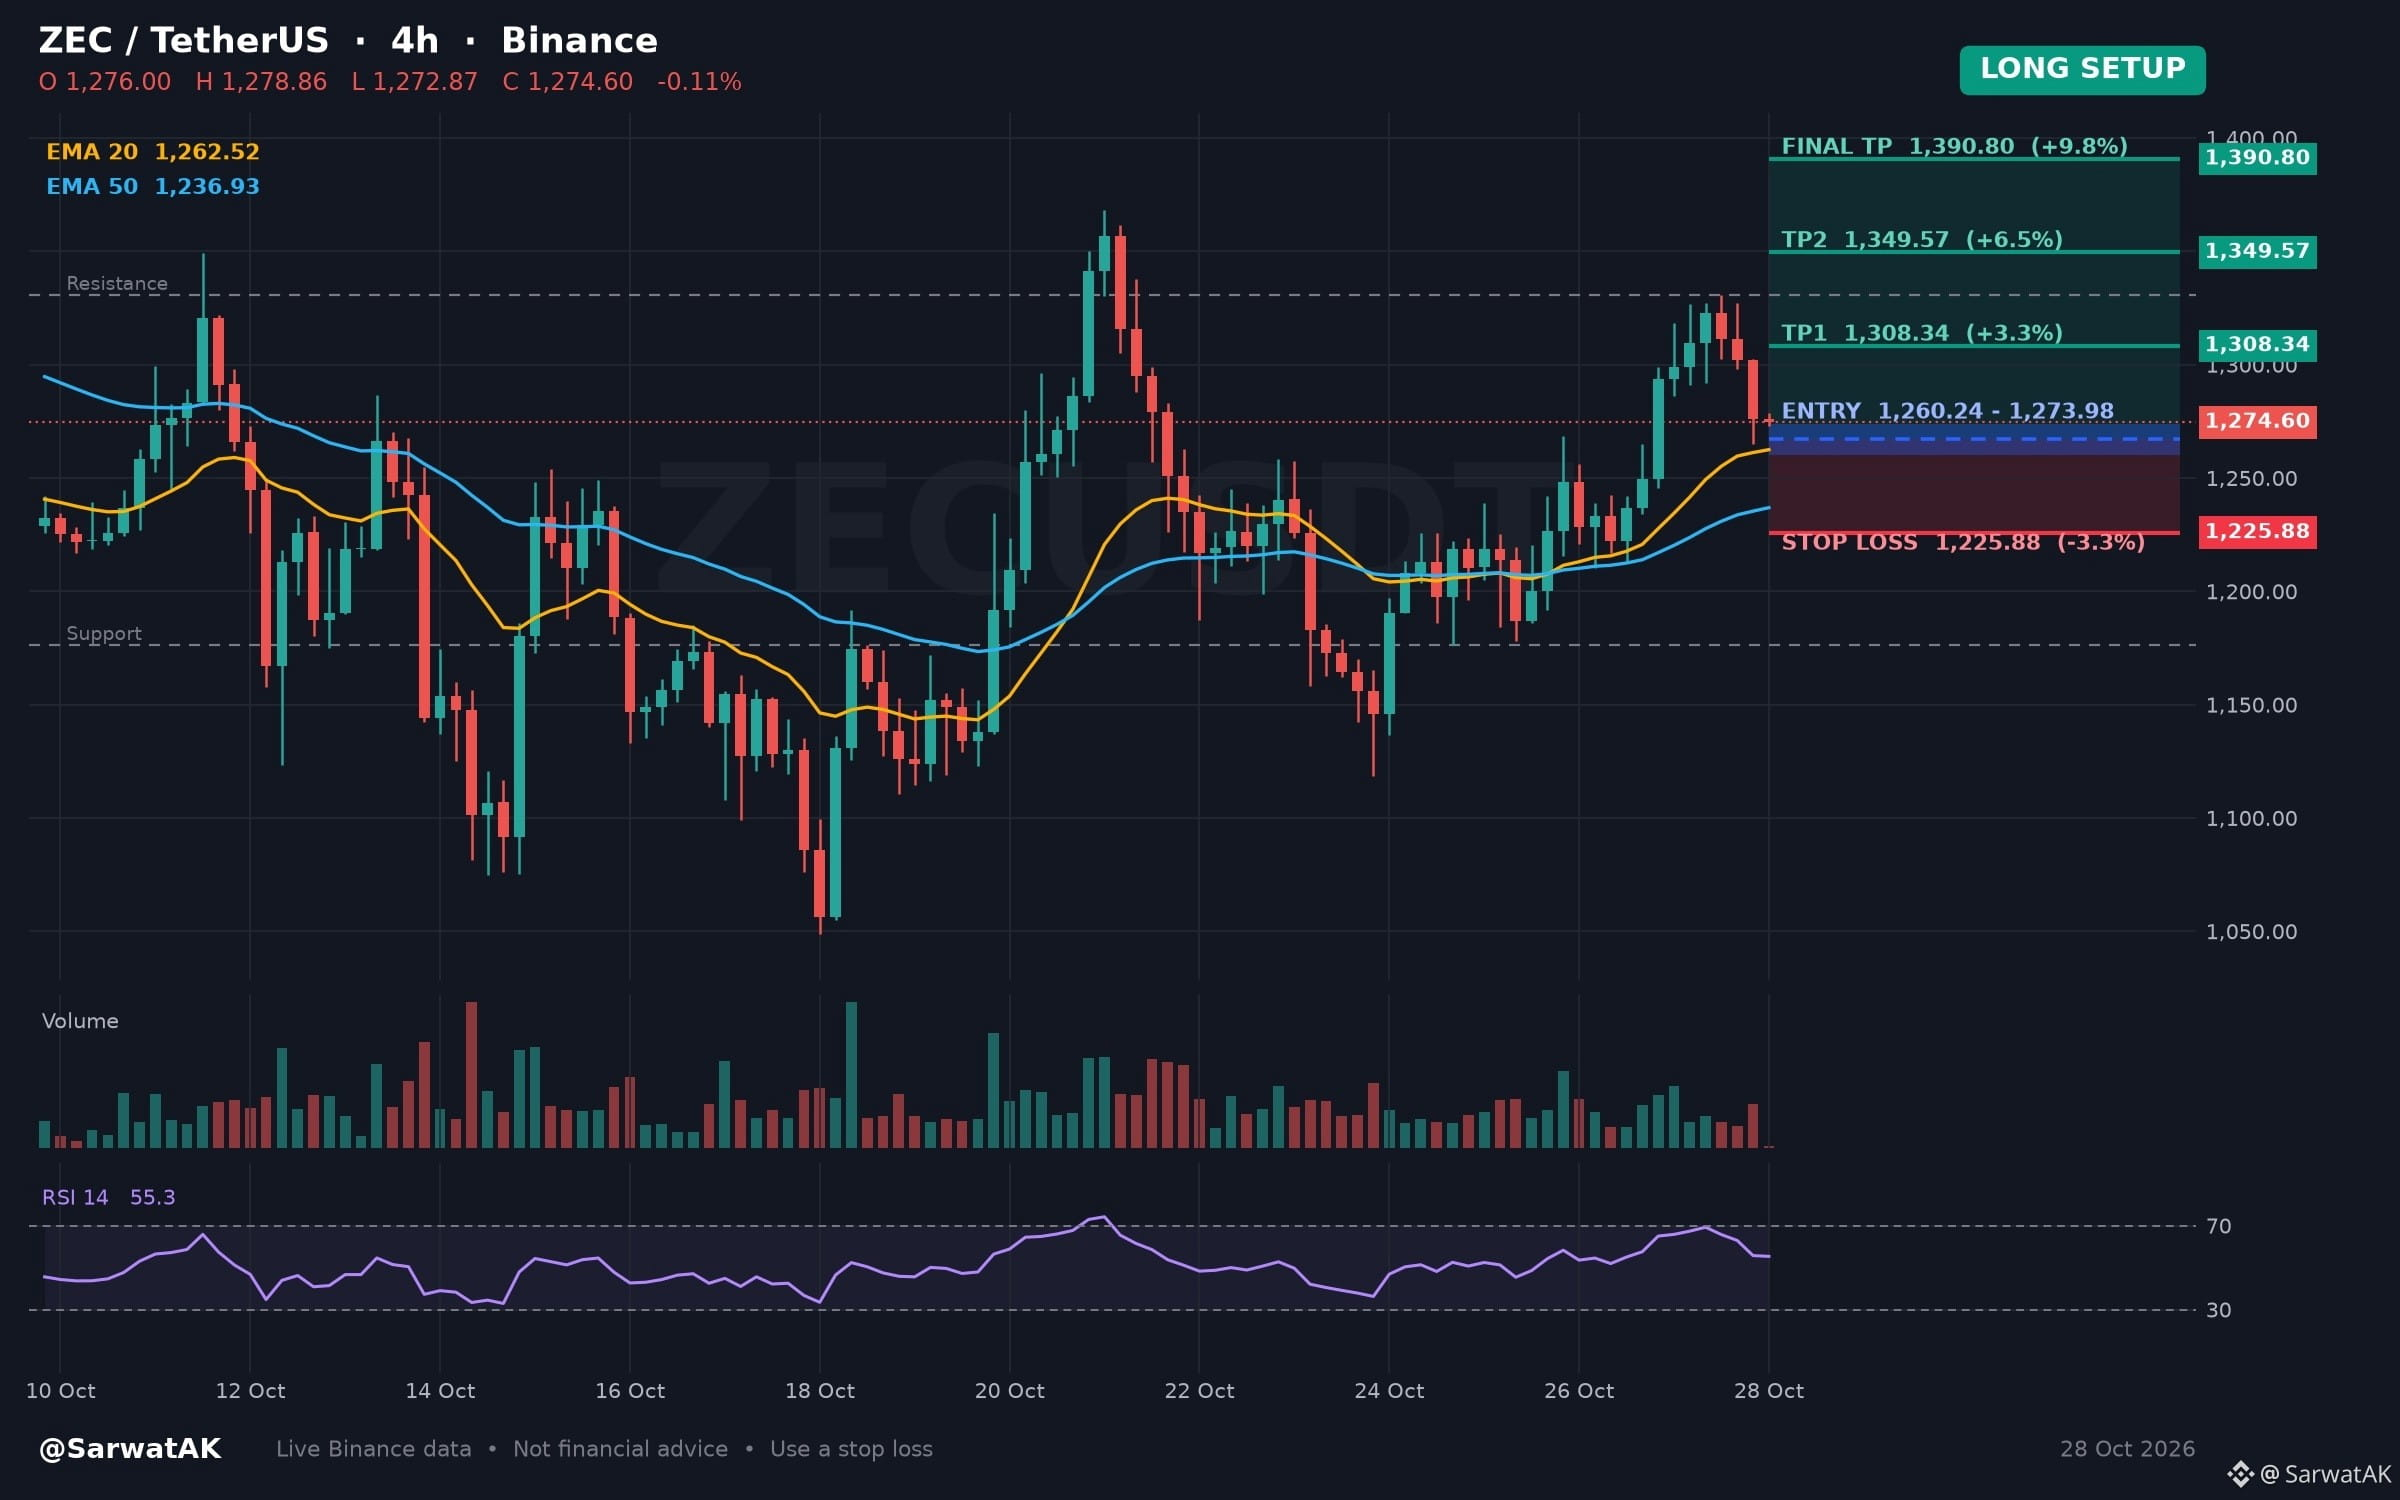
$ZEC LONG SETUP ... NEXT TARGET 1,390.80
Moving Average Alignment Holds Firm Despite Short Term Retracement
Entry: 1,260.24 - 1,273.98 (Long)
TP1: 1,308.34
TP2: 1,349.57
Final TP: 1,390.80
SL: 1,225.88
Despite downward movement over the past twenty-four hours, price stays above the shorter exponential moving average, which sits above the longer average. The relative strength index on the four-hour chart remains neutral, signaling a period of market balance.
As long as 1,260.24 holds, structure stays constructive
Must use stop loss while trading
Trade $ZEC
Not financial advice. Always DYOR.
Like & Follow for Daily Trade Analytics & Insider News. @SarwatAK
#ZEC #CanMicrosoftDeliverOnAI #EarningsSeason #CanGoogleDefindItsCore
{future}(ZECUSDT)
$ZEC LONG SETUP ... NEXT TARGET 1,390.80
Moving Average Alignment Holds Firm Despite Short Term Retracement
Entry: 1,260.24 - 1,273.98 (Long)
TP1: 1,308.34
TP2: 1,349.57
Final TP: 1,390.80
SL: 1,225.88
Despite downward movement over the past twenty-four hours, price stays above the shorter exponential moving average, which sits above the longer average. The relative strength index on the four-hour chart remains neutral, signaling a period of market balance.
As long as 1,260.24 holds, structure stays constructive
Must use stop loss while trading
Trade $ZEC
Not financial advice. Always DYOR.
Like & Follow for Daily Trade Analytics & Insider News. @SarwatAK
#ZEC #CanMicrosoftDeliverOnAI #EarningsSeason #CanGoogleDefindItsCore
1
216
·
--
Haussier
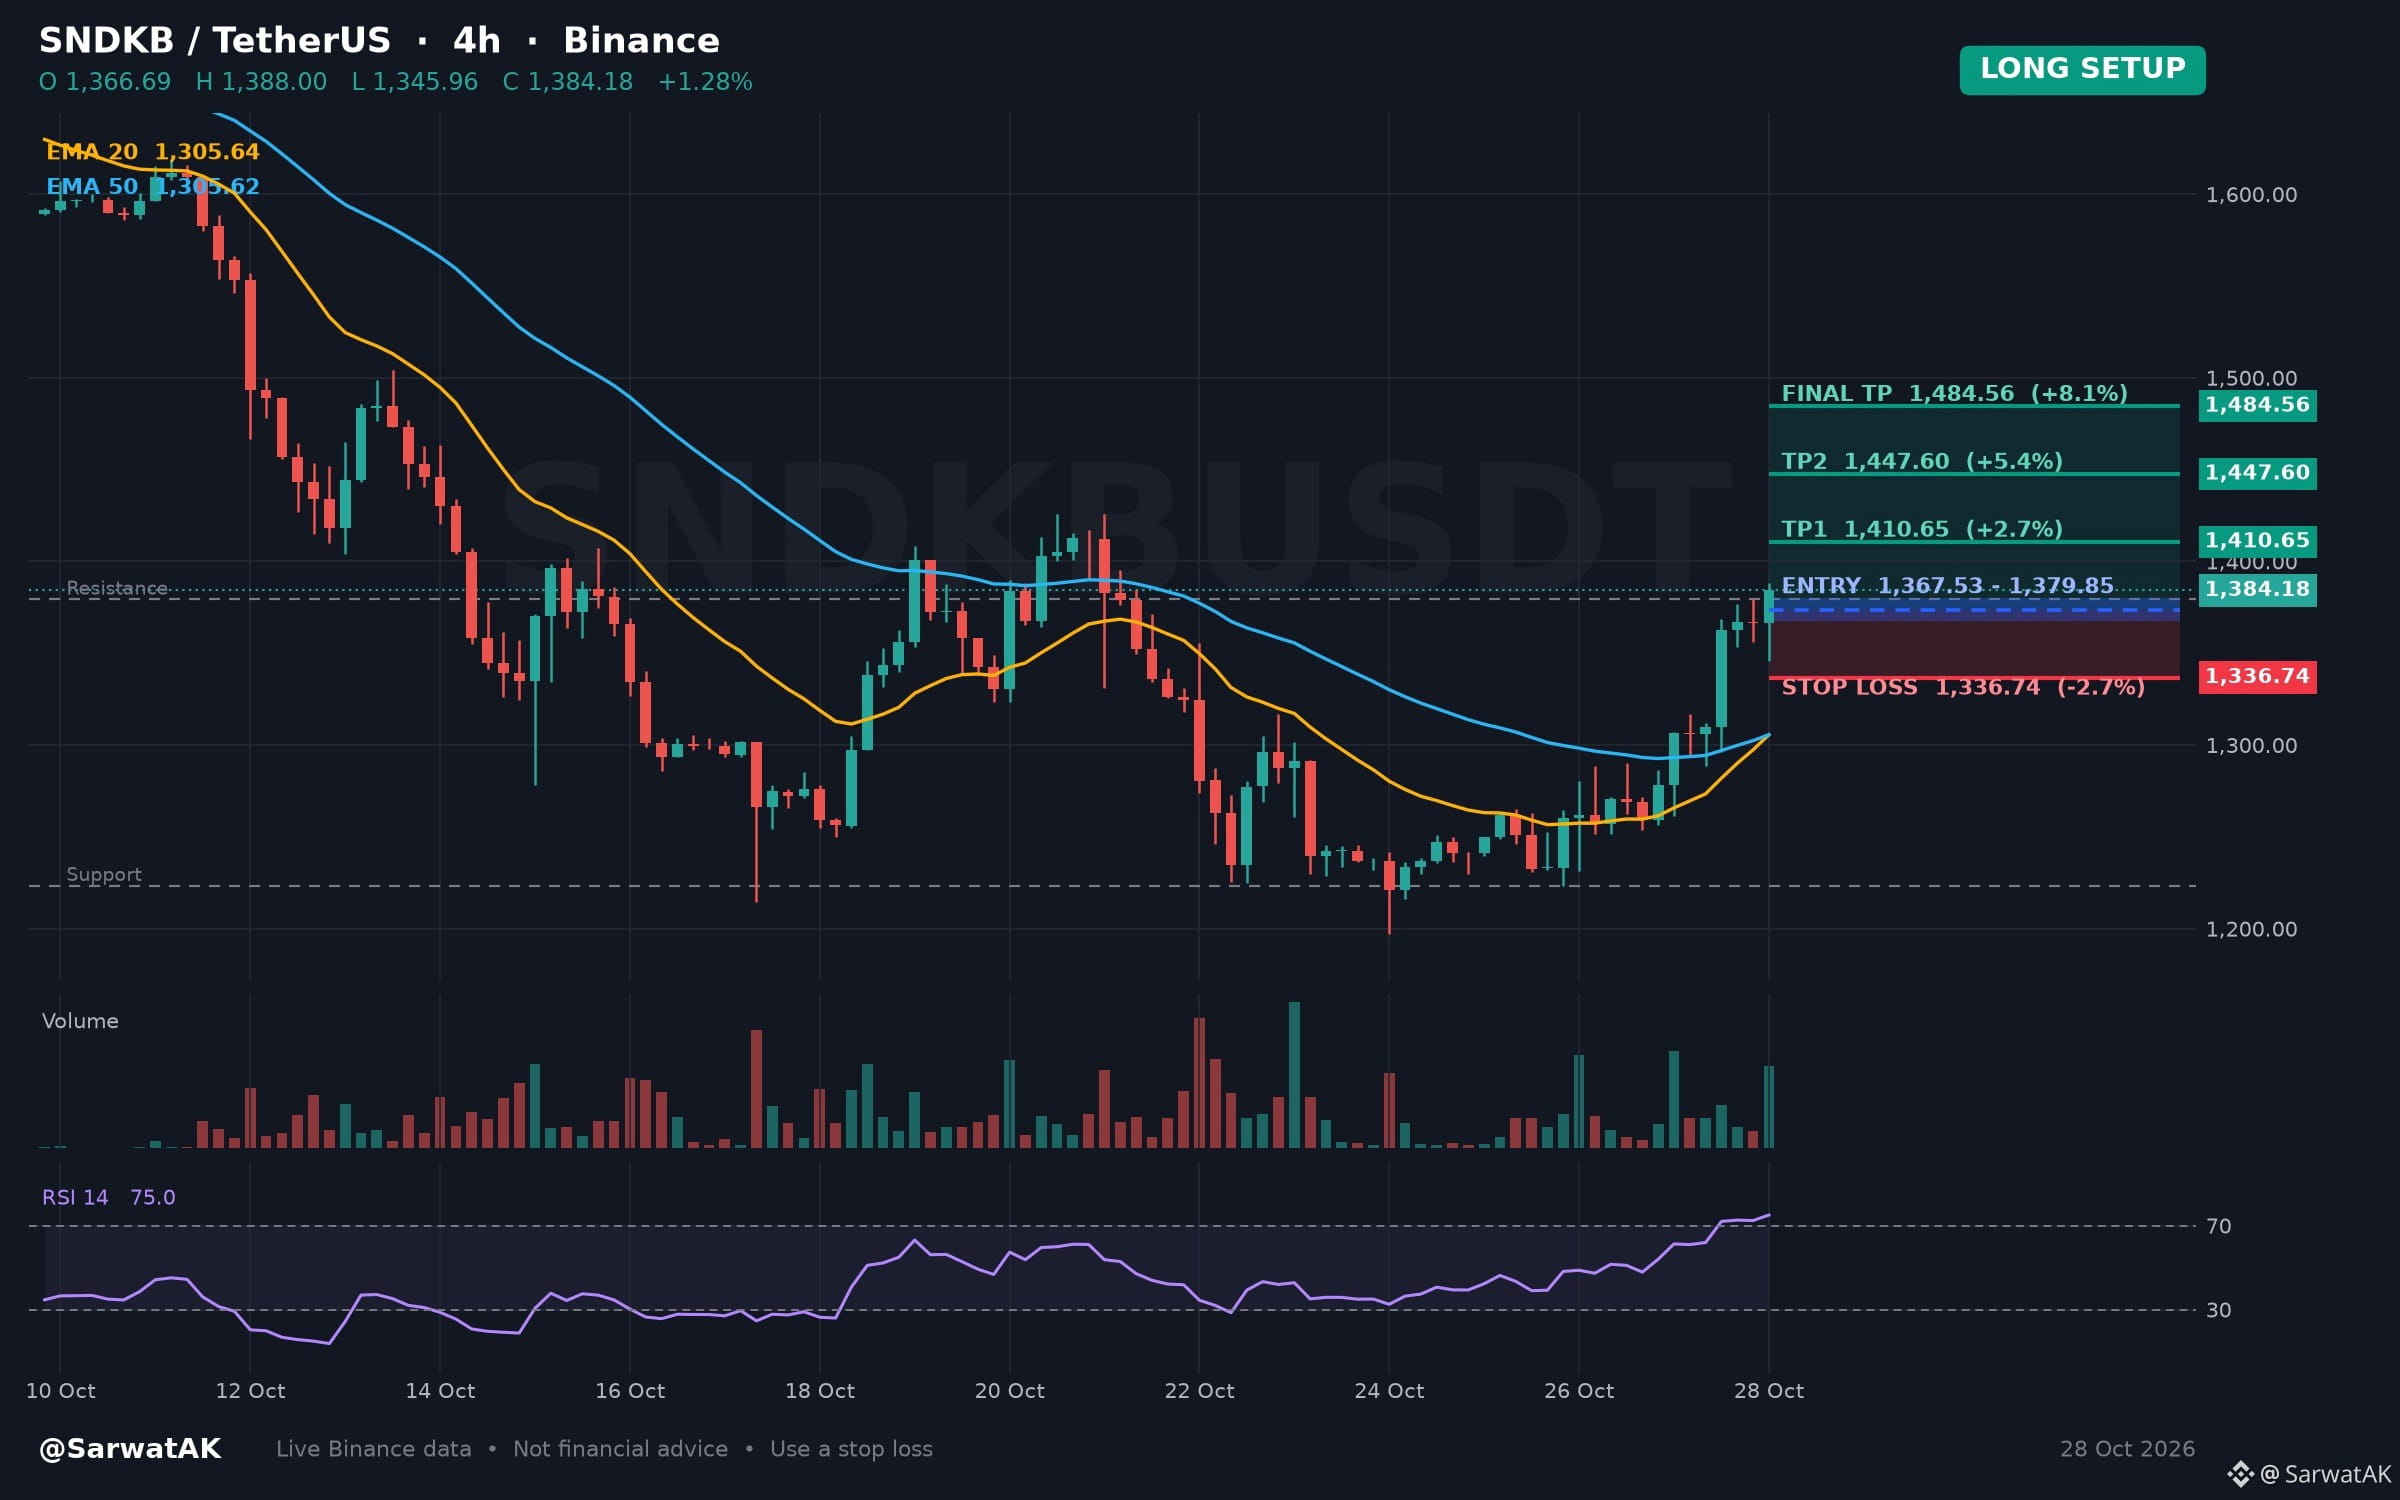
$SNDKB LONG SETUP ... NEXT TARGET 1,484.56
Overbought RSI Meets Upward Momentum on Four-Hour Chart
Entry: 1,367.53 - 1,379.85 (Long)
TP1: 1,410.65
TP2: 1,447.60
Final TP: 1,484.56
SL: 1,336.74
The overbought reading on the four-hour chart suggests buying pressure may be waning. Combined with an upward move over the past twenty-four hours, the price is testing a potential short-term ceiling.
As long as 1,367.53 holds, structure stays constructive
Must use stop loss while trading
Trade $SNDKB
Not financial advice. Always DYOR.
Like & Follow for Daily Trade Analytics & Insider News. @SarwatAK
#SNDKB #CanMicrosoftDeliverOnAI #EarningsSeason #CanGoogleDefindItsCore
{future}(SNDKUSDT)
$SNDKB LONG SETUP ... NEXT TARGET 1,484.56
Overbought RSI Meets Upward Momentum on Four-Hour Chart
Entry: 1,367.53 - 1,379.85 (Long)
TP1: 1,410.65
TP2: 1,447.60
Final TP: 1,484.56
SL: 1,336.74
The overbought reading on the four-hour chart suggests buying pressure may be waning. Combined with an upward move over the past twenty-four hours, the price is testing a potential short-term ceiling.
As long as 1,367.53 holds, structure stays constructive
Must use stop loss while trading
Trade $SNDKB
Not financial advice. Always DYOR.
Like & Follow for Daily Trade Analytics & Insider News. @SarwatAK
#SNDKB #CanMicrosoftDeliverOnAI #EarningsSeason #CanGoogleDefindItsCore
70
·
--
Baissier
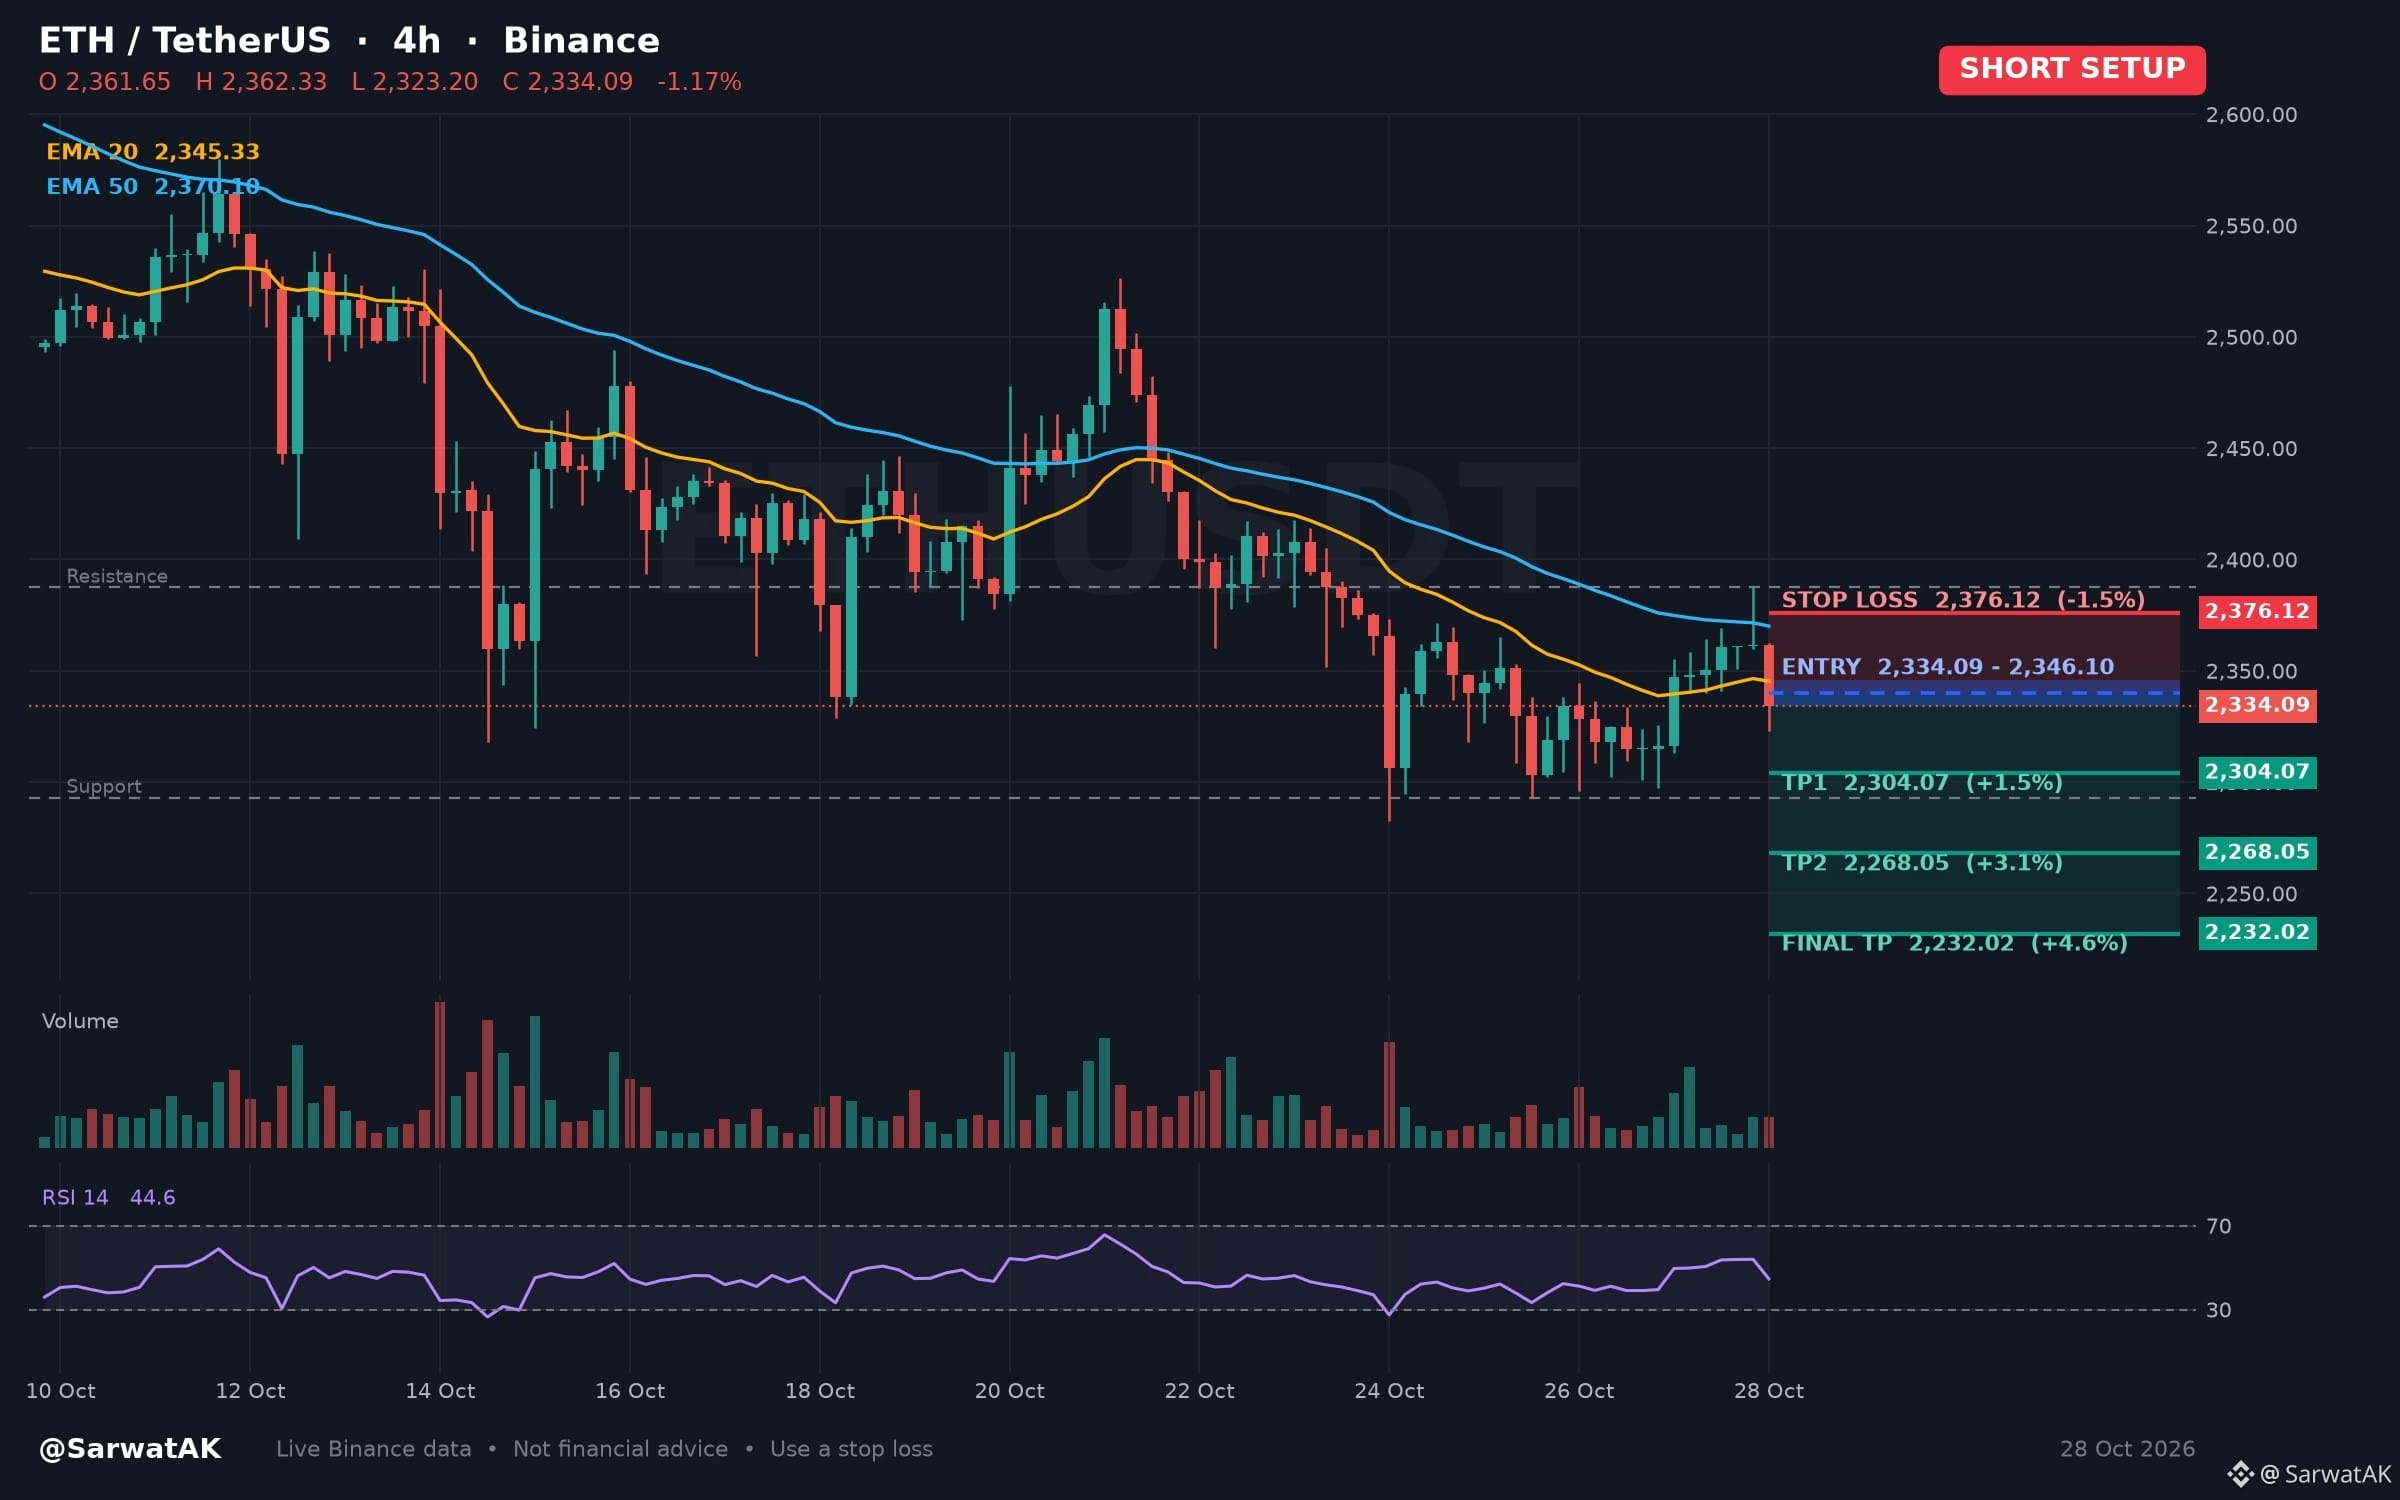
$ETH SHORT SETUP ... NEXT TARGET 2,232.02
Moving Average Bearish Alignment Accompanied by Neutral Relative Strength Index
Entry: 2,334.09 - 2,346.10 (Short)
TP1: 2,304.07
TP2: 2,268.05
Final TP: 2,232.02
SL: 2,376.12
Trading downward over the past twenty-four hours, price remains below aligned short and medium-term exponential moving averages. A neutral relative strength index on the four-hour chart indicates momentum is neither overbought nor oversold.
As long as price stays below 2,346.10, structure stays heavy
Must use stop loss while trading
Trade $ETH
Not financial advice. Always DYOR.
Like & Follow for Daily Trade Analytics & Insider News. @SarwatAK
#Ethereum #CanMicrosoftDeliverOnAI #EarningsSeason #CanGoogleDefindItsCore
{spot}(ETHUSDT)
$ETH SHORT SETUP ... NEXT TARGET 2,232.02
Moving Average Bearish Alignment Accompanied by Neutral Relative Strength Index
Entry: 2,334.09 - 2,346.10 (Short)
TP1: 2,304.07
TP2: 2,268.05
Final TP: 2,232.02
SL: 2,376.12
Trading downward over the past twenty-four hours, price remains below aligned short and medium-term exponential moving averages. A neutral relative strength index on the four-hour chart indicates momentum is neither overbought nor oversold.
As long as price stays below 2,346.10, structure stays heavy
Must use stop loss while trading
Trade $ETH
Not financial advice. Always DYOR.
Like & Follow for Daily Trade Analytics & Insider News. @SarwatAK
#Ethereum #CanMicrosoftDeliverOnAI #EarningsSeason #CanGoogleDefindItsCore
1
68
·
--
Haussier
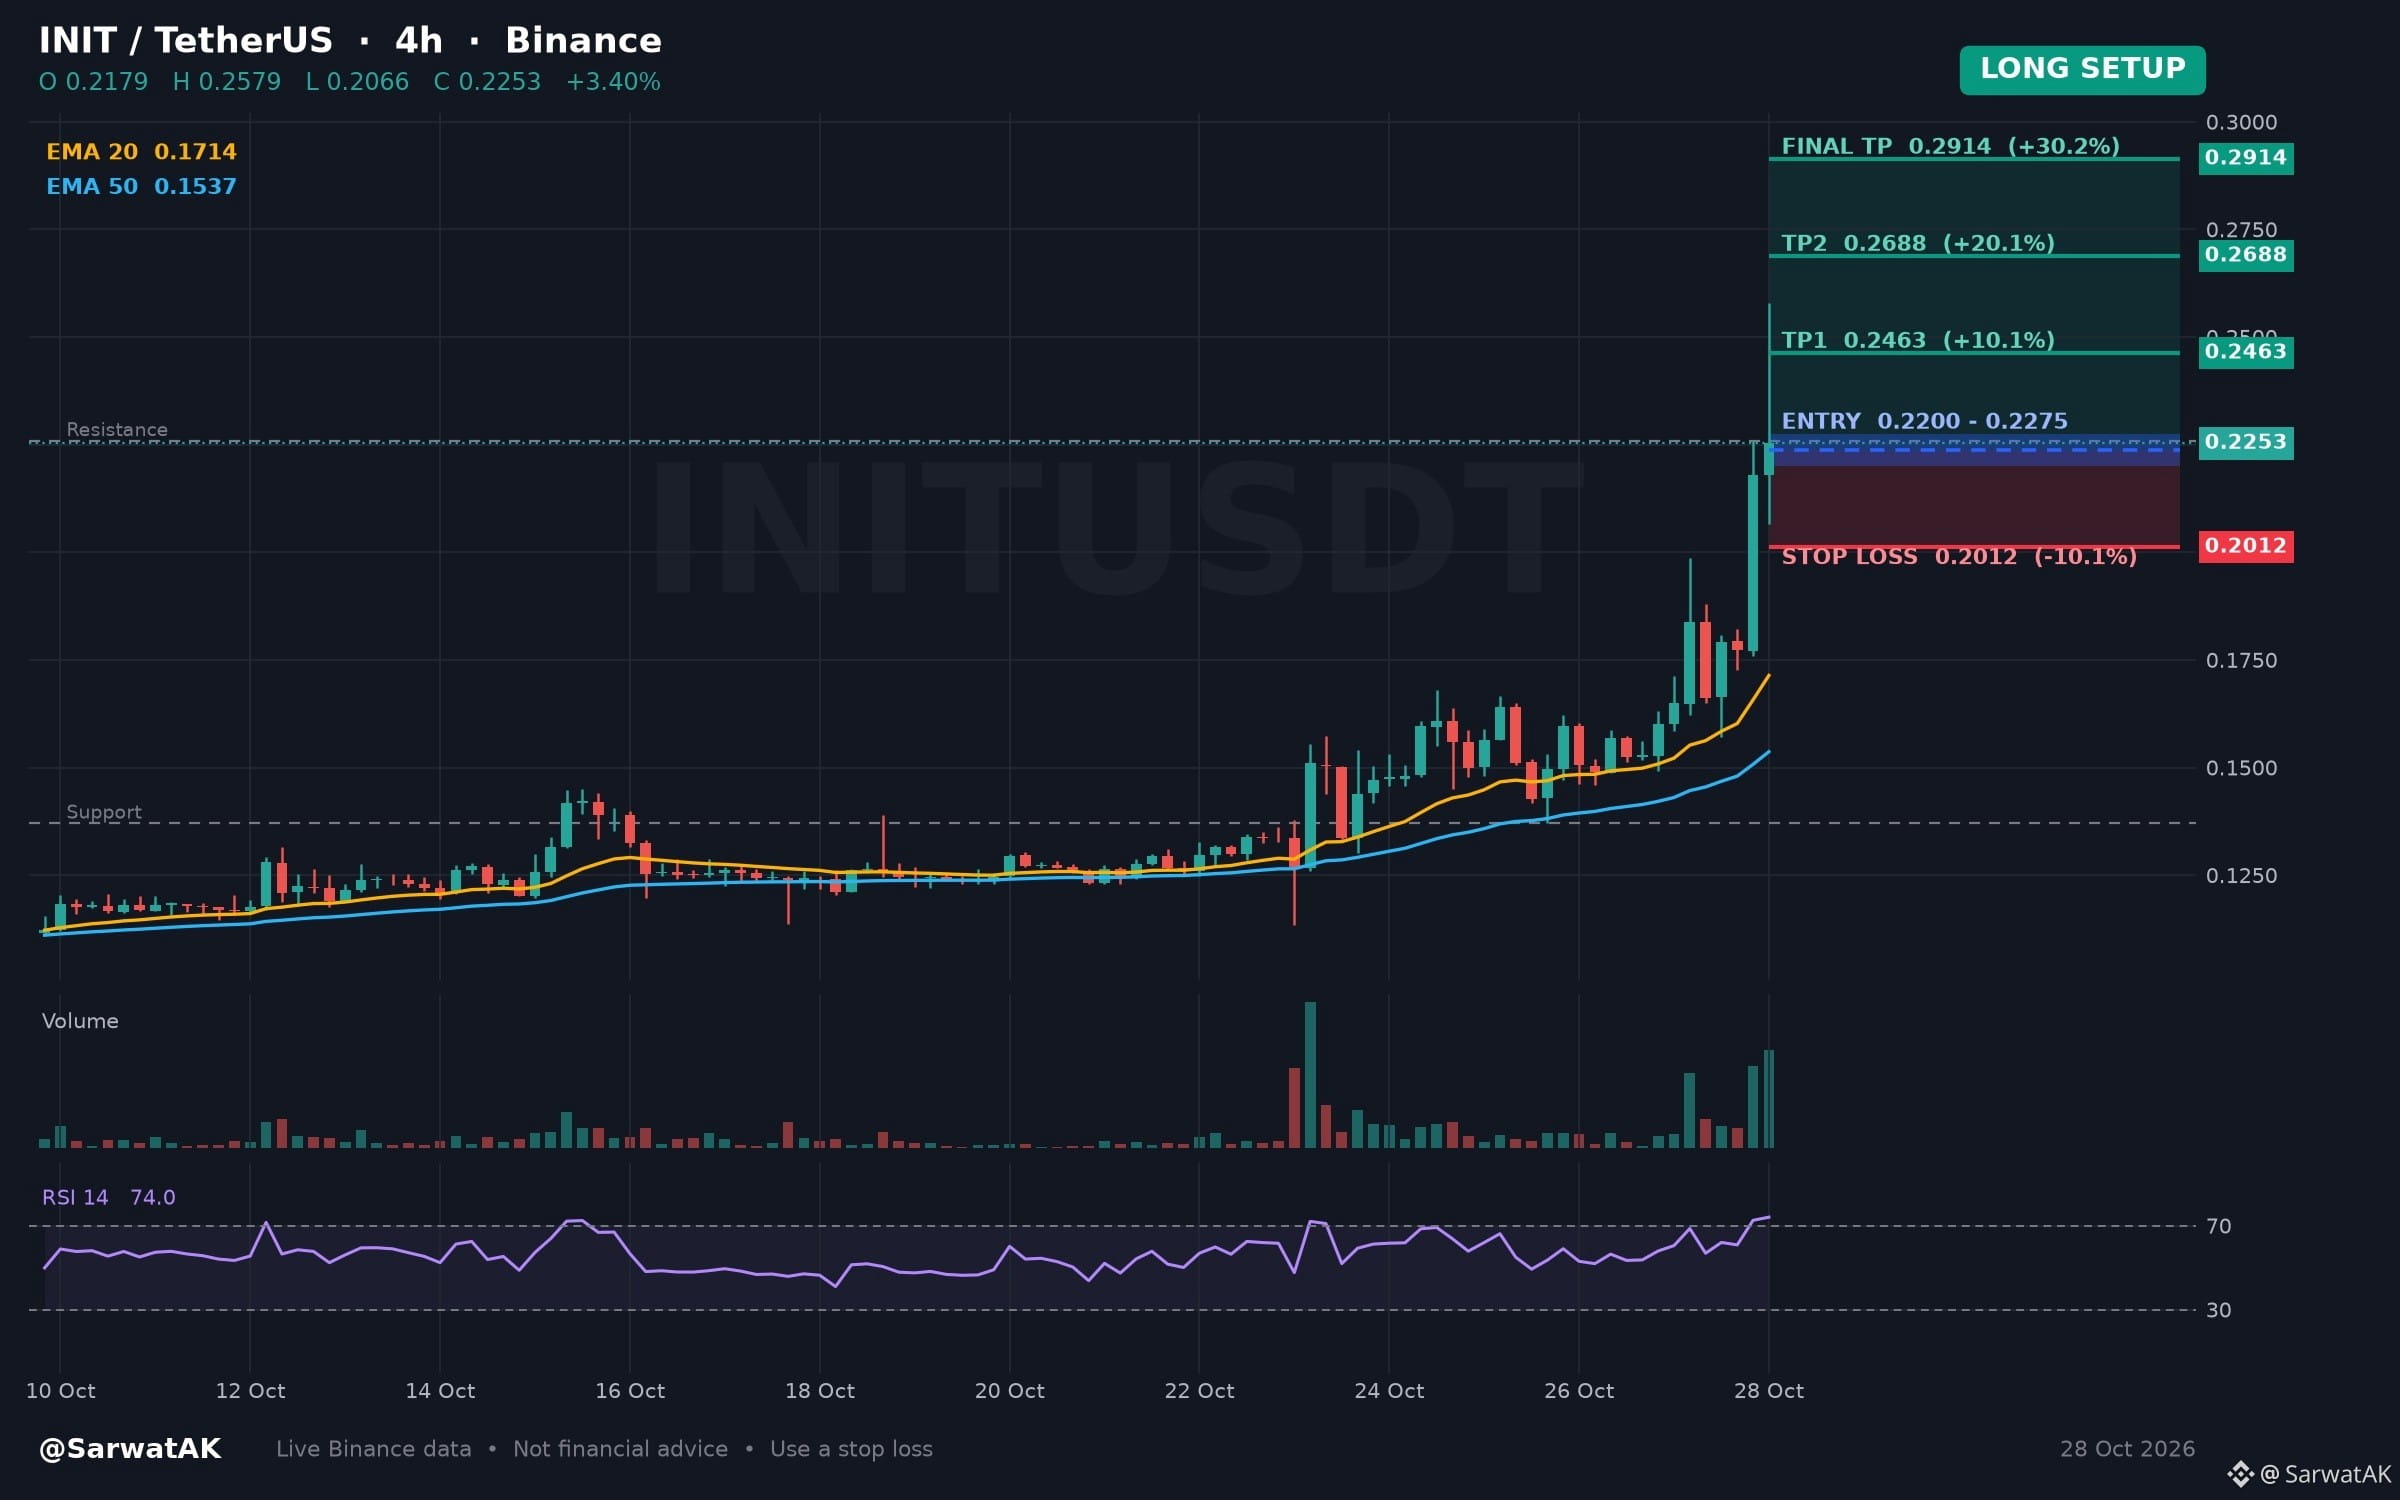
$INIT LONG SETUP ... NEXT TARGET 0.2914
Four-Hour Breakout Above Multi-Session High with Overbought Momentum
Entry: 0.2200 - 0.2275 (Long)
TP1: 0.2463
TP2: 0.2688
Final TP: 0.2914
SL: 0.2012
The asset moved upward over the past twenty-four hours, trading above the highest level of the last twenty four-hour candles. With the four-hour relative strength index in the overbought zone, traders are observing whether this move sustains.
As long as 0.2200 holds, structure stays constructive
Must use stop loss while trading
Trade $INIT
Not financial advice. Always DYOR.
Like & Follow for Daily Trade Analytics & Insider News. @SarwatAK
#INIT #HotTrends #TradingSignals
{spot}(INITUSDT)
$INIT LONG SETUP ... NEXT TARGET 0.2914
Four-Hour Breakout Above Multi-Session High with Overbought Momentum
Entry: 0.2200 - 0.2275 (Long)
TP1: 0.2463
TP2: 0.2688
Final TP: 0.2914
SL: 0.2012
The asset moved upward over the past twenty-four hours, trading above the highest level of the last twenty four-hour candles. With the four-hour relative strength index in the overbought zone, traders are observing whether this move sustains.
As long as 0.2200 holds, structure stays constructive
Must use stop loss while trading
Trade $INIT
Not financial advice. Always DYOR.
Like & Follow for Daily Trade Analytics & Insider News. @SarwatAK
#INIT #HotTrends #TradingSignals
200
·
--
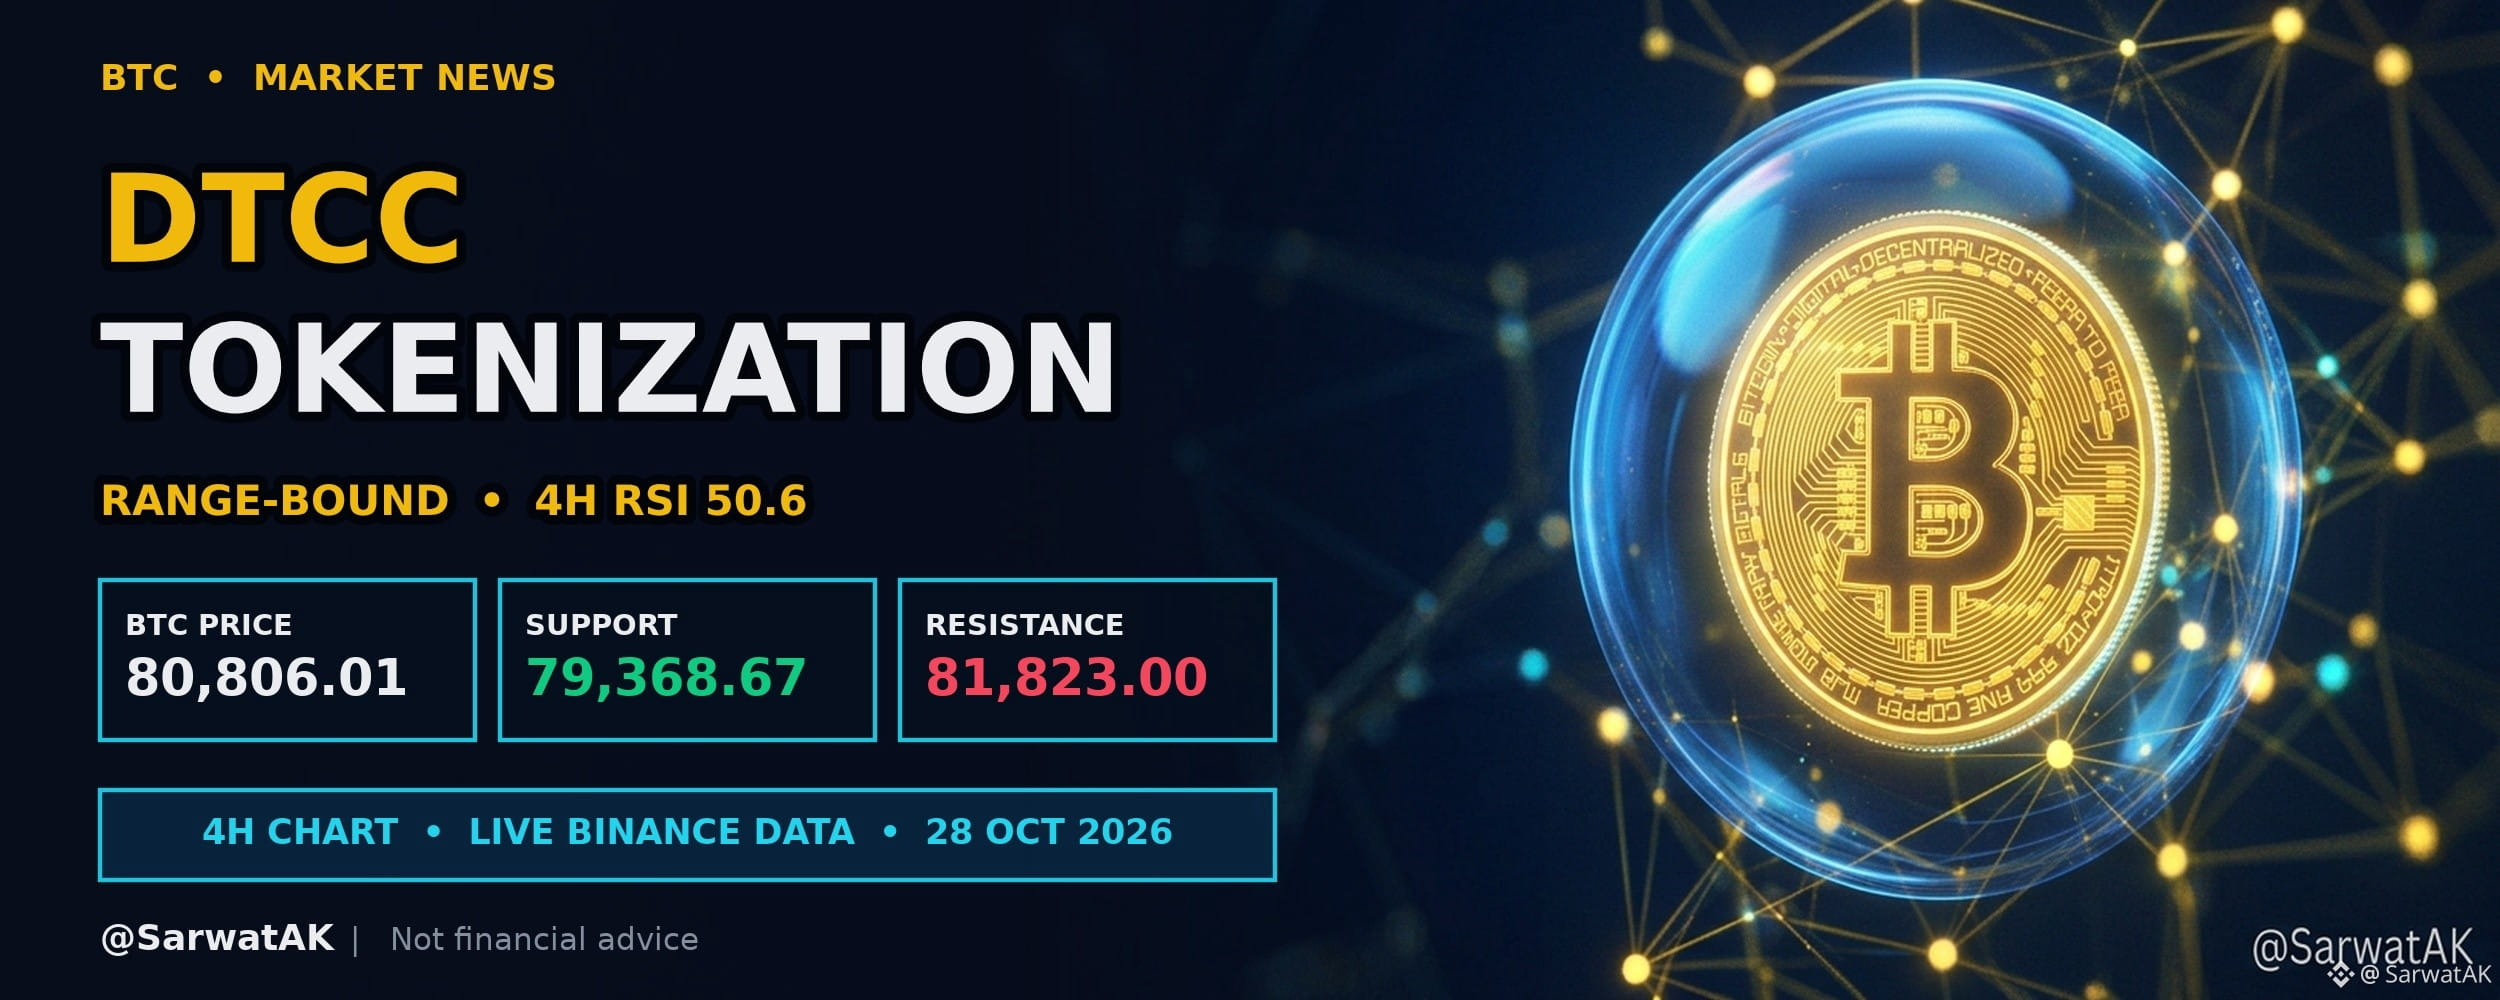
DTCC Unit Launches Tokenization Services
WHAT HAPPENED
▪️ A post-trade market infrastructure provider's unit has officially launched tokenization services.
▪️ The provider stated that these services will create a practical path for the adoption of tokenized securities.
WHY IT MATTERS FOR TRADERS
Institutional infrastructure developments of this nature may gradually improve market sentiment regarding tokenized assets. Broader adoption of tokenized securities could eventually influence liquidity across digital asset markets.
MARKET SNAPSHOT
▪️ $BTC: 80,806.01 USD, up 0.7% (24h), 4H RSI 50.6
▪️ Range to watch: 79,368.67 support / 81,823.00 resistance
How might traditional market infrastructure integration impact the adoption of tokenized securities?
Source: Cointelegraph
Not financial advice. Always DYOR.
Like & Follow for Daily Trade Analytics & Insider News. @SarwatAK
#TrendingTopic #Bitcoin #HotTrends
66
·
--
Baissier
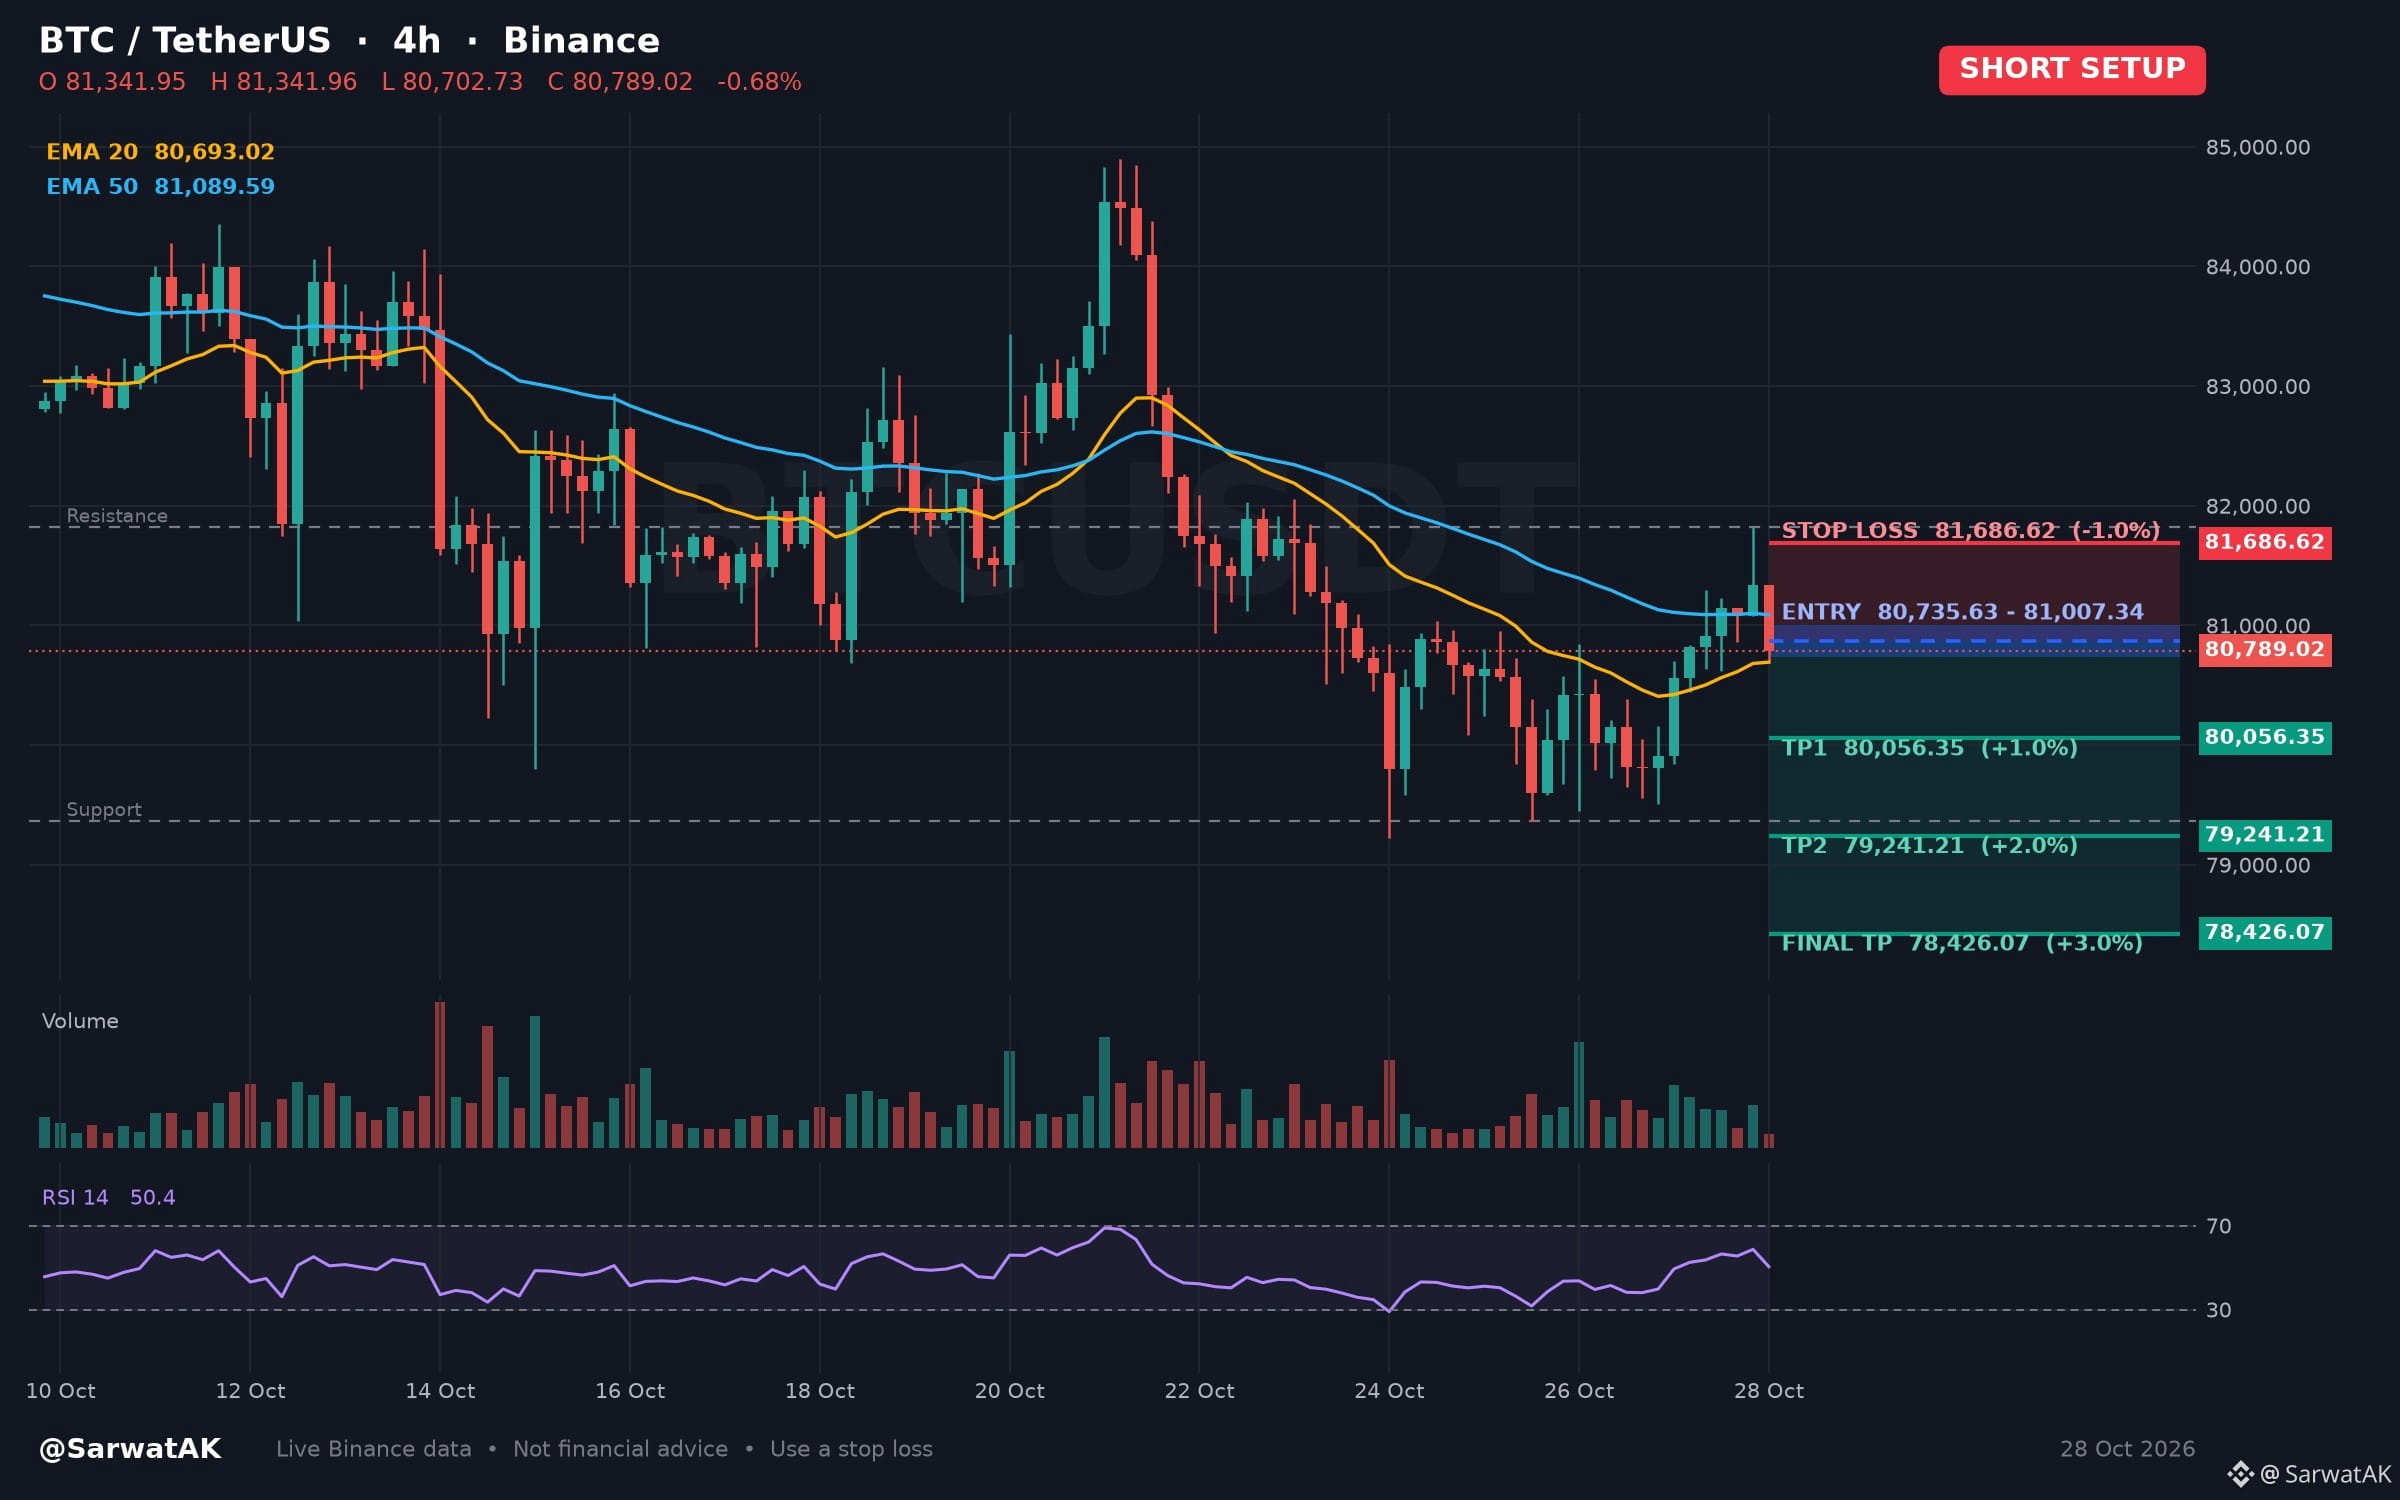
$BTC SHORT SETUP ... NEXT TARGET 78,426.07
Rangebound Structure with Mixed EMA Signals and Neutral Momentum
Entry: 80,735.63 - 81,007.34 (Short)
TP1: 80,056.35
TP2: 79,241.21
Final TP: 78,426.07
SL: 81,686.62
Price trades between key boundaries with mixed EMA signals despite upward progress over the past twenty-four hours. With the four-hour RSI in neutral territory, directional resolution depends on a break beyond either boundary.
As long as price stays below 81,007.34, structure stays heavy
Must use stop loss while trading
Trade $BTC
Not financial advice. Always DYOR.
Like & Follow for Daily Trade Analytics & Insider News. @SarwatAK
#Bitcoin #TrendingTopic #HotTrends
{spot}(BTCUSDT)
$BTC SHORT SETUP ... NEXT TARGET 78,426.07
Rangebound Structure with Mixed EMA Signals and Neutral Momentum
Entry: 80,735.63 - 81,007.34 (Short)
TP1: 80,056.35
TP2: 79,241.21
Final TP: 78,426.07
SL: 81,686.62
Price trades between key boundaries with mixed EMA signals despite upward progress over the past twenty-four hours. With the four-hour RSI in neutral territory, directional resolution depends on a break beyond either boundary.
As long as price stays below 81,007.34, structure stays heavy
Must use stop loss while trading
Trade $BTC
Not financial advice. Always DYOR.
Like & Follow for Daily Trade Analytics & Insider News. @SarwatAK
#Bitcoin #TrendingTopic #HotTrends
86
·
--
Haussier
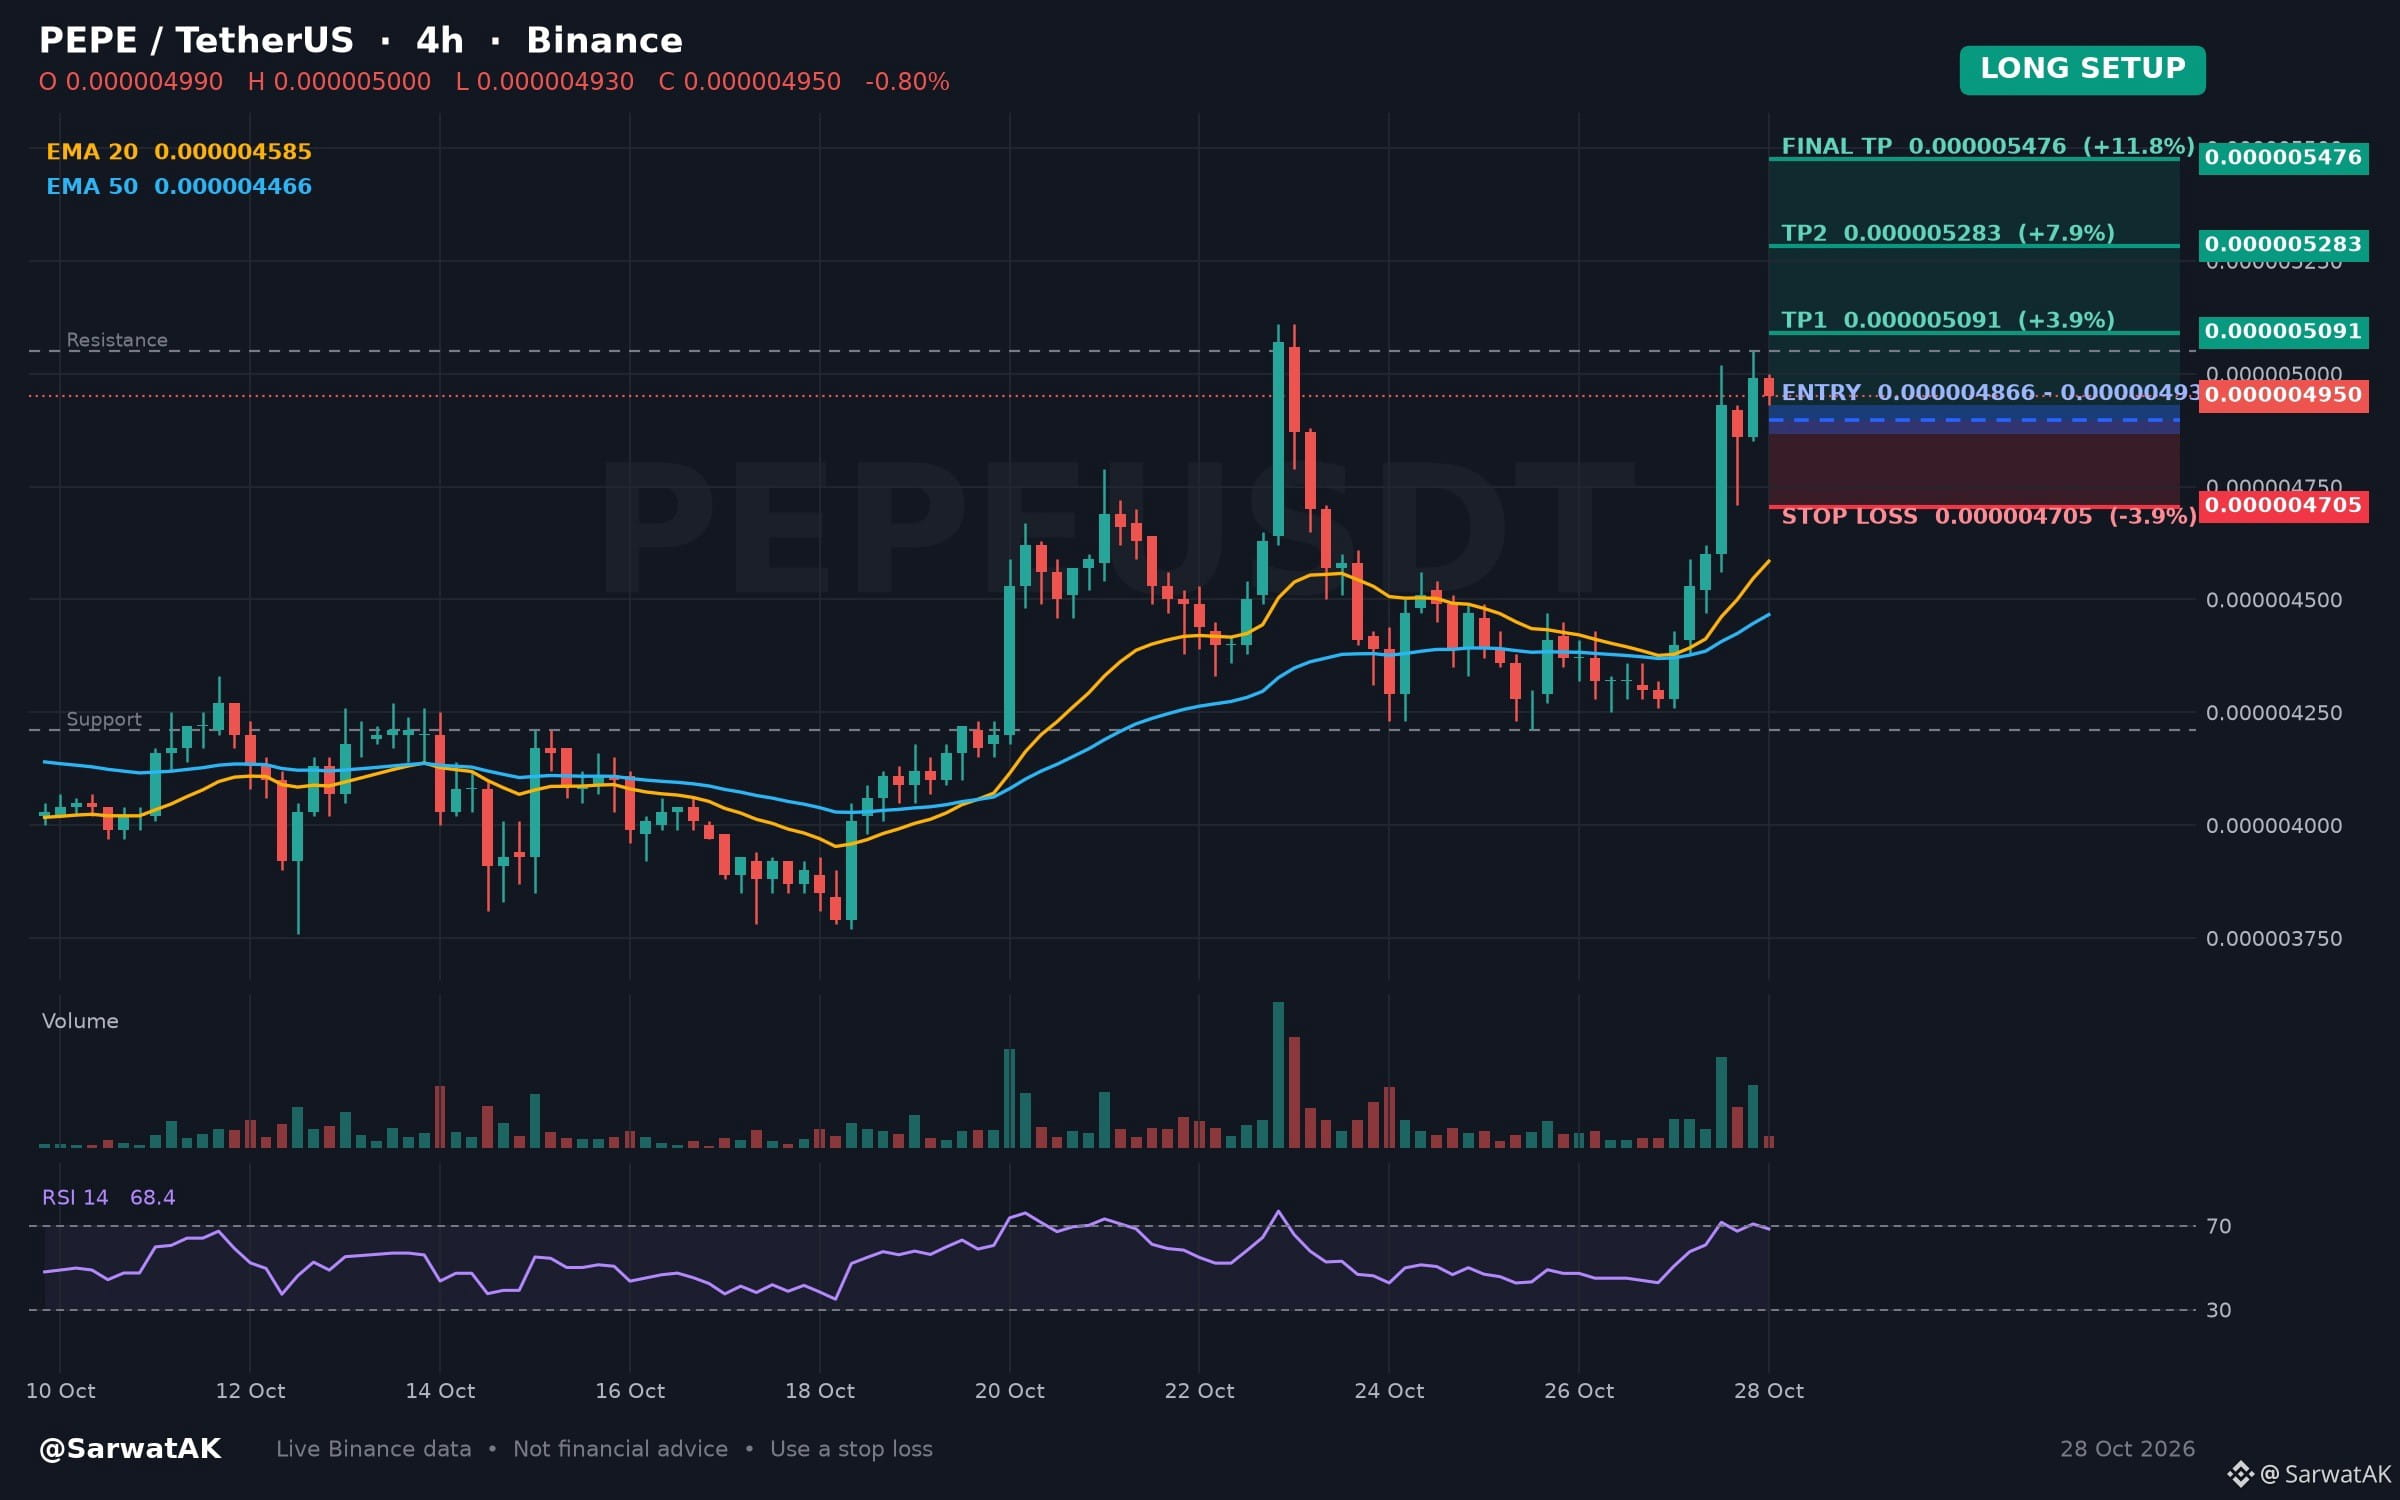
$PEPE LONG SETUP ... NEXT TARGET 0.000005476
Upward Moving Average Alignment Meets Neutral Four-Hour Momentum
Entry: 0.000004866 - 0.000004930 (Long)
TP1: 0.000005091
TP2: 0.000005283
Final TP: 0.000005476
SL: 0.000004705
Price holding above consecutive exponential moving averages reflects an upward direction over the past twenty-four hours. The four-hour relative strength index sits in neutral territory, leaving momentum balanced as market structure develops.
As long as 0.000004866 holds, structure stays constructive
Must use stop loss while trading
Trade $PEPE
Not financial advice. Always DYOR.
Like & Follow for Daily Trade Analytics & Insider News. @SarwatAK
#PEPE #TrendingTopic #HotTrends
{spot}(PEPEUSDT)
$PEPE LONG SETUP ... NEXT TARGET 0.000005476
Upward Moving Average Alignment Meets Neutral Four-Hour Momentum
Entry: 0.000004866 - 0.000004930 (Long)
TP1: 0.000005091
TP2: 0.000005283
Final TP: 0.000005476
SL: 0.000004705
Price holding above consecutive exponential moving averages reflects an upward direction over the past twenty-four hours. The four-hour relative strength index sits in neutral territory, leaving momentum balanced as market structure develops.
As long as 0.000004866 holds, structure stays constructive
Must use stop loss while trading
Trade $PEPE
Not financial advice. Always DYOR.
Like & Follow for Daily Trade Analytics & Insider News. @SarwatAK
#PEPE #TrendingTopic #HotTrends
106
·
--
Crypto Could Outperform AI Stocks, Says Wall Street Veteran Jordi Visser
WHAT HAPPENED
▪️ Former Morgan Stanley and Weiss executive Jordi Visser states AI agents are boosting demand for crypto.
▪️ Visser reports expanding his holdings beyond Bitcoin, Ether, and Solana.
WHY IT MATTERS FOR TRADERS
Institutional commentary linking artificial intelligence to crypto utility may shift overall market sentiment. Increased allocation beyond major assets could also alter liquidity distribution across altcoin markets.
MARKET SNAPSHOT
▪️ $BTC: 80,297.10 USD, down 0.2% (24h), 4H RSI 45.8
▪️ Range to watch: 79,220.74 support / 81,097.47 resistance
Do you expect AI agent activity to drive liquidity into digital assets beyond major tokens?
Source: Cointelegraph
Not financial advice. Always DYOR.
Like & Follow for Daily Trade Analytics & Insider News. @SarwatAK
#CanMicrosoftDeliverOnAI #CanGoogleDefendItsCore

6
·
--
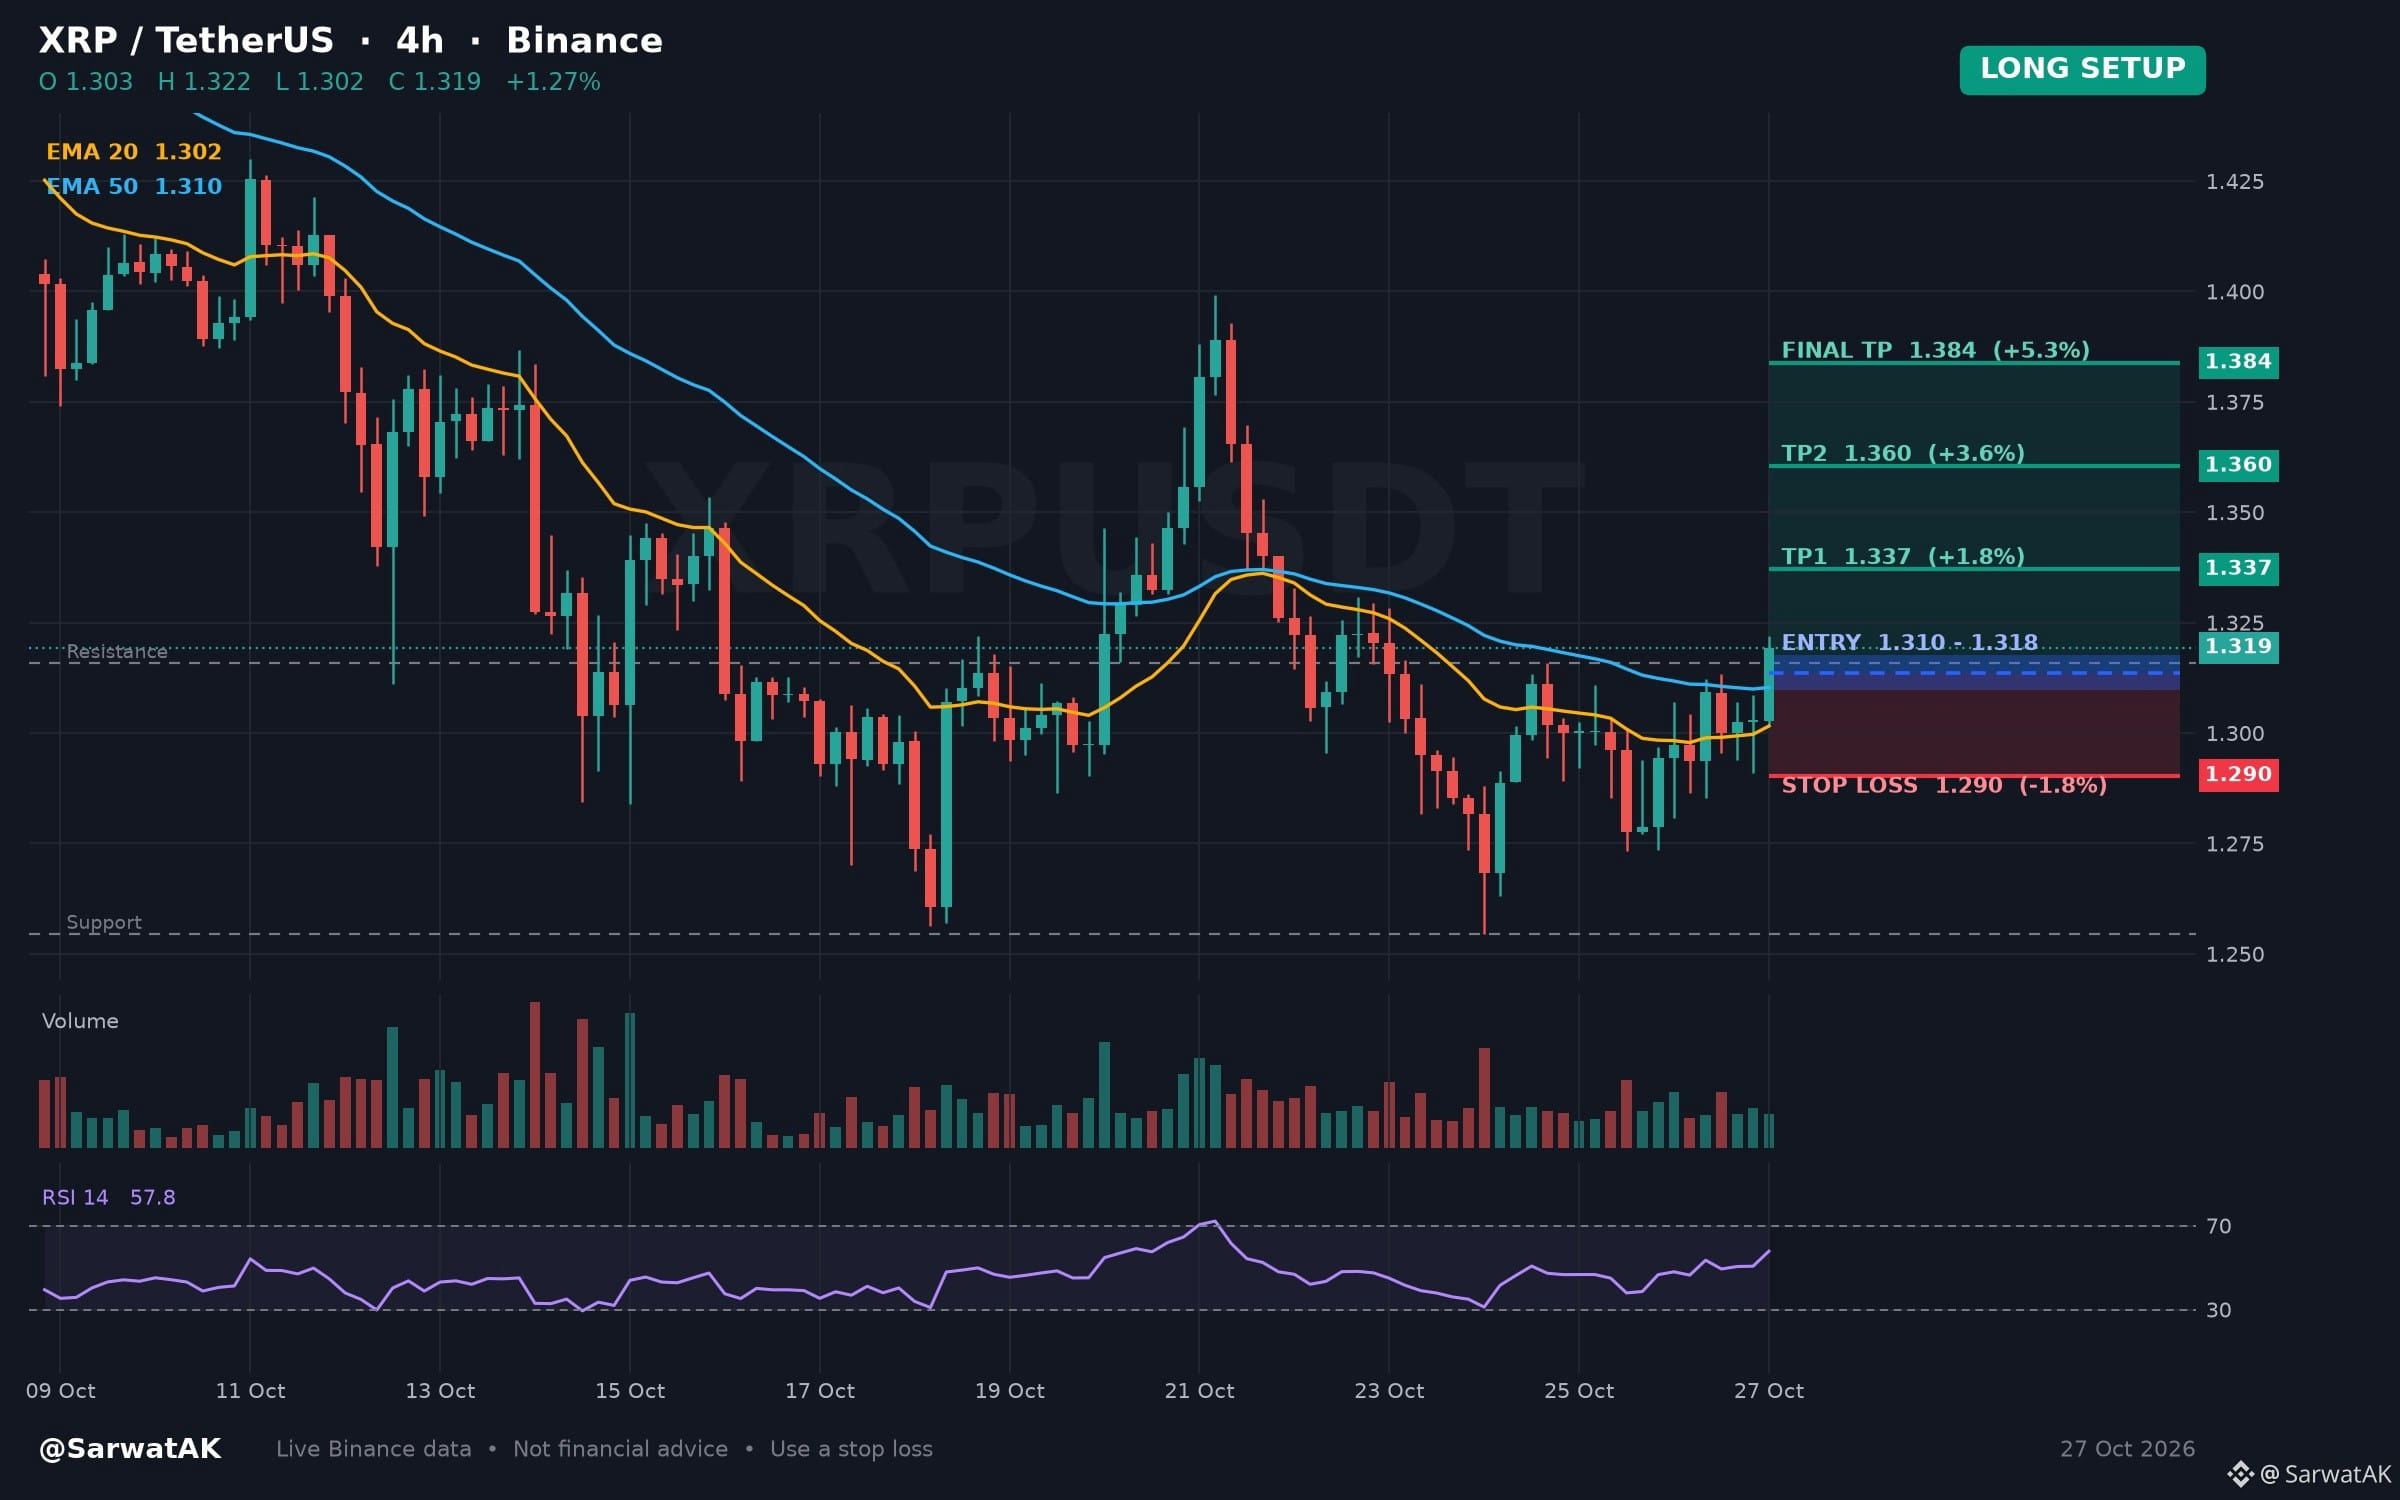
$XRP LONG SETUP ... NEXT TARGET 1.384
Multi-Candle Breakout Meets Neutral Momentum on Four-Hour Chart
Entry: 1.310 - 1.318 (Long)
TP1: 1.337
TP2: 1.360
Final TP: 1.384
SL: 1.290
Upward price action over the past twenty-four hours has cleared the highest level of the last twenty four-hour candles. With relative strength remaining neutral on the four-hour chart, market participants are evaluating whether momentum can sustain this level.
As long as 1.310 holds, structure stays constructive
Must use stop loss while trading
Trade $XRP
Not financial advice. Always DYOR.
Like & Follow for Daily Trade Analytics & Insider News. @SarwatAK
#XRP #HotTrends #TrendingTopic
{spot}(XRPUSDT)
{future}(XRPUSDT)
$XRP LONG SETUP ... NEXT TARGET 1.384
Multi-Candle Breakout Meets Neutral Momentum on Four-Hour Chart
Entry: 1.310 - 1.318 (Long)
TP1: 1.337
TP2: 1.360
Final TP: 1.384
SL: 1.290
Upward price action over the past twenty-four hours has cleared the highest level of the last twenty four-hour candles. With relative strength remaining neutral on the four-hour chart, market participants are evaluating whether momentum can sustain this level.
As long as 1.310 holds, structure stays constructive
Must use stop loss while trading
Trade $XRP
Not financial advice. Always DYOR.
Like & Follow for Daily Trade Analytics & Insider News. @SarwatAK
#XRP #HotTrends #TrendingTopic
38
·
--
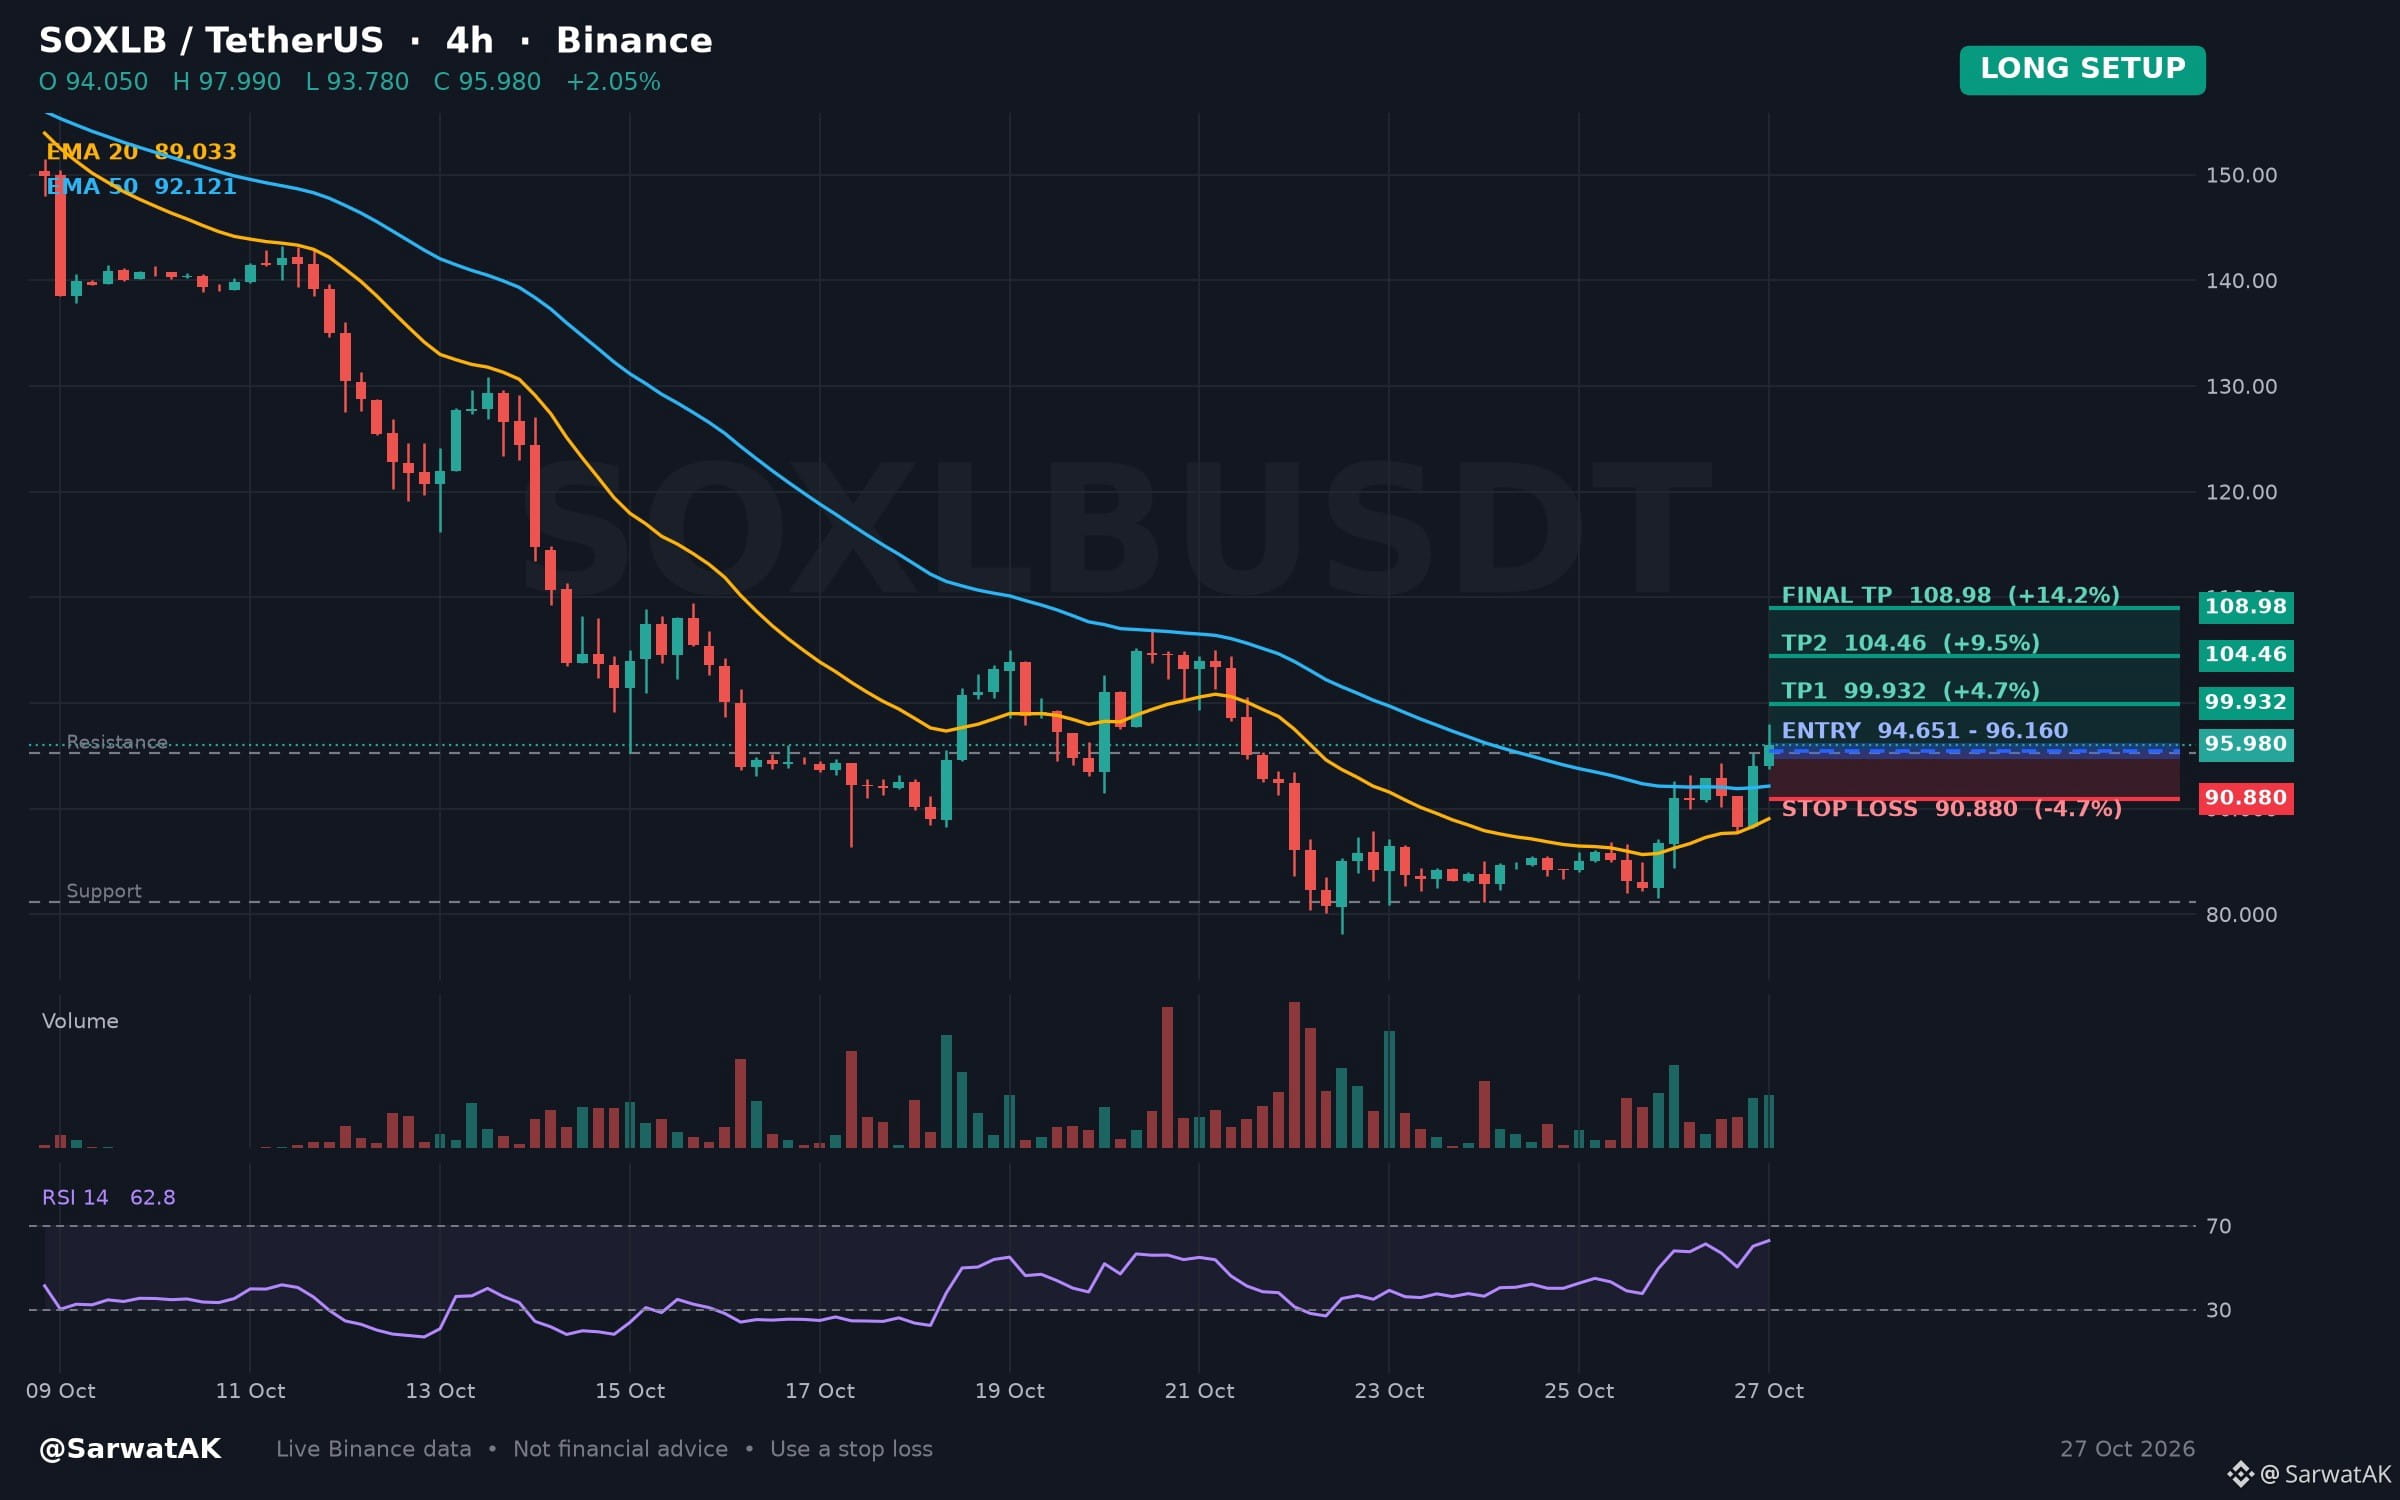
$SOXLB LONG SETUP ... NEXT TARGET 108.98
Price Extends Past Recent Highs as Relative Strength Stays Neutral
Entry: 94.651 - 96.160 (Long)
TP1: 99.932
TP2: 104.46
Final TP: 108.98
SL: 90.880
Pushing above the peak of the past twenty four-hour candles extends twenty-four-hour gains while relative strength remains neutral. Holding above this prior ceiling reflects continued expansion, whereas a slip below it suggests consolidation.
As long as 94.651 holds, structure stays constructive
Must use stop loss while trading
Trade $SOXLB
Not financial advice. Always DYOR.
Like & Follow for Daily Trade Analytics & Insider News. @SarwatAK
#SOXLB #Breakout #TrendingTopic
{spot}(SOXLBUSDT)
$SOXLB LONG SETUP ... NEXT TARGET 108.98
Price Extends Past Recent Highs as Relative Strength Stays Neutral
Entry: 94.651 - 96.160 (Long)
TP1: 99.932
TP2: 104.46
Final TP: 108.98
SL: 90.880
Pushing above the peak of the past twenty four-hour candles extends twenty-four-hour gains while relative strength remains neutral. Holding above this prior ceiling reflects continued expansion, whereas a slip below it suggests consolidation.
As long as 94.651 holds, structure stays constructive
Must use stop loss while trading
Trade $SOXLB
Not financial advice. Always DYOR.
Like & Follow for Daily Trade Analytics & Insider News. @SarwatAK
#SOXLB #Breakout #TrendingTopic
2
73
·
--
Baissier
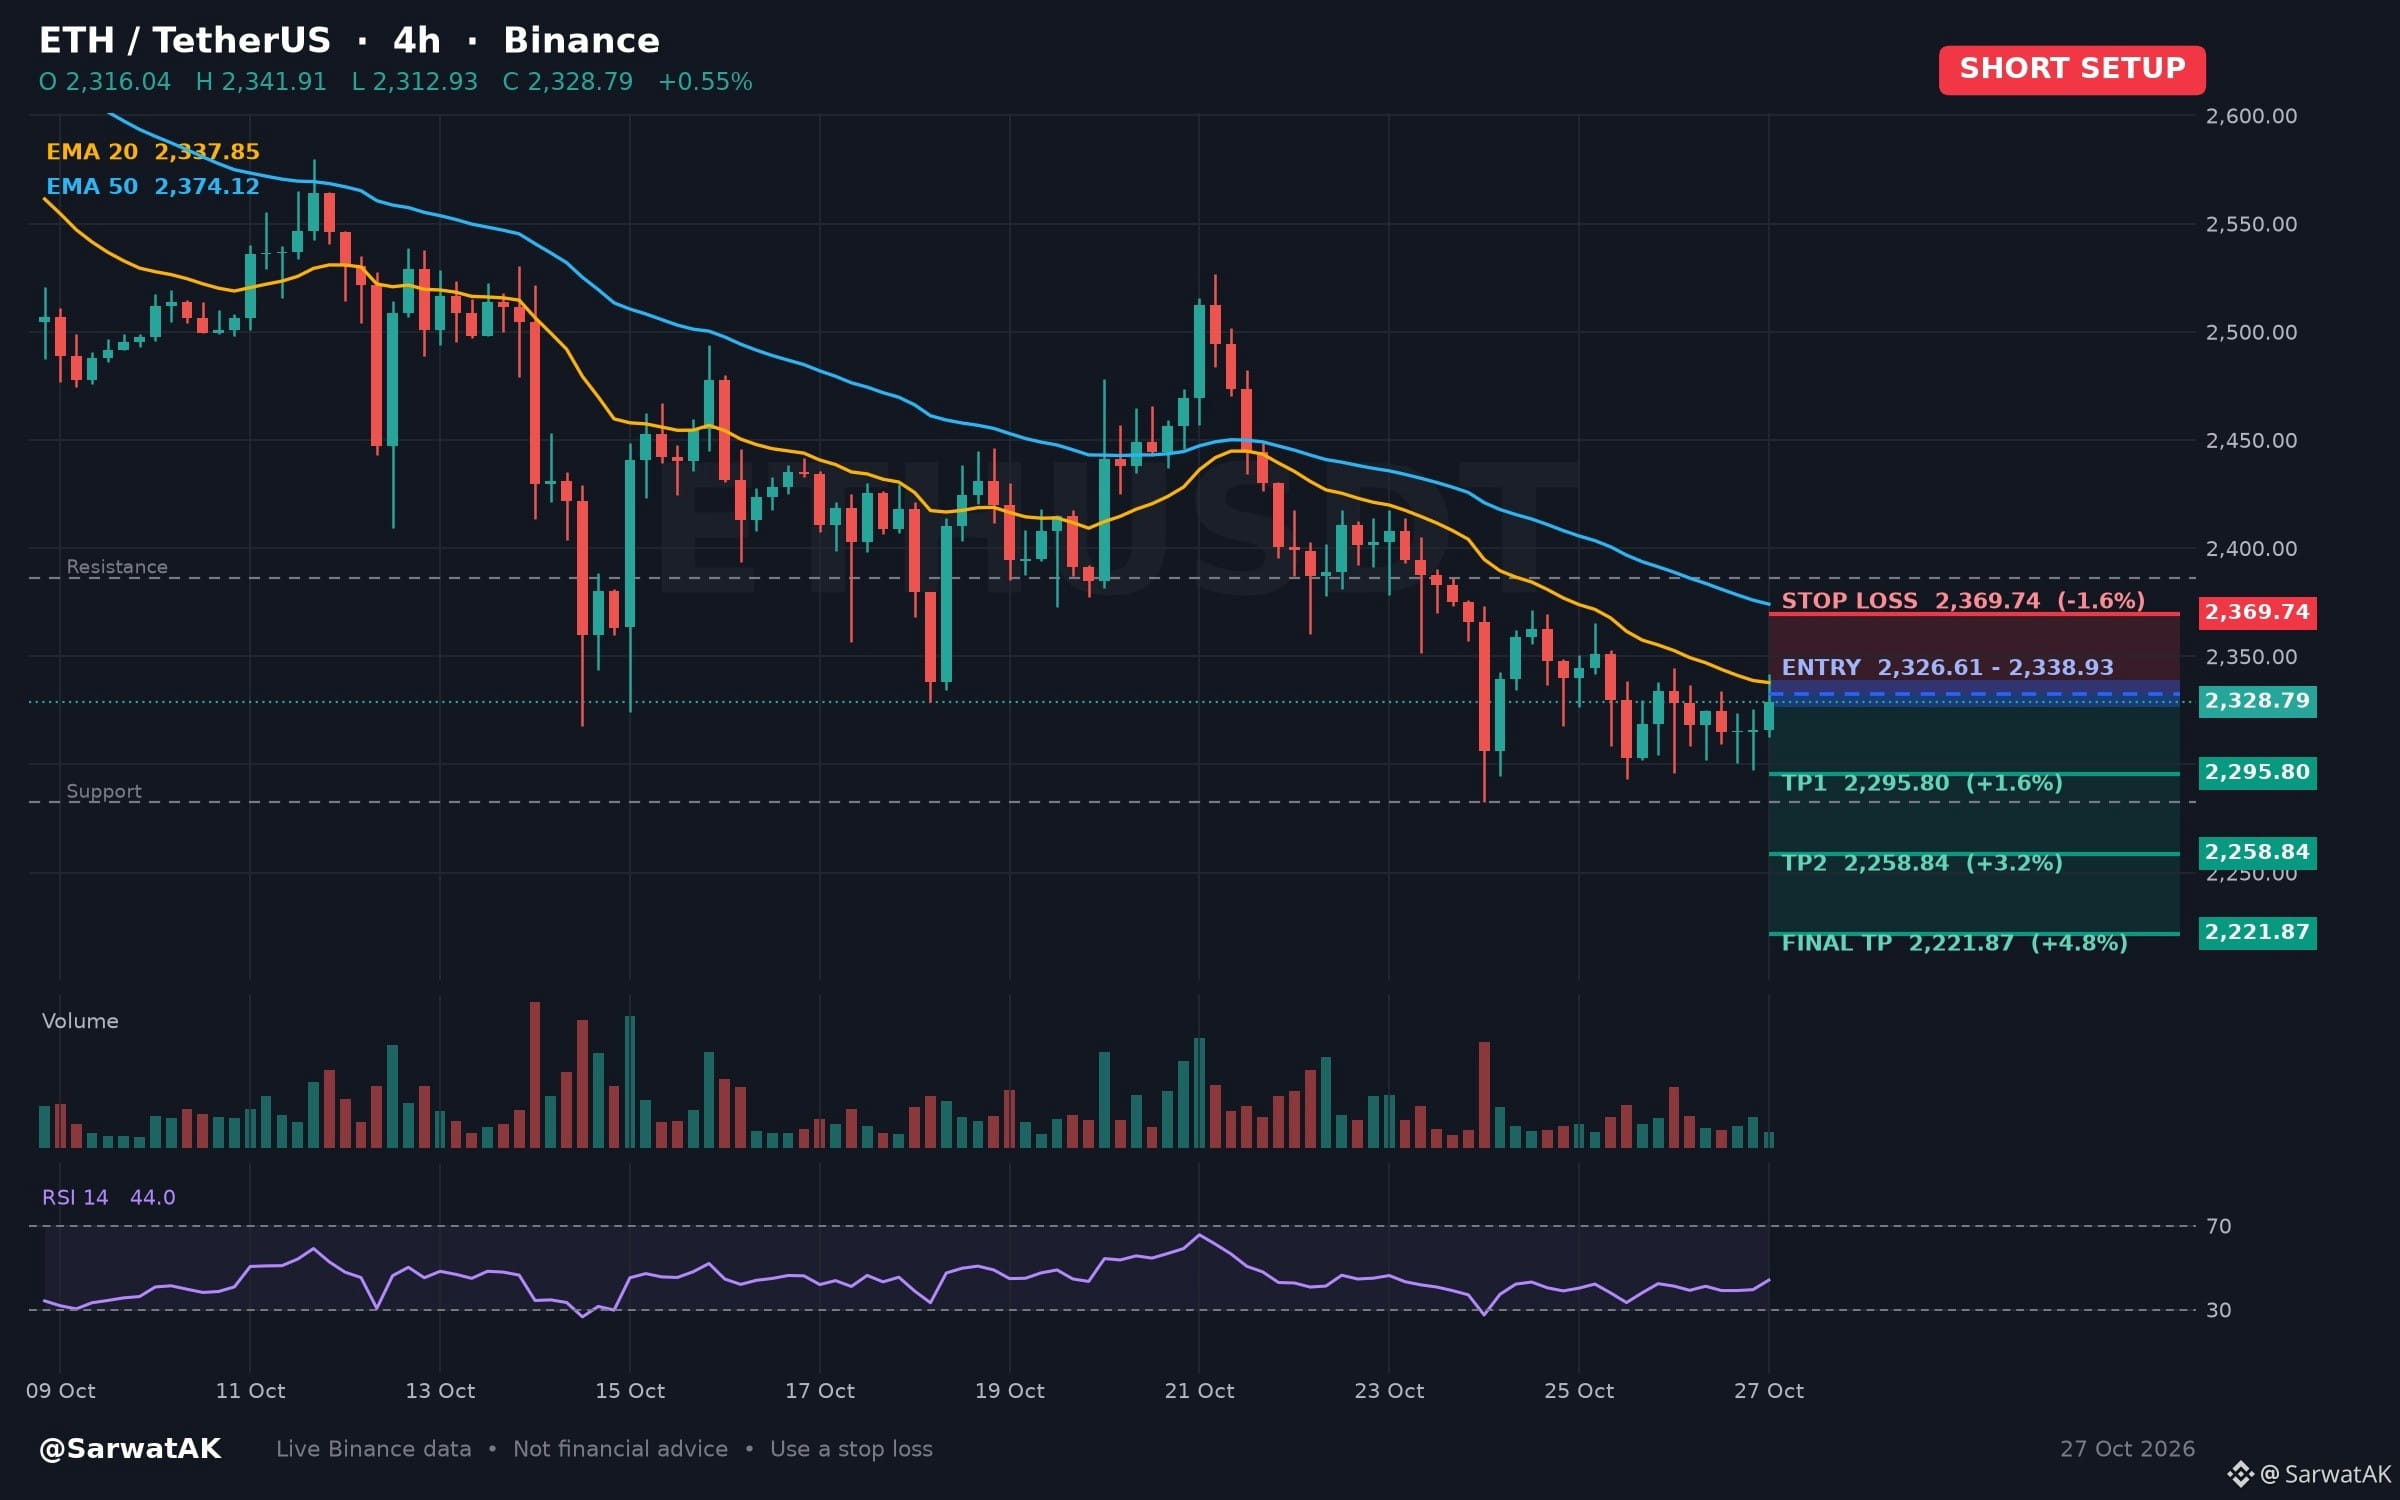
$ETH SHORT SETUP ... NEXT TARGET 2,221.87
Four-Hour Chart Displays Bearish Moving Average Alignment with Neutral Momentum
Entry: 2,326.61 - 2,338.93 (Short)
TP1: 2,295.80
TP2: 2,258.84
Final TP: 2,221.87
SL: 2,369.74
Price remains below key exponential moving averages following downward trajectory over the past twenty-four hours. Meanwhile, a neutral relative strength index on the four-hour chart suggests momentum has room to expand in either direction.
As long as price stays below 2,338.93, structure stays heavy
Must use stop loss while trading
Trade $ETH
Not financial advice. Always DYOR.
Like & Follow for Daily Trade Analytics & Insider News. @SarwatAK
#ETH #FOMCWatch #EthereumDropsBelow$2300
{spot}(ETHUSDT)
$ETH SHORT SETUP ... NEXT TARGET 2,221.87
Four-Hour Chart Displays Bearish Moving Average Alignment with Neutral Momentum
Entry: 2,326.61 - 2,338.93 (Short)
TP1: 2,295.80
TP2: 2,258.84
Final TP: 2,221.87
SL: 2,369.74
Price remains below key exponential moving averages following downward trajectory over the past twenty-four hours. Meanwhile, a neutral relative strength index on the four-hour chart suggests momentum has room to expand in either direction.
As long as price stays below 2,338.93, structure stays heavy
Must use stop loss while trading
Trade $ETH
Not financial advice. Always DYOR.
Like & Follow for Daily Trade Analytics & Insider News. @SarwatAK
#ETH #FOMCWatch #EthereumDropsBelow$2300
1
95
·
--
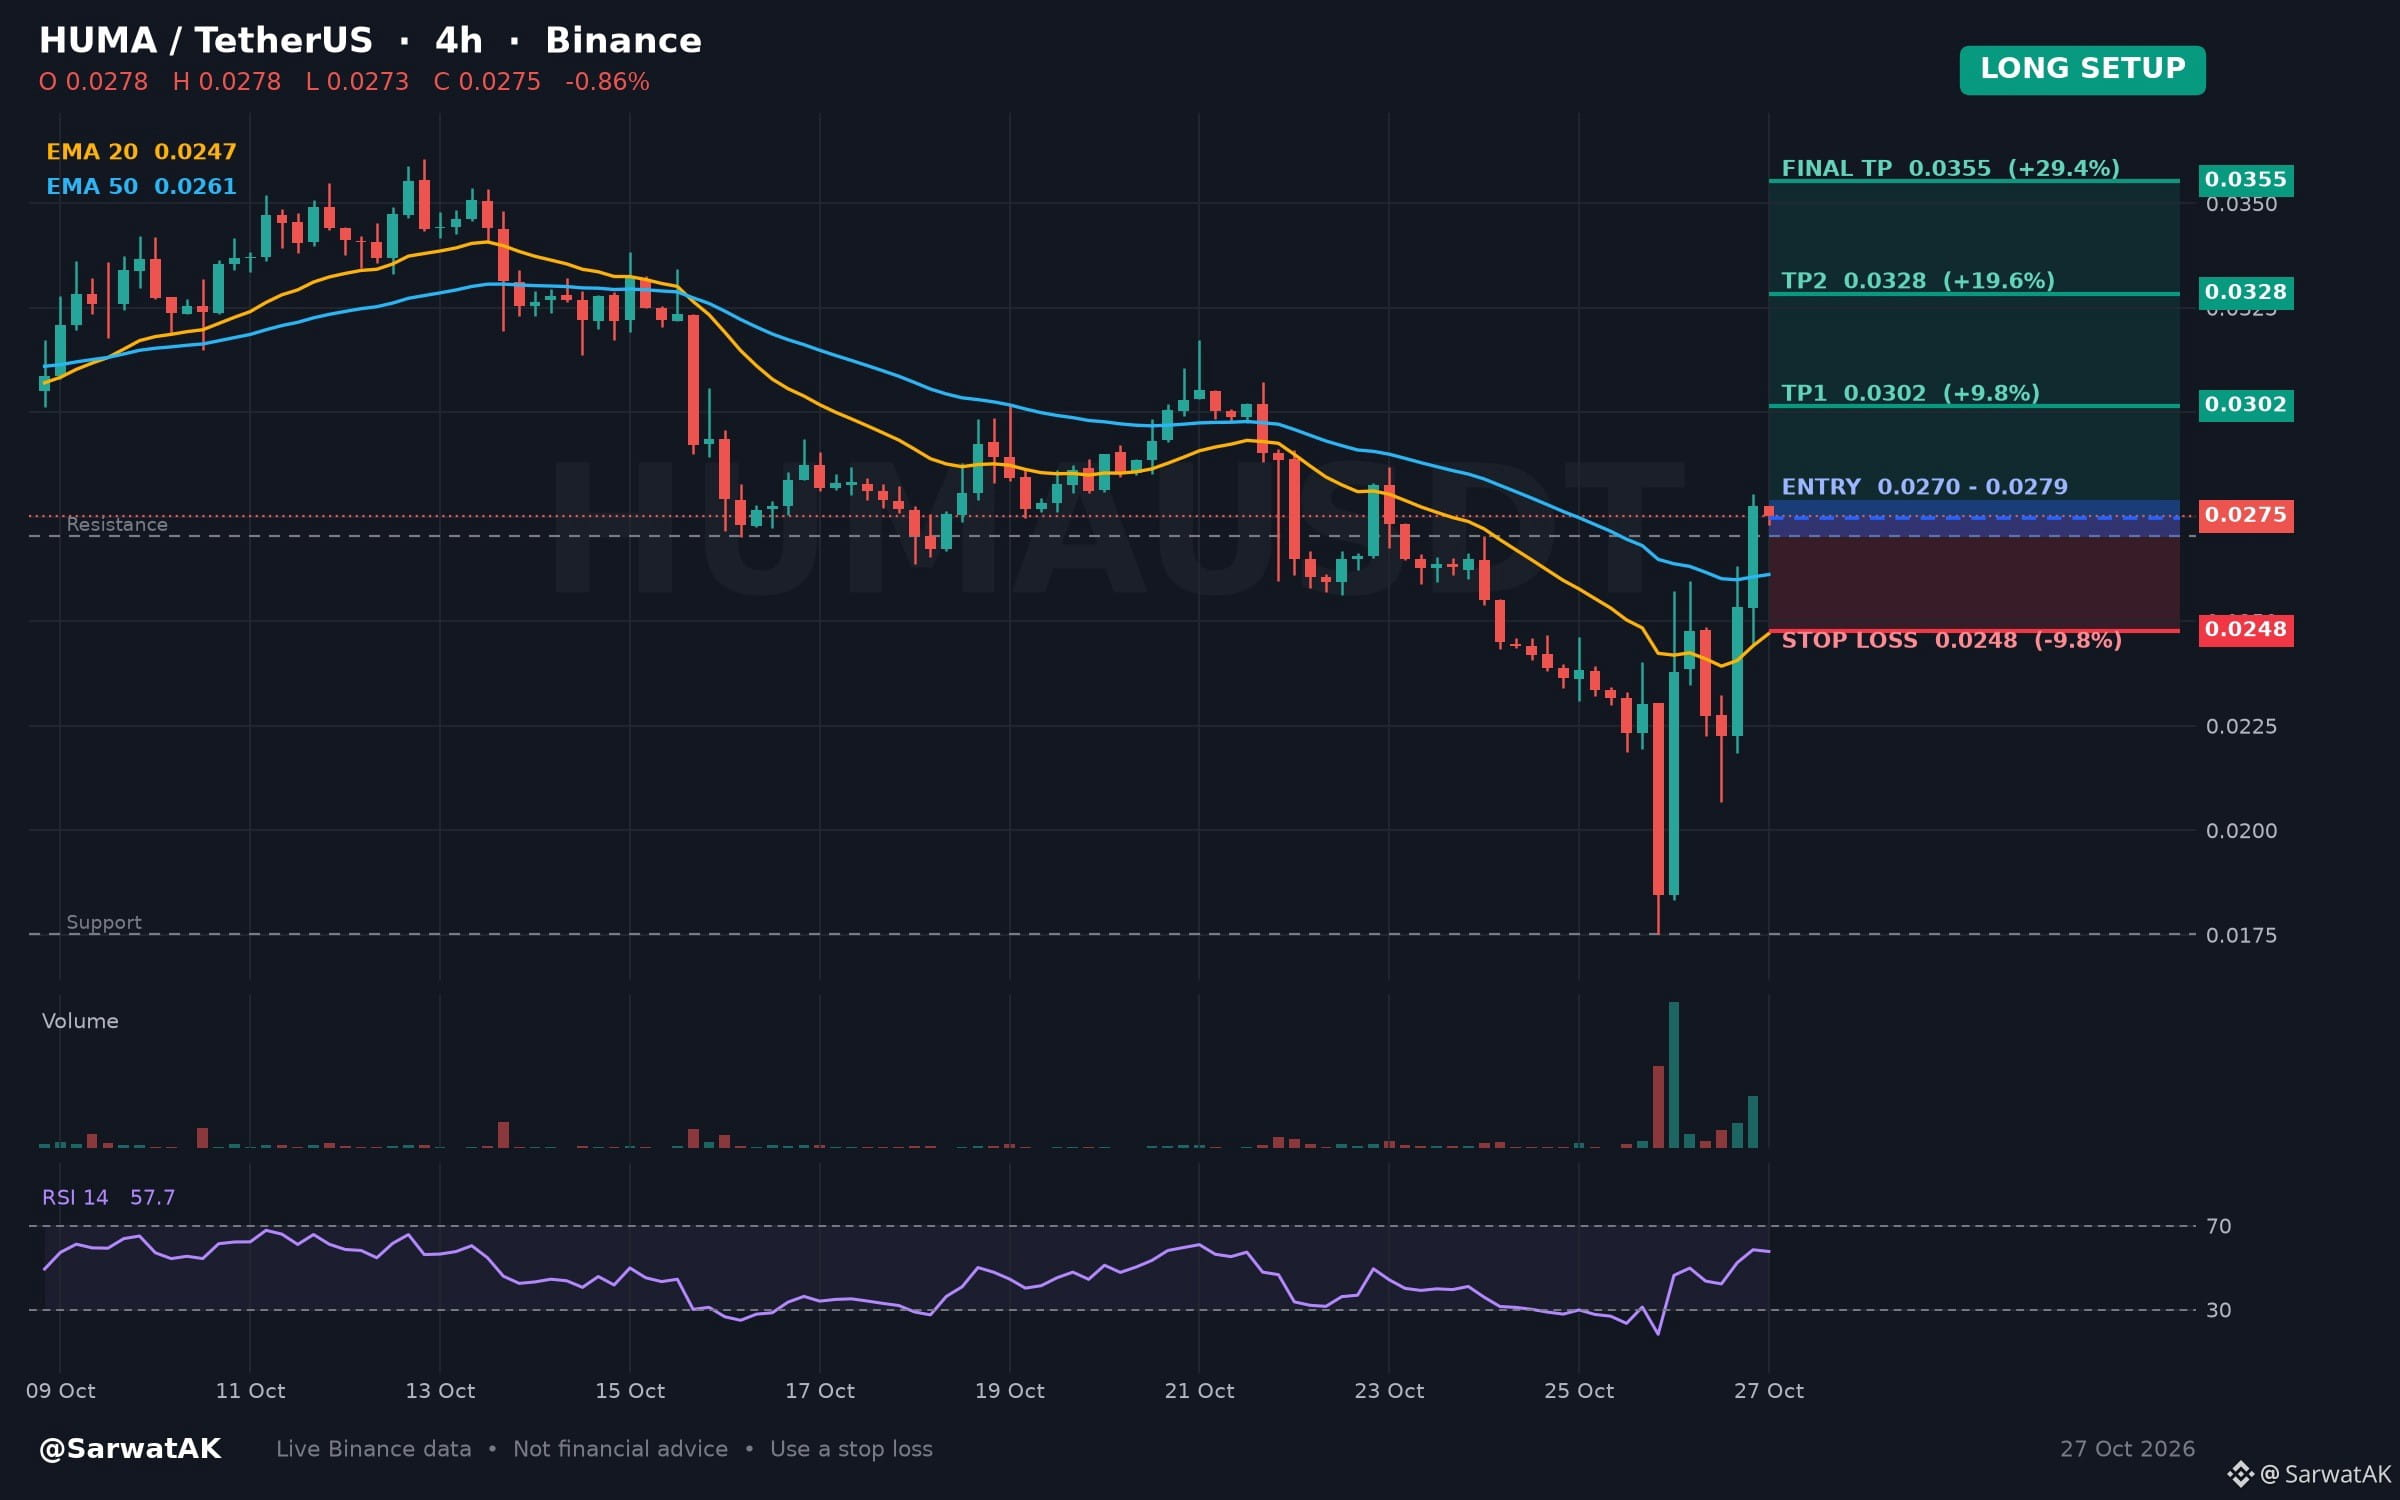
$HUMA LONG SETUP ... NEXT TARGET 0.0355
Four-Hour Breakout Above Multi-Candle High Signals Potential Structural Shift
Entry: 0.0270 - 0.0279 (Long)
TP1: 0.0302
TP2: 0.0328
Final TP: 0.0355
SL: 0.0248
Price has advanced above the highest level of recent four-hour candles amid positive movement over the past twenty-four hours. Because the four-hour RSI remains in the neutral zone, traders typically evaluate if momentum can support further continuation.
As long as 0.0270 holds, structure stays constructive
Must use stop loss while trading
Trade $HUMA
Not financial advice. Always DYOR.
Like & Follow for Daily Trade Analytics & Insider News. @SarwatAK
{spot}(HUMAUSDT)
#HUMA #HotTrends #FOMCWatch
{future}(HUMAUSDT)
$HUMA LONG SETUP ... NEXT TARGET 0.0355
Four-Hour Breakout Above Multi-Candle High Signals Potential Structural Shift
Entry: 0.0270 - 0.0279 (Long)
TP1: 0.0302
TP2: 0.0328
Final TP: 0.0355
SL: 0.0248
Price has advanced above the highest level of recent four-hour candles amid positive movement over the past twenty-four hours. Because the four-hour RSI remains in the neutral zone, traders typically evaluate if momentum can support further continuation.
As long as 0.0270 holds, structure stays constructive
Must use stop loss while trading
Trade $HUMA
Not financial advice. Always DYOR.
Like & Follow for Daily Trade Analytics & Insider News. @SarwatAK
#HUMA #HotTrends #FOMCWatch
77
·
--
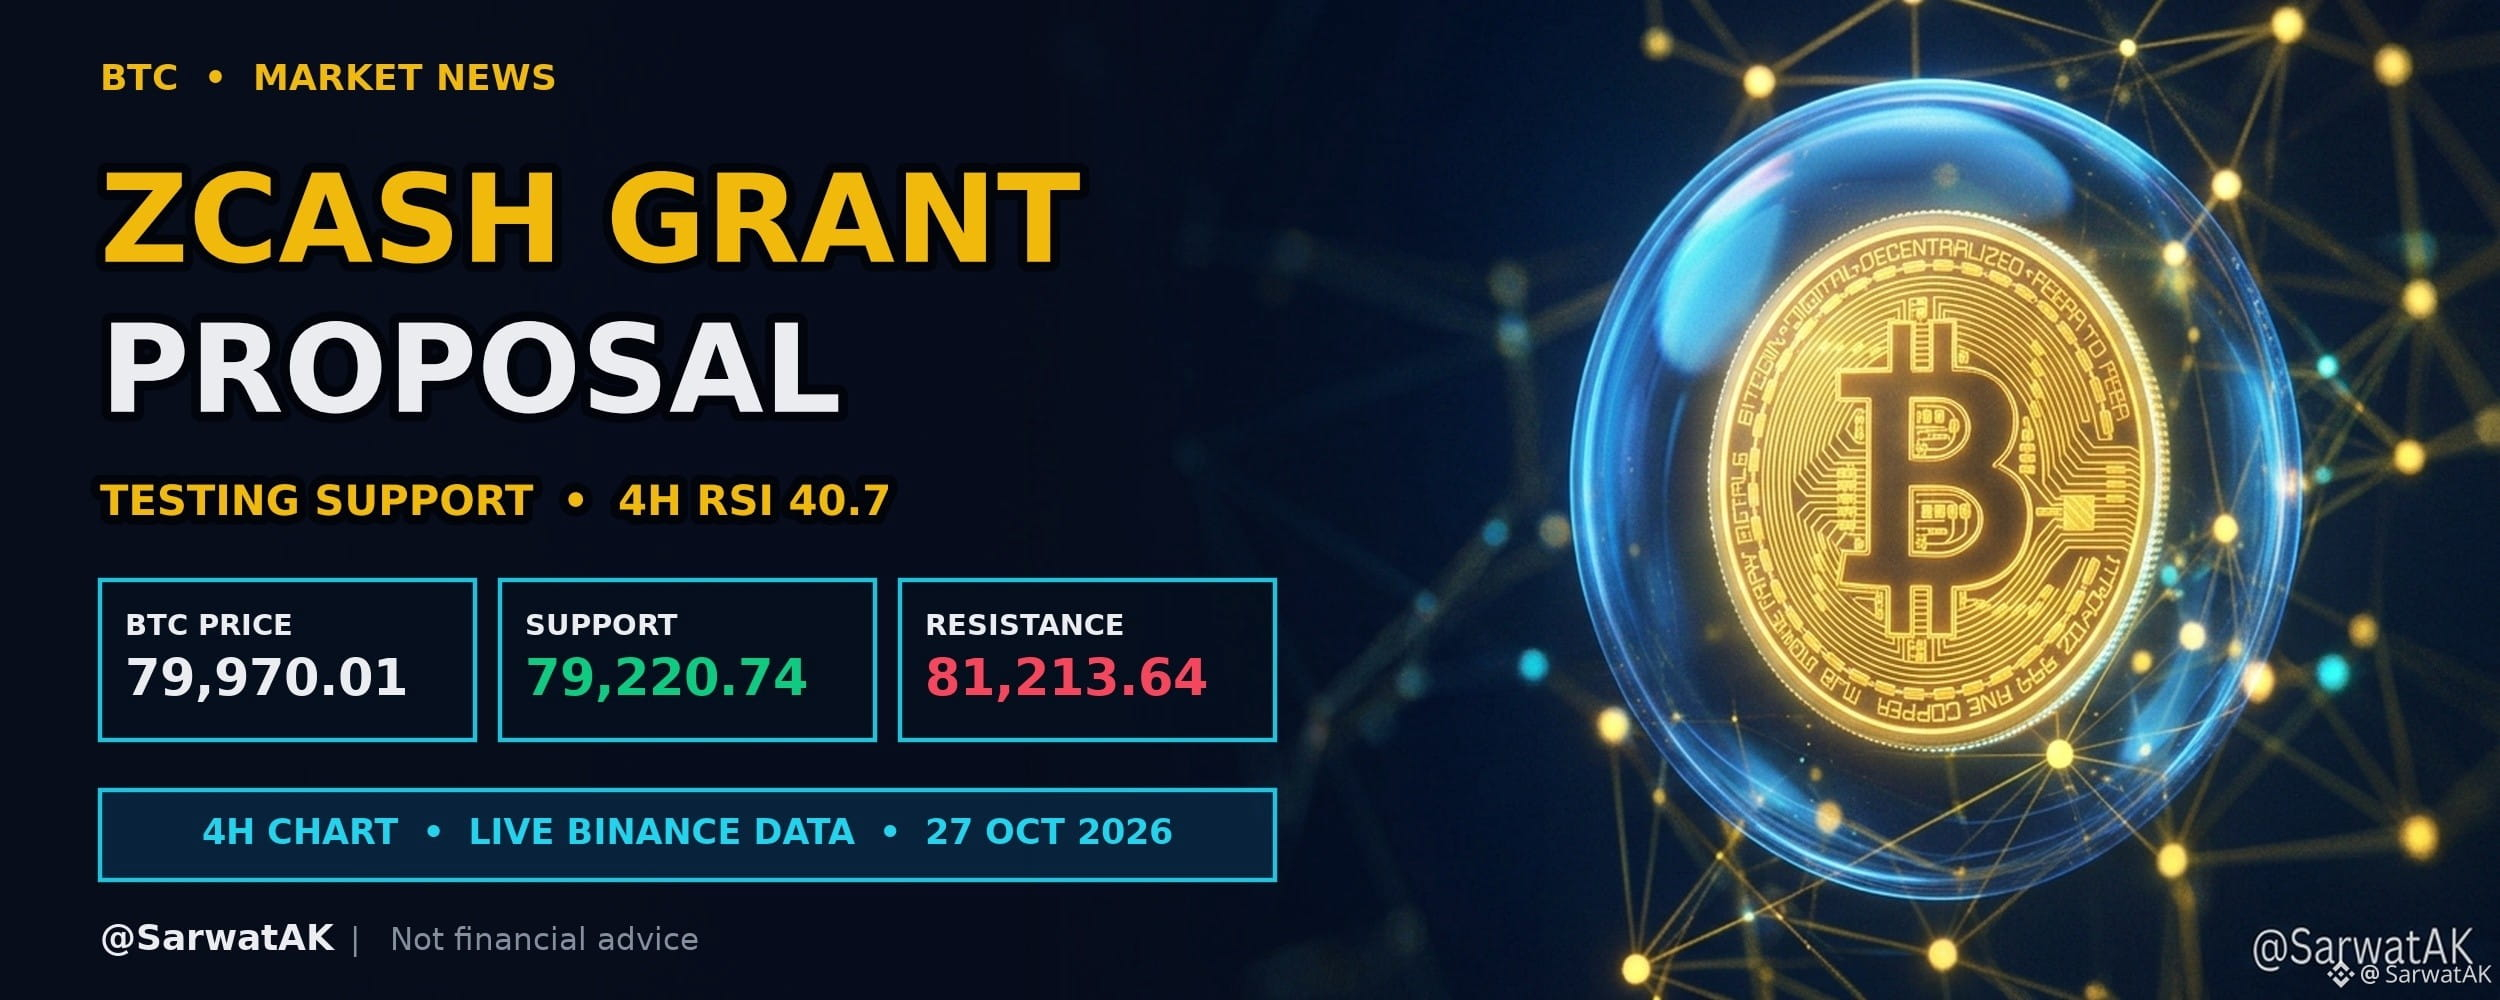
Zcash Co-Founder Proposes Redirecting Grant Funds to Network Reserve
WHAT HAPPENED
▪️ Co-founder Sean Bowe proposed ending funding for the Zcash Community Grants program, stating it has sufficient capital.
▪️ The proposal suggests redirecting the grants program's share of newly issued ZEC into a dedicated network reserve.
WHY IT MATTERS FOR TRADERS
Redirecting new ZEC emissions to a reserve could alter long-term distribution dynamics and market supply expectations. Traders often monitor changes in protocol funding structures as indicators of shifting governance priorities and ecosystem stability.
MARKET SNAPSHOT
▪️ $BTC: 79,970.01 USD, down 0.6% (24h), 4H RSI 40.7
▪️ Range to watch: 79,220.74 support / 81,213.64 resistance
How do you expect network reserve models to influence token governance over time?
Source: Cointelegraph
Not financial advice. Always DYOR.
Like & Follow for Daily Trade Analytics & Insider News. @SarwatAK
#TrendingTopic #Bitcoin #ZEC
201
·
--
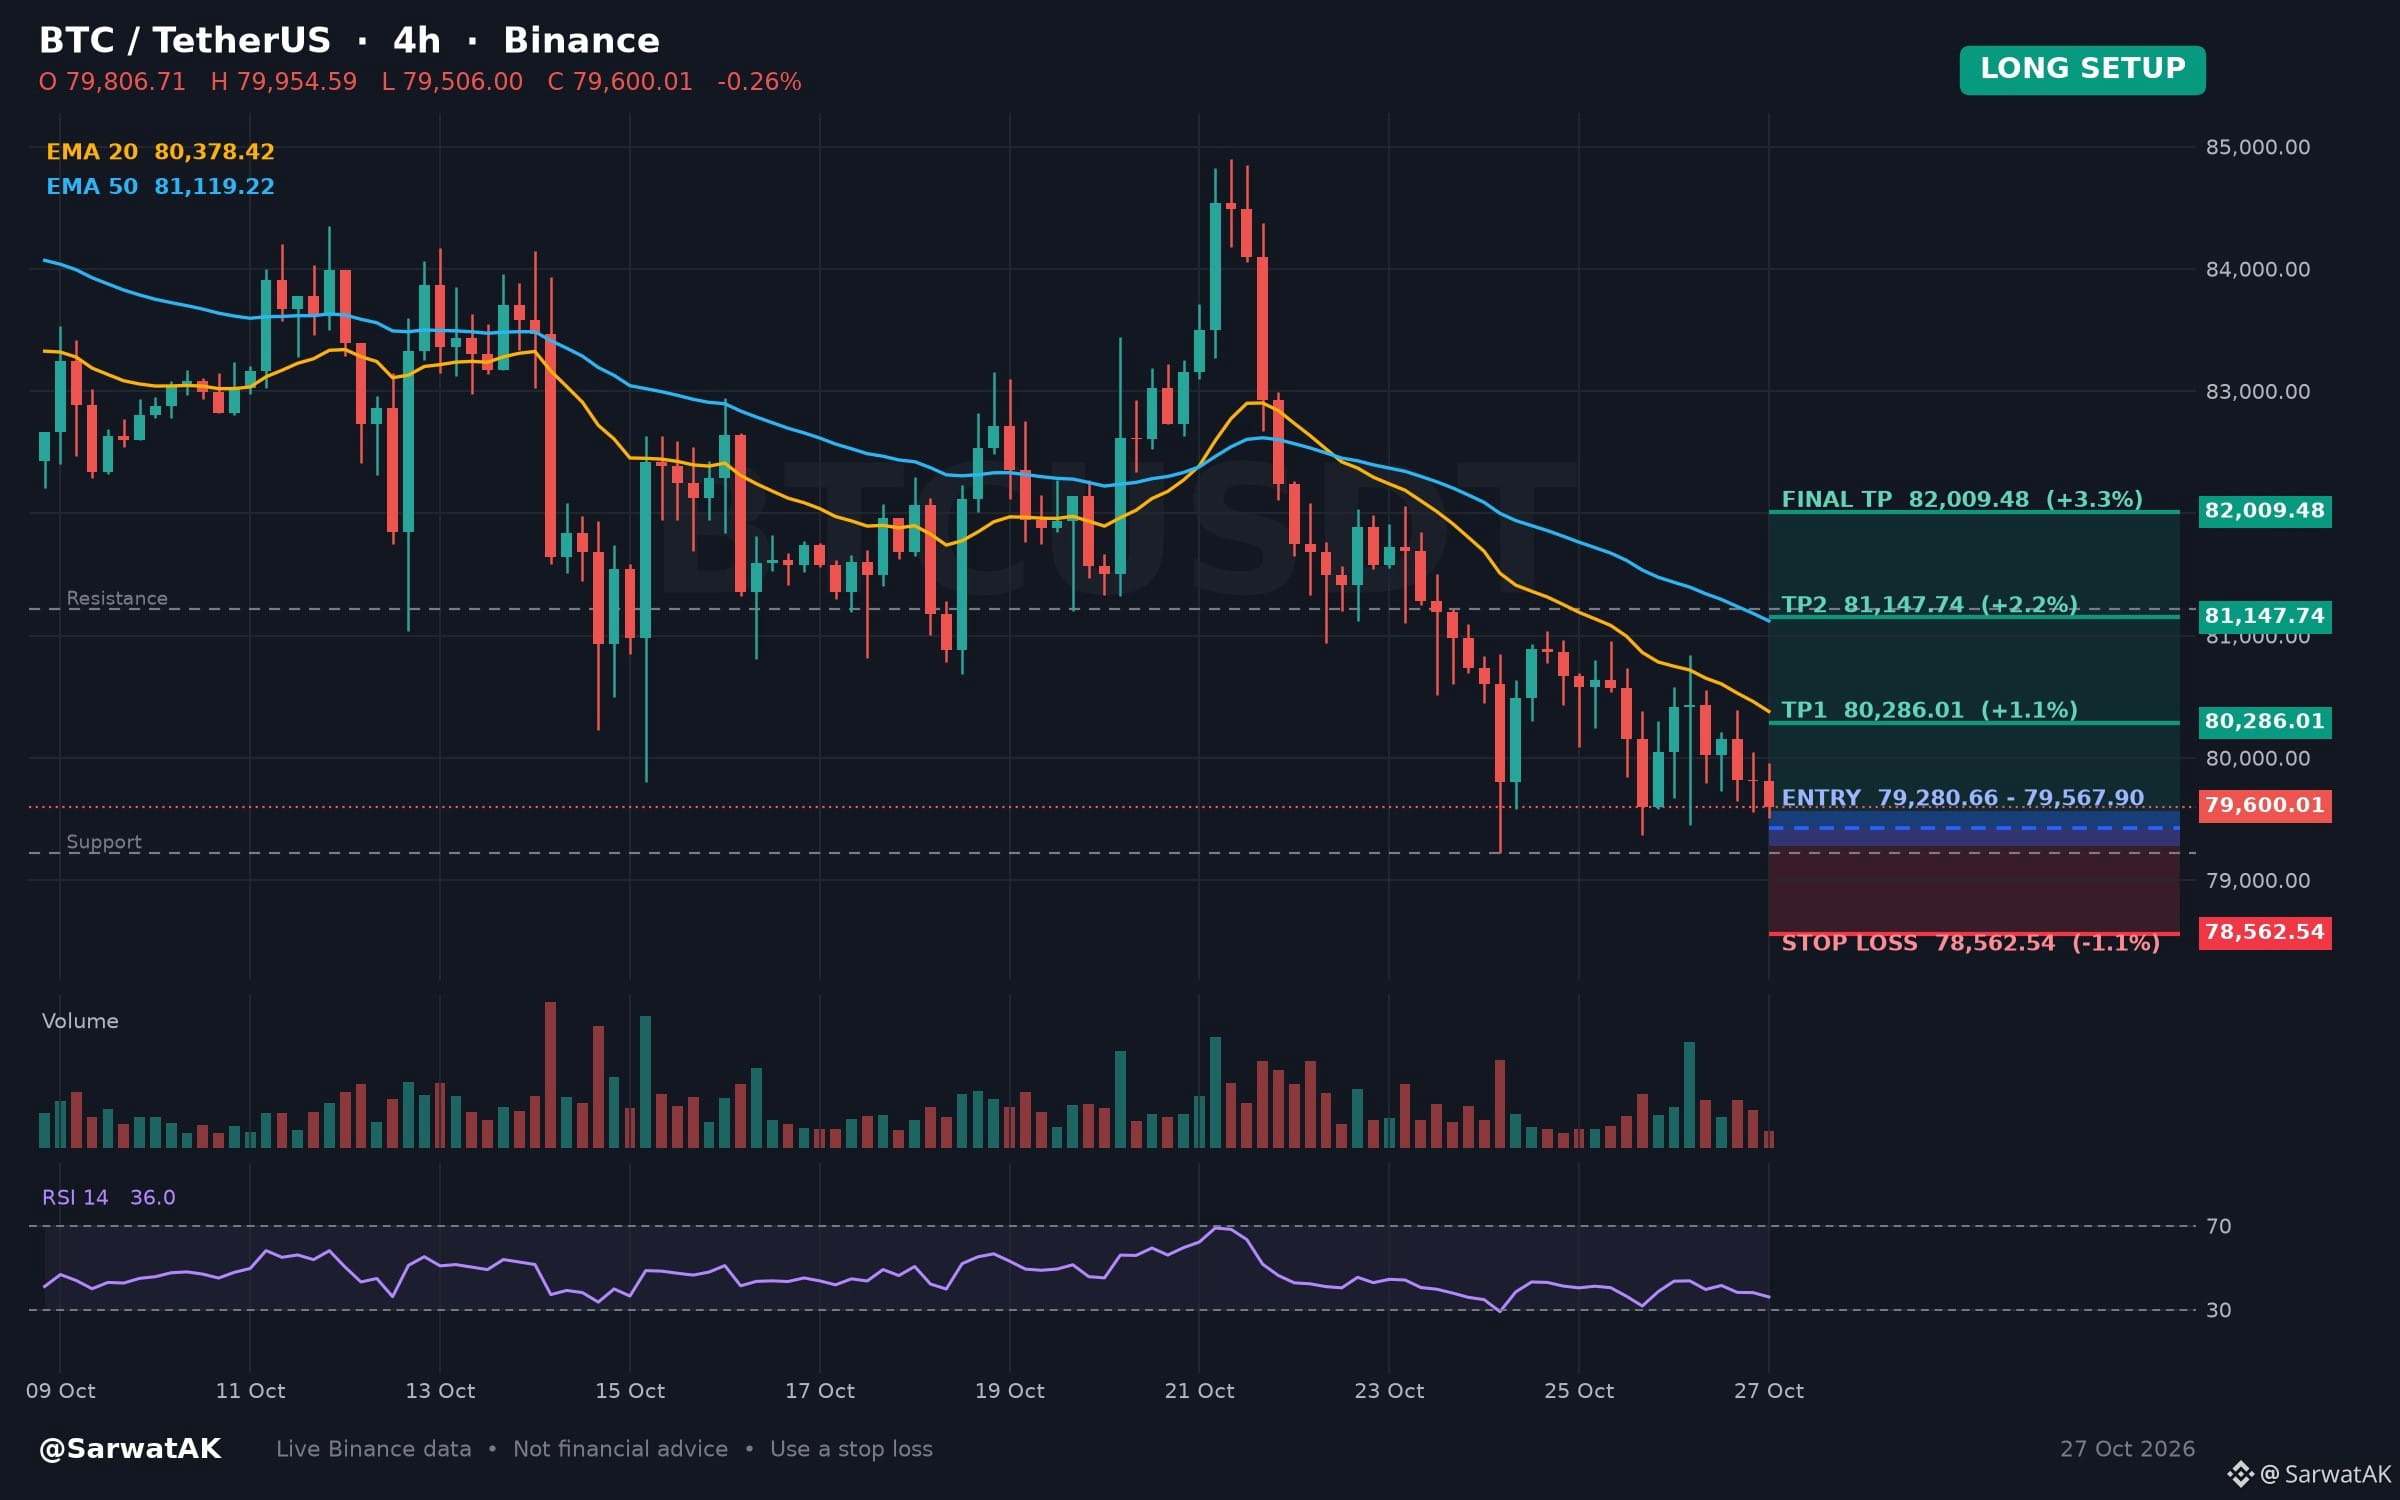
Haussier
$BTC LONG SETUP ... NEXT TARGET 82,009.48
Testing Key Swing Lows Amid Neutral Four Hour Momentum Conditions
Entry: 79,280.66 - 79,567.90 (Long)
TP1: 80,286.01
TP2: 81,147.74
Final TP: 82,009.48
SL: 78,562.54
Downward pressure over the past twenty-four hours brings price to test the twenty-candle swing low. Meanwhile, the four-hour RSI remains in the neutral zone, leaving the immediate trajectory dependent on how price reacts at this structural boundary.
As long as 79,280.66 holds, structure stays constructive
Must use stop loss while trading
Trade $BTC
Not financial advice. Always DYOR.
Like & Follow for Daily Trade Analytics & Insider News. @SarwatAK
#Bitcoin #Trending #TechnicalAnalysis
{future}(BTCUSDT)
$BTC LONG SETUP ... NEXT TARGET 82,009.48
Testing Key Swing Lows Amid Neutral Four Hour Momentum Conditions
Entry: 79,280.66 - 79,567.90 (Long)
TP1: 80,286.01
TP2: 81,147.74
Final TP: 82,009.48
SL: 78,562.54
Downward pressure over the past twenty-four hours brings price to test the twenty-candle swing low. Meanwhile, the four-hour RSI remains in the neutral zone, leaving the immediate trajectory dependent on how price reacts at this structural boundary.
As long as 79,280.66 holds, structure stays constructive
Must use stop loss while trading
Trade $BTC
Not financial advice. Always DYOR.
Like & Follow for Daily Trade Analytics & Insider News. @SarwatAK
#Bitcoin #Trending #TechnicalAnalysis
1
78
·
--
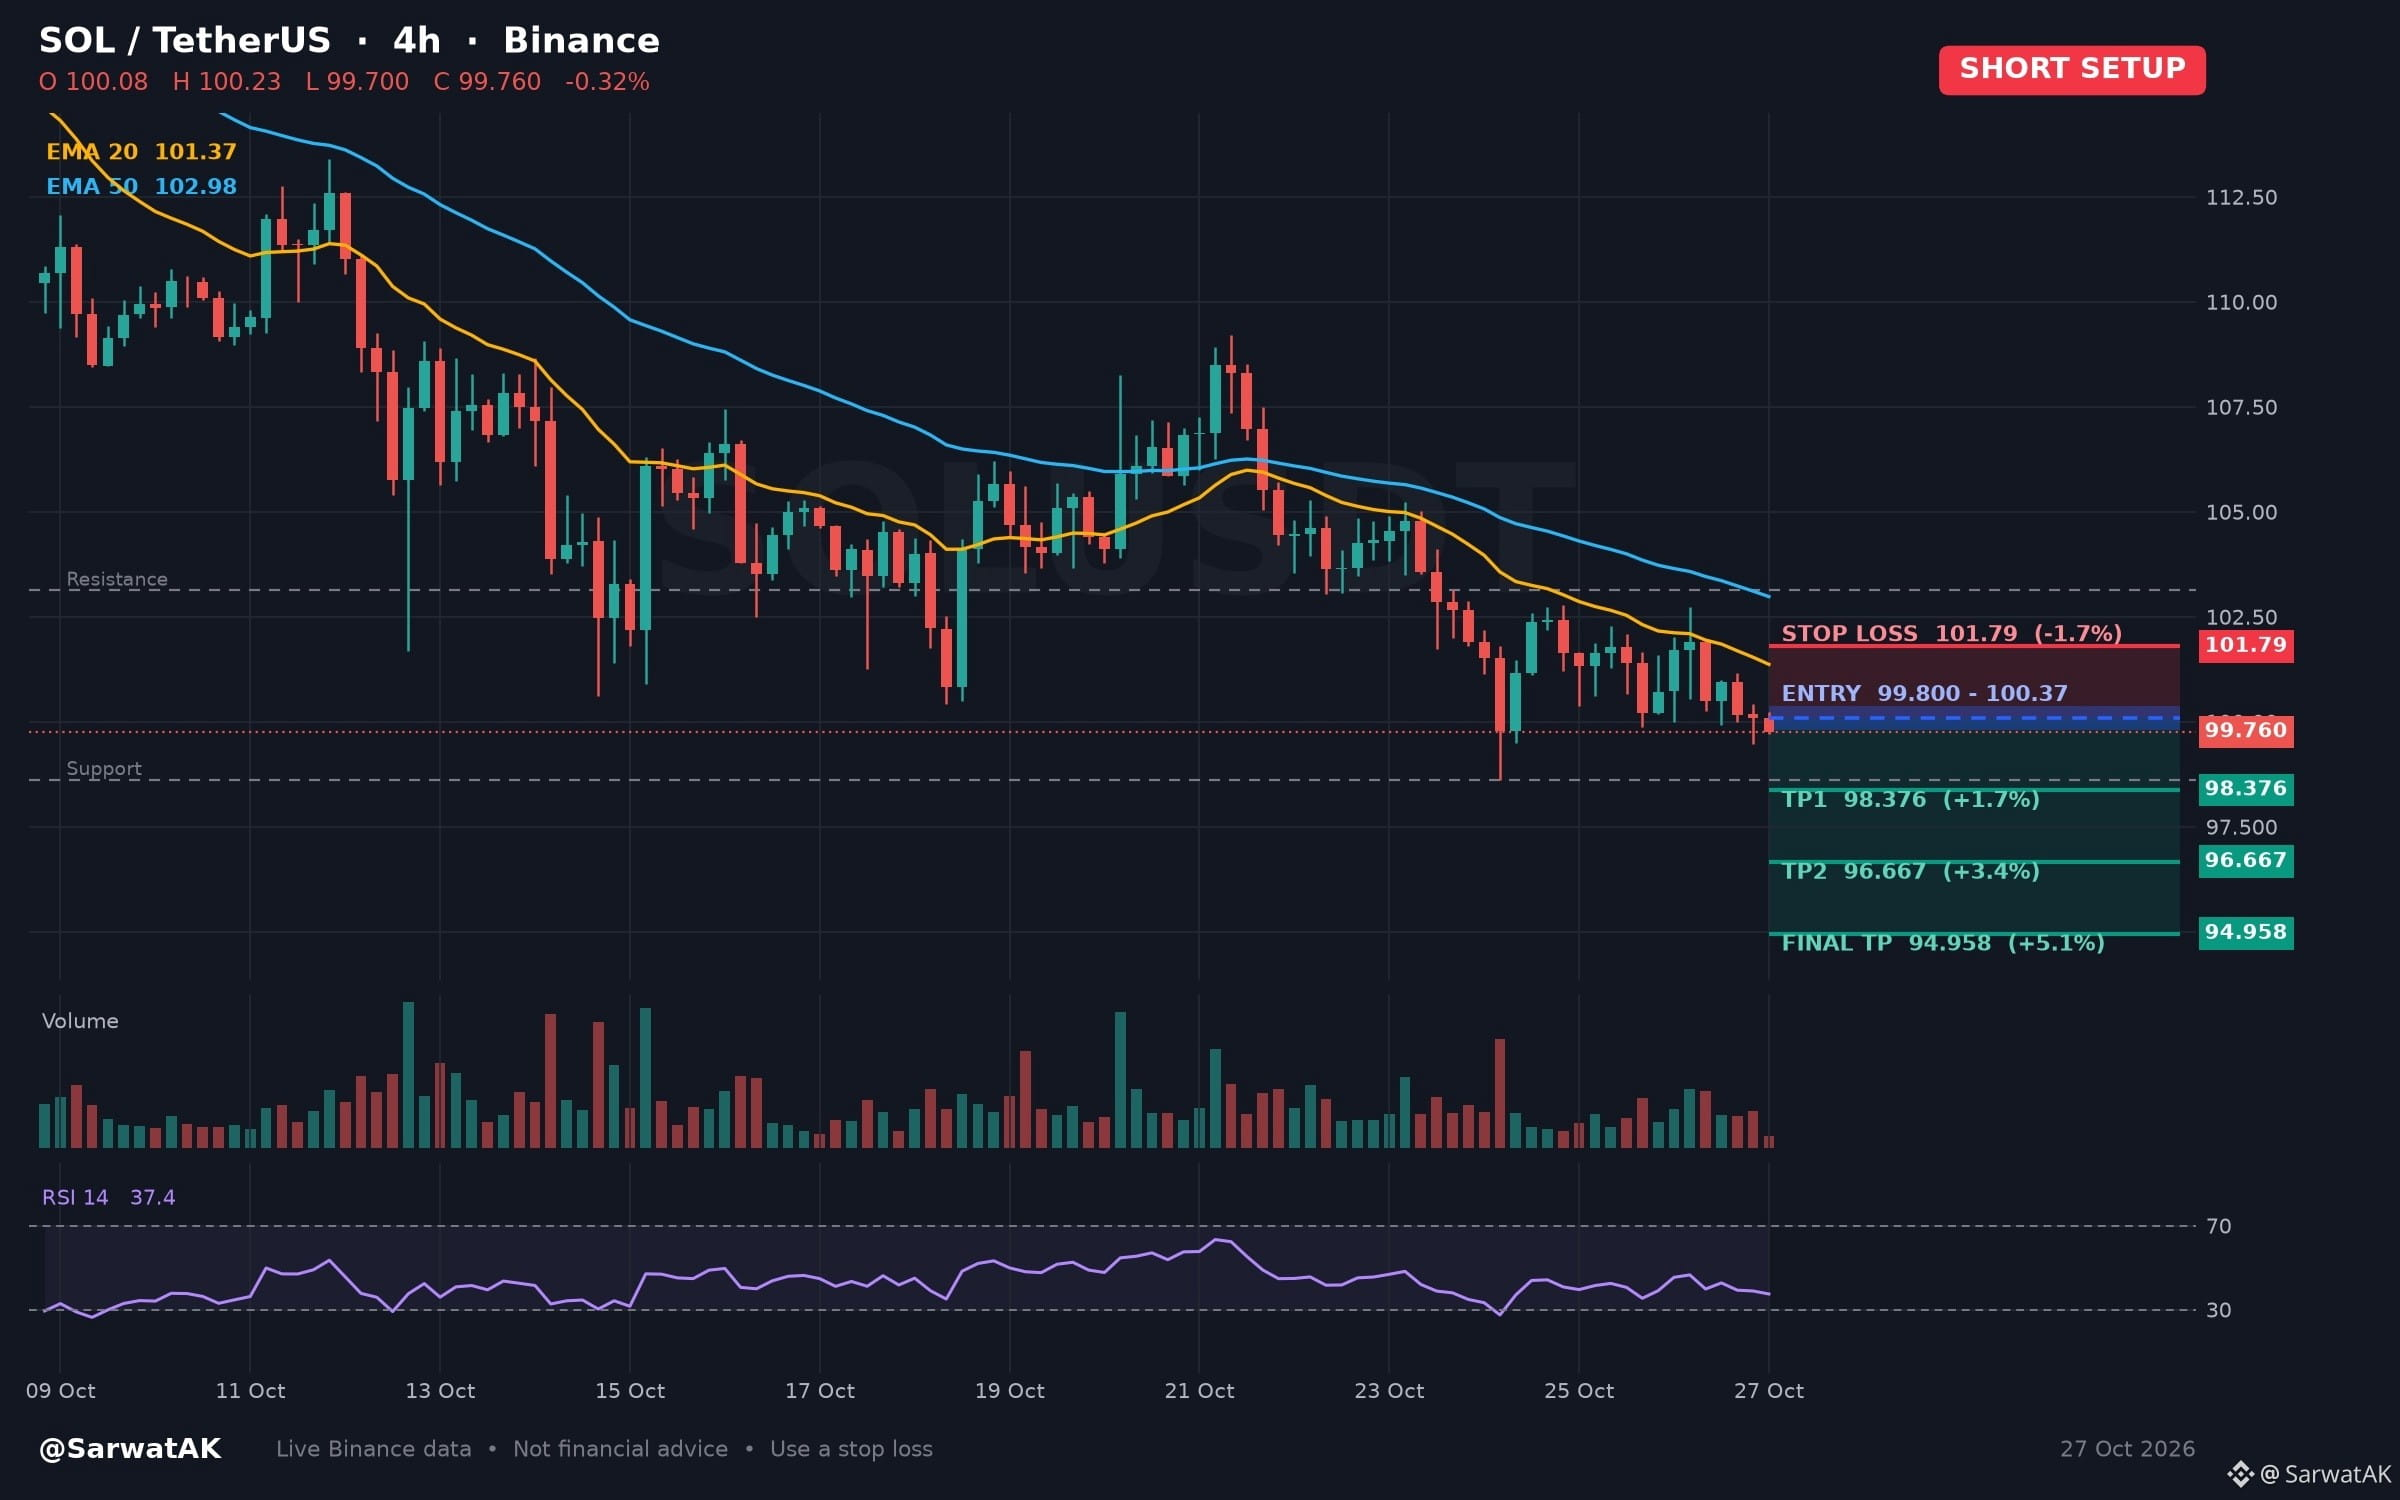
Baissier
$SOL SHORT SETUP ... NEXT TARGET 94.958
Bearish EMA Alignment with Neutral RSI
Entry: 99.800 - 100.37 (Short)
TP1: 98.376
TP2: 96.667
Final TP: 94.958
SL: 101.79
The price sits below the short-term EMA, and that EMA remains under the longer EMA on the four-hour chart. With the RSI in a neutral range and a downward move over the past twenty-four hours, momentum appears restrained.
As long as price stays below 100.37, structure stays heavy
Must use stop loss while trading
Trade $SOL
Not financial advice. Always DYOR.
Like & Follow for Daily Trade Analytics & Insider News. @SarwatAK
#Solana #HotTrends #TradingSignals
{spot}(SOLUSDT)
$SOL SHORT SETUP ... NEXT TARGET 94.958
Bearish EMA Alignment with Neutral RSI
Entry: 99.800 - 100.37 (Short)
TP1: 98.376
TP2: 96.667
Final TP: 94.958
SL: 101.79
The price sits below the short-term EMA, and that EMA remains under the longer EMA on the four-hour chart. With the RSI in a neutral range and a downward move over the past twenty-four hours, momentum appears restrained.
As long as price stays below 100.37, structure stays heavy
Must use stop loss while trading
Trade $SOL
Not financial advice. Always DYOR.
Like & Follow for Daily Trade Analytics & Insider News. @SarwatAK
#Solana #HotTrends #TradingSignals
88
·
--
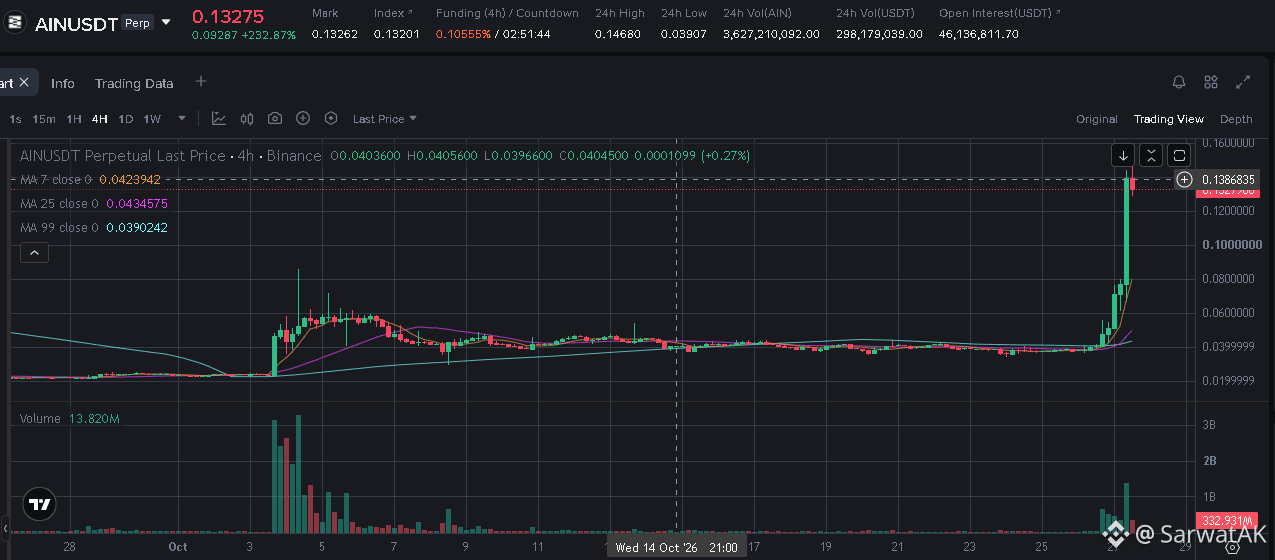
Baissier
$AIN SHORT SETUP ... NEXT TARGET 0.06
Neutral Relative Strength Amid Moving Average Bearish Alignment
Entry: 0.1351 - 0.140 (Short)
TP1: 0.12
TP2: 0.10
Final TP: 0.06
SL: 0.145
Must use stop loss while trading
Trade $AIN
Not financial advice. Always DYOR.
Like & Follow for Daily Trade Analytics & Insider News. @SarwatAK
#AIN #TradingSignals
{future}(AINUSDT)
$AIN SHORT SETUP ... NEXT TARGET 0.06
Neutral Relative Strength Amid Moving Average Bearish Alignment
Entry: 0.1351 - 0.140 (Short)
TP1: 0.12
TP2: 0.10
Final TP: 0.06
SL: 0.145
Must use stop loss while trading
Trade $AIN
Not financial advice. Always DYOR.
Like & Follow for Daily Trade Analytics & Insider News. @SarwatAK
#AIN #TradingSignals
280
·
--
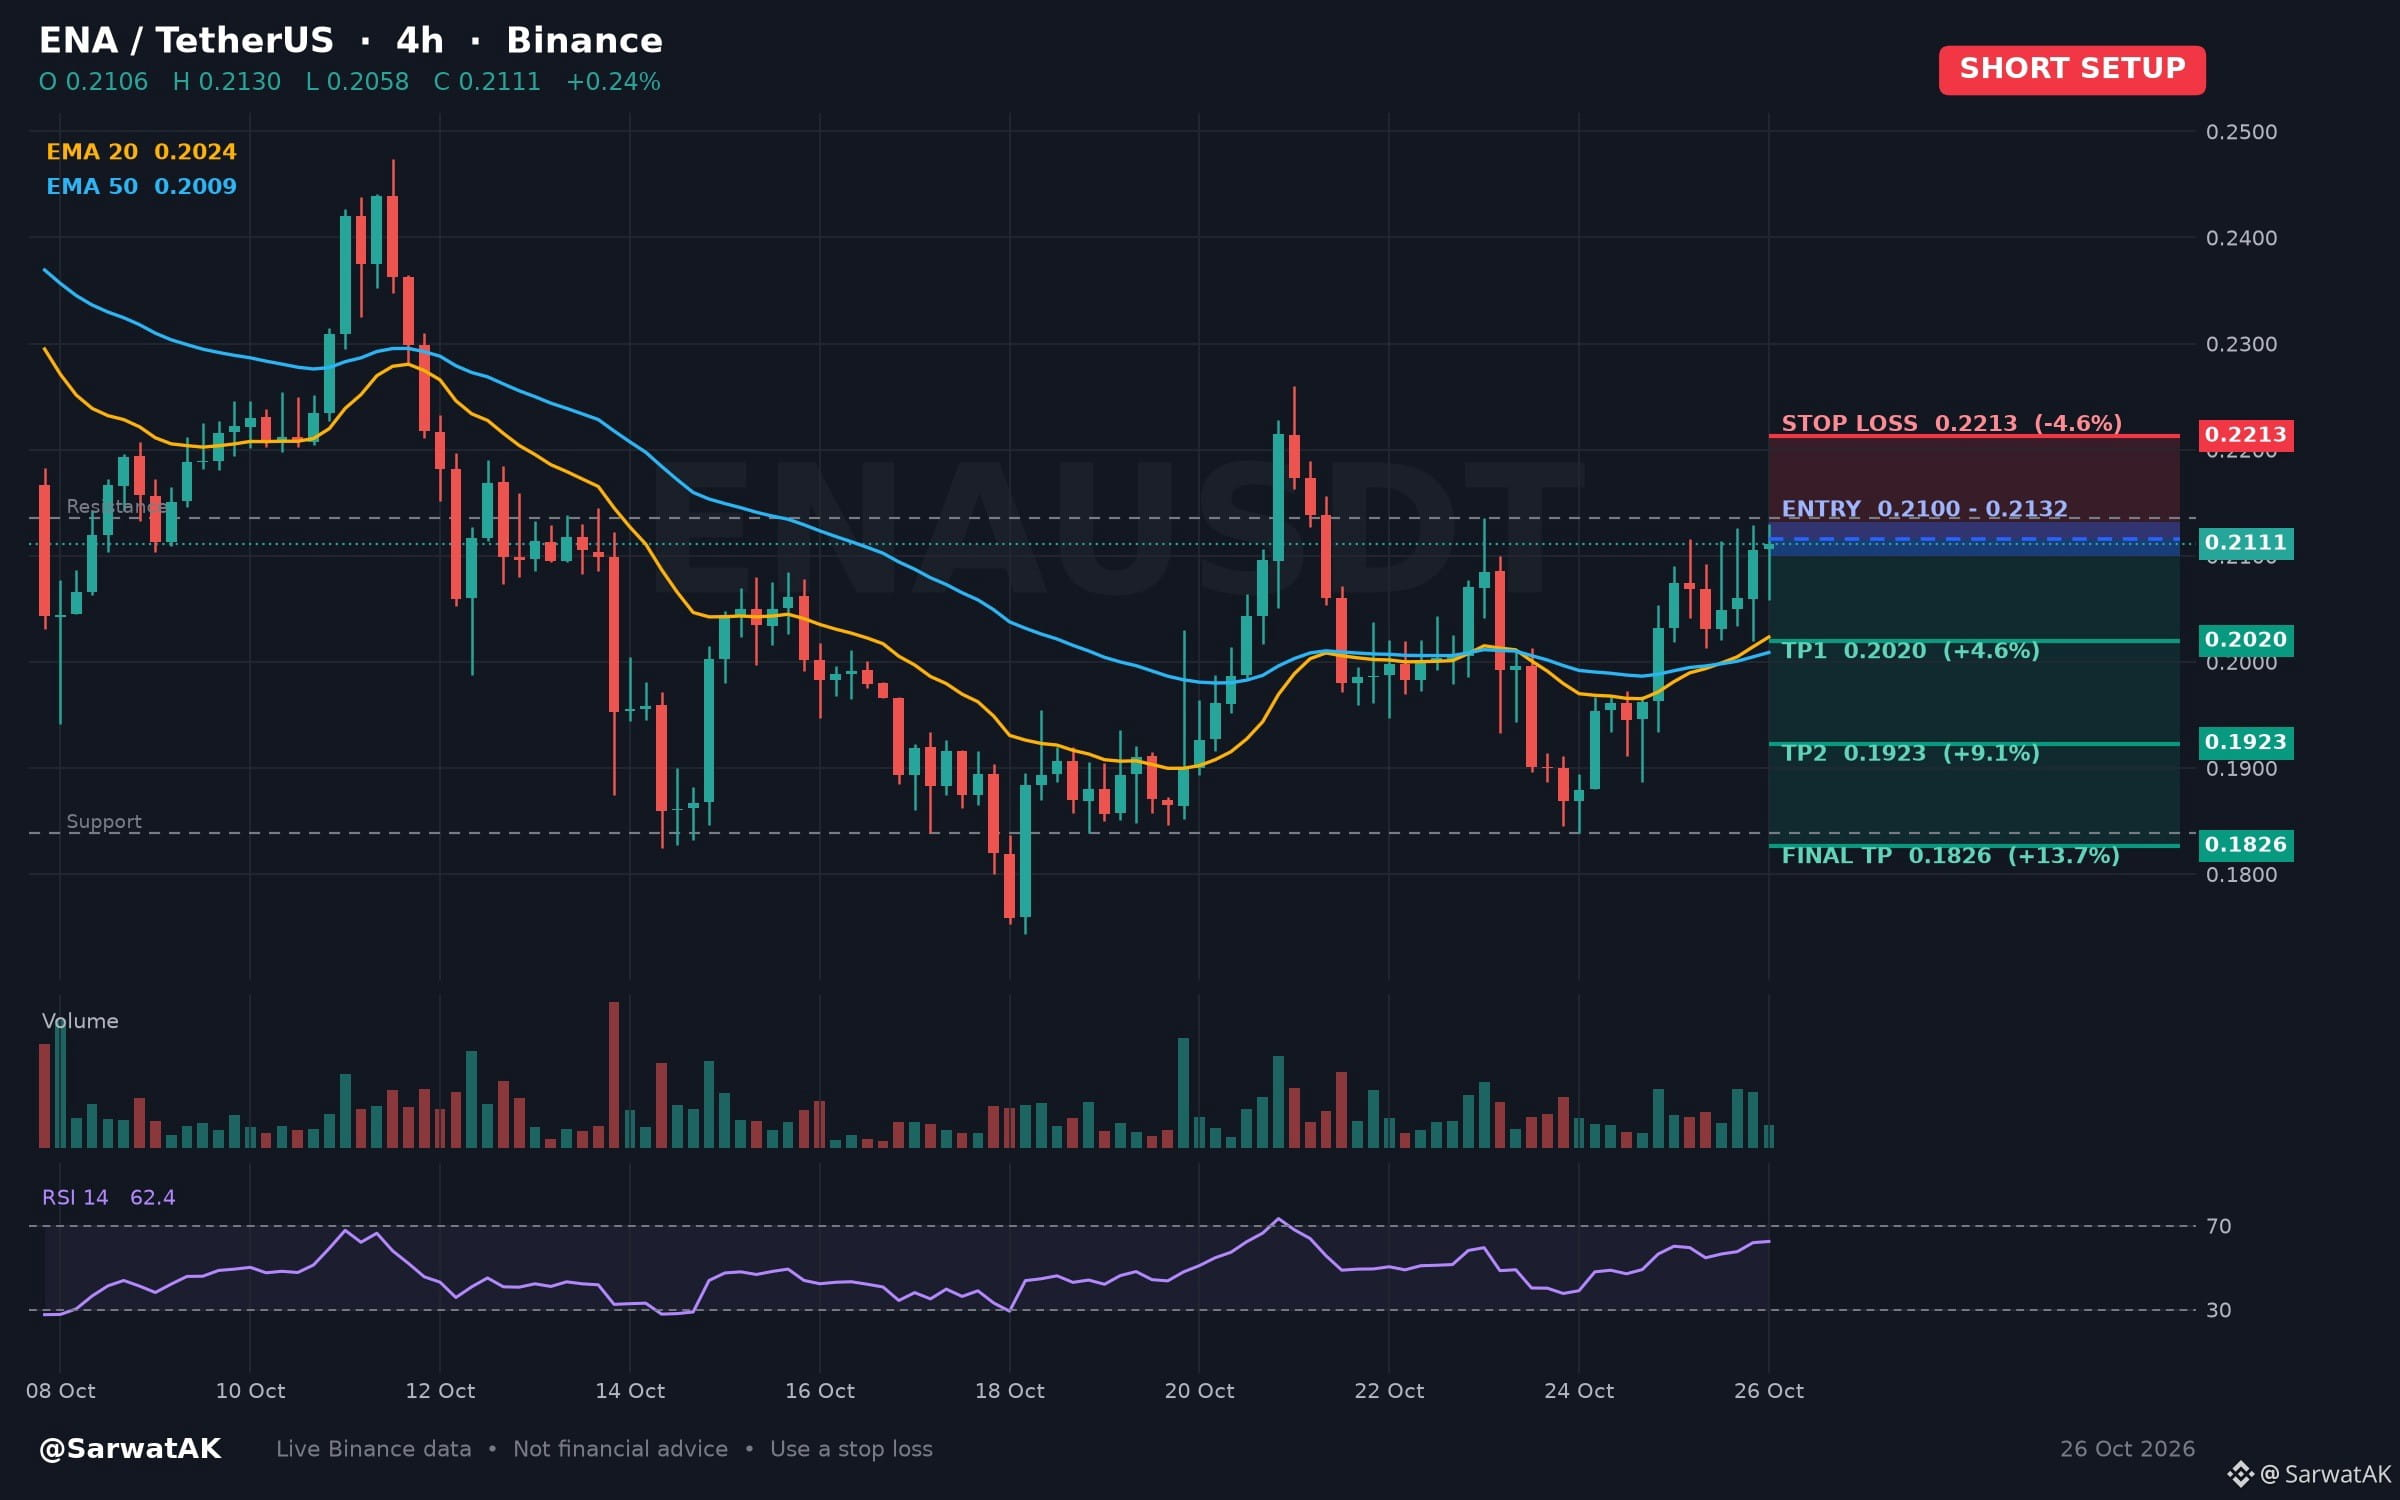
$ENA SHORT SETUP ... NEXT TARGET 0.1826
Swing High Test Accompanied by Neutral Four Hour Momentum
Entry: 0.2100 - 0.2132 (Short)
TP1: 0.2020
TP2: 0.1923
Final TP: 0.1826
SL: 0.2213
Upward trajectory over the past twenty-four hours has brought price to test its twenty-candle swing high. With the relative strength index on the four-hour chart remaining neutral, market participants watch whether price can sustain this level.
As long as price stays below 0.2132, structure stays heavy
Must use stop loss while trading
Trade $ENA
Not financial advice. Always DYOR.
Like & Follow for Daily Trade Analytics & Insider News. @SarwatAK
#ENA #Breakout #TrendingTopic
120
·
--
Baissier
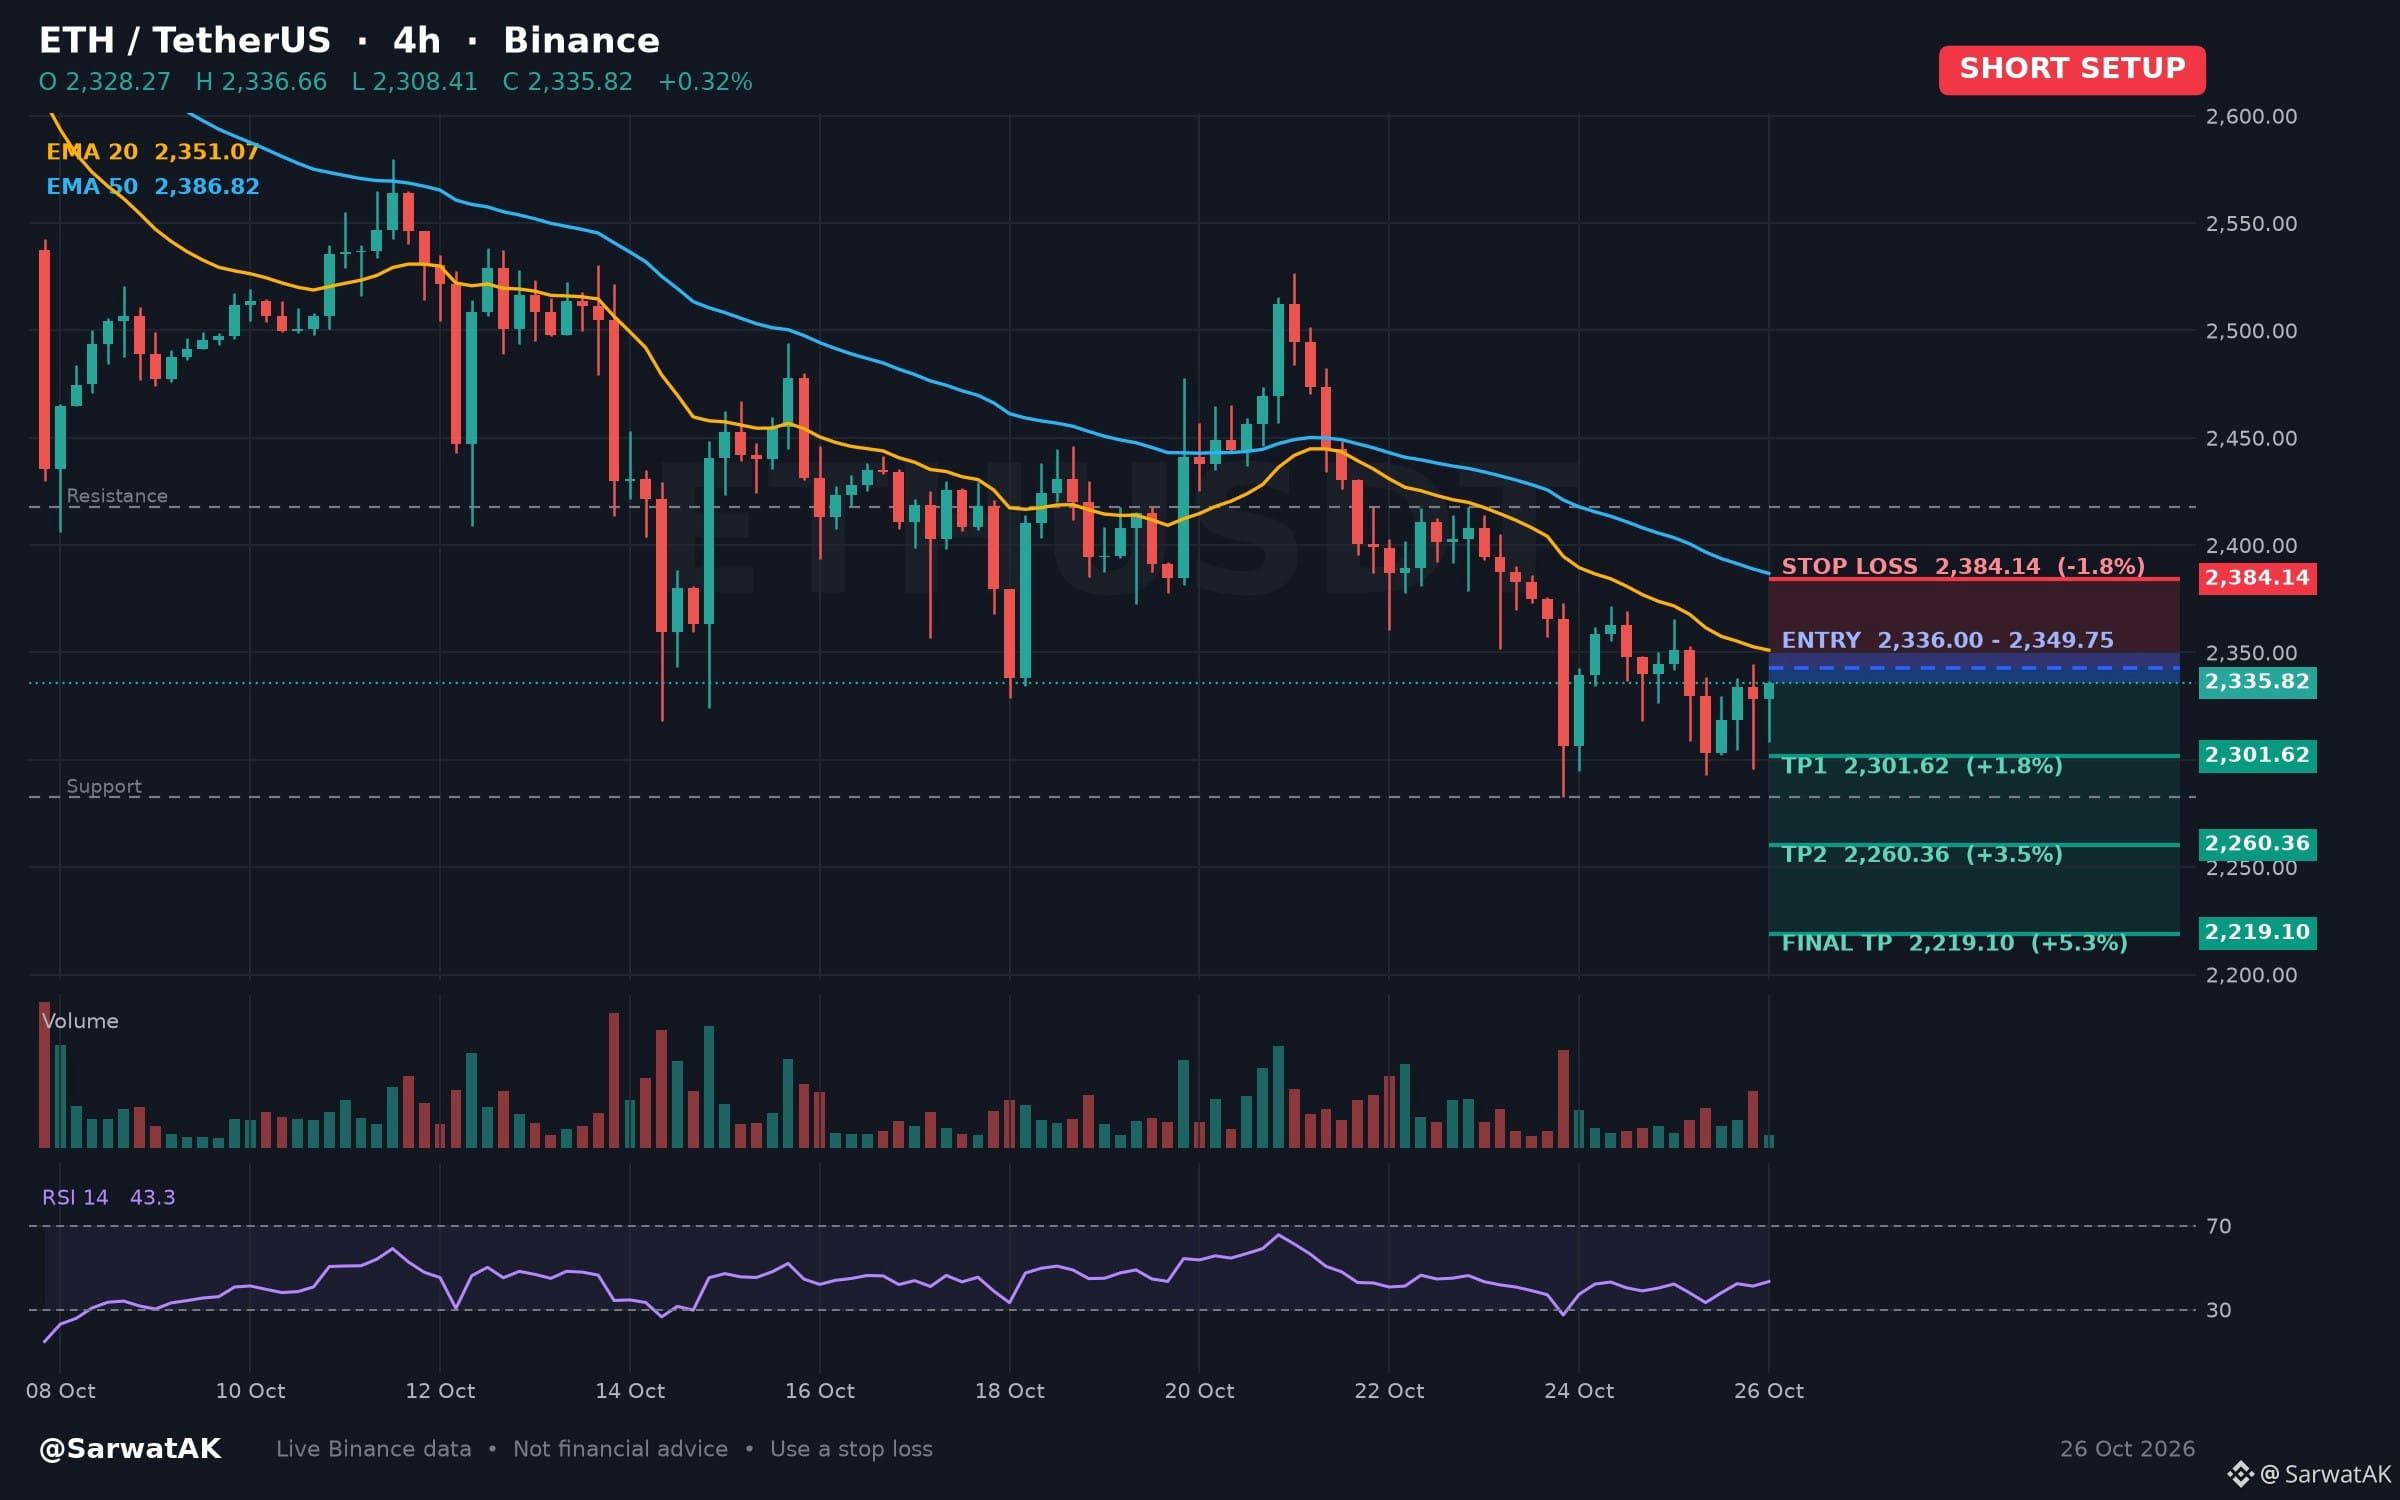
$ETH SHORT SETUP ... NEXT TARGET 2,219.10
Bearish EMA Alignment with Neutral Four-Hour RSI
Entry: 2,336.00 - 2,349.75 (Short)
TP1: 2,301.62
TP2: 2,260.36
Final TP: 2,219.10
SL: 2,384.14
The price sits beneath the short-term EMA, which itself is under the medium-term EMA, indicating a downtrend on the four-hour chart. Combined with a neutral four-hour RSI and a downward move over the past twenty-four hours, momentum appears limited.
As long as price stays below 2,349.75, structure stays heavy
Must use stop loss while trading
Trade $ETH
Not financial advice. Always DYOR.
Like & Follow for Daily Trade Analytics & Insider News. @SarwatAK
#Ethereum #BinancePick #EarningsSeason #AnthropicTTMRevenueGrewAbout1200%
{spot}(ETHUSDT)
$ETH SHORT SETUP ... NEXT TARGET 2,219.10
Bearish EMA Alignment with Neutral Four-Hour RSI
Entry: 2,336.00 - 2,349.75 (Short)
TP1: 2,301.62
TP2: 2,260.36
Final TP: 2,219.10
SL: 2,384.14
The price sits beneath the short-term EMA, which itself is under the medium-term EMA, indicating a downtrend on the four-hour chart. Combined with a neutral four-hour RSI and a downward move over the past twenty-four hours, momentum appears limited.
As long as price stays below 2,349.75, structure stays heavy
Must use stop loss while trading
Trade $ETH
Not financial advice. Always DYOR.
Like & Follow for Daily Trade Analytics & Insider News. @SarwatAK
#Ethereum #BinancePick #EarningsSeason #AnthropicTTMRevenueGrewAbout1200%
42
·
--
Haussier
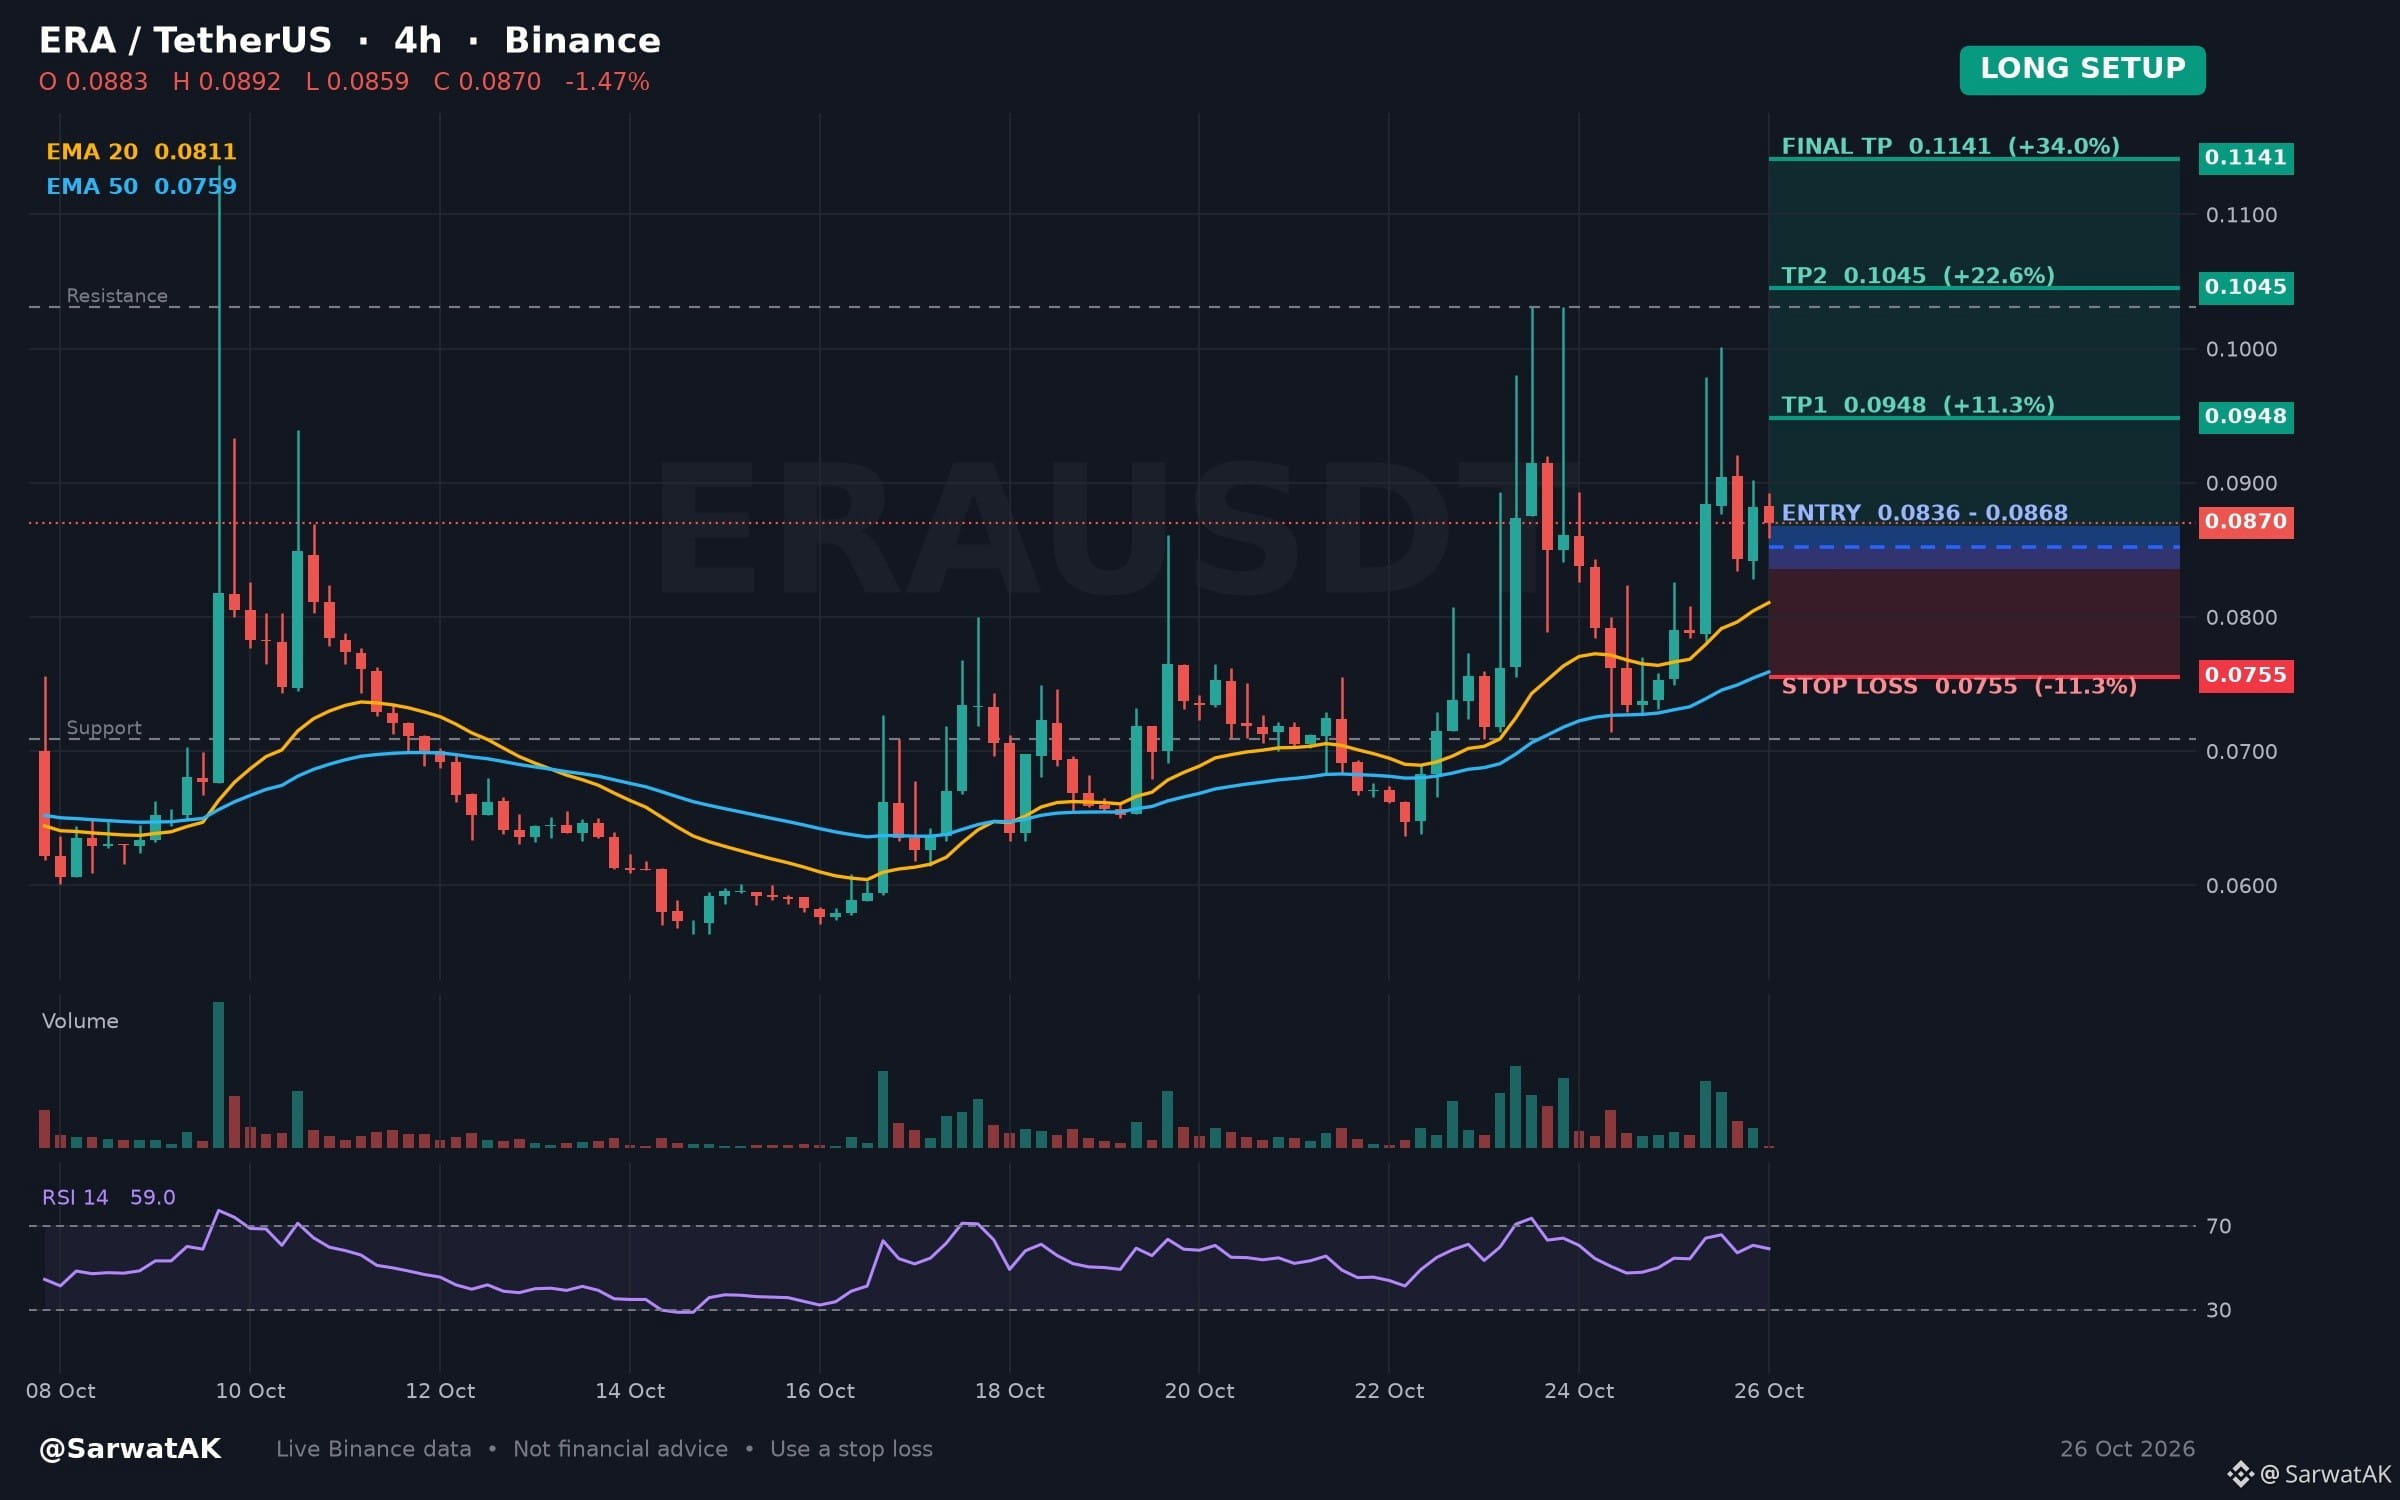
$ERA LONG SETUP ... NEXT TARGET 0.1141
Moving Average Alignment Reflects Steady Structure on Four-Hour Chart
Entry: 0.0836 - 0.0868 (Long)
TP1: 0.0948
TP2: 0.1045
Final TP: 0.1141
SL: 0.0755
Price sits above the faster exponential moving average, which remains above the slower average after upward movement over the past twenty-four hours. With the four-hour relative strength index in the neutral zone, traders observe whether momentum persists.
As long as 0.0836 holds, structure stays constructive
Must use stop loss while trading
Trade $ERA
Not financial advice. Always DYOR.
Like & Follow for Daily Trade Analytics & Insider News. @SarwatAK
#ERA #HotTrends #TradingSignals
{spot}(ERAUSDT)
$ERA LONG SETUP ... NEXT TARGET 0.1141
Moving Average Alignment Reflects Steady Structure on Four-Hour Chart
Entry: 0.0836 - 0.0868 (Long)
TP1: 0.0948
TP2: 0.1045
Final TP: 0.1141
SL: 0.0755
Price sits above the faster exponential moving average, which remains above the slower average after upward movement over the past twenty-four hours. With the four-hour relative strength index in the neutral zone, traders observe whether momentum persists.
As long as 0.0836 holds, structure stays constructive
Must use stop loss while trading
Trade $ERA
Not financial advice. Always DYOR.
Like & Follow for Daily Trade Analytics & Insider News. @SarwatAK
#ERA #HotTrends #TradingSignals
45
Connectez-vous pour découvrir plus de contenu
Rejoignez la communauté mondiale des adeptes de cryptomonnaies sur Binance Square
⚡️ Suviez les dernières informations importantes sur les cryptomonnaies.
💬 Jugé digne de confiance par la plus grande plateforme d’échange de cryptomonnaies au monde.
👍 Découvrez les connaissances que partagent les créateurs vérifiés.
Adresse e-mail/Nº de téléphone