

Pelin Ay
3.5k Publications

Pelin Ay
Signaler
Bloquer l’utilisateur
Yazar/Analist/Trader
Trade régulièrement
5.8 an(s)
30 Suivis
5.5K+ Abonnés
7.1K+ J’aime
Publications
Tous
Citations
Vidéos
·
--
📈 $PYTH · 1H
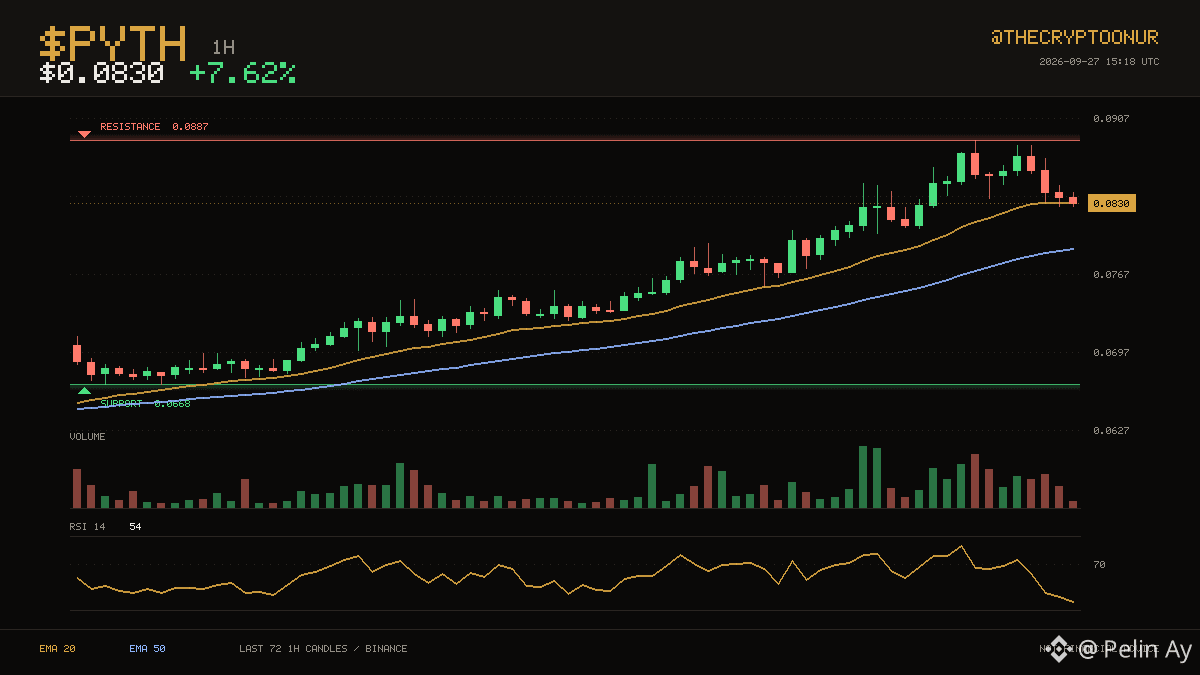
$PYTH is at $0.0830, with one average above price and one below. The three day range runs from $0.0668 up to $0.0887. It is trading in the top third of the range right now. Resistance is the near one at 6.9% above; support is far below and not in play. Averages have been ordered the same way for a long stretch now, with the 20 above the 50. Momentum is mid range with RSI at 54. The 24 hour range runs $0.0757 to $0.0887, and price is around the middle of it. Volume is close to normal at 1.5x the recent average. Up 7.6% over 24 hours.
DYOR
$PYTH #Crypto
📈 $PYTH · 1H
$PYTH is at $0.0830, with one average above price and one below. The three day range runs from $0.0668 up to $0.0887. It is trading in the top third of the range right now. Resistance is the near one at 6.9% above; support is far below and not in play. Averages have been ordered the same way for a long stretch now, with the 20 above the 50. Momentum is mid range with RSI at 54. The 24 hour range runs $0.0757 to $0.0887, and price is around the middle of it. Volume is close to normal at 1.5x the recent average. Up 7.6% over 24 hours.
DYOR
$PYTH #Crypto
$PYTH is at $0.0830, with one average above price and one below. The three day range runs from $0.0668 up to $0.0887. It is trading in the top third of the range right now. Resistance is the near one at 6.9% above; support is far below and not in play. Averages have been ordered the same way for a long stretch now, with the 20 above the 50. Momentum is mid range with RSI at 54. The 24 hour range runs $0.0757 to $0.0887, and price is around the middle of it. Volume is close to normal at 1.5x the recent average. Up 7.6% over 24 hours.
DYOR
$PYTH #Crypto
2
1
883
·
--
Partiellement vrai
What's Behind the Sharp Rise in SOON?
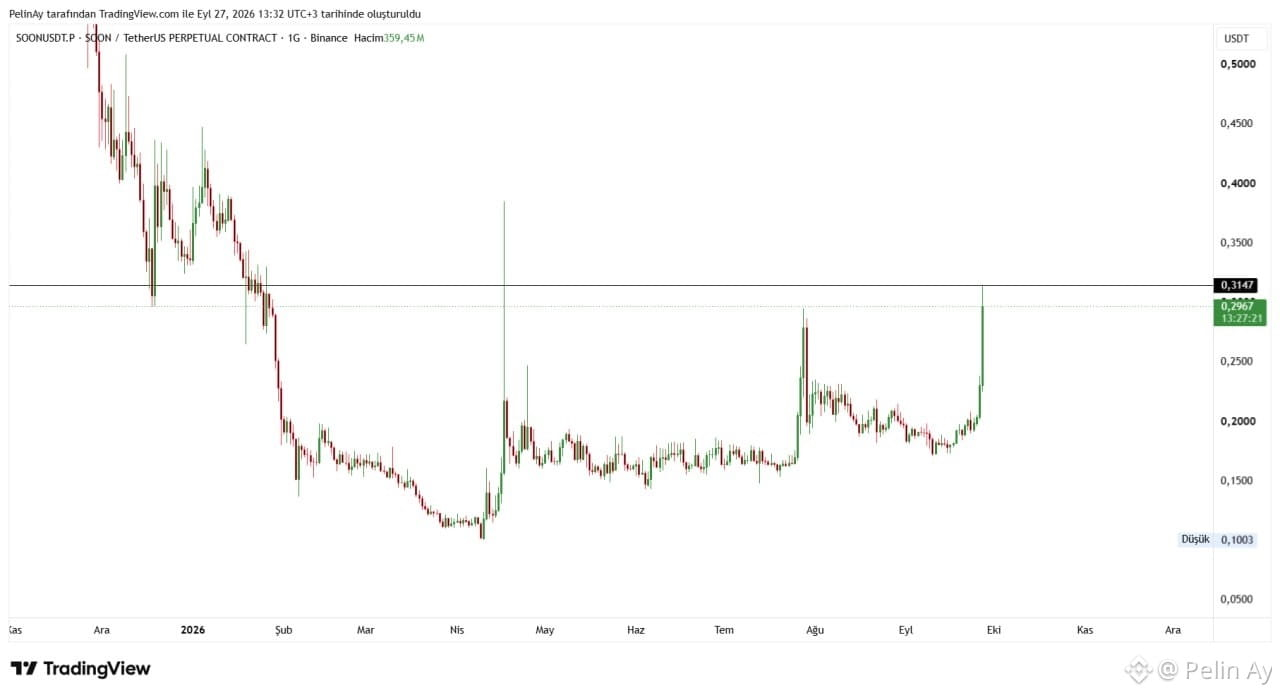
In the SOON chart, we see a very sharp upward breakout, especially in the recent period, following a long consolidation in the $0.18-$0.20 range. The price quickly rose from approximately $0.18 to $0.2967, a movement of over 60%. Moreover, the formation of a long wick testing the $0.3147 resistance level on the daily candle indicates the presence of significant sell orders in this area.
One of the most important developments that could explain this movement is the unlock of 20.24 million SOON tokens on September 23rd. This amount represented approximately 3.6% of the circulating supply. The fact that the price rose strongly again after this unlock, which initially created selling pressure, suggests that the market may have absorbed the selling pressure.
Besides this, the core story of SOON continues. The project runs on an SVM-based rollup infrastructure on Ethereum, BNB Chain, and Base; The TON-Solana connection via InterSOON is also active. This multi-L1 approach is one of the factors that could provide speculative demand for SOON, especially if the SVM narrative regains interest.
CMC's September 26th analysis also states that there is no specific confirmed factor for the uptrend and that the movement may have been strengthened by low speculative flows. Therefore, it may be more accurate to evaluate the current movement due to decreased selling pressure after the unlock, low liquidity, a technical breakout, and speculative transactions.
On the chart, $0.3147 is a critical resistance. A daily close above this region could strengthen the continuation of the breakout; however, a rejection from here could lead to profit-taking towards the $0.25-$0.26 and then the $0.20-$0.22 region. Especially given the high Binance volume on the chart, it should be considered that the movement may have been amplified not only by spot demand but also by leveraged trading. $SOON #SOON
What's Behind the Sharp Rise in SOON?
In the SOON chart, we see a very sharp upward breakout, especially in the recent period, following a long consolidation in the $0.18-$0.20 range. The price quickly rose from approximately $0.18 to $0.2967, a movement of over 60%. Moreover, the formation of a long wick testing the $0.3147 resistance level on the daily candle indicates the presence of significant sell orders in this area.
One of the most important developments that could explain this movement is the unlock of 20.24 million SOON tokens on September 23rd. This amount represented approximately 3.6% of the circulating supply. The fact that the price rose strongly again after this unlock, which initially created selling pressure, suggests that the market may have absorbed the selling pressure.
Besides this, the core story of SOON continues. The project runs on an SVM-based rollup infrastructure on Ethereum, BNB Chain, and Base; The TON-Solana connection via InterSOON is also active. This multi-L1 approach is one of the factors that could provide speculative demand for SOON, especially if the SVM narrative regains interest.
CMC's September 26th analysis also states that there is no specific confirmed factor for the uptrend and that the movement may have been strengthened by low speculative flows. Therefore, it may be more accurate to evaluate the current movement due to decreased selling pressure after the unlock, low liquidity, a technical breakout, and speculative transactions.
On the chart, $0.3147 is a critical resistance. A daily close above this region could strengthen the continuation of the breakout; however, a rejection from here could lead to profit-taking towards the $0.25-$0.26 and then the $0.20-$0.22 region. Especially given the high Binance volume on the chart, it should be considered that the movement may have been amplified not only by spot demand but also by leveraged trading. $SOON #SOON
In the SOON chart, we see a very sharp upward breakout, especially in the recent period, following a long consolidation in the $0.18-$0.20 range. The price quickly rose from approximately $0.18 to $0.2967, a movement of over 60%. Moreover, the formation of a long wick testing the $0.3147 resistance level on the daily candle indicates the presence of significant sell orders in this area.
One of the most important developments that could explain this movement is the unlock of 20.24 million SOON tokens on September 23rd. This amount represented approximately 3.6% of the circulating supply. The fact that the price rose strongly again after this unlock, which initially created selling pressure, suggests that the market may have absorbed the selling pressure.
Besides this, the core story of SOON continues. The project runs on an SVM-based rollup infrastructure on Ethereum, BNB Chain, and Base; The TON-Solana connection via InterSOON is also active. This multi-L1 approach is one of the factors that could provide speculative demand for SOON, especially if the SVM narrative regains interest.
CMC's September 26th analysis also states that there is no specific confirmed factor for the uptrend and that the movement may have been strengthened by low speculative flows. Therefore, it may be more accurate to evaluate the current movement due to decreased selling pressure after the unlock, low liquidity, a technical breakout, and speculative transactions.
On the chart, $0.3147 is a critical resistance. A daily close above this region could strengthen the continuation of the breakout; however, a rejection from here could lead to profit-taking towards the $0.25-$0.26 and then the $0.20-$0.22 region. Especially given the high Binance volume on the chart, it should be considered that the movement may have been amplified not only by spot demand but also by leveraged trading. $SOON #SOON
1
736
·
--
📈 $DOT · 1H
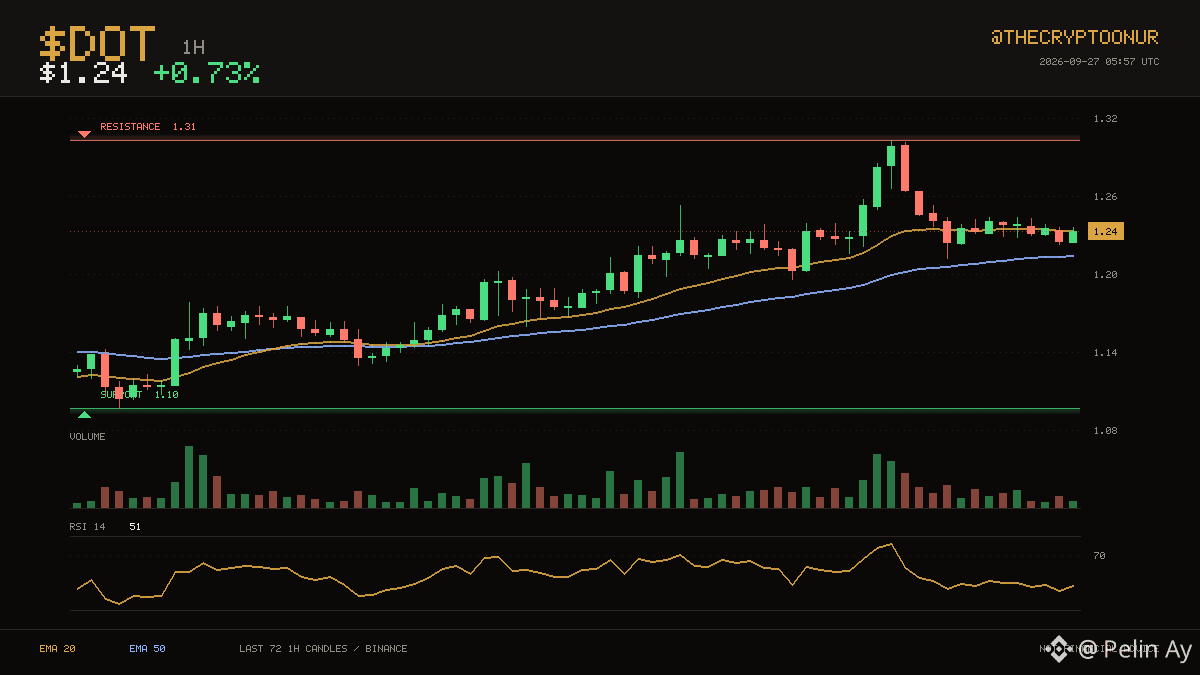
$DOT is at $1.24, with one average above price and one below. The three day range runs from $1.10 up to $1.31. Price is holding in the upper third of that range. That is 5.7% to the ceiling and 11.2% to the floor. The 20 has stayed above the 50 for 58 candles. RSI at 51 is neutral, so momentum is not blocking a move either way. Over the past day it has traded between $1.20 and $1.31, sitting around the middle of it now. Turnover is unremarkable, running 1.0x the recent average. The 20 average is at $1.24 and the 50 at $1.22. Up 0.7% over 24 hours.
DYOR
$DOT #Trading
📈 $DOT · 1H
$DOT is at $1.24, with one average above price and one below. The three day range runs from $1.10 up to $1.31. Price is holding in the upper third of that range. That is 5.7% to the ceiling and 11.2% to the floor. The 20 has stayed above the 50 for 58 candles. RSI at 51 is neutral, so momentum is not blocking a move either way. Over the past day it has traded between $1.20 and $1.31, sitting around the middle of it now. Turnover is unremarkable, running 1.0x the recent average. The 20 average is at $1.24 and the 50 at $1.22. Up 0.7% over 24 hours.
DYOR
$DOT #Trading
$DOT is at $1.24, with one average above price and one below. The three day range runs from $1.10 up to $1.31. Price is holding in the upper third of that range. That is 5.7% to the ceiling and 11.2% to the floor. The 20 has stayed above the 50 for 58 candles. RSI at 51 is neutral, so momentum is not blocking a move either way. Over the past day it has traded between $1.20 and $1.31, sitting around the middle of it now. Turnover is unremarkable, running 1.0x the recent average. The 20 average is at $1.24 and the 50 at $1.22. Up 0.7% over 24 hours.
DYOR
$DOT #Trading
2
7
5.6k
·
--
🟢 $GRAM · 1H
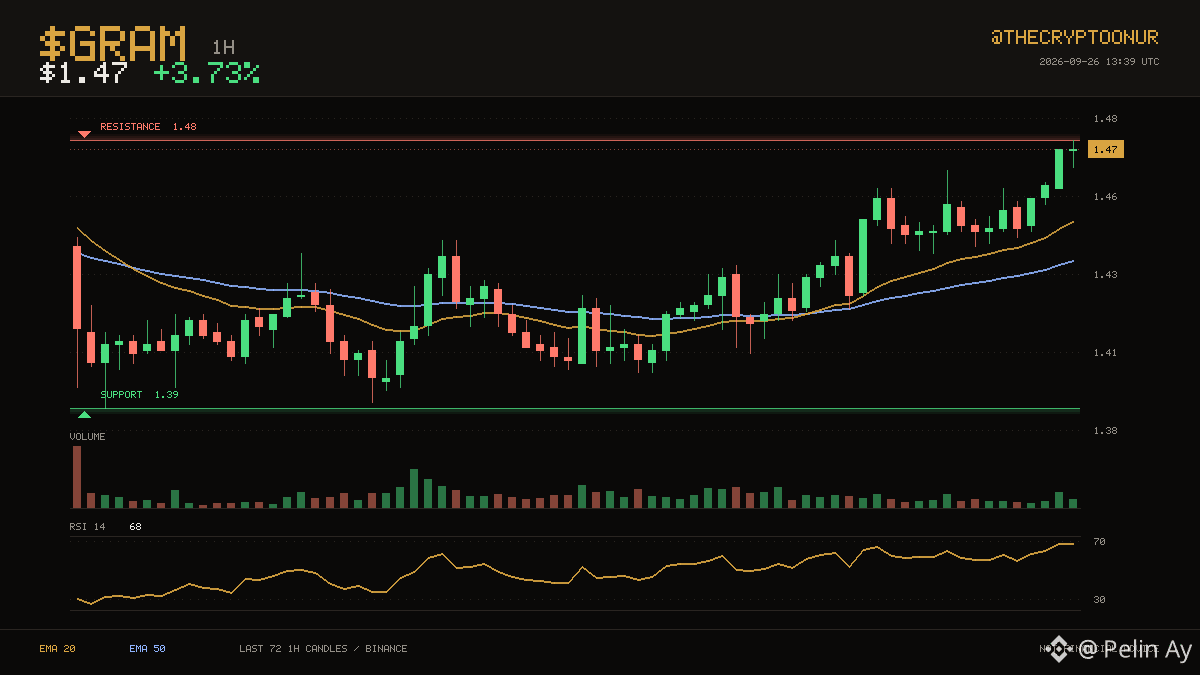
$1.47 keeps $GRAM on the stronger side of its hourly averages. The last three days topped out near $1.48, and price is pressing that area again. It is trading in the top third of the range right now. Resistance is only 0.2% away, so there is not much room before it matters. Averages have been ordered the same way for only 19 candles, with the 20 above the 50. Momentum is mid range with RSI at 68. The 24 hour range runs $1.41 to $1.48, and price is near the top of it. Volume is close to normal at 0.8x the recent average. Up 3.7% over 24 hours.
DYOR
$GRAM #Crypto
🟢 $GRAM · 1H
$1.47 keeps $GRAM on the stronger side of its hourly averages. The last three days topped out near $1.48, and price is pressing that area again. It is trading in the top third of the range right now. Resistance is only 0.2% away, so there is not much room before it matters. Averages have been ordered the same way for only 19 candles, with the 20 above the 50. Momentum is mid range with RSI at 68. The 24 hour range runs $1.41 to $1.48, and price is near the top of it. Volume is close to normal at 0.8x the recent average. Up 3.7% over 24 hours.
DYOR
$GRAM #Crypto
$1.47 keeps $GRAM on the stronger side of its hourly averages. The last three days topped out near $1.48, and price is pressing that area again. It is trading in the top third of the range right now. Resistance is only 0.2% away, so there is not much room before it matters. Averages have been ordered the same way for only 19 candles, with the 20 above the 50. Momentum is mid range with RSI at 68. The 24 hour range runs $1.41 to $1.48, and price is near the top of it. Volume is close to normal at 0.8x the recent average. Up 3.7% over 24 hours.
DYOR
$GRAM #Crypto
2
1
1.3k
·
--
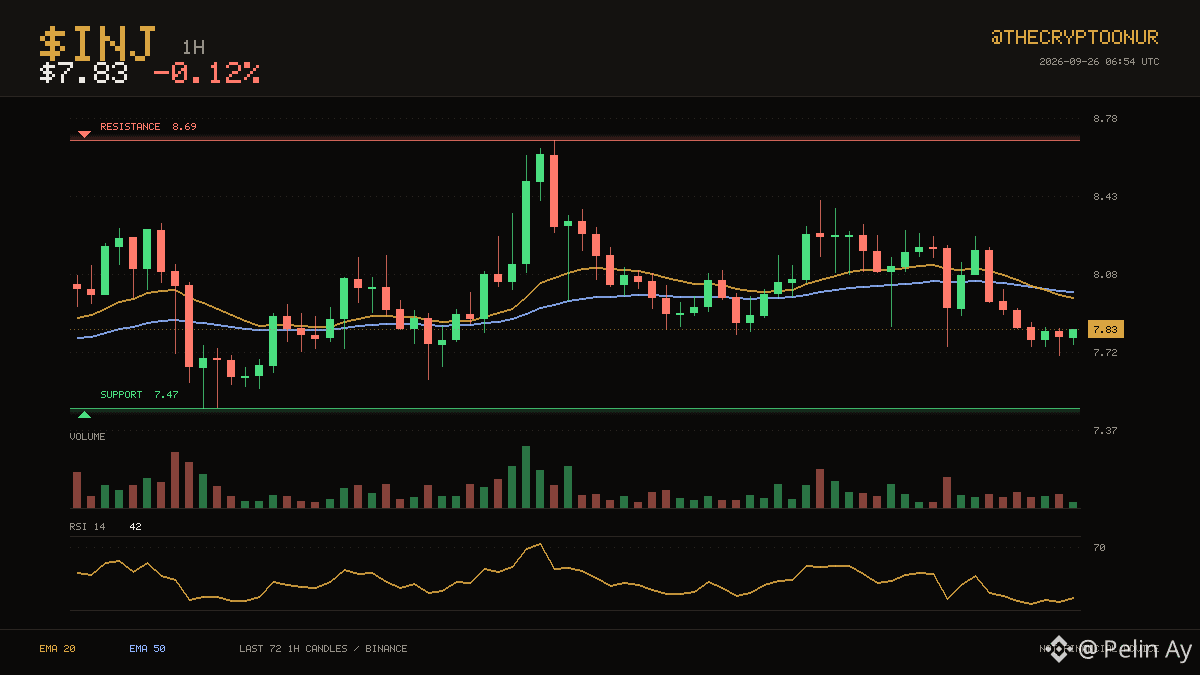
📉 $INJ · 1H
The action has stayed between $7.47 and $8.69 over the last three days. $INJ is at $7.83, under both its 20 and 50 hourly averages. It is sitting in the bottom third of the range. Resistance sits 10.9% above and support 4.6% below. This shift is fresh: the 20 has been below the 50 for only 3 candles. Momentum is mid range with RSI at 42. The 24 hour range runs $7.71 to $8.41, and price is near the bottom of it. Volume is close to normal at 0.8x the recent average. Flat over the past 24 hours.
Binance spot data. DYOR
$INJ #Binance
📉 $INJ · 1H
The action has stayed between $7.47 and $8.69 over the last three days. $INJ is at $7.83, under both its 20 and 50 hourly averages. It is sitting in the bottom third of the range. Resistance sits 10.9% above and support 4.6% below. This shift is fresh: the 20 has been below the 50 for only 3 candles. Momentum is mid range with RSI at 42. The 24 hour range runs $7.71 to $8.41, and price is near the bottom of it. Volume is close to normal at 0.8x the recent average. Flat over the past 24 hours.
Binance spot data. DYOR
$INJ #Binance
The action has stayed between $7.47 and $8.69 over the last three days. $INJ is at $7.83, under both its 20 and 50 hourly averages. It is sitting in the bottom third of the range. Resistance sits 10.9% above and support 4.6% below. This shift is fresh: the 20 has been below the 50 for only 3 candles. Momentum is mid range with RSI at 42. The 24 hour range runs $7.71 to $8.41, and price is near the bottom of it. Volume is close to normal at 0.8x the recent average. Flat over the past 24 hours.
Binance spot data. DYOR
$INJ #Binance
1
1
1.3k
·
--
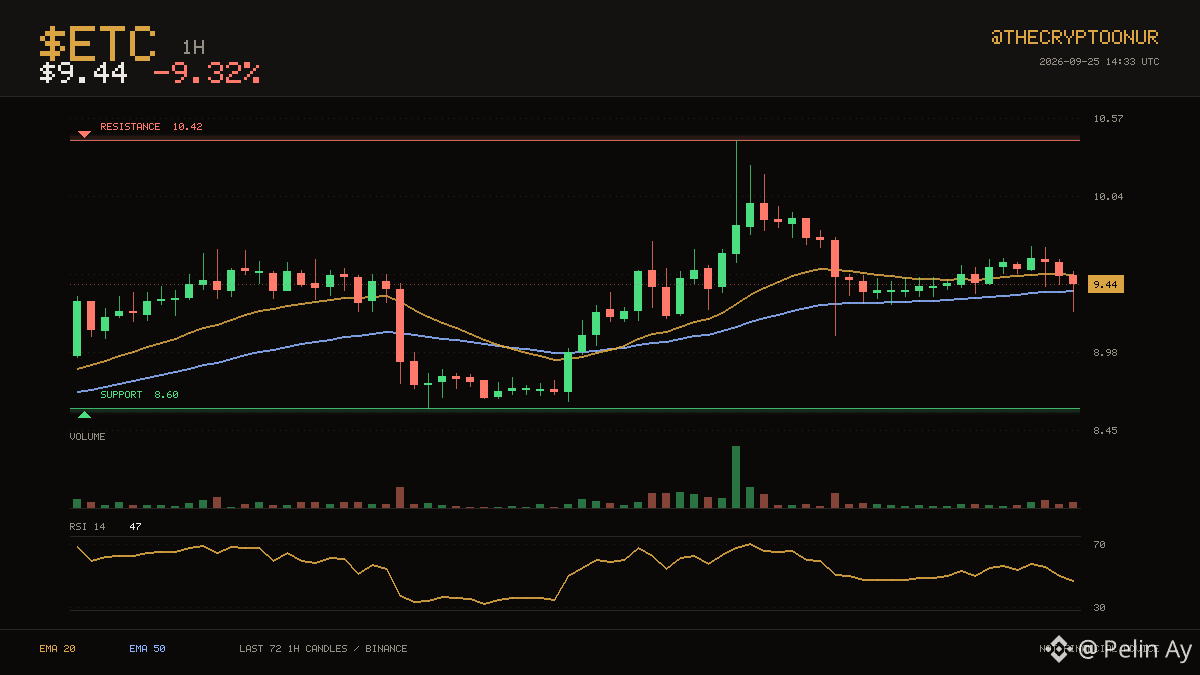
📉 $ETC · 1H
$ETC is at $9.44, with one average above price and one below. The three day range runs from $8.60 up to $10.42. That puts price in the middle of the range. That is 10.4% to the ceiling and 8.9% to the floor. The 20 has stayed above the 50 for 33 candles. RSI at 47 is neutral, so momentum is not blocking a move either way. Over the past day it has traded between $9.10 and $10.41, sitting near the bottom of it now. Turnover is unremarkable, running 1.3x the recent average. The 20 average is at $9.51 and the 50 at $9.40. Down 9.3% over 24 hours.
DYOR
$ETC #Trading
📉 $ETC · 1H
$ETC is at $9.44, with one average above price and one below. The three day range runs from $8.60 up to $10.42. That puts price in the middle of the range. That is 10.4% to the ceiling and 8.9% to the floor. The 20 has stayed above the 50 for 33 candles. RSI at 47 is neutral, so momentum is not blocking a move either way. Over the past day it has traded between $9.10 and $10.41, sitting near the bottom of it now. Turnover is unremarkable, running 1.3x the recent average. The 20 average is at $9.51 and the 50 at $9.40. Down 9.3% over 24 hours.
DYOR
$ETC #Trading
$ETC is at $9.44, with one average above price and one below. The three day range runs from $8.60 up to $10.42. That puts price in the middle of the range. That is 10.4% to the ceiling and 8.9% to the floor. The 20 has stayed above the 50 for 33 candles. RSI at 47 is neutral, so momentum is not blocking a move either way. Over the past day it has traded between $9.10 and $10.41, sitting near the bottom of it now. Turnover is unremarkable, running 1.3x the recent average. The 20 average is at $9.51 and the 50 at $9.40. Down 9.3% over 24 hours.
DYOR
$ETC #Trading
2
995
·
--
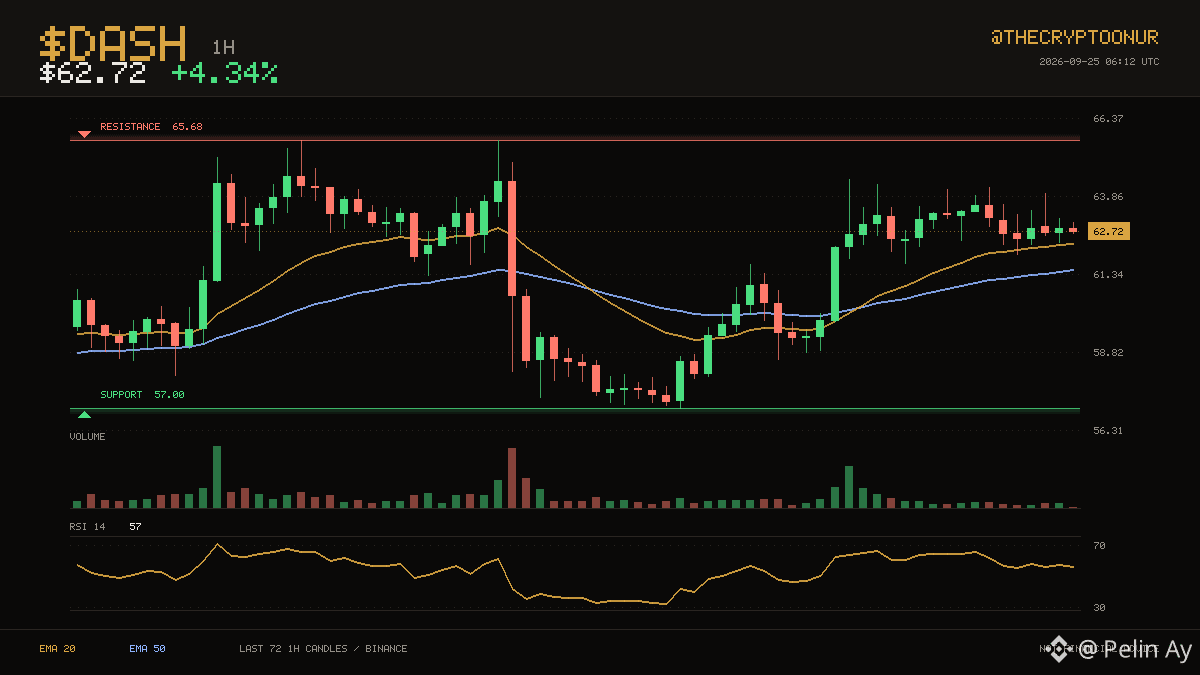
📈 $DASH · 1H
$DASH sits at $62.72, with the 20 and 50 hourly averages both below price. The three day range runs from $57.00 up to $65.68. Price is roughly mid range here. Resistance sits 4.7% above and support 9.1% below. Averages have been ordered the same way for only 16 candles, with the 20 above the 50. Momentum is mid range with RSI at 57. The 24 hour range runs $58.61 to $64.40, and price is near the top of it. Volume is close to normal at 0.9x the recent average. Those averages sit at $62.34 and $61.49 respectively. Up 4.3% over 24 hours.
DYOR
$DASH #Crypto
📈 $DASH · 1H
$DASH sits at $62.72, with the 20 and 50 hourly averages both below price. The three day range runs from $57.00 up to $65.68. Price is roughly mid range here. Resistance sits 4.7% above and support 9.1% below. Averages have been ordered the same way for only 16 candles, with the 20 above the 50. Momentum is mid range with RSI at 57. The 24 hour range runs $58.61 to $64.40, and price is near the top of it. Volume is close to normal at 0.9x the recent average. Those averages sit at $62.34 and $61.49 respectively. Up 4.3% over 24 hours.
DYOR
$DASH #Crypto
$DASH sits at $62.72, with the 20 and 50 hourly averages both below price. The three day range runs from $57.00 up to $65.68. Price is roughly mid range here. Resistance sits 4.7% above and support 9.1% below. Averages have been ordered the same way for only 16 candles, with the 20 above the 50. Momentum is mid range with RSI at 57. The 24 hour range runs $58.61 to $64.40, and price is near the top of it. Volume is close to normal at 0.9x the recent average. Those averages sit at $62.34 and $61.49 respectively. Up 4.3% over 24 hours.
DYOR
$DASH #Crypto
2
6
2.1k
·
--
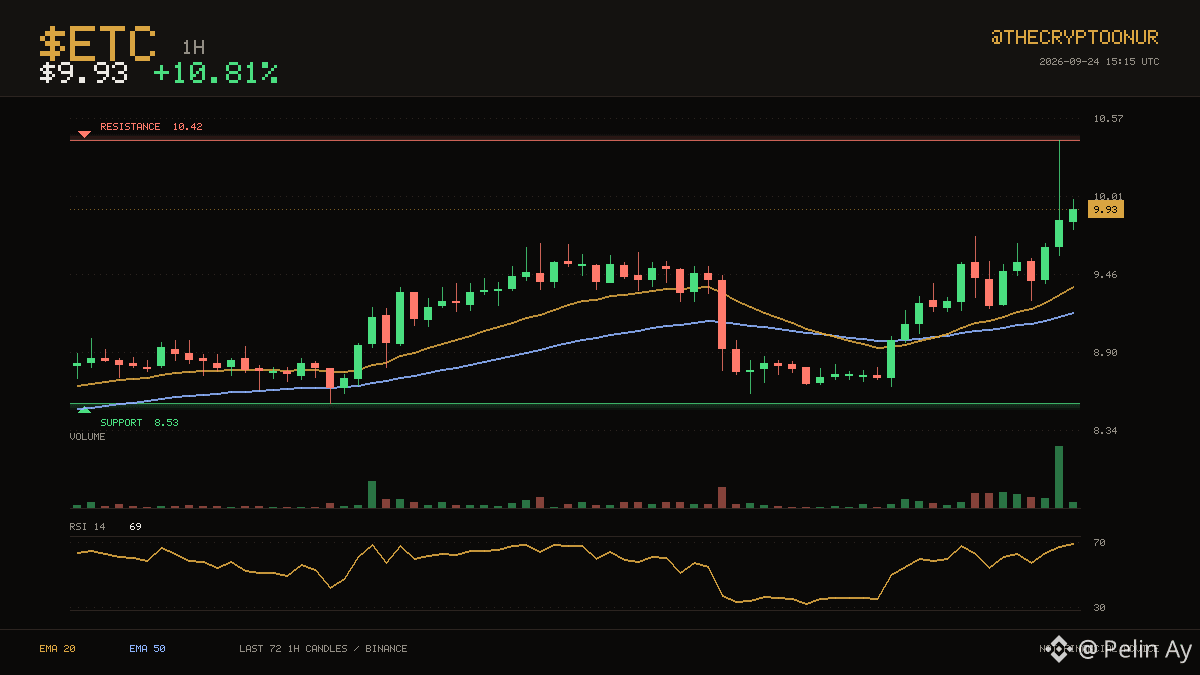
🟢 $ETC · 1H
$9.93 keeps $ETC on the stronger side of its hourly averages. $8.53 on the low side and $10.42 on the high side have contained the last three days. Price is holding in the upper third of that range. That is 4.9% to the ceiling and 14.1% to the floor. The 20 crossed above the 50 recently, for only 10 candles, so this leg is still young. RSI at 69 is neutral, so momentum is not blocking a move either way. Over the past day it has traded between $8.60 and $10.42, sitting near the top of it now. The last 24 hours carried roughly 2.8x normal volume. Up 10.8% over 24 hours.
DYOR
$ETC #TechnicalAnalysis
🟢 $ETC · 1H
$9.93 keeps $ETC on the stronger side of its hourly averages. $8.53 on the low side and $10.42 on the high side have contained the last three days. Price is holding in the upper third of that range. That is 4.9% to the ceiling and 14.1% to the floor. The 20 crossed above the 50 recently, for only 10 candles, so this leg is still young. RSI at 69 is neutral, so momentum is not blocking a move either way. Over the past day it has traded between $8.60 and $10.42, sitting near the top of it now. The last 24 hours carried roughly 2.8x normal volume. Up 10.8% over 24 hours.
DYOR
$ETC #TechnicalAnalysis
$9.93 keeps $ETC on the stronger side of its hourly averages. $8.53 on the low side and $10.42 on the high side have contained the last three days. Price is holding in the upper third of that range. That is 4.9% to the ceiling and 14.1% to the floor. The 20 crossed above the 50 recently, for only 10 candles, so this leg is still young. RSI at 69 is neutral, so momentum is not blocking a move either way. Over the past day it has traded between $8.60 and $10.42, sitting near the top of it now. The last 24 hours carried roughly 2.8x normal volume. Up 10.8% over 24 hours.
DYOR
$ETC #TechnicalAnalysis
536
·
--
Article
Ethereum Network Continues to StrengthenEthereum Ağı Giderek Güçleniyor
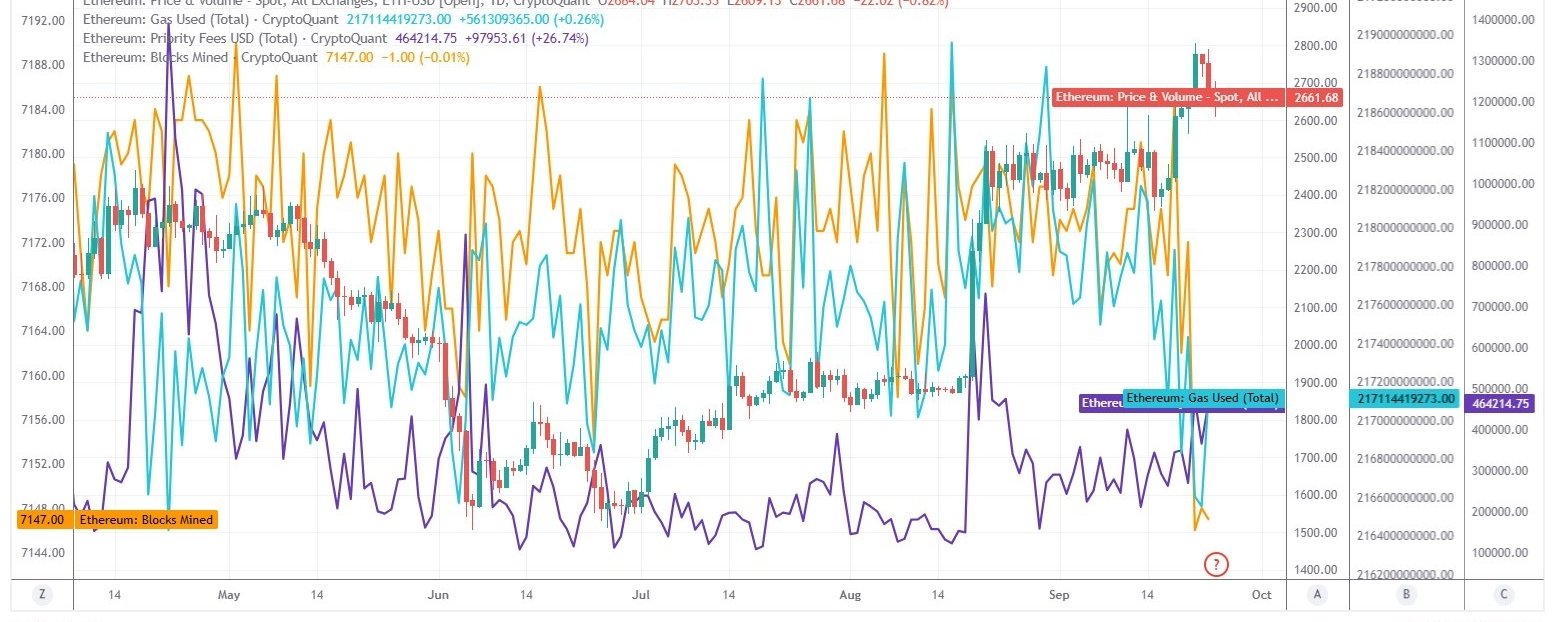
Grafikte Ethereum fiyatı ile Gas Used, Priority Fees ve Blocks Mined arasındaki ilişkiye baktığımda, özellikle son bölümde ağ kullanımının fiyat hareketini destekleyen ancak tek başına yeni bir yükseliş trendini garanti etmeyen bir yapı oluşturduğunu görüyorum.
Ethereum’da ağ kullanımı hâlâ güçlü. ETH fiyatı grafiğin son bölümünde yaklaşık 1.900 dolar bölgesinden 2.800 dolara kadar yükselmiş, ardından 2.660 dolar civarına geri çekilmiş durumda. Buna karşılık Gas Used tarafı yaklaşık 217,1 milyar seviyesinde ve son veride %0,26 artış gösteriyor.
Buradaki önemli olan, fiyat geri çekilmesine rağmen gas kullanımında belirgin bir çöküş yok. Bu, Ethereum ağındaki işlem talebinin fiyatla birlikte tamamen ortadan kalkmadığını gösteriyor.
Grafikte benim için en önemli veri Priority Fees diyebilirim. Çünkü, son değer yaklaşık 464 bin dolar ve günlük değişim %26,74 artış. Gas Used yalnızca %0,26 yükselirken Priority Fees'in %26'nın üzerinde artması önemli bir ayrışma. Bu durum, kullanıcıların işlemlerinin daha hızlı işlenmesi için validatorlara daha yüksek öncelik ücreti ödemeye başladığını gösterebilir. Yani ağda sadece işlem sayısı değil, blok alanı için ödenmeye razı olunan ücretin de arttığı görülüyor. Bu özellikle ETH açısından olumlu bir kullanım sinyali oluşturabilir; çünkü Ethereum üzerindeki ekonomik aktivitenin yalnızca spekülatif fiyat hareketinden ibaret olmadığını düşündürüyor.
Blocks Mined yaklaşık 7.147 seviyesinde ve neredeyse yatay.
Bu veri, ağın ürettiği blok sayısında önemli bir artış olmadığını gösteriyor. Dolayısıyla Gas Used ve Priority Fees tarafındaki hareketin temelinde daha fazla blok üretilmesi değil, mevcut blokların daha yoğun kullanılması ve blok alanı için daha fazla rekabet oluşması bulunuyor.
Blok sayısı sabitken Gas Used hafif artıyor ve Priority Fees güçlü yükseliyor. Böyle bir yapı, Ethereum ağında talebin fiyatından daha hızlı şekilde ücret tarafına yansıdığını gösteriyor.
Grafiğe göre 2.600–2.650 dolar bölgesi korunursa, ağ kullanımının yüksek kalması ve Priority Fees'in yükselmeye devam etmesi, mevcut geri çekilmenin yalnızca bir düzeltme olarak kalmasına yardımcı olabilir. Bu durumda fiyatın yeniden 2.700–2.800 dolar bölgesini test etmesi gündeme gelebilir.
Grafikte şu anda gördüğüm yapı ETH'nin 1.900 dolar civarından 2.800 dolara yükseldiği süreçte ağ kullanımı ve özellikle Priority Fees belirgin şekilde güçlenmiş. Ancak son fiyatın 2.800 dolardan 2.660 dolar civarına gerilemesi, yükselişin kısa vadede momentum kaybettiğini gösteriyor. Buna rağmen ağ tarafındaki aktivitenin hâlâ dirençli olması, fiyat düzeltmesinin zincir üzerindeki kullanımda henüz karşılığını bulmadığını düşündürüyor. Bu nedenle
ETH fiyatı kısa vadede soluklanmış olsa da Ethereum ağındaki kullanım talebi henüz belirgin biçimde bozulmuş değil. Priority Fees'in yüksek kalması, 2.600 dolar çevresindeki fiyat yapısının korunması halinde yeniden yukarı yönlü hareket için destekleyici bir zincir üstü faktör olabilir. Buna karşılık Priority Fees'in sert şekilde geri çekilmesi ve Gas Used'ın da eşlik etmesi, 2.600 dolar desteğinin daha fazla baskı altında kalmasına yol açabilecek önemli bir uyarı olur. Şu an için böyle bir risk grafikte oluşmuş değil.
Ethereum Network Continues to Strengthen
Ethereum Ağı Giderek Güçleniyor
Grafikte Ethereum fiyatı ile Gas Used, Priority Fees ve Blocks Mined arasındaki ilişkiye baktığımda, özellikle son bölümde ağ kullanımının fiyat hareketini destekleyen ancak tek başına yeni bir yükseliş trendini garanti etmeyen bir yapı oluşturduğunu görüyorum.
Ethereum’da ağ kullanımı hâlâ güçlü. ETH fiyatı grafiğin son bölümünde yaklaşık 1.900 dolar bölgesinden 2.800 dolara kadar yükselmiş, ardından 2.660 dolar civarına geri çekilmiş durumda. Buna karşılık Gas Used tarafı yaklaşık 217,1 milyar seviyesinde ve son veride %0,26 artış gösteriyor.
Buradaki önemli olan, fiyat geri çekilmesine rağmen gas kullanımında belirgin bir çöküş yok. Bu, Ethereum ağındaki işlem talebinin fiyatla birlikte tamamen ortadan kalkmadığını gösteriyor.
Grafikte benim için en önemli veri Priority Fees diyebilirim. Çünkü, son değer yaklaşık 464 bin dolar ve günlük değişim %26,74 artış. Gas Used yalnızca %0,26 yükselirken Priority Fees'in %26'nın üzerinde artması önemli bir ayrışma. Bu durum, kullanıcıların işlemlerinin daha hızlı işlenmesi için validatorlara daha yüksek öncelik ücreti ödemeye başladığını gösterebilir. Yani ağda sadece işlem sayısı değil, blok alanı için ödenmeye razı olunan ücretin de arttığı görülüyor. Bu özellikle ETH açısından olumlu bir kullanım sinyali oluşturabilir; çünkü Ethereum üzerindeki ekonomik aktivitenin yalnızca spekülatif fiyat hareketinden ibaret olmadığını düşündürüyor.
Blocks Mined yaklaşık 7.147 seviyesinde ve neredeyse yatay.
Bu veri, ağın ürettiği blok sayısında önemli bir artış olmadığını gösteriyor. Dolayısıyla Gas Used ve Priority Fees tarafındaki hareketin temelinde daha fazla blok üretilmesi değil, mevcut blokların daha yoğun kullanılması ve blok alanı için daha fazla rekabet oluşması bulunuyor.
Blok sayısı sabitken Gas Used hafif artıyor ve Priority Fees güçlü yükseliyor. Böyle bir yapı, Ethereum ağında talebin fiyatından daha hızlı şekilde ücret tarafına yansıdığını gösteriyor.
Grafiğe göre 2.600–2.650 dolar bölgesi korunursa, ağ kullanımının yüksek kalması ve Priority Fees'in yükselmeye devam etmesi, mevcut geri çekilmenin yalnızca bir düzeltme olarak kalmasına yardımcı olabilir. Bu durumda fiyatın yeniden 2.700–2.800 dolar bölgesini test etmesi gündeme gelebilir.
Grafikte şu anda gördüğüm yapı ETH'nin 1.900 dolar civarından 2.800 dolara yükseldiği süreçte ağ kullanımı ve özellikle Priority Fees belirgin şekilde güçlenmiş. Ancak son fiyatın 2.800 dolardan 2.660 dolar civarına gerilemesi, yükselişin kısa vadede momentum kaybettiğini gösteriyor. Buna rağmen ağ tarafındaki aktivitenin hâlâ dirençli olması, fiyat düzeltmesinin zincir üzerindeki kullanımda henüz karşılığını bulmadığını düşündürüyor. Bu nedenle
ETH fiyatı kısa vadede soluklanmış olsa da Ethereum ağındaki kullanım talebi henüz belirgin biçimde bozulmuş değil. Priority Fees'in yüksek kalması, 2.600 dolar çevresindeki fiyat yapısının korunması halinde yeniden yukarı yönlü hareket için destekleyici bir zincir üstü faktör olabilir. Buna karşılık Priority Fees'in sert şekilde geri çekilmesi ve Gas Used'ın da eşlik etmesi, 2.600 dolar desteğinin daha fazla baskı altında kalmasına yol açabilecek önemli bir uyarı olur. Şu an için böyle bir risk grafikte oluşmuş değil.
Grafikte Ethereum fiyatı ile Gas Used, Priority Fees ve Blocks Mined arasındaki ilişkiye baktığımda, özellikle son bölümde ağ kullanımının fiyat hareketini destekleyen ancak tek başına yeni bir yükseliş trendini garanti etmeyen bir yapı oluşturduğunu görüyorum.
Ethereum’da ağ kullanımı hâlâ güçlü. ETH fiyatı grafiğin son bölümünde yaklaşık 1.900 dolar bölgesinden 2.800 dolara kadar yükselmiş, ardından 2.660 dolar civarına geri çekilmiş durumda. Buna karşılık Gas Used tarafı yaklaşık 217,1 milyar seviyesinde ve son veride %0,26 artış gösteriyor.
Buradaki önemli olan, fiyat geri çekilmesine rağmen gas kullanımında belirgin bir çöküş yok. Bu, Ethereum ağındaki işlem talebinin fiyatla birlikte tamamen ortadan kalkmadığını gösteriyor.
Grafikte benim için en önemli veri Priority Fees diyebilirim. Çünkü, son değer yaklaşık 464 bin dolar ve günlük değişim %26,74 artış. Gas Used yalnızca %0,26 yükselirken Priority Fees'in %26'nın üzerinde artması önemli bir ayrışma. Bu durum, kullanıcıların işlemlerinin daha hızlı işlenmesi için validatorlara daha yüksek öncelik ücreti ödemeye başladığını gösterebilir. Yani ağda sadece işlem sayısı değil, blok alanı için ödenmeye razı olunan ücretin de arttığı görülüyor. Bu özellikle ETH açısından olumlu bir kullanım sinyali oluşturabilir; çünkü Ethereum üzerindeki ekonomik aktivitenin yalnızca spekülatif fiyat hareketinden ibaret olmadığını düşündürüyor.
Blocks Mined yaklaşık 7.147 seviyesinde ve neredeyse yatay.
Bu veri, ağın ürettiği blok sayısında önemli bir artış olmadığını gösteriyor. Dolayısıyla Gas Used ve Priority Fees tarafındaki hareketin temelinde daha fazla blok üretilmesi değil, mevcut blokların daha yoğun kullanılması ve blok alanı için daha fazla rekabet oluşması bulunuyor.
Blok sayısı sabitken Gas Used hafif artıyor ve Priority Fees güçlü yükseliyor. Böyle bir yapı, Ethereum ağında talebin fiyatından daha hızlı şekilde ücret tarafına yansıdığını gösteriyor.
Grafiğe göre 2.600–2.650 dolar bölgesi korunursa, ağ kullanımının yüksek kalması ve Priority Fees'in yükselmeye devam etmesi, mevcut geri çekilmenin yalnızca bir düzeltme olarak kalmasına yardımcı olabilir. Bu durumda fiyatın yeniden 2.700–2.800 dolar bölgesini test etmesi gündeme gelebilir.
Grafikte şu anda gördüğüm yapı ETH'nin 1.900 dolar civarından 2.800 dolara yükseldiği süreçte ağ kullanımı ve özellikle Priority Fees belirgin şekilde güçlenmiş. Ancak son fiyatın 2.800 dolardan 2.660 dolar civarına gerilemesi, yükselişin kısa vadede momentum kaybettiğini gösteriyor. Buna rağmen ağ tarafındaki aktivitenin hâlâ dirençli olması, fiyat düzeltmesinin zincir üzerindeki kullanımda henüz karşılığını bulmadığını düşündürüyor. Bu nedenle
ETH fiyatı kısa vadede soluklanmış olsa da Ethereum ağındaki kullanım talebi henüz belirgin biçimde bozulmuş değil. Priority Fees'in yüksek kalması, 2.600 dolar çevresindeki fiyat yapısının korunması halinde yeniden yukarı yönlü hareket için destekleyici bir zincir üstü faktör olabilir. Buna karşılık Priority Fees'in sert şekilde geri çekilmesi ve Gas Used'ın da eşlik etmesi, 2.600 dolar desteğinin daha fazla baskı altında kalmasına yol açabilecek önemli bir uyarı olur. Şu an için böyle bir risk grafikte oluşmuş değil.
1
1
300
·
--
📉 $SNDKB · 1H
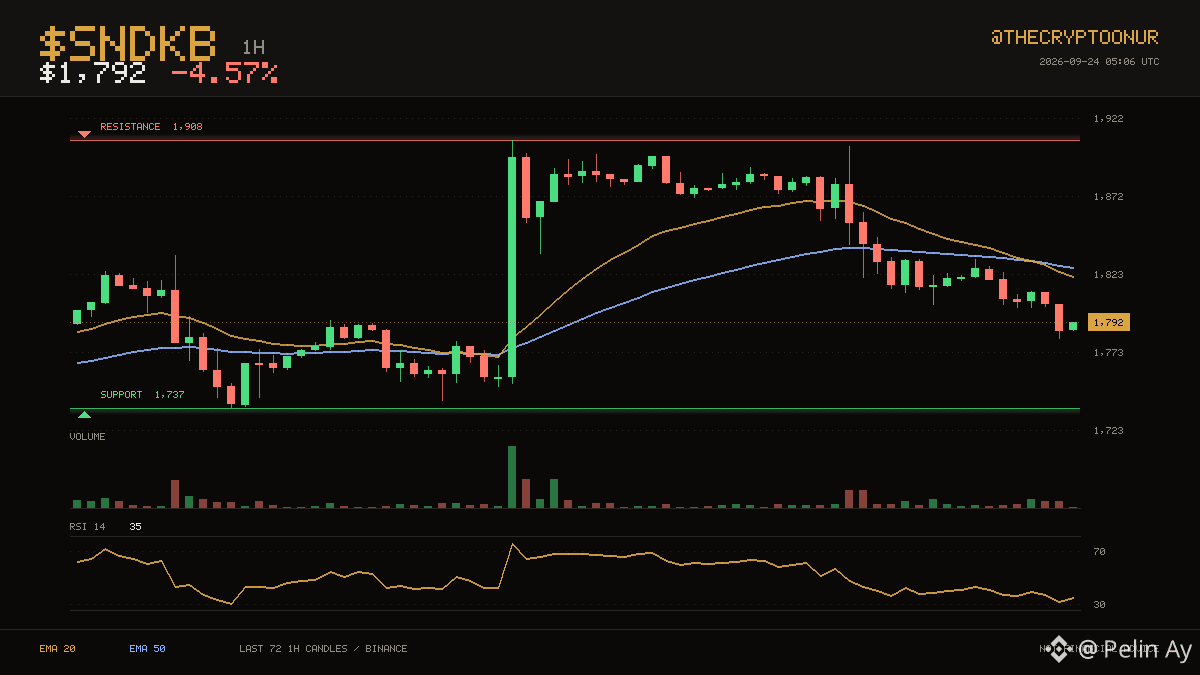
$SNDKB trades at $1,792, still on the weak side of its hourly averages. The three day range runs from $1,737 up to $1,908. Price is down in the lower third of that range. That is 6.5% to the ceiling and 3.1% to the floor. The 20 crossed below the 50 recently, for only 3 candles, so this leg is still young. RSI at 35 is neutral, so momentum is not blocking a move either way. Over the past day it has traded between $1,782 and $1,904, sitting near the bottom of it now. Turnover is unremarkable, running 1.2x the recent average. Down 4.6% over 24 hours.
DYOR
$SNDKB #Trading
📉 $SNDKB · 1H
$SNDKB trades at $1,792, still on the weak side of its hourly averages. The three day range runs from $1,737 up to $1,908. Price is down in the lower third of that range. That is 6.5% to the ceiling and 3.1% to the floor. The 20 crossed below the 50 recently, for only 3 candles, so this leg is still young. RSI at 35 is neutral, so momentum is not blocking a move either way. Over the past day it has traded between $1,782 and $1,904, sitting near the bottom of it now. Turnover is unremarkable, running 1.2x the recent average. Down 4.6% over 24 hours.
DYOR
$SNDKB #Trading
$SNDKB trades at $1,792, still on the weak side of its hourly averages. The three day range runs from $1,737 up to $1,908. Price is down in the lower third of that range. That is 6.5% to the ceiling and 3.1% to the floor. The 20 crossed below the 50 recently, for only 3 candles, so this leg is still young. RSI at 35 is neutral, so momentum is not blocking a move either way. Over the past day it has traded between $1,782 and $1,904, sitting near the bottom of it now. Turnover is unremarkable, running 1.2x the recent average. Down 4.6% over 24 hours.
DYOR
$SNDKB #Trading
1
313
·
--
📈 $牛来 · 1H
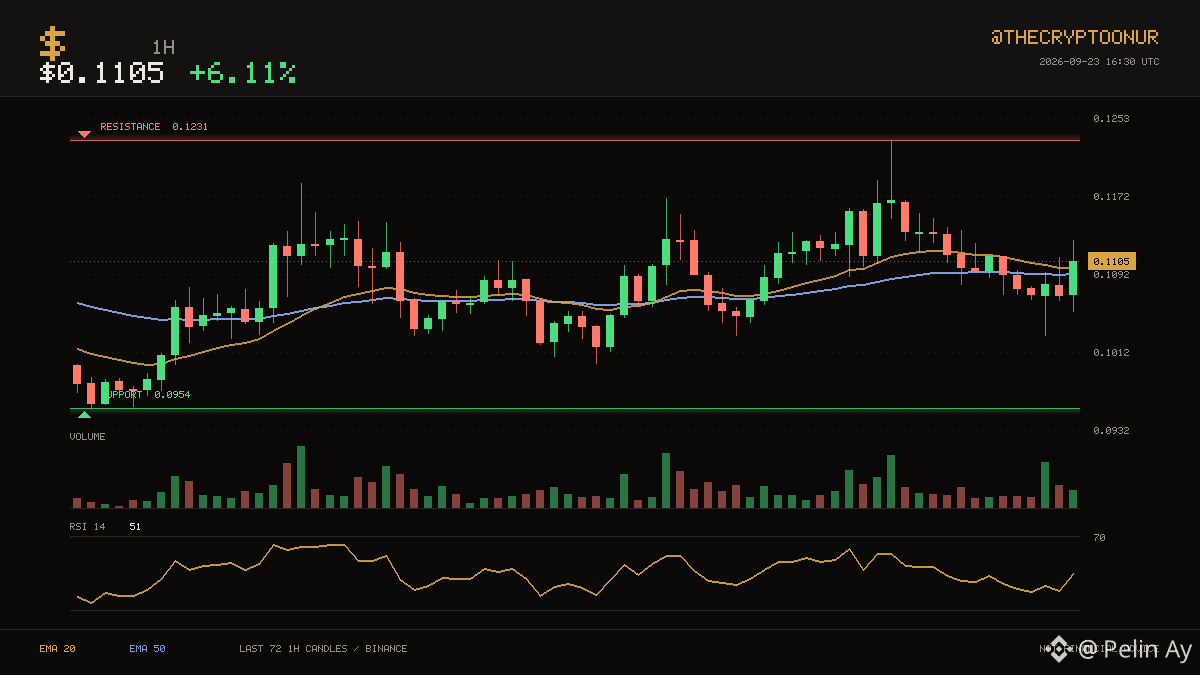
$牛来 sits at $0.1105, with the 20 and 50 hourly averages both below price. The three day range runs from $0.0954 up to $0.1231. Price is roughly mid range here. Resistance sits 11.3% above and support 13.7% below. Averages have been ordered the same way for 31 candles, with the 20 above the 50. Momentum is mid range with RSI at 51. The 24 hour range runs $0.1030 to $0.1231, and price is around the middle of it. Volume is close to normal at 1.2x the recent average. Those averages sit at $0.1100 and $0.1093 respectively. Up 6.1% over 24 hours.
DYOR
$牛来 #Crypto
📈 $牛来 · 1H
$牛来 sits at $0.1105, with the 20 and 50 hourly averages both below price. The three day range runs from $0.0954 up to $0.1231. Price is roughly mid range here. Resistance sits 11.3% above and support 13.7% below. Averages have been ordered the same way for 31 candles, with the 20 above the 50. Momentum is mid range with RSI at 51. The 24 hour range runs $0.1030 to $0.1231, and price is around the middle of it. Volume is close to normal at 1.2x the recent average. Those averages sit at $0.1100 and $0.1093 respectively. Up 6.1% over 24 hours.
DYOR
$牛来 #Crypto
$牛来 sits at $0.1105, with the 20 and 50 hourly averages both below price. The three day range runs from $0.0954 up to $0.1231. Price is roughly mid range here. Resistance sits 11.3% above and support 13.7% below. Averages have been ordered the same way for 31 candles, with the 20 above the 50. Momentum is mid range with RSI at 51. The 24 hour range runs $0.1030 to $0.1231, and price is around the middle of it. Volume is close to normal at 1.2x the recent average. Those averages sit at $0.1100 and $0.1093 respectively. Up 6.1% over 24 hours.
DYOR
$牛来 #Crypto
1
343
·
--
Article
Leveraged trading on the Bitcoin side has calmed down.Bitcoin Tarafında Kaldıraçlı İşlemler Sakinleşti
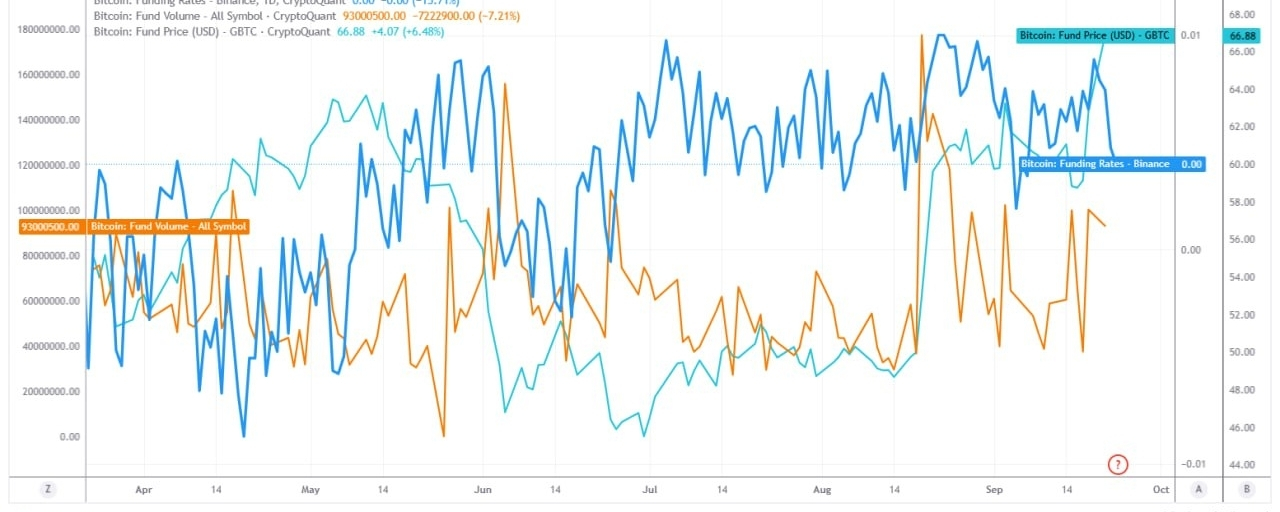
Bu grafikte bence en önemli nokta, Funding Rate’in yeniden 0.00 seviyesine gelmesi. Bu durum Bitcoin'in türev piyasasındaki kaldıraçlı pozisyonların önemli ölçüde dengelendiğini gösteriyor. Pozitif funding'de longlar shortlara ödeme yapar; funding'in sıfıra yaklaşması ise piyasanın daha dengeli hale geldiğini gösterir.
Güncel piyasa verilerinde de Binance BTC funding oranı 23 Eylül 2026 verisinde yaklaşık %0,001 civarında. Fiyat yükselirken funding aşırı pozitif değilse, yükselişin temelinde aşırı kaldıraçlı long pozisyonlar olmadığı düşünülebilir. Dolayısıyla mevcut görüntü, geçmişte gördüğümüz fiyat yükseldi herkes long açtı, funding aşırı yükseldi long tasfiyeleri geldi düşüncesinden farklı bir yapı var. long pozisyonların agresif şekilde birikmediğini görürüz. Böyle bir ortamda fiyat yükselmeye devam ederse, piyasa daha sağlıklı şekilde ilerleyebilir. Ancak grafikteki diğer iki metriği de birlikte okumak gerekiyor.
Fund Volume, son dönemde yaklaşık 93 milyon seviyesine çıkmış. Özellikle Ağustos ortasındaki düşük seviyelerden sonra hacimde belirgin toparlanma var. Bu bize piyasanın yeniden daha fazla işlem ve fon aktivitesi gördüğünü söylüyor.
Hacim artışı ile Funding'in aynı anda düşük kalması ise bu aktivitenin aşırı long kaldıraçla desteklenmediğini düşündürüyor.
GBTC Fun Price, son bölümde yaklaşık 66,88 seviyesine yükselmiş durumda. Dolayısıyla
GBTC fiyatındaki yükseliş ile fon hacmindeki toparlanma, kurumsal tarafındaki aktivitenin arttığını gösteren ek bir sinyal olarak değerlendirilebilir.
Sadece bu grafiğe bakarak güçlü bir tekrar düşüş başlayacak sinyali görmüyorum. Hatta mevcut funding yapısının önemli avantajı Funding aşırı pozitif değil, long kalabalığı oluşmamış, long tasfiyesi riski sınırlı. Daha önce piyasalarda gördüğümüz sert düşüşlerin önemli bir bölümü, yüksek funding ve fiyatın aşağı kırılması ile hızlanabiliyor.
Grafiğin mevcut görüntüsünü şöyle özetleyebiliriz. Bitcoin türev piyasasında aşırı long pozisyonlanma şu anda belirgin değil. Funding Rate'in 0.00'a yaklaşması, kaldıraç baskısının temizlendiğine ve piyasanın daha dengeli hale geldiğine işaret ediyor. Aynı zamanda Fund Volume'daki toparlanma piyasa aktivitesinin yeniden arttığını gösteriyor. Bu nedenle yalnızca bu grafik üzerinden bakıldığında yeni ve sert bir düşüşün başladığını söylemek için yeterli veri yok. Kısacası, şu an grafikte benim için alarm veren şey kaldıraç tarafının oldukça sakinleşmiş olması. Bu yapı, fiyatın yeniden yükselmesi durumunda hareketin henüz aşırı kalabalık bir long pozisyon yapısına dayanmadığını gösterebilir.
Leveraged trading on the Bitcoin side has calmed down.
Bitcoin Tarafında Kaldıraçlı İşlemler Sakinleşti
Bu grafikte bence en önemli nokta, Funding Rate’in yeniden 0.00 seviyesine gelmesi. Bu durum Bitcoin'in türev piyasasındaki kaldıraçlı pozisyonların önemli ölçüde dengelendiğini gösteriyor. Pozitif funding'de longlar shortlara ödeme yapar; funding'in sıfıra yaklaşması ise piyasanın daha dengeli hale geldiğini gösterir.
Güncel piyasa verilerinde de Binance BTC funding oranı 23 Eylül 2026 verisinde yaklaşık %0,001 civarında. Fiyat yükselirken funding aşırı pozitif değilse, yükselişin temelinde aşırı kaldıraçlı long pozisyonlar olmadığı düşünülebilir. Dolayısıyla mevcut görüntü, geçmişte gördüğümüz fiyat yükseldi herkes long açtı, funding aşırı yükseldi long tasfiyeleri geldi düşüncesinden farklı bir yapı var. long pozisyonların agresif şekilde birikmediğini görürüz. Böyle bir ortamda fiyat yükselmeye devam ederse, piyasa daha sağlıklı şekilde ilerleyebilir. Ancak grafikteki diğer iki metriği de birlikte okumak gerekiyor.
Fund Volume, son dönemde yaklaşık 93 milyon seviyesine çıkmış. Özellikle Ağustos ortasındaki düşük seviyelerden sonra hacimde belirgin toparlanma var. Bu bize piyasanın yeniden daha fazla işlem ve fon aktivitesi gördüğünü söylüyor.
Hacim artışı ile Funding'in aynı anda düşük kalması ise bu aktivitenin aşırı long kaldıraçla desteklenmediğini düşündürüyor.
GBTC Fun Price, son bölümde yaklaşık 66,88 seviyesine yükselmiş durumda. Dolayısıyla
GBTC fiyatındaki yükseliş ile fon hacmindeki toparlanma, kurumsal tarafındaki aktivitenin arttığını gösteren ek bir sinyal olarak değerlendirilebilir.
Sadece bu grafiğe bakarak güçlü bir tekrar düşüş başlayacak sinyali görmüyorum. Hatta mevcut funding yapısının önemli avantajı Funding aşırı pozitif değil, long kalabalığı oluşmamış, long tasfiyesi riski sınırlı. Daha önce piyasalarda gördüğümüz sert düşüşlerin önemli bir bölümü, yüksek funding ve fiyatın aşağı kırılması ile hızlanabiliyor.
Grafiğin mevcut görüntüsünü şöyle özetleyebiliriz. Bitcoin türev piyasasında aşırı long pozisyonlanma şu anda belirgin değil. Funding Rate'in 0.00'a yaklaşması, kaldıraç baskısının temizlendiğine ve piyasanın daha dengeli hale geldiğine işaret ediyor. Aynı zamanda Fund Volume'daki toparlanma piyasa aktivitesinin yeniden arttığını gösteriyor. Bu nedenle yalnızca bu grafik üzerinden bakıldığında yeni ve sert bir düşüşün başladığını söylemek için yeterli veri yok. Kısacası, şu an grafikte benim için alarm veren şey kaldıraç tarafının oldukça sakinleşmiş olması. Bu yapı, fiyatın yeniden yükselmesi durumunda hareketin henüz aşırı kalabalık bir long pozisyon yapısına dayanmadığını gösterebilir.
Bu grafikte bence en önemli nokta, Funding Rate’in yeniden 0.00 seviyesine gelmesi. Bu durum Bitcoin'in türev piyasasındaki kaldıraçlı pozisyonların önemli ölçüde dengelendiğini gösteriyor. Pozitif funding'de longlar shortlara ödeme yapar; funding'in sıfıra yaklaşması ise piyasanın daha dengeli hale geldiğini gösterir.
Güncel piyasa verilerinde de Binance BTC funding oranı 23 Eylül 2026 verisinde yaklaşık %0,001 civarında. Fiyat yükselirken funding aşırı pozitif değilse, yükselişin temelinde aşırı kaldıraçlı long pozisyonlar olmadığı düşünülebilir. Dolayısıyla mevcut görüntü, geçmişte gördüğümüz fiyat yükseldi herkes long açtı, funding aşırı yükseldi long tasfiyeleri geldi düşüncesinden farklı bir yapı var. long pozisyonların agresif şekilde birikmediğini görürüz. Böyle bir ortamda fiyat yükselmeye devam ederse, piyasa daha sağlıklı şekilde ilerleyebilir. Ancak grafikteki diğer iki metriği de birlikte okumak gerekiyor.
Fund Volume, son dönemde yaklaşık 93 milyon seviyesine çıkmış. Özellikle Ağustos ortasındaki düşük seviyelerden sonra hacimde belirgin toparlanma var. Bu bize piyasanın yeniden daha fazla işlem ve fon aktivitesi gördüğünü söylüyor.
Hacim artışı ile Funding'in aynı anda düşük kalması ise bu aktivitenin aşırı long kaldıraçla desteklenmediğini düşündürüyor.
GBTC Fun Price, son bölümde yaklaşık 66,88 seviyesine yükselmiş durumda. Dolayısıyla
GBTC fiyatındaki yükseliş ile fon hacmindeki toparlanma, kurumsal tarafındaki aktivitenin arttığını gösteren ek bir sinyal olarak değerlendirilebilir.
Sadece bu grafiğe bakarak güçlü bir tekrar düşüş başlayacak sinyali görmüyorum. Hatta mevcut funding yapısının önemli avantajı Funding aşırı pozitif değil, long kalabalığı oluşmamış, long tasfiyesi riski sınırlı. Daha önce piyasalarda gördüğümüz sert düşüşlerin önemli bir bölümü, yüksek funding ve fiyatın aşağı kırılması ile hızlanabiliyor.
Grafiğin mevcut görüntüsünü şöyle özetleyebiliriz. Bitcoin türev piyasasında aşırı long pozisyonlanma şu anda belirgin değil. Funding Rate'in 0.00'a yaklaşması, kaldıraç baskısının temizlendiğine ve piyasanın daha dengeli hale geldiğine işaret ediyor. Aynı zamanda Fund Volume'daki toparlanma piyasa aktivitesinin yeniden arttığını gösteriyor. Bu nedenle yalnızca bu grafik üzerinden bakıldığında yeni ve sert bir düşüşün başladığını söylemek için yeterli veri yok. Kısacası, şu an grafikte benim için alarm veren şey kaldıraç tarafının oldukça sakinleşmiş olması. Bu yapı, fiyatın yeniden yükselmesi durumunda hareketin henüz aşırı kalabalık bir long pozisyon yapısına dayanmadığını gösterebilir.
217
·
--
📉 $PUMP · 1H
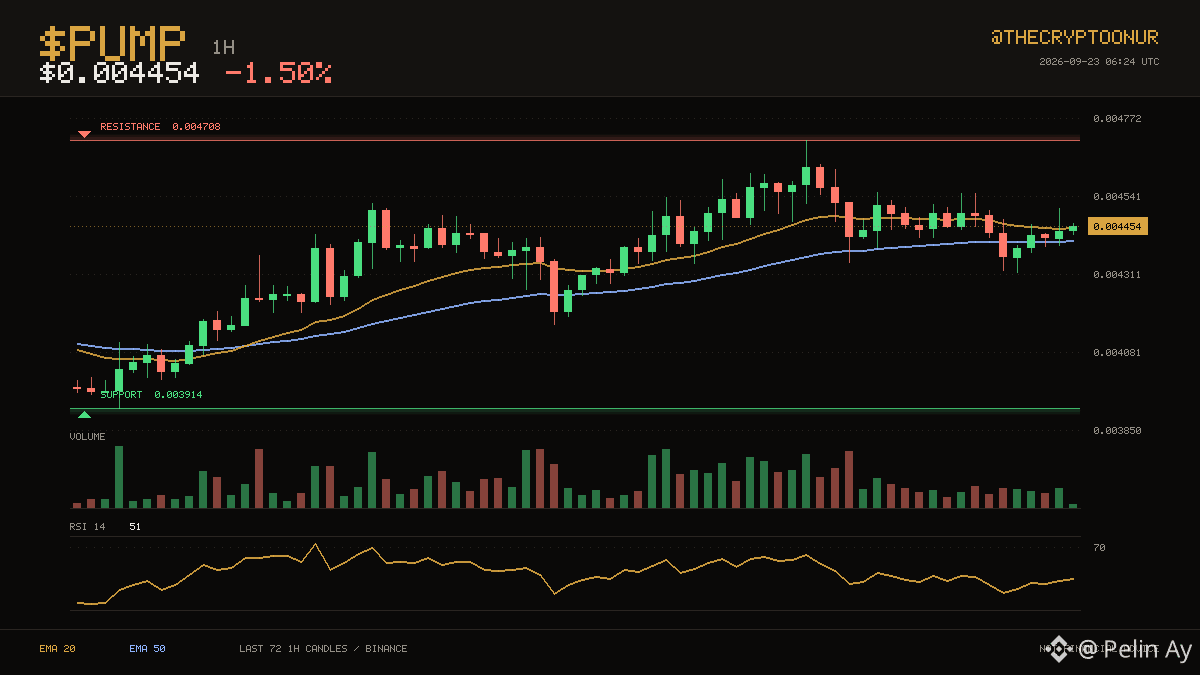
$PUMP sits at $0.004454, with the 20 and 50 hourly averages both below price. The three day range runs from $0.003914 up to $0.004708. Price is holding in the upper third of that range. That is 5.7% to the ceiling and 12.1% to the floor. The 20 has stayed above the 50 for a long stretch now. RSI at 51 is neutral, so momentum is not blocking a move either way. Over the past day it has traded between $0.004318 and $0.004708, sitting around the middle of it now. Turnover is unremarkable, running 1.0x the recent average. Down 1.5% over 24 hours.
DYOR
$PUMP #Trading
📉 $PUMP · 1H
$PUMP sits at $0.004454, with the 20 and 50 hourly averages both below price. The three day range runs from $0.003914 up to $0.004708. Price is holding in the upper third of that range. That is 5.7% to the ceiling and 12.1% to the floor. The 20 has stayed above the 50 for a long stretch now. RSI at 51 is neutral, so momentum is not blocking a move either way. Over the past day it has traded between $0.004318 and $0.004708, sitting around the middle of it now. Turnover is unremarkable, running 1.0x the recent average. Down 1.5% over 24 hours.
DYOR
$PUMP #Trading
$PUMP sits at $0.004454, with the 20 and 50 hourly averages both below price. The three day range runs from $0.003914 up to $0.004708. Price is holding in the upper third of that range. That is 5.7% to the ceiling and 12.1% to the floor. The 20 has stayed above the 50 for a long stretch now. RSI at 51 is neutral, so momentum is not blocking a move either way. Over the past day it has traded between $0.004318 and $0.004708, sitting around the middle of it now. Turnover is unremarkable, running 1.0x the recent average. Down 1.5% over 24 hours.
DYOR
$PUMP #Trading
1
1
796
·
--
📉 $BANK · 1H
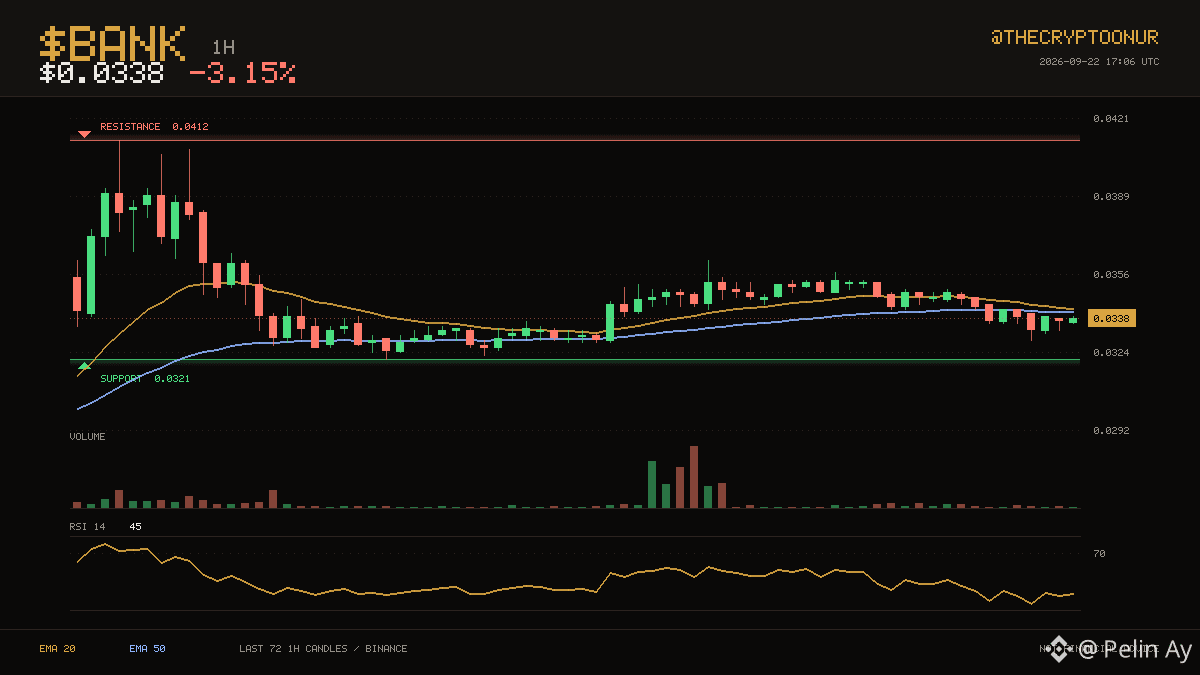
$BANK trades at $0.0338, still on the weak side of its hourly averages. Buyers have been showing up around $0.0321, which is where price is sitting now. It is sitting in the bottom third of the range. Support is the near one at 5.0% below; the range high is far above. Averages have been ordered the same way for a long stretch now, with the 20 above the 50. Momentum is mid range with RSI at 45. The 24 hour range runs $0.0329 to $0.0357, and price is around the middle of it. Volume is thin, around 0.3x the recent average, so moves here are easier to fade. Down 3.2% over 24 hours.
DYOR
$BANK #Crypto
📉 $BANK · 1H
$BANK trades at $0.0338, still on the weak side of its hourly averages. Buyers have been showing up around $0.0321, which is where price is sitting now. It is sitting in the bottom third of the range. Support is the near one at 5.0% below; the range high is far above. Averages have been ordered the same way for a long stretch now, with the 20 above the 50. Momentum is mid range with RSI at 45. The 24 hour range runs $0.0329 to $0.0357, and price is around the middle of it. Volume is thin, around 0.3x the recent average, so moves here are easier to fade. Down 3.2% over 24 hours.
DYOR
$BANK #Crypto
$BANK trades at $0.0338, still on the weak side of its hourly averages. Buyers have been showing up around $0.0321, which is where price is sitting now. It is sitting in the bottom third of the range. Support is the near one at 5.0% below; the range high is far above. Averages have been ordered the same way for a long stretch now, with the 20 above the 50. Momentum is mid range with RSI at 45. The 24 hour range runs $0.0329 to $0.0357, and price is around the middle of it. Volume is thin, around 0.3x the recent average, so moves here are easier to fade. Down 3.2% over 24 hours.
DYOR
$BANK #Crypto
1
1.4k
·
--
🟢 $BCH · 1H
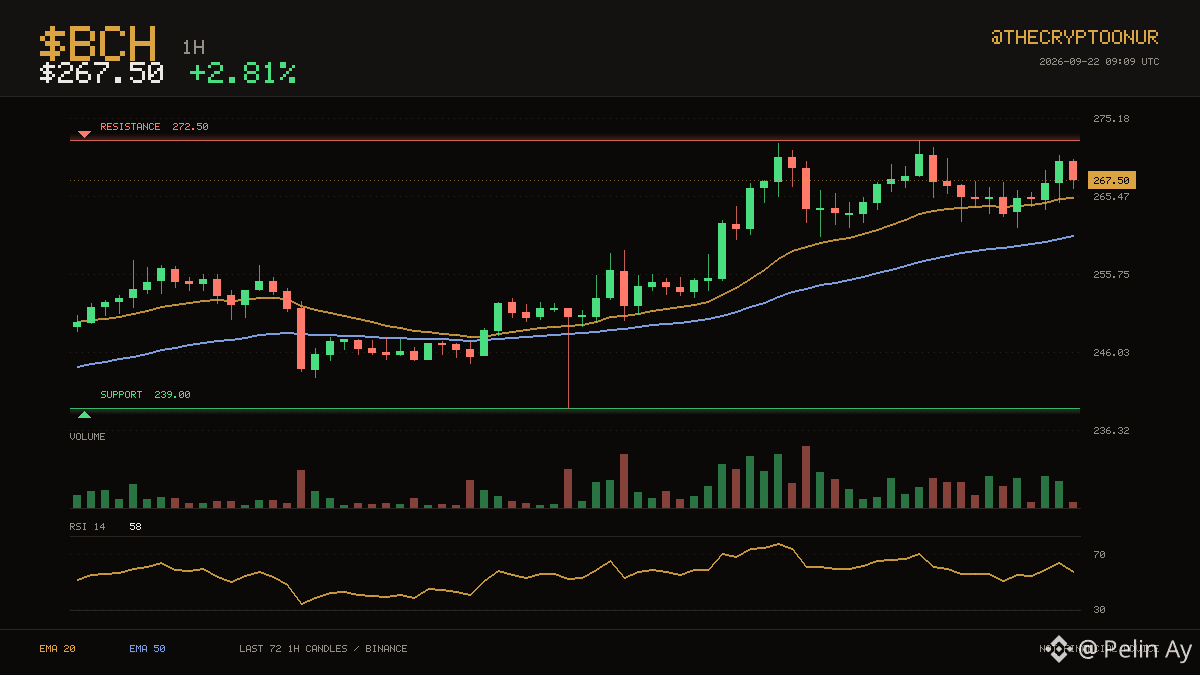
$267.50 keeps $BCH on the stronger side of its hourly averages. The last three days topped out near $272.50, and price is pressing that area again. It is trading in the top third of the range right now. Resistance sits 1.9% above and support 10.7% below. Averages have been ordered the same way for a long stretch now, with the 20 above the 50. Momentum is mid range with RSI at 58. The 24 hour range runs $260.20 to $272.50, and price is around the middle of it. Volume over the past day is running about 1.6x the recent average, so there is real participation behind this. Up 2.8% over 24 hours.
DYOR
$BCH #Crypto
🟢 $BCH · 1H
$267.50 keeps $BCH on the stronger side of its hourly averages. The last three days topped out near $272.50, and price is pressing that area again. It is trading in the top third of the range right now. Resistance sits 1.9% above and support 10.7% below. Averages have been ordered the same way for a long stretch now, with the 20 above the 50. Momentum is mid range with RSI at 58. The 24 hour range runs $260.20 to $272.50, and price is around the middle of it. Volume over the past day is running about 1.6x the recent average, so there is real participation behind this. Up 2.8% over 24 hours.
DYOR
$BCH #Crypto
$267.50 keeps $BCH on the stronger side of its hourly averages. The last three days topped out near $272.50, and price is pressing that area again. It is trading in the top third of the range right now. Resistance sits 1.9% above and support 10.7% below. Averages have been ordered the same way for a long stretch now, with the 20 above the 50. Momentum is mid range with RSI at 58. The 24 hour range runs $260.20 to $272.50, and price is around the middle of it. Volume over the past day is running about 1.6x the recent average, so there is real participation behind this. Up 2.8% over 24 hours.
DYOR
$BCH #Crypto
1
3
498
·
--
🟢 $PENGU · 1H
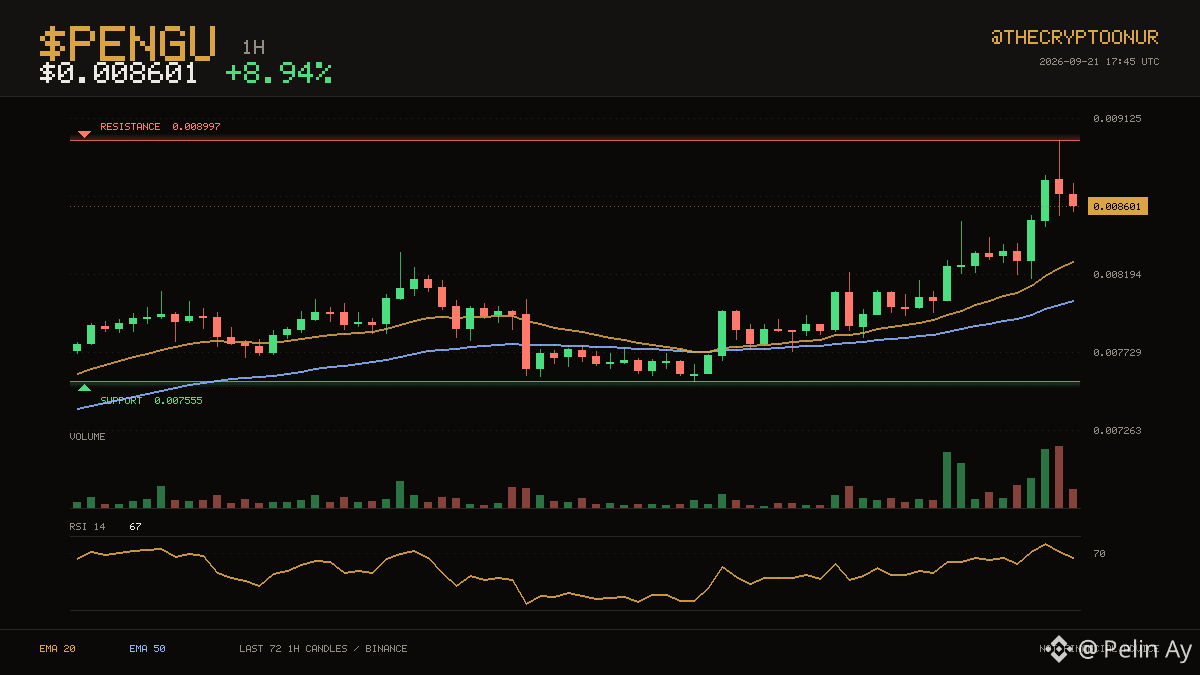
$0.008601 keeps $PENGU on the stronger side of its hourly averages. $0.007555 on the low side and $0.008997 on the high side have contained the last three days. It is trading in the top third of the range right now. Resistance sits 4.6% above and support 12.2% below. Averages have been ordered the same way for 26 candles, with the 20 above the 50. Momentum is mid range with RSI at 67. The 24 hour range runs $0.007736 to $0.008997, and price is around the middle of it. Volume over the past day is running about 2.2x the recent average, so there is real participation behind this. Up 8.9% over 24 hours.
DYOR
$PENGU #Crypto
🟢 $PENGU · 1H
$0.008601 keeps $PENGU on the stronger side of its hourly averages. $0.007555 on the low side and $0.008997 on the high side have contained the last three days. It is trading in the top third of the range right now. Resistance sits 4.6% above and support 12.2% below. Averages have been ordered the same way for 26 candles, with the 20 above the 50. Momentum is mid range with RSI at 67. The 24 hour range runs $0.007736 to $0.008997, and price is around the middle of it. Volume over the past day is running about 2.2x the recent average, so there is real participation behind this. Up 8.9% over 24 hours.
DYOR
$PENGU #Crypto
$0.008601 keeps $PENGU on the stronger side of its hourly averages. $0.007555 on the low side and $0.008997 on the high side have contained the last three days. It is trading in the top third of the range right now. Resistance sits 4.6% above and support 12.2% below. Averages have been ordered the same way for 26 candles, with the 20 above the 50. Momentum is mid range with RSI at 67. The 24 hour range runs $0.007736 to $0.008997, and price is around the middle of it. Volume over the past day is running about 2.2x the recent average, so there is real participation behind this. Up 8.9% over 24 hours.
DYOR
$PENGU #Crypto
1
1
784
·
--
🟢 $POL · 1H
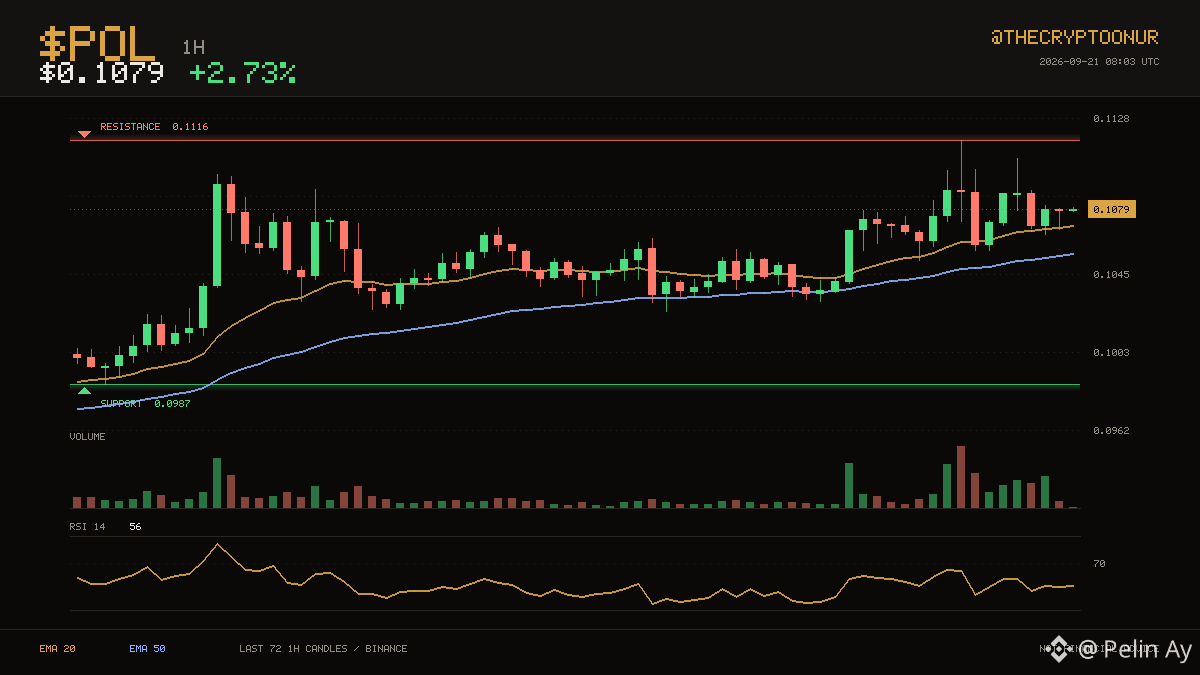
$0.1079 keeps $POL on the stronger side of its hourly averages. $0.0987 on the low side and $0.1116 on the high side have contained the last three days. Price is holding in the upper third of that range. That is 3.4% to the ceiling and 8.6% to the floor. The 20 has stayed above the 50 for a long stretch now. RSI at 56 is neutral, so momentum is not blocking a move either way. Over the past day it has traded between $0.1031 and $0.1116, sitting around the middle of it now. The last 24 hours carried roughly 1.5x normal volume. Up 2.7% over 24 hours.
DYOR
$POL #TechnicalAnalysis
🟢 $POL · 1H
$0.1079 keeps $POL on the stronger side of its hourly averages. $0.0987 on the low side and $0.1116 on the high side have contained the last three days. Price is holding in the upper third of that range. That is 3.4% to the ceiling and 8.6% to the floor. The 20 has stayed above the 50 for a long stretch now. RSI at 56 is neutral, so momentum is not blocking a move either way. Over the past day it has traded between $0.1031 and $0.1116, sitting around the middle of it now. The last 24 hours carried roughly 1.5x normal volume. Up 2.7% over 24 hours.
DYOR
$POL #TechnicalAnalysis
$0.1079 keeps $POL on the stronger side of its hourly averages. $0.0987 on the low side and $0.1116 on the high side have contained the last three days. Price is holding in the upper third of that range. That is 3.4% to the ceiling and 8.6% to the floor. The 20 has stayed above the 50 for a long stretch now. RSI at 56 is neutral, so momentum is not blocking a move either way. Over the past day it has traded between $0.1031 and $0.1116, sitting around the middle of it now. The last 24 hours carried roughly 1.5x normal volume. Up 2.7% over 24 hours.
DYOR
$POL #TechnicalAnalysis
2
592
·
--
📉 $牛来 · 1H
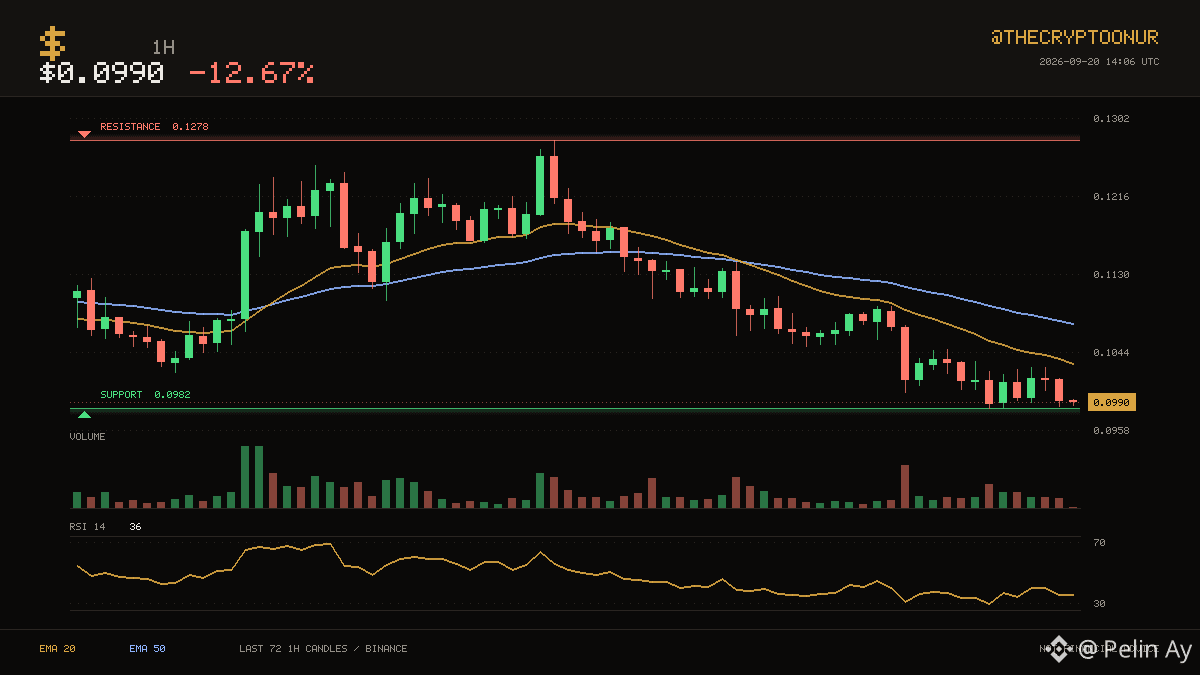
Buyers have been showing up around $0.0982, which is where price is sitting now. $牛来 is at $0.0990, under both its 20 and 50 hourly averages. It is sitting in the bottom third of the range. Support is the near one at 0.8% below; the range high is far above. Averages have been ordered the same way for 24 candles, with the 20 below the 50. Momentum is mid range with RSI at 36. The 24 hour range runs $0.0982 to $0.1134, and price is near the bottom of it. Volume is thin, around 0.6x the recent average, so moves here are easier to fade. Down 12.7% over 24 hours.
Binance spot data. DYOR
$牛来 #Binance
📉 $牛来 · 1H
Buyers have been showing up around $0.0982, which is where price is sitting now. $牛来 is at $0.0990, under both its 20 and 50 hourly averages. It is sitting in the bottom third of the range. Support is the near one at 0.8% below; the range high is far above. Averages have been ordered the same way for 24 candles, with the 20 below the 50. Momentum is mid range with RSI at 36. The 24 hour range runs $0.0982 to $0.1134, and price is near the bottom of it. Volume is thin, around 0.6x the recent average, so moves here are easier to fade. Down 12.7% over 24 hours.
Binance spot data. DYOR
$牛来 #Binance
Buyers have been showing up around $0.0982, which is where price is sitting now. $牛来 is at $0.0990, under both its 20 and 50 hourly averages. It is sitting in the bottom third of the range. Support is the near one at 0.8% below; the range high is far above. Averages have been ordered the same way for 24 candles, with the 20 below the 50. Momentum is mid range with RSI at 36. The 24 hour range runs $0.0982 to $0.1134, and price is near the bottom of it. Volume is thin, around 0.6x the recent average, so moves here are easier to fade. Down 12.7% over 24 hours.
Binance spot data. DYOR
$牛来 #Binance
1
580
·
--
📈 $HBAR · 1H
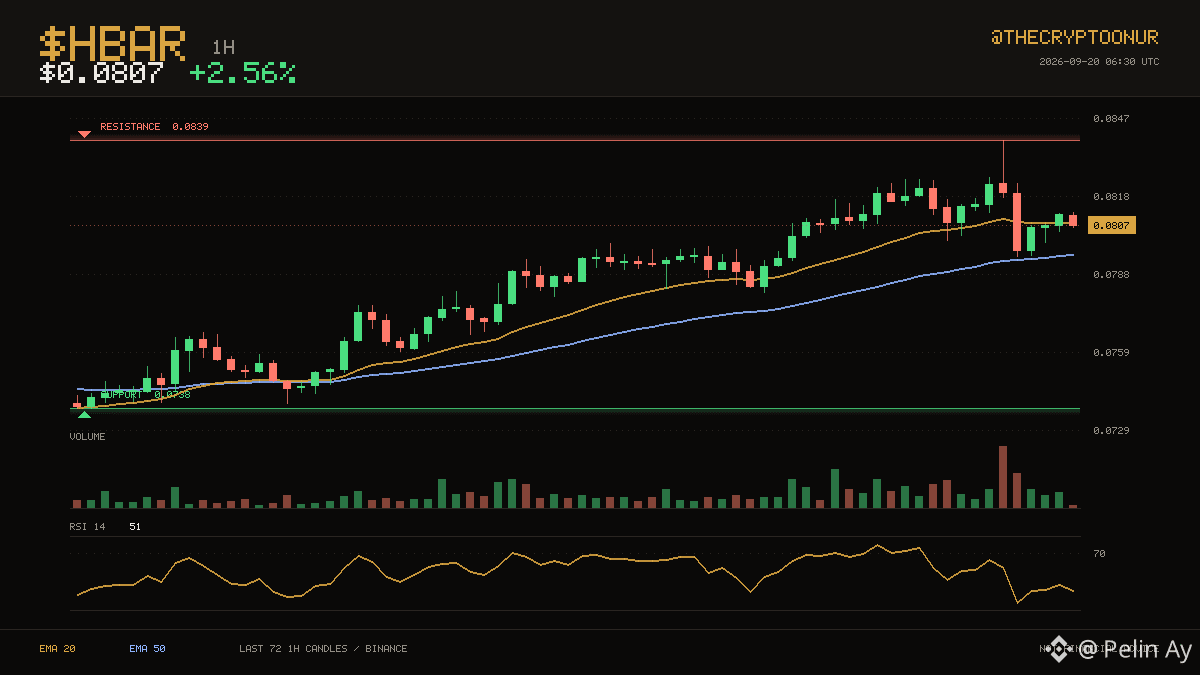
The action has stayed between $0.0738 and $0.0839 over the last three days. $HBAR is caught between its averages at $0.0807. Price is holding in the upper third of that range. That is 4.0% to the ceiling and 8.6% to the floor. The 20 has stayed above the 50 for a long stretch now. RSI at 51 is neutral, so momentum is not blocking a move either way. Over the past day it has traded between $0.0782 and $0.0839, sitting around the middle of it now. The last 24 hours carried roughly 1.8x normal volume. Up 2.6% over 24 hours.
DYOR
$HBAR #Binance
📈 $HBAR · 1H
The action has stayed between $0.0738 and $0.0839 over the last three days. $HBAR is caught between its averages at $0.0807. Price is holding in the upper third of that range. That is 4.0% to the ceiling and 8.6% to the floor. The 20 has stayed above the 50 for a long stretch now. RSI at 51 is neutral, so momentum is not blocking a move either way. Over the past day it has traded between $0.0782 and $0.0839, sitting around the middle of it now. The last 24 hours carried roughly 1.8x normal volume. Up 2.6% over 24 hours.
DYOR
$HBAR #Binance
The action has stayed between $0.0738 and $0.0839 over the last three days. $HBAR is caught between its averages at $0.0807. Price is holding in the upper third of that range. That is 4.0% to the ceiling and 8.6% to the floor. The 20 has stayed above the 50 for a long stretch now. RSI at 51 is neutral, so momentum is not blocking a move either way. Over the past day it has traded between $0.0782 and $0.0839, sitting around the middle of it now. The last 24 hours carried roughly 1.8x normal volume. Up 2.6% over 24 hours.
DYOR
$HBAR #Binance
2
847
·
--
📉 $牛来 · 1H
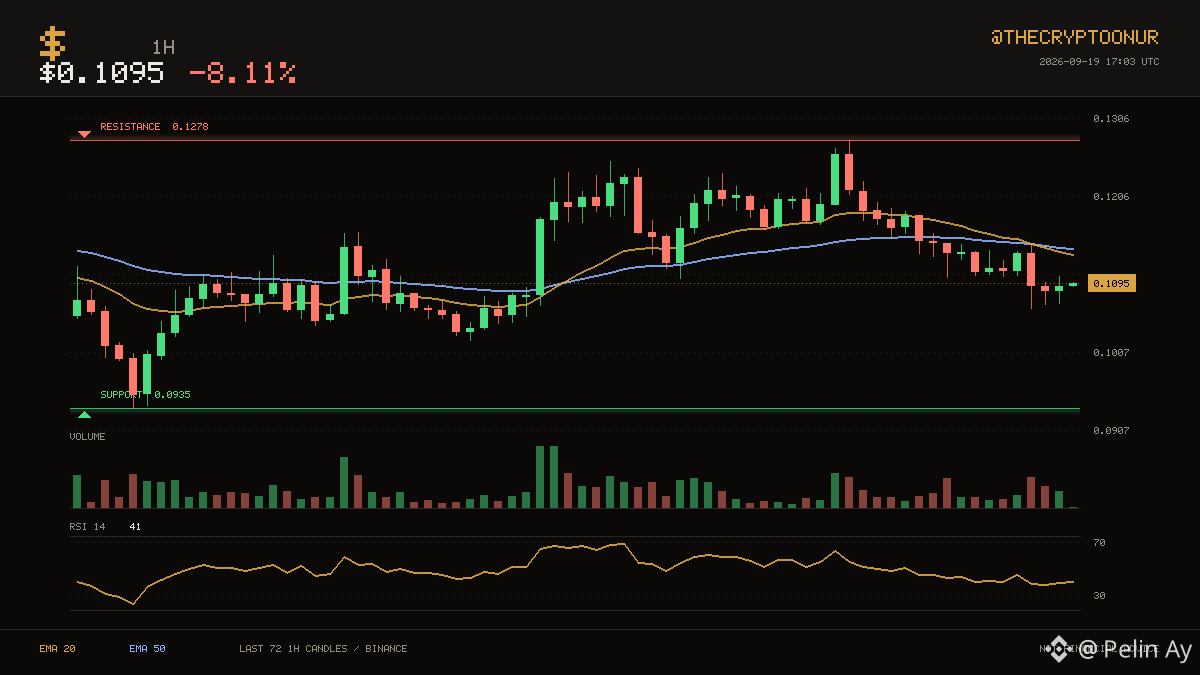
The action has stayed between $0.0935 and $0.1278 over the last three days. $牛来 is at $0.1095, under both its 20 and 50 hourly averages. That puts price in the middle of the range. The floor is 14.7% away and the ceiling is nowhere close. The 20 crossed below the 50 recently, for only 3 candles, so this leg is still young. RSI at 41 is neutral, so momentum is not blocking a move either way. Over the past day it has traded between $0.1063 and $0.1278, sitting near the bottom of it now. Participation is light at about 0.6x average volume. Down 8.1% over 24 hours.
DYOR
$牛来 #Binance
📉 $牛来 · 1H
The action has stayed between $0.0935 and $0.1278 over the last three days. $牛来 is at $0.1095, under both its 20 and 50 hourly averages. That puts price in the middle of the range. The floor is 14.7% away and the ceiling is nowhere close. The 20 crossed below the 50 recently, for only 3 candles, so this leg is still young. RSI at 41 is neutral, so momentum is not blocking a move either way. Over the past day it has traded between $0.1063 and $0.1278, sitting near the bottom of it now. Participation is light at about 0.6x average volume. Down 8.1% over 24 hours.
DYOR
$牛来 #Binance
The action has stayed between $0.0935 and $0.1278 over the last three days. $牛来 is at $0.1095, under both its 20 and 50 hourly averages. That puts price in the middle of the range. The floor is 14.7% away and the ceiling is nowhere close. The 20 crossed below the 50 recently, for only 3 candles, so this leg is still young. RSI at 41 is neutral, so momentum is not blocking a move either way. Over the past day it has traded between $0.1063 and $0.1278, sitting near the bottom of it now. Participation is light at about 0.6x average volume. Down 8.1% over 24 hours.
DYOR
$牛来 #Binance
720
Connectez-vous pour découvrir plus de contenu
Rejoignez la communauté mondiale des adeptes de cryptomonnaies sur Binance Square
⚡️ Suviez les dernières informations importantes sur les cryptomonnaies.
💬 Jugé digne de confiance par la plus grande plateforme d’échange de cryptomonnaies au monde.
👍 Découvrez les connaissances que partagent les créateurs vérifiés.
Adresse e-mail/Nº de téléphone
Sujets d’actualité
BitwiseFilesFinalNEARSpotETFProspectus
83,857 vues
1,377 mentions
#bitwisefilesfinalnearspotetfprospectus
Can $NEAR REALLY reach $562 with an ETF approval? 🚀
The crypto market is buzzing as Bitwise files its final prospectus for a Spot NEAR ETF (Ticker: NRR on NYSE Arca)! 📊🔥
Is institutional money about to unleash the biggest pump in NEAR’s history? Analysts are throwing around mind-blowing price targets:
🎯 Intermediate Target: $155
🎯 2030 Long-Term Target: $562
💡 Let's do the math:
At $562, $NEAR would sit at roughly a $680 Billion market cap—putting it right up there with Ethereum's potential valuation. With NEAR leading the Chain Abstraction & AI crypto narrative, this might not be as crazy as it sounds!
With SEC regulations turning more crypto-friendly and Wall Street knocking on the door, are you Accumulating or Holding?
👇 Drop your realistic price prediction for $NEAR in the comments! 👇
#BitwiseFilesFinalNEARSpotETFProspectus #Altcoins #CryptoNews #ETF
Doomsday-Trader
·6 mentions J’aime
·3.7k vues
BitgetHackerMoves$83MStolenXRP
32,047 vues
160 mentions
SOLSpotETFWeeklyInflow$188M
21,074 vues
131 mentions