

Henry Insights
5.9k Publications

Henry Insights
 Binance Square Vérifié
Signaler
Bloquer l’utilisateur
Ouvert au trading
Trade régulièrement
4.9 an(s)
118 Suivis
66.2K+ Abonnés
48.5K+ J’aime
Publications
Portefeuille
Tous
Citations
Vidéos
PINNED
BITCOIN UNDER $30K. 😨
Yes, the pain exists right now but more of it is coming.
Just when I was convinced that the "BOTTOM IS IN"
This happened 👀
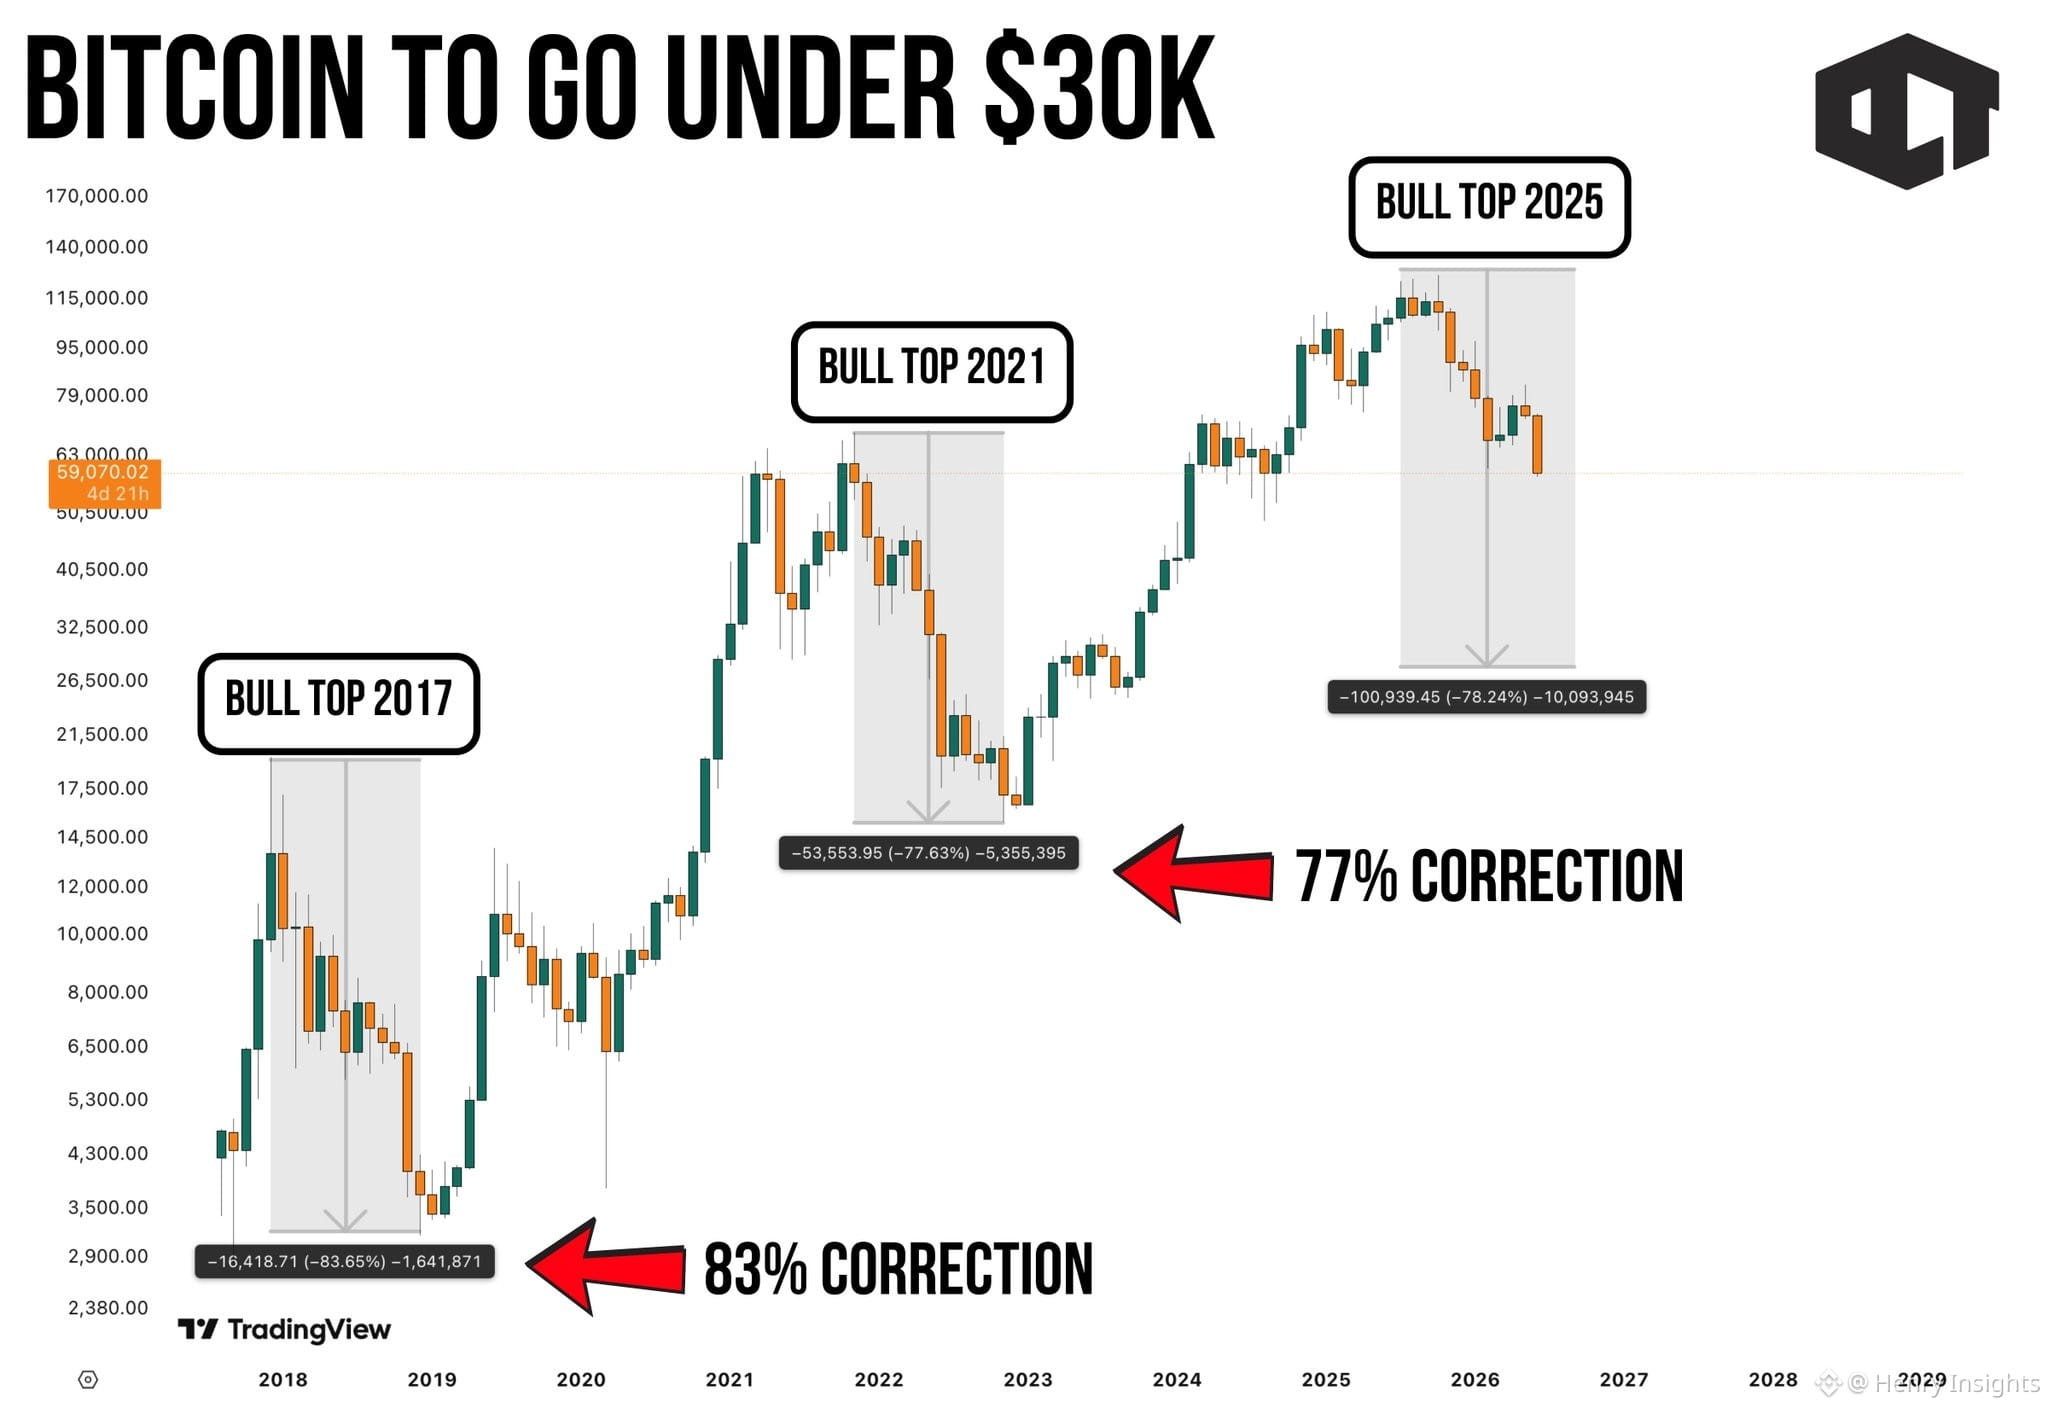
Bitcoin has already gone through this twice before. After the 2017 bull top, BTC corrected around 83%.
After the 2021 bull top, BTC corrected around 77%.
If 2025 was another cycle top, then a similar correction puts Bitcoin somewhere near or under $30K.
That is the scary part.
Because the market is still pricing this like the bear market is about to be over.
👉 THE FINAL BLEED PHASE
The worst part of every Bitcoin cycle usually comes after people stop believing the crash can go deeper.
Just like in March 2022, when 2 green months made everyone believe that the bottom was in.
At first, the dip feels healthy. Then it becomes frustrating.
Then it becomes boring. Then suddenly the final leg down wipes out everyone who survived the first few drops.
That is where this chart gets uncomfortable.
BTC is already trading far below the 2025 highs, momentum is weak, and the structure looks like it could be entering the same late-cycle bleed zone that destroyed confidence in 2018 and 2022.
👉 ALTS COULD GET HIT HARDER
If Bitcoin really moves toward $30K, altcoins will not just “correct.”
They will get repriced.
Most alts are already bleeding against BTC. Liquidity is thin. Retail attention is gone.
And if Bitcoin loses another major leg, the market will likely rotate into survival mode again.
That means forced selling, broken supports, lower liquidity, and brutal candles across the board.
This is where portfolios can look fine one week and completely wrecked the next.
👉 BUT HERE IS THE TWIST
The same zone that creates the most fear can also create the real bottom.
Every cycle bottom looks obvious only after the recovery starts.
So yes, this chart looks dangerous. Bitcoin under $30K is no longer a crazy thought if the old correction pattern repeats.
But there is another pattern that tells how this is the bottom.
Stay tuned for the next update.
#BTC☀ #CryptoNewss #BinanceSquareFamily
BITCOIN UNDER $30K. 😨
Yes, the pain exists right now but more of it is coming.
Just when I was convinced that the "BOTTOM IS IN"
This happened 👀
Bitcoin has already gone through this twice before. After the 2017 bull top, BTC corrected around 83%.
After the 2021 bull top, BTC corrected around 77%.
If 2025 was another cycle top, then a similar correction puts Bitcoin somewhere near or under $30K.
That is the scary part.
Because the market is still pricing this like the bear market is about to be over.
👉 THE FINAL BLEED PHASE
The worst part of every Bitcoin cycle usually comes after people stop believing the crash can go deeper.
Just like in March 2022, when 2 green months made everyone believe that the bottom was in.
At first, the dip feels healthy. Then it becomes frustrating.
Then it becomes boring. Then suddenly the final leg down wipes out everyone who survived the first few drops.
That is where this chart gets uncomfortable.
BTC is already trading far below the 2025 highs, momentum is weak, and the structure looks like it could be entering the same late-cycle bleed zone that destroyed confidence in 2018 and 2022.
👉 ALTS COULD GET HIT HARDER
If Bitcoin really moves toward $30K, altcoins will not just “correct.”
They will get repriced.
Most alts are already bleeding against BTC. Liquidity is thin. Retail attention is gone.
And if Bitcoin loses another major leg, the market will likely rotate into survival mode again.
That means forced selling, broken supports, lower liquidity, and brutal candles across the board.
This is where portfolios can look fine one week and completely wrecked the next.
👉 BUT HERE IS THE TWIST
The same zone that creates the most fear can also create the real bottom.
Every cycle bottom looks obvious only after the recovery starts.
So yes, this chart looks dangerous. Bitcoin under $30K is no longer a crazy thought if the old correction pattern repeats.
But there is another pattern that tells how this is the bottom.
Stay tuned for the next update.
#BTC☀ #CryptoNewss #BinanceSquareFamily
Yes, the pain exists right now but more of it is coming.
Just when I was convinced that the "BOTTOM IS IN"
This happened 👀
Bitcoin has already gone through this twice before. After the 2017 bull top, BTC corrected around 83%.
After the 2021 bull top, BTC corrected around 77%.
If 2025 was another cycle top, then a similar correction puts Bitcoin somewhere near or under $30K.
That is the scary part.
Because the market is still pricing this like the bear market is about to be over.
👉 THE FINAL BLEED PHASE
The worst part of every Bitcoin cycle usually comes after people stop believing the crash can go deeper.
Just like in March 2022, when 2 green months made everyone believe that the bottom was in.
At first, the dip feels healthy. Then it becomes frustrating.
Then it becomes boring. Then suddenly the final leg down wipes out everyone who survived the first few drops.
That is where this chart gets uncomfortable.
BTC is already trading far below the 2025 highs, momentum is weak, and the structure looks like it could be entering the same late-cycle bleed zone that destroyed confidence in 2018 and 2022.
👉 ALTS COULD GET HIT HARDER
If Bitcoin really moves toward $30K, altcoins will not just “correct.”
They will get repriced.
Most alts are already bleeding against BTC. Liquidity is thin. Retail attention is gone.
And if Bitcoin loses another major leg, the market will likely rotate into survival mode again.
That means forced selling, broken supports, lower liquidity, and brutal candles across the board.
This is where portfolios can look fine one week and completely wrecked the next.
👉 BUT HERE IS THE TWIST
The same zone that creates the most fear can also create the real bottom.
Every cycle bottom looks obvious only after the recovery starts.
So yes, this chart looks dangerous. Bitcoin under $30K is no longer a crazy thought if the old correction pattern repeats.
But there is another pattern that tells how this is the bottom.
Stay tuned for the next update.
#BTC☀ #CryptoNewss #BinanceSquareFamily
26
40
43.7k
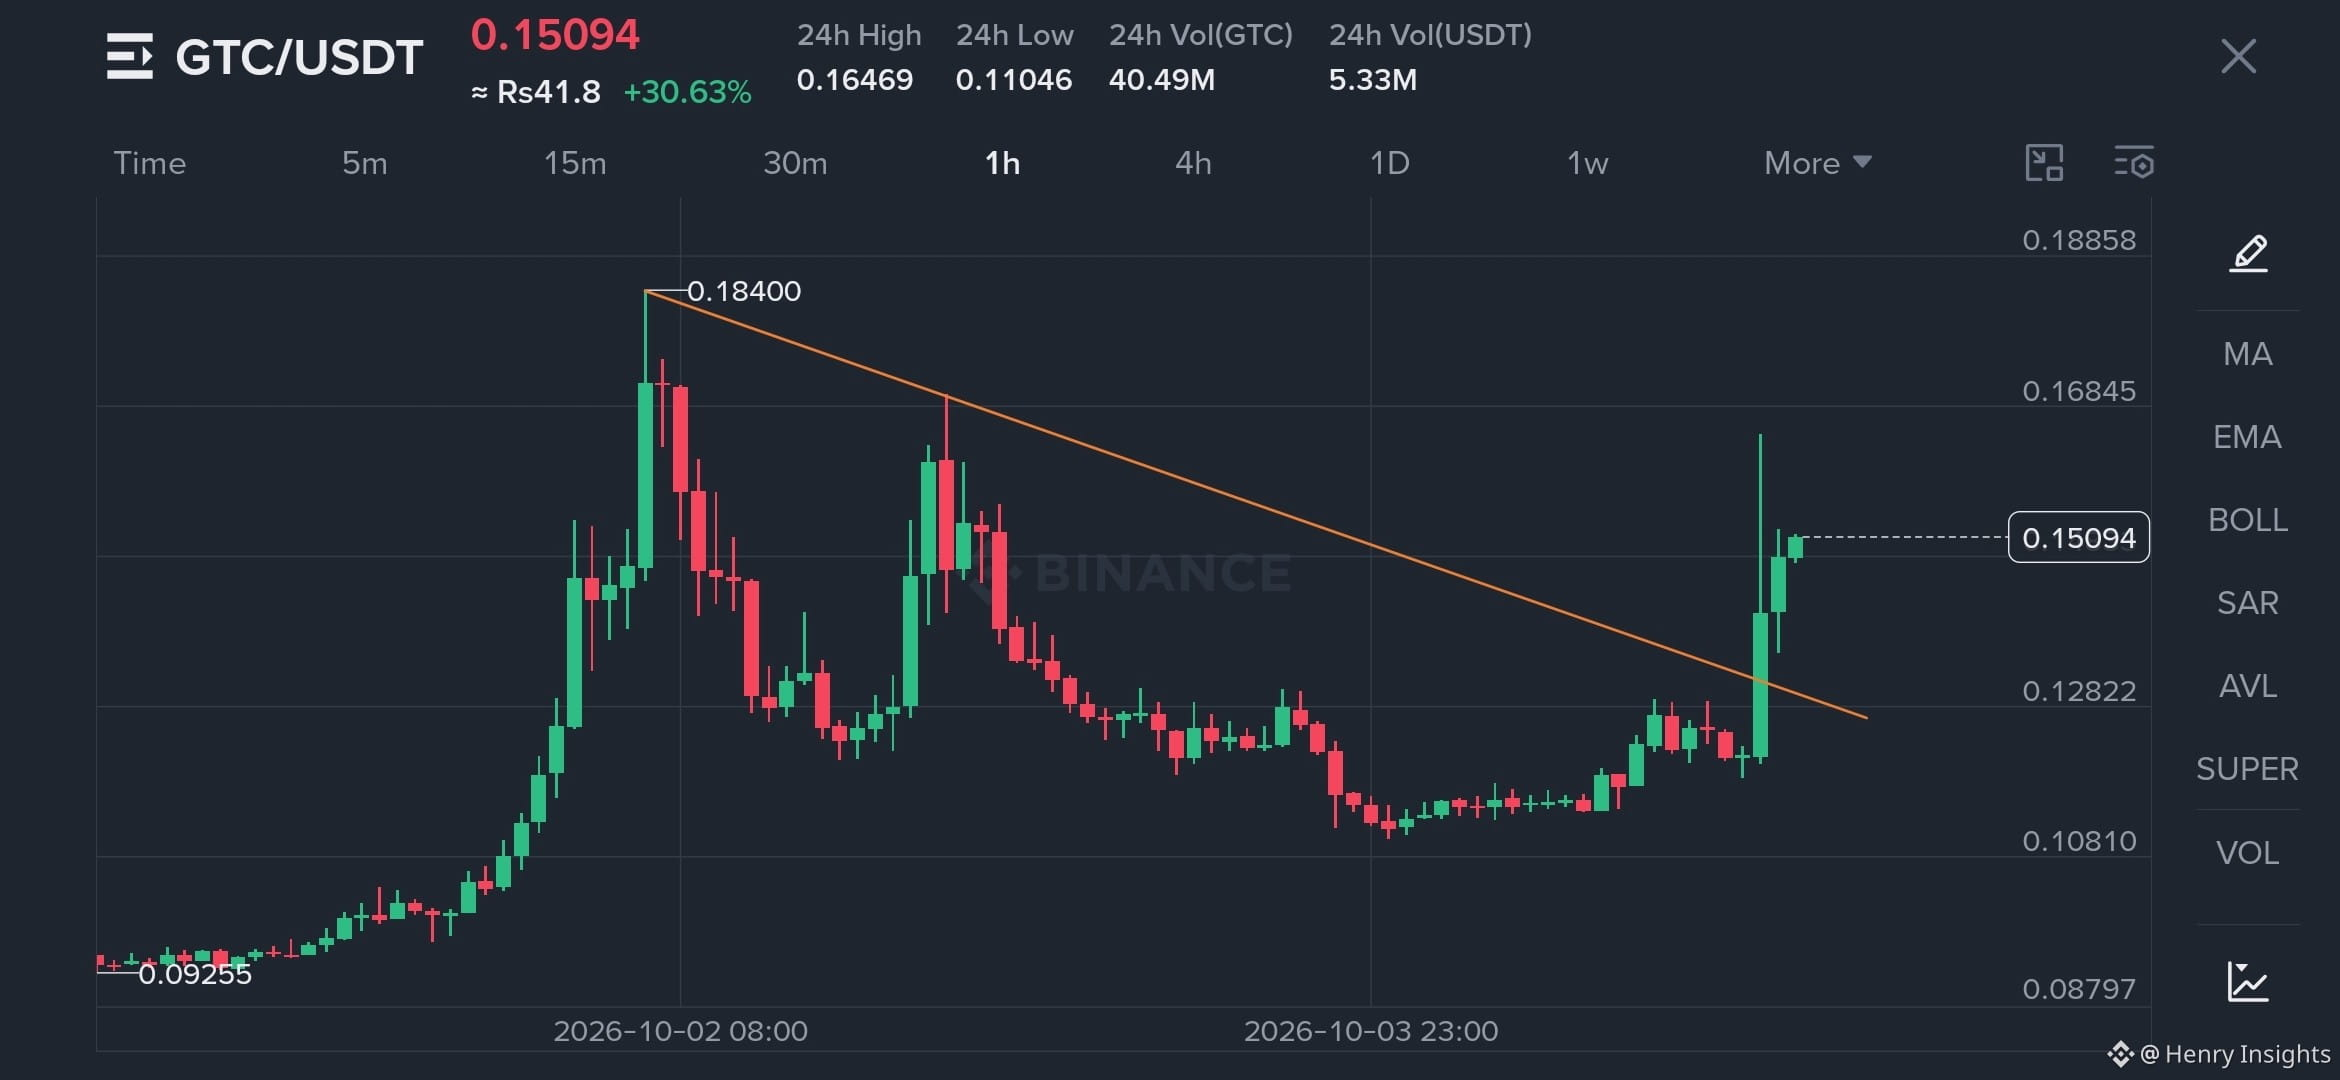
$GTC final dips
before it prints a massive green candle within 1h
Save this tweet and remind me in couple of hours.
$GTC final dips
before it prints a massive green candle within 1h
Save this tweet and remind me in couple of hours.
before it prints a massive green candle within 1h
Save this tweet and remind me in couple of hours.
3
142
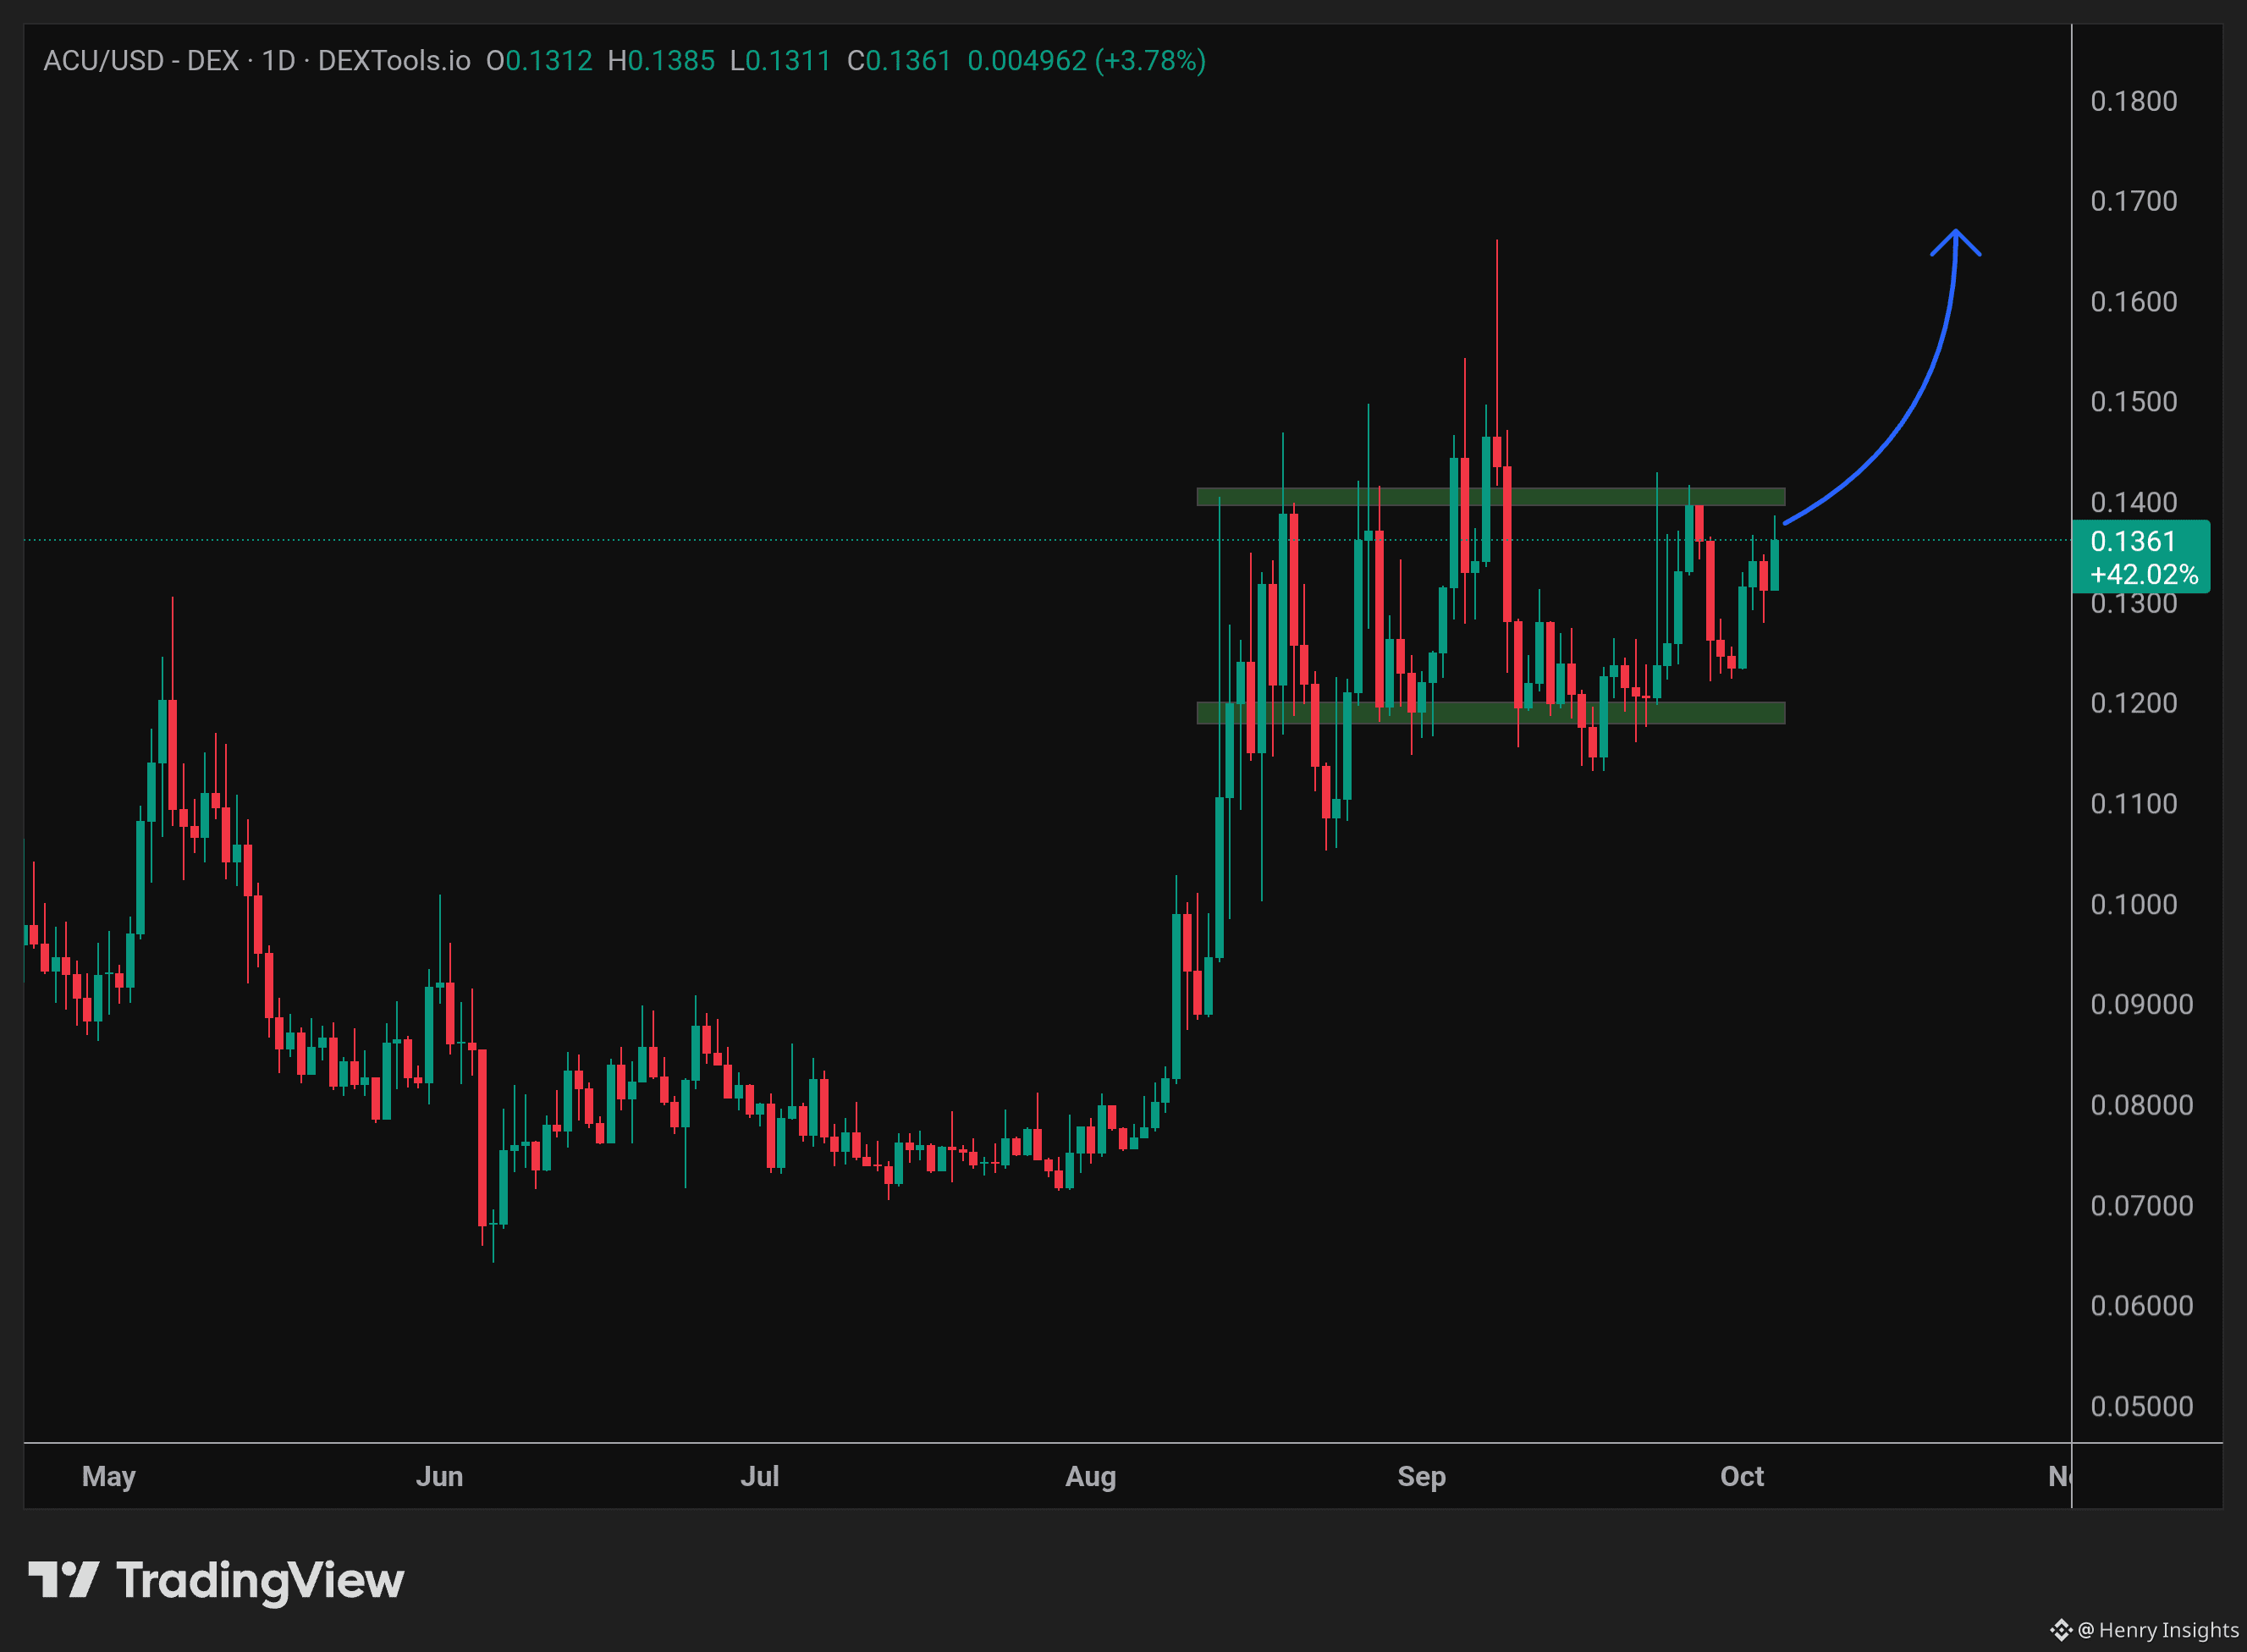
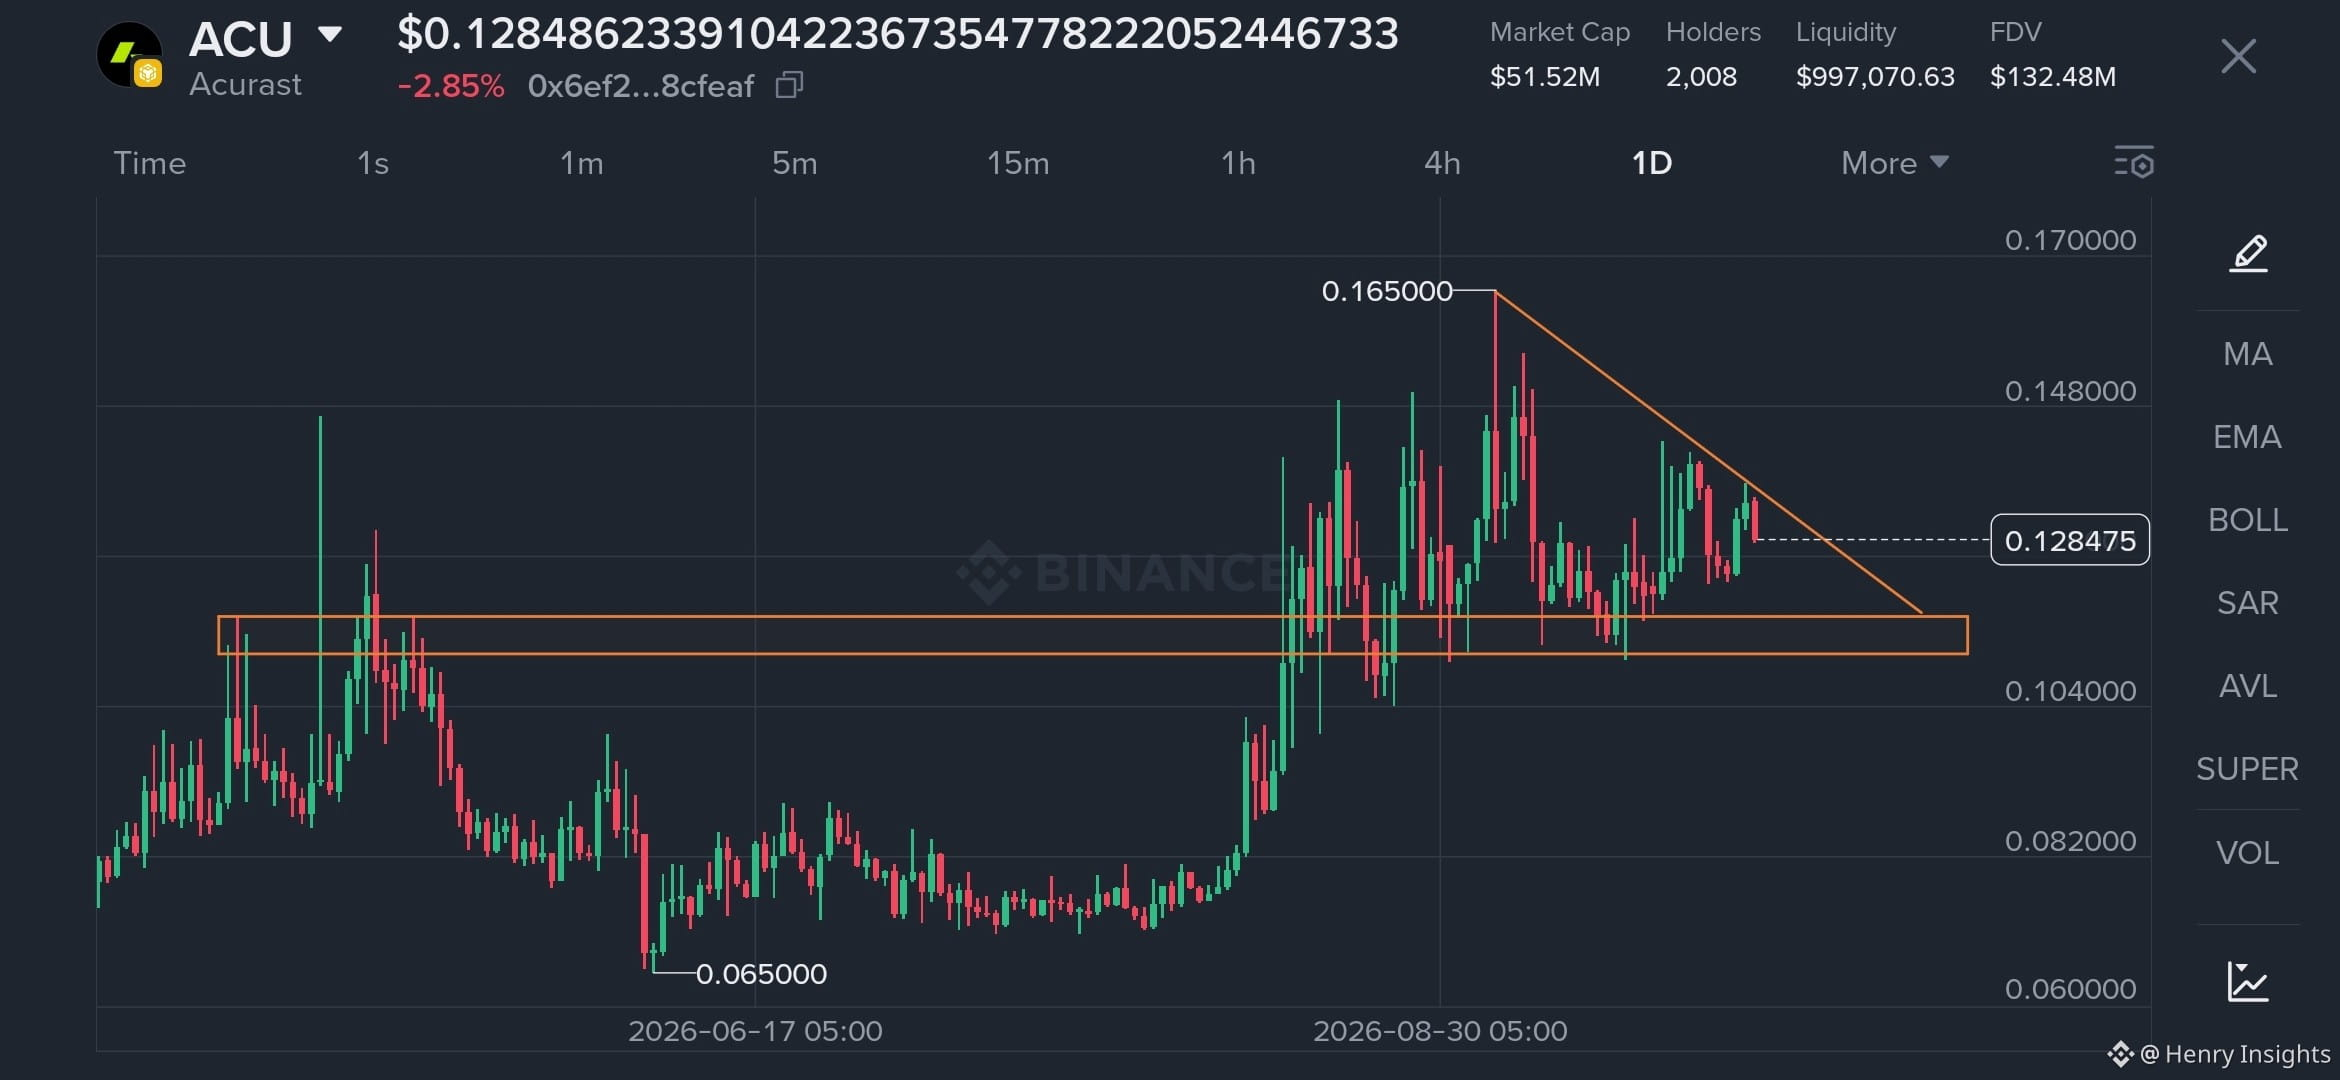
$ACU looking primed for expansion.
The Razor Navigator is flashing strong bullish confluence across timeframes:
🔹 State: Bullish (HTF Bull)
🔹 Power / TQI: 74% / 72% Strong
🔹 Regime: Trending
Entry: 0.13079
TP1: 0.13995
TP2: 0.14758
TP3: 0.15673
SL: 0.11553
Price is bouncing clean off entry and pushing up toward TP1. Momentum looks solid.
#ACUSDT #Acurast
$ACU looking primed for expansion.
The Razor Navigator is flashing strong bullish confluence across timeframes:
🔹 State: Bullish (HTF Bull)
🔹 Power / TQI: 74% / 72% Strong
🔹 Regime: Trending
Entry: 0.13079
TP1: 0.13995
TP2: 0.14758
TP3: 0.15673
SL: 0.11553
Price is bouncing clean off entry and pushing up toward TP1. Momentum looks solid.
#ACUSDT #Acurast
The Razor Navigator is flashing strong bullish confluence across timeframes:
🔹 State: Bullish (HTF Bull)
🔹 Power / TQI: 74% / 72% Strong
🔹 Regime: Trending
Entry: 0.13079
TP1: 0.13995
TP2: 0.14758
TP3: 0.15673
SL: 0.11553
Price is bouncing clean off entry and pushing up toward TP1. Momentum looks solid.
#ACUSDT #Acurast
2
270
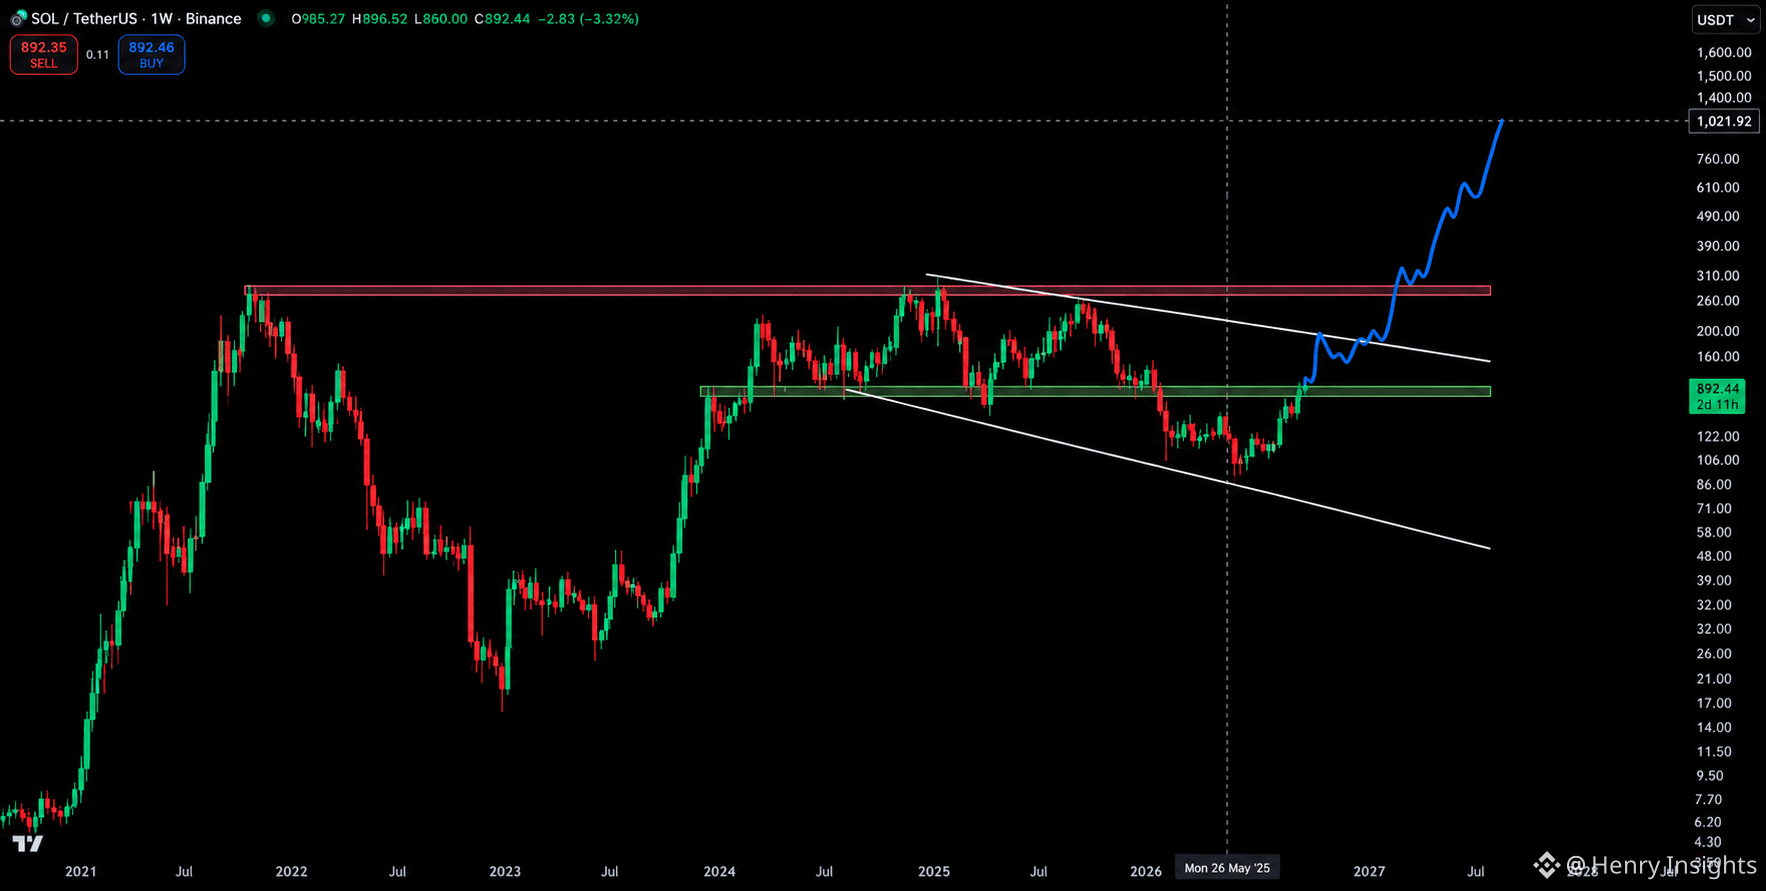
$SOL
Could Solana be heading to $1k per coin in 2027?
Let's take a look at the chart...
$SOL
Could Solana be heading to $1k per coin in 2027?
Let's take a look at the chart...
Could Solana be heading to $1k per coin in 2027?
Let's take a look at the chart...
385
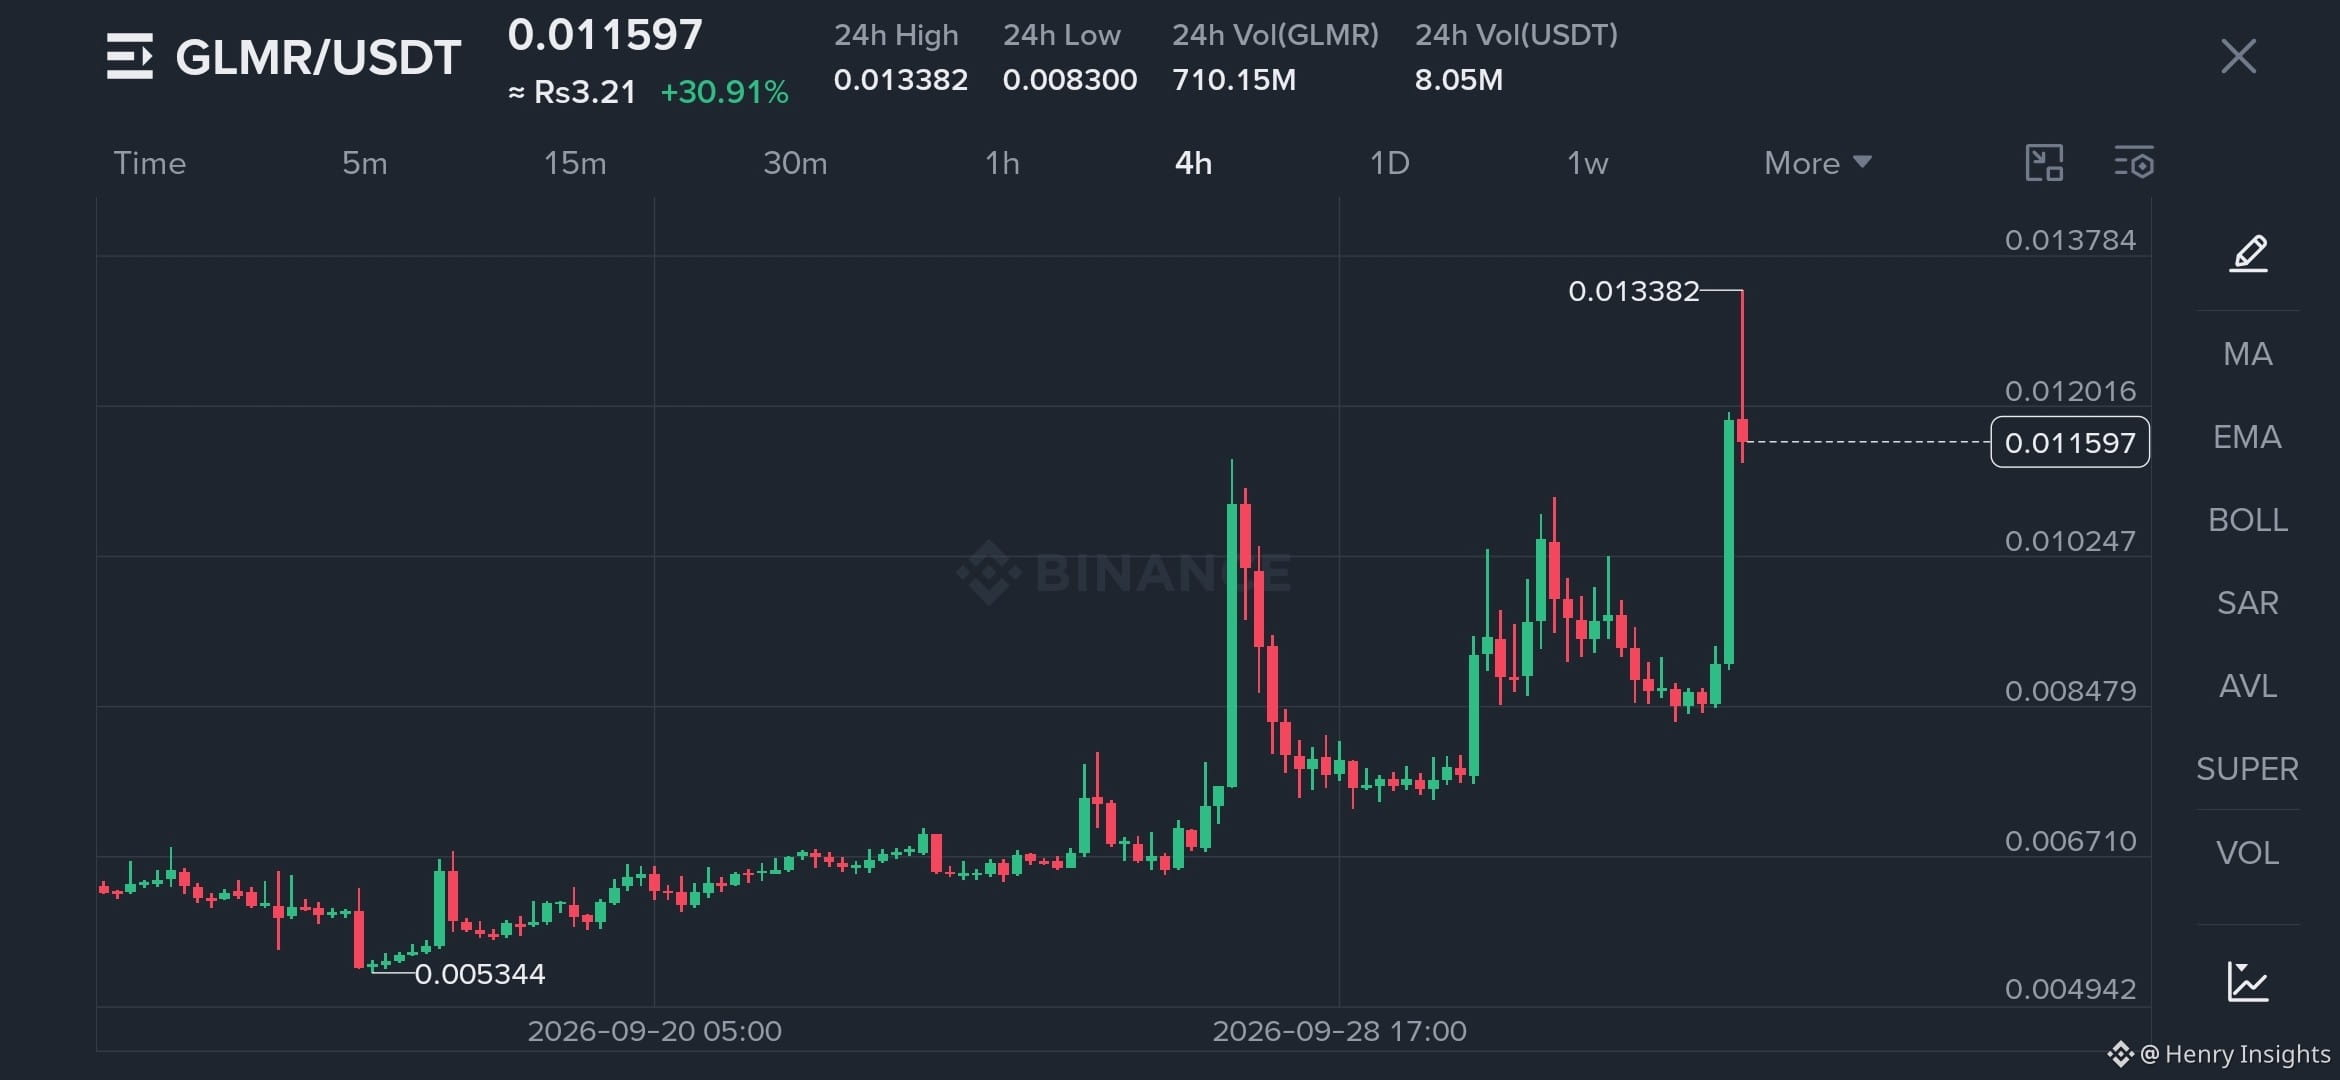
$GLMR /USDT — BOOM BOOM! ✈️ Flight Ready… Next Stop THE MOON!
$GLMR /USDT — BOOM BOOM! ✈️ Flight Ready… Next Stop THE MOON!
1
142
#Polymarket has transformed into a powerful platform for tracking real-time information and market sentiment.
Unlike traditional platforms with static predictions, the probabilities here move constantly based on order book activity, user trades, and fresh news. Traded YES and NO positions adjust instantly as new details emerge across crypto, finance, technology, and global events.
The real strength lies in this dynamic flow: news breaks, traders react, and market probabilities adjust within seconds. This live reflection of global consensus makes it a unique tool for monitoring market trends.
NFA.
#Polymarket has transformed into a powerful platform for tracking real-time information and market sentiment.
Unlike traditional platforms with static predictions, the probabilities here move constantly based on order book activity, user trades, and fresh news. Traded YES and NO positions adjust instantly as new details emerge across crypto, finance, technology, and global events.
The real strength lies in this dynamic flow: news breaks, traders react, and market probabilities adjust within seconds. This live reflection of global consensus makes it a unique tool for monitoring market trends.
NFA.
Unlike traditional platforms with static predictions, the probabilities here move constantly based on order book activity, user trades, and fresh news. Traded YES and NO positions adjust instantly as new details emerge across crypto, finance, technology, and global events.
The real strength lies in this dynamic flow: news breaks, traders react, and market probabilities adjust within seconds. This live reflection of global consensus makes it a unique tool for monitoring market trends.
NFA.

1
280
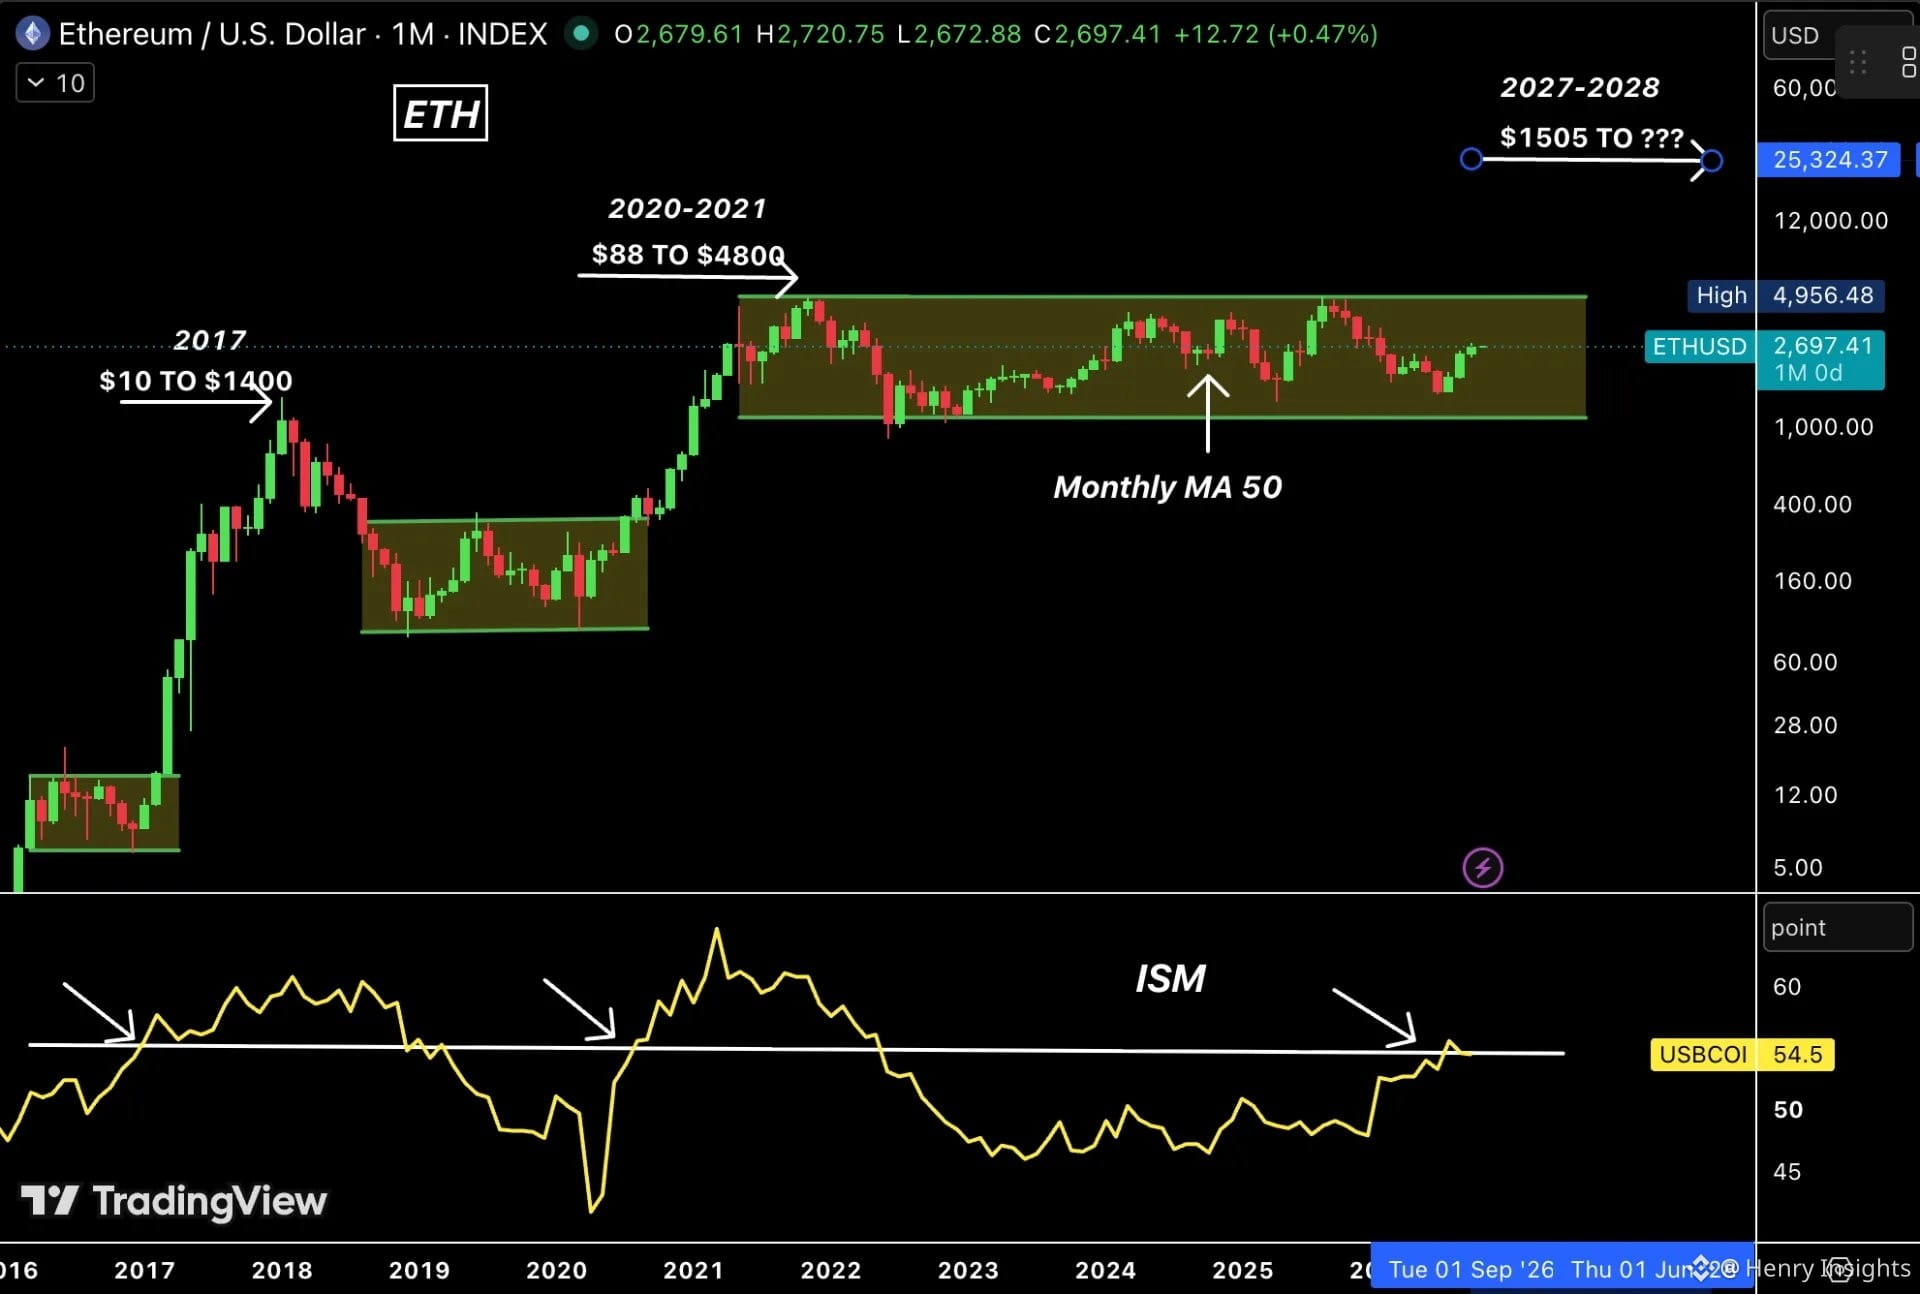
$ETH IS STILL WAITING FOR ITS BIGGEST BULLISH SIGNAL.
2017: ISM broke above 56, and then ETH rallied from $10 to $1,400.
2020 to 2021: ISM broke above 56, and then ETH rallied from $88 to $4,800.
Today, ISM came in at 54.5, slightly below the 54.8 forecast and 54.6 previous.
So the setup is still alive, but 56 remains the key level that triggered the parabolic phase in the last 2 cycles.
ETH is currently around $2,695, sitting on the Monthly MA 50.
If ISM continues moving higher toward 60 in the coming months, we could see another massive ETH and altcoin cycle in 2027 to 2028.
$ETH IS STILL WAITING FOR ITS BIGGEST BULLISH SIGNAL.
2017: ISM broke above 56, and then ETH rallied from $10 to $1,400.
2020 to 2021: ISM broke above 56, and then ETH rallied from $88 to $4,800.
Today, ISM came in at 54.5, slightly below the 54.8 forecast and 54.6 previous.
So the setup is still alive, but 56 remains the key level that triggered the parabolic phase in the last 2 cycles.
ETH is currently around $2,695, sitting on the Monthly MA 50.
If ISM continues moving higher toward 60 in the coming months, we could see another massive ETH and altcoin cycle in 2027 to 2028.
2017: ISM broke above 56, and then ETH rallied from $10 to $1,400.
2020 to 2021: ISM broke above 56, and then ETH rallied from $88 to $4,800.
Today, ISM came in at 54.5, slightly below the 54.8 forecast and 54.6 previous.
So the setup is still alive, but 56 remains the key level that triggered the parabolic phase in the last 2 cycles.
ETH is currently around $2,695, sitting on the Monthly MA 50.
If ISM continues moving higher toward 60 in the coming months, we could see another massive ETH and altcoin cycle in 2027 to 2028.
2
173
·
--
Haussier
$MOVR Breakdown.
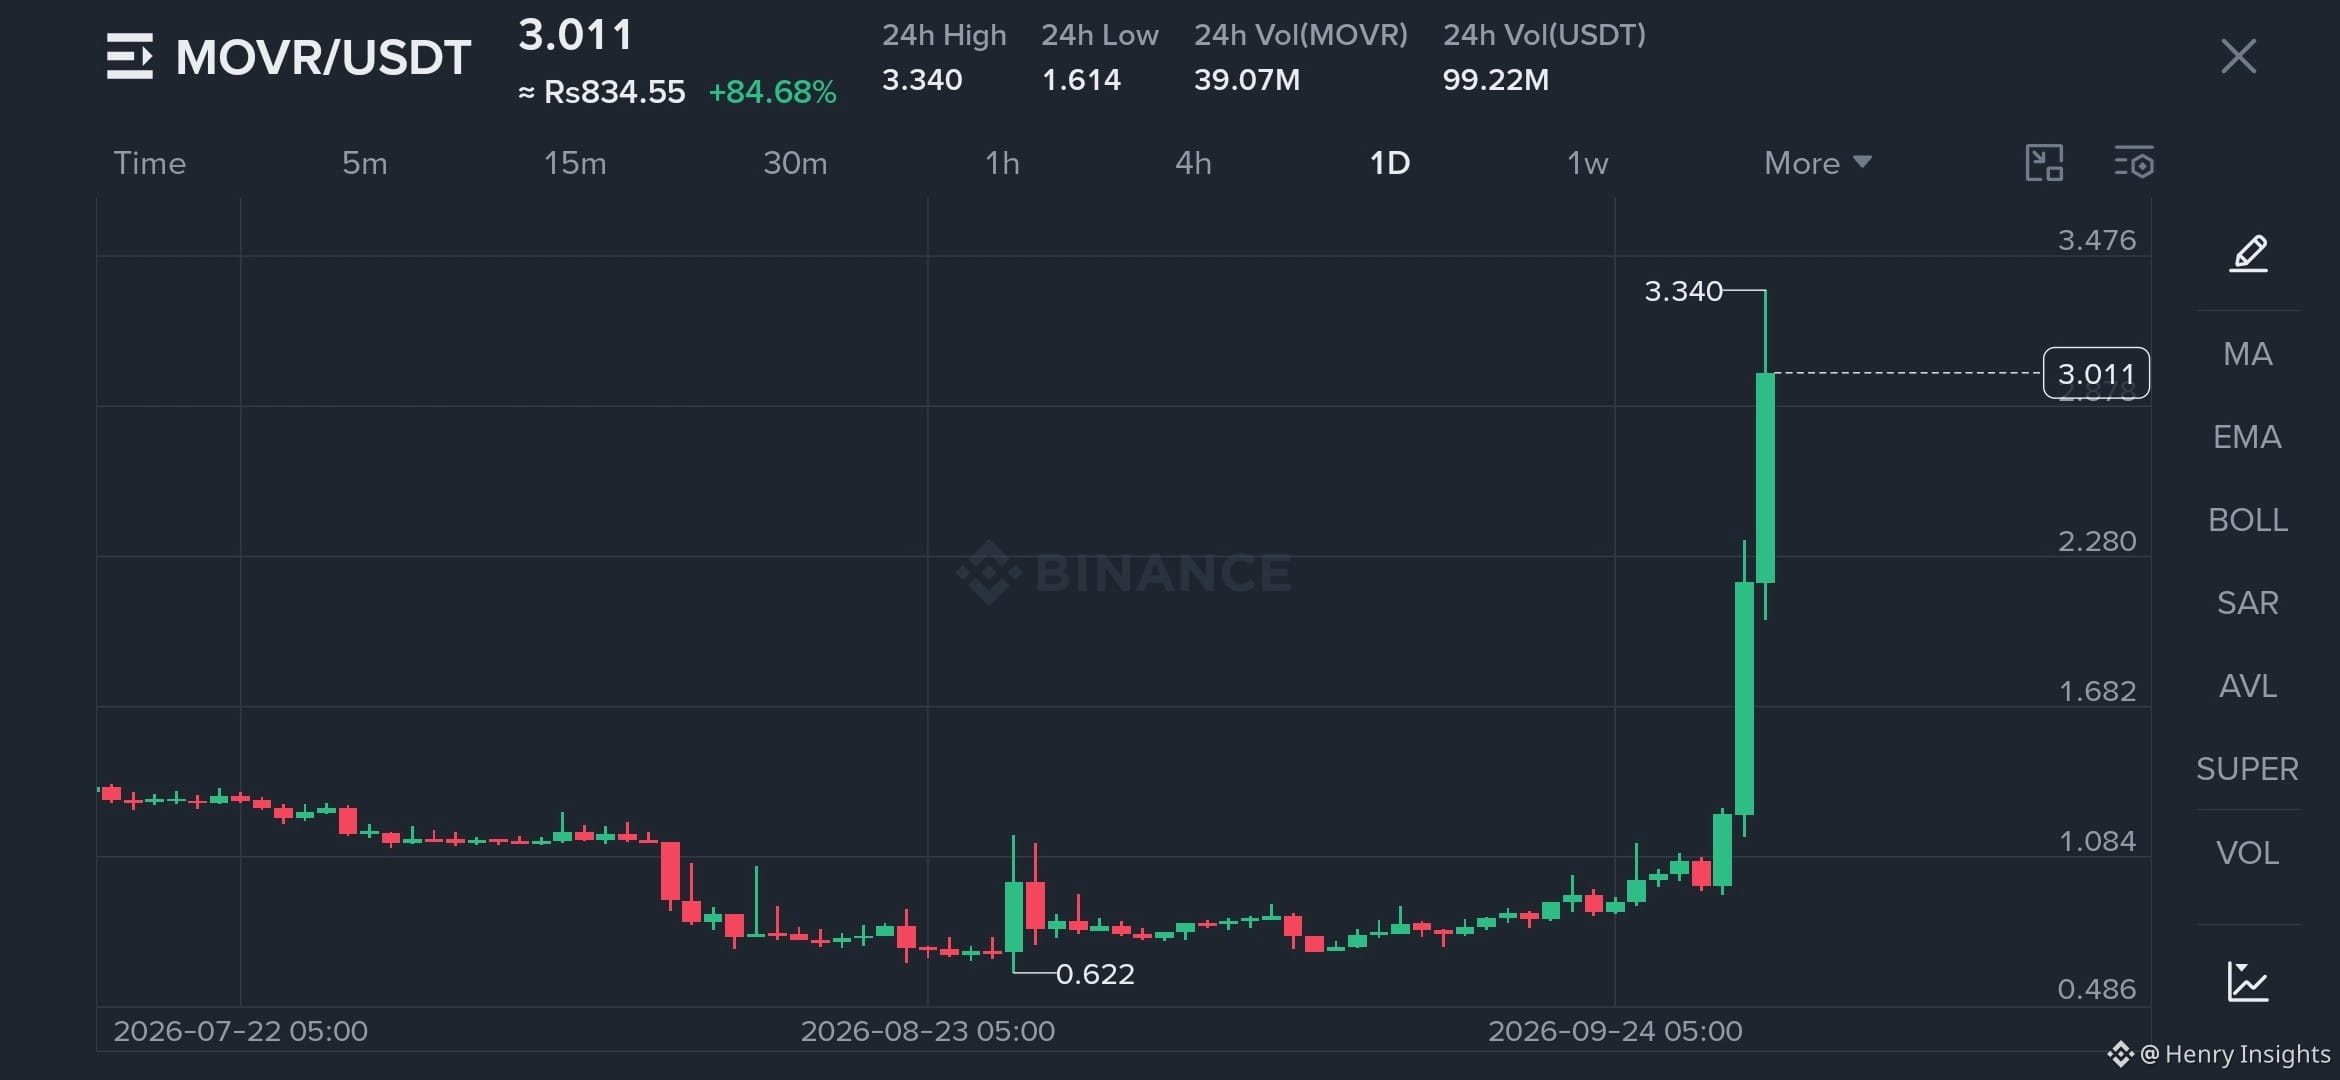
MOVR has seen a strong parabolic breakout from the 0.622 support region, driven by high trading volume. The price is up over 84%, showing intense buying pressure.
Key Levels:
Current Price: 3.011
24h High: 3.340
Immediate Support: 2.280
Next Resistance: 3.476
As long as the volume stays high, the bullish momentum can continue toward higher targets after any healthy retests.
$MOVR Breakdown.
MOVR has seen a strong parabolic breakout from the 0.622 support region, driven by high trading volume. The price is up over 84%, showing intense buying pressure.
Key Levels:
Current Price: 3.011
24h High: 3.340
Immediate Support: 2.280
Next Resistance: 3.476
As long as the volume stays high, the bullish momentum can continue toward higher targets after any healthy retests.
MOVR has seen a strong parabolic breakout from the 0.622 support region, driven by high trading volume. The price is up over 84%, showing intense buying pressure.
Key Levels:
Current Price: 3.011
24h High: 3.340
Immediate Support: 2.280
Next Resistance: 3.476
As long as the volume stays high, the bullish momentum can continue toward higher targets after any healthy retests.
1
119
·
--
Haussier
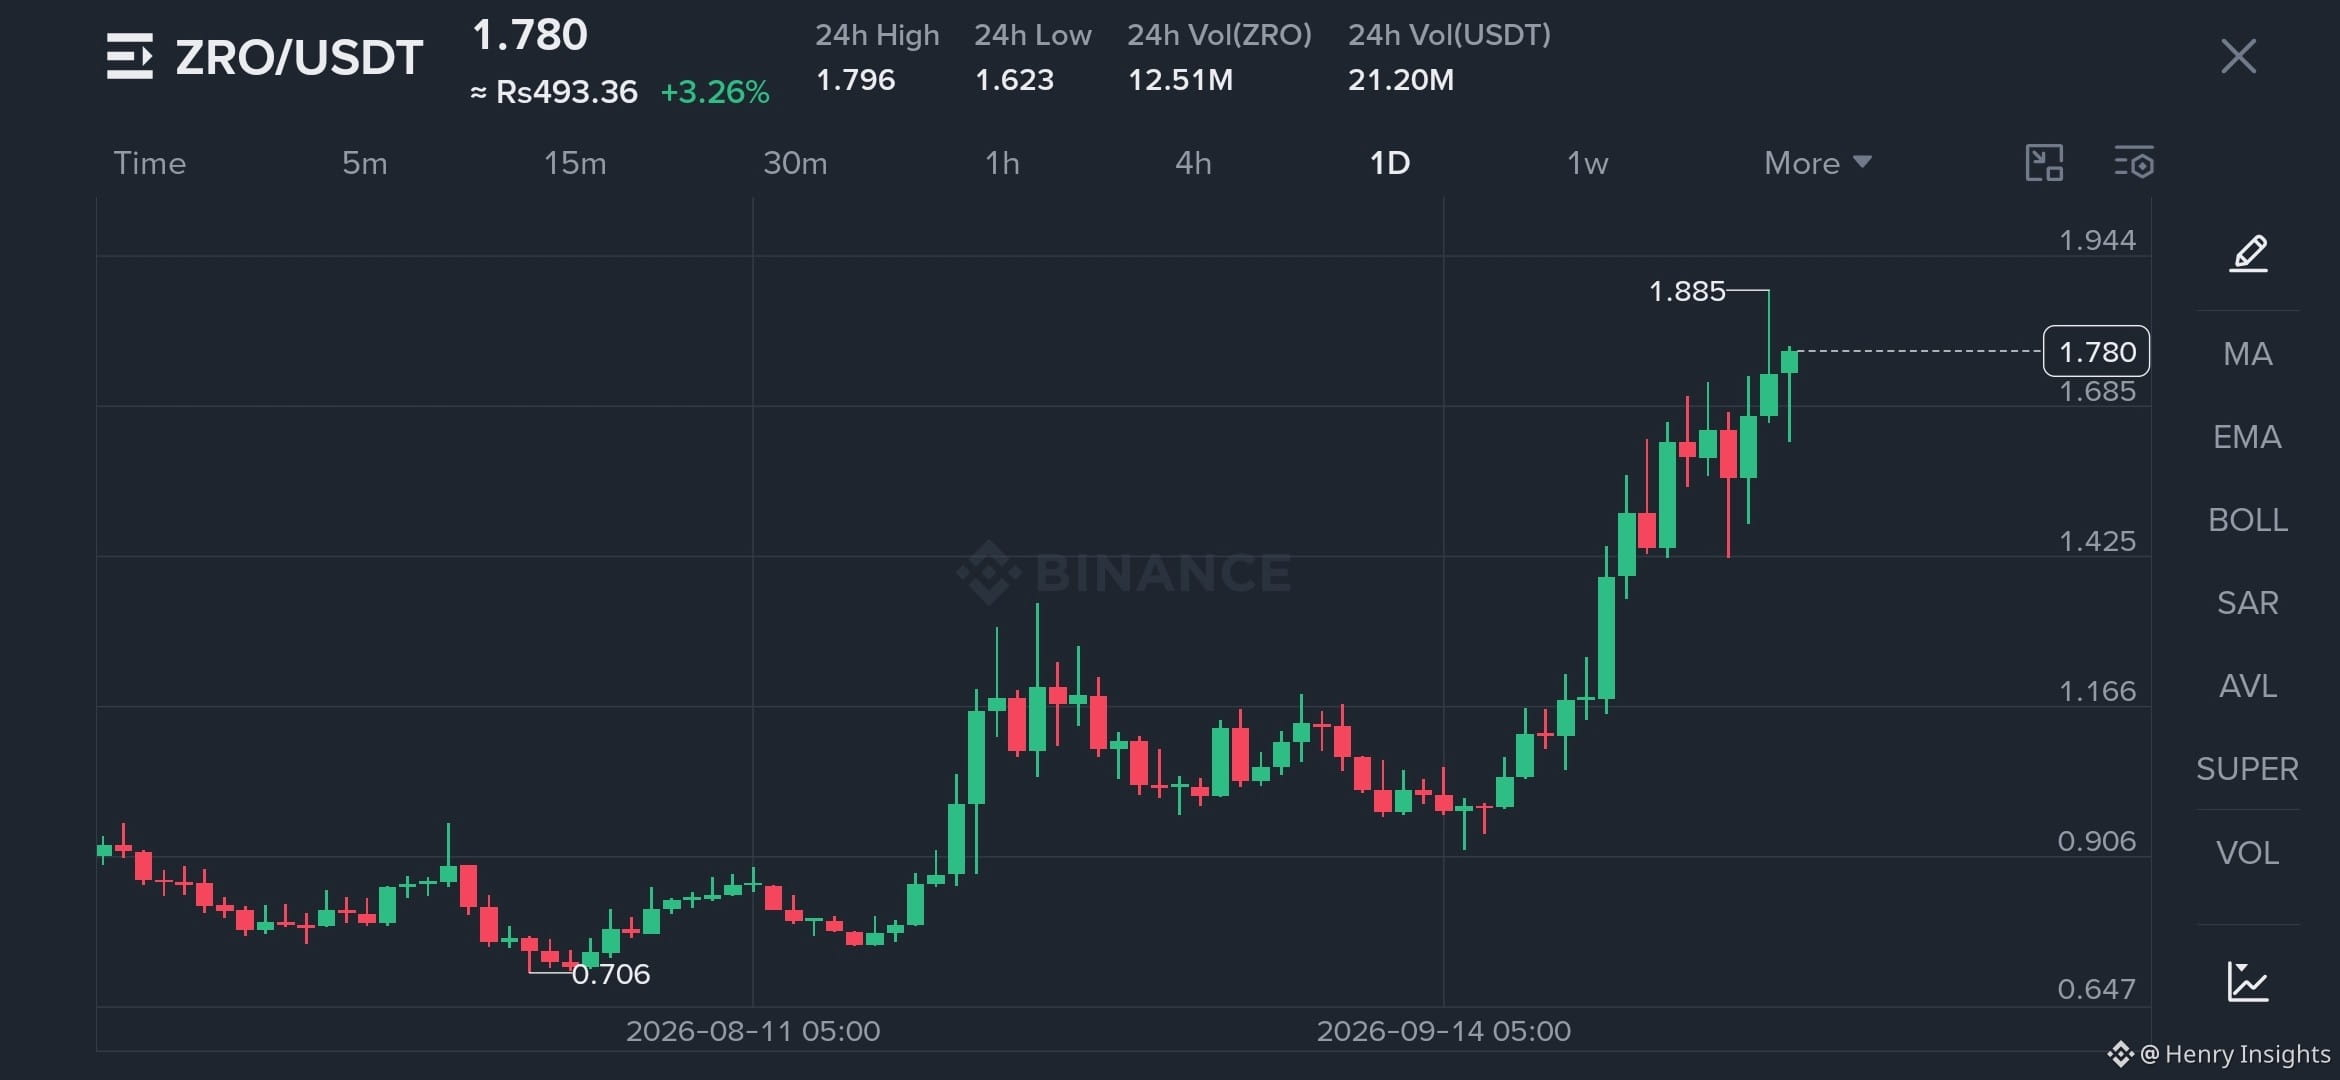
$ZRO has been steadily making higher highs and moving up nicely from the 0.706 zone. The trend looks super strong right now.
Price Levels:
Price: 1.780
Resistance: 1.885
Support: 1.425 - 1.623
Target: 1.944
If it holds support, we could see a quick push toward 1.944 soon.
What is your move here?
#zro #crypto
$ZRO has been steadily making higher highs and moving up nicely from the 0.706 zone. The trend looks super strong right now.
Price Levels:
Price: 1.780
Resistance: 1.885
Support: 1.425 - 1.623
Target: 1.944
If it holds support, we could see a quick push toward 1.944 soon.
What is your move here?
#zro #crypto
Price Levels:
Price: 1.780
Resistance: 1.885
Support: 1.425 - 1.623
Target: 1.944
If it holds support, we could see a quick push toward 1.944 soon.
What is your move here?
#zro #crypto
1
140
·
--
Haussier
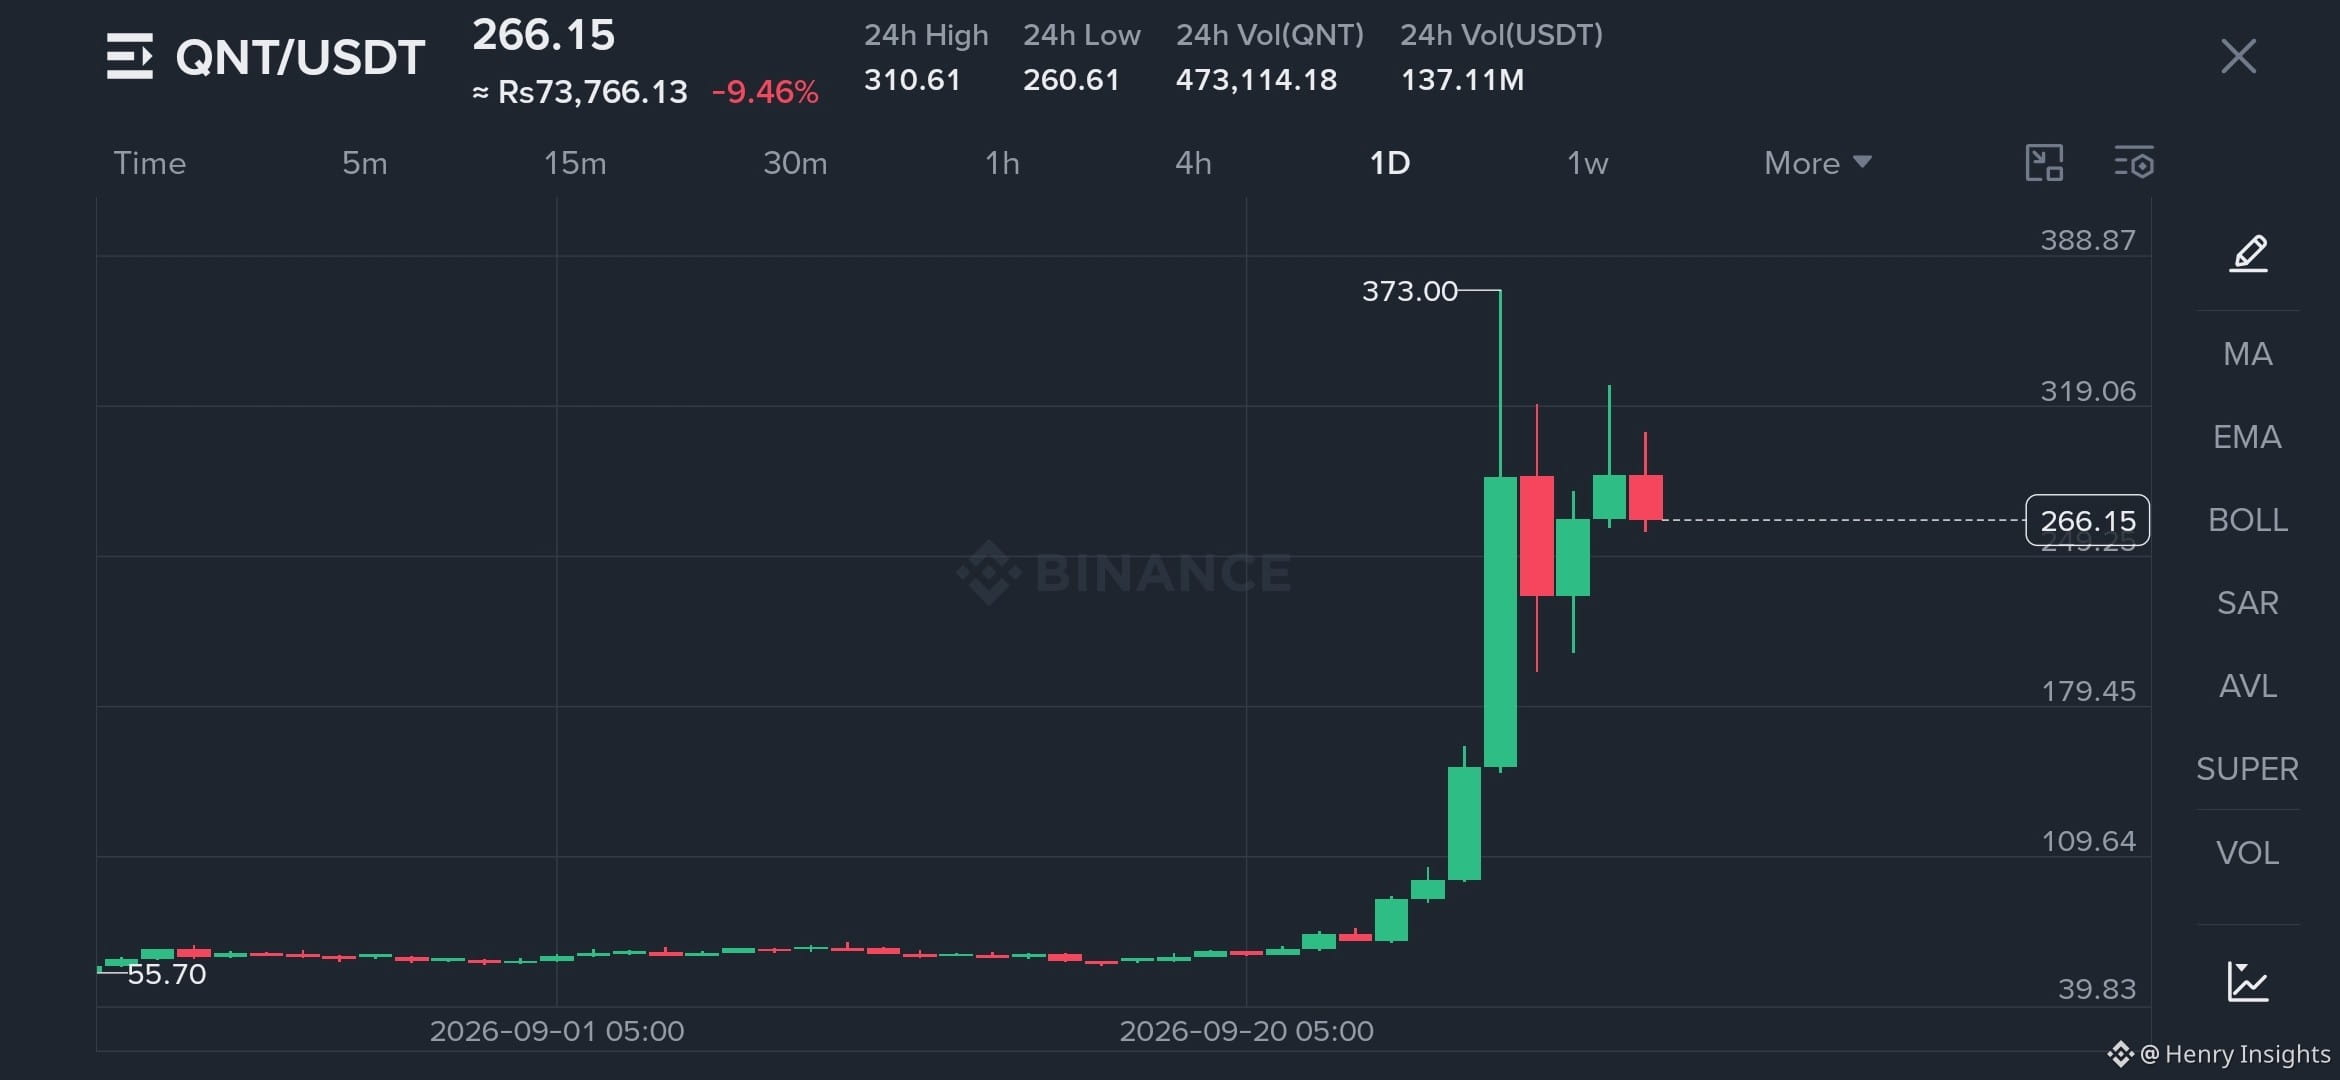
If you bought $10,000 worth of $QNT just 15 days ago, you’d now have roughly $64,000.
Let that sink in.
$10,000 → $64,000 in just TWO WEEKS.
If you bought $10,000 worth of $QNT just 15 days ago, you’d now have roughly $64,000.
Let that sink in.
$10,000 → $64,000 in just TWO WEEKS.
Let that sink in.
$10,000 → $64,000 in just TWO WEEKS.
1
1
1.1k
Before you panic sell, read this.
Bitcoin pumped +50% from the June low of $57,700 to $87,300.
ETH jumped +85% from the June low of $1,505 to $2,800.
Many altcoins like $NEAR and $ZEC have exploded 5x–10x from the recent lows.
What you are seeing now is a normal correction and profit-taking after the gains.
Uptober and Q4 start in just 2 days and it is going to be massive for crypto. Hold tight.
Before you panic sell, read this.
Bitcoin pumped +50% from the June low of $57,700 to $87,300.
ETH jumped +85% from the June low of $1,505 to $2,800.
Many altcoins like $NEAR and $ZEC have exploded 5x–10x from the recent lows.
What you are seeing now is a normal correction and profit-taking after the gains.
Uptober and Q4 start in just 2 days and it is going to be massive for crypto. Hold tight.
Bitcoin pumped +50% from the June low of $57,700 to $87,300.
ETH jumped +85% from the June low of $1,505 to $2,800.
Many altcoins like $NEAR and $ZEC have exploded 5x–10x from the recent lows.
What you are seeing now is a normal correction and profit-taking after the gains.
Uptober and Q4 start in just 2 days and it is going to be massive for crypto. Hold tight.


1
204
Article
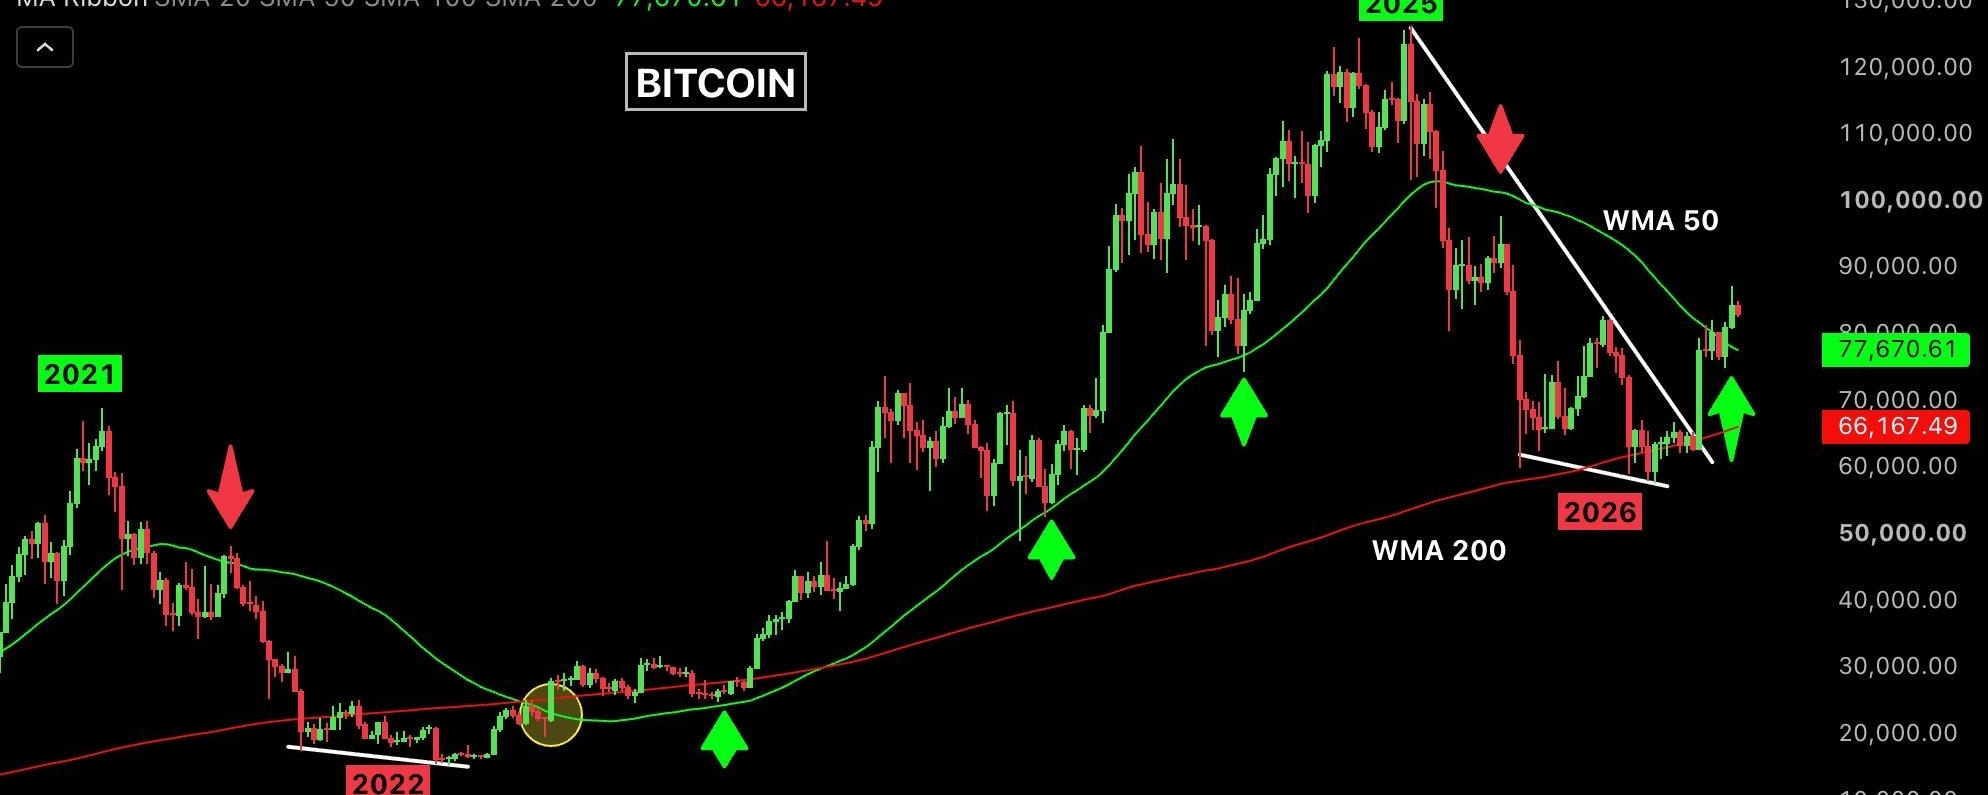
BITCOIN WEEKLY ANALYSISBitcoin pumped 4% last week and closed at $84,445, its highest weekly close in 8 months and second consecutive close above the Weekly MA 50.
So how did Bitcoin go from $57K to $87K?
BTC spent 11 weeks testing the Weekly MA 200 and it held as support. During that time, MACD turned bullish, RSI showed a bullish divergence and momentum started shifting toward bulls.
Then BTC broke above $67K and spent the next 4 weeks testing the Weekly MA 50, while $75K held as support.
Once Bitcoin finally closed above the Weekly MA 50, another short squeeze pushed BTC above $86K.
Meanwhile, the macro data was also improving:
- ISM hit 55.6, a 4 year high.
- Russell 2000 broke to a new ATH.
- Core inflation cooled toward a 5 year low.
Important levels:
- Support: Weekly MA 50 at $77,670 | Daily MA 200 at $71,100
- Resistance: $87K to $98K
Important events this week:
- ISM: Thursday
- Jobs data: Friday
BITCOIN WEEKLY ANALYSIS
Bitcoin pumped 4% last week and closed at $84,445, its highest weekly close in 8 months and second consecutive close above the Weekly MA 50.
So how did Bitcoin go from $57K to $87K?
BTC spent 11 weeks testing the Weekly MA 200 and it held as support. During that time, MACD turned bullish, RSI showed a bullish divergence and momentum started shifting toward bulls.
Then BTC broke above $67K and spent the next 4 weeks testing the Weekly MA 50, while $75K held as support.
Once Bitcoin finally closed above the Weekly MA 50, another short squeeze pushed BTC above $86K.
Meanwhile, the macro data was also improving:
- ISM hit 55.6, a 4 year high.
- Russell 2000 broke to a new ATH.
- Core inflation cooled toward a 5 year low.
Important levels:
- Support: Weekly MA 50 at $77,670 | Daily MA 200 at $71,100
- Resistance: $87K to $98K
Important events this week:
- ISM: Thursday
- Jobs data: Friday
So how did Bitcoin go from $57K to $87K?
BTC spent 11 weeks testing the Weekly MA 200 and it held as support. During that time, MACD turned bullish, RSI showed a bullish divergence and momentum started shifting toward bulls.
Then BTC broke above $67K and spent the next 4 weeks testing the Weekly MA 50, while $75K held as support.
Once Bitcoin finally closed above the Weekly MA 50, another short squeeze pushed BTC above $86K.
Meanwhile, the macro data was also improving:
- ISM hit 55.6, a 4 year high.
- Russell 2000 broke to a new ATH.
- Core inflation cooled toward a 5 year low.
Important levels:
- Support: Weekly MA 50 at $77,670 | Daily MA 200 at $71,100
- Resistance: $87K to $98K
Important events this week:
- ISM: Thursday
- Jobs data: Friday
77
Article
The Stage Is Set for a Massive Altcoin SeasonIf you feel like altcoins have been asleep at the wheel, it might be time to wake up. The monthly chart for OTHERS/BTC—a key metric that tracks the performance of altcoins relative to Bitcoin—is flashing one of its most bullish setups in years.
Several technical indicators are aligning at once, signaling that a major market shift could be underway:
* Breakout from a 4-Year Downtrend: Altcoins have finally snapped out of a multi-year slump against Bitcoin, clearing a major resistance level that kept them suppressed for four years.
* New Uptrend Confirmed: Following the breakout earlier in 2026, the chart has established higher lows, confirming that a fresh structural uptrend is forming.
* Bullish Momentum Cross: Long-term momentum indicators have crossed upward on the monthly timeframe, a signal that typically indicates sustained, macro-level strength rather than a short-term pump.
* Echoes of 2021: This technical setup looks almost identical to the structure seen right before the massive altcoin explosion in 2021.
When OTHERS/BTC trends upward, it means money is actively rotating out of Bitcoin and flowing into the broader altcoin market. While high-timeframe monthly charts take time to play out, the structural foundation is now laid. If history repeats itself, the next altcoin season could be one for the books.
The Stage Is Set for a Massive Altcoin Season
If you feel like altcoins have been asleep at the wheel, it might be time to wake up. The monthly chart for OTHERS/BTC—a key metric that tracks the performance of altcoins relative to Bitcoin—is flashing one of its most bullish setups in years.
Several technical indicators are aligning at once, signaling that a major market shift could be underway:
* Breakout from a 4-Year Downtrend: Altcoins have finally snapped out of a multi-year slump against Bitcoin, clearing a major resistance level that kept them suppressed for four years.
* New Uptrend Confirmed: Following the breakout earlier in 2026, the chart has established higher lows, confirming that a fresh structural uptrend is forming.
* Bullish Momentum Cross: Long-term momentum indicators have crossed upward on the monthly timeframe, a signal that typically indicates sustained, macro-level strength rather than a short-term pump.
* Echoes of 2021: This technical setup looks almost identical to the structure seen right before the massive altcoin explosion in 2021.
When OTHERS/BTC trends upward, it means money is actively rotating out of Bitcoin and flowing into the broader altcoin market. While high-timeframe monthly charts take time to play out, the structural foundation is now laid. If history repeats itself, the next altcoin season could be one for the books.
Several technical indicators are aligning at once, signaling that a major market shift could be underway:
* Breakout from a 4-Year Downtrend: Altcoins have finally snapped out of a multi-year slump against Bitcoin, clearing a major resistance level that kept them suppressed for four years.
* New Uptrend Confirmed: Following the breakout earlier in 2026, the chart has established higher lows, confirming that a fresh structural uptrend is forming.
* Bullish Momentum Cross: Long-term momentum indicators have crossed upward on the monthly timeframe, a signal that typically indicates sustained, macro-level strength rather than a short-term pump.
* Echoes of 2021: This technical setup looks almost identical to the structure seen right before the massive altcoin explosion in 2021.
When OTHERS/BTC trends upward, it means money is actively rotating out of Bitcoin and flowing into the broader altcoin market. While high-timeframe monthly charts take time to play out, the structural foundation is now laid. If history repeats itself, the next altcoin season could be one for the books.
127
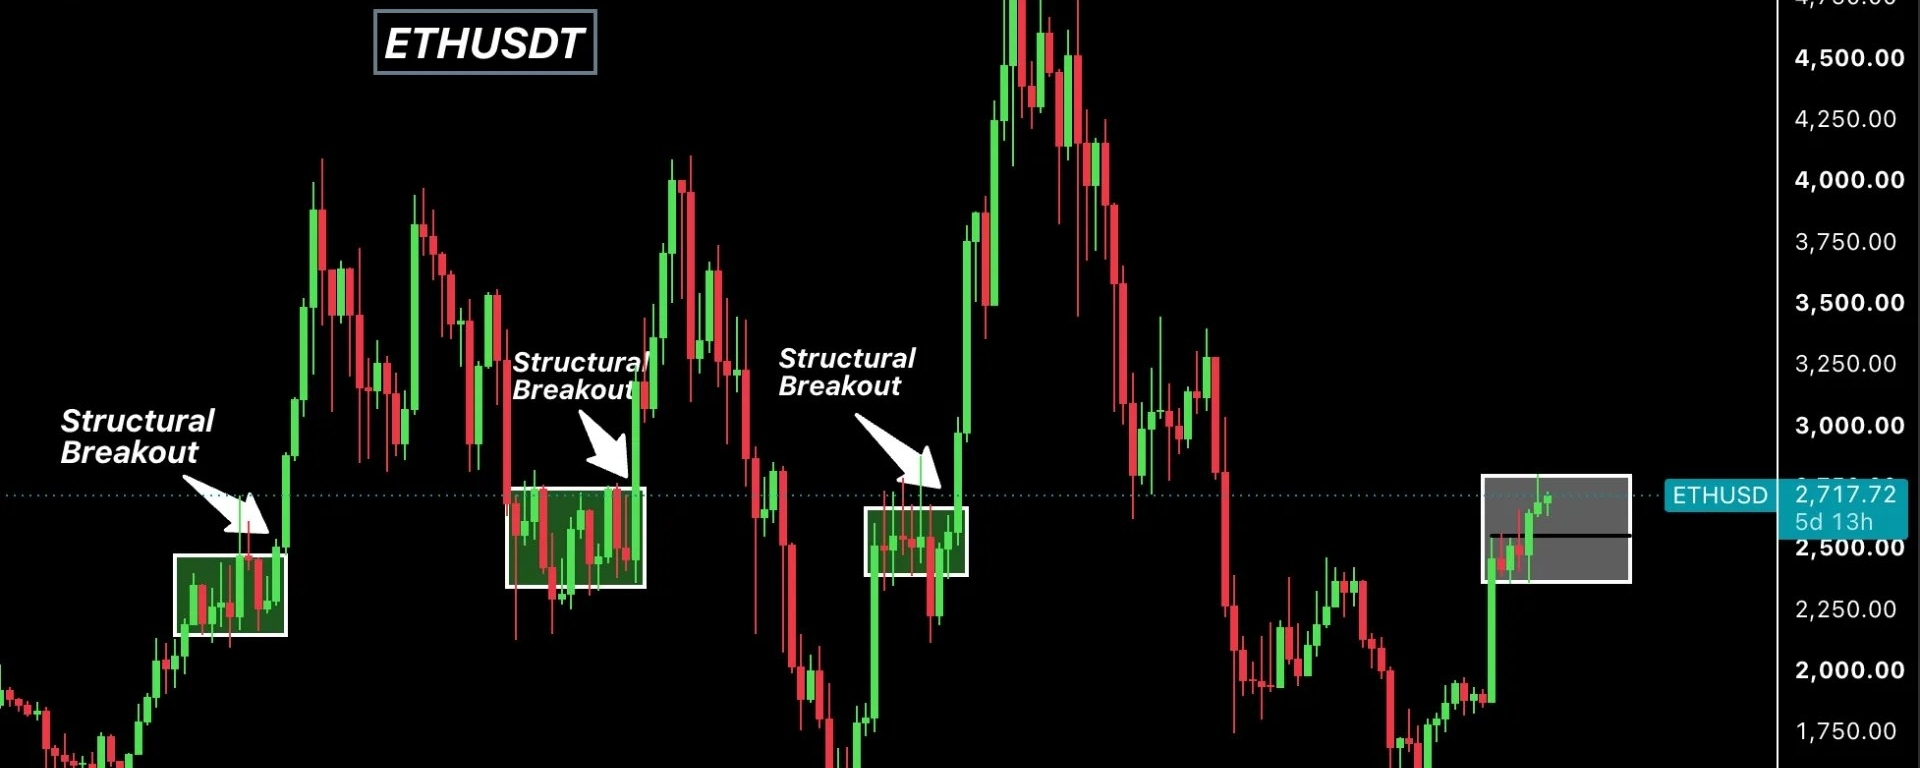
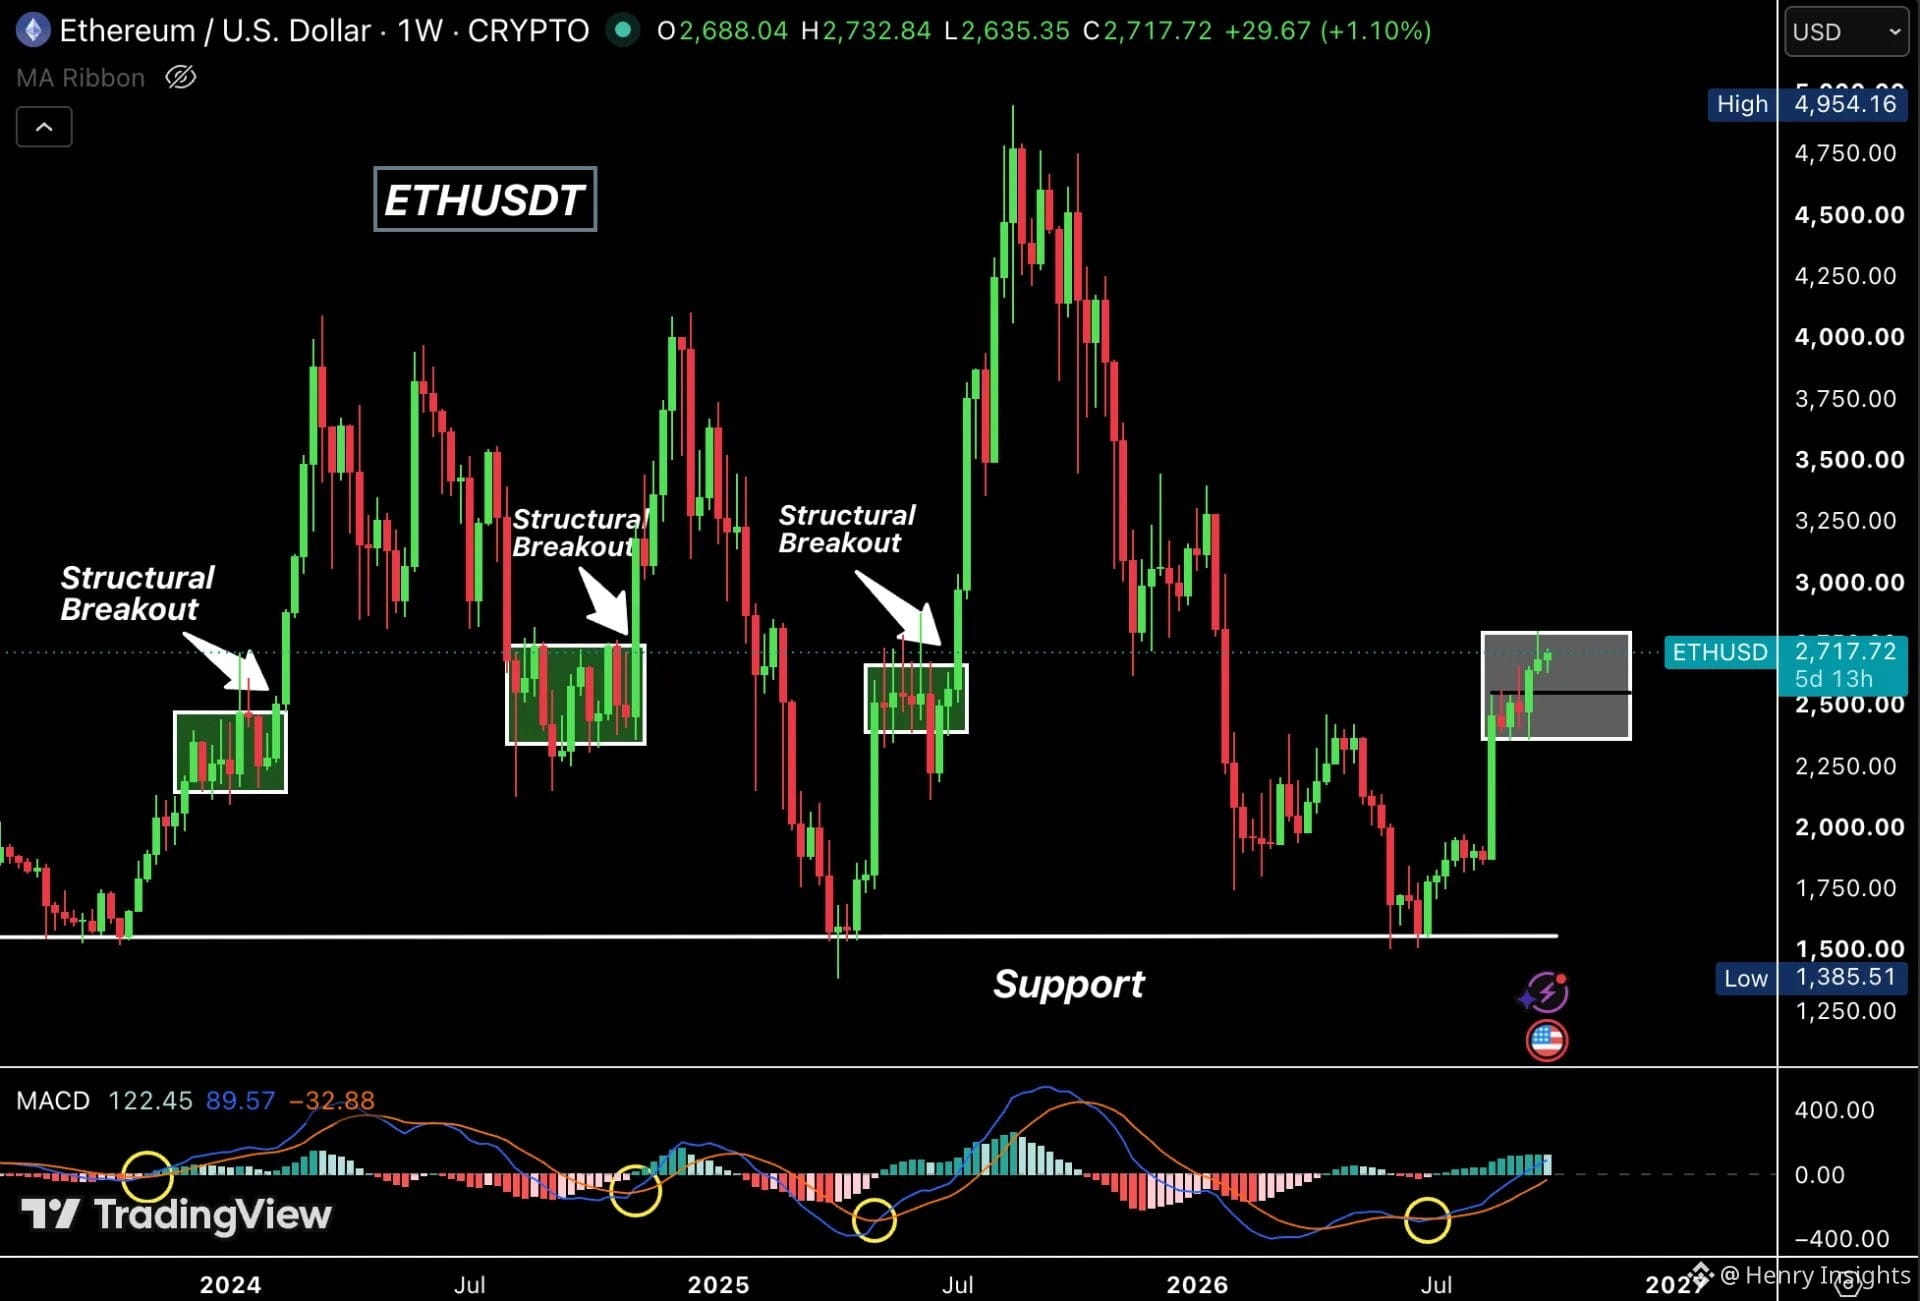
ETHEREUM IS GETTING READY FOR A BIG MOVE.
$ETH held $2,550 and closed the week up 1.66%.
The $2,300 to $2,800 range is what matters now. This same zone has produced 3 major breakouts on the weekly chart.
Each time ETH broke out of this range, the next move was big.
A confirmed break above $2,800 puts $3,600 to $4,500 as the next major zone.
Support: $2,550 and $2,350
The key event this week is ISM on Thursday.
Historically, when ISM pushes above 56, ETH and Alts tend to rally.
ETHEREUM IS GETTING READY FOR A BIG MOVE.
$ETH held $2,550 and closed the week up 1.66%.
The $2,300 to $2,800 range is what matters now. This same zone has produced 3 major breakouts on the weekly chart.
Each time ETH broke out of this range, the next move was big.
A confirmed break above $2,800 puts $3,600 to $4,500 as the next major zone.
Support: $2,550 and $2,350
The key event this week is ISM on Thursday.
Historically, when ISM pushes above 56, ETH and Alts tend to rally.
$ETH held $2,550 and closed the week up 1.66%.
The $2,300 to $2,800 range is what matters now. This same zone has produced 3 major breakouts on the weekly chart.
Each time ETH broke out of this range, the next move was big.
A confirmed break above $2,800 puts $3,600 to $4,500 as the next major zone.
Support: $2,550 and $2,350
The key event this week is ISM on Thursday.
Historically, when ISM pushes above 56, ETH and Alts tend to rally.
1
140
·
--
Haussier
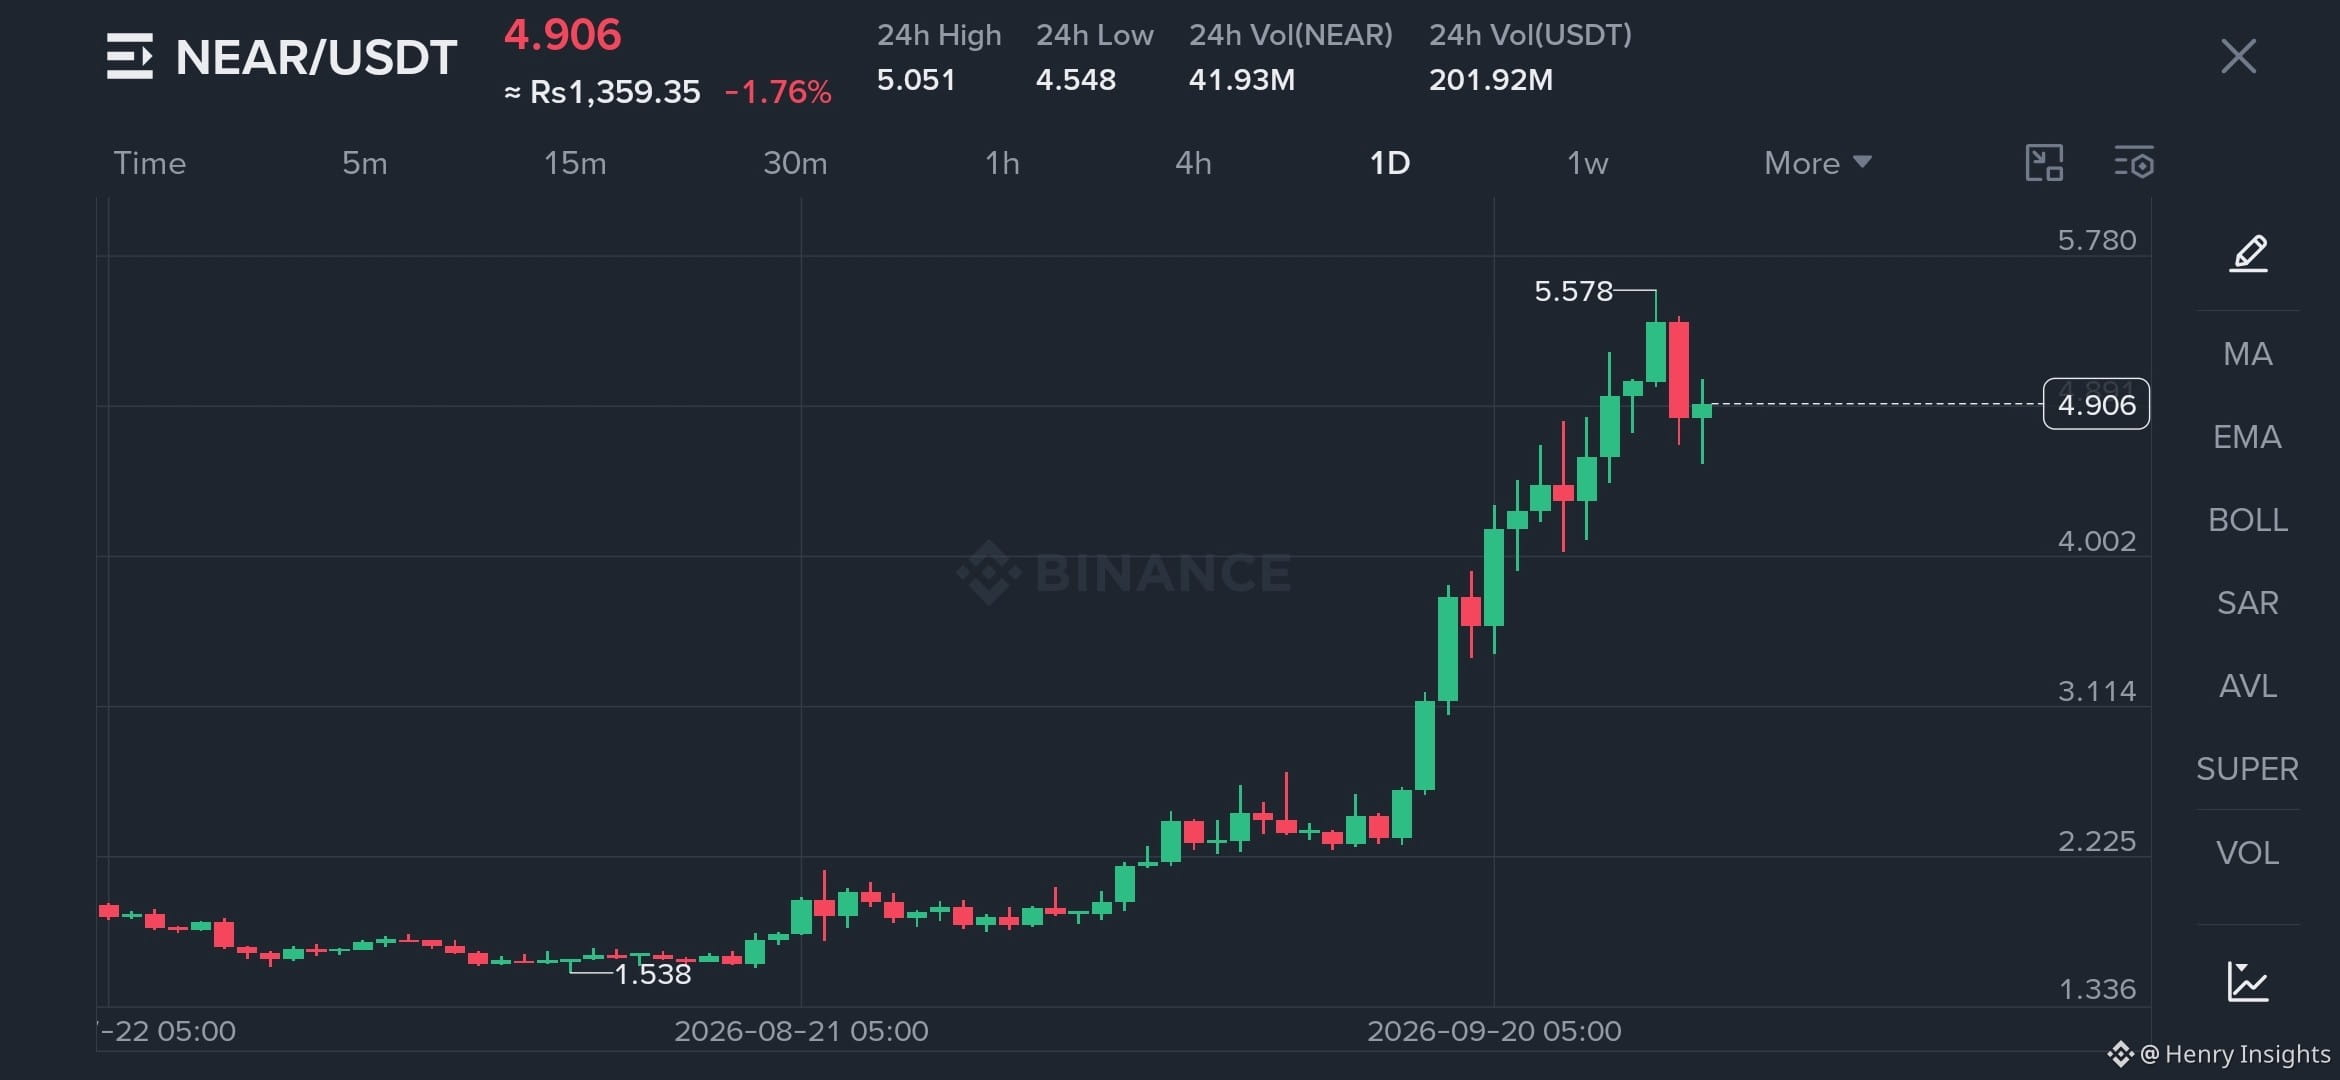
BREAKING: 🇺🇸 Bitwise launches first US spot NEAR ETF.
$NEAR is up 180% in the last 30 days.
BREAKING: 🇺🇸 Bitwise launches first US spot NEAR ETF.
$NEAR is up 180% in the last 30 days.
$NEAR is up 180% in the last 30 days.
177
·
--
Haussier
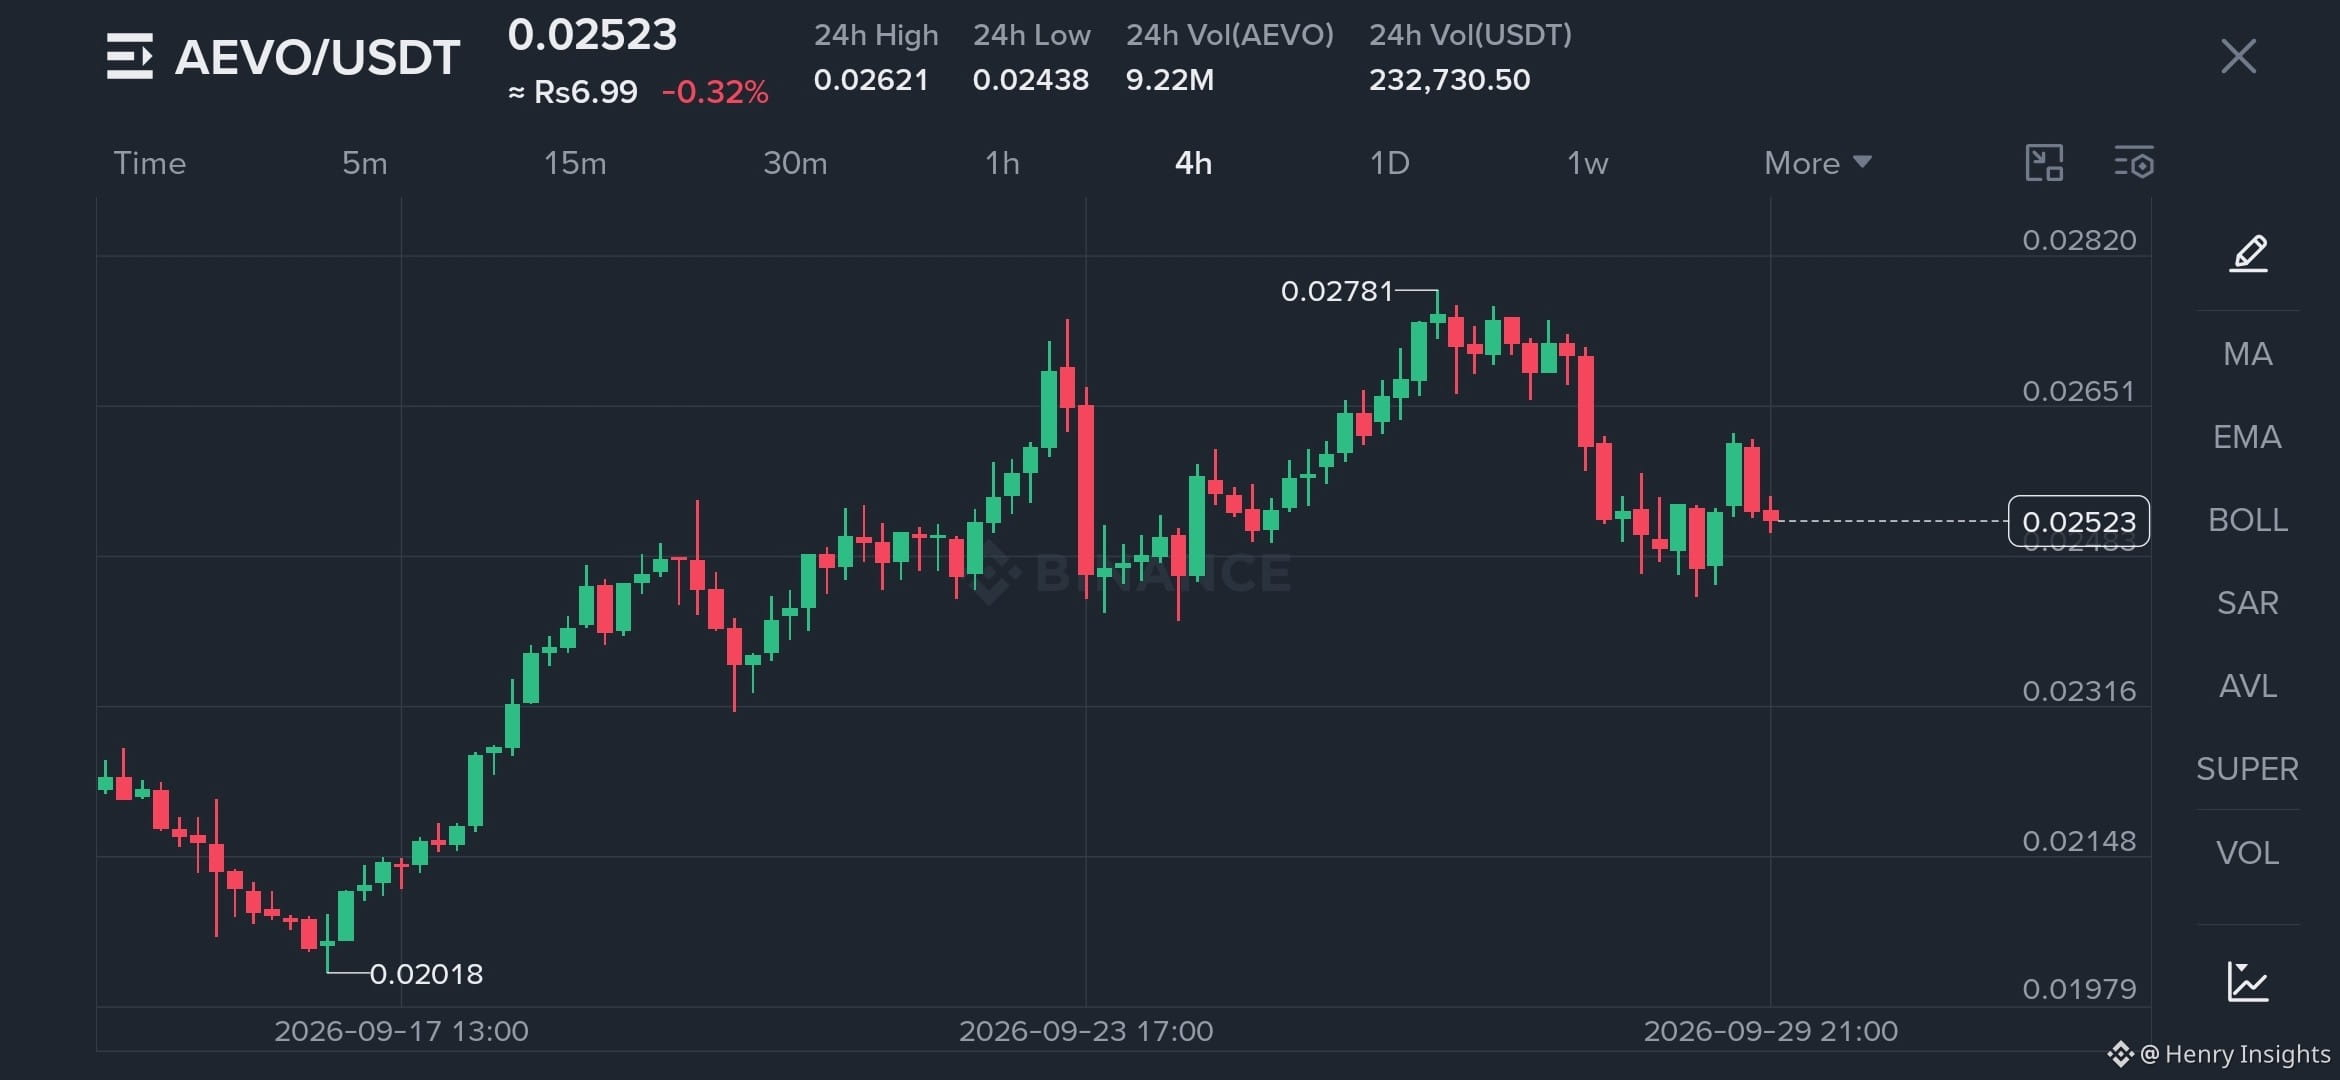
$AEVO Analysis on 4H Chart.
AEVO after hitting a low of $0.02018 showed a solid recovery all the way up to $0.02781! Currently, it's consolidating around $0.02523.
Key Levels to Watch:
• Support: $0.02018
• Resistance: $0.02781
What's Next?
If $AEVO breaks above $0.02781, we can see another bullish push. Holding above $0.02500 is crucial for buyers right now
What are your thoughts on $AEVO? Bullish or Bearish?
$AEVO Analysis on 4H Chart.
AEVO after hitting a low of $0.02018 showed a solid recovery all the way up to $0.02781! Currently, it's consolidating around $0.02523.
Key Levels to Watch:
• Support: $0.02018
• Resistance: $0.02781
What's Next?
If $AEVO breaks above $0.02781, we can see another bullish push. Holding above $0.02500 is crucial for buyers right now
What are your thoughts on $AEVO ? Bullish or Bearish?
AEVO after hitting a low of $0.02018 showed a solid recovery all the way up to $0.02781! Currently, it's consolidating around $0.02523.
Key Levels to Watch:
• Support: $0.02018
• Resistance: $0.02781
What's Next?
If $AEVO breaks above $0.02781, we can see another bullish push. Holding above $0.02500 is crucial for buyers right now
What are your thoughts on $AEVO ? Bullish or Bearish?
370
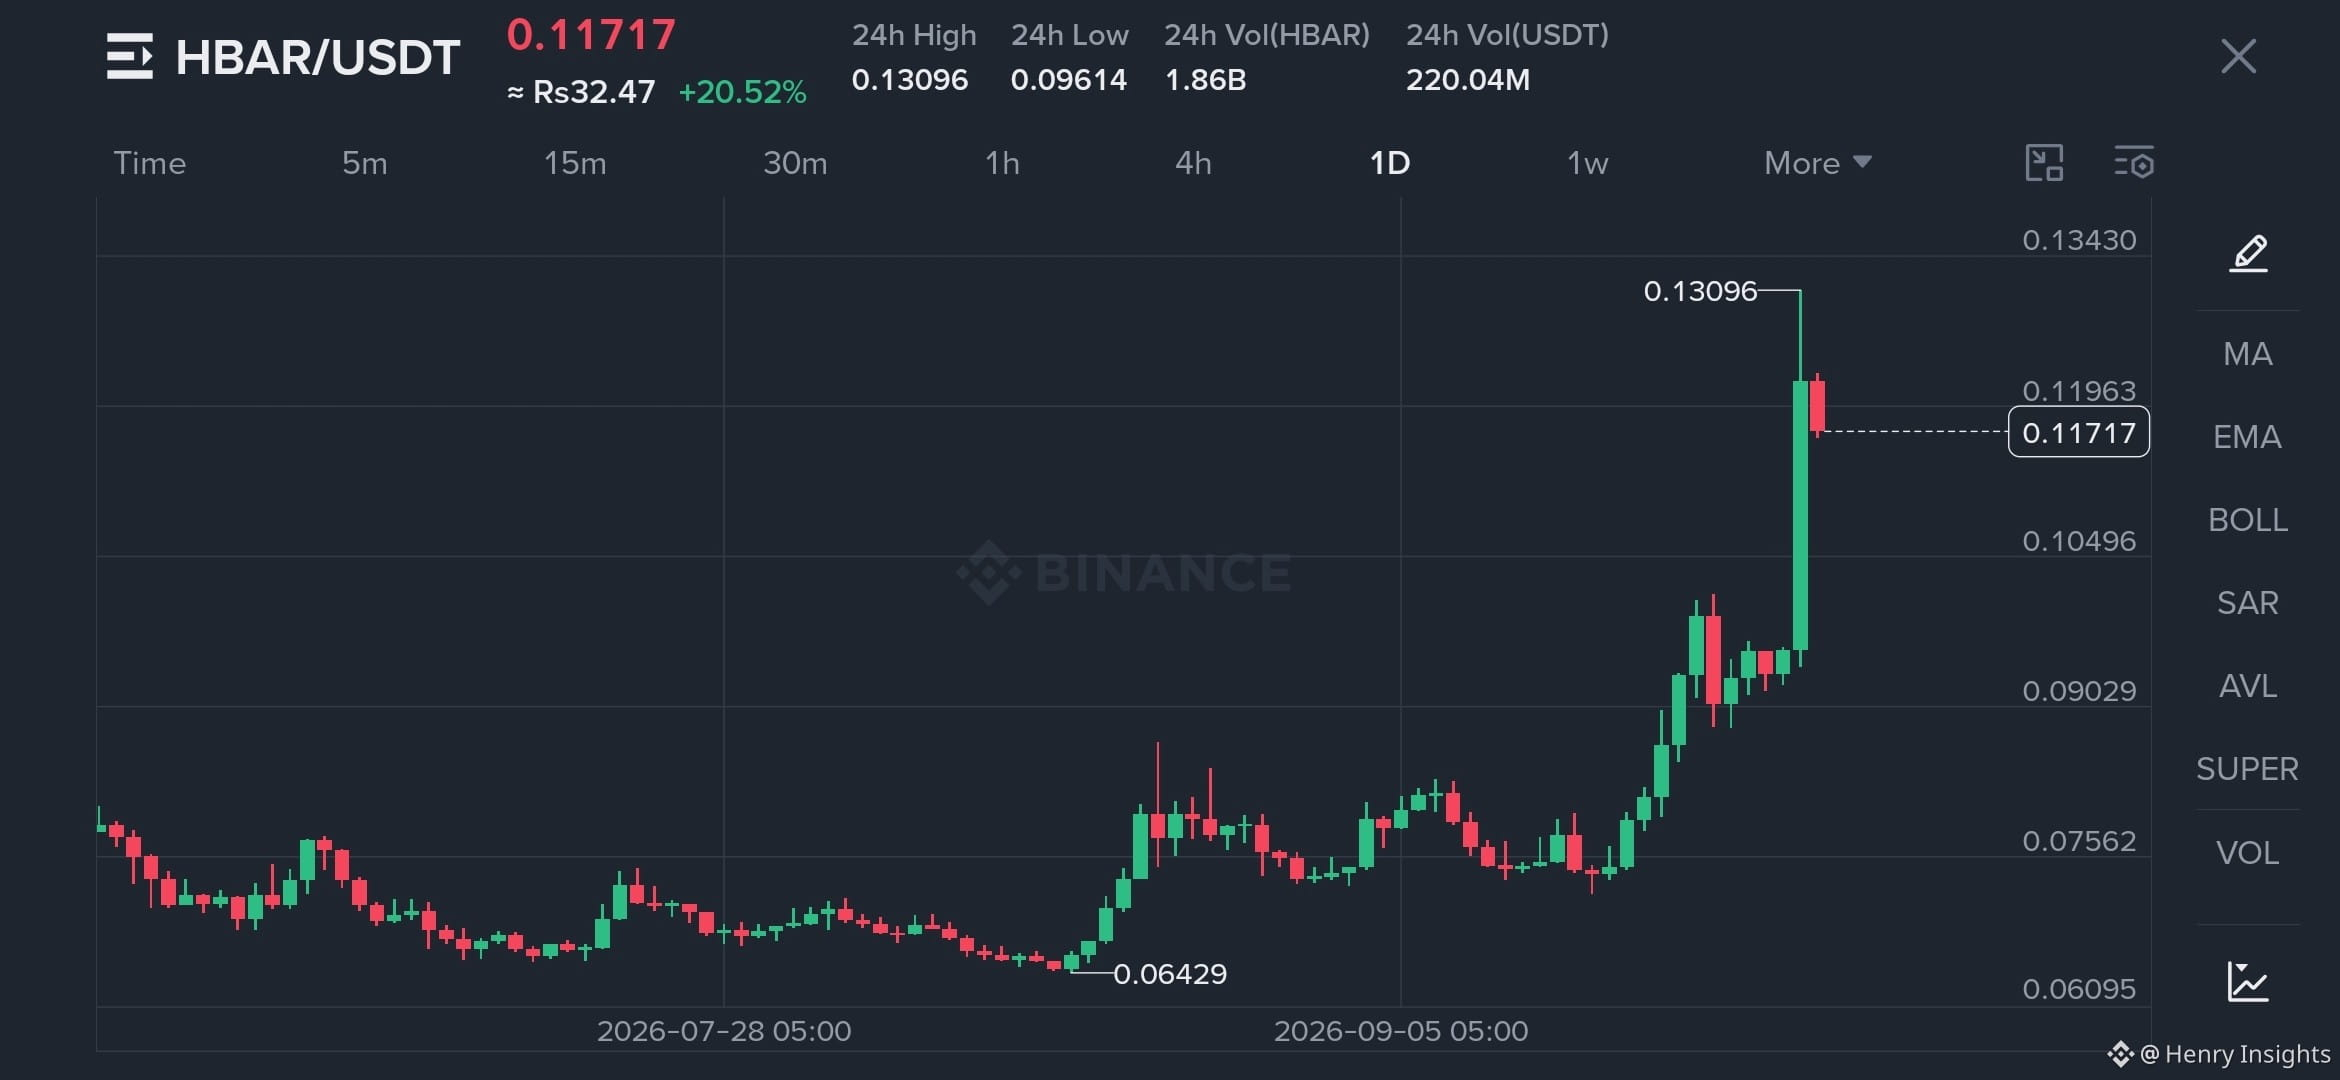
BREAKING: $HBAR surges nearly 40% as HBAR ETF momentum gains traction following IBM’s partnership with Hedera.
BREAKING: $HBAR surges nearly 40% as HBAR ETF momentum gains traction following IBM’s partnership with Hedera.
1
198
·
--
Haussier
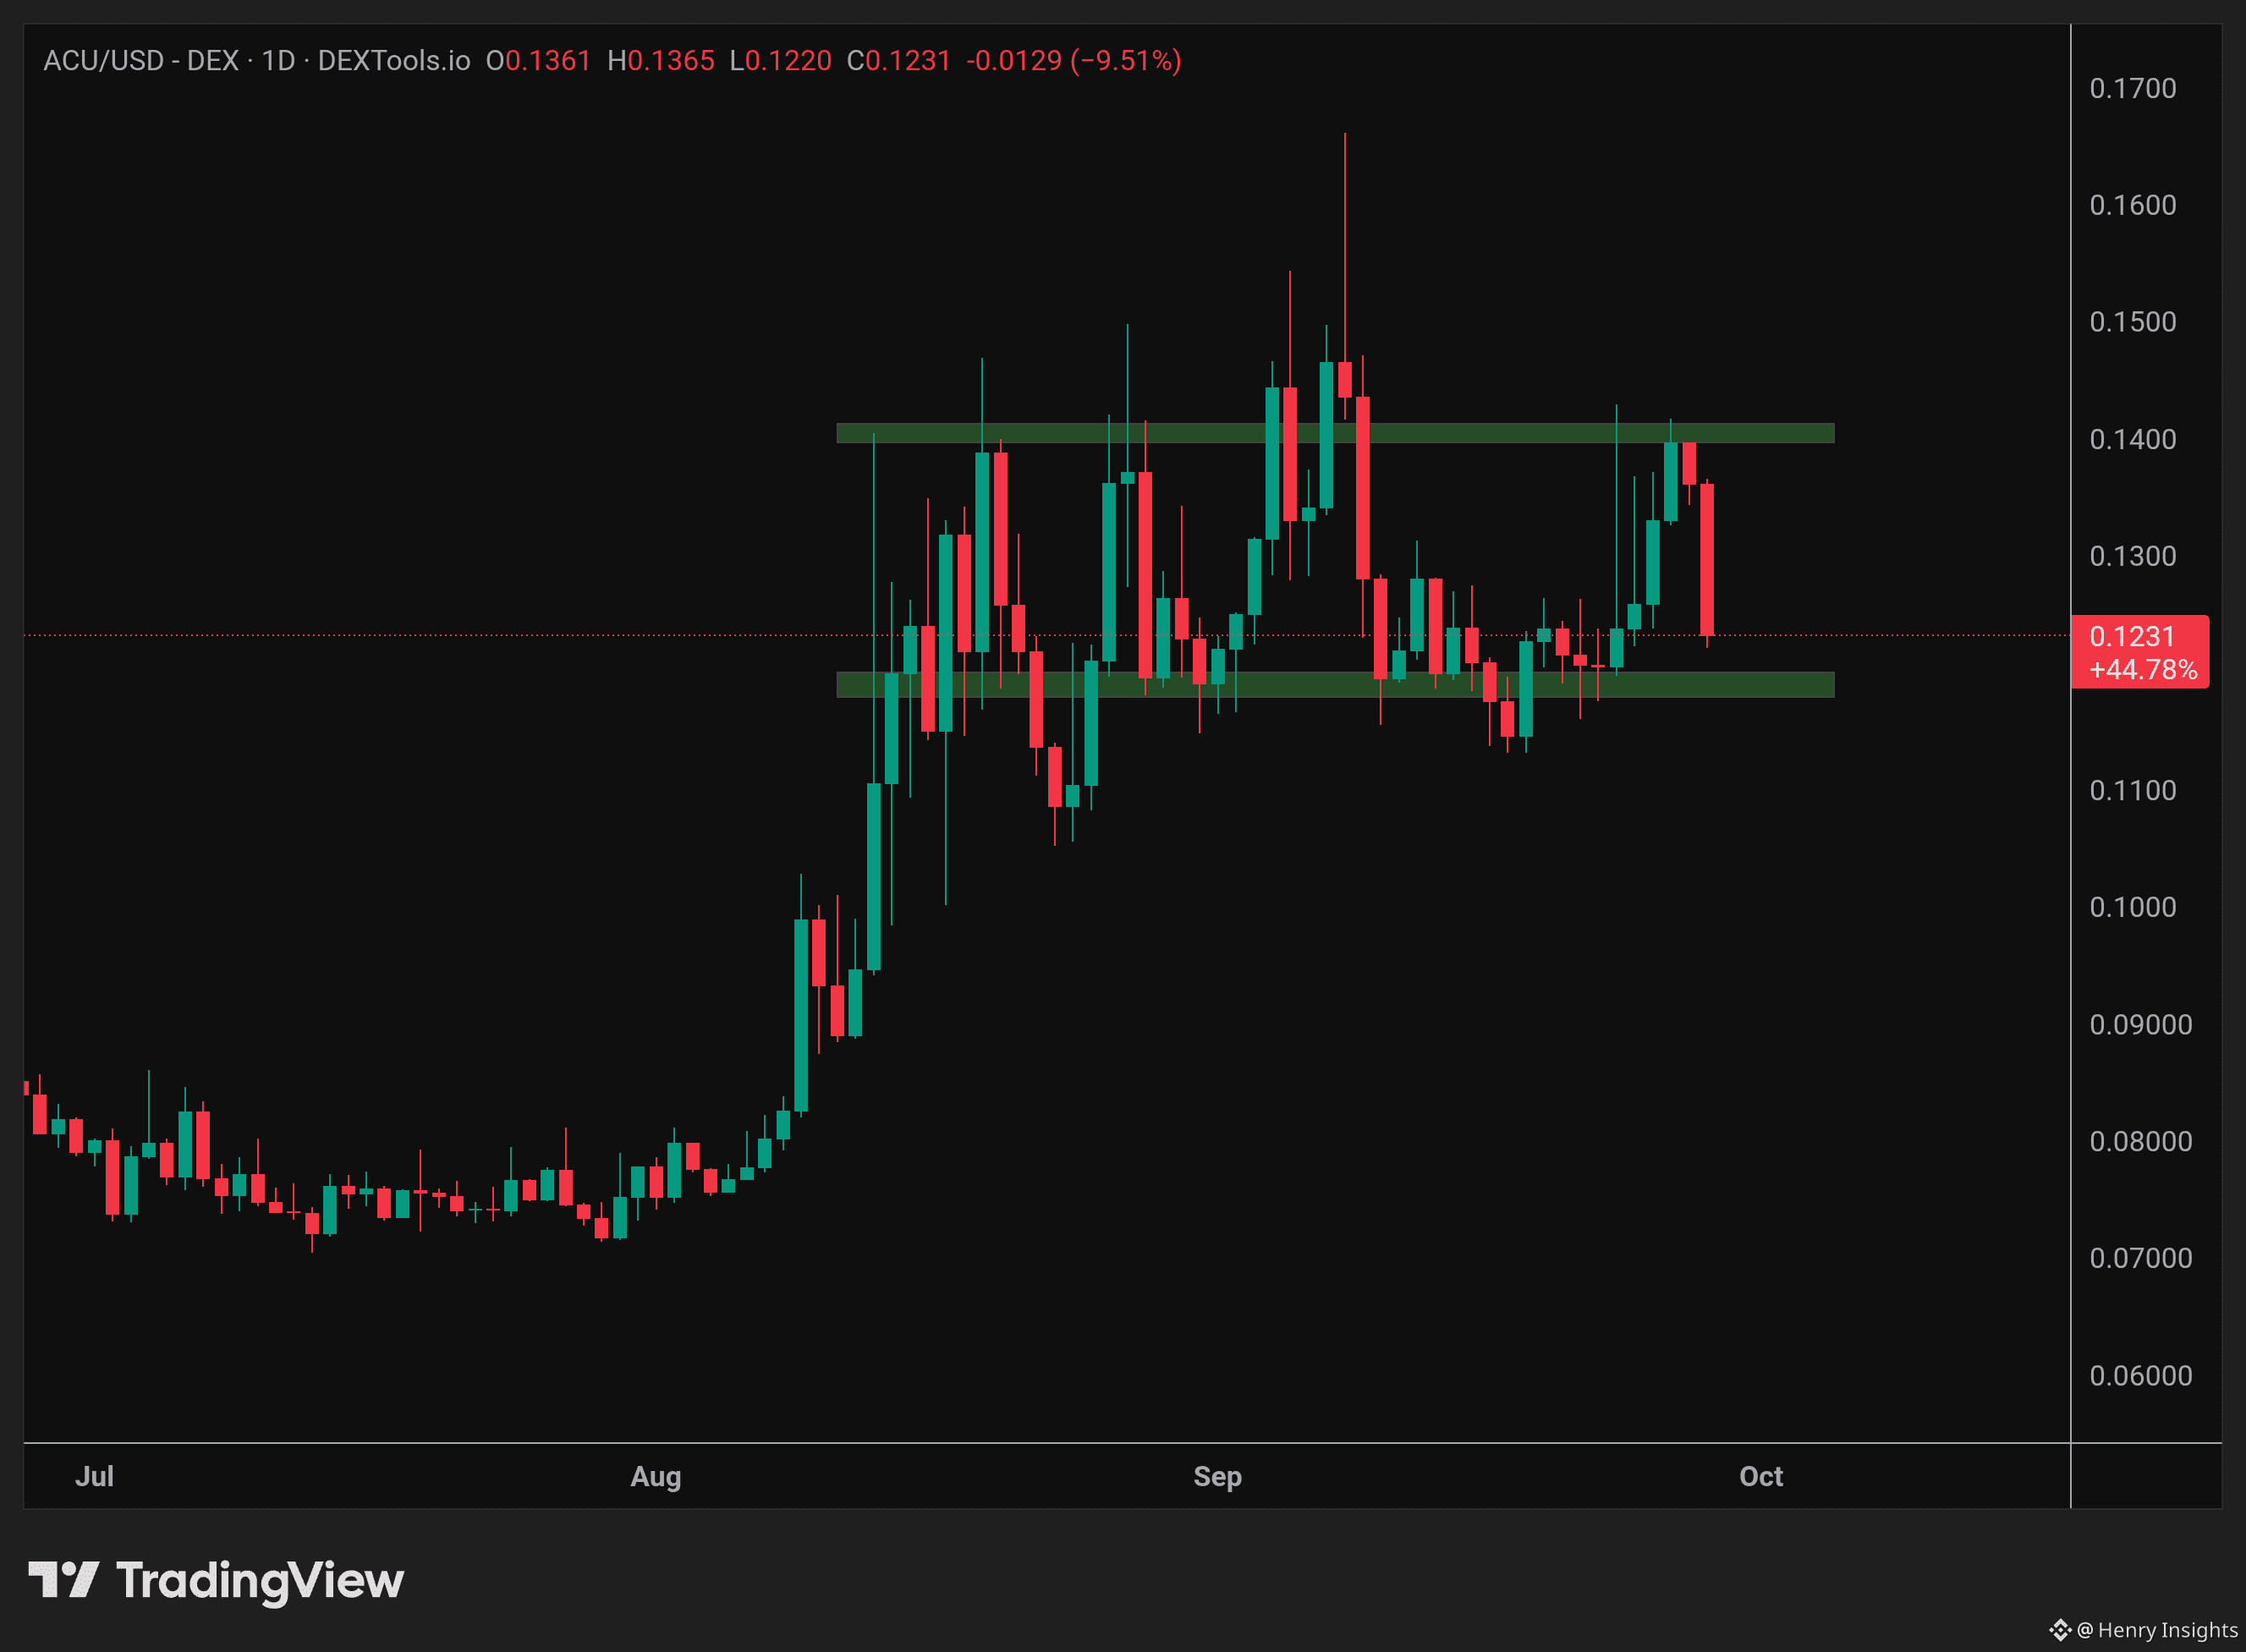
$ACU is still stuck in a clear range.
Price got rejected again near the $0.140 resistance and is now back around $0.123.
• Support: $0.118–0.120
• Resistance: $0.140–0.142
Holding support could bring another attempt at $0.14. A clean breakout above $0.14 would open the door for higher levels, while losing $0.118 could weaken the setup.
Watching this range closely.
$ACU is still stuck in a clear range.
Price got rejected again near the $0.140 resistance and is now back around $0.123.
• Support: $0.118–0.120
• Resistance: $0.140–0.142
Holding support could bring another attempt at $0.14. A clean breakout above $0.14 would open the door for higher levels, while losing $0.118 could weaken the setup.
Watching this range closely.
Price got rejected again near the $0.140 resistance and is now back around $0.123.
• Support: $0.118–0.120
• Resistance: $0.140–0.142
Holding support could bring another attempt at $0.14. A clean breakout above $0.14 would open the door for higher levels, while losing $0.118 could weaken the setup.
Watching this range closely.
1
2
224
Connectez-vous pour découvrir plus de contenu
Rejoignez la communauté mondiale des adeptes de cryptomonnaies sur Binance Square
⚡️ Suviez les dernières informations importantes sur les cryptomonnaies.
💬 Jugé digne de confiance par la plus grande plateforme d’échange de cryptomonnaies au monde.
👍 Découvrez les connaissances que partagent les créateurs vérifiés.
Adresse e-mail/Nº de téléphone
Sujets d’actualité
DriftHackVictimsBeginClaims
27,183 vues
454 mentions
🚨 DRIFT HACK VICTIMS CAN FINALLY START CLAIMING RECOVERY!
Victims of Drift’s April 2026 exploit are now able to claim DFX recovery tokens. The attack caused roughly $295.4M in verified losses, while the initial recovery pool held about $3.11M.
At launch, 1 DFX represented $1 of verified loss, but the initial redemption value was only around $0.0104 per DFX — roughly 1 cent recovered for every $1 lost. Users can redeem, sell, or hold DFX for potentially larger future recoveries as the pool receives additional funding.
⚠️ Important: Redeeming DFX burns the tokens, meaning users give up their share of future recovery funding for those tokens.
Could Drift victims eventually recover a much larger portion of their losses? 👇
#drifthackvictimsbeginclaims
#PEPE $PEPE
ASHFAQ NAEEM
·1 mentions J’aime
·5.7k vues
SolanaTokenizedStockVolumeTops$4.4BInSeptember
4,446 vues
53 mentions
BitcoinSpotETFsDraw$6.34BInflowsInQ3
15,519 vues
168 mentions