

Kai Venn
166 Publications

Kai Venn
Signaler
Bloquer l’utilisateur
17 Suivis
13 Abonnés
28 J’aime
Publications
Tous
Citations
·
--
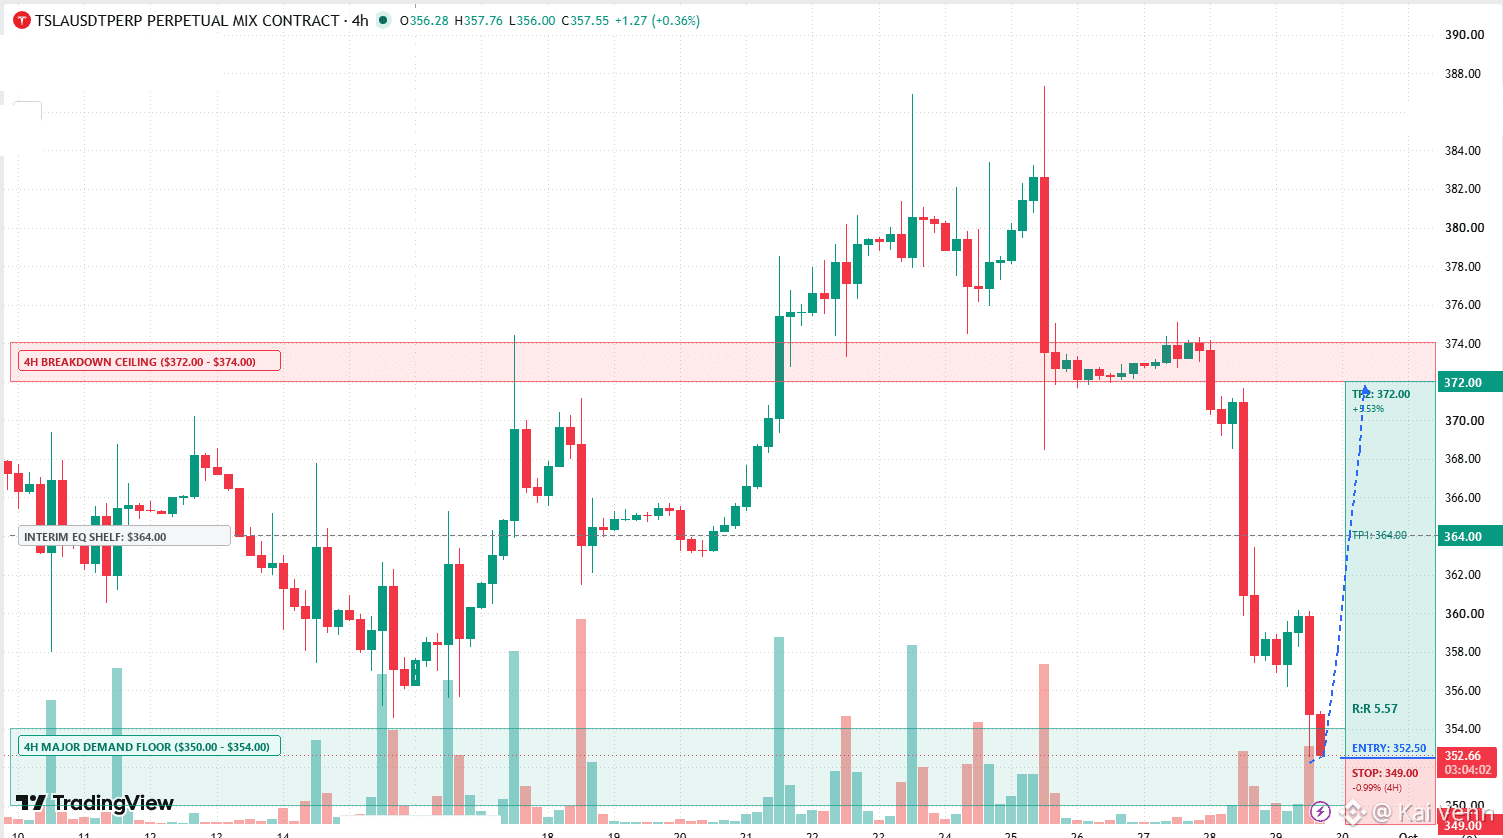
$TSLA wiped out $33 in four sessions and dumped straight into the $350 to $354 launchpad from mid-September. Selling shorts down here is suicide with eight consecutive red 4H candles meeting a proven demand floor.
I am taking the long side between $351 and $353.50. Trim the first chunk of size at the $364 interim shelf, then let the rest run toward the $372 breakdown ceiling. If a 4H candle closes below $349 flat, the floor is broken.
$TSLA wiped out $33 in four sessions and dumped straight into the $350 to $354 launchpad from mid-September. Selling shorts down here is suicide with eight consecutive red 4H candles meeting a proven demand floor.
I am taking the long side between $351 and $353.50. Trim the first chunk of size at the $364 interim shelf, then let the rest run toward the $372 breakdown ceiling. If a 4H candle closes below $349 flat, the floor is broken.
I am taking the long side between $351 and $353.50. Trim the first chunk of size at the $364 interim shelf, then let the rest run toward the $372 breakdown ceiling. If a 4H candle closes below $349 flat, the floor is broken.
223
·
--
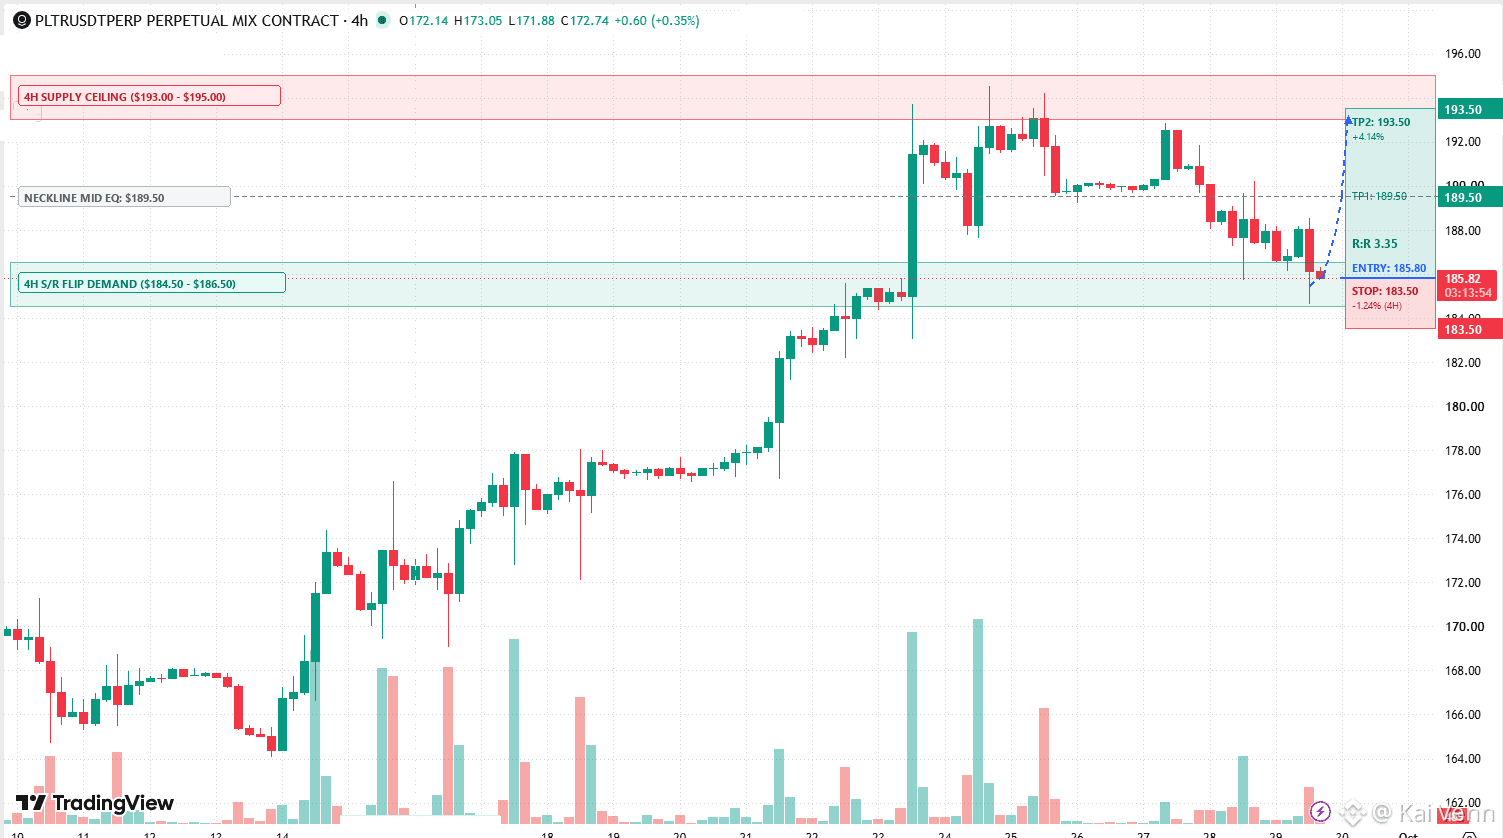
$PLTR completed a four-day correction from the $194.50 highs and is currently printing its first buyer absorption wick right into the August breakout shelf. This retest of prior resistance flipped into support offers a defined entry with asymmetric upside.
- Bid Zone: $185.00 to $186.20
- Take Profit 1: $189.50 (Neckline EQ scale-out)
- Take Profit 2: $193.50 (Range ceiling)
- Invalidation Stop: 4H candle close below $183.50
A 4H close below $183.50 breaks the structural floor. If that happens, exit immediately without hoping for a bounce.
$PLTR completed a four-day correction from the $194.50 highs and is currently printing its first buyer absorption wick right into the August breakout shelf. This retest of prior resistance flipped into support offers a defined entry with asymmetric upside.
- Bid Zone: $185.00 to $186.20
- Take Profit 1: $189.50 (Neckline EQ scale-out)
- Take Profit 2: $193.50 (Range ceiling)
- Invalidation Stop: 4H candle close below $183.50
A 4H close below $183.50 breaks the structural floor. If that happens, exit immediately without hoping for a bounce.
- Bid Zone: $185.00 to $186.20
- Take Profit 1: $189.50 (Neckline EQ scale-out)
- Take Profit 2: $193.50 (Range ceiling)
- Invalidation Stop: 4H candle close below $183.50
A 4H close below $183.50 breaks the structural floor. If that happens, exit immediately without hoping for a bounce.
131
·
--
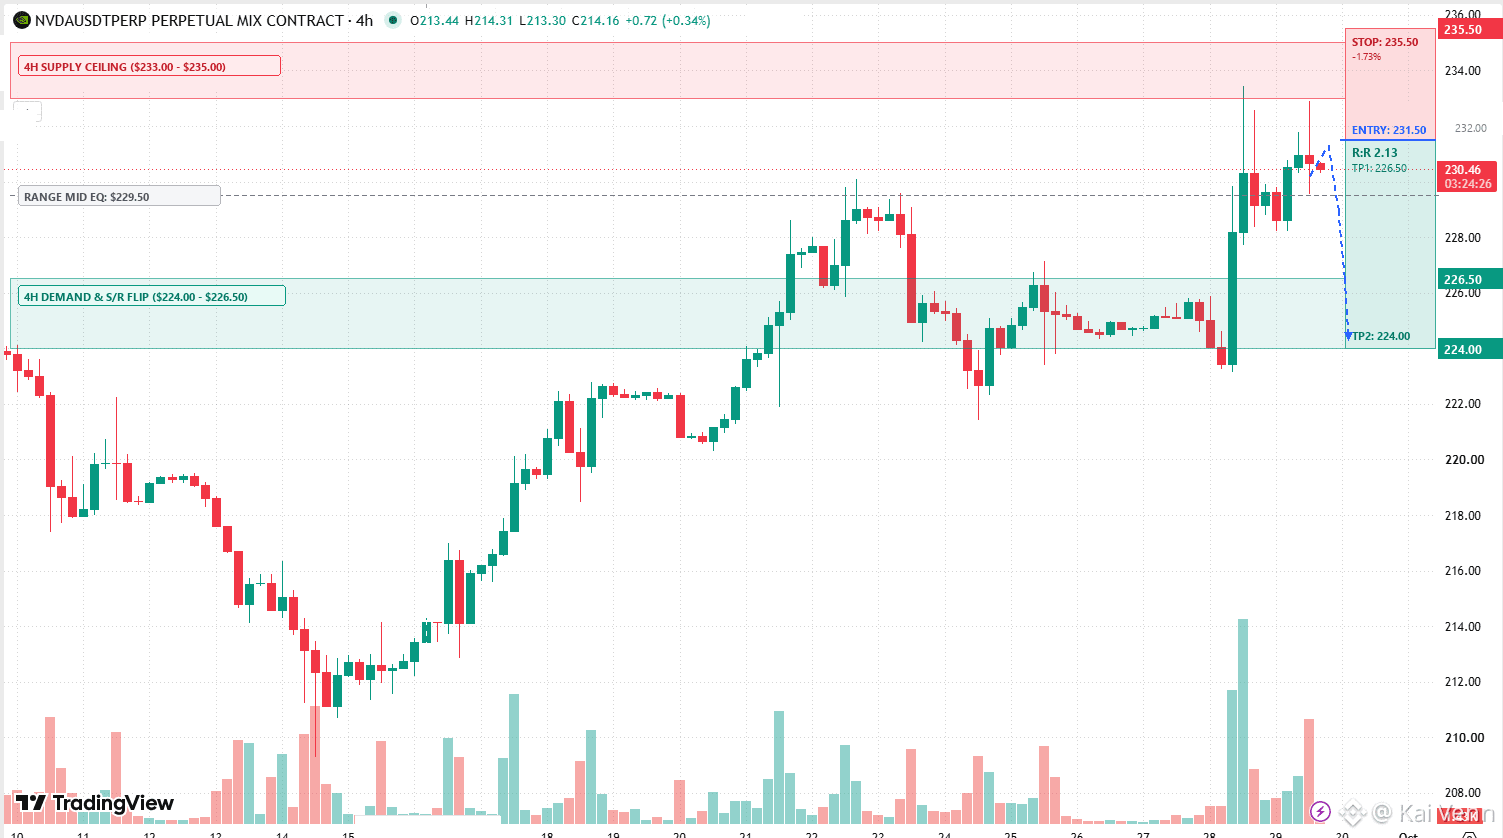
$NVDA equity perps are flashing pure retail FOMO into the exact September ceiling that triggered the last $25 dump. Mainstream headlines are blasting record buyback figures while late buyers chase the tape above $230, handing liquidity straight to distribution desks.
I am fading this euphoria inside the $231.50 to $233.00 supply wick. Lock in partials at $226.50 once the $229.50 mid-pivot cracks, and target $224.00 flat at the demand base. If a 4H candle closes above $235.50, this double top invalidates and you cut the short immediately without looking back.
$NVDA equity perps are flashing pure retail FOMO into the exact September ceiling that triggered the last $25 dump. Mainstream headlines are blasting record buyback figures while late buyers chase the tape above $230, handing liquidity straight to distribution desks.
I am fading this euphoria inside the $231.50 to $233.00 supply wick. Lock in partials at $226.50 once the $229.50 mid-pivot cracks, and target $224.00 flat at the demand base. If a 4H candle closes above $235.50, this double top invalidates and you cut the short immediately without looking back.
I am fading this euphoria inside the $231.50 to $233.00 supply wick. Lock in partials at $226.50 once the $229.50 mid-pivot cracks, and target $224.00 flat at the demand base. If a 4H candle closes above $235.50, this double top invalidates and you cut the short immediately without looking back.
163
·
--
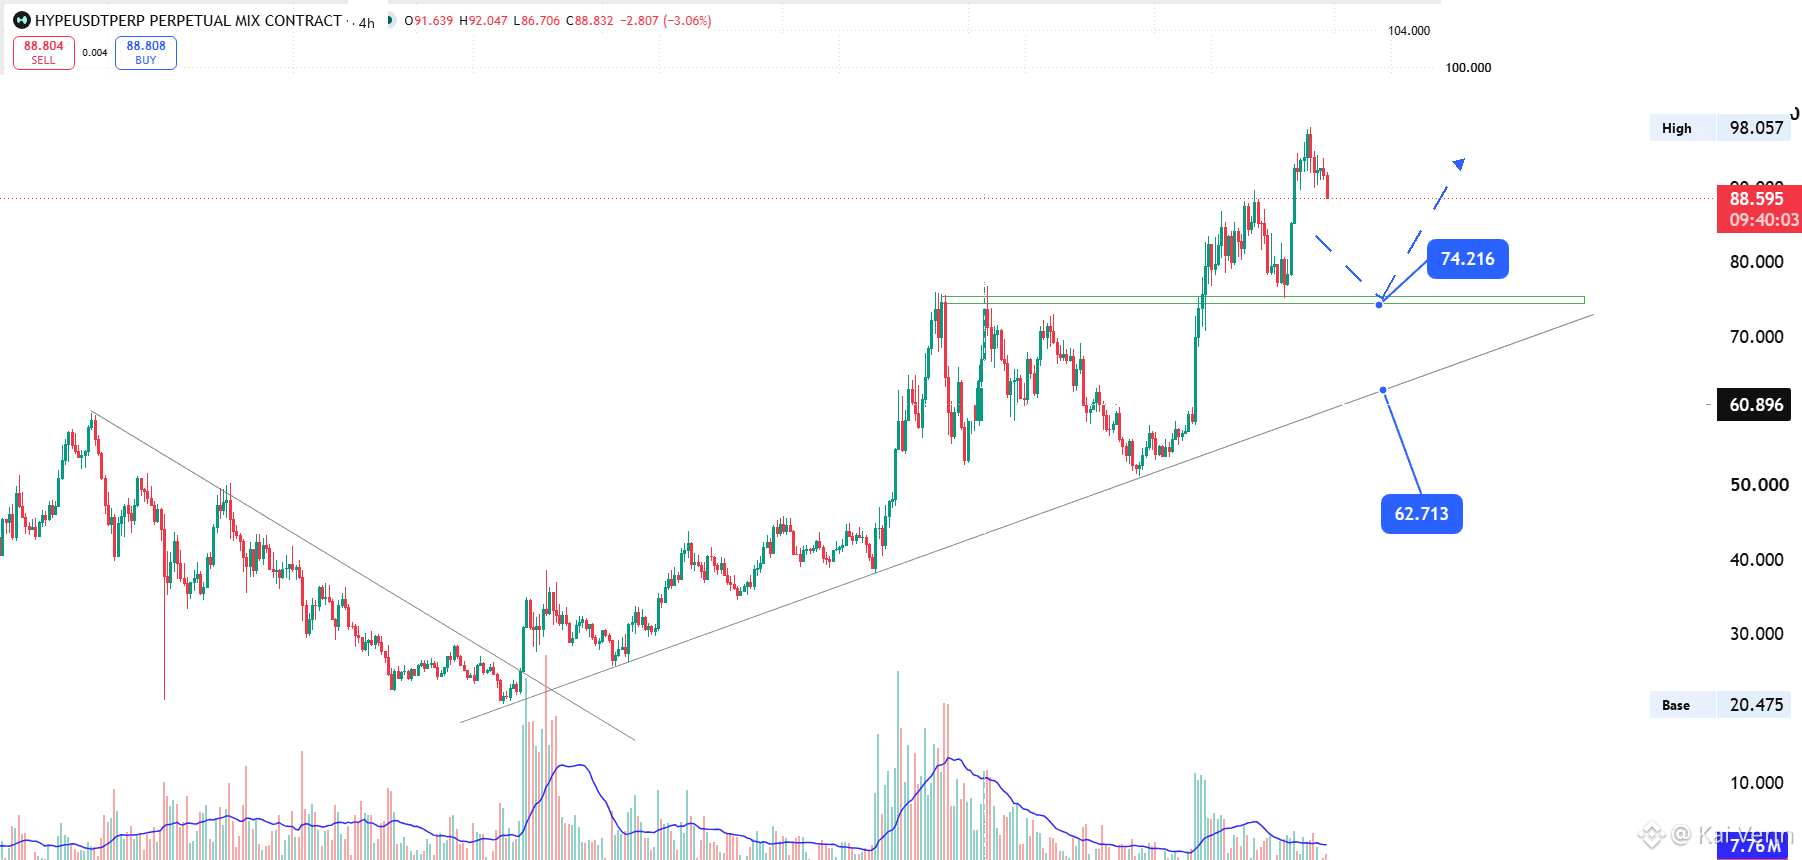
$HYPE engineered a classic liquidity sweep at $98.057 after breaking out of a seven-month ascending triangle. Retail buyers chased the expansion candle above $90, only to get trapped at the local top while smart money started rotating profits.
The institutional bid does not sit here at $88.59. The real demand rests back at the previous $74.216 multi-touch ceiling, which now serves as primary structural support alongside the macro ascending trendline. Wait for this corrective leg to finish washing out late longs into the $74.00 to $76.00 zone before stepping in.
Take initial profits back at $88.00 and leave runners for a retest of $98.00 and new highs above $105.00. If a 4H candle closes below $71.50, the breakout failed, structure breaks down, and you cut the trade immediately.
$HYPE engineered a classic liquidity sweep at $98.057 after breaking out of a seven-month ascending triangle. Retail buyers chased the expansion candle above $90, only to get trapped at the local top while smart money started rotating profits.
The institutional bid does not sit here at $88.59. The real demand rests back at the previous $74.216 multi-touch ceiling, which now serves as primary structural support alongside the macro ascending trendline. Wait for this corrective leg to finish washing out late longs into the $74.00 to $76.00 zone before stepping in.
Take initial profits back at $88.00 and leave runners for a retest of $98.00 and new highs above $105.00. If a 4H candle closes below $71.50, the breakout failed, structure breaks down, and you cut the trade immediately.
The institutional bid does not sit here at $88.59. The real demand rests back at the previous $74.216 multi-touch ceiling, which now serves as primary structural support alongside the macro ascending trendline. Wait for this corrective leg to finish washing out late longs into the $74.00 to $76.00 zone before stepping in.
Take initial profits back at $88.00 and leave runners for a retest of $98.00 and new highs above $105.00. If a 4H candle closes below $71.50, the breakout failed, structure breaks down, and you cut the trade immediately.
332
·
--
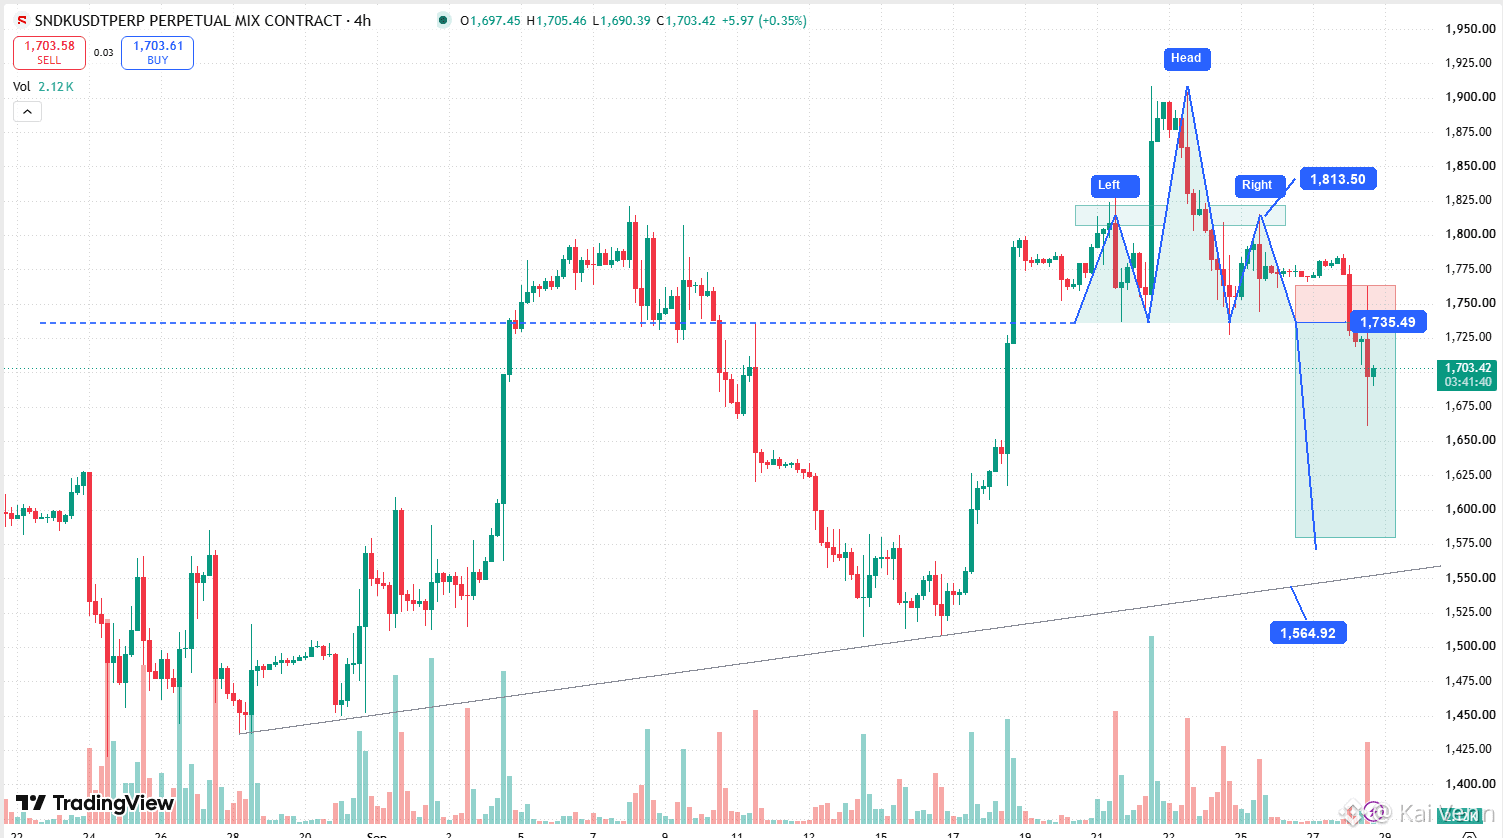
$SNDK triggered a textbook Head and Shoulders breakdown on the 4H chart the moment the $1,735.49 neckline gave out. Both shoulders stalled at $1,813.50 before the head swept $1,907.98 to trap late breakout longs. That opens a clean path down toward the macro ascending trendline near $1,565.
Do not chase red candles into $1,675. Wait for a relief bounce into the broken neckline between $1,730 and $1,738 to short. Take initial profits around $1,600 and let runners ride down to $1,565. If a 4H candle closes back above $1,762.67, the setup is invalidated and you cut the trade immediately without arguing with the tape.
$SNDK triggered a textbook Head and Shoulders breakdown on the 4H chart the moment the $1,735.49 neckline gave out. Both shoulders stalled at $1,813.50 before the head swept $1,907.98 to trap late breakout longs. That opens a clean path down toward the macro ascending trendline near $1,565.
Do not chase red candles into $1,675. Wait for a relief bounce into the broken neckline between $1,730 and $1,738 to short. Take initial profits around $1,600 and let runners ride down to $1,565. If a 4H candle closes back above $1,762.67, the setup is invalidated and you cut the trade immediately without arguing with the tape.
Do not chase red candles into $1,675. Wait for a relief bounce into the broken neckline between $1,730 and $1,738 to short. Take initial profits around $1,600 and let runners ride down to $1,565. If a 4H candle closes back above $1,762.67, the setup is invalidated and you cut the trade immediately without arguing with the tape.
651
·
--
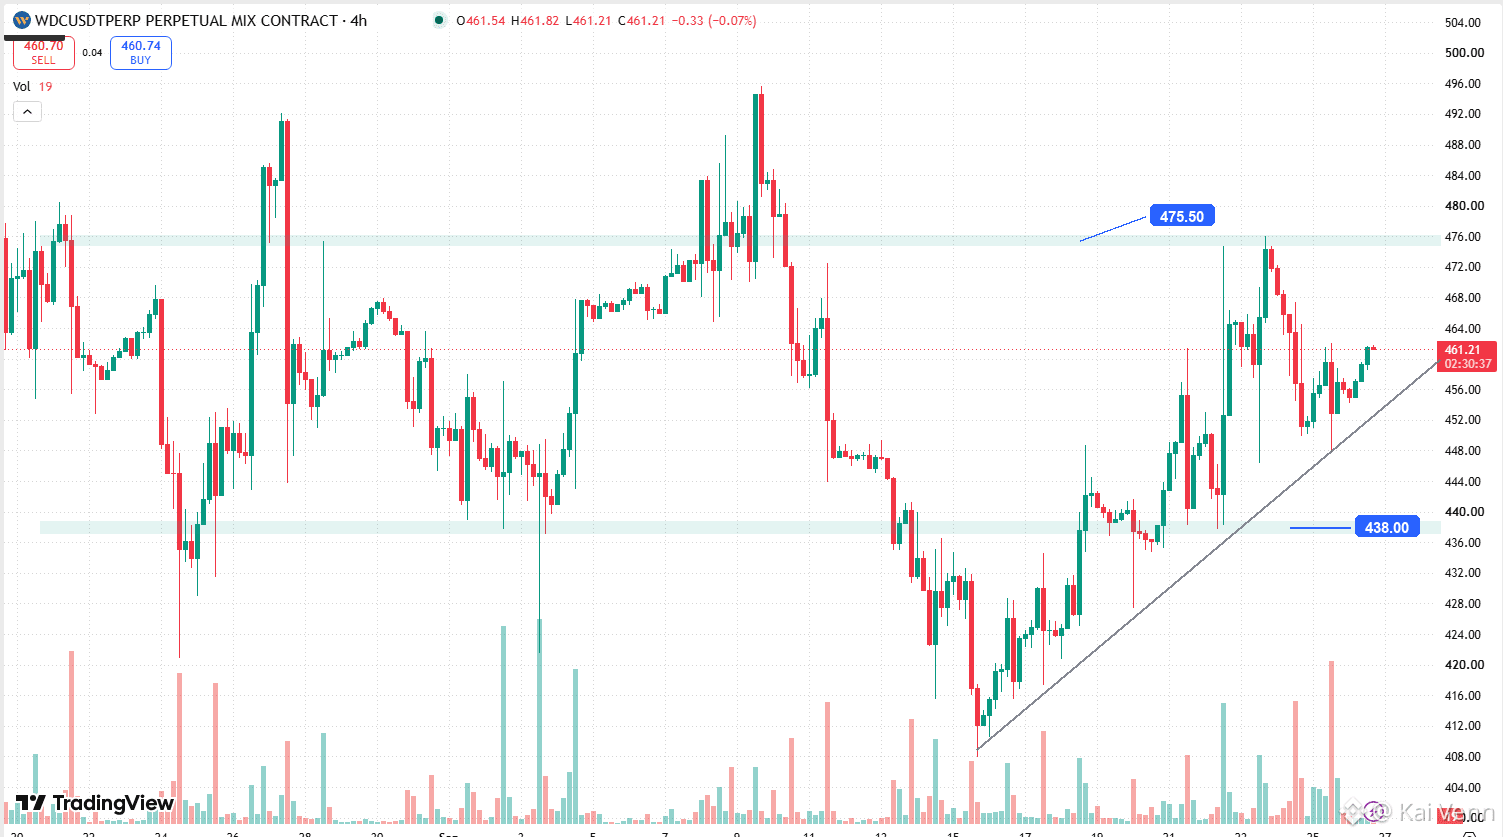
$WDC 4H structure shows a clean higher-low recovery running off the $412 bottom, but taking new positions right in the middle at $461 makes no sense. The ceiling is obvious at $475.50 after last week's upper-wick rejection, and chasing green candles here means absorbing supply from sellers who have been distributing since $496.
If you want the long side, wait for price to test the ascending trendline support near $450 to $452. Enter on confirmation with an initial take profit at $472 and runners targeting $475.50. A 4H candle close below $448 breaks the structural swing low, and you cut the trade immediately without arguing with the order book.
If price pushes straight into $473 to $475.50 first, look for a rejection wick to take a quick short toward $458, with a hard stop on any 4H close above $478.
$WDC 4H structure shows a clean higher-low recovery running off the $412 bottom, but taking new positions right in the middle at $461 makes no sense. The ceiling is obvious at $475.50 after last week's upper-wick rejection, and chasing green candles here means absorbing supply from sellers who have been distributing since $496.
If you want the long side, wait for price to test the ascending trendline support near $450 to $452. Enter on confirmation with an initial take profit at $472 and runners targeting $475.50. A 4H candle close below $448 breaks the structural swing low, and you cut the trade immediately without arguing with the order book.
If price pushes straight into $473 to $475.50 first, look for a rejection wick to take a quick short toward $458, with a hard stop on any 4H close above $478.
If you want the long side, wait for price to test the ascending trendline support near $450 to $452. Enter on confirmation with an initial take profit at $472 and runners targeting $475.50. A 4H candle close below $448 breaks the structural swing low, and you cut the trade immediately without arguing with the order book.
If price pushes straight into $473 to $475.50 first, look for a rejection wick to take a quick short toward $458, with a hard stop on any 4H close above $478.
405
·
--
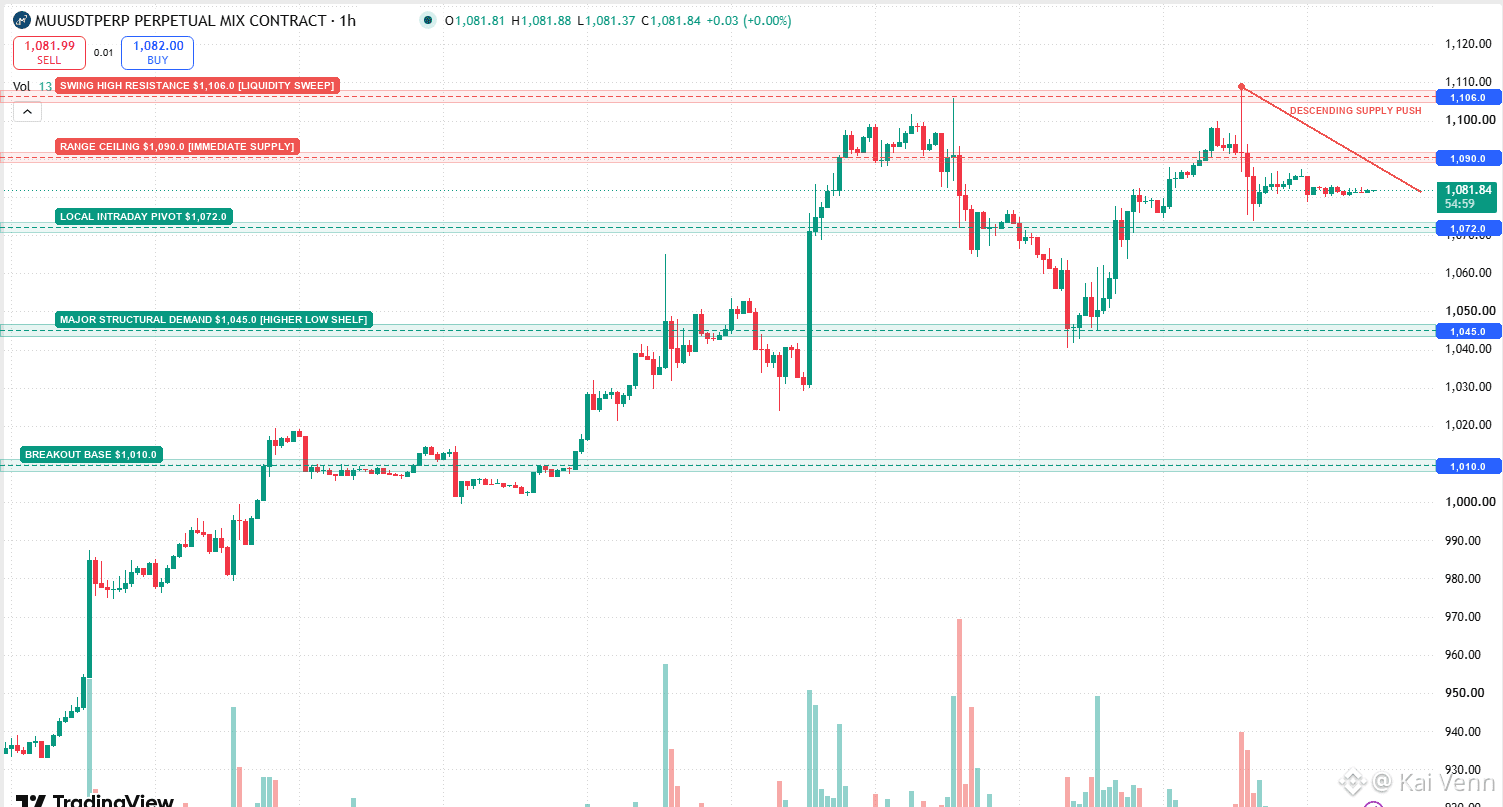
$MU printed a violent wick up to $1,106.00 that swept liquidity above the consolidation highs before sellers drove price right back inside the bracket.
We are now compressing beneath a descending supply trendline just above the $1,072.00 intraday pivot. Bidding $1,082 here makes zero sense into heavy overhead supply at $1,090.00. I am waiting for this compression to resolve toward genuine demand rather than guessing the break.
Levels to trade:
- Bid zone: $1,042 to $1,048 (major higher low structural demand shelf)
- Take profit: $1,072 on initial rotation, runners to $1,090
- Invalidation hard stop: 1H candle close below $1,036. Cut it on the close without hesitation, no bagholding.
Tactical short alternative: if price tests $1,088 to $1,092 and prints a 1H rejection wick under the descending trendline, take the short fade down to $1,072 with a hard stop above $1,102.
$MU printed a violent wick up to $1,106.00 that swept liquidity above the consolidation highs before sellers drove price right back inside the bracket.
We are now compressing beneath a descending supply trendline just above the $1,072.00 intraday pivot. Bidding $1,082 here makes zero sense into heavy overhead supply at $1,090.00. I am waiting for this compression to resolve toward genuine demand rather than guessing the break.
Levels to trade:
- Bid zone: $1,042 to $1,048 (major higher low structural demand shelf)
- Take profit: $1,072 on initial rotation, runners to $1,090
- Invalidation hard stop: 1H candle close below $1,036. Cut it on the close without hesitation, no bagholding.
Tactical short alternative: if price tests $1,088 to $1,092 and prints a 1H rejection wick under the descending trendline, take the short fade down to $1,072 with a hard stop above $1,102.
We are now compressing beneath a descending supply trendline just above the $1,072.00 intraday pivot. Bidding $1,082 here makes zero sense into heavy overhead supply at $1,090.00. I am waiting for this compression to resolve toward genuine demand rather than guessing the break.
Levels to trade:
- Bid zone: $1,042 to $1,048 (major higher low structural demand shelf)
- Take profit: $1,072 on initial rotation, runners to $1,090
- Invalidation hard stop: 1H candle close below $1,036. Cut it on the close without hesitation, no bagholding.
Tactical short alternative: if price tests $1,088 to $1,092 and prints a 1H rejection wick under the descending trendline, take the short fade down to $1,072 with a hard stop above $1,102.
280
·
--
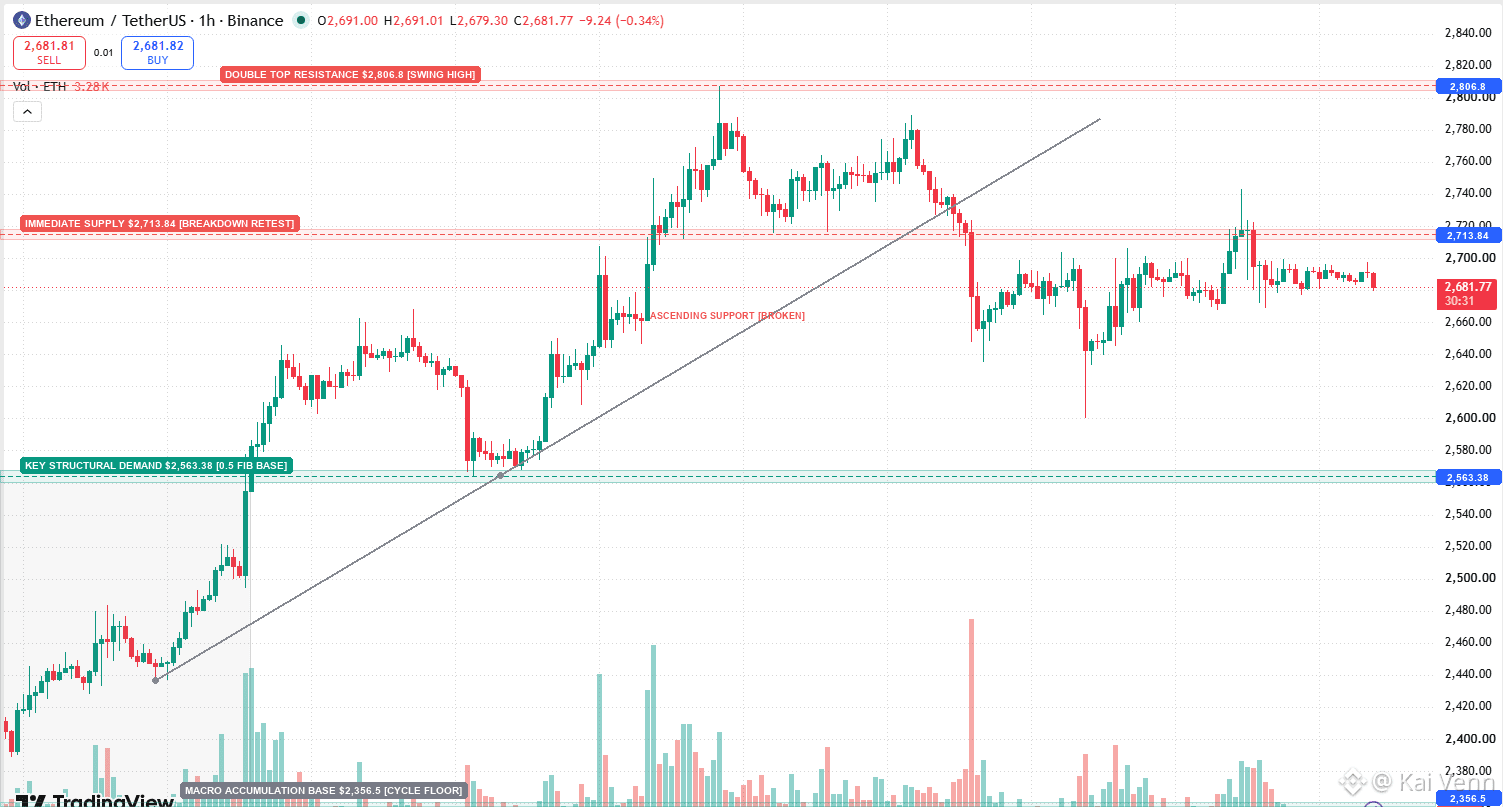
$ETH followed Bitcoin right out the window after losing its multi-day diagonal support trendline that drove the entire rally from the $2,350 base.
The double top print at $2,806 was a textbook distribution trap, and the impulsive sell candle that sliced through the trendline confirmed the breakdown. Right now, price is putting in a weak corrective retest beneath immediate overhead supply at $2,713.84. As long as 1H candles keep rejecting under this $2,710 to $2,715 pocket, there is zero reason to chase longs. Path of least resistance favors a rotation back toward $2,640 and ultimately down into major structural demand at $2,563.38 (the 0.5 Fib confluence). If buyers fail to defend $2,560, the trap door opens for a full mean reversion down to the $2,350 origin.
Desk execution is simple: fade any relief wicks pushing into $2,705 to $2,715 targeting $2,640 and $2,563. Any hourly close printing and holding above $2,735 invalidates the short bias immediately, cut it with zero hesitation.
$ETH followed Bitcoin right out the window after losing its multi-day diagonal support trendline that drove the entire rally from the $2,350 base.
The double top print at $2,806 was a textbook distribution trap, and the impulsive sell candle that sliced through the trendline confirmed the breakdown. Right now, price is putting in a weak corrective retest beneath immediate overhead supply at $2,713.84. As long as 1H candles keep rejecting under this $2,710 to $2,715 pocket, there is zero reason to chase longs. Path of least resistance favors a rotation back toward $2,640 and ultimately down into major structural demand at $2,563.38 (the 0.5 Fib confluence). If buyers fail to defend $2,560, the trap door opens for a full mean reversion down to the $2,350 origin.
Desk execution is simple: fade any relief wicks pushing into $2,705 to $2,715 targeting $2,640 and $2,563. Any hourly close printing and holding above $2,735 invalidates the short bias immediately, cut it with zero hesitation.
The double top print at $2,806 was a textbook distribution trap, and the impulsive sell candle that sliced through the trendline confirmed the breakdown. Right now, price is putting in a weak corrective retest beneath immediate overhead supply at $2,713.84. As long as 1H candles keep rejecting under this $2,710 to $2,715 pocket, there is zero reason to chase longs. Path of least resistance favors a rotation back toward $2,640 and ultimately down into major structural demand at $2,563.38 (the 0.5 Fib confluence). If buyers fail to defend $2,560, the trap door opens for a full mean reversion down to the $2,350 origin.
Desk execution is simple: fade any relief wicks pushing into $2,705 to $2,715 targeting $2,640 and $2,563. Any hourly close printing and holding above $2,735 invalidates the short bias immediately, cut it with zero hesitation.
70
·
--
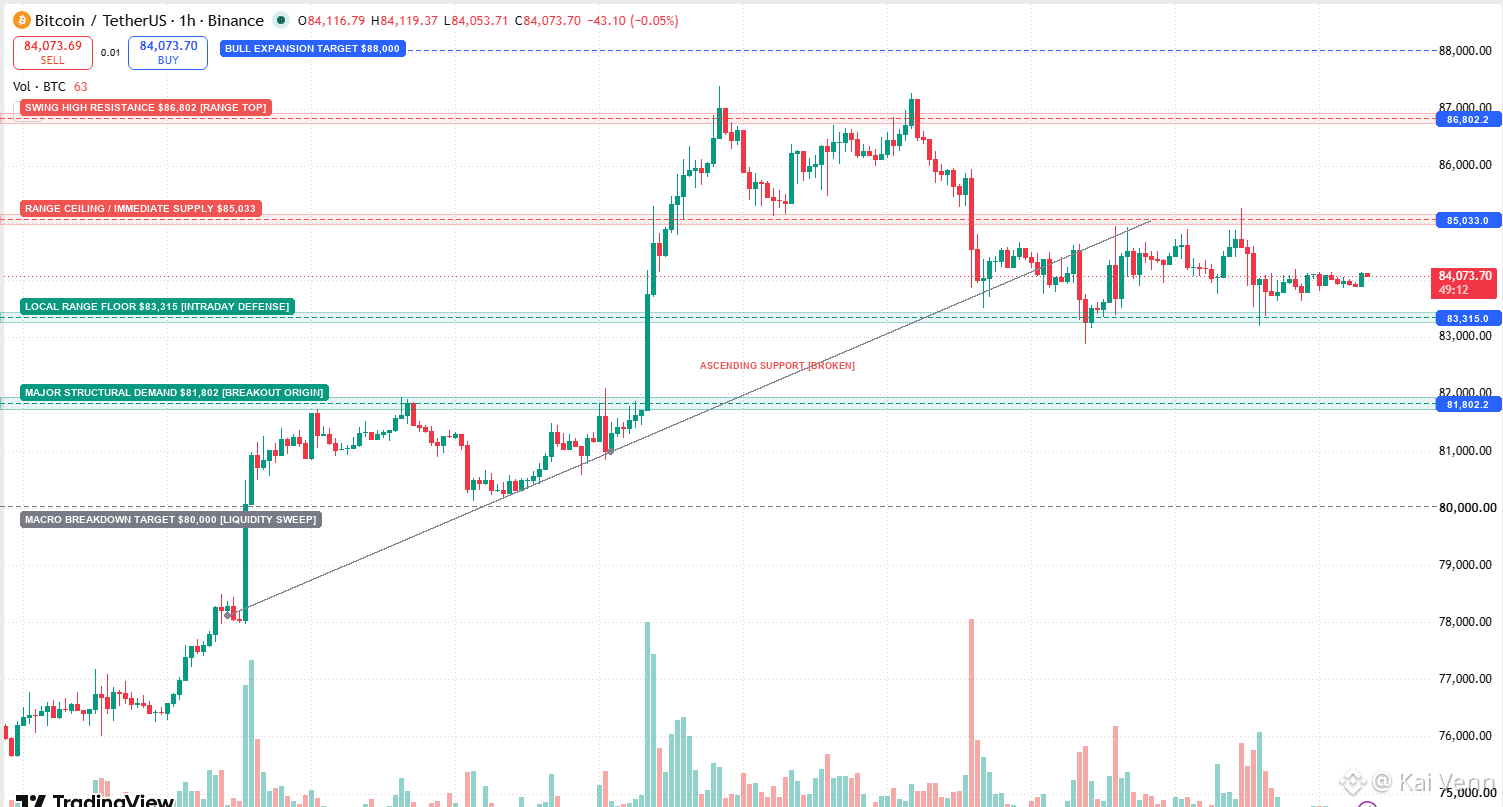
$BTC is compressing inside a tight 1H range bracket between $83,315 and $85,033 after breaking down below its ascending support trendline from the $76,500 swing low.
Market structure on the 1H timeframe remains defensively capped by the $85,033 breakdown origin. Every relief bounce into this ceiling continues to get absorbed by sellers. A clean close below the $83,315 local floor triggers a rapid flush toward the primary structural breakout base at $81,800 to $82,000. If bulls fail to defend $81,800, expect an acceleration sweep down to $80,000, with secondary macro liquidity resting at $70,000 to $71,000. Regaining upside momentum requires an hourly close firmly back above $86,802 to re-open a run toward $88,000.
Execution Plan:
- Short Reload: $84,800 to $85,033 on rejection wicks
- Take Profit Targets: $83,315, then $81,802
- Demand Bid Zone: $81,600 to $82,000 on confirmed absorption
- Invalidation Stop: Cut position immediately on any candle close above $86,802
$BTC is compressing inside a tight 1H range bracket between $83,315 and $85,033 after breaking down below its ascending support trendline from the $76,500 swing low.
Market structure on the 1H timeframe remains defensively capped by the $85,033 breakdown origin. Every relief bounce into this ceiling continues to get absorbed by sellers. A clean close below the $83,315 local floor triggers a rapid flush toward the primary structural breakout base at $81,800 to $82,000. If bulls fail to defend $81,800, expect an acceleration sweep down to $80,000, with secondary macro liquidity resting at $70,000 to $71,000. Regaining upside momentum requires an hourly close firmly back above $86,802 to re-open a run toward $88,000.
Execution Plan:
- Short Reload: $84,800 to $85,033 on rejection wicks
- Take Profit Targets: $83,315, then $81,802
- Demand Bid Zone: $81,600 to $82,000 on confirmed absorption
- Invalidation Stop: Cut position immediately on any candle close above $86,802
Market structure on the 1H timeframe remains defensively capped by the $85,033 breakdown origin. Every relief bounce into this ceiling continues to get absorbed by sellers. A clean close below the $83,315 local floor triggers a rapid flush toward the primary structural breakout base at $81,800 to $82,000. If bulls fail to defend $81,800, expect an acceleration sweep down to $80,000, with secondary macro liquidity resting at $70,000 to $71,000. Regaining upside momentum requires an hourly close firmly back above $86,802 to re-open a run toward $88,000.
Execution Plan:
- Short Reload: $84,800 to $85,033 on rejection wicks
- Take Profit Targets: $83,315, then $81,802
- Demand Bid Zone: $81,600 to $82,000 on confirmed absorption
- Invalidation Stop: Cut position immediately on any candle close above $86,802
87
·
--
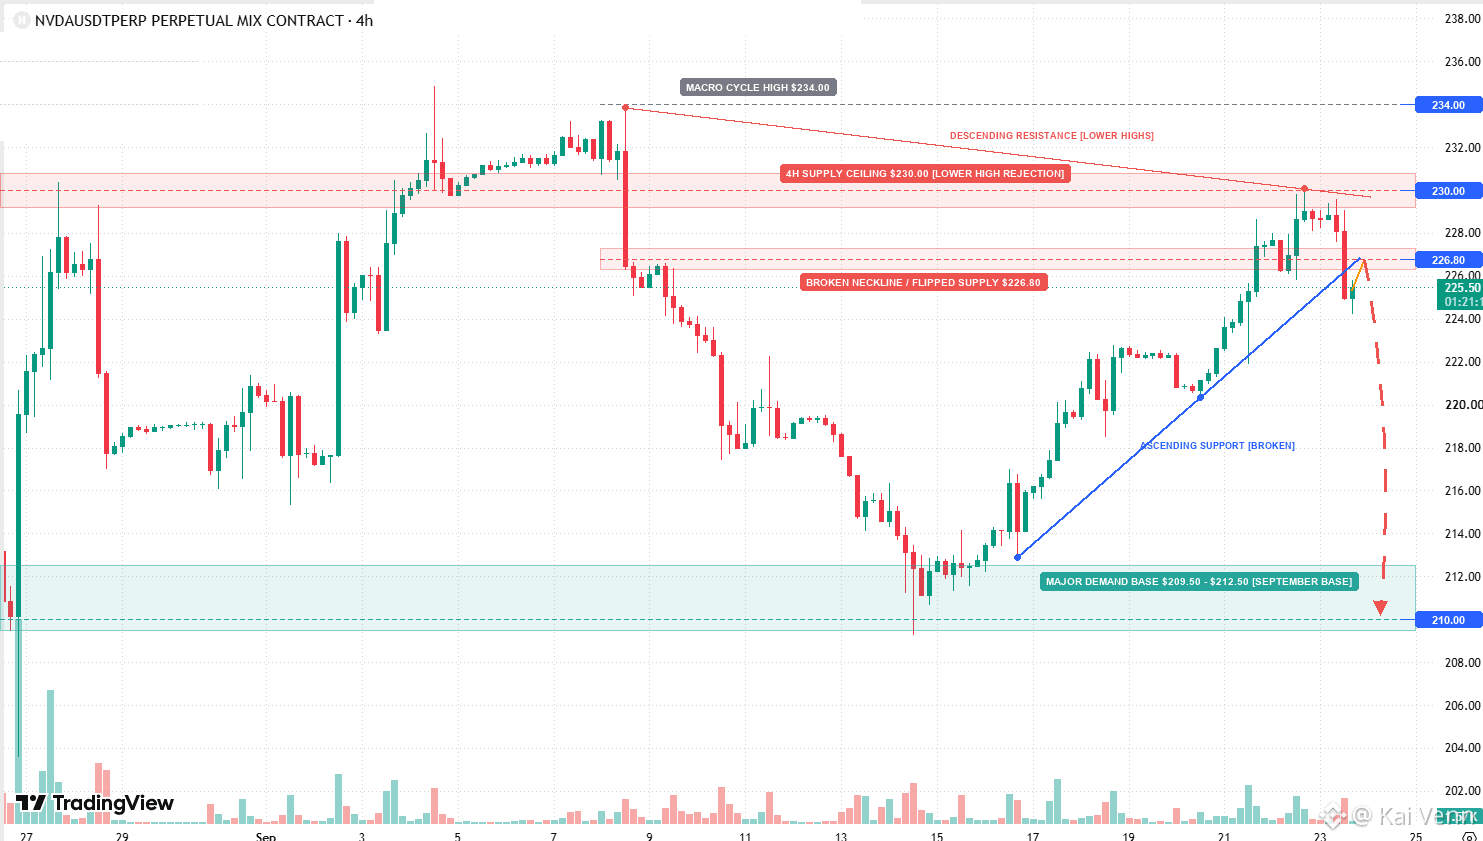
$NVDA lost its primary ascending trendline after printing a textbook lower high rejection at the $230 supply ceiling, trapped beneath the $234 cycle peak.
The $226.80 neckline has flipped into immediate overhead resistance. With the diagonal bull trendline broken, there is no meaningful high-timeframe structural support between current levels and the $210 macro demand floor. Any minor pause around $222 is weak liquidity. The real institutional bid sits at $210, where the entire September rally originated.
Execution setup:
- Short Reload: $226.50 to $227.50 on the retest wick
- Primary Target: $210.00
- Hard Stop: Any 4H candle close above $230.50
The projection path looks for a brief relief retest into the broken trendline followed by an expansion flush into $210. Stand aside on long bids until the $210 macro shelf is tested.
$NVDA lost its primary ascending trendline after printing a textbook lower high rejection at the $230 supply ceiling, trapped beneath the $234 cycle peak.
The $226.80 neckline has flipped into immediate overhead resistance. With the diagonal bull trendline broken, there is no meaningful high-timeframe structural support between current levels and the $210 macro demand floor. Any minor pause around $222 is weak liquidity. The real institutional bid sits at $210, where the entire September rally originated.
Execution setup:
- Short Reload: $226.50 to $227.50 on the retest wick
- Primary Target: $210.00
- Hard Stop: Any 4H candle close above $230.50
The projection path looks for a brief relief retest into the broken trendline followed by an expansion flush into $210. Stand aside on long bids until the $210 macro shelf is tested.
The $226.80 neckline has flipped into immediate overhead resistance. With the diagonal bull trendline broken, there is no meaningful high-timeframe structural support between current levels and the $210 macro demand floor. Any minor pause around $222 is weak liquidity. The real institutional bid sits at $210, where the entire September rally originated.
Execution setup:
- Short Reload: $226.50 to $227.50 on the retest wick
- Primary Target: $210.00
- Hard Stop: Any 4H candle close above $230.50
The projection path looks for a brief relief retest into the broken trendline followed by an expansion flush into $210. Stand aside on long bids until the $210 macro shelf is tested.
66
·
--
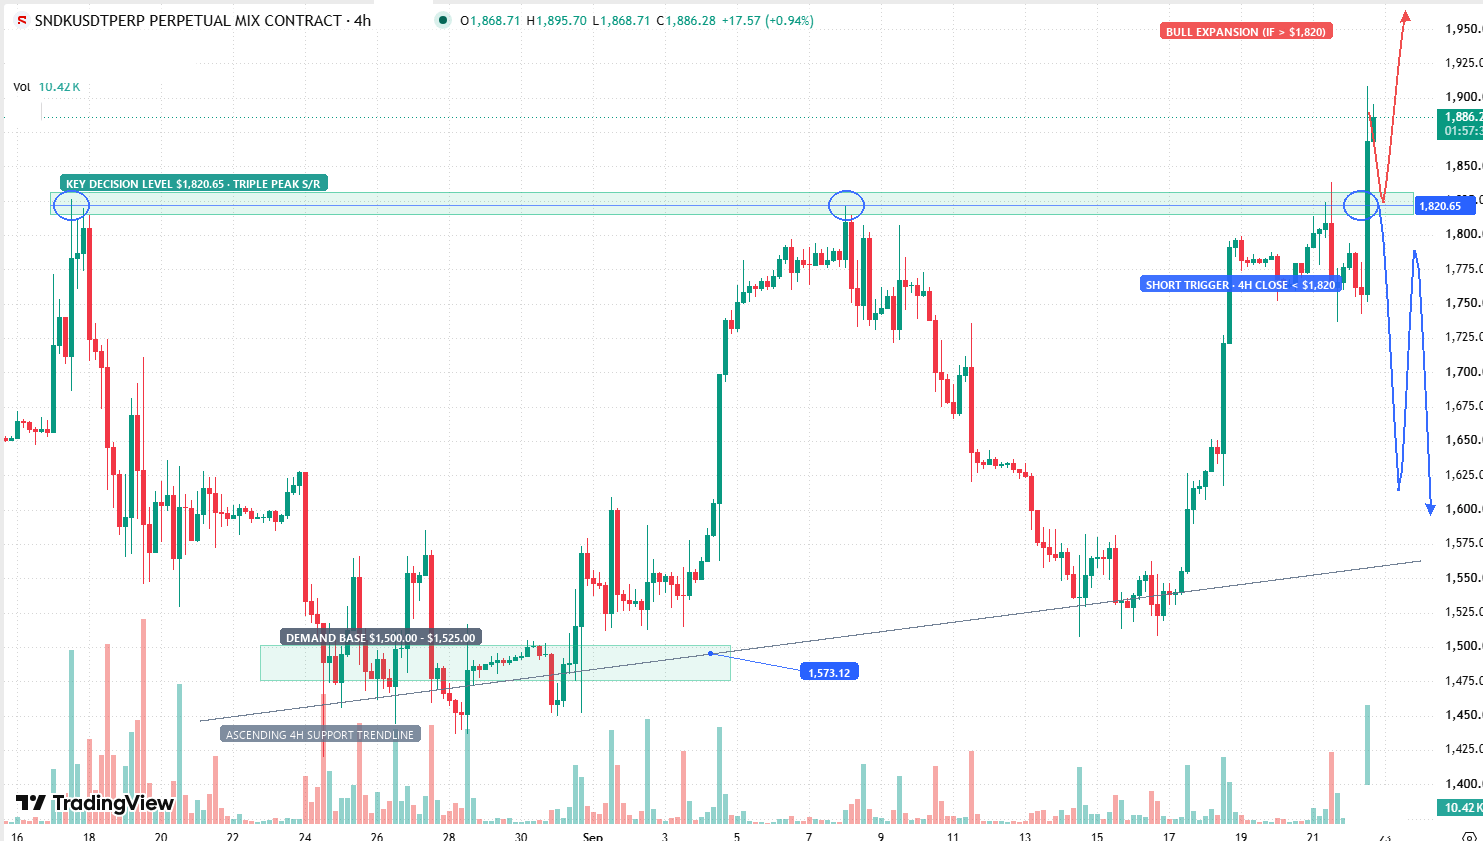
$SNDK rejection from $1,895 is live, flushing straight into our $1,820 trigger line. If 4H closes below $1,820, the bull trap is confirmed and we ride this down to $1,650.
$SNDK rejection from $1,895 is live, flushing straight into our $1,820 trigger line. If 4H closes below $1,820, the bull trap is confirmed and we ride this down to $1,650.
Kai Venn
·
--
$SNDK is trading near $1,885 after breaking out above the $1,820 resistance ceiling.
Do not touch the short while price sits above $1,820. Bulls remain in full control as long as this shelf holds, with an open path toward $2,000.
The only reason to get short is if 4H structure breaks below $1,820.
If a 4H candle closes below $1,820, sell the retest into $1,810 to $1,820. First target sits at $1,650, followed by the ascending trendline around $1,575.
Do not touch the short while price sits above $1,820. Bulls remain in full control as long as this shelf holds, with an open path toward $2,000.
The only reason to get short is if 4H structure breaks below $1,820.
If a 4H candle closes below $1,820, sell the retest into $1,810 to $1,820. First target sits at $1,650, followed by the ascending trendline around $1,575.
312
·
--
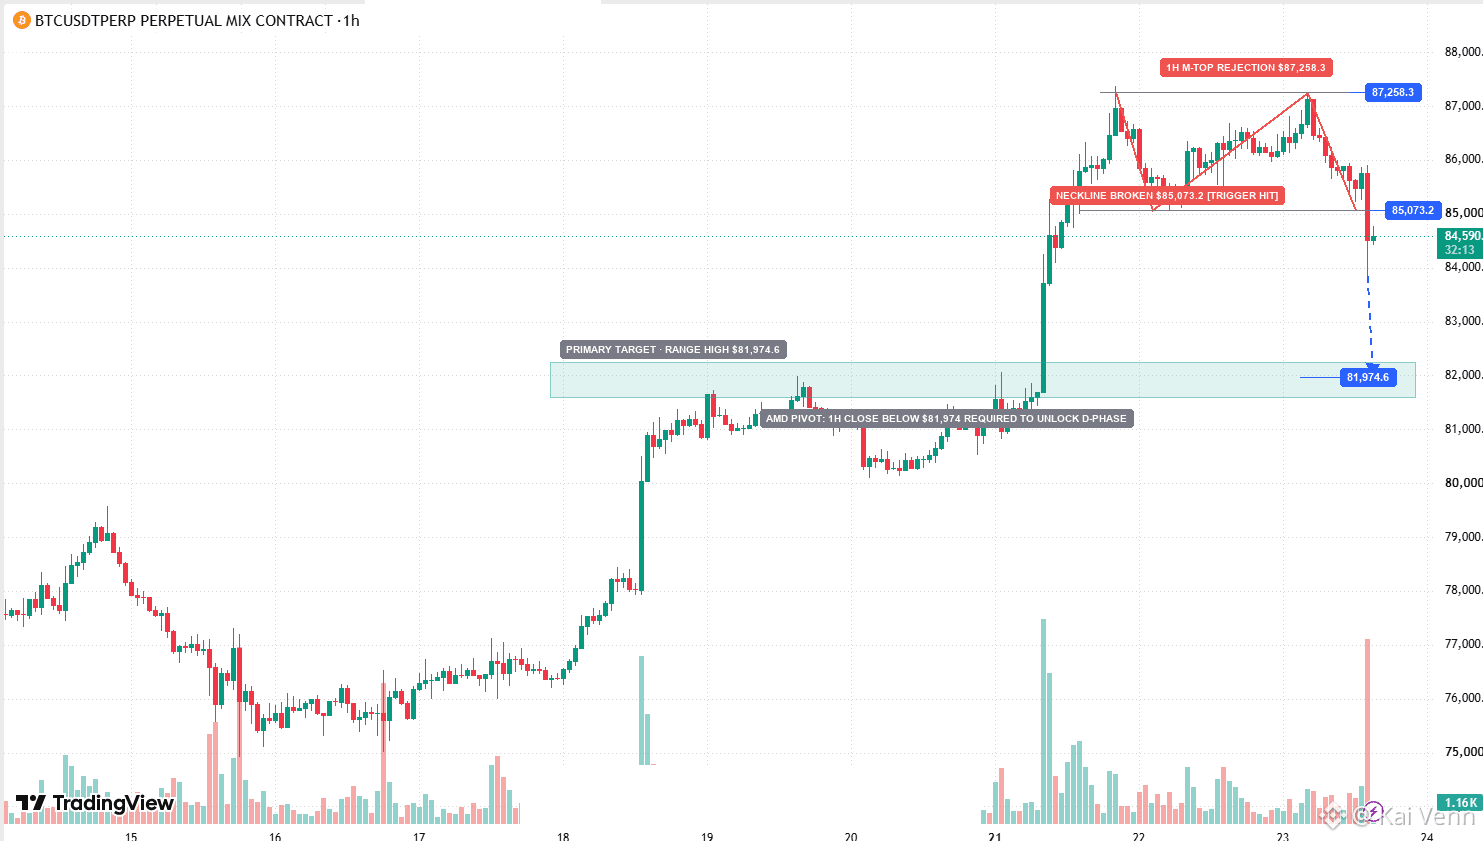
$BTC delivered on the 1H M-top breakdown with textbook precision, slicing clean through the $85,070 neckline and flushing down to $83,840.
If you took the breakdown short when $85,070 gave way, you have a solid cushion. Lock in partials right here and trail your stop to $85,600 to ensure this trade cannot turn red.
The immediate target is the $81,970 prior range ceiling. This is the structural dividing line. Only an hourly close through $81,970 confirms the entire push above was a liquidity sweep, which opens the path toward deeper distribution.
Do not chase late short fills in no-man's-land. Either let price reach the $82,000 target to cover your position, or wait for an exhausted relief tap toward $85,000 before adding. Hard stop on any 1H close back above $85,800.
$BTC delivered on the 1H M-top breakdown with textbook precision, slicing clean through the $85,070 neckline and flushing down to $83,840.
If you took the breakdown short when $85,070 gave way, you have a solid cushion. Lock in partials right here and trail your stop to $85,600 to ensure this trade cannot turn red.
The immediate target is the $81,970 prior range ceiling. This is the structural dividing line. Only an hourly close through $81,970 confirms the entire push above was a liquidity sweep, which opens the path toward deeper distribution.
Do not chase late short fills in no-man's-land. Either let price reach the $82,000 target to cover your position, or wait for an exhausted relief tap toward $85,000 before adding. Hard stop on any 1H close back above $85,800.
If you took the breakdown short when $85,070 gave way, you have a solid cushion. Lock in partials right here and trail your stop to $85,600 to ensure this trade cannot turn red.
The immediate target is the $81,970 prior range ceiling. This is the structural dividing line. Only an hourly close through $81,970 confirms the entire push above was a liquidity sweep, which opens the path toward deeper distribution.
Do not chase late short fills in no-man's-land. Either let price reach the $82,000 target to cover your position, or wait for an exhausted relief tap toward $85,000 before adding. Hard stop on any 1H close back above $85,800.
Kai Venn
·
--
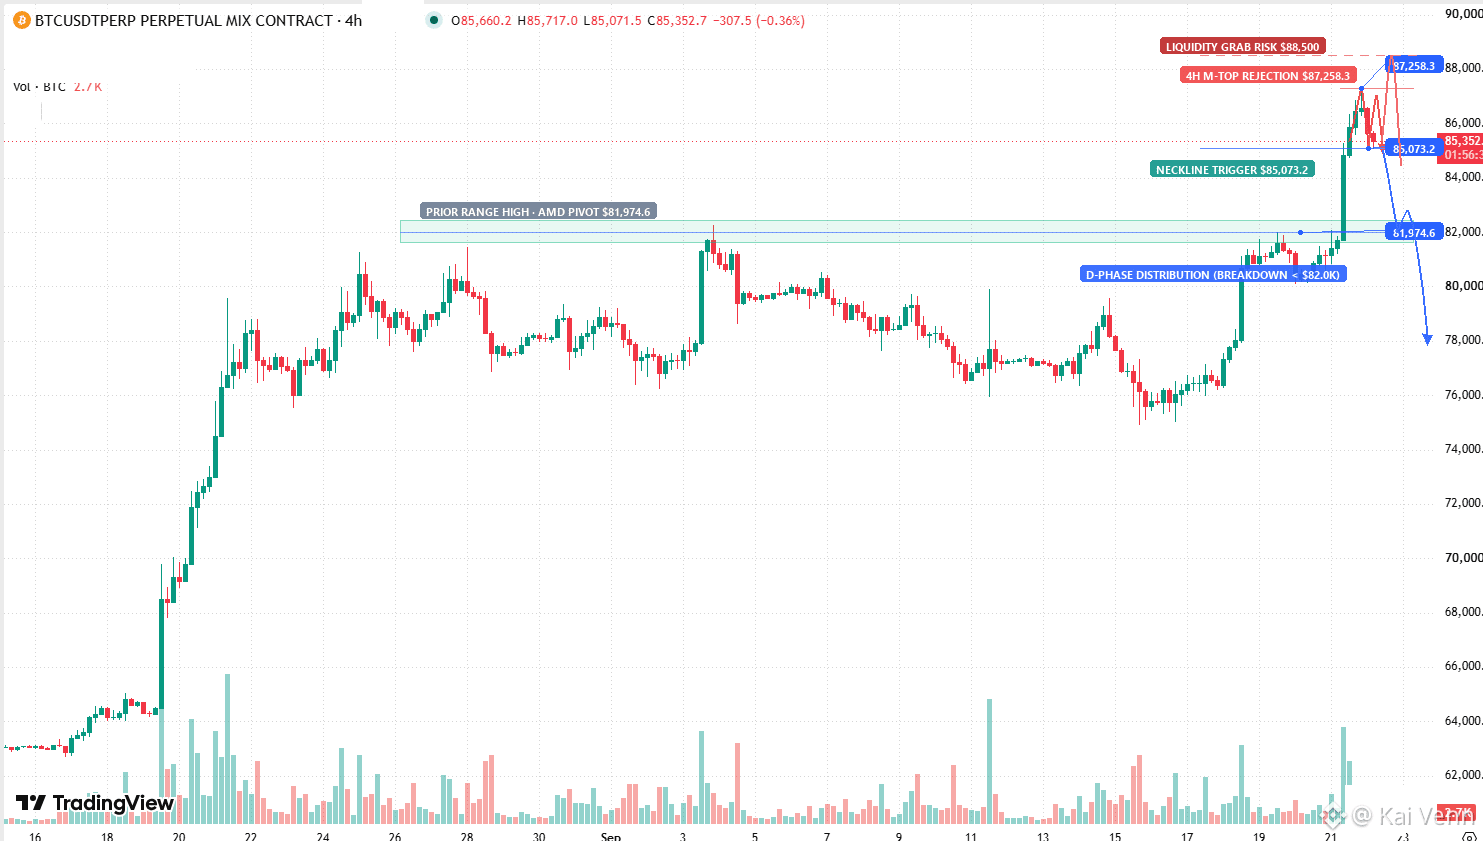
$BTC is carving out a 4H M-top structure right below the $87,260 resistance high, and everything hinges on the $85,070 neckline.
A confirmed 4H close below $85,070 opens immediate downside toward the previous range ceiling at $81,970. Slicing through $81,970 confirms the entire breakout was the Manipulation phase of an AMD setup, unlocking the Distribution phase toward $78,000.
Keep in mind there is still residual liquidity sitting near $88,500. Be alert for a fast wick into $88,500 to wipe late breakout shorts before the real flush begins.
- Short Trigger 1: 4H close below $85,070 (Target: $82,000)
- Short Trigger 2: 4H close below $81,970 (Target: $78,000)
- Invalidation: 4H close above $88,800
A confirmed 4H close below $85,070 opens immediate downside toward the previous range ceiling at $81,970. Slicing through $81,970 confirms the entire breakout was the Manipulation phase of an AMD setup, unlocking the Distribution phase toward $78,000.
Keep in mind there is still residual liquidity sitting near $88,500. Be alert for a fast wick into $88,500 to wipe late breakout shorts before the real flush begins.
- Short Trigger 1: 4H close below $85,070 (Target: $82,000)
- Short Trigger 2: 4H close below $81,970 (Target: $78,000)
- Invalidation: 4H close above $88,800
61
·
--
$BTC is carving out a 4H M-top structure right below the $87,260 resistance high, and everything hinges on the $85,070 neckline.
A confirmed 4H close below $85,070 opens immediate downside toward the previous range ceiling at $81,970. Slicing through $81,970 confirms the entire breakout was the Manipulation phase of an AMD setup, unlocking the Distribution phase toward $78,000.
Keep in mind there is still residual liquidity sitting near $88,500. Be alert for a fast wick into $88,500 to wipe late breakout shorts before the real flush begins.
- Short Trigger 1: 4H close below $85,070 (Target: $82,000)
- Short Trigger 2: 4H close below $81,970 (Target: $78,000)
- Invalidation: 4H close above $88,800
$BTC is carving out a 4H M-top structure right below the $87,260 resistance high, and everything hinges on the $85,070 neckline.
A confirmed 4H close below $85,070 opens immediate downside toward the previous range ceiling at $81,970. Slicing through $81,970 confirms the entire breakout was the Manipulation phase of an AMD setup, unlocking the Distribution phase toward $78,000.
Keep in mind there is still residual liquidity sitting near $88,500. Be alert for a fast wick into $88,500 to wipe late breakout shorts before the real flush begins.
- Short Trigger 1: 4H close below $85,070 (Target: $82,000)
- Short Trigger 2: 4H close below $81,970 (Target: $78,000)
- Invalidation: 4H close above $88,800
A confirmed 4H close below $85,070 opens immediate downside toward the previous range ceiling at $81,970. Slicing through $81,970 confirms the entire breakout was the Manipulation phase of an AMD setup, unlocking the Distribution phase toward $78,000.
Keep in mind there is still residual liquidity sitting near $88,500. Be alert for a fast wick into $88,500 to wipe late breakout shorts before the real flush begins.
- Short Trigger 1: 4H close below $85,070 (Target: $82,000)
- Short Trigger 2: 4H close below $81,970 (Target: $78,000)
- Invalidation: 4H close above $88,800
1
1
88
·
--
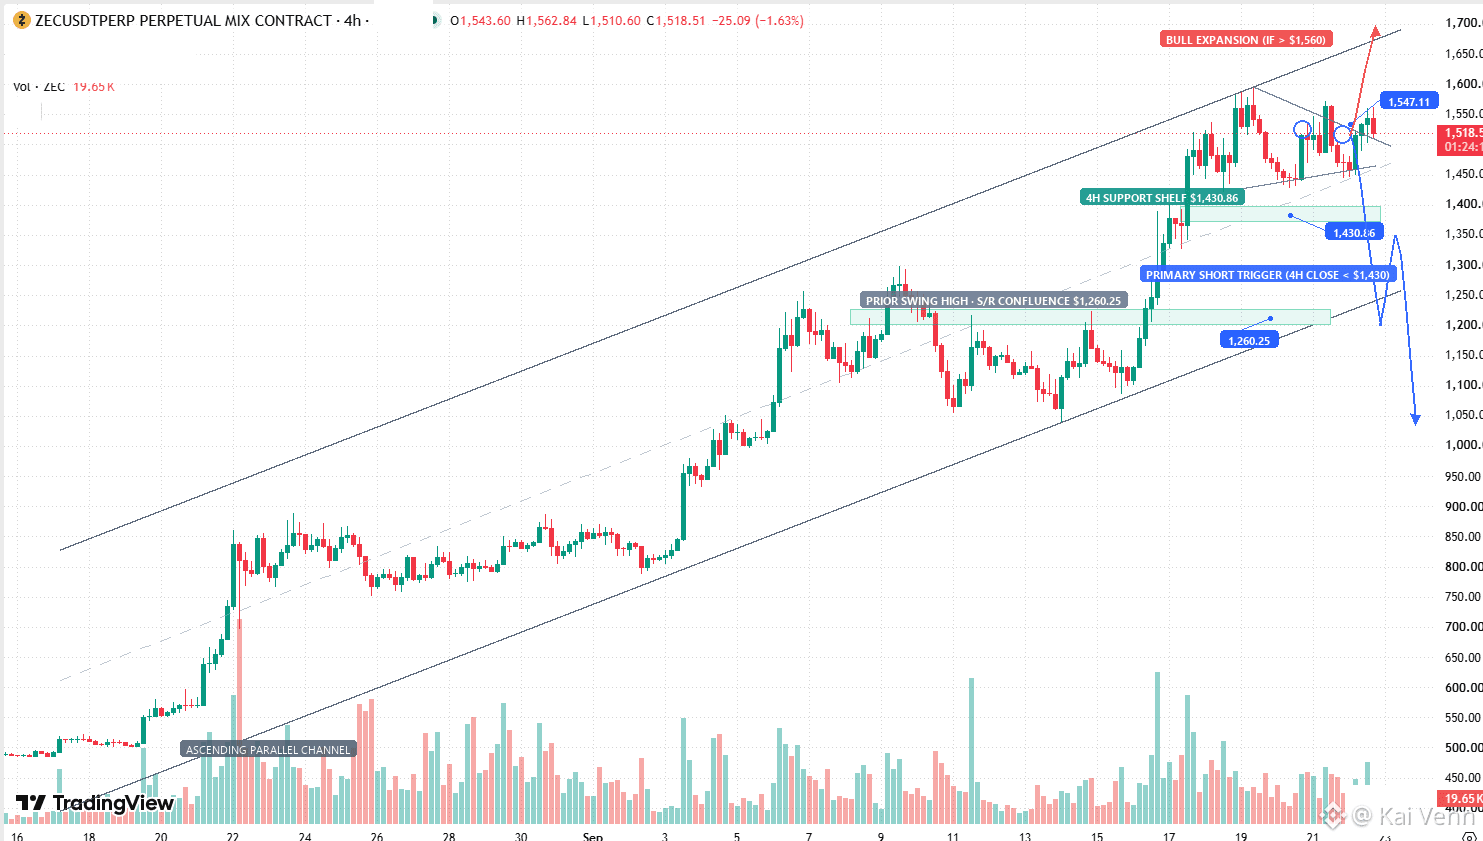
$ZEC gained over +230% off the $466 summer low, but momentum is finally stalling at the upper boundary of the multi-month channel.
While retail chases green breakouts into $1,550, the 4H structure is putting in lower highs and pressing directly against the $1,430 support shelf. I am strictly biased short here.
The trade activates on a confirmed 4H close below $1,430.
Once $1,430 breaks, sell the retest into $1,420 to $1,440. Target 1 sits at $1,260, where the previous swing high meets the lower channel trendline. Target 2 extends down to $1,100.
Hard stop on any 4H close above $1,560. If buyers push through descending triangle resistance, close the short immediately.
$ZEC gained over +230% off the $466 summer low, but momentum is finally stalling at the upper boundary of the multi-month channel.
While retail chases green breakouts into $1,550, the 4H structure is putting in lower highs and pressing directly against the $1,430 support shelf. I am strictly biased short here.
The trade activates on a confirmed 4H close below $1,430.
Once $1,430 breaks, sell the retest into $1,420 to $1,440. Target 1 sits at $1,260, where the previous swing high meets the lower channel trendline. Target 2 extends down to $1,100.
Hard stop on any 4H close above $1,560. If buyers push through descending triangle resistance, close the short immediately.
While retail chases green breakouts into $1,550, the 4H structure is putting in lower highs and pressing directly against the $1,430 support shelf. I am strictly biased short here.
The trade activates on a confirmed 4H close below $1,430.
Once $1,430 breaks, sell the retest into $1,420 to $1,440. Target 1 sits at $1,260, where the previous swing high meets the lower channel trendline. Target 2 extends down to $1,100.
Hard stop on any 4H close above $1,560. If buyers push through descending triangle resistance, close the short immediately.
225
·
--
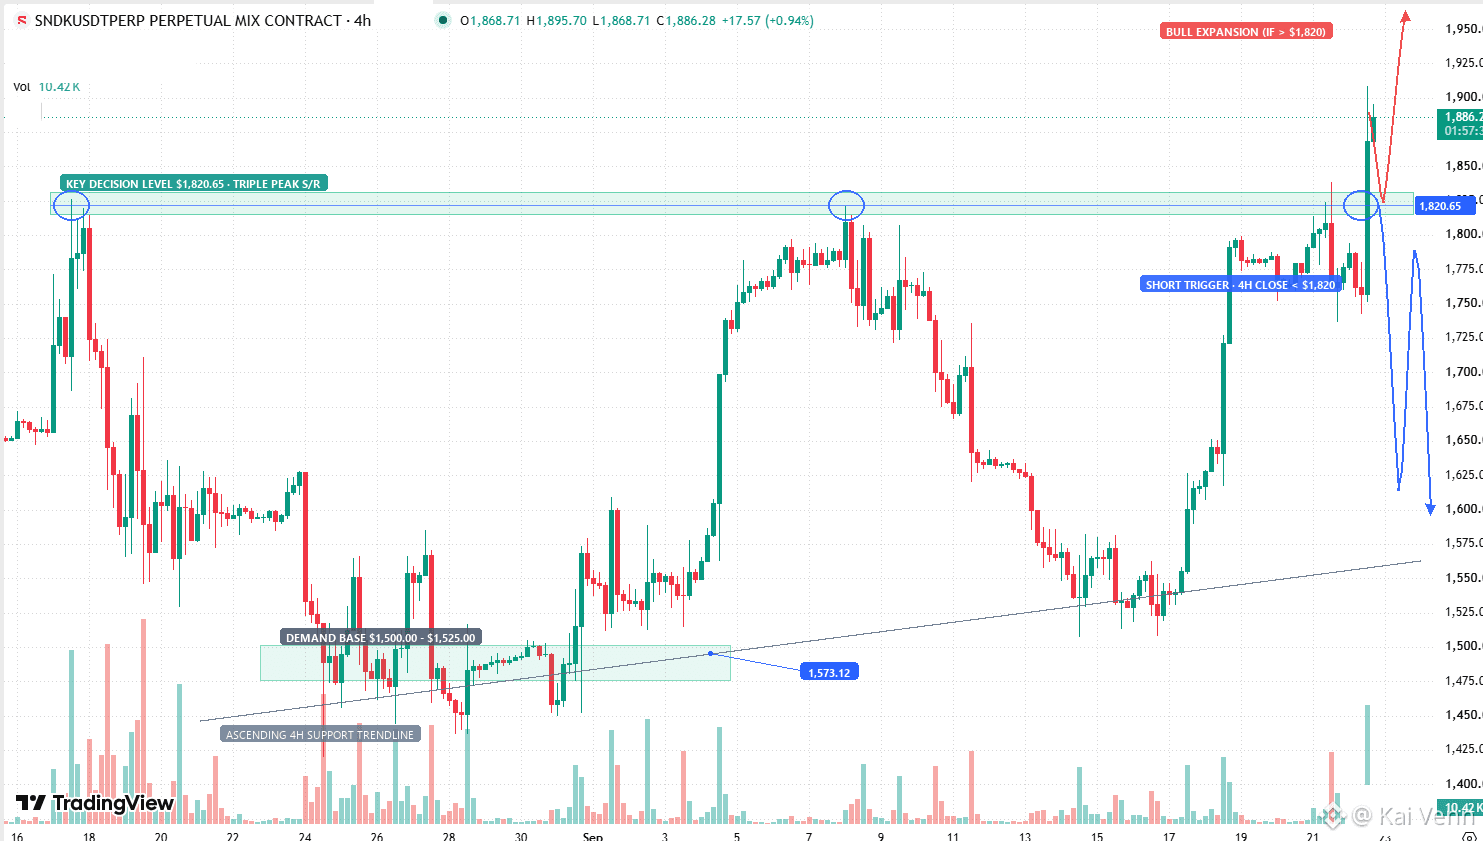
$SNDK is trading near $1,885 after breaking out above the $1,820 resistance ceiling.
Do not touch the short while price sits above $1,820. Bulls remain in full control as long as this shelf holds, with an open path toward $2,000.
The only reason to get short is if 4H structure breaks below $1,820.
If a 4H candle closes below $1,820, sell the retest into $1,810 to $1,820. First target sits at $1,650, followed by the ascending trendline around $1,575.
$SNDK is trading near $1,885 after breaking out above the $1,820 resistance ceiling.
Do not touch the short while price sits above $1,820. Bulls remain in full control as long as this shelf holds, with an open path toward $2,000.
The only reason to get short is if 4H structure breaks below $1,820.
If a 4H candle closes below $1,820, sell the retest into $1,810 to $1,820. First target sits at $1,650, followed by the ascending trendline around $1,575.
Do not touch the short while price sits above $1,820. Bulls remain in full control as long as this shelf holds, with an open path toward $2,000.
The only reason to get short is if 4H structure breaks below $1,820.
If a 4H candle closes below $1,820, sell the retest into $1,810 to $1,820. First target sits at $1,650, followed by the ascending trendline around $1,575.
1
434
·
--
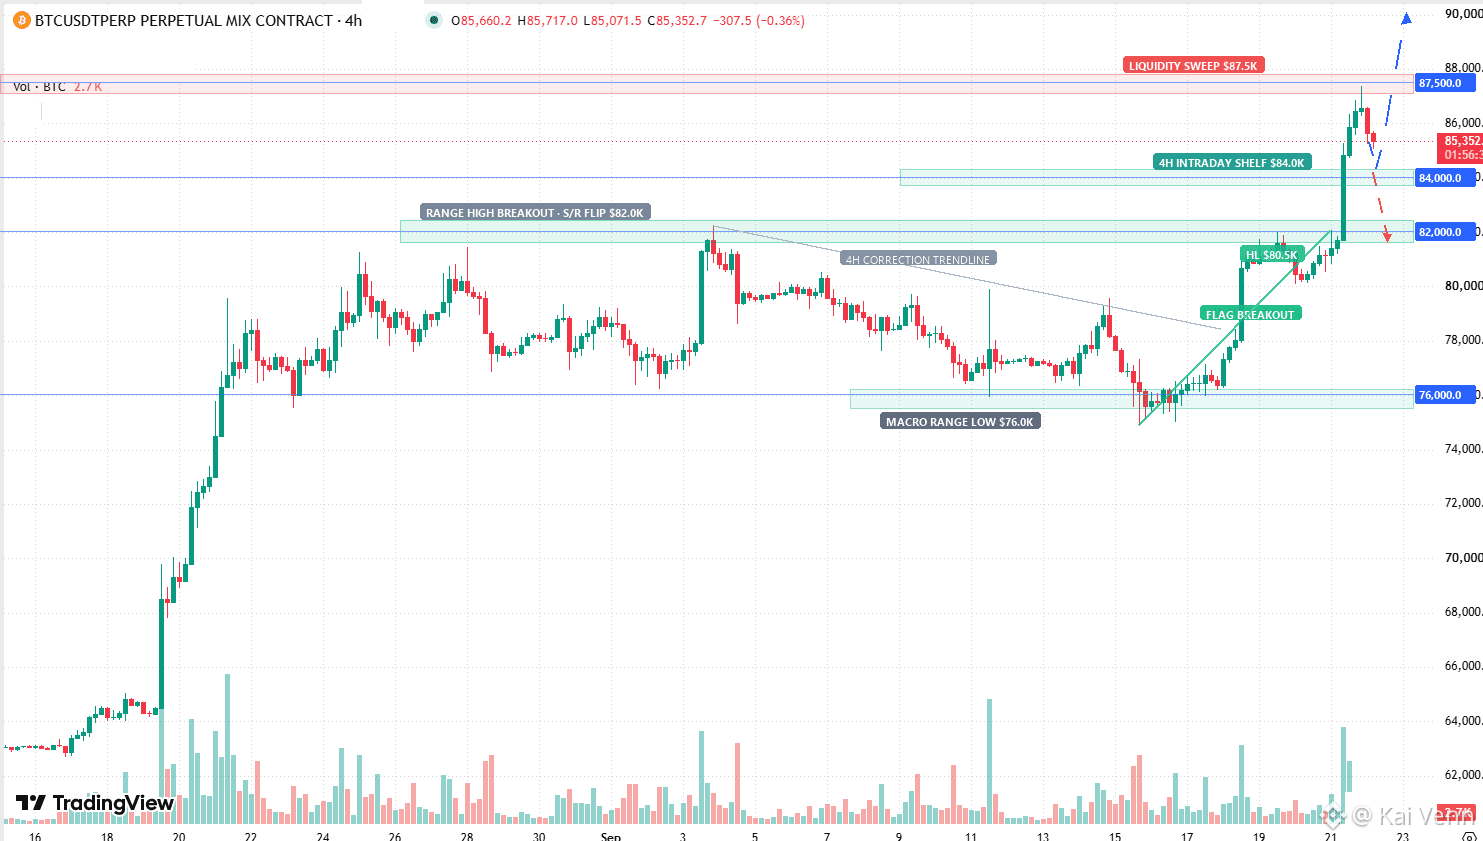
$BTC pushed into $87,500 after a 12,000-point run off the $75,500 base. The move cleared out overhead liquidity, and buyers are now taking profits.
Chasing green candles up here at $85,300 is poor risk-reward. The clean risk-defined setup is waiting for price to test the 4H shelf between $83,800 and $84,200, or a deeper wick into the prior range high at $82,000.
- Entry: Bid $83,800 to $84,200 (Add if it wicks to $82,200)
- Target 1: $87,500
- Target 2: $90,000
- Hard Stop: 4H close below $81,500
If price drops and closes below $81,500 on the 4H, the breakout structure is broken and you close the trade immediately. Do not baghold back down into the old range.
$BTC pushed into $87,500 after a 12,000-point run off the $75,500 base. The move cleared out overhead liquidity, and buyers are now taking profits.
Chasing green candles up here at $85,300 is poor risk-reward. The clean risk-defined setup is waiting for price to test the 4H shelf between $83,800 and $84,200, or a deeper wick into the prior range high at $82,000.
- Entry: Bid $83,800 to $84,200 (Add if it wicks to $82,200)
- Target 1: $87,500
- Target 2: $90,000
- Hard Stop: 4H close below $81,500
If price drops and closes below $81,500 on the 4H, the breakout structure is broken and you close the trade immediately. Do not baghold back down into the old range.
Chasing green candles up here at $85,300 is poor risk-reward. The clean risk-defined setup is waiting for price to test the 4H shelf between $83,800 and $84,200, or a deeper wick into the prior range high at $82,000.
- Entry: Bid $83,800 to $84,200 (Add if it wicks to $82,200)
- Target 1: $87,500
- Target 2: $90,000
- Hard Stop: 4H close below $81,500
If price drops and closes below $81,500 on the 4H, the breakout structure is broken and you close the trade immediately. Do not baghold back down into the old range.
54
·
--
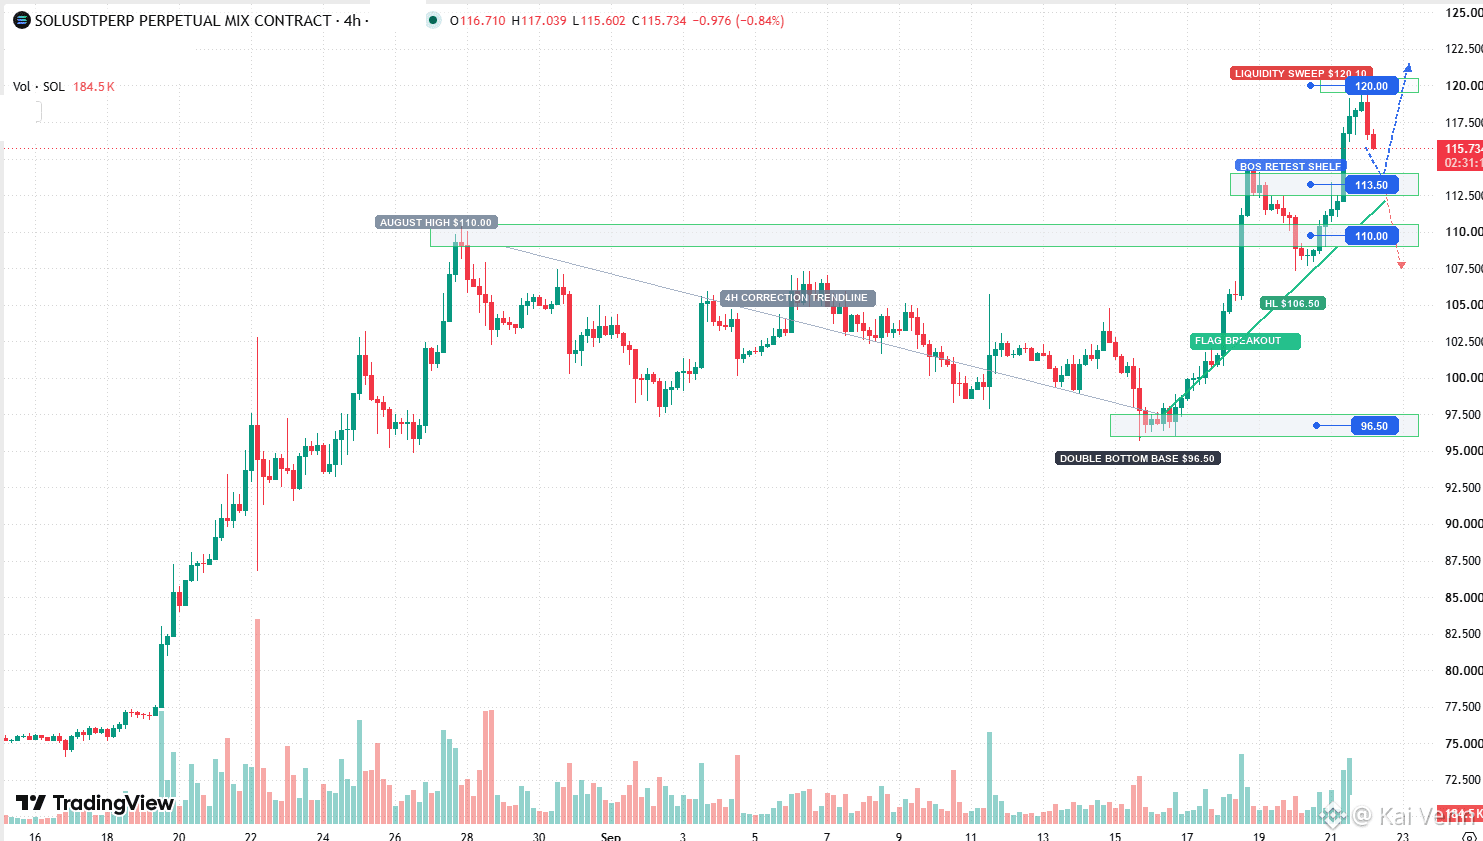
$SOL wicked into the $120.00 round number after a clean +25% push off the $96.50 base, and now we are finally getting the pullback.
Zero interest in chasing up here around $115.70. The real high-conviction trade is waiting for price to dip into the $112.50 to $114.00 shelf, where the previous breakout peak aligns with the ascending 4H support floor.
Bidding that $112.50 to $114.00 retest. Taking partials at $120.00 and trailing the rest toward $125.00.
Hard stop on a 4H close below $109.50. If the August breakout level gives way, cut the position on the spot.
$SOL wicked into the $120.00 round number after a clean +25% push off the $96.50 base, and now we are finally getting the pullback.
Zero interest in chasing up here around $115.70. The real high-conviction trade is waiting for price to dip into the $112.50 to $114.00 shelf, where the previous breakout peak aligns with the ascending 4H support floor.
Bidding that $112.50 to $114.00 retest. Taking partials at $120.00 and trailing the rest toward $125.00.
Hard stop on a 4H close below $109.50. If the August breakout level gives way, cut the position on the spot.
Zero interest in chasing up here around $115.70. The real high-conviction trade is waiting for price to dip into the $112.50 to $114.00 shelf, where the previous breakout peak aligns with the ascending 4H support floor.
Bidding that $112.50 to $114.00 retest. Taking partials at $120.00 and trailing the rest toward $125.00.
Hard stop on a 4H close below $109.50. If the August breakout level gives way, cut the position on the spot.
1
1
103
·
--
Baissier
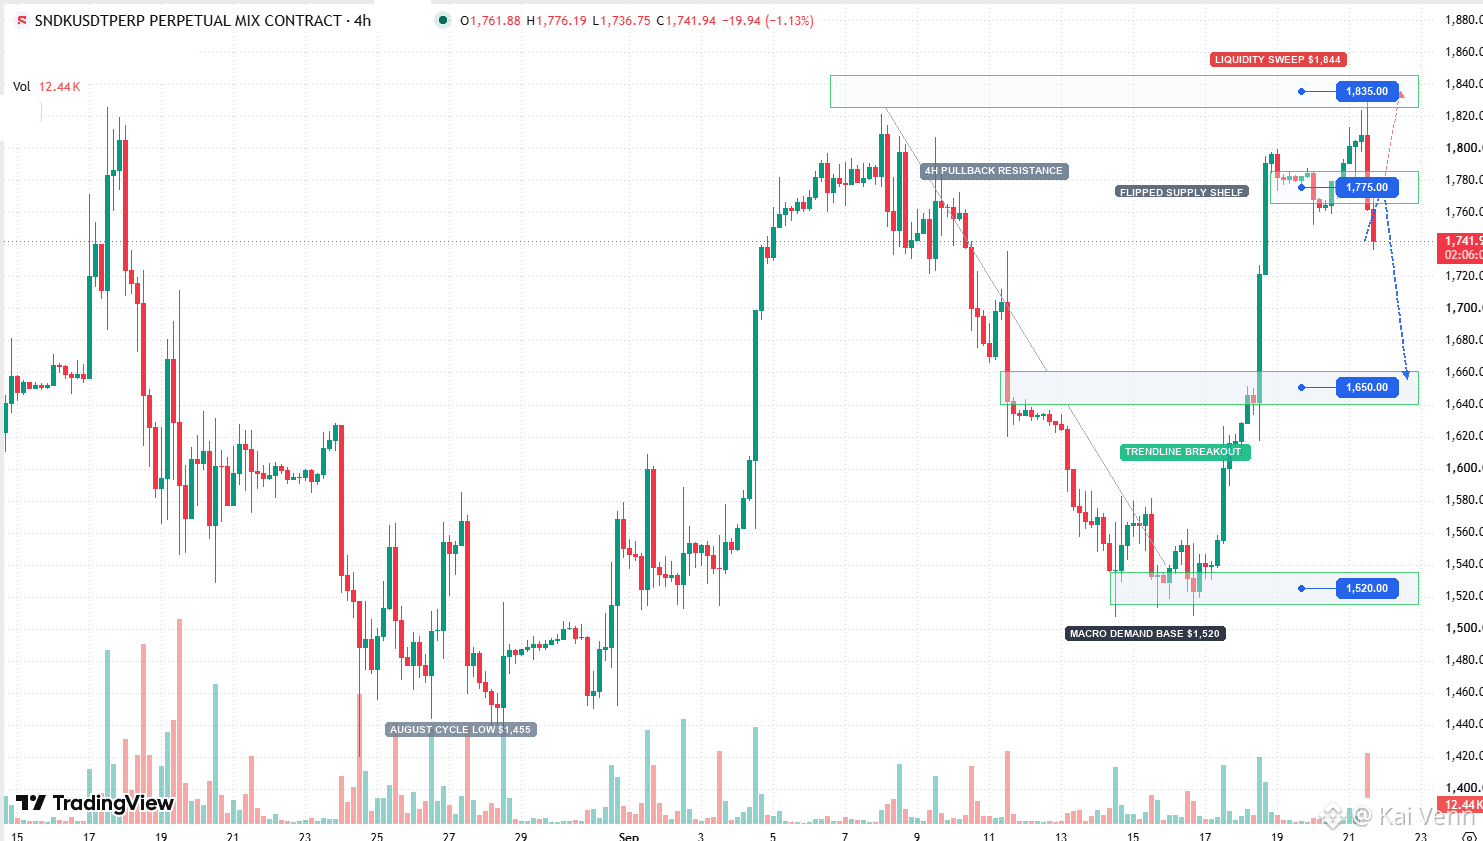
$SNDK slammed right into the $1,844 macro ceiling, left a massive rejection wick, and dumped over $100 straight through the $1,765 floor.
Zero interest in catching this falling knife right now. The play is fading any relief bounce back into the broken shelf at $1,770 - $1,785.
Looking for price to roll over toward $1,700 first, with the main target sitting down at the $1,650 breakout base.
Hard stop on a 4H close above $1,815. If bulls take back that level, cut it on the spot.
$SNDK slammed right into the $1,844 macro ceiling, left a massive rejection wick, and dumped over $100 straight through the $1,765 floor.
Zero interest in catching this falling knife right now. The play is fading any relief bounce back into the broken shelf at $1,770 - $1,785.
Looking for price to roll over toward $1,700 first, with the main target sitting down at the $1,650 breakout base.
Hard stop on a 4H close above $1,815. If bulls take back that level, cut it on the spot.
Zero interest in catching this falling knife right now. The play is fading any relief bounce back into the broken shelf at $1,770 - $1,785.
Looking for price to roll over toward $1,700 first, with the main target sitting down at the $1,650 breakout base.
Hard stop on a 4H close above $1,815. If bulls take back that level, cut it on the spot.
2
1
796
·
--
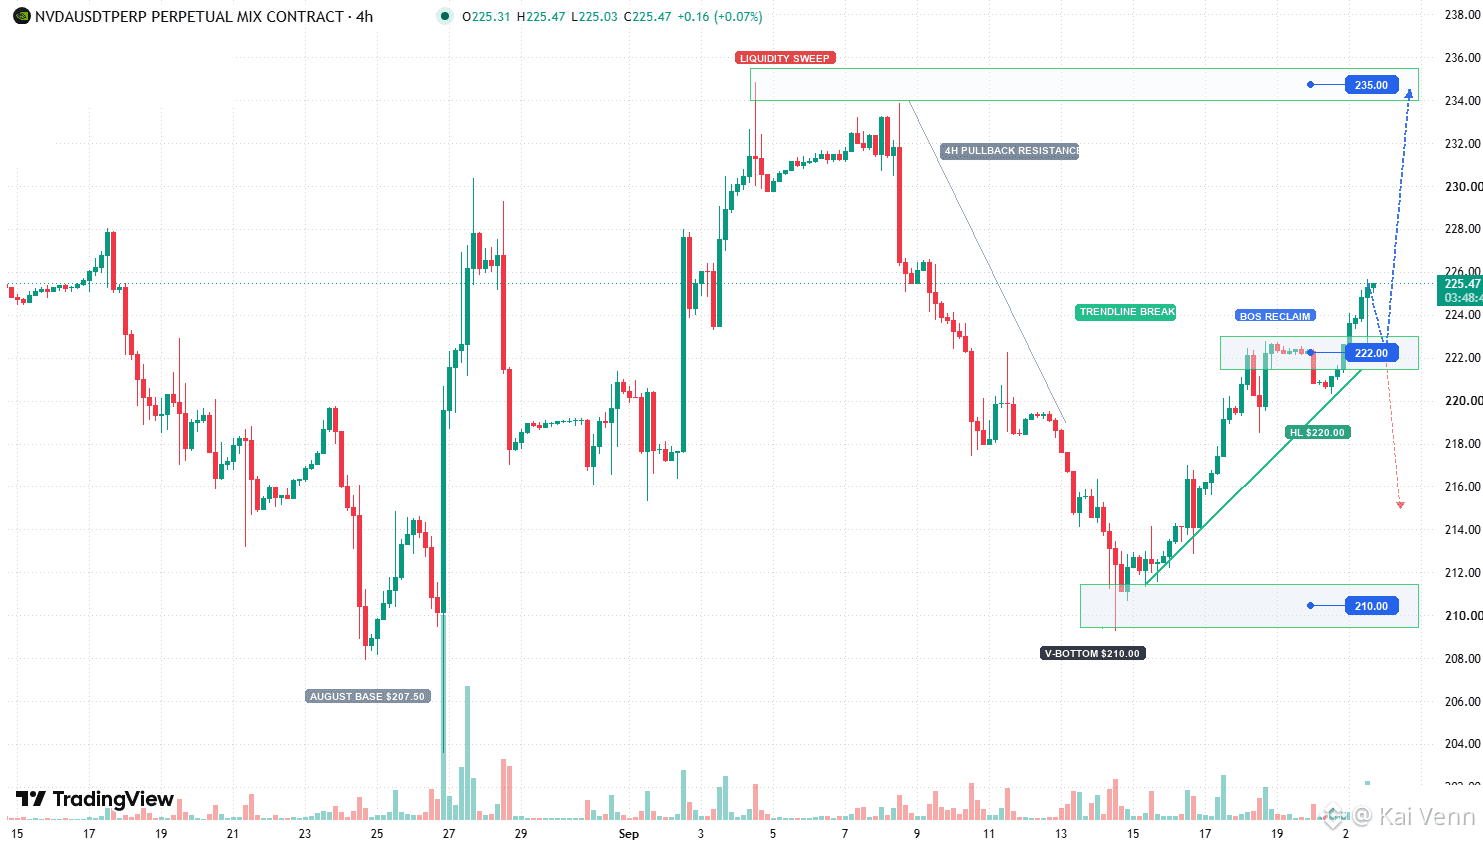
$NVDA is pressing $225.50 after breaking out of the 4H pullback resistance and holding a rising floor off $210.00. Chasing the candle directly into the $235.00 liquidity ceiling offers terrible risk-reward, so we wait for price to come back to the shelf.
- Bid Area: $220.00 to $222.50 (retest of the reclaimed structure shelf and ascending support line)
- Upside Targets: $230.00 (TP1) and $235.00 (TP2 macro ceiling)
- Invalidation Stop: 4H close below $218.00 (snaps the ascending base, exit immediately with zero hesitation)
$NVDA is pressing $225.50 after breaking out of the 4H pullback resistance and holding a rising floor off $210.00. Chasing the candle directly into the $235.00 liquidity ceiling offers terrible risk-reward, so we wait for price to come back to the shelf.
- Bid Area: $220.00 to $222.50 (retest of the reclaimed structure shelf and ascending support line)
- Upside Targets: $230.00 (TP1) and $235.00 (TP2 macro ceiling)
- Invalidation Stop: 4H close below $218.00 (snaps the ascending base, exit immediately with zero hesitation)
- Bid Area: $220.00 to $222.50 (retest of the reclaimed structure shelf and ascending support line)
- Upside Targets: $230.00 (TP1) and $235.00 (TP2 macro ceiling)
- Invalidation Stop: 4H close below $218.00 (snaps the ascending base, exit immediately with zero hesitation)
96
·
--
UNI leads our fresh desk orders alongside RAY, ZEC.
Here is the exact execution plan across these four setups:
$UNI Short
- Entry: 8.77
- Invalidation Stop: 9.50
- Take Profit: 7.20 (TP1) / 5.80 (TP2)
$RAY Short
- Entry: 1.73
- Invalidation Stop: 1.85
- Take Profit: 1.35 (TP1)
$ZEC Short
- Entry: 1490
- Invalidation Stop: 1545
- Take Profit: 1250 (TP1)
- Note: Lower conviction setup. Single speculative poke only with reduced size.
Personal trading views only, not financial advice. Stick strictly to the hard stops and manage your own risk.
UNI leads our fresh desk orders alongside RAY, ZEC.
Here is the exact execution plan across these four setups:
$UNI Short
- Entry: 8.77
- Invalidation Stop: 9.50
- Take Profit: 7.20 (TP1) / 5.80 (TP2)
$RAY Short
- Entry: 1.73
- Invalidation Stop: 1.85
- Take Profit: 1.35 (TP1)
$ZEC Short
- Entry: 1490
- Invalidation Stop: 1545
- Take Profit: 1250 (TP1)
- Note: Lower conviction setup. Single speculative poke only with reduced size.
Personal trading views only, not financial advice. Stick strictly to the hard stops and manage your own risk.
Here is the exact execution plan across these four setups:
$UNI Short
- Entry: 8.77
- Invalidation Stop: 9.50
- Take Profit: 7.20 (TP1) / 5.80 (TP2)
$RAY Short
- Entry: 1.73
- Invalidation Stop: 1.85
- Take Profit: 1.35 (TP1)
$ZEC Short
- Entry: 1490
- Invalidation Stop: 1545
- Take Profit: 1250 (TP1)
- Note: Lower conviction setup. Single speculative poke only with reduced size.
Personal trading views only, not financial advice. Stick strictly to the hard stops and manage your own risk.
263
Connectez-vous pour découvrir plus de contenu
Rejoignez la communauté mondiale des adeptes de cryptomonnaies sur Binance Square
⚡️ Suviez les dernières informations importantes sur les cryptomonnaies.
💬 Jugé digne de confiance par la plus grande plateforme d’échange de cryptomonnaies au monde.
👍 Découvrez les connaissances que partagent les créateurs vérifiés.
Adresse e-mail/Nº de téléphone