

Giannis Andreou
1.3k Publications

Giannis Andreou
Signaler
Bloquer l’utilisateur
Crypto analyst. 2000 Video content on YouTube - Giannis Andreou | Bitmern Mining Founder & CEO | Author
1.4K+ Suivis
29.3K+ Abonnés
19.9K+ J’aime
Publications
Tous
Citations
Vidéos
Direct
PINNED
🔥 Throwback to One of My Most Insightful Crypto Conversations! 🔥
Two years ago, I had the chance to sit down with CZ for a deep dive into the future of Web3, the challenges of global adoption, and the mindset behind building in a fast-moving crypto world.
From discussing Bitcoin’s resilience 🟧, to the rise of BNB 🚀, to exploring how stablecoins would reshape global finance 💴 → it was one of those conversations that sticks with you long after the cameras stop rolling.
If you missed it back then, now’s the perfect time to revisit it— the insights are still gold. ✨
$BTC $ETH $BNB
🔥 Throwback to One of My Most Insightful Crypto Conversations! 🔥
Two years ago, I had the chance to sit down with CZ for a deep dive into the future of Web3, the challenges of global adoption, and the mindset behind building in a fast-moving crypto world.
From discussing Bitcoin’s resilience 🟧, to the rise of BNB 🚀, to exploring how stablecoins would reshape global finance 💴 → it was one of those conversations that sticks with you long after the cameras stop rolling.
If you missed it back then, now’s the perfect time to revisit it— the insights are still gold. ✨
$BTC $ETH $BNB
Two years ago, I had the chance to sit down with CZ for a deep dive into the future of Web3, the challenges of global adoption, and the mindset behind building in a fast-moving crypto world.
From discussing Bitcoin’s resilience 🟧, to the rise of BNB 🚀, to exploring how stablecoins would reshape global finance 💴 → it was one of those conversations that sticks with you long after the cameras stop rolling.
If you missed it back then, now’s the perfect time to revisit it— the insights are still gold. ✨
$BTC $ETH $BNB
26
18
159
51.5k
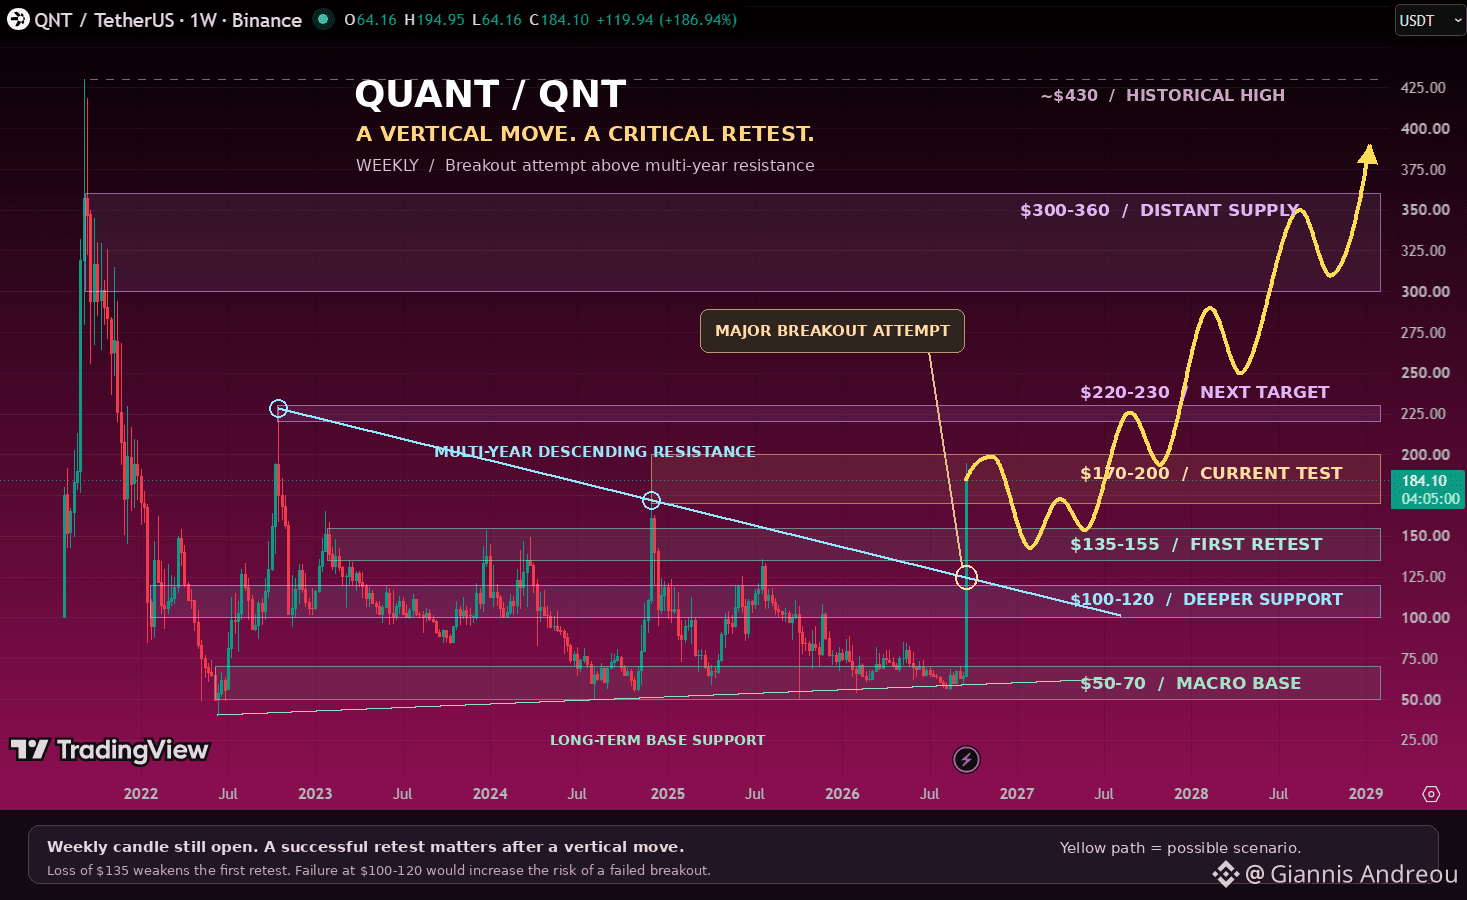
⚪ $QNT: YEARS OF RESISTANCE. ONE EXPLOSIVE MOVE.
QNT has surged through the descending trendline and into $170–200 resistance.
The weekly candle is still open. Now I’m watching whether buyers can defend the breakout.
A pullback toward $135–155 could test the recovery. Deeper support sits around $100–120, near the former trendline.
Clear $200 and hold the retest, and $220–230 becomes the next checkpoint. Beyond that, $300–360 is the larger supply zone.
Falling back below the trendline would raise the risk of a failed breakout.
The yellow path is a scenario, not a timetable.
Nothing is guaranteed. Do Your Own Research.
⚪ $QNT: YEARS OF RESISTANCE. ONE EXPLOSIVE MOVE.
QNT has surged through the descending trendline and into $170–200 resistance.
The weekly candle is still open. Now I’m watching whether buyers can defend the breakout.
A pullback toward $135–155 could test the recovery. Deeper support sits around $100–120, near the former trendline.
Clear $200 and hold the retest, and $220–230 becomes the next checkpoint. Beyond that, $300–360 is the larger supply zone.
Falling back below the trendline would raise the risk of a failed breakout.
The yellow path is a scenario, not a timetable.
Nothing is guaranteed. Do Your Own Research.
QNT has surged through the descending trendline and into $170–200 resistance.
The weekly candle is still open. Now I’m watching whether buyers can defend the breakout.
A pullback toward $135–155 could test the recovery. Deeper support sits around $100–120, near the former trendline.
Clear $200 and hold the retest, and $220–230 becomes the next checkpoint. Beyond that, $300–360 is the larger supply zone.
Falling back below the trendline would raise the risk of a failed breakout.
The yellow path is a scenario, not a timetable.
Nothing is guaranteed. Do Your Own Research.
86
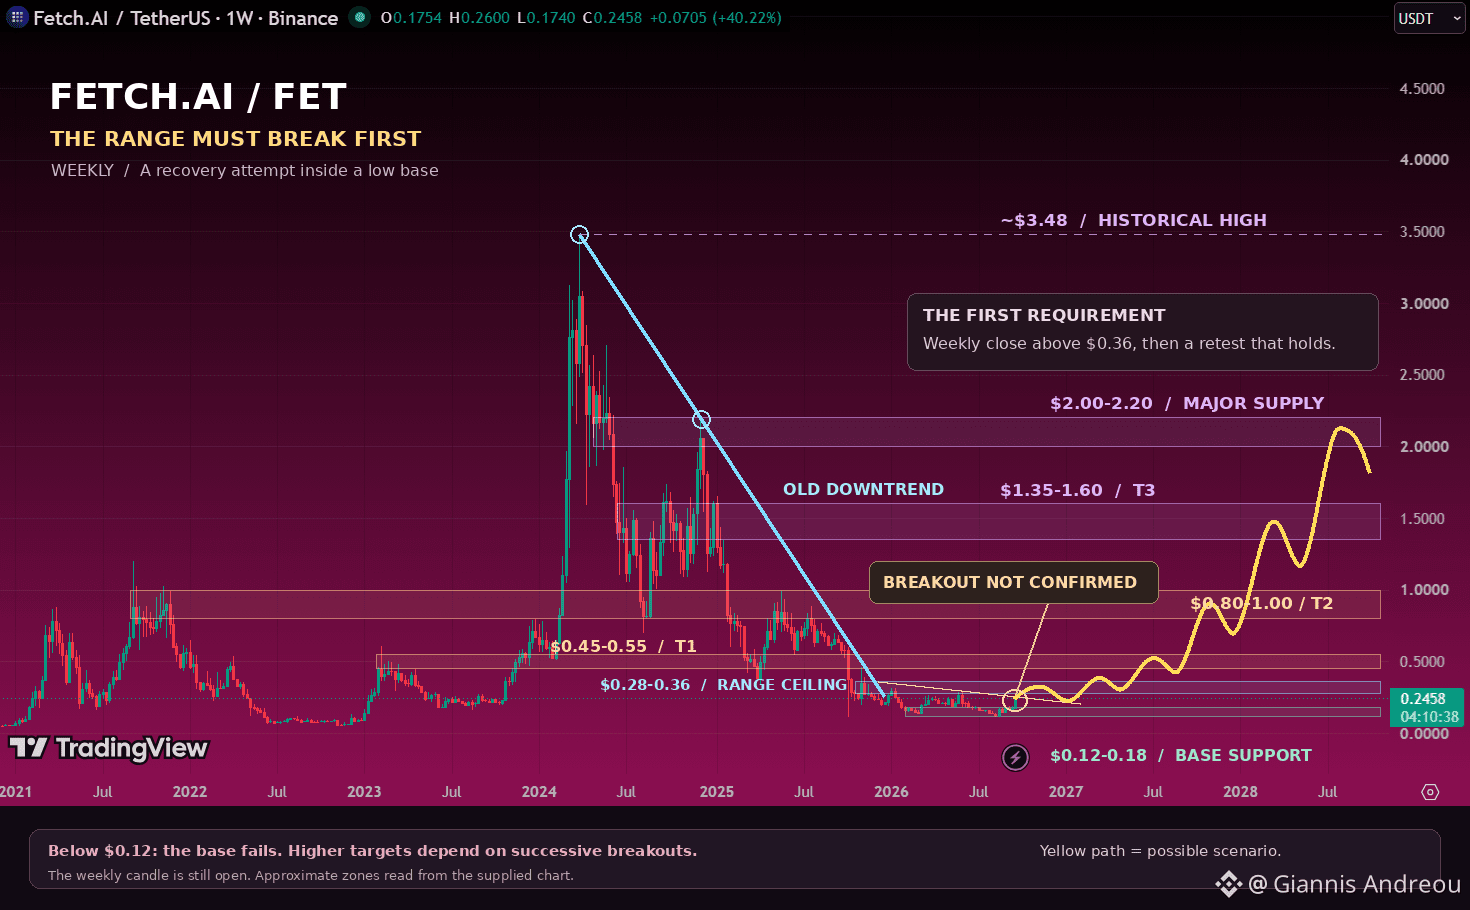
🤖 $FET: A STRONG BOUNCE. ONE RANGE STILL TO ESCAPE.
FET is recovering, but the $0.28–0.36 resistance zone remains overhead.
I’m watching for a weekly close above $0.36 and a retest that holds. That would strengthen the case for $0.45–0.55, followed by $0.80–1.00.
Beyond those barriers, $1.35–1.60 and $2.00–2.20 become longer-term checkpoints.
The $3.48 historical high is a reference, not an automatic destination.
Support sits around $0.12–0.18. A sustained loss of $0.12 would undermine the base.
The weekly candle is still open. Confirmation comes first.
Nothing is guaranteed. Do Your Own Research.
🤖 $FET: A STRONG BOUNCE. ONE RANGE STILL TO ESCAPE.
FET is recovering, but the $0.28–0.36 resistance zone remains overhead.
I’m watching for a weekly close above $0.36 and a retest that holds. That would strengthen the case for $0.45–0.55, followed by $0.80–1.00.
Beyond those barriers, $1.35–1.60 and $2.00–2.20 become longer-term checkpoints.
The $3.48 historical high is a reference, not an automatic destination.
Support sits around $0.12–0.18. A sustained loss of $0.12 would undermine the base.
The weekly candle is still open. Confirmation comes first.
Nothing is guaranteed. Do Your Own Research.
FET is recovering, but the $0.28–0.36 resistance zone remains overhead.
I’m watching for a weekly close above $0.36 and a retest that holds. That would strengthen the case for $0.45–0.55, followed by $0.80–1.00.
Beyond those barriers, $1.35–1.60 and $2.00–2.20 become longer-term checkpoints.
The $3.48 historical high is a reference, not an automatic destination.
Support sits around $0.12–0.18. A sustained loss of $0.12 would undermine the base.
The weekly candle is still open. Confirmation comes first.
Nothing is guaranteed. Do Your Own Research.
119
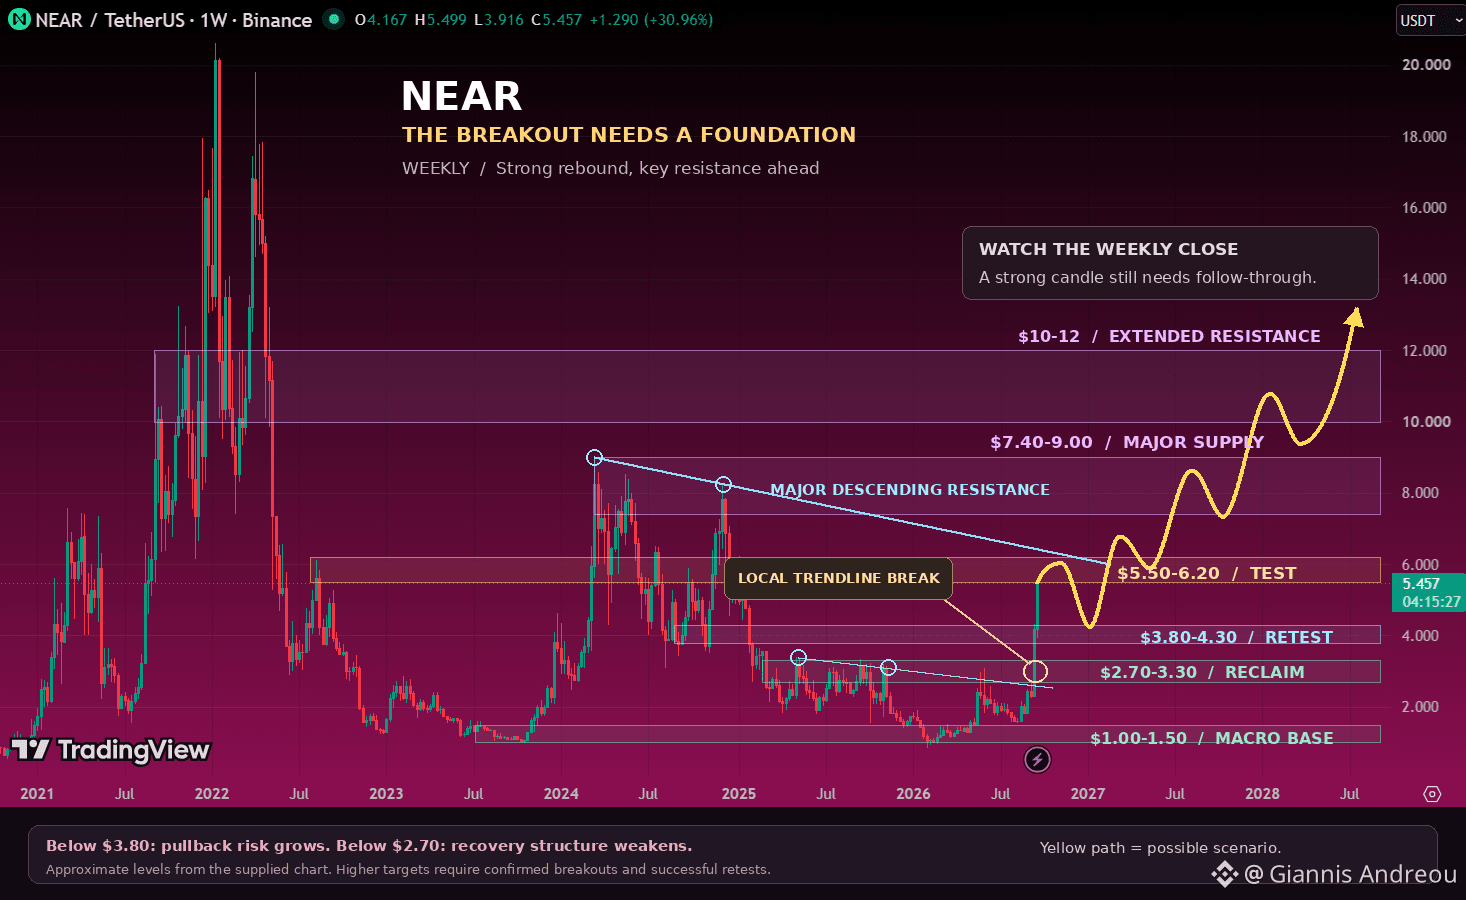
🟢 $NEAR: THE NEXT BREAK COULD CHANGE THE STRUCTURE.
NEAR has cleared local descending resistance and rallied toward $5.50–6.20.
The bigger trendline from the 2024 highs remains overhead. Breaking that resistance and holding the retest would strengthen the case for $7.40–9.00.
Clear that supply zone, and $10–12 becomes the next area to watch.
On a pullback, $3.80–4.30 is the first support zone I’m watching, followed by $2.70–3.30.
The weekly candle is still open. Strong momentum needs confirmation.
The yellow path illustrates a possible recovery, including corrections.
Nothing is guaranteed. Do Your Own Research.
🟢 $NEAR: THE NEXT BREAK COULD CHANGE THE STRUCTURE.
NEAR has cleared local descending resistance and rallied toward $5.50–6.20.
The bigger trendline from the 2024 highs remains overhead. Breaking that resistance and holding the retest would strengthen the case for $7.40–9.00.
Clear that supply zone, and $10–12 becomes the next area to watch.
On a pullback, $3.80–4.30 is the first support zone I’m watching, followed by $2.70–3.30.
The weekly candle is still open. Strong momentum needs confirmation.
The yellow path illustrates a possible recovery, including corrections.
Nothing is guaranteed. Do Your Own Research.
NEAR has cleared local descending resistance and rallied toward $5.50–6.20.
The bigger trendline from the 2024 highs remains overhead. Breaking that resistance and holding the retest would strengthen the case for $7.40–9.00.
Clear that supply zone, and $10–12 becomes the next area to watch.
On a pullback, $3.80–4.30 is the first support zone I’m watching, followed by $2.70–3.30.
The weekly candle is still open. Strong momentum needs confirmation.
The yellow path illustrates a possible recovery, including corrections.
Nothing is guaranteed. Do Your Own Research.
145
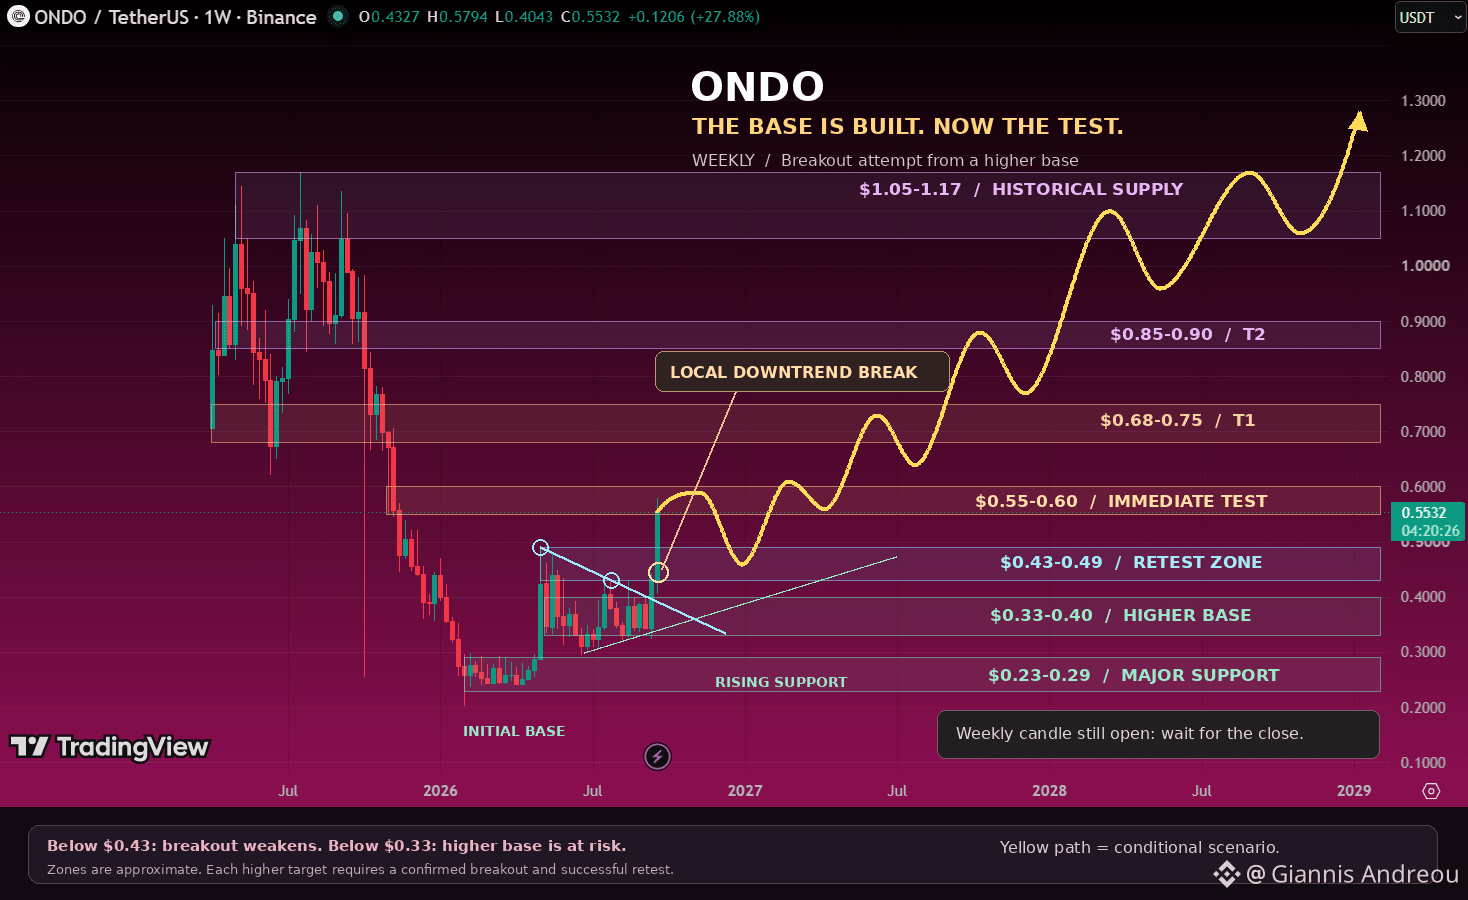
⚪ $ONDO: THE BASE IS BUILT. NOW COMES THE TEST.
ONDO has pushed above local descending resistance and into the $0.55–0.60 zone.
The weekly candle is still open. A close above $0.60, followed by a successful retest, would strengthen the case for $0.68–0.75.
Clear that, and $0.85–0.90 becomes the next checkpoint, followed by historical supply around $1.05–1.17.
On a pullback, I’m watching $0.43–0.49 for support. Lose $0.43, and a deeper test of $0.33–0.40 becomes possible.
The yellow path is a conditional scenario, with corrections along the way.
Nothing is guaranteed. Do Your Own Research.
⚪ $ONDO: THE BASE IS BUILT. NOW COMES THE TEST.
ONDO has pushed above local descending resistance and into the $0.55–0.60 zone.
The weekly candle is still open. A close above $0.60, followed by a successful retest, would strengthen the case for $0.68–0.75.
Clear that, and $0.85–0.90 becomes the next checkpoint, followed by historical supply around $1.05–1.17.
On a pullback, I’m watching $0.43–0.49 for support. Lose $0.43, and a deeper test of $0.33–0.40 becomes possible.
The yellow path is a conditional scenario, with corrections along the way.
Nothing is guaranteed. Do Your Own Research.
ONDO has pushed above local descending resistance and into the $0.55–0.60 zone.
The weekly candle is still open. A close above $0.60, followed by a successful retest, would strengthen the case for $0.68–0.75.
Clear that, and $0.85–0.90 becomes the next checkpoint, followed by historical supply around $1.05–1.17.
On a pullback, I’m watching $0.43–0.49 for support. Lose $0.43, and a deeper test of $0.33–0.40 becomes possible.
The yellow path is a conditional scenario, with corrections along the way.
Nothing is guaranteed. Do Your Own Research.
102
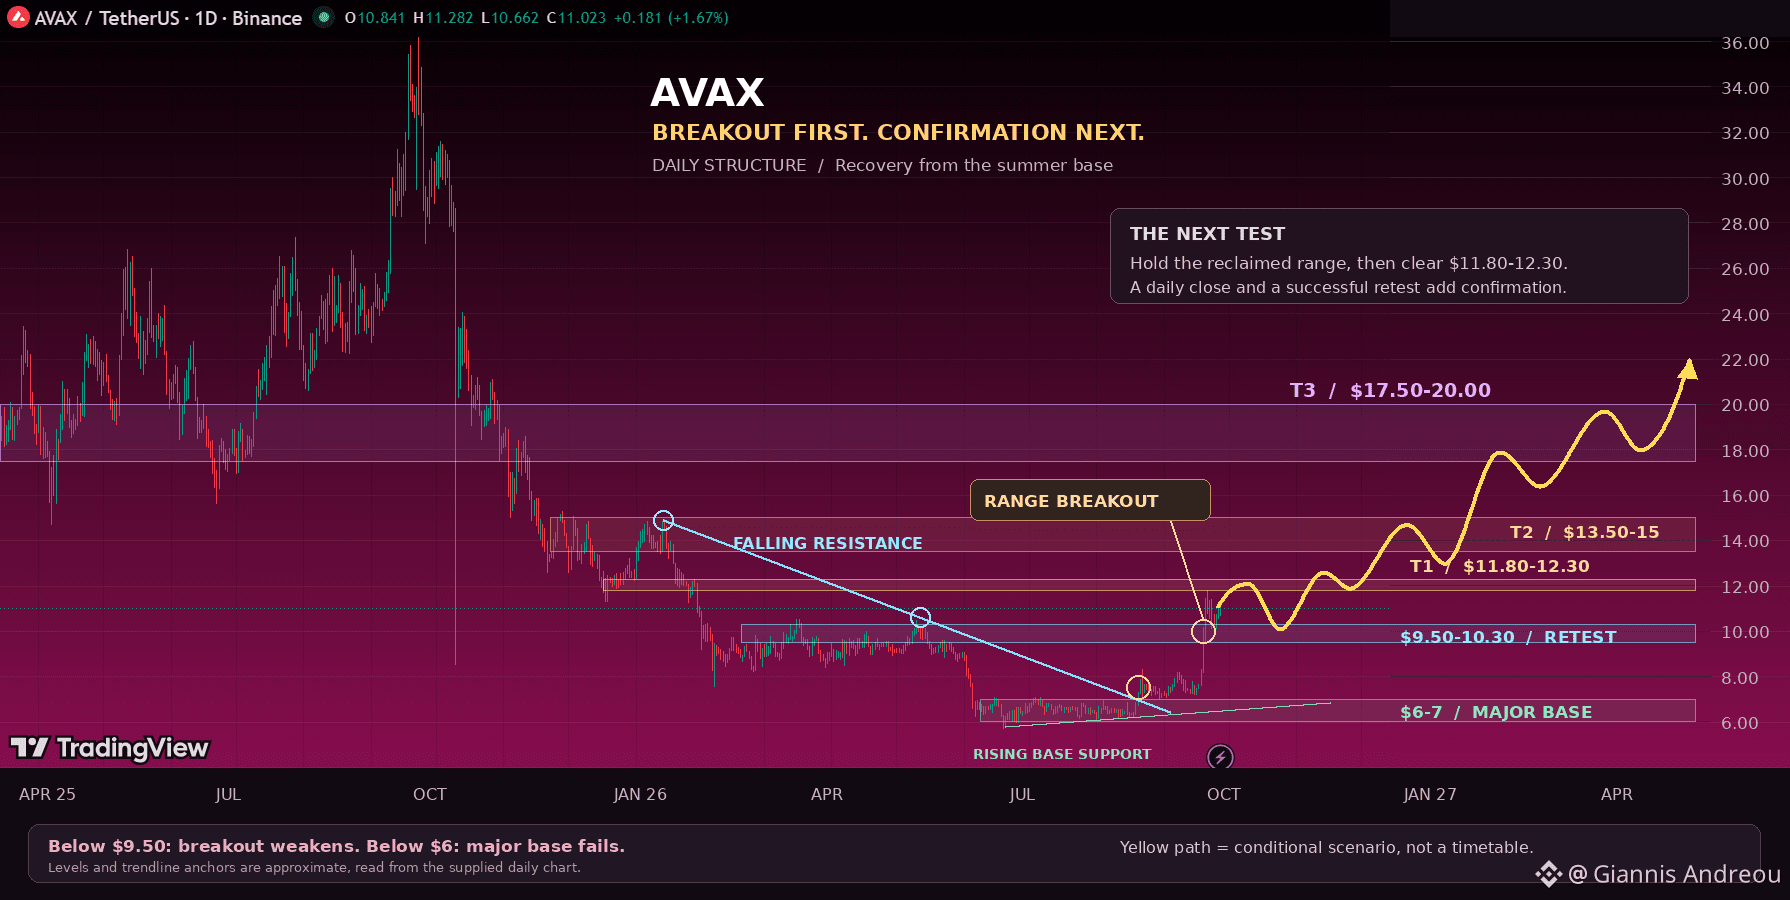
🔺 $AVAX: THE BREAKOUT IS HERE. CAN BUYERS DEFEND IT?
AVAX has broken above the falling trendline and pushed through the $9.50–10.30 resistance zone.
Now I’m watching whether that area becomes support.
Hold it, and $11.80–12.30 is the next test. A confirmed daily breakout and successful retest would strengthen the case for $13.50–15, followed by $17.50–20.
Slip back below $9.50, and the breakout weakens. The deeper structural support remains around $6–7.
The yellow path shows a possible progression, with corrections along the way.
Nothing is guaranteed. Do Your Own Research.
🔺 $AVAX: THE BREAKOUT IS HERE. CAN BUYERS DEFEND IT?
AVAX has broken above the falling trendline and pushed through the $9.50–10.30 resistance zone.
Now I’m watching whether that area becomes support.
Hold it, and $11.80–12.30 is the next test. A confirmed daily breakout and successful retest would strengthen the case for $13.50–15, followed by $17.50–20.
Slip back below $9.50, and the breakout weakens. The deeper structural support remains around $6–7.
The yellow path shows a possible progression, with corrections along the way.
Nothing is guaranteed. Do Your Own Research.
AVAX has broken above the falling trendline and pushed through the $9.50–10.30 resistance zone.
Now I’m watching whether that area becomes support.
Hold it, and $11.80–12.30 is the next test. A confirmed daily breakout and successful retest would strengthen the case for $13.50–15, followed by $17.50–20.
Slip back below $9.50, and the breakout weakens. The deeper structural support remains around $6–7.
The yellow path shows a possible progression, with corrections along the way.
Nothing is guaranteed. Do Your Own Research.
127
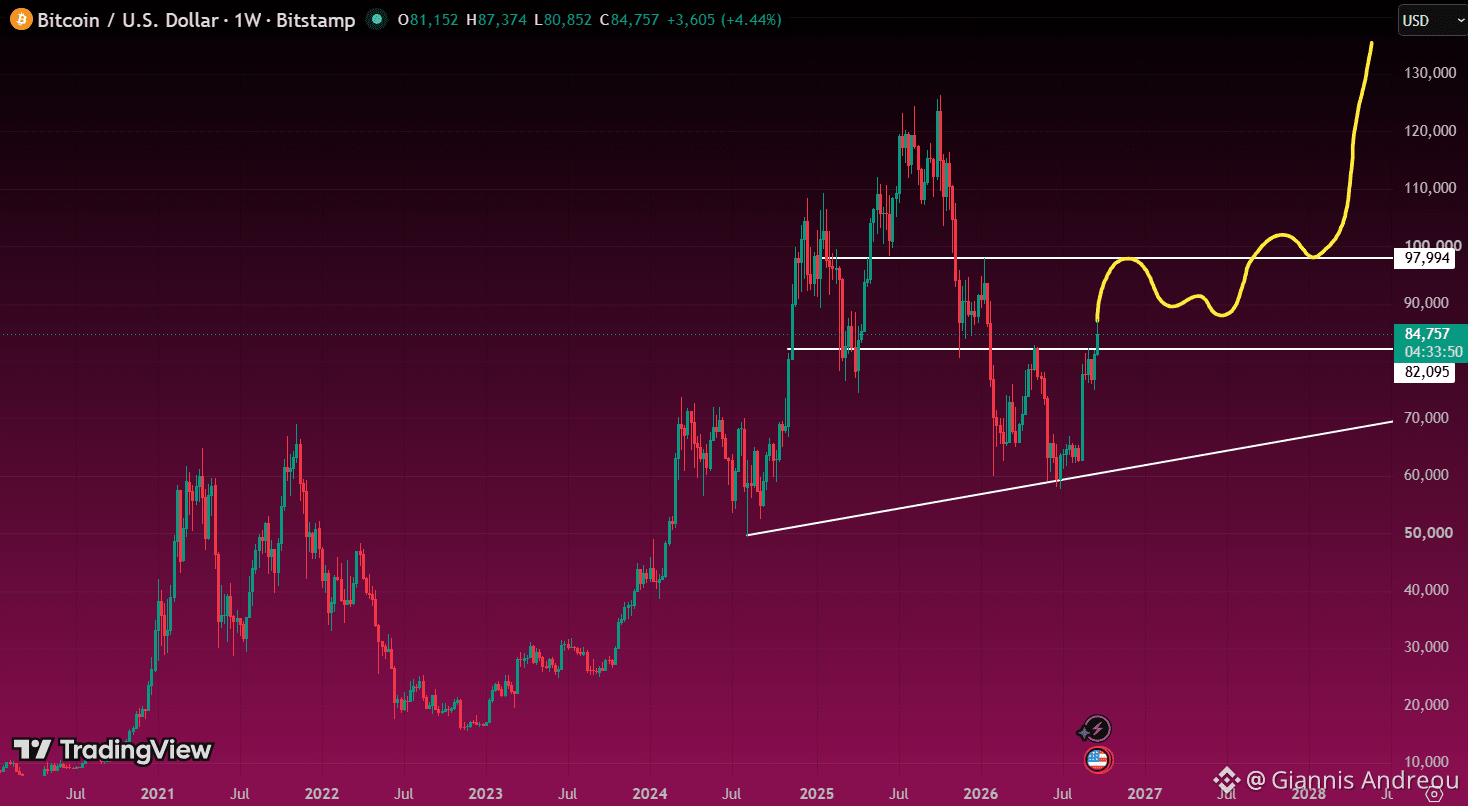
🟠 $BTC IS BUILDING ABOVE A CRITICAL SUPPORT
Bitcoin is holding the $82K area, and that keeps the bigger structure alive.
The next major level I’m watching is around $98K.
If $BTC can reclaim that zone and turn it into support, the chart opens up toward six figures again and potentially much higher.
Then price discovery becomes the next conversation.
🟠 $BTC IS BUILDING ABOVE A CRITICAL SUPPORT
Bitcoin is holding the $82K area, and that keeps the bigger structure alive.
The next major level I’m watching is around $98K.
If $BTC can reclaim that zone and turn it into support, the chart opens up toward six figures again and potentially much higher.
Then price discovery becomes the next conversation.
Bitcoin is holding the $82K area, and that keeps the bigger structure alive.
The next major level I’m watching is around $98K.
If $BTC can reclaim that zone and turn it into support, the chart opens up toward six figures again and potentially much higher.
Then price discovery becomes the next conversation.
175
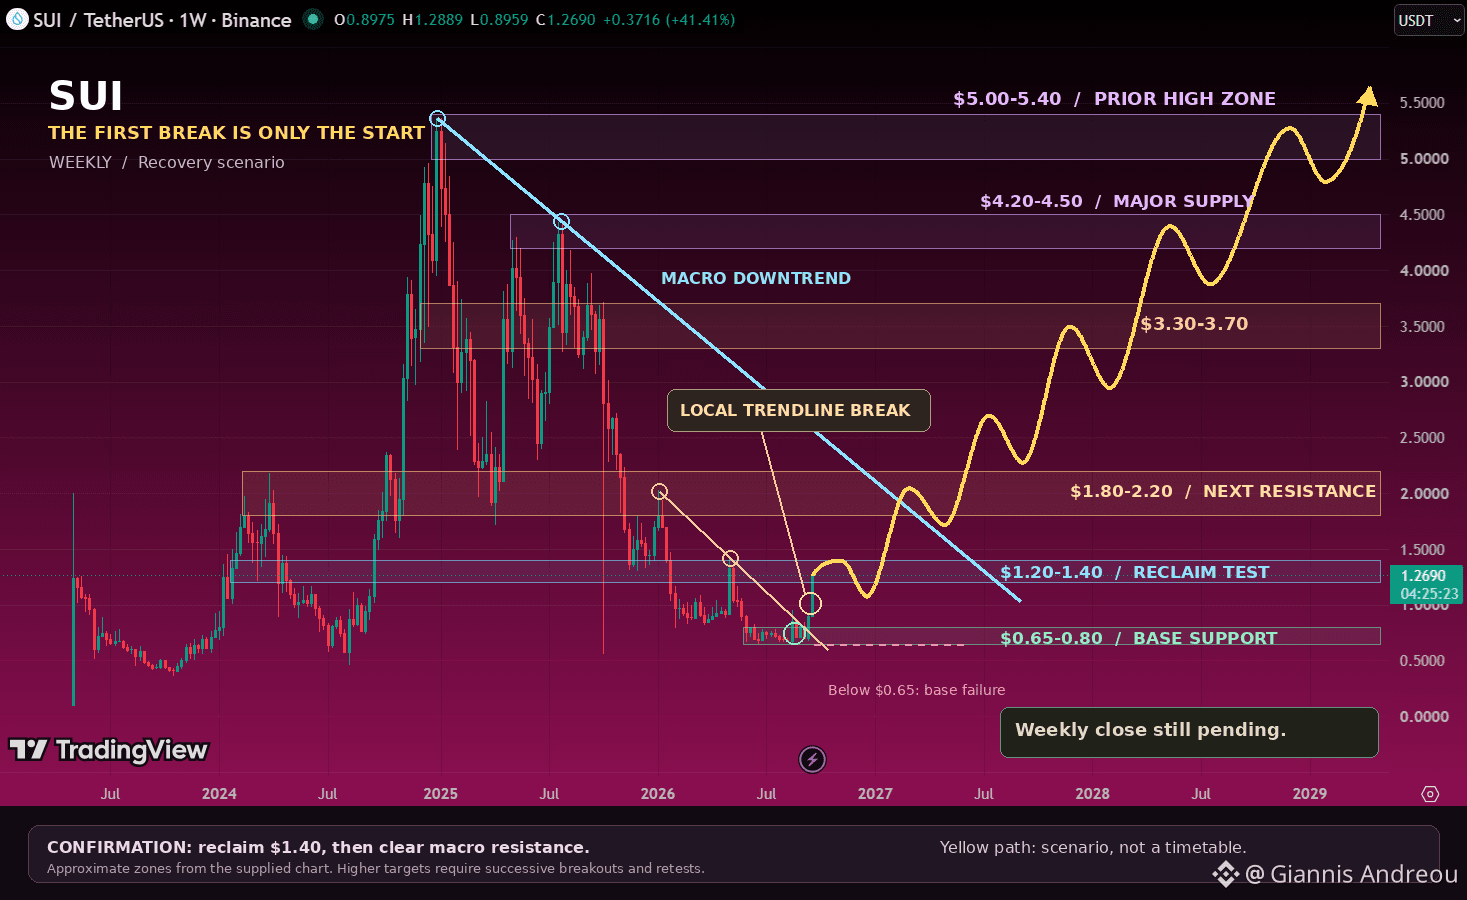
💧 $SUI: ONE TRENDLINE DOWN. THE BIGGER TEST REMAINS.
SUI has pushed above local descending resistance and into the $1.20–1.40 reclaim zone. The weekly candle is still open.
Close above $1.40 and defend the retest, and $1.80–2.20 becomes the next checkpoint.
The larger downtrend from the 2025 highs remains overhead. Clearing it would strengthen the recovery case toward $3.30–3.70, then $4.20–4.50.
The $5.00–5.40 highs come into focus only after those barriers fall.
Support remains around $0.65–0.80. A sustained loss of $0.65 would undermine the base.
Nothing is guaranteed. Do Your Own Research.
💧 $SUI: ONE TRENDLINE DOWN. THE BIGGER TEST REMAINS.
SUI has pushed above local descending resistance and into the $1.20–1.40 reclaim zone. The weekly candle is still open.
Close above $1.40 and defend the retest, and $1.80–2.20 becomes the next checkpoint.
The larger downtrend from the 2025 highs remains overhead. Clearing it would strengthen the recovery case toward $3.30–3.70, then $4.20–4.50.
The $5.00–5.40 highs come into focus only after those barriers fall.
Support remains around $0.65–0.80. A sustained loss of $0.65 would undermine the base.
Nothing is guaranteed. Do Your Own Research.
SUI has pushed above local descending resistance and into the $1.20–1.40 reclaim zone. The weekly candle is still open.
Close above $1.40 and defend the retest, and $1.80–2.20 becomes the next checkpoint.
The larger downtrend from the 2025 highs remains overhead. Clearing it would strengthen the recovery case toward $3.30–3.70, then $4.20–4.50.
The $5.00–5.40 highs come into focus only after those barriers fall.
Support remains around $0.65–0.80. A sustained loss of $0.65 would undermine the base.
Nothing is guaranteed. Do Your Own Research.
2
94
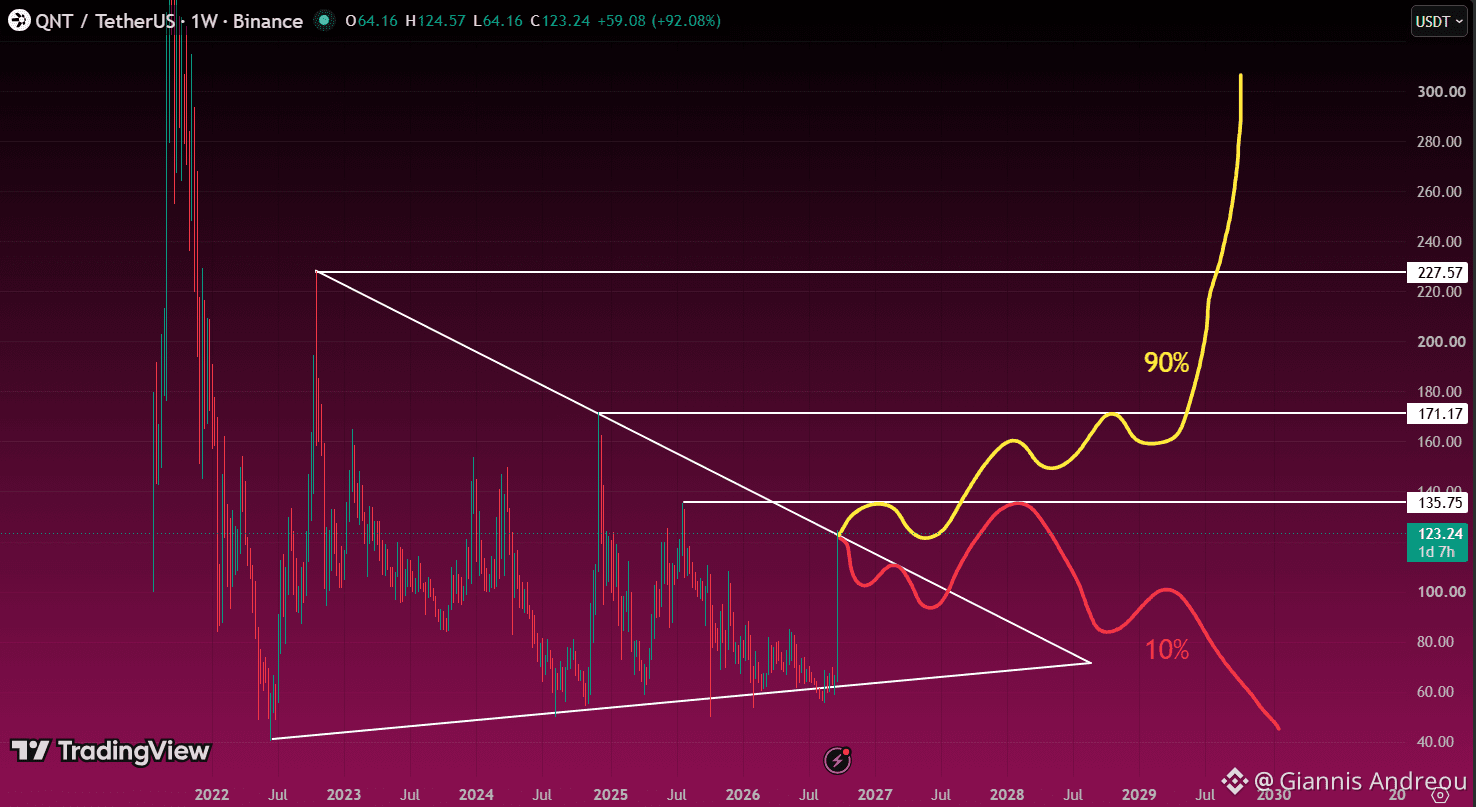
⚪ $QNT IS SITTING ON A MASSIVE TRENDLINE
This is one of the most important spots on the chart right now.
$QNT is pressing right into a major long-term trendline, and I think this level could decide the next big move.
If QNT breaks above it cleanly and holds, the next levels I’m watching are:
$136 → $171 → $227
A breakout here could completely change the structure and send $QNT much higher.
Sometimes one trendline changes everything.
⚪ $QNT IS SITTING ON A MASSIVE TRENDLINE
This is one of the most important spots on the chart right now.
$QNT is pressing right into a major long-term trendline, and I think this level could decide the next big move.
If QNT breaks above it cleanly and holds, the next levels I’m watching are:
$136 → $171 → $227
A breakout here could completely change the structure and send $QNT much higher.
Sometimes one trendline changes everything.
This is one of the most important spots on the chart right now.
$QNT is pressing right into a major long-term trendline, and I think this level could decide the next big move.
If QNT breaks above it cleanly and holds, the next levels I’m watching are:
$136 → $171 → $227
A breakout here could completely change the structure and send $QNT much higher.
Sometimes one trendline changes everything.
34
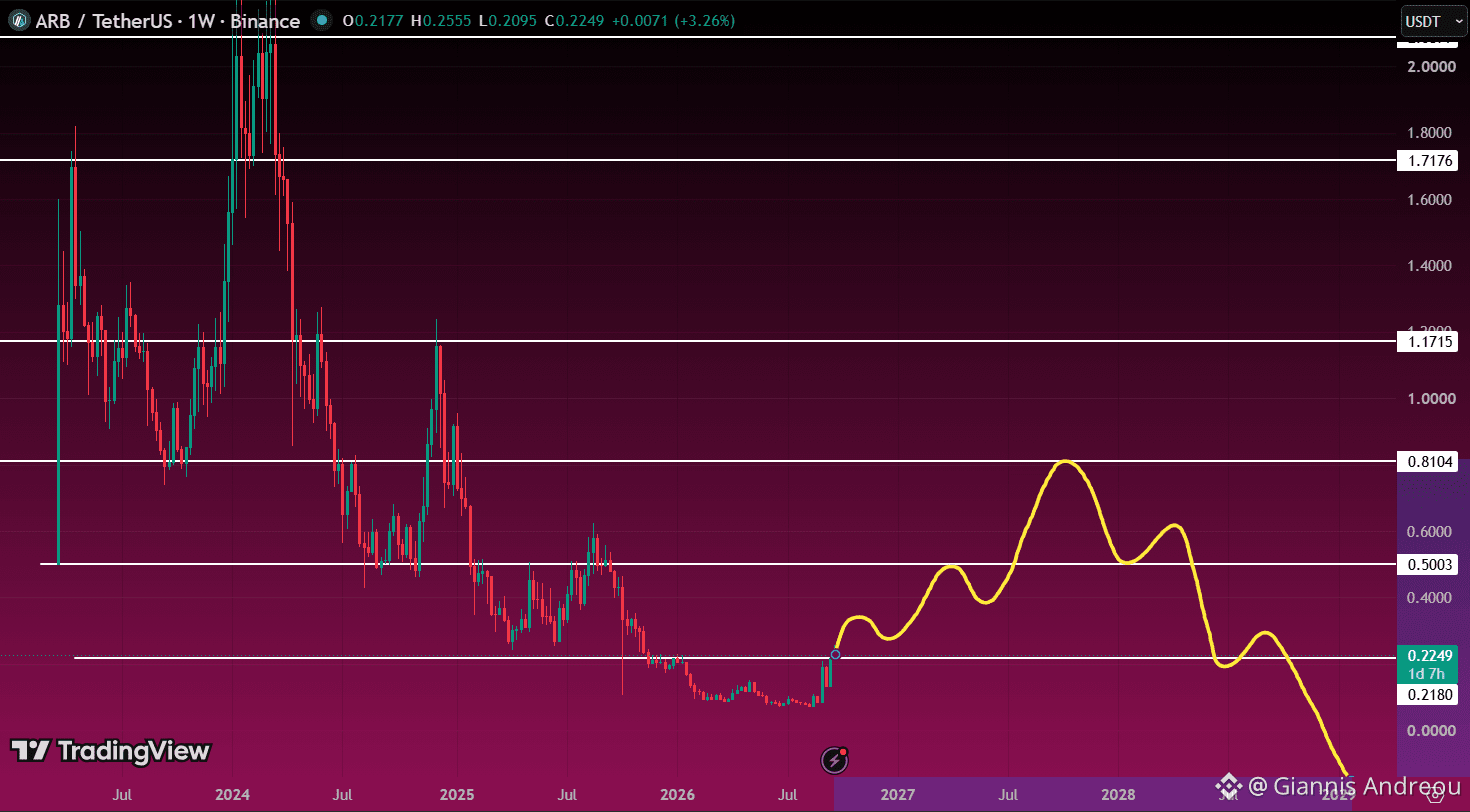
🔵 $ARB: I’M NOT LOVING THIS LONG-TERM STRUCTURE
Arbitrum is bouncing, but zooming out, the chart still looks heavy.
The first major level I need to see reclaimed is around $0.50.
Above that, $0.81 becomes the next real test.
But until $ARB starts breaking these levels and building higher highs, I’m staying cautious.
Right now, the bigger structure still looks weak compared with many other altcoins.
$ARB needs to prove it can change the trend first.
🔵 $ARB: I’M NOT LOVING THIS LONG-TERM STRUCTURE
Arbitrum is bouncing, but zooming out, the chart still looks heavy.
The first major level I need to see reclaimed is around $0.50.
Above that, $0.81 becomes the next real test.
But until $ARB starts breaking these levels and building higher highs, I’m staying cautious.
Right now, the bigger structure still looks weak compared with many other altcoins.
$ARB needs to prove it can change the trend first.
Arbitrum is bouncing, but zooming out, the chart still looks heavy.
The first major level I need to see reclaimed is around $0.50.
Above that, $0.81 becomes the next real test.
But until $ARB starts breaking these levels and building higher highs, I’m staying cautious.
Right now, the bigger structure still looks weak compared with many other altcoins.
$ARB needs to prove it can change the trend first.
1
45
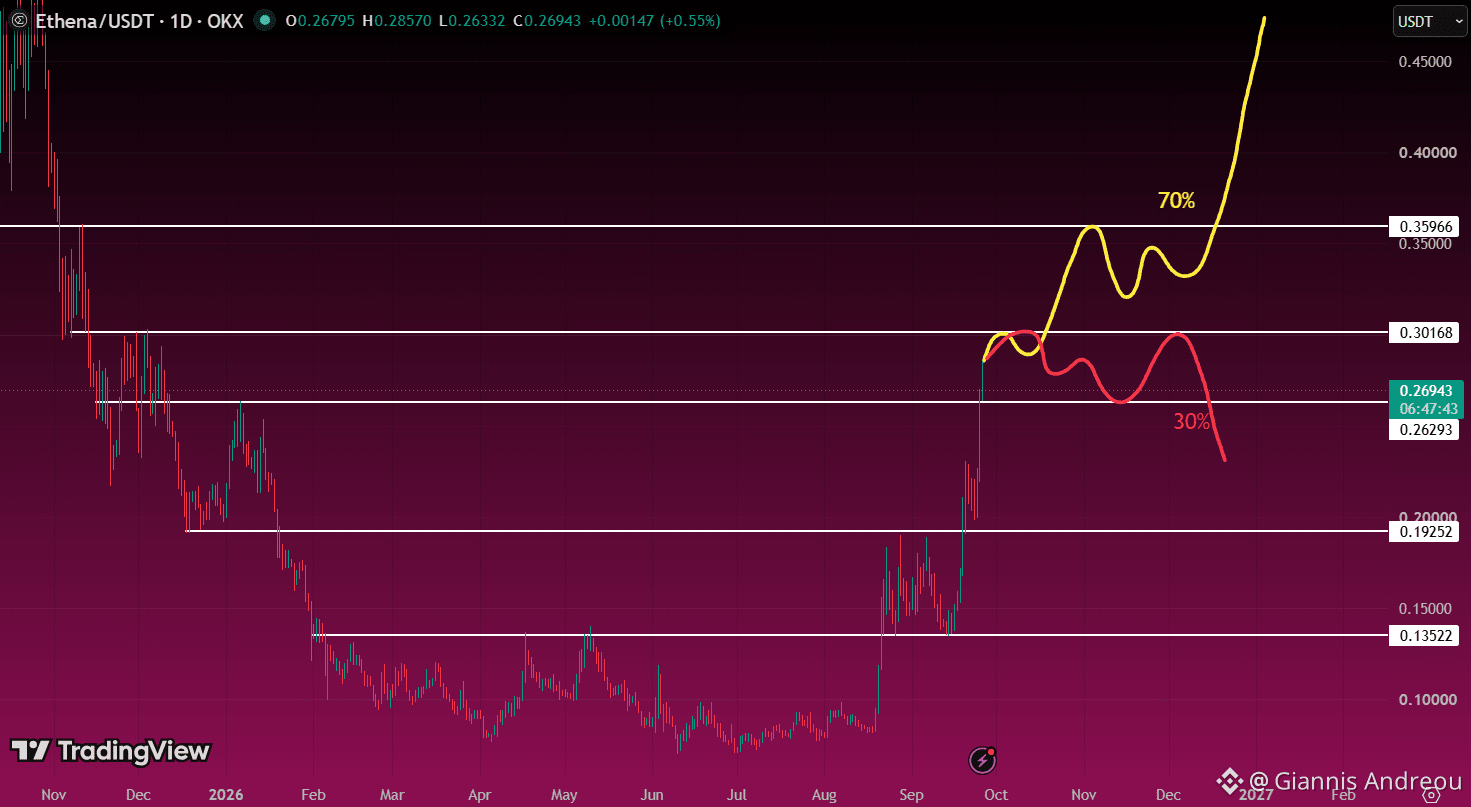
🟣 $ENA IS SITTING AT A MAKE-OR-BREAK LEVEL
Ethena is trading right around the $0.263 support zone, while $0.30 remains the key resistance above.
My base case is still bullish.
If $ENA holds this support and breaks above $0.30, the next major level I’m watching is around $0.36, with room for a much bigger continuation after that.
But if $0.263 fails, the structure weakens fast and a deeper pullback toward $0.19 becomes possible.
For now:
70% bullish continuation.
30% deeper correction.
$0.30 is the level that unlocks the next move.
🟣 $ENA IS SITTING AT A MAKE-OR-BREAK LEVEL
Ethena is trading right around the $0.263 support zone, while $0.30 remains the key resistance above.
My base case is still bullish.
If $ENA holds this support and breaks above $0.30, the next major level I’m watching is around $0.36, with room for a much bigger continuation after that.
But if $0.263 fails, the structure weakens fast and a deeper pullback toward $0.19 becomes possible.
For now:
70% bullish continuation.
30% deeper correction.
$0.30 is the level that unlocks the next move.
Ethena is trading right around the $0.263 support zone, while $0.30 remains the key resistance above.
My base case is still bullish.
If $ENA holds this support and breaks above $0.30, the next major level I’m watching is around $0.36, with room for a much bigger continuation after that.
But if $0.263 fails, the structure weakens fast and a deeper pullback toward $0.19 becomes possible.
For now:
70% bullish continuation.
30% deeper correction.
$0.30 is the level that unlocks the next move.
2
169
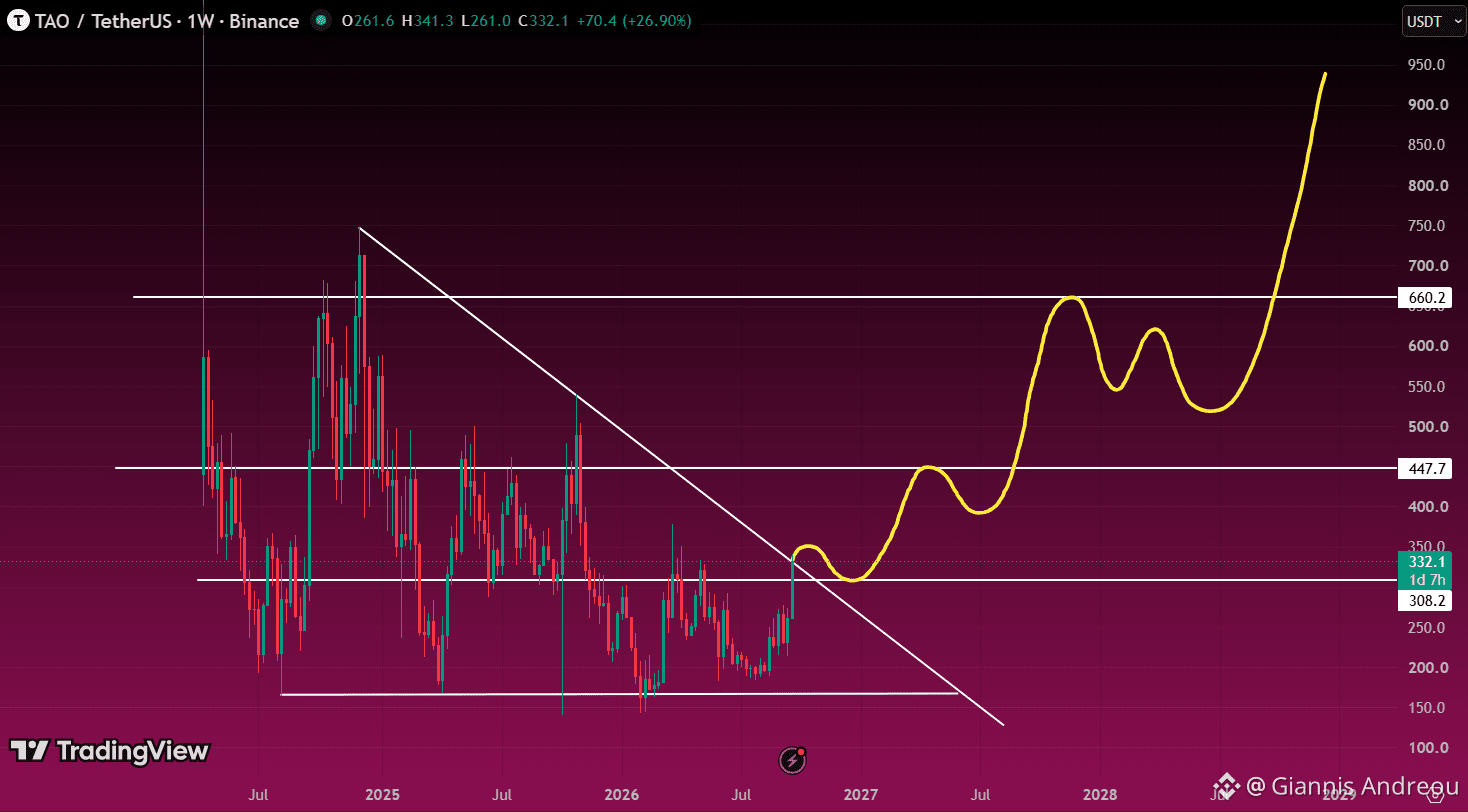
🤖 $TAO IS FIGHTING A MAJOR TRENDLINE
$TAO is now pressing into the long-term descending trendline.
This is the level that matters.
If TAO breaks above it and holds, I think the next major levels on the chart are:
$448 → $660
A clean breakout here could completely change the structure and open the door for a much bigger move.
For now, all eyes are on the trendline.
Break it, hold it, and $TAO could really start moving.
🤖 $TAO IS FIGHTING A MAJOR TRENDLINE
$TAO is now pressing into the long-term descending trendline.
This is the level that matters.
If TAO breaks above it and holds, I think the next major levels on the chart are:
$448 → $660
A clean breakout here could completely change the structure and open the door for a much bigger move.
For now, all eyes are on the trendline.
Break it, hold it, and $TAO could really start moving.
$TAO is now pressing into the long-term descending trendline.
This is the level that matters.
If TAO breaks above it and holds, I think the next major levels on the chart are:
$448 → $660
A clean breakout here could completely change the structure and open the door for a much bigger move.
For now, all eyes are on the trendline.
Break it, hold it, and $TAO could really start moving.
47
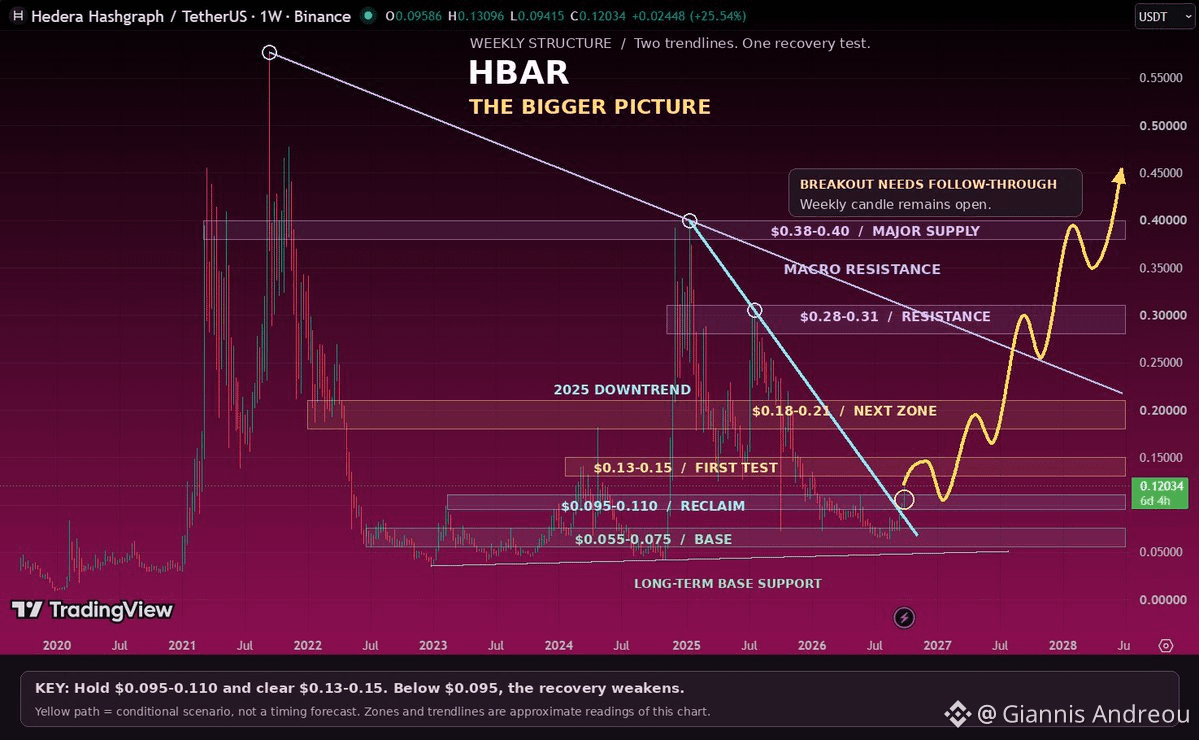
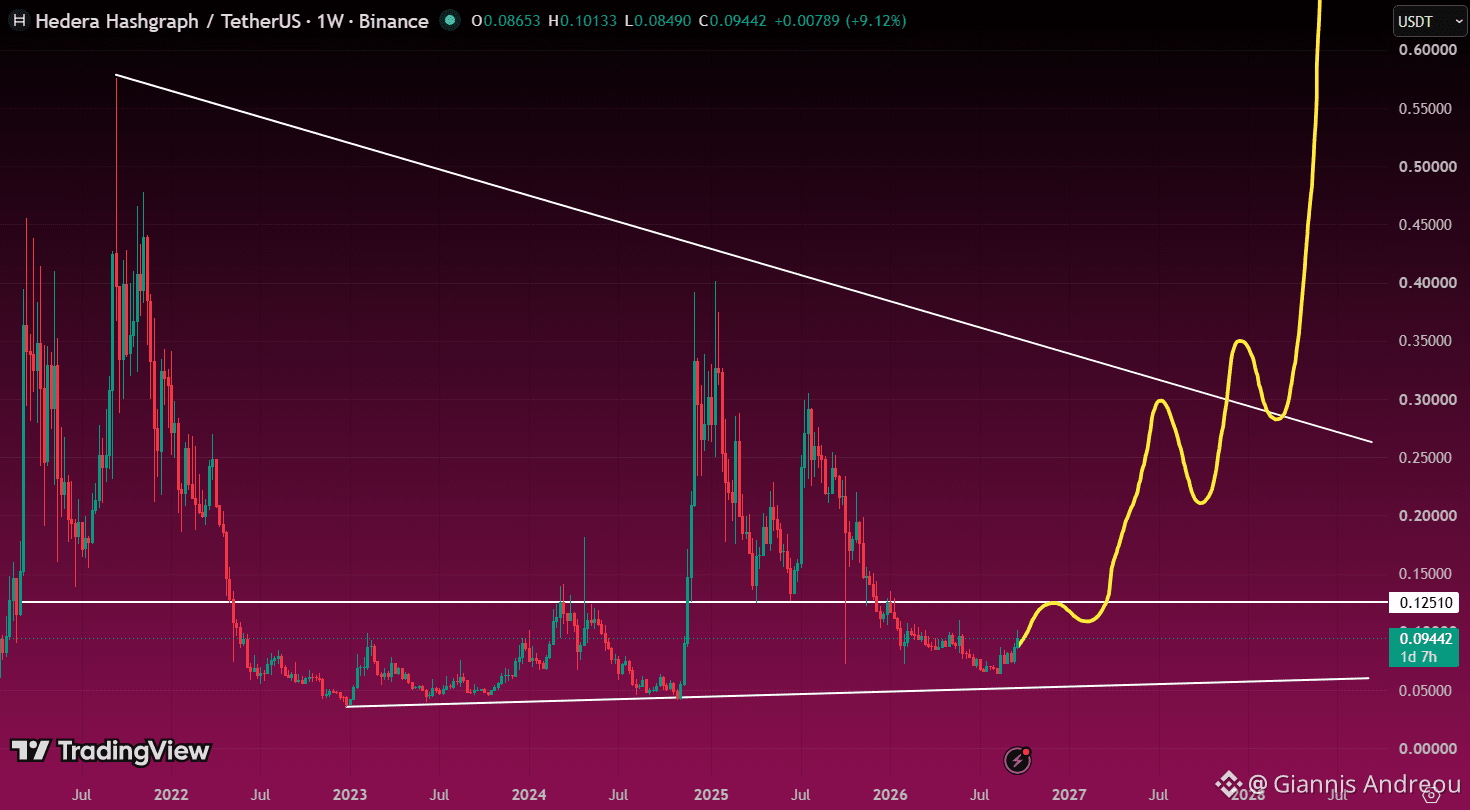
⚫ $HBAR IS GETTING CLOSER TO A BIG MOMENT
Hedera is still trading below the long-term descending trendline, but the structure underneath is starting to improve.
The first major level I’m watching is around $0.125.
If $HBAR breaks that and then pushes through the bigger trendline above, I think the chart could open up in a much bigger way.
For now, the roadmap is simple:
Break $0.125.
Reclaim the trendline.
Then the real move can begin.
$HBAR is not there yet.
But it’s getting interesting.
⚫ $HBAR IS GETTING CLOSER TO A BIG MOMENT
Hedera is still trading below the long-term descending trendline, but the structure underneath is starting to improve.
The first major level I’m watching is around $0.125.
If $HBAR breaks that and then pushes through the bigger trendline above, I think the chart could open up in a much bigger way.
For now, the roadmap is simple:
Break $0.125.
Reclaim the trendline.
Then the real move can begin.
$HBAR is not there yet.
But it’s getting interesting.
Hedera is still trading below the long-term descending trendline, but the structure underneath is starting to improve.
The first major level I’m watching is around $0.125.
If $HBAR breaks that and then pushes through the bigger trendline above, I think the chart could open up in a much bigger way.
For now, the roadmap is simple:
Break $0.125.
Reclaim the trendline.
Then the real move can begin.
$HBAR is not there yet.
But it’s getting interesting.
32
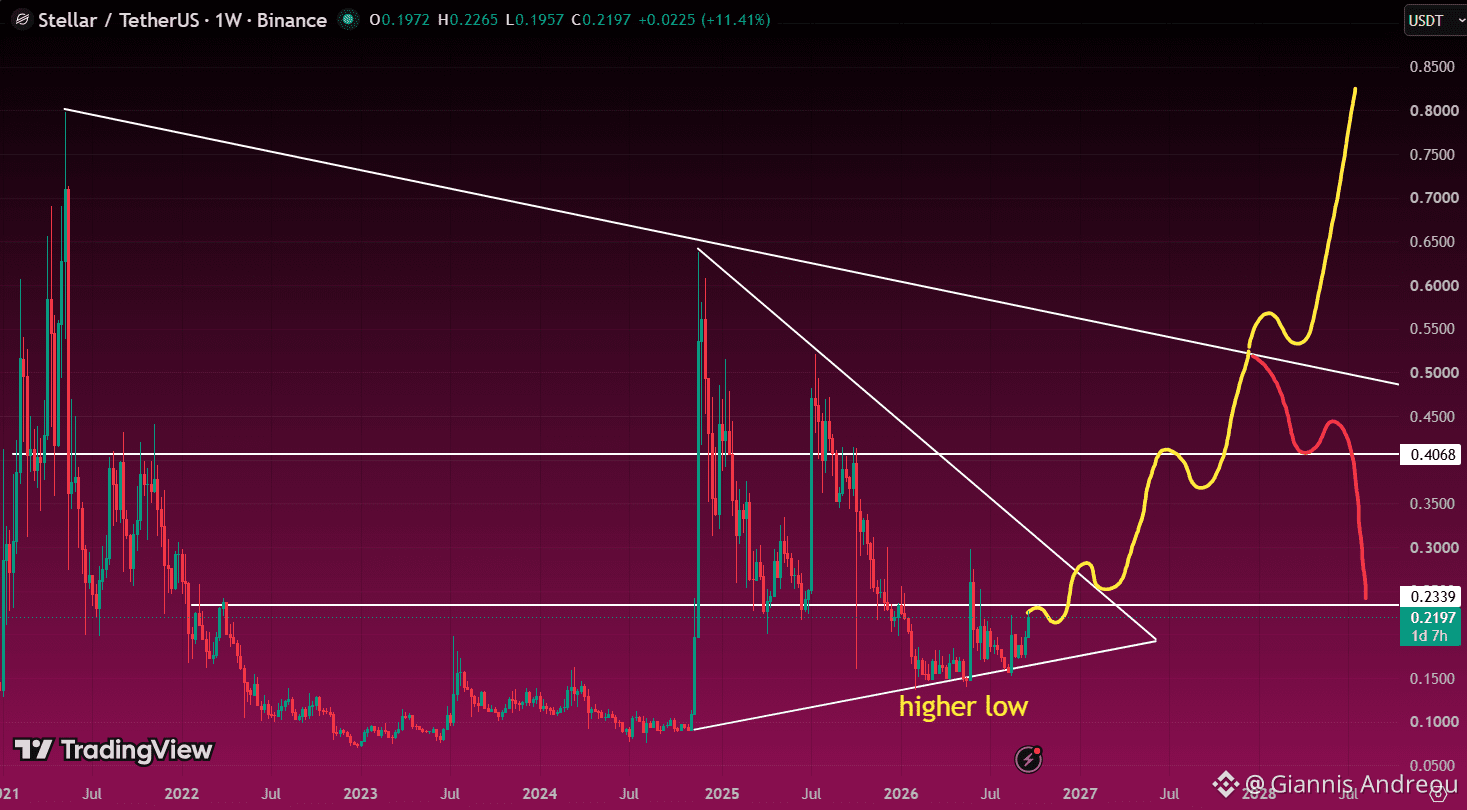
🌍 $XLM HAS TWO CLEAR PATHS FROM HERE
Stellar is building a higher low, but price is still trapped inside a major structure.
For me, this chart has two scenarios.
Bullish route:
If $XLM breaks out of the triangle and reclaims the bigger descending trendline, the first major level I’m watching is around $0.40.
If that breaks, the move could expand much higher.
Bearish route:
If price gets rejected and loses the higher-low structure, then $0.23 becomes the key level to watch.
Lose that, and the setup weakens fast.
Right now, $XLM is sitting at an important decision point.
Breakout or breakdown.
That is the story.
🌍 $XLM HAS TWO CLEAR PATHS FROM HERE
Stellar is building a higher low, but price is still trapped inside a major structure.
For me, this chart has two scenarios.
Bullish route:
If $XLM breaks out of the triangle and reclaims the bigger descending trendline, the first major level I’m watching is around $0.40.
If that breaks, the move could expand much higher.
Bearish route:
If price gets rejected and loses the higher-low structure, then $0.23 becomes the key level to watch.
Lose that, and the setup weakens fast.
Right now, $XLM is sitting at an important decision point.
Breakout or breakdown.
That is the story.
Stellar is building a higher low, but price is still trapped inside a major structure.
For me, this chart has two scenarios.
Bullish route:
If $XLM breaks out of the triangle and reclaims the bigger descending trendline, the first major level I’m watching is around $0.40.
If that breaks, the move could expand much higher.
Bearish route:
If price gets rejected and loses the higher-low structure, then $0.23 becomes the key level to watch.
Lose that, and the setup weakens fast.
Right now, $XLM is sitting at an important decision point.
Breakout or breakdown.
That is the story.
70
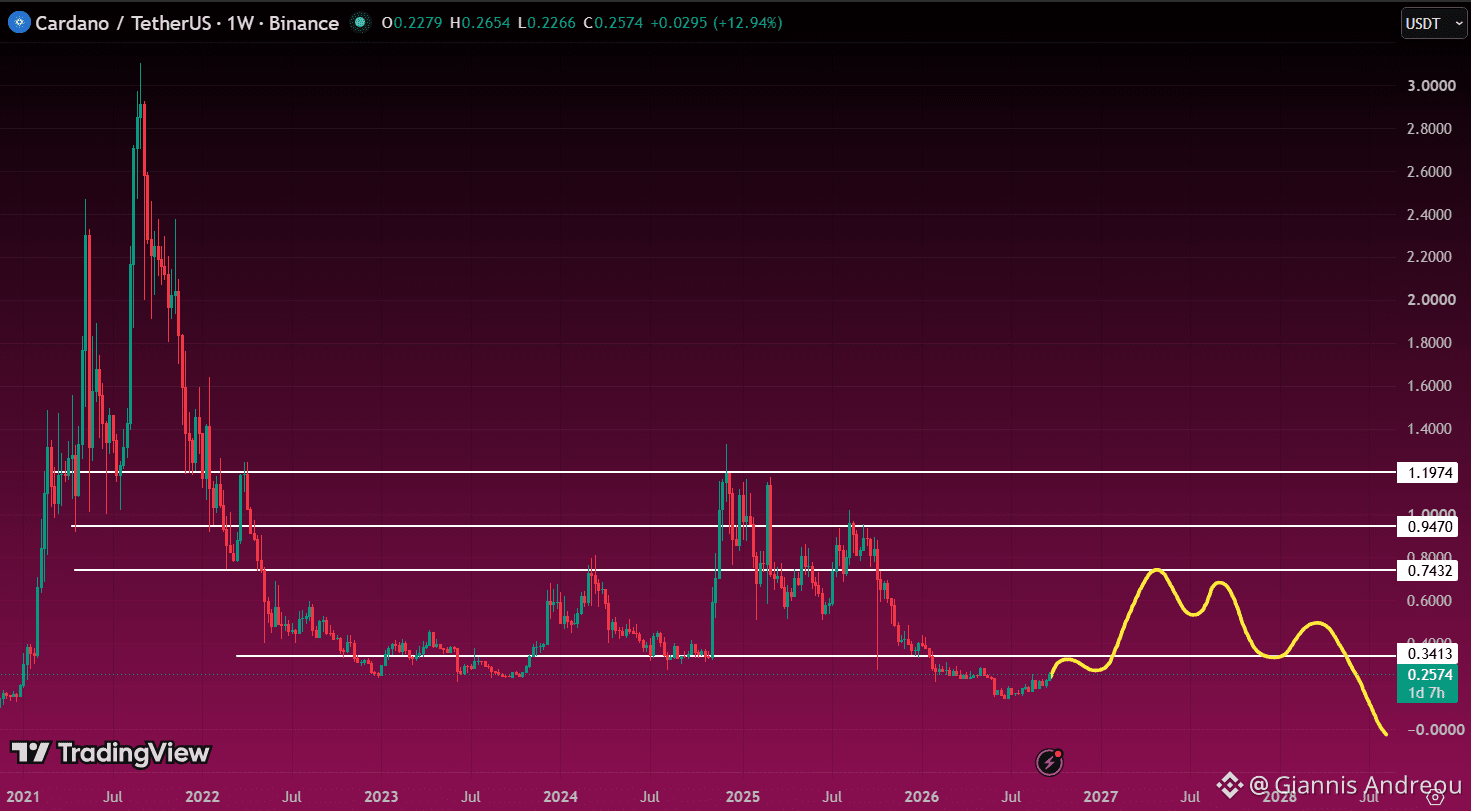
🔵 SORRY $ADA FANS, BUT I DON’T LIKE WHAT I’M SEEING YET
While many other altcoins have already started reclaiming major levels, Cardano is still struggling below its first real resistance.
$ADA hasn’t even broken the $0.34 area yet.
And above that, there is still:
$0.74 → $0.95 → $1.20
That is a lot of resistance still sitting overhead.
Could $ADA eventually turn bullish? Of course.
But right now, compared with many other charts, I think Cardano still has a lot more to prove.
For now, I’m staying cautious.
🔵 SORRY $ADA FANS, BUT I DON’T LIKE WHAT I’M SEEING YET
While many other altcoins have already started reclaiming major levels, Cardano is still struggling below its first real resistance.
$ADA hasn’t even broken the $0.34 area yet.
And above that, there is still:
$0.74 → $0.95 → $1.20
That is a lot of resistance still sitting overhead.
Could $ADA eventually turn bullish? Of course.
But right now, compared with many other charts, I think Cardano still has a lot more to prove.
For now, I’m staying cautious.
While many other altcoins have already started reclaiming major levels, Cardano is still struggling below its first real resistance.
$ADA hasn’t even broken the $0.34 area yet.
And above that, there is still:
$0.74 → $0.95 → $1.20
That is a lot of resistance still sitting overhead.
Could $ADA eventually turn bullish? Of course.
But right now, compared with many other charts, I think Cardano still has a lot more to prove.
For now, I’m staying cautious.
39
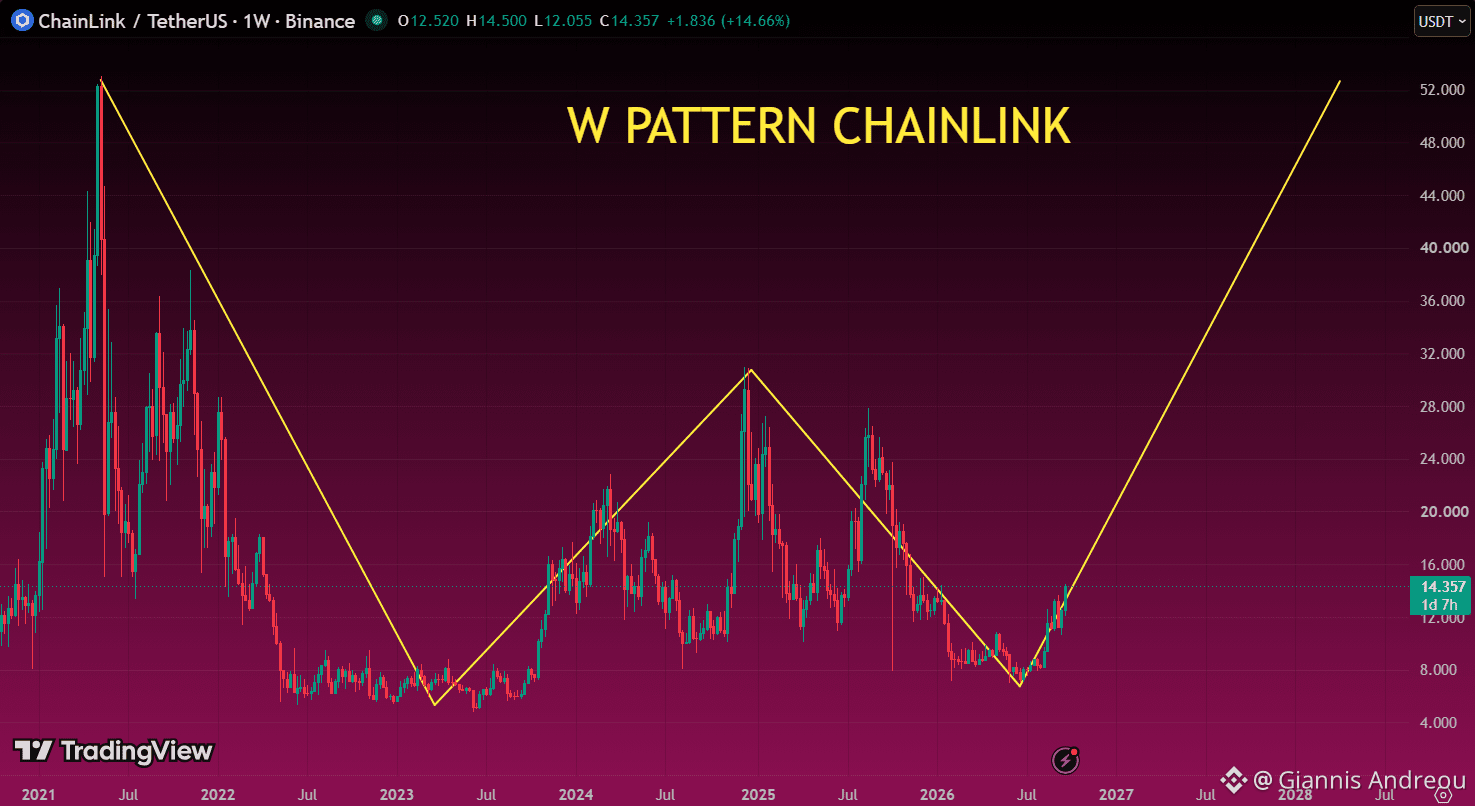
🔗 $LINK IS BUILDING A HUGE W PATTERN
This is the kind of structure that can change everything.
On the higher timeframe, Chainlink looks like it is forming a massive W pattern.
That usually means one thing:
a long accumulation structure before a much bigger move.
If this pattern keeps playing out, $LINK could be setting up for a strong expansion phase from here.
The chart is starting to look very interesting.
Sometimes the biggest moves start from the cleanest long-term patterns.
🔗 $LINK IS BUILDING A HUGE W PATTERN
This is the kind of structure that can change everything.
On the higher timeframe, Chainlink looks like it is forming a massive W pattern.
That usually means one thing:
a long accumulation structure before a much bigger move.
If this pattern keeps playing out, $LINK could be setting up for a strong expansion phase from here.
The chart is starting to look very interesting.
Sometimes the biggest moves start from the cleanest long-term patterns.
This is the kind of structure that can change everything.
On the higher timeframe, Chainlink looks like it is forming a massive W pattern.
That usually means one thing:
a long accumulation structure before a much bigger move.
If this pattern keeps playing out, $LINK could be setting up for a strong expansion phase from here.
The chart is starting to look very interesting.
Sometimes the biggest moves start from the cleanest long-term patterns.
31
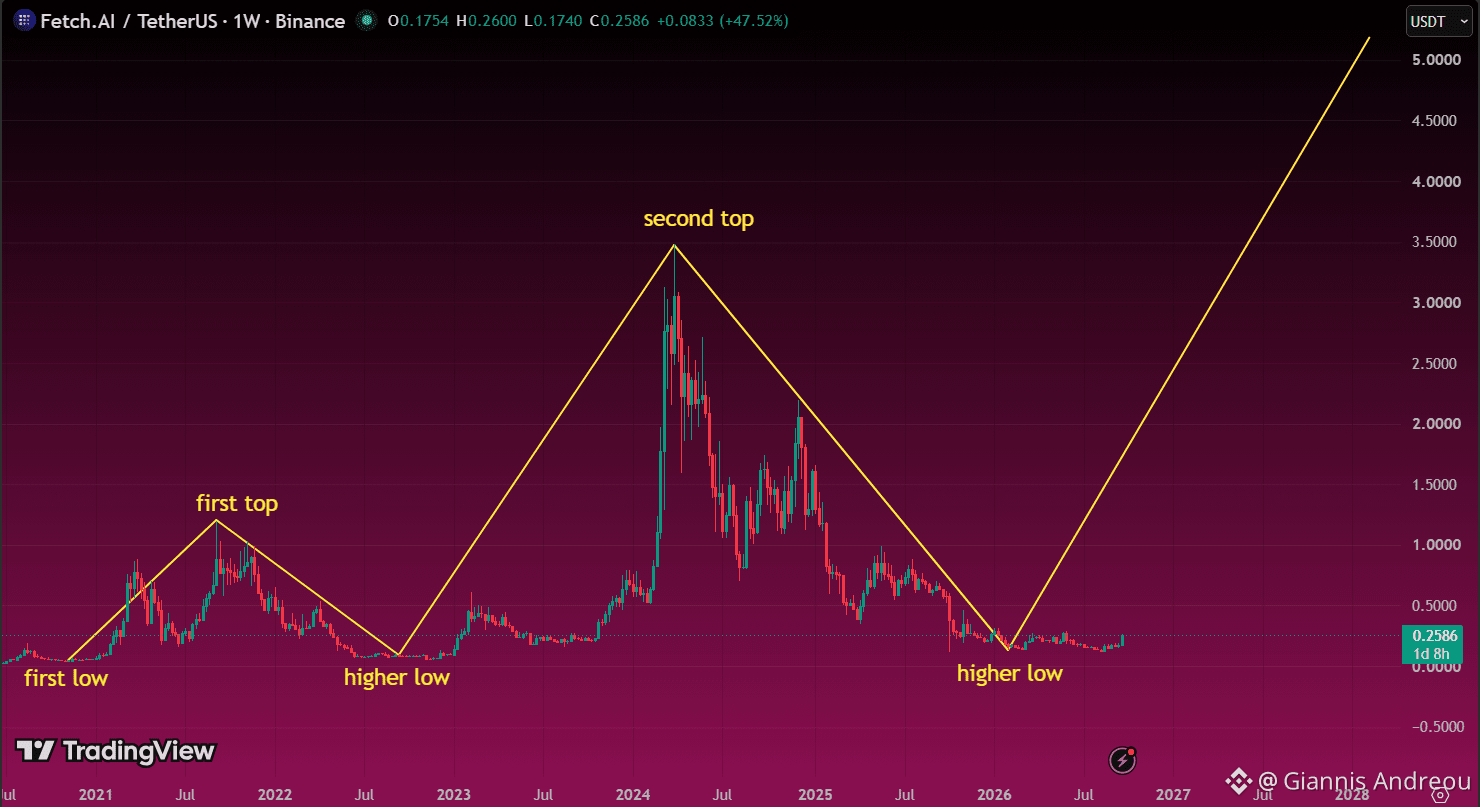
🤖 $FET IS ONE OF THOSE PROJECTS THAT NEVER REALLY STOPPED BUILDING
When I look at this chart, I do not just see price action.
I see a project that has kept developing through multiple cycles.
The structure shows it too.
After the first cycle, $FET built a higher low.
After the next major run, it built another higher low.
That is what long-term growth often looks like.
Not a straight line up.
But a project that keeps evolving, survives the resets, and comes back stronger.
$FET has been showing development over the years.
That is why I still think it deserves attention.
🤖 $FET IS ONE OF THOSE PROJECTS THAT NEVER REALLY STOPPED BUILDING
When I look at this chart, I do not just see price action.
I see a project that has kept developing through multiple cycles.
The structure shows it too.
After the first cycle, $FET built a higher low.
After the next major run, it built another higher low.
That is what long-term growth often looks like.
Not a straight line up.
But a project that keeps evolving, survives the resets, and comes back stronger.
$FET has been showing development over the years.
That is why I still think it deserves attention.
When I look at this chart, I do not just see price action.
I see a project that has kept developing through multiple cycles.
The structure shows it too.
After the first cycle, $FET built a higher low.
After the next major run, it built another higher low.
That is what long-term growth often looks like.
Not a straight line up.
But a project that keeps evolving, survives the resets, and comes back stronger.
$FET has been showing development over the years.
That is why I still think it deserves attention.
1
95
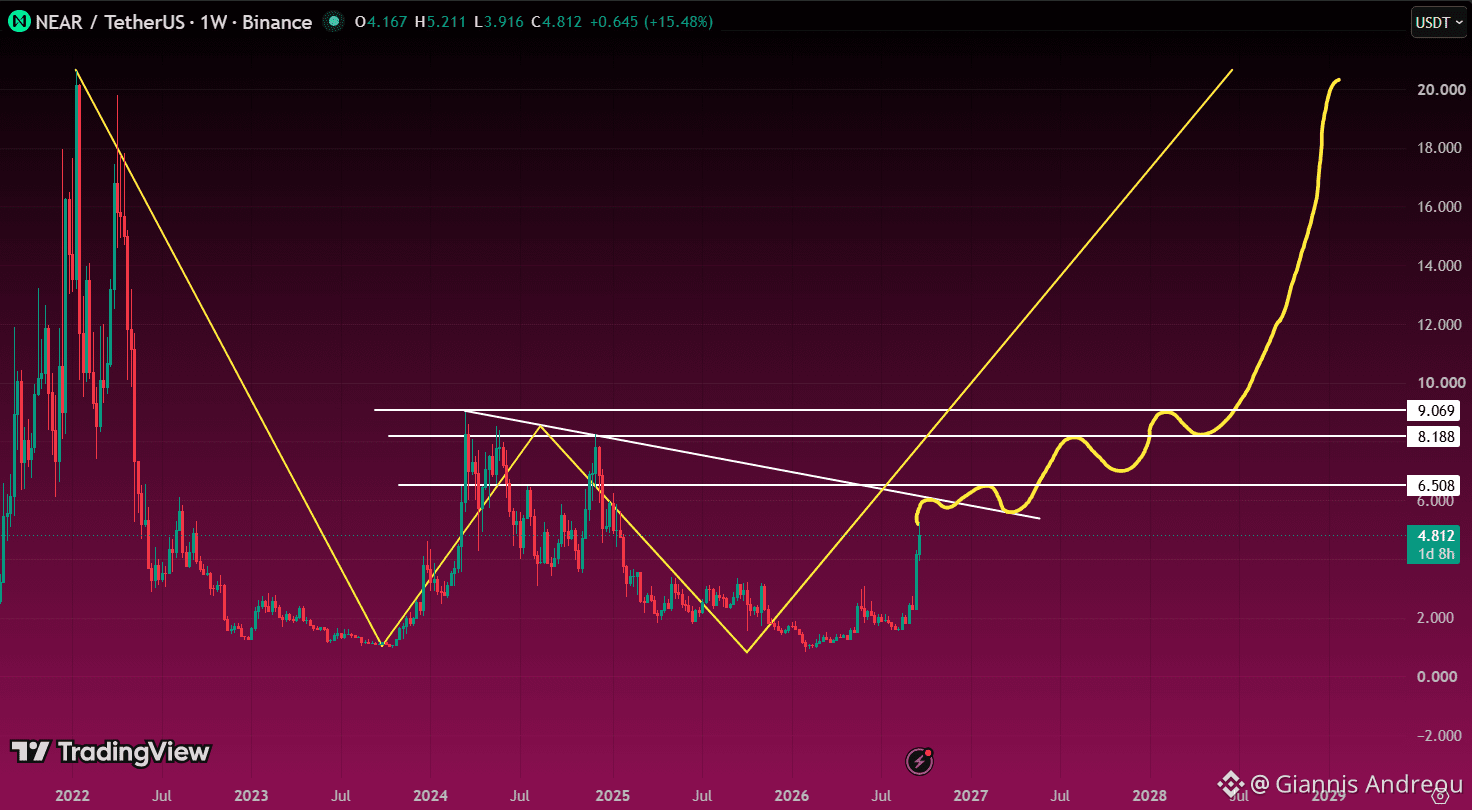
🌐 $NEAR IS BUILDING A MASSIVE W PATTERN
Since the 2021 top, $NEAR has been shaping what looks like a huge W structure on the higher timeframe.
That is why this area matters so much.
If price keeps pushing higher and breaks the descending trendline, I think this pattern could trigger a much bigger move.
The next levels on my chart are:
$6.50 → $8.20 → $9.00
And if the full W pattern really plays out, this may only be the beginning.
This is one of the cleaner long-term structures I’m watching right now.
🌐 $NEAR IS BUILDING A MASSIVE W PATTERN
Since the 2021 top, $NEAR has been shaping what looks like a huge W structure on the higher timeframe.
That is why this area matters so much.
If price keeps pushing higher and breaks the descending trendline, I think this pattern could trigger a much bigger move.
The next levels on my chart are:
$6.50 → $8.20 → $9.00
And if the full W pattern really plays out, this may only be the beginning.
This is one of the cleaner long-term structures I’m watching right now.
Since the 2021 top, $NEAR has been shaping what looks like a huge W structure on the higher timeframe.
That is why this area matters so much.
If price keeps pushing higher and breaks the descending trendline, I think this pattern could trigger a much bigger move.
The next levels on my chart are:
$6.50 → $8.20 → $9.00
And if the full W pattern really plays out, this may only be the beginning.
This is one of the cleaner long-term structures I’m watching right now.
76
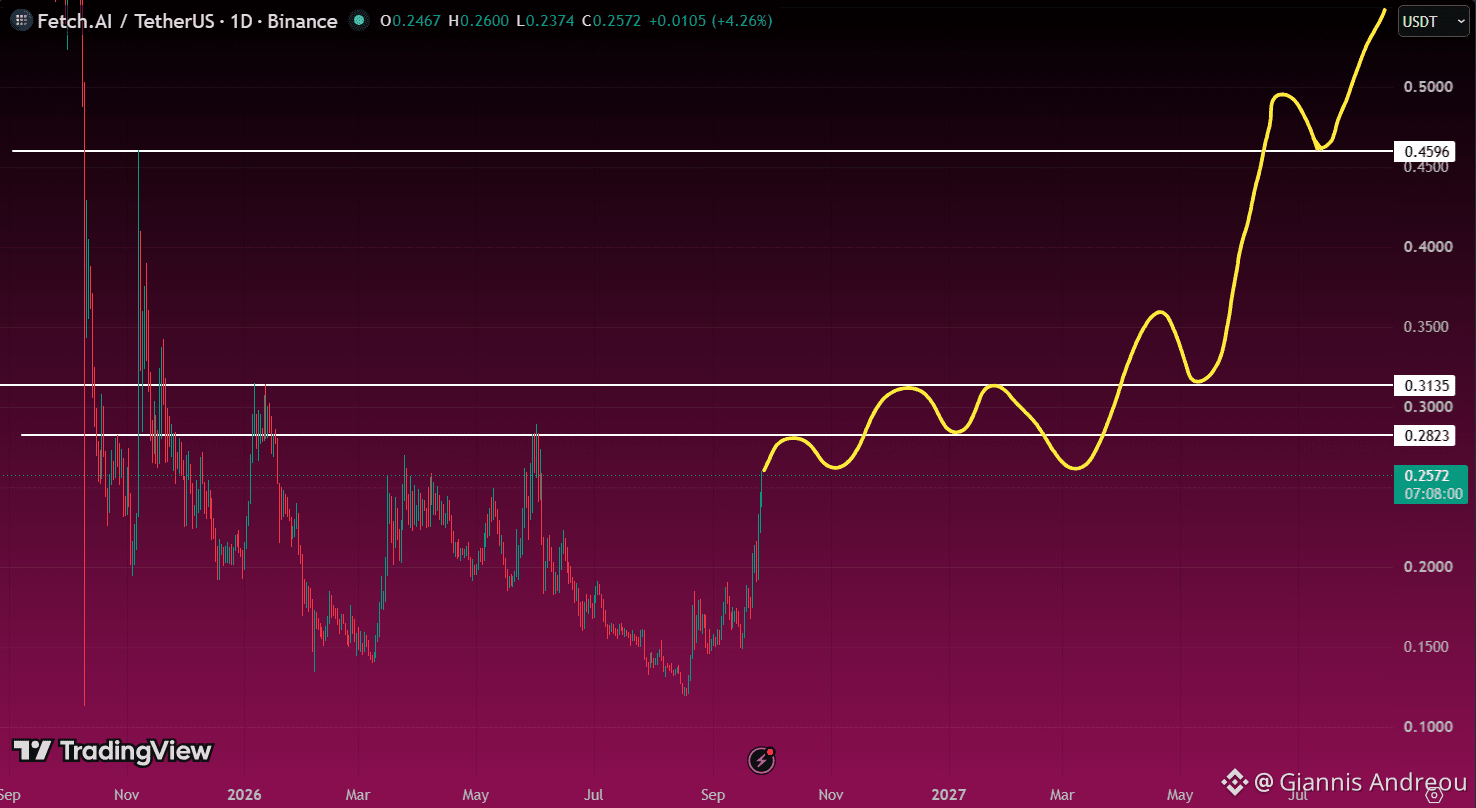
🤖 $FET IS GETTING VERY CLOSE TO A BIG BREAKOUT
$FET is pushing back toward the $0.28-$0.31 resistance zone.
If that area breaks cleanly and holds, I think the move could accelerate fast.
The next major level on my chart is around $0.46.
For now, the roadmap is simple:
Break $0.28-$0.31.
Hold it.
Then $0.46 comes into focus.
$FET is starting to look interesting again.
🤖 $FET IS GETTING VERY CLOSE TO A BIG BREAKOUT
$FET is pushing back toward the $0.28-$0.31 resistance zone.
If that area breaks cleanly and holds, I think the move could accelerate fast.
The next major level on my chart is around $0.46.
For now, the roadmap is simple:
Break $0.28-$0.31.
Hold it.
Then $0.46 comes into focus.
$FET is starting to look interesting again.
$FET is pushing back toward the $0.28-$0.31 resistance zone.
If that area breaks cleanly and holds, I think the move could accelerate fast.
The next major level on my chart is around $0.46.
For now, the roadmap is simple:
Break $0.28-$0.31.
Hold it.
Then $0.46 comes into focus.
$FET is starting to look interesting again.
66
Connectez-vous pour découvrir plus de contenu
Rejoignez la communauté mondiale des adeptes de cryptomonnaies sur Binance Square
⚡️ Suviez les dernières informations importantes sur les cryptomonnaies.
💬 Jugé digne de confiance par la plus grande plateforme d’échange de cryptomonnaies au monde.
👍 Découvrez les connaissances que partagent les créateurs vérifiés.
Adresse e-mail/Nº de téléphone