

CryptoMind学道
3.8k Publications

CryptoMind学道
Signaler
Bloquer l’utilisateur
交易员 | Reading Liquidity, Flow & Structure | Spot • Futures • New Listings | BTC ETH BNB & Momentum Alts | Risk First
Trade régulièrement
2.7 an(s)
4 Suivis
775 Abonnés
2.6K+ J’aime
Publications
Tous
Citations
·
--
Haussier
The floor holds while the crowd sleeps
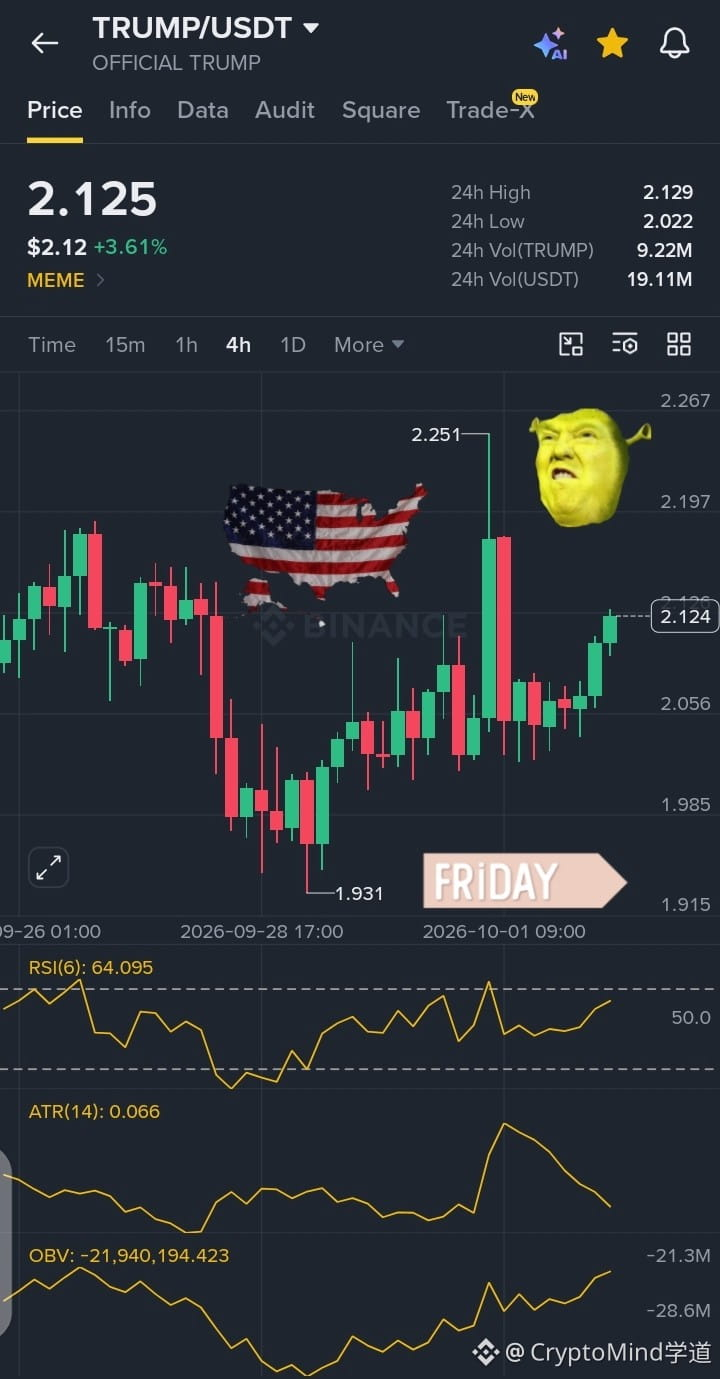
Everyone chased the spike to 2.25, but the real work is happening quietly right above 2.00. I've held dead bags before, so I know the risk, but this base looks like it's being built for something bigger
🟢 Building a spot position in $TRUMP
📍 Zone: 2.00–2.15
🎯 Target 1: 3.00
💰 Target 2: 3.80
🛑 Exit below: 1.88
Green candles are for exit liquidity, not entries
Where's your zone on this one?
{spot}(TRUMPUSDT)
The floor holds while the crowd sleeps
Everyone chased the spike to 2.25, but the real work is happening quietly right above 2.00. I've held dead bags before, so I know the risk, but this base looks like it's being built for something bigger
🟢 Building a spot position in $TRUMP
📍 Zone: 2.00–2.15
🎯 Target 1: 3.00
💰 Target 2: 3.80
🛑 Exit below: 1.88
Green candles are for exit liquidity, not entries
Where's your zone on this one?
Everyone chased the spike to 2.25, but the real work is happening quietly right above 2.00. I've held dead bags before, so I know the risk, but this base looks like it's being built for something bigger
🟢 Building a spot position in $TRUMP
📍 Zone: 2.00–2.15
🎯 Target 1: 3.00
💰 Target 2: 3.80
🛑 Exit below: 1.88
Green candles are for exit liquidity, not entries
Where's your zone on this one?
56
·
--
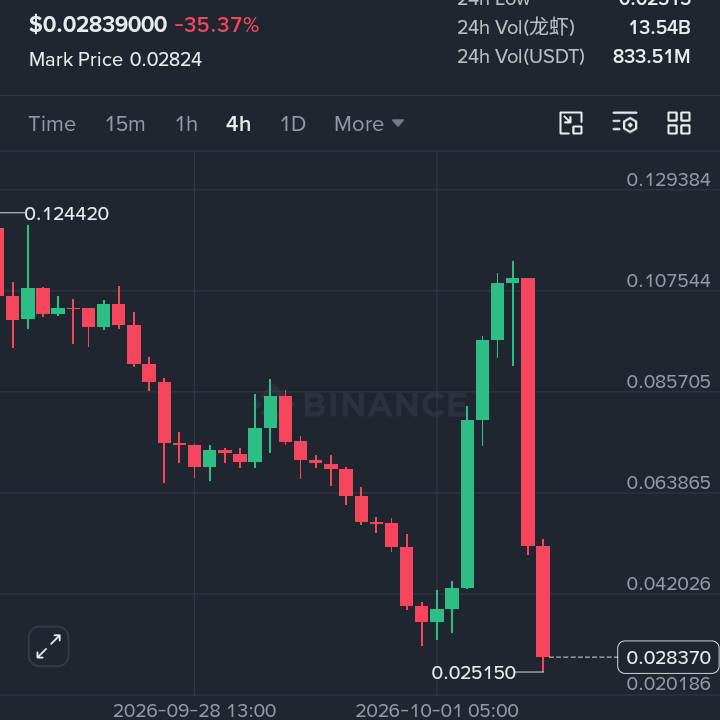
bottom tagged. 🩸
🟢 Long $龙虾
🚪 Entry 0.02839
💰 Targets 0.04202, 0.06386
🛑 Stop 0.02515
{future}(龙虾USDT)
Brutal wick swept the lows. Late shorts now trapped as spot bids absorb panic. Buying this sharp
Fading this bounce or joining
bottom tagged. 🩸
🟢 Long $龙虾
🚪 Entry 0.02839
💰 Targets 0.04202, 0.06386
🛑 Stop 0.02515
Brutal wick swept the lows. Late shorts now trapped as spot bids absorb panic. Buying this sharp
Fading this bounce or joining
🟢 Long $龙虾
🚪 Entry 0.02839
💰 Targets 0.04202, 0.06386
🛑 Stop 0.02515
Brutal wick swept the lows. Late shorts now trapped as spot bids absorb panic. Buying this sharp
Fading this bounce or joining
58
·
--
Article
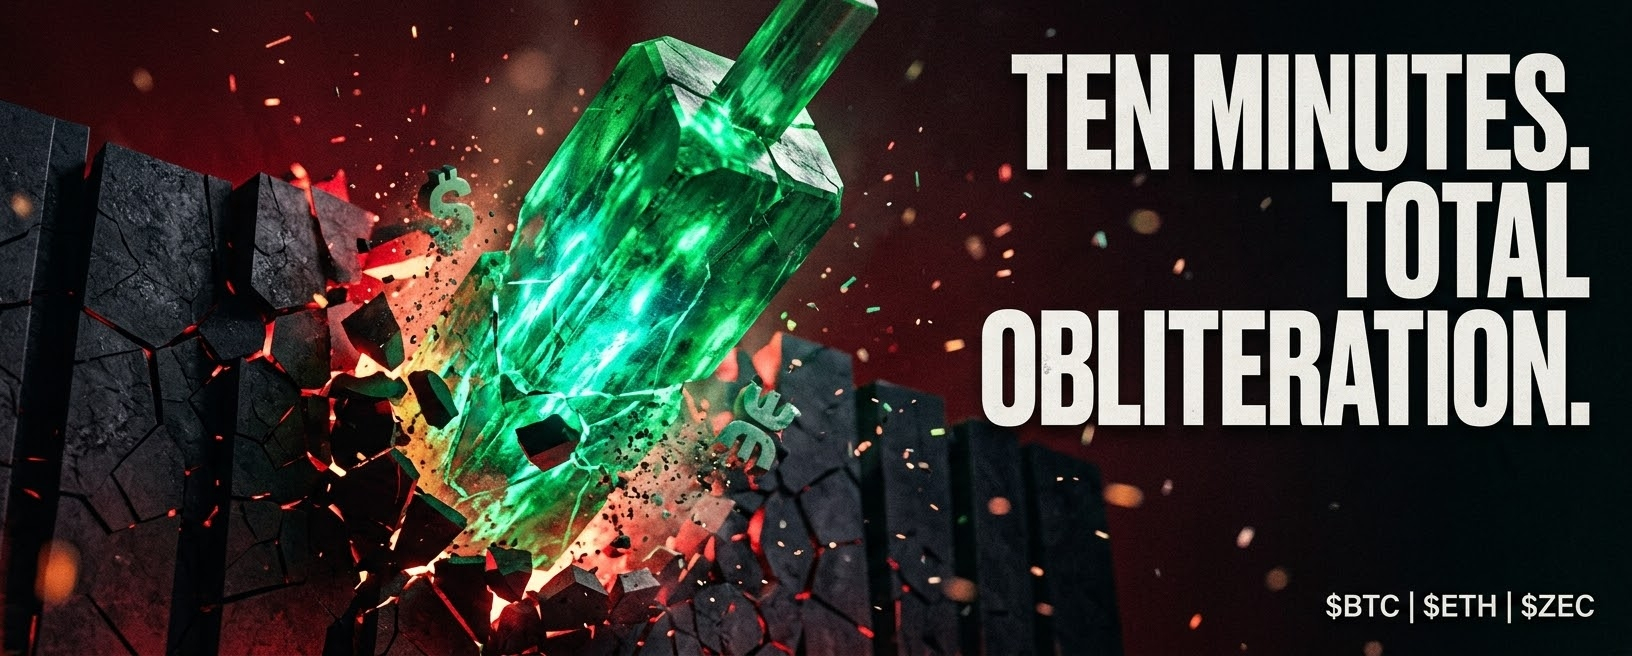
I Watched $110 Million Vanish in Ten MinutesI opened my laptop at 4:40 a.m. and the liquidation feed was screaming. Not flashing. Screaming.
Ten minutes. That's all it took.
$110 million in short positions, gone. Forced closed. Bought back at market. No warning, no slow bleed — just a cascade that ripped through every exchange in seconds.
I've seen liquidations before. I've been on the wrong side of them. But the speed of this one made me sit up straight.
Here's what the numbers actually say.
In the 24 hours before that ten-minute burst, total liquidations ranged from $100 million to $170 million. Shorts consistently made up more than $70 million of that. Then the dam broke.
Across the entire day, 66,942 traders got liquidated. $191 million total. Longs took $107 million of that pain. Shorts got hit for $83 million.
But the shorts didn't just get hit. They got steamrolled. Bitcoin short liquidations hit $24.7 million. Ethereum shorts, $15.6 million. The largest single liquidation was a $3.13 million ZEC position on Hyperliquid.
I remember staring at a screen like that back in 2022. I was short ETH at what I thought was the top. The funding was negative, the crowd was bearish, everything lined up. Then a single green candle took me out in under two minutes. I refreshed the page like the number would come back. It didn't.
That's what a short squeeze feels like. It doesn't care about your thesis.
The mechanics are brutal in their simplicity. A leveraged short sells borrowed coins, hoping to buy them back cheaper. When price moves against them, the exchange closes the trade automatically before losses eat the collateral. Closing a short means buying the asset. All that forced buying pushes price higher. Higher prices knock out the next layer of shorts. Which triggers more buying.
A feedback loop. A machine that eats people who bet the wrong way.
CoinGlass data shows shorts have typically accounted for 65% to 90% of all liquidations during major price surges. This wasn't an exception. It was the rule, executed at a speed that caught everyone off guard.
And here's what nobody's saying.
Everyone's calling this a bull signal. "Shorts got wrecked, bullish!" But this wasn't organic demand. This was forced buying. The spot bid barely moved while shorts were getting torn apart. The people buying weren't buyers — they were liquidators. That's not the same thing.
The real question is what happens when the forced buying stops.
Bitcoin pumped through $86,000 during the squeeze. It's holding around $86,100 now, up 2.84% in 24 hours. But look at what the whales are doing. Bitcoin whales shed 30,000 BTC — that's $2.52 billion — between September 27 and October 1. While retail was shorting and getting liquidated, the big money was quietly exiting.
Ethereum whales, meanwhile, added 60,000 ETH. $162 million. XRP whales stayed flat. That divergence matters more than the liquidation print.
The fear and greed index sits at 71. Greed. Down two points from yesterday. Still greed.
I'm not bearish. I'm just saying the people celebrating might be too early.
The move was real. $110 million in forced closes is real. But real moves still need a base to stand on. Liquidation cascades don't tell you direction. They tell you positioning. And the positioning just got reset in one direction. Which means the other direction is now crowded.
The level that matters is $86,000.
BTC broke through it during the squeeze. If it holds above that on a daily close, the next leg could build. Shorts will start clustering again, and if CoinGlass patterns hold, 65% to 90% of the next rally's liquidations will come from people betting against it.
If $86,000 breaks? The forced buying that fueled this move disappears. Spot bid was thin underneath. The same cascade that ripped shorts apart can run in reverse. Liquidations don't discriminate.
$BTC $ETH $ZEC
#crypto #bitcoin #liquidation
When the crowd gets loud, do you listen — or do you watch the tape?
I Watched $110 Million Vanish in Ten Minutes
I opened my laptop at 4:40 a.m. and the liquidation feed was screaming. Not flashing. Screaming.
Ten minutes. That's all it took.
$110 million in short positions, gone. Forced closed. Bought back at market. No warning, no slow bleed — just a cascade that ripped through every exchange in seconds.
I've seen liquidations before. I've been on the wrong side of them. But the speed of this one made me sit up straight.
Here's what the numbers actually say.
In the 24 hours before that ten-minute burst, total liquidations ranged from $100 million to $170 million. Shorts consistently made up more than $70 million of that. Then the dam broke.
Across the entire day, 66,942 traders got liquidated. $191 million total. Longs took $107 million of that pain. Shorts got hit for $83 million.
But the shorts didn't just get hit. They got steamrolled. Bitcoin short liquidations hit $24.7 million. Ethereum shorts, $15.6 million. The largest single liquidation was a $3.13 million ZEC position on Hyperliquid.
I remember staring at a screen like that back in 2022. I was short ETH at what I thought was the top. The funding was negative, the crowd was bearish, everything lined up. Then a single green candle took me out in under two minutes. I refreshed the page like the number would come back. It didn't.
That's what a short squeeze feels like. It doesn't care about your thesis.
The mechanics are brutal in their simplicity. A leveraged short sells borrowed coins, hoping to buy them back cheaper. When price moves against them, the exchange closes the trade automatically before losses eat the collateral. Closing a short means buying the asset. All that forced buying pushes price higher. Higher prices knock out the next layer of shorts. Which triggers more buying.
A feedback loop. A machine that eats people who bet the wrong way.
CoinGlass data shows shorts have typically accounted for 65% to 90% of all liquidations during major price surges. This wasn't an exception. It was the rule, executed at a speed that caught everyone off guard.
And here's what nobody's saying.
Everyone's calling this a bull signal. "Shorts got wrecked, bullish!" But this wasn't organic demand. This was forced buying. The spot bid barely moved while shorts were getting torn apart. The people buying weren't buyers — they were liquidators. That's not the same thing.
The real question is what happens when the forced buying stops.
Bitcoin pumped through $86,000 during the squeeze. It's holding around $86,100 now, up 2.84% in 24 hours. But look at what the whales are doing. Bitcoin whales shed 30,000 BTC — that's $2.52 billion — between September 27 and October 1. While retail was shorting and getting liquidated, the big money was quietly exiting.
Ethereum whales, meanwhile, added 60,000 ETH. $162 million. XRP whales stayed flat. That divergence matters more than the liquidation print.
The fear and greed index sits at 71. Greed. Down two points from yesterday. Still greed.
I'm not bearish. I'm just saying the people celebrating might be too early.
The move was real. $110 million in forced closes is real. But real moves still need a base to stand on. Liquidation cascades don't tell you direction. They tell you positioning. And the positioning just got reset in one direction. Which means the other direction is now crowded.
The level that matters is $86,000.
BTC broke through it during the squeeze. If it holds above that on a daily close, the next leg could build. Shorts will start clustering again, and if CoinGlass patterns hold, 65% to 90% of the next rally's liquidations will come from people betting against it.
If $86,000 breaks? The forced buying that fueled this move disappears. Spot bid was thin underneath. The same cascade that ripped shorts apart can run in reverse. Liquidations don't discriminate.
$BTC $ETH $ZEC
#crypto #bitcoin #liquidation
When the crowd gets loud, do you listen — or do you watch the tape?
Ten minutes. That's all it took.
$110 million in short positions, gone. Forced closed. Bought back at market. No warning, no slow bleed — just a cascade that ripped through every exchange in seconds.
I've seen liquidations before. I've been on the wrong side of them. But the speed of this one made me sit up straight.
Here's what the numbers actually say.
In the 24 hours before that ten-minute burst, total liquidations ranged from $100 million to $170 million. Shorts consistently made up more than $70 million of that. Then the dam broke.
Across the entire day, 66,942 traders got liquidated. $191 million total. Longs took $107 million of that pain. Shorts got hit for $83 million.
But the shorts didn't just get hit. They got steamrolled. Bitcoin short liquidations hit $24.7 million. Ethereum shorts, $15.6 million. The largest single liquidation was a $3.13 million ZEC position on Hyperliquid.
I remember staring at a screen like that back in 2022. I was short ETH at what I thought was the top. The funding was negative, the crowd was bearish, everything lined up. Then a single green candle took me out in under two minutes. I refreshed the page like the number would come back. It didn't.
That's what a short squeeze feels like. It doesn't care about your thesis.
The mechanics are brutal in their simplicity. A leveraged short sells borrowed coins, hoping to buy them back cheaper. When price moves against them, the exchange closes the trade automatically before losses eat the collateral. Closing a short means buying the asset. All that forced buying pushes price higher. Higher prices knock out the next layer of shorts. Which triggers more buying.
A feedback loop. A machine that eats people who bet the wrong way.
CoinGlass data shows shorts have typically accounted for 65% to 90% of all liquidations during major price surges. This wasn't an exception. It was the rule, executed at a speed that caught everyone off guard.
And here's what nobody's saying.
Everyone's calling this a bull signal. "Shorts got wrecked, bullish!" But this wasn't organic demand. This was forced buying. The spot bid barely moved while shorts were getting torn apart. The people buying weren't buyers — they were liquidators. That's not the same thing.
The real question is what happens when the forced buying stops.
Bitcoin pumped through $86,000 during the squeeze. It's holding around $86,100 now, up 2.84% in 24 hours. But look at what the whales are doing. Bitcoin whales shed 30,000 BTC — that's $2.52 billion — between September 27 and October 1. While retail was shorting and getting liquidated, the big money was quietly exiting.
Ethereum whales, meanwhile, added 60,000 ETH. $162 million. XRP whales stayed flat. That divergence matters more than the liquidation print.
The fear and greed index sits at 71. Greed. Down two points from yesterday. Still greed.
I'm not bearish. I'm just saying the people celebrating might be too early.
The move was real. $110 million in forced closes is real. But real moves still need a base to stand on. Liquidation cascades don't tell you direction. They tell you positioning. And the positioning just got reset in one direction. Which means the other direction is now crowded.
The level that matters is $86,000.
BTC broke through it during the squeeze. If it holds above that on a daily close, the next leg could build. Shorts will start clustering again, and if CoinGlass patterns hold, 65% to 90% of the next rally's liquidations will come from people betting against it.
If $86,000 breaks? The forced buying that fueled this move disappears. Spot bid was thin underneath. The same cascade that ripped shorts apart can run in reverse. Liquidations don't discriminate.
$BTC $ETH $ZEC
#crypto #bitcoin #liquidation
When the crowd gets loud, do you listen — or do you watch the tape?
1
140
·
--
Haussier
Everyone's chasing green candles, but I'm watching the supply 🐂
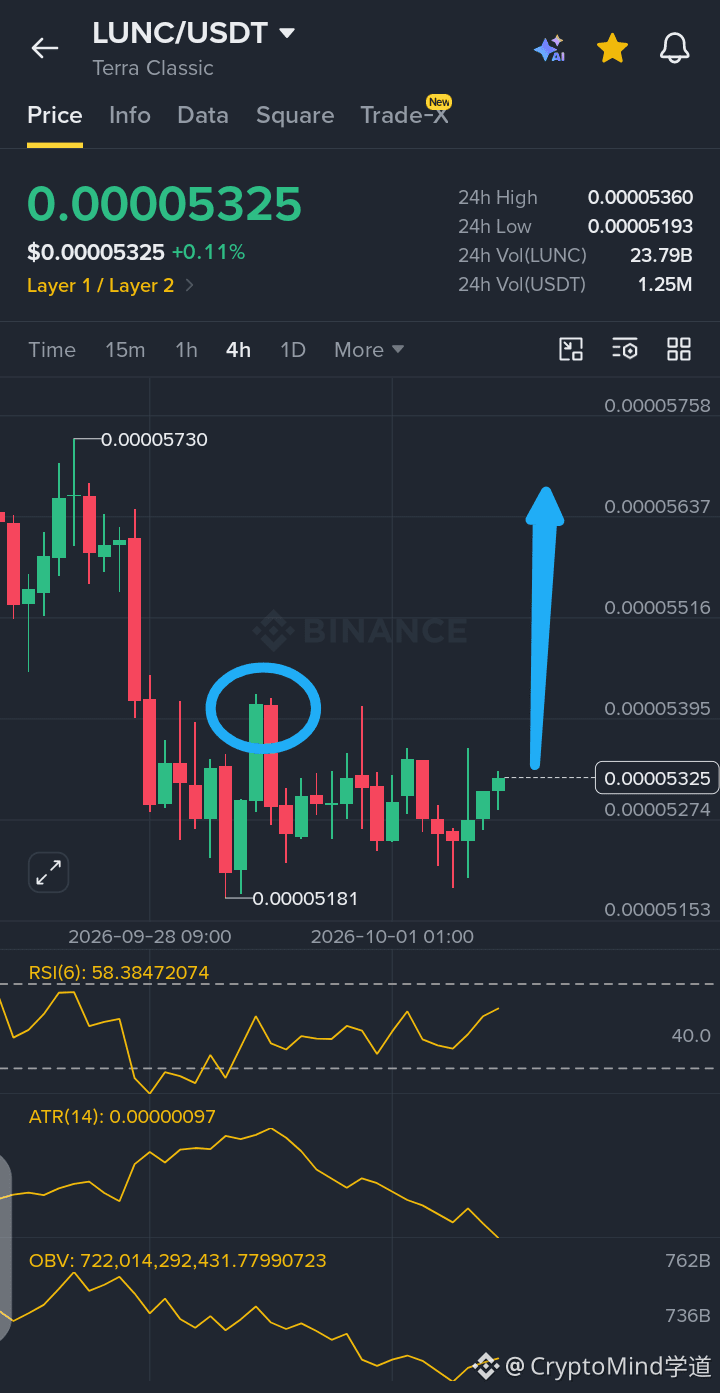
$LUNC is sitting at 0.00005325 after bouncing off 0.00005181. Binance just burned 334.9M tokens, pushing total burns past 460B. The 1.5% burn tax is finally biting
I'm accumulating near 0.00005150–0.00005250. Targeting 0.00005730 first, then 0.00006000. If we lose 0.00005000, I'm out
Does the burn narrative finally have legs, or is this just another slow bleed?
{spot}(LUNCUSDT)
Everyone's chasing green candles, but I'm watching the supply 🐂
$LUNC is sitting at 0.00005325 after bouncing off 0.00005181. Binance just burned 334.9M tokens, pushing total burns past 460B. The 1.5% burn tax is finally biting
I'm accumulating near 0.00005150–0.00005250. Targeting 0.00005730 first, then 0.00006000. If we lose 0.00005000, I'm out
Does the burn narrative finally have legs, or is this just another slow bleed?
$LUNC is sitting at 0.00005325 after bouncing off 0.00005181. Binance just burned 334.9M tokens, pushing total burns past 460B. The 1.5% burn tax is finally biting
I'm accumulating near 0.00005150–0.00005250. Targeting 0.00005730 first, then 0.00006000. If we lose 0.00005000, I'm out
Does the burn narrative finally have legs, or is this just another slow bleed?
81
·
--
𝗧𝗵𝗲 𝗺𝗮𝗿𝗸𝗲𝘁 𝗶𝘀 𝗽𝗿𝗶𝗰𝗶𝗻𝗴 𝗮𝗻 𝗮𝗹𝘁𝘀𝗲𝗮𝘀𝗼𝗻 𝘁𝗵𝗮𝘁 𝘁𝗵𝗲 𝗱𝗮𝘁𝗮 𝘀𝗮𝘆𝘀 𝗵𝗮𝘀 𝗻𝗼𝘁 𝘀𝘁𝗮𝗿𝘁𝗲𝗱 ❔
Here is a number worth sitting with: the Altcoin Season Index reads 37 out of 100. Altseason needs 75.
Now look at the board. PUMPBTCUSDT down 29.5 percent after Binance announced it will delist and settle the contract on October 5. Beneath it, a full roster of pain — 100000BOB at minus 20, $QNT CYPH and BLUAI all near minus 12, SOON at minus 10, then NEAR on both quote pairs, followed by SKDD, AMC, ONG, SHAZ, MET, ENA on two venues, BERA, TEM, $ZEC across USDT and USDC, SEC, ON, then WLD and BLUR side by side, POWER, Q listed twice, APR, Z2, ALPHA, KMN, 4, FLOCK, $ESPORTS OG, and finally HBAR on both pairs closing near minus 5.
Twenty nine names. One direction.
Meanwhile Bitcoin trades around 84,600, dominance sits near 58 percent, and Glassnode data shows 85 percent of altcoins carrying funding rates above their mean — the highest since Bitcoin traded at record levels.
Read that twice. Futures traders are paying premium to long altcoins at the exact moment the rotation index says there is no rotation.
This is what denial looks like on a leaderboard. Leveraged longs waiting for a season the tape refuses to deliver, funding bleeding out while dominance holds.
History is blunt about this setup. Every confirmed altseason was preceded by Bitcoin leading and ETH strengthening against it. Neither is happening. What is happening is forced exits, delistings, and longs paying rent on underwater positions.
The board is not a buying list. It is a warning label.
Which name on that list are you still holding — and is it conviction or is it funding fees talking?
Not financial advice. Do your own research.
#bitcoin #altcoinseason #BinanceSquare #cryptotrading #MarketAnalysis
𝗧𝗵𝗲 𝗺𝗮𝗿𝗸𝗲𝘁 𝗶𝘀 𝗽𝗿𝗶𝗰𝗶𝗻𝗴 𝗮𝗻 𝗮𝗹𝘁𝘀𝗲𝗮𝘀𝗼𝗻 𝘁𝗵𝗮𝘁 𝘁𝗵𝗲 𝗱𝗮𝘁𝗮 𝘀𝗮𝘆𝘀 𝗵𝗮𝘀 𝗻𝗼𝘁 𝘀𝘁𝗮𝗿𝘁𝗲𝗱 ❔
Here is a number worth sitting with: the Altcoin Season Index reads 37 out of 100. Altseason needs 75.
Now look at the board. PUMPBTCUSDT down 29.5 percent after Binance announced it will delist and settle the contract on October 5. Beneath it, a full roster of pain — 100000BOB at minus 20, $QNT CYPH and BLUAI all near minus 12, SOON at minus 10, then NEAR on both quote pairs, followed by SKDD, AMC, ONG, SHAZ, MET, ENA on two venues, BERA, TEM, $ZEC across USDT and USDC, SEC, ON, then WLD and BLUR side by side, POWER, Q listed twice, APR, Z2, ALPHA, KMN, 4, FLOCK, $ESPORTS OG, and finally HBAR on both pairs closing near minus 5.
Twenty nine names. One direction.
Meanwhile Bitcoin trades around 84,600, dominance sits near 58 percent, and Glassnode data shows 85 percent of altcoins carrying funding rates above their mean — the highest since Bitcoin traded at record levels.
Read that twice. Futures traders are paying premium to long altcoins at the exact moment the rotation index says there is no rotation.
This is what denial looks like on a leaderboard. Leveraged longs waiting for a season the tape refuses to deliver, funding bleeding out while dominance holds.
History is blunt about this setup. Every confirmed altseason was preceded by Bitcoin leading and ETH strengthening against it. Neither is happening. What is happening is forced exits, delistings, and longs paying rent on underwater positions.
The board is not a buying list. It is a warning label.
Which name on that list are you still holding — and is it conviction or is it funding fees talking?
Not financial advice. Do your own research.
#bitcoin #altcoinseason #BinanceSquare #cryptotrading #MarketAnalysis
Here is a number worth sitting with: the Altcoin Season Index reads 37 out of 100. Altseason needs 75.
Now look at the board. PUMPBTCUSDT down 29.5 percent after Binance announced it will delist and settle the contract on October 5. Beneath it, a full roster of pain — 100000BOB at minus 20, $QNT CYPH and BLUAI all near minus 12, SOON at minus 10, then NEAR on both quote pairs, followed by SKDD, AMC, ONG, SHAZ, MET, ENA on two venues, BERA, TEM, $ZEC across USDT and USDC, SEC, ON, then WLD and BLUR side by side, POWER, Q listed twice, APR, Z2, ALPHA, KMN, 4, FLOCK, $ESPORTS OG, and finally HBAR on both pairs closing near minus 5.
Twenty nine names. One direction.
Meanwhile Bitcoin trades around 84,600, dominance sits near 58 percent, and Glassnode data shows 85 percent of altcoins carrying funding rates above their mean — the highest since Bitcoin traded at record levels.
Read that twice. Futures traders are paying premium to long altcoins at the exact moment the rotation index says there is no rotation.
This is what denial looks like on a leaderboard. Leveraged longs waiting for a season the tape refuses to deliver, funding bleeding out while dominance holds.
History is blunt about this setup. Every confirmed altseason was preceded by Bitcoin leading and ETH strengthening against it. Neither is happening. What is happening is forced exits, delistings, and longs paying rent on underwater positions.
The board is not a buying list. It is a warning label.
Which name on that list are you still holding — and is it conviction or is it funding fees talking?
Not financial advice. Do your own research.
#bitcoin #altcoinseason #BinanceSquare #cryptotrading #MarketAnalysis

1
54
·
--
Article
The Exchange Rang the Closing Bell, Not the SellersIt's that dead stretch where one session has packed up, another is halfway through its day, and the biggest one hasn't opened its eyes yet. The candles on my screen barely twitched for hours. That kind of stillness usually means nothing is happening. This time it meant something already had.
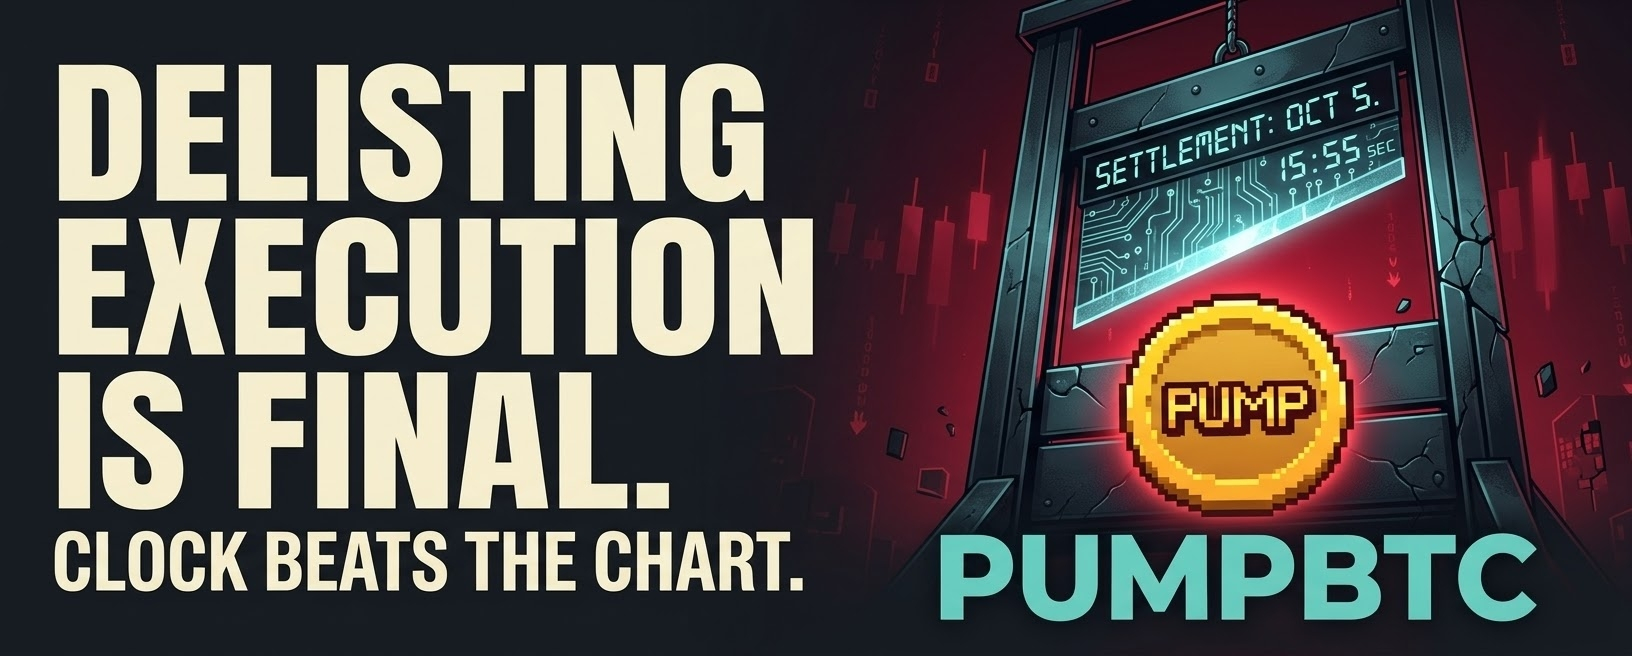
Then one red candle on the 4-hour ate three weeks of PUMPBTC price in a single print. Down 29.95% on the day, from a shelf near 0.0104 straight to 0.0069, before clawing back to 0.00774. A move like that doesn't come from sellers out-arguing buyers. It comes from a door being marked exit-only.
The indicators underneath tell the same story. RSI(6) is sitting near 15, ATR has jumped to roughly triple its usual reading, and OBV rolled over hard into the drop. Oversold, yes — but oversold things with deadlines don't bounce the way traders want them to.
Here's the headline, and it's as clean as it is brutal. Binance Futures is delisting the PUMPBTC perpetual. Every open position gets closed and settled automatically on October 5 — the venue itself posted the notice, and settlements like this don't negotiate with your stop loss.
Open interest on $PUMPBTC sits at 2.21 million, and roughly 46,000 in futures positions were liquidated over the past 24 hours. Futures volume ran about 9.3 million against just 558,000 on spot. The market cap is 4.88 million. Nobody is trading this coin anymore. They're escaping it.
The full 24-hour range says everything: a high at 0.01109, a low at 0.00690, and a close to nowhere in between. That is not a price discovery process. That's a liquidation ledger with candles drawn on it.
Funding doesn't matter here. In three days this contract stops existing, so the longs-versus-shorts argument is over by decree. What remains is a countdown, and every PUMPBTC candle between now and settlement is just noise around the exit door.
The level that matters is 0.0069, the wick low printed in the panic. Above it, the trapped are still hoping.
Above 0.00874 — the top of that post-crash bounce — and I'm watching 0.0098 first, then 0.01044, the old shelf that gave way. Those zones are full of people begging for a fill to get out flat, and I'll ride their urgency, not fight it.
Lose 0.0069 and I'm done. No third target, no averaging down into a contract with a burial date. Below the day's low there isn't enough liquidity left to justify any size at all.
{future}(PUMPBTCUSDT)
Bitcoin is trading around 84,600, up roughly a percent on the day. The majors are fine. This was never a market event — it's a single-asset execution, and the rest of crypto barely noticed $PUMPBTC falling.
Dominance is holding between 57% and 59% depending on who's counting, and total crypto market cap sits near 2.88 trillion. Capital is parked in Bitcoin, and in that kind of tape a small coin with a delisting notice bleeds alone — there is no alt bid coming to rescue PUMPBTC.
This coin has already shown how it behaves under stress. On September 10 it dropped 11% in hours for no reason of its own, simply because Bitcoin slid toward 78,000 on macro fear. High beta, thin books, and now a deadline on top.
The room is positioned for a dead-cat bounce into settlement, and they might get one — forced covers can squeeze price for a day. But they're wrong about why it would move, and confusing a funeral procession for a rally is how accounts get carried out with the casket.
I once held a delisted contract all the way to settlement, telling myself the bounce had to come first. It didn't. I ate the settlement print, watched the ticker vanish from my screen, and learned the hard way that a clock beats a chart every single time, no matter how good the setup looks.
Three days. That's all the $PUMPBTC contract has left. After that the chart stops being a chart and becomes a footnote in Binance's archive, and every level I marked tonight means nothing at all.
So when the exchange announces your coin's funeral date, are you trading the bounce — or are you respecting the clock?
The Exchange Rang the Closing Bell, Not the Sellers
It's that dead stretch where one session has packed up, another is halfway through its day, and the biggest one hasn't opened its eyes yet. The candles on my screen barely twitched for hours. That kind of stillness usually means nothing is happening. This time it meant something already had.
Then one red candle on the 4-hour ate three weeks of PUMPBTC price in a single print. Down 29.95% on the day, from a shelf near 0.0104 straight to 0.0069, before clawing back to 0.00774. A move like that doesn't come from sellers out-arguing buyers. It comes from a door being marked exit-only.
The indicators underneath tell the same story. RSI(6) is sitting near 15, ATR has jumped to roughly triple its usual reading, and OBV rolled over hard into the drop. Oversold, yes — but oversold things with deadlines don't bounce the way traders want them to.
Here's the headline, and it's as clean as it is brutal. Binance Futures is delisting the PUMPBTC perpetual. Every open position gets closed and settled automatically on October 5 — the venue itself posted the notice, and settlements like this don't negotiate with your stop loss.
Open interest on $PUMPBTC sits at 2.21 million, and roughly 46,000 in futures positions were liquidated over the past 24 hours. Futures volume ran about 9.3 million against just 558,000 on spot. The market cap is 4.88 million. Nobody is trading this coin anymore. They're escaping it.
The full 24-hour range says everything: a high at 0.01109, a low at 0.00690, and a close to nowhere in between. That is not a price discovery process. That's a liquidation ledger with candles drawn on it.
Funding doesn't matter here. In three days this contract stops existing, so the longs-versus-shorts argument is over by decree. What remains is a countdown, and every PUMPBTC candle between now and settlement is just noise around the exit door.
The level that matters is 0.0069, the wick low printed in the panic. Above it, the trapped are still hoping.
Above 0.00874 — the top of that post-crash bounce — and I'm watching 0.0098 first, then 0.01044, the old shelf that gave way. Those zones are full of people begging for a fill to get out flat, and I'll ride their urgency, not fight it.
Lose 0.0069 and I'm done. No third target, no averaging down into a contract with a burial date. Below the day's low there isn't enough liquidity left to justify any size at all.
Bitcoin is trading around 84,600, up roughly a percent on the day. The majors are fine. This was never a market event — it's a single-asset execution, and the rest of crypto barely noticed $PUMPBTC falling.
Dominance is holding between 57% and 59% depending on who's counting, and total crypto market cap sits near 2.88 trillion. Capital is parked in Bitcoin, and in that kind of tape a small coin with a delisting notice bleeds alone — there is no alt bid coming to rescue PUMPBTC.
This coin has already shown how it behaves under stress. On September 10 it dropped 11% in hours for no reason of its own, simply because Bitcoin slid toward 78,000 on macro fear. High beta, thin books, and now a deadline on top.
The room is positioned for a dead-cat bounce into settlement, and they might get one — forced covers can squeeze price for a day. But they're wrong about why it would move, and confusing a funeral procession for a rally is how accounts get carried out with the casket.
I once held a delisted contract all the way to settlement, telling myself the bounce had to come first. It didn't. I ate the settlement print, watched the ticker vanish from my screen, and learned the hard way that a clock beats a chart every single time, no matter how good the setup looks.
Three days. That's all the $PUMPBTC contract has left. After that the chart stops being a chart and becomes a footnote in Binance's archive, and every level I marked tonight means nothing at all.
So when the exchange announces your coin's funeral date, are you trading the bounce — or are you respecting the clock?
Then one red candle on the 4-hour ate three weeks of PUMPBTC price in a single print. Down 29.95% on the day, from a shelf near 0.0104 straight to 0.0069, before clawing back to 0.00774. A move like that doesn't come from sellers out-arguing buyers. It comes from a door being marked exit-only.
The indicators underneath tell the same story. RSI(6) is sitting near 15, ATR has jumped to roughly triple its usual reading, and OBV rolled over hard into the drop. Oversold, yes — but oversold things with deadlines don't bounce the way traders want them to.
Here's the headline, and it's as clean as it is brutal. Binance Futures is delisting the PUMPBTC perpetual. Every open position gets closed and settled automatically on October 5 — the venue itself posted the notice, and settlements like this don't negotiate with your stop loss.
Open interest on $PUMPBTC sits at 2.21 million, and roughly 46,000 in futures positions were liquidated over the past 24 hours. Futures volume ran about 9.3 million against just 558,000 on spot. The market cap is 4.88 million. Nobody is trading this coin anymore. They're escaping it.
The full 24-hour range says everything: a high at 0.01109, a low at 0.00690, and a close to nowhere in between. That is not a price discovery process. That's a liquidation ledger with candles drawn on it.
Funding doesn't matter here. In three days this contract stops existing, so the longs-versus-shorts argument is over by decree. What remains is a countdown, and every PUMPBTC candle between now and settlement is just noise around the exit door.
The level that matters is 0.0069, the wick low printed in the panic. Above it, the trapped are still hoping.
Above 0.00874 — the top of that post-crash bounce — and I'm watching 0.0098 first, then 0.01044, the old shelf that gave way. Those zones are full of people begging for a fill to get out flat, and I'll ride their urgency, not fight it.
Lose 0.0069 and I'm done. No third target, no averaging down into a contract with a burial date. Below the day's low there isn't enough liquidity left to justify any size at all.
Bitcoin is trading around 84,600, up roughly a percent on the day. The majors are fine. This was never a market event — it's a single-asset execution, and the rest of crypto barely noticed $PUMPBTC falling.
Dominance is holding between 57% and 59% depending on who's counting, and total crypto market cap sits near 2.88 trillion. Capital is parked in Bitcoin, and in that kind of tape a small coin with a delisting notice bleeds alone — there is no alt bid coming to rescue PUMPBTC.
This coin has already shown how it behaves under stress. On September 10 it dropped 11% in hours for no reason of its own, simply because Bitcoin slid toward 78,000 on macro fear. High beta, thin books, and now a deadline on top.
The room is positioned for a dead-cat bounce into settlement, and they might get one — forced covers can squeeze price for a day. But they're wrong about why it would move, and confusing a funeral procession for a rally is how accounts get carried out with the casket.
I once held a delisted contract all the way to settlement, telling myself the bounce had to come first. It didn't. I ate the settlement print, watched the ticker vanish from my screen, and learned the hard way that a clock beats a chart every single time, no matter how good the setup looks.
Three days. That's all the $PUMPBTC contract has left. After that the chart stops being a chart and becomes a footnote in Binance's archive, and every level I marked tonight means nothing at all.
So when the exchange announces your coin's funeral date, are you trading the bounce — or are you respecting the clock?
29
·
--
𝗙𝗮𝗺 𝗧𝗵𝗲 𝗵𝗶𝗴𝗵 𝘄𝗮𝘀 𝘁𝗵𝗲 𝘁𝗿𝗮𝗽. 𝗡𝗼𝘁 𝘁𝗵𝗲 𝗹𝗼𝘄
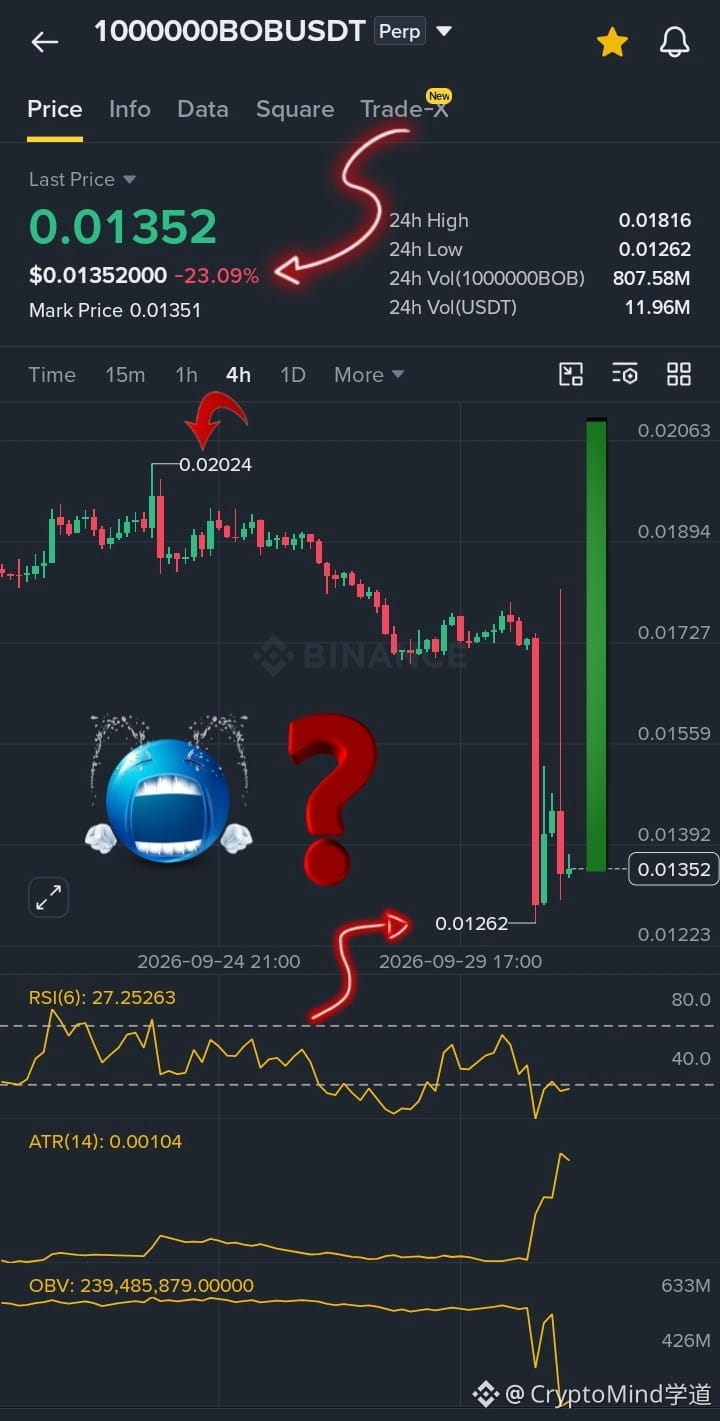
They pushed it to 0.02024 and called it strength. $1000000BOB gave it all back to 0.01262. RSI sits at 27.25 after the flush. I've been here before: when everyone leans in near the top, $1000000BOB makes the exit thin.
Which side is getting too comfortable?
{future}(1000000BOBUSDT)
𝗙𝗮𝗺 𝗧𝗵𝗲 𝗵𝗶𝗴𝗵 𝘄𝗮𝘀 𝘁𝗵𝗲 𝘁𝗿𝗮𝗽. 𝗡𝗼𝘁 𝘁𝗵𝗲 𝗹𝗼𝘄
They pushed it to 0.02024 and called it strength. $1000000BOB gave it all back to 0.01262. RSI sits at 27.25 after the flush. I've been here before: when everyone leans in near the top, $1000000BOB makes the exit thin.
Which side is getting too comfortable?
They pushed it to 0.02024 and called it strength. $1000000BOB gave it all back to 0.01262. RSI sits at 27.25 after the flush. I've been here before: when everyone leans in near the top, $1000000BOB makes the exit thin.
Which side is getting too comfortable?
46
·
--
Haussier
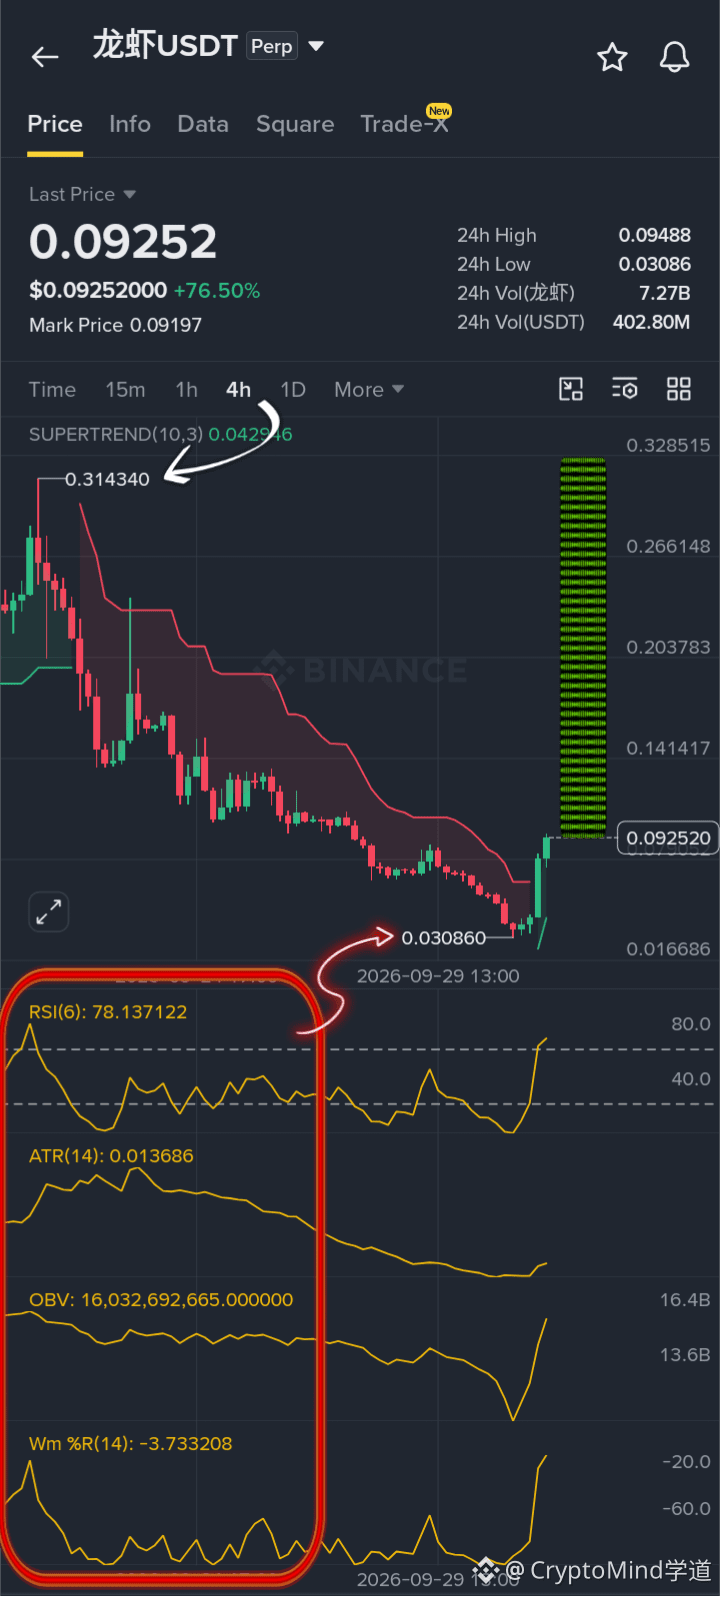
$龙虾 just went parabolic with a +76% candle. RSI is overbought at 78 and price is far above the SuperTrend baseline.
Not chasing this spike. Waiting for a pullback to see if it can hold a higher low.
Entry: 0.082 - 0.086
TP1: 0.095
TP2: 0.105
TP3: 0.120
SL: 0.068
Leverage: 10x-20x
{future}(龙虾USDT)
Taking partials at TP1, moving stop to breakeven, letting the rest run
The move from 0.030 to 0.094 is a vertical pump. OBV shows real volume, but the RSI indicates the move is stretched. I want to see price defend the 0.082 zone before entering. If 0.068 breaks, the momentum is gone and I stay out
Invalidated on a 4h close below 0.068
Are you fading this massive green candle or waiting for the dip?
$龙虾 just went parabolic with a +76% candle. RSI is overbought at 78 and price is far above the SuperTrend baseline.
Not chasing this spike. Waiting for a pullback to see if it can hold a higher low.
Entry: 0.082 - 0.086
TP1: 0.095
TP2: 0.105
TP3: 0.120
SL: 0.068
Leverage: 10x-20x
Taking partials at TP1, moving stop to breakeven, letting the rest run
The move from 0.030 to 0.094 is a vertical pump. OBV shows real volume, but the RSI indicates the move is stretched. I want to see price defend the 0.082 zone before entering. If 0.068 breaks, the momentum is gone and I stay out
Invalidated on a 4h close below 0.068
Are you fading this massive green candle or waiting for the dip?
Not chasing this spike. Waiting for a pullback to see if it can hold a higher low.
Entry: 0.082 - 0.086
TP1: 0.095
TP2: 0.105
TP3: 0.120
SL: 0.068
Leverage: 10x-20x
Taking partials at TP1, moving stop to breakeven, letting the rest run
The move from 0.030 to 0.094 is a vertical pump. OBV shows real volume, but the RSI indicates the move is stretched. I want to see price defend the 0.082 zone before entering. If 0.068 breaks, the momentum is gone and I stay out
Invalidated on a 4h close below 0.068
Are you fading this massive green candle or waiting for the dip?
169
·
--
𝗢𝗻𝗹𝘆 𝗴𝗼𝘁 𝗼𝗻𝗲 𝗵𝗼𝘂𝗿 𝗳𝗼𝗿 𝘁𝗵𝗶𝘀 𝘀𝗲𝘁𝘂𝗽 ⏳
Vote fast, my timer's already running...
$龙虾 just ripped from 0.03 to 0.09 in a day. That's a 3x move on the 4H and RSI is sitting at 78. Funding is +0.09%, so longs are getting squeezed. I've been exit liquidity on these vertical candles before. It's hot. Don't wanna hold the bag if it reverses.
Are you buying this top or fading it?
{future}(龙虾USDT)
𝗢𝗻𝗹𝘆 𝗴𝗼𝘁 𝗼𝗻𝗲 𝗵𝗼𝘂𝗿 𝗳𝗼𝗿 𝘁𝗵𝗶𝘀 𝘀𝗲𝘁𝘂𝗽 ⏳
Vote fast, my timer's already running...
$龙虾 just ripped from 0.03 to 0.09 in a day. That's a 3x move on the 4H and RSI is sitting at 78. Funding is +0.09%, so longs are getting squeezed. I've been exit liquidity on these vertical candles before. It's hot. Don't wanna hold the bag if it reverses.
Are you buying this top or fading it?
Vote fast, my timer's already running...
$龙虾 just ripped from 0.03 to 0.09 in a day. That's a 3x move on the 4H and RSI is sitting at 78. Funding is +0.09%, so longs are getting squeezed. I've been exit liquidity on these vertical candles before. It's hot. Don't wanna hold the bag if it reverses.
Are you buying this top or fading it?
🔘 Buy the 0.095 breakout
40%
🔘 Short the 0.099 wick
0%
🔘 Wait for 0.07 retest
60%
5 Votes • Vote fermé
383
·
--
Haussier
0.030 𝙛𝙡𝙪𝙨𝙝, 𝙑-𝙧𝙚𝙘𝙤𝙫𝙚𝙧𝙮 𝙞𝙨 𝙝𝙚𝙧𝙚 𝙣𝙤𝙬 🧐
🟢 Long $龙虾
🚪 Entry 0.09324
💰 Targets 0.09424, 0.14141
🛑 Stop 0.08500
Trade here 👇🏽
{future}(龙虾USDT)
Late shorts completely liquidated on the bounce. Spot bids absorbed the panic. Buying this V-recovery imbalance. 🧲
Fading this or joining the squeeze? 🐋
0.030 𝙛𝙡𝙪𝙨𝙝, 𝙑-𝙧𝙚𝙘𝙤𝙫𝙚𝙧𝙮 𝙞𝙨 𝙝𝙚𝙧𝙚 𝙣𝙤𝙬 🧐
🟢 Long $龙虾
🚪 Entry 0.09324
💰 Targets 0.09424, 0.14141
🛑 Stop 0.08500
Trade here 👇🏽
Late shorts completely liquidated on the bounce. Spot bids absorbed the panic. Buying this V-recovery imbalance. 🧲
Fading this or joining the squeeze? 🐋
🟢 Long $龙虾
🚪 Entry 0.09324
💰 Targets 0.09424, 0.14141
🛑 Stop 0.08500
Trade here 👇🏽
Late shorts completely liquidated on the bounce. Spot bids absorbed the panic. Buying this V-recovery imbalance. 🧲
Fading this or joining the squeeze? 🐋

166
·
--

Article
Chasing Green Candles Is How You Give It All BackThree charts on the screen. Three different energies. The first one caught my eye because of a number: 101.66. A high that got sold, and a 1.44% gain on the day that looks like a recovery, not a breakout.
The second chart is the one that made me pause. A 20% candle with an RSI at 89. That's not a drift. That's a decision. The third one is the quietest of the three, but the RSI at 77 says the move is already underway.
$CL is the first one. The funding is negative at -0.0099%. That means shorts are paying longs. On a chart that's been beaten down from 101 to 88, that's the fuel for a squeeze. Open interest sits around $30 million on Binance, and the SuperTrend line at 93.86 is the wall.
The level that matters is $93.86. A clean break above it and the door opens toward $96. Below $88.57 and the bid thins out.
Above $93.86 and I'm watching $96 first, then $99. Lose $88.57 and I'm done. I've held a losing short too long before, watching a small gain turn into a margin call because I believed the trend more than the tape.
{future}(CLUSDT)
$ACN is the second chart. The headline is the Binance listing on September 29. A TradFi perpetual with up to 20x leverage. That's the catalyst. The tape reflects it with a 20% move and volume that's already 115.9% above average.
Funding is positive at 0.0100%. Longs are paying shorts. Open interest is climbing. The SuperTrend at 191.38 is the floor. The level that matters is $219.49. That's the recent high. A clean break above it opens the door toward $240.
Above $219.49 and I'm watching $240 first, then $260. Lose $177.42 and I'm out.
{future}(ACNUSDT)
$NOW is the third chart. The tape is quiet but the RSI at 77 tells a story. The move from 127 to 138 happened fast, and the SuperTrend at 132.82 is now the floor. Funding is near zero on most venues, which means the crowd isn't leaning either way.
Open interest sits around $1.3 million on MEXC. Thin, but climbing. The level that matters is $147.78. That's the recent high. A clean break above it opens the door toward $155.
Above $147.78 and I'm watching $155 first, then $165. Lose $127.06 and I'm out.
{future}(NOWUSDT)
The wider market matters here. Bitcoin is holding near $84,000 after tapping $87,000. Dominance slipped to 58.6% as of October 1, down 1.11%. That's the spine of this whole trade.
When dominance falls while the aggregate cap rises, the marginal dollar is moving down the risk curve. The Altcoin Season Index is at 64 out of 100. Still below the 75 threshold that confirms a full rotation, but the direction is clear.
Open interest in perpetual futures across crypto is elevated. The crowd is leaning into these TradFi listings and the oil play. Where I could be wrong is if Bitcoin dominance reclaims 60% and the rotation stalls. Then the late longs get paid and these breakouts fail.
I've been on the wrong side of a "confirmed breakout" before. The chart looked perfect, every box checked, and then the bid vanished. That's why I don't trust a wick at the high.
The levels are the levels. The tape will tell you which ones matter.
How much of this rotation did you actually catch, and how much did you watch from the sidelines?
Chasing Green Candles Is How You Give It All Back
Three charts on the screen. Three different energies. The first one caught my eye because of a number: 101.66. A high that got sold, and a 1.44% gain on the day that looks like a recovery, not a breakout.
The second chart is the one that made me pause. A 20% candle with an RSI at 89. That's not a drift. That's a decision. The third one is the quietest of the three, but the RSI at 77 says the move is already underway.
$CL is the first one. The funding is negative at -0.0099%. That means shorts are paying longs. On a chart that's been beaten down from 101 to 88, that's the fuel for a squeeze. Open interest sits around $30 million on Binance, and the SuperTrend line at 93.86 is the wall.
The level that matters is $93.86. A clean break above it and the door opens toward $96. Below $88.57 and the bid thins out.
Above $93.86 and I'm watching $96 first, then $99. Lose $88.57 and I'm done. I've held a losing short too long before, watching a small gain turn into a margin call because I believed the trend more than the tape.
$ACN is the second chart. The headline is the Binance listing on September 29. A TradFi perpetual with up to 20x leverage. That's the catalyst. The tape reflects it with a 20% move and volume that's already 115.9% above average.
Funding is positive at 0.0100%. Longs are paying shorts. Open interest is climbing. The SuperTrend at 191.38 is the floor. The level that matters is $219.49. That's the recent high. A clean break above it opens the door toward $240.
Above $219.49 and I'm watching $240 first, then $260. Lose $177.42 and I'm out.
$NOW is the third chart. The tape is quiet but the RSI at 77 tells a story. The move from 127 to 138 happened fast, and the SuperTrend at 132.82 is now the floor. Funding is near zero on most venues, which means the crowd isn't leaning either way.
Open interest sits around $1.3 million on MEXC. Thin, but climbing. The level that matters is $147.78. That's the recent high. A clean break above it opens the door toward $155.
Above $147.78 and I'm watching $155 first, then $165. Lose $127.06 and I'm out.
The wider market matters here. Bitcoin is holding near $84,000 after tapping $87,000. Dominance slipped to 58.6% as of October 1, down 1.11%. That's the spine of this whole trade.
When dominance falls while the aggregate cap rises, the marginal dollar is moving down the risk curve. The Altcoin Season Index is at 64 out of 100. Still below the 75 threshold that confirms a full rotation, but the direction is clear.
Open interest in perpetual futures across crypto is elevated. The crowd is leaning into these TradFi listings and the oil play. Where I could be wrong is if Bitcoin dominance reclaims 60% and the rotation stalls. Then the late longs get paid and these breakouts fail.
I've been on the wrong side of a "confirmed breakout" before. The chart looked perfect, every box checked, and then the bid vanished. That's why I don't trust a wick at the high.
The levels are the levels. The tape will tell you which ones matter.
How much of this rotation did you actually catch, and how much did you watch from the sidelines?
The second chart is the one that made me pause. A 20% candle with an RSI at 89. That's not a drift. That's a decision. The third one is the quietest of the three, but the RSI at 77 says the move is already underway.
$CL is the first one. The funding is negative at -0.0099%. That means shorts are paying longs. On a chart that's been beaten down from 101 to 88, that's the fuel for a squeeze. Open interest sits around $30 million on Binance, and the SuperTrend line at 93.86 is the wall.
The level that matters is $93.86. A clean break above it and the door opens toward $96. Below $88.57 and the bid thins out.
Above $93.86 and I'm watching $96 first, then $99. Lose $88.57 and I'm done. I've held a losing short too long before, watching a small gain turn into a margin call because I believed the trend more than the tape.
$ACN is the second chart. The headline is the Binance listing on September 29. A TradFi perpetual with up to 20x leverage. That's the catalyst. The tape reflects it with a 20% move and volume that's already 115.9% above average.
Funding is positive at 0.0100%. Longs are paying shorts. Open interest is climbing. The SuperTrend at 191.38 is the floor. The level that matters is $219.49. That's the recent high. A clean break above it opens the door toward $240.
Above $219.49 and I'm watching $240 first, then $260. Lose $177.42 and I'm out.
$NOW is the third chart. The tape is quiet but the RSI at 77 tells a story. The move from 127 to 138 happened fast, and the SuperTrend at 132.82 is now the floor. Funding is near zero on most venues, which means the crowd isn't leaning either way.
Open interest sits around $1.3 million on MEXC. Thin, but climbing. The level that matters is $147.78. That's the recent high. A clean break above it opens the door toward $155.
Above $147.78 and I'm watching $155 first, then $165. Lose $127.06 and I'm out.
The wider market matters here. Bitcoin is holding near $84,000 after tapping $87,000. Dominance slipped to 58.6% as of October 1, down 1.11%. That's the spine of this whole trade.
When dominance falls while the aggregate cap rises, the marginal dollar is moving down the risk curve. The Altcoin Season Index is at 64 out of 100. Still below the 75 threshold that confirms a full rotation, but the direction is clear.
Open interest in perpetual futures across crypto is elevated. The crowd is leaning into these TradFi listings and the oil play. Where I could be wrong is if Bitcoin dominance reclaims 60% and the rotation stalls. Then the late longs get paid and these breakouts fail.
I've been on the wrong side of a "confirmed breakout" before. The chart looked perfect, every box checked, and then the bid vanished. That's why I don't trust a wick at the high.
The levels are the levels. The tape will tell you which ones matter.
How much of this rotation did you actually catch, and how much did you watch from the sidelines?
41
·
--
𝙏𝙧𝙖𝙙𝙚 𝙎𝙢𝙖𝙧𝙩, 𝙎𝙩𝙖𝙮 𝙎𝙖𝙛𝙚! 🛑🔐
While tracking charts and managing setups is key, keeping our trading environment secure is just as critical.
During high-volatility market cycles, scam links and phishing attempts often spike. Here are 3 essential rules to protect your capital and account:
1️⃣ Verify All Links: Never click on unverified links claiming to offer "Free USDT" or giveaways—many are disguised payment requests.
2️⃣ Stay On-Platform: Avoid off-platform deals or sharing private contact details like WhatsApp or Telegram.
3️⃣ Prioritize Capital Protection: Focus on disciplined risk management rather than looking for shortcuts.
Binance Square is a place for us to learn, share real insights, and grow together. Keeping it safe and clean is our shared responsibility! 🚀
What is your #1 golden rule for staying safe in crypto? Drop your thoughts below! 👇
$MU $SOL $BTC
#BinanceSquare #CryptoSafety #StaySafe
𝙏𝙧𝙖𝙙𝙚 𝙎𝙢𝙖𝙧𝙩, 𝙎𝙩𝙖𝙮 𝙎𝙖𝙛𝙚! 🛑🔐
While tracking charts and managing setups is key, keeping our trading environment secure is just as critical.
During high-volatility market cycles, scam links and phishing attempts often spike. Here are 3 essential rules to protect your capital and account:
1️⃣ Verify All Links: Never click on unverified links claiming to offer "Free USDT" or giveaways—many are disguised payment requests.
2️⃣ Stay On-Platform: Avoid off-platform deals or sharing private contact details like WhatsApp or Telegram.
3️⃣ Prioritize Capital Protection: Focus on disciplined risk management rather than looking for shortcuts.
Binance Square is a place for us to learn, share real insights, and grow together. Keeping it safe and clean is our shared responsibility! 🚀
What is your #1 golden rule for staying safe in crypto? Drop your thoughts below! 👇
$MU $SOL $BTC
#BinanceSquare #CryptoSafety #StaySafe
While tracking charts and managing setups is key, keeping our trading environment secure is just as critical.
During high-volatility market cycles, scam links and phishing attempts often spike. Here are 3 essential rules to protect your capital and account:
1️⃣ Verify All Links: Never click on unverified links claiming to offer "Free USDT" or giveaways—many are disguised payment requests.
2️⃣ Stay On-Platform: Avoid off-platform deals or sharing private contact details like WhatsApp or Telegram.
3️⃣ Prioritize Capital Protection: Focus on disciplined risk management rather than looking for shortcuts.
Binance Square is a place for us to learn, share real insights, and grow together. Keeping it safe and clean is our shared responsibility! 🚀
What is your #1 golden rule for staying safe in crypto? Drop your thoughts below! 👇
$MU $SOL $BTC
#BinanceSquare #CryptoSafety #StaySafe

26
·
--
🚨 𝙎𝙖𝙛𝙚𝙩𝙮 𝙁𝙞𝙧𝙨𝙩! 𝘽𝙞𝙣𝙖𝙣𝙘𝙚 𝙎𝙦𝙪𝙖𝙧𝙚 𝘾𝙤𝙢𝙢𝙪𝙣𝙞𝙩𝙮 𝘼𝙡𝙚𝙧𝙩 🚨
Security and safety should always be our top priority while navigating the crypto space. Thanks to Binance Square Official for keeping the community informed and taking strict enforcement actions against policy violations!
Quick Reminders for Everyone:
1️⃣ Never click on suspicious third-party links claiming to offer "Free USDT" or giveaways—many of these are disguised payment requests.
2️⃣ Stay cautious of off-platform redirection and unverified sellers.
3️⃣ Always verify information before interacting with any external links.
Let’s keep our community safe, clean, and educational! 🔐✨
#BinanceSquare #CryptoSafety #StaySafe
🚨 𝙎𝙖𝙛𝙚𝙩𝙮 𝙁𝙞𝙧𝙨𝙩! 𝘽𝙞𝙣𝙖𝙣𝙘𝙚 𝙎𝙦𝙪𝙖𝙧𝙚 𝘾𝙤𝙢𝙢𝙪𝙣𝙞𝙩𝙮 𝘼𝙡𝙚𝙧𝙩 🚨
Security and safety should always be our top priority while navigating the crypto space. Thanks to Binance Square Official for keeping the community informed and taking strict enforcement actions against policy violations!
Quick Reminders for Everyone:
1️⃣ Never click on suspicious third-party links claiming to offer "Free USDT" or giveaways—many of these are disguised payment requests.
2️⃣ Stay cautious of off-platform redirection and unverified sellers.
3️⃣ Always verify information before interacting with any external links.
Let’s keep our community safe, clean, and educational! 🔐✨
#BinanceSquare #CryptoSafety #StaySafe
Security and safety should always be our top priority while navigating the crypto space. Thanks to Binance Square Official for keeping the community informed and taking strict enforcement actions against policy violations!
Quick Reminders for Everyone:
1️⃣ Never click on suspicious third-party links claiming to offer "Free USDT" or giveaways—many of these are disguised payment requests.
2️⃣ Stay cautious of off-platform redirection and unverified sellers.
3️⃣ Always verify information before interacting with any external links.
Let’s keep our community safe, clean, and educational! 🔐✨
#BinanceSquare #CryptoSafety #StaySafe


Binance Square Official
·
--
Safety Alert and Enforcement Update | Sep 14–27, 2026
We’ve highlighted key violations identified over the last two weeks. Stay alert to protect your funds and personal information.
1. Using fake giveaway links to mislead users
Some accounts may disguise payment links as giveaway links. Always verify links before opening them to avoid potential financial loss.
2. Promoting products and redirecting users to third-party channels
Product quality, payment security, and delivery cannot be guaranteed on unverified third-party channels. Do not transfer funds or share personal information with unknown sellers.
We have taken enforcement action against the accounts involved.
If you see suspicious content, please report it. Use the reporting option in the upper-right corner of the content to flag off-platform redirection, false or misleading claims, fraud, solicitation, or repeated spam. We will review reports and take appropriate action.
Thank you for helping us keep Binance Square safe and trustworthy. For questions about publishing rules, comment moderation, or enforcement appeals, please refer to the Community Guidelines or contact Customer Support.
1. Using fake giveaway links to mislead users
Some accounts may disguise payment links as giveaway links. Always verify links before opening them to avoid potential financial loss.
2. Promoting products and redirecting users to third-party channels
Product quality, payment security, and delivery cannot be guaranteed on unverified third-party channels. Do not transfer funds or share personal information with unknown sellers.
We have taken enforcement action against the accounts involved.
If you see suspicious content, please report it. Use the reporting option in the upper-right corner of the content to flag off-platform redirection, false or misleading claims, fraud, solicitation, or repeated spam. We will review reports and take appropriate action.
Thank you for helping us keep Binance Square safe and trustworthy. For questions about publishing rules, comment moderation, or enforcement appeals, please refer to the Community Guidelines or contact Customer Support.
32
·
--
𝙄'𝙙 𝙧𝙖𝙩𝙝𝙚𝙧 𝙢𝙞𝙨𝙨 𝙖 𝙗𝙤𝙪𝙣𝙘𝙚 𝙩𝙝𝙖𝙣 𝙘𝙝𝙖𝙨𝙚 🔥
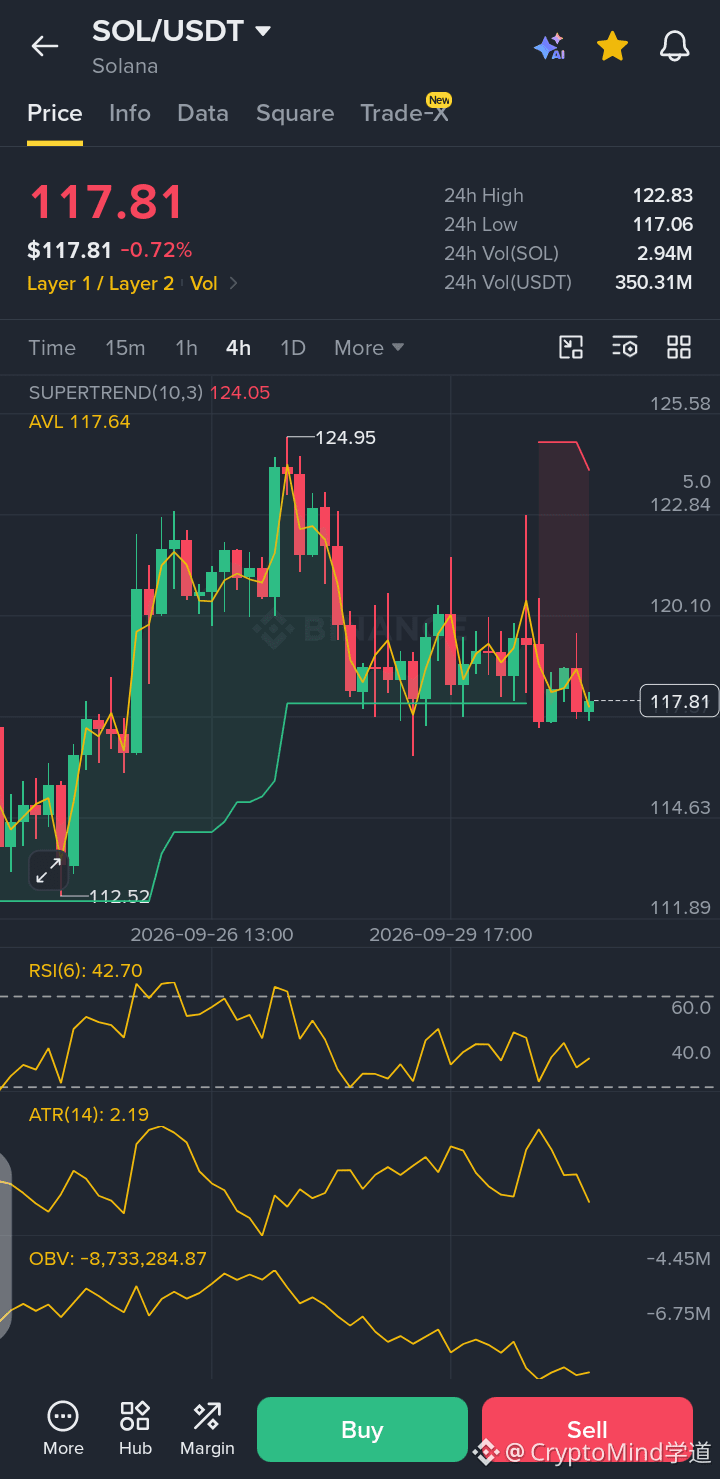
I've held $SOL through worse drawdowns than this. We peaked at 124.95 and now it's just drifting near 117.81. Boring price action, but that's how bases get built
Buy Zone: 115.00 - 117.50
TP1: 124.50
TP2: 132.00
Invalidation: 112.00
Spot is a waiting game, so I'm in no rush to add to $SOL 🐂
Are you bidding this range or waiting for a lower entry? Follow for elite spot setups. DYOR
{spot}(SOLUSDT)
𝙄'𝙙 𝙧𝙖𝙩𝙝𝙚𝙧 𝙢𝙞𝙨𝙨 𝙖 𝙗𝙤𝙪𝙣𝙘𝙚 𝙩𝙝𝙖𝙣 𝙘𝙝𝙖𝙨𝙚 🔥
I've held $SOL through worse drawdowns than this. We peaked at 124.95 and now it's just drifting near 117.81. Boring price action, but that's how bases get built
Buy Zone: 115.00 - 117.50
TP1: 124.50
TP2: 132.00
Invalidation: 112.00
Spot is a waiting game, so I'm in no rush to add to $SOL 🐂
Are you bidding this range or waiting for a lower entry? Follow for elite spot setups. DYOR
I've held $SOL through worse drawdowns than this. We peaked at 124.95 and now it's just drifting near 117.81. Boring price action, but that's how bases get built
Buy Zone: 115.00 - 117.50
TP1: 124.50
TP2: 132.00
Invalidation: 112.00
Spot is a waiting game, so I'm in no rush to add to $SOL 🐂
Are you bidding this range or waiting for a lower entry? Follow for elite spot setups. DYOR
63
·
--
Haussier
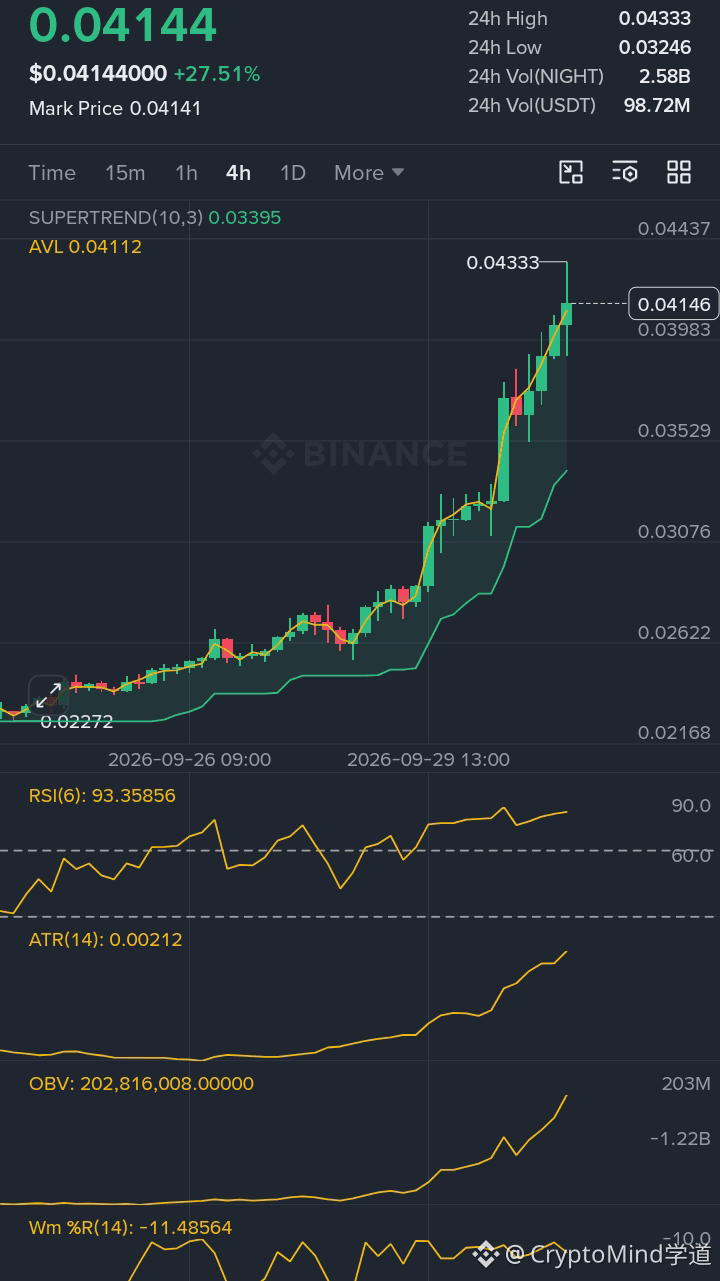
𝙏𝙤𝙥 𝙄𝙨 𝙉𝙚𝙖𝙧 ❔
🟢 Long $NIGHT
🚪 Entry 0.04144
💰 Targets 0.04437, 0.04500
🛑 Stop 0.03983
Up 27% in 24h. Price is grinding at the top of a vertical move, RSI screaming overbought. 🧗
Are you fading this or joining? 🤔
{future}(NIGHTUSDT)
𝙏𝙤𝙥 𝙄𝙨 𝙉𝙚𝙖𝙧 ❔
🟢 Long $NIGHT
🚪 Entry 0.04144
💰 Targets 0.04437, 0.04500
🛑 Stop 0.03983
Up 27% in 24h. Price is grinding at the top of a vertical move, RSI screaming overbought. 🧗
Are you fading this or joining? 🤔
🟢 Long $NIGHT
🚪 Entry 0.04144
💰 Targets 0.04437, 0.04500
🛑 Stop 0.03983
Up 27% in 24h. Price is grinding at the top of a vertical move, RSI screaming overbought. 🧗
Are you fading this or joining? 🤔
65
·
--
Article
The One That Got Away Because I Waited Too LongI missed a trade last year that still eats at me. Not because I was wrong. Because I was right and did nothing. I had been watching a coin for weeks. I knew the catalyst. I knew the levels. I told myself I'd wait for a pullback to get a better entry. The pullback came, but it was shallow. I hesitated. Then it ripped without me. I sat there watching the chart go vertical, telling myself I'd catch the next one. There was no next one. That's the thing about this game. The setups that matter don't wait for you to feel comfortable. They just go.
I'm staring at the $STX chart right now and I'm feeling that same tension. Not the tension of a bad setup. The tension of a good setup that's already moving. STX is up 26% today. It's trading around $0.39. The RSI is sitting at 92. That's not just overbought. That's the kind of number that makes you want to close your laptop and walk away. But here's the thing. Overbought can stay overbought longer than you can stay solvent if you short it. And on the flip side, chasing a 26% candle is how you become exit liquidity for someone who bought three days ago.
The story behind the move is real. Muneeb Ali, the founder of Stacks, just returned as CEO of Stacks Labs. The announcement came on September 30, and it formalized a role he'd been taking on anyway. The Genesis Bond opened on September 10, letting institutions stake BTC on the Bitcoin L1 and earn yield. Weekly BTC rewards have been paying out since September 17. Anchorage Digital announced custody support on September 24. HashKey Cloud became an sBTC signer. 21Shares is involved. This isn't a meme pump. This is a narrative with institutional legs. The Bitcoin staking story is getting real, and Stacks is the main way to play it.
But here's where I have to be honest with myself. I've seen this exact pattern before. A token runs hard on a real catalyst, the crowd piles in, and then the people who bought the rumor sell the news. The RSI hitting 92 is a warning. The funding rate is positive, which means longs are paying shorts. That's a sign of overcrowding. The fear and greed index is at 74, which is greed territory. When everyone is leaning the same way, the easy money has already been made.
I'm not saying the move is over. I'm saying the easy part is over. The rest requires patience and a plan. I've been the guy who chased a 26% candle and watched it give back half the move in two days. I've also been the guy who waited for a pullback that never came and missed the whole thing. Both feel terrible. The difference is that one is recoverable and the other isn't.
The broader market is in a tricky spot. Bitcoin is stuck near $83,000. It couldn't hold $87,000 last week. The key support zone is $82,900 to $83,000, and as long as it holds, the uptrend is intact with room toward $88,600. If it breaks, the next levels are $81,600 and then the 50-week average near $78,700. That's the backdrop. It's not bearish, but it's not clean either. Bitcoin is deciding, and when Bitcoin decides, altcoins follow. ETH is testing support around $2,640 to $2,660. A break below that opens the door to $2,600, and a reclaim of $2,750 to $2,800 would open the path to $3,000.
The lesson that cost me the most was learning that timing is everything. Being right about the direction means nothing if you're wrong about the entry. A good setup at a bad price is a bad trade. A bad setup at a good price is still a bad trade. The only thing that matters is whether the risk-to-reward makes sense right now. And right now, chasing STX at $0.39 with an RSI of 92 doesn't make sense. Waiting for a pullback to $0.37 or $0.36 does.
{future}(STXUSDT)
So what do I do with this? I wait. I watch the $0.36 level like a hawk. That's the area that held during the accumulation phase before the breakout. If STX pulls back and holds above $0.36, I'll look for a move back toward $0.40 first, and then $0.44 if the volume comes back. If it loses $0.36 on a daily close, I'm gone. No hesitation. The next stop would be $0.33 and then $0.29. Size would be small. A third of what I'd normally take. I've been wrong before, and I'll be wrong again. The goal isn't to be right. It's to survive long enough to be right when it matters.
For $BTC I'm watching $82,900. If it holds, I'm looking for a move back to $85,000 and then $88,600. If it loses $82,900 on a close, I'm out. The next stop is $81,600.
For $ETH I'm watching $2,640. If it holds, I'm looking for a reclaim of $2,750 and then $3,000. If it loses $2,640, I'm out. The next stop is $2,600.
The hardest part of this game isn't reading the chart. It's managing the voice in your head that tells you you're missing out. That voice has cost me more money than any bad trade ever did. It's the same voice that's telling people right now that STX is about to run forever. Maybe it is. But I've seen enough vertical candles turn into waterfalls to know that chasing is a losing game.
So here's my question for you. When you look at this chart, are you seeing a setup, or are you seeing a reason to click? And if you chase this and it turns, will you be able to admit you were wrong before it costs you everything?
The One That Got Away Because I Waited Too Long
I missed a trade last year that still eats at me. Not because I was wrong. Because I was right and did nothing. I had been watching a coin for weeks. I knew the catalyst. I knew the levels. I told myself I'd wait for a pullback to get a better entry. The pullback came, but it was shallow. I hesitated. Then it ripped without me. I sat there watching the chart go vertical, telling myself I'd catch the next one. There was no next one. That's the thing about this game. The setups that matter don't wait for you to feel comfortable. They just go.
I'm staring at the $STX chart right now and I'm feeling that same tension. Not the tension of a bad setup. The tension of a good setup that's already moving. STX is up 26% today. It's trading around $0.39. The RSI is sitting at 92. That's not just overbought. That's the kind of number that makes you want to close your laptop and walk away. But here's the thing. Overbought can stay overbought longer than you can stay solvent if you short it. And on the flip side, chasing a 26% candle is how you become exit liquidity for someone who bought three days ago.
The story behind the move is real. Muneeb Ali, the founder of Stacks, just returned as CEO of Stacks Labs. The announcement came on September 30, and it formalized a role he'd been taking on anyway. The Genesis Bond opened on September 10, letting institutions stake BTC on the Bitcoin L1 and earn yield. Weekly BTC rewards have been paying out since September 17. Anchorage Digital announced custody support on September 24. HashKey Cloud became an sBTC signer. 21Shares is involved. This isn't a meme pump. This is a narrative with institutional legs. The Bitcoin staking story is getting real, and Stacks is the main way to play it.
But here's where I have to be honest with myself. I've seen this exact pattern before. A token runs hard on a real catalyst, the crowd piles in, and then the people who bought the rumor sell the news. The RSI hitting 92 is a warning. The funding rate is positive, which means longs are paying shorts. That's a sign of overcrowding. The fear and greed index is at 74, which is greed territory. When everyone is leaning the same way, the easy money has already been made.
I'm not saying the move is over. I'm saying the easy part is over. The rest requires patience and a plan. I've been the guy who chased a 26% candle and watched it give back half the move in two days. I've also been the guy who waited for a pullback that never came and missed the whole thing. Both feel terrible. The difference is that one is recoverable and the other isn't.
The broader market is in a tricky spot. Bitcoin is stuck near $83,000. It couldn't hold $87,000 last week. The key support zone is $82,900 to $83,000, and as long as it holds, the uptrend is intact with room toward $88,600. If it breaks, the next levels are $81,600 and then the 50-week average near $78,700. That's the backdrop. It's not bearish, but it's not clean either. Bitcoin is deciding, and when Bitcoin decides, altcoins follow. ETH is testing support around $2,640 to $2,660. A break below that opens the door to $2,600, and a reclaim of $2,750 to $2,800 would open the path to $3,000.
The lesson that cost me the most was learning that timing is everything. Being right about the direction means nothing if you're wrong about the entry. A good setup at a bad price is a bad trade. A bad setup at a good price is still a bad trade. The only thing that matters is whether the risk-to-reward makes sense right now. And right now, chasing STX at $0.39 with an RSI of 92 doesn't make sense. Waiting for a pullback to $0.37 or $0.36 does.
So what do I do with this? I wait. I watch the $0.36 level like a hawk. That's the area that held during the accumulation phase before the breakout. If STX pulls back and holds above $0.36, I'll look for a move back toward $0.40 first, and then $0.44 if the volume comes back. If it loses $0.36 on a daily close, I'm gone. No hesitation. The next stop would be $0.33 and then $0.29. Size would be small. A third of what I'd normally take. I've been wrong before, and I'll be wrong again. The goal isn't to be right. It's to survive long enough to be right when it matters.
For $BTC I'm watching $82,900. If it holds, I'm looking for a move back to $85,000 and then $88,600. If it loses $82,900 on a close, I'm out. The next stop is $81,600.
For $ETH I'm watching $2,640. If it holds, I'm looking for a reclaim of $2,750 and then $3,000. If it loses $2,640, I'm out. The next stop is $2,600.
The hardest part of this game isn't reading the chart. It's managing the voice in your head that tells you you're missing out. That voice has cost me more money than any bad trade ever did. It's the same voice that's telling people right now that STX is about to run forever. Maybe it is. But I've seen enough vertical candles turn into waterfalls to know that chasing is a losing game.
So here's my question for you. When you look at this chart, are you seeing a setup, or are you seeing a reason to click? And if you chase this and it turns, will you be able to admit you were wrong before it costs you everything?
I'm staring at the $STX chart right now and I'm feeling that same tension. Not the tension of a bad setup. The tension of a good setup that's already moving. STX is up 26% today. It's trading around $0.39. The RSI is sitting at 92. That's not just overbought. That's the kind of number that makes you want to close your laptop and walk away. But here's the thing. Overbought can stay overbought longer than you can stay solvent if you short it. And on the flip side, chasing a 26% candle is how you become exit liquidity for someone who bought three days ago.
The story behind the move is real. Muneeb Ali, the founder of Stacks, just returned as CEO of Stacks Labs. The announcement came on September 30, and it formalized a role he'd been taking on anyway. The Genesis Bond opened on September 10, letting institutions stake BTC on the Bitcoin L1 and earn yield. Weekly BTC rewards have been paying out since September 17. Anchorage Digital announced custody support on September 24. HashKey Cloud became an sBTC signer. 21Shares is involved. This isn't a meme pump. This is a narrative with institutional legs. The Bitcoin staking story is getting real, and Stacks is the main way to play it.
But here's where I have to be honest with myself. I've seen this exact pattern before. A token runs hard on a real catalyst, the crowd piles in, and then the people who bought the rumor sell the news. The RSI hitting 92 is a warning. The funding rate is positive, which means longs are paying shorts. That's a sign of overcrowding. The fear and greed index is at 74, which is greed territory. When everyone is leaning the same way, the easy money has already been made.
I'm not saying the move is over. I'm saying the easy part is over. The rest requires patience and a plan. I've been the guy who chased a 26% candle and watched it give back half the move in two days. I've also been the guy who waited for a pullback that never came and missed the whole thing. Both feel terrible. The difference is that one is recoverable and the other isn't.
The broader market is in a tricky spot. Bitcoin is stuck near $83,000. It couldn't hold $87,000 last week. The key support zone is $82,900 to $83,000, and as long as it holds, the uptrend is intact with room toward $88,600. If it breaks, the next levels are $81,600 and then the 50-week average near $78,700. That's the backdrop. It's not bearish, but it's not clean either. Bitcoin is deciding, and when Bitcoin decides, altcoins follow. ETH is testing support around $2,640 to $2,660. A break below that opens the door to $2,600, and a reclaim of $2,750 to $2,800 would open the path to $3,000.
The lesson that cost me the most was learning that timing is everything. Being right about the direction means nothing if you're wrong about the entry. A good setup at a bad price is a bad trade. A bad setup at a good price is still a bad trade. The only thing that matters is whether the risk-to-reward makes sense right now. And right now, chasing STX at $0.39 with an RSI of 92 doesn't make sense. Waiting for a pullback to $0.37 or $0.36 does.
So what do I do with this? I wait. I watch the $0.36 level like a hawk. That's the area that held during the accumulation phase before the breakout. If STX pulls back and holds above $0.36, I'll look for a move back toward $0.40 first, and then $0.44 if the volume comes back. If it loses $0.36 on a daily close, I'm gone. No hesitation. The next stop would be $0.33 and then $0.29. Size would be small. A third of what I'd normally take. I've been wrong before, and I'll be wrong again. The goal isn't to be right. It's to survive long enough to be right when it matters.
For $BTC I'm watching $82,900. If it holds, I'm looking for a move back to $85,000 and then $88,600. If it loses $82,900 on a close, I'm out. The next stop is $81,600.
For $ETH I'm watching $2,640. If it holds, I'm looking for a reclaim of $2,750 and then $3,000. If it loses $2,640, I'm out. The next stop is $2,600.
The hardest part of this game isn't reading the chart. It's managing the voice in your head that tells you you're missing out. That voice has cost me more money than any bad trade ever did. It's the same voice that's telling people right now that STX is about to run forever. Maybe it is. But I've seen enough vertical candles turn into waterfalls to know that chasing is a losing game.
So here's my question for you. When you look at this chart, are you seeing a setup, or are you seeing a reason to click? And if you chase this and it turns, will you be able to admit you were wrong before it costs you everything?
84
·
--
Good Morning Everyone 🌄 The chart is coiling right under $1.04, but the real catalyst isn't technical. It's a supply shock.
$FIL is holding the $1.02 supertrend, but OBV is bleeding and RSI sits at 36. No chase here.
I'm already in from $0.70 and adding on any dip to $0.98–1.00. Targets are $1.22 then $1.45. A daily close below $0.95 kills it.
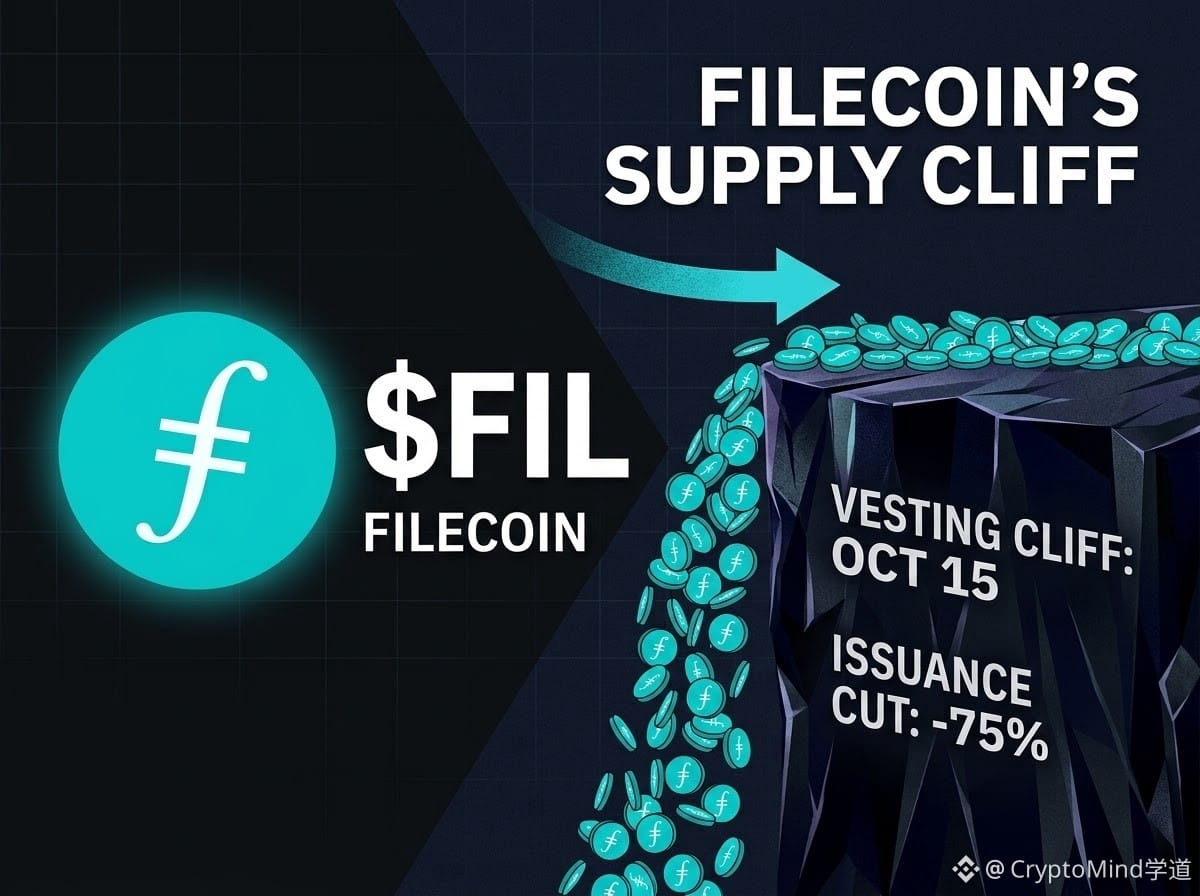
Vesting ends October 15, cutting annual issuance by 75%. That's the largest supply change since mainnet.
Is the market pricing in the vesting cliff, or does $FIL need paid onchain demand to actually show up first?
{spot}(FILUSDT)
Good Morning Everyone 🌄 The chart is coiling right under $1.04, but the real catalyst isn't technical. It's a supply shock.
$FIL is holding the $1.02 supertrend, but OBV is bleeding and RSI sits at 36. No chase here.
I'm already in from $0.70 and adding on any dip to $0.98–1.00. Targets are $1.22 then $1.45. A daily close below $0.95 kills it.
Vesting ends October 15, cutting annual issuance by 75%. That's the largest supply change since mainnet.
Is the market pricing in the vesting cliff, or does $FIL need paid onchain demand to actually show up first?
$FIL is holding the $1.02 supertrend, but OBV is bleeding and RSI sits at 36. No chase here.
I'm already in from $0.70 and adding on any dip to $0.98–1.00. Targets are $1.22 then $1.45. A daily close below $0.95 kills it.
Vesting ends October 15, cutting annual issuance by 75%. That's the largest supply change since mainnet.
Is the market pricing in the vesting cliff, or does $FIL need paid onchain demand to actually show up first?
1
135
·
--

Article
The hardest trade is doing absolutely nothing at all
😱Got a call from a buddy an hour ago.
Asked me if the coast was clear.
I opened the chart and just nodded.
It's not a bloodbath.
It's not a rocket.
It's just a slow, grinding chop.
And that's the hardest thing to trade.
Look at $BTC right now.
It ran from 74,909 all the way to 87,385.
That's a wild leg up.
Now it's sitting at 84,323.
Just chilling in the middle of nowhere.
No man's land.
The SuperTrend is at 85,114.
Price is below it.
That's a red flag.
It means the buyers lost the immediate fight.
The volume is heavy though.
14.77 billion in USDT traded.
That's a lot of money changing hands.
OBV is sitting at 466,000.
It's holding up.
People aren't dumping.
They're just waiting.
Watching.
RSI is at 65.8.
Not overbought. Not oversold.
Just a coin flip waiting to happen.
{future}(BTCUSDT)
Look at $BTC on this 4-hour chart.
It can't make up its mind.
It wants to go up, but it's tired.
Every dip gets bought up quickly.
Every rip gets sold into.
It's a tug of war.
The crowd is leaning the wrong way.
They think we're going straight back to 90k.
They're ignoring the resistance.
That 87,385 level is the wall.
It's the recent high.
It's where the sellers are waiting.
If we clear it, it's game on.
If we don't, we chop.
And chopping kills accounts.
It bores you to death.
Then it liquidates you.
That's the game.
Let's talk about the wider market.
Bitcoin dominance is holding steady.
Money isn't leaving the space.
It's just rotating.
Moving from the majors to the alts.
Then back to the majors.
The crowd is betting on a breakout.
They're buying calls, longing the perp.
But the tape says otherwise.
The tape says we need to cool off.
The ATR is at 907.
That means daily swings are wild.
You can't be loose with your stops.
You'll get wicked out in minutes.
I've seen it happen a hundred times.
I've watched accounts die because they couldn't walk away.
I've watched them come back because they finally learned to wait.
I've watched people quit at the worst time.
Right at the bottom.
Right before the rip.
It's heartbreaking.
But it's the game.
$BTC is just a reflection of human emotion.
Greed and fear, painted in green and red.
When you understand that, you stop fighting it.
You start flowing with it.
You wait for the fear to peak, then you buy.
You wait for the greed to peak, then you sell.
That's the whole secret.
It's simple, but it's not easy.
Most people can't do it.
I see people on Twitter calling the top.
They always call the top.
They'll be calling the top at ninety.
It's just noise.
Turn off the noise.
Look at the chart.
Look at the volume.
That's the only truth.
Above 85,100 and I'm watching 87,300, then 90,000.
Lose 82,900 and I'm stepping aside.
It's that simple.
Don't marry a chart.
It doesn't love you back.
You have to detach.
You have to look at the screen like it's a puzzle.
Not like it's your retirement.
The market is a ruthless teacher.
It doesn't care about your feelings.
It doesn't care about your bags.
Take a breath.
Step away from the screen.
The charts will still be here tomorrow.
I missed the first leg, and that's fine.
I'd rather miss a bounce than catch a twenty percent drop.
The goal isn't to catch the exact bottom.
The goal is to survive the chop.
Cash is a position.
Remember that.
Chasing pumps is how you blow up.
Waiting for the pullback takes patience.
Most people don't have it.
They want the reward without the screen time.
The market doesn't care if you're bored.
It doesn't care if you missed the move.
It only cares about price and volume.
Everything else is noise.
So what's your plan here?
Are you buying this because you see an opportunity, or because you're mad you missed the bottom?
The hardest trade is doing absolutely nothing at all 😱
Got a call from a buddy an hour ago.
Asked me if the coast was clear.
I opened the chart and just nodded.
It's not a bloodbath.
It's not a rocket.
It's just a slow, grinding chop.
And that's the hardest thing to trade.
Look at $BTC right now.
It ran from 74,909 all the way to 87,385.
That's a wild leg up.
Now it's sitting at 84,323.
Just chilling in the middle of nowhere.
No man's land.
The SuperTrend is at 85,114.
Price is below it.
That's a red flag.
It means the buyers lost the immediate fight.
The volume is heavy though.
14.77 billion in USDT traded.
That's a lot of money changing hands.
OBV is sitting at 466,000.
It's holding up.
People aren't dumping.
They're just waiting.
Watching.
RSI is at 65.8.
Not overbought. Not oversold.
Just a coin flip waiting to happen.
Look at $BTC on this 4-hour chart.
It can't make up its mind.
It wants to go up, but it's tired.
Every dip gets bought up quickly.
Every rip gets sold into.
It's a tug of war.
The crowd is leaning the wrong way.
They think we're going straight back to 90k.
They're ignoring the resistance.
That 87,385 level is the wall.
It's the recent high.
It's where the sellers are waiting.
If we clear it, it's game on.
If we don't, we chop.
And chopping kills accounts.
It bores you to death.
Then it liquidates you.
That's the game.
Let's talk about the wider market.
Bitcoin dominance is holding steady.
Money isn't leaving the space.
It's just rotating.
Moving from the majors to the alts.
Then back to the majors.
The crowd is betting on a breakout.
They're buying calls, longing the perp.
But the tape says otherwise.
The tape says we need to cool off.
The ATR is at 907.
That means daily swings are wild.
You can't be loose with your stops.
You'll get wicked out in minutes.
I've seen it happen a hundred times.
I've watched accounts die because they couldn't walk away.
I've watched them come back because they finally learned to wait.
I've watched people quit at the worst time.
Right at the bottom.
Right before the rip.
It's heartbreaking.
But it's the game.
$BTC is just a reflection of human emotion.
Greed and fear, painted in green and red.
When you understand that, you stop fighting it.
You start flowing with it.
You wait for the fear to peak, then you buy.
You wait for the greed to peak, then you sell.
That's the whole secret.
It's simple, but it's not easy.
Most people can't do it.
I see people on Twitter calling the top.
They always call the top.
They'll be calling the top at ninety.
It's just noise.
Turn off the noise.
Look at the chart.
Look at the volume.
That's the only truth.
Above 85,100 and I'm watching 87,300, then 90,000.
Lose 82,900 and I'm stepping aside.
It's that simple.
Don't marry a chart.
It doesn't love you back.
You have to detach.
You have to look at the screen like it's a puzzle.
Not like it's your retirement.
The market is a ruthless teacher.
It doesn't care about your feelings.
It doesn't care about your bags.
Take a breath.
Step away from the screen.
The charts will still be here tomorrow.
I missed the first leg, and that's fine.
I'd rather miss a bounce than catch a twenty percent drop.
The goal isn't to catch the exact bottom.
The goal is to survive the chop.
Cash is a position.
Remember that.
Chasing pumps is how you blow up.
Waiting for the pullback takes patience.
Most people don't have it.
They want the reward without the screen time.
The market doesn't care if you're bored.
It doesn't care if you missed the move.
It only cares about price and volume.
Everything else is noise.
So what's your plan here?
Are you buying this because you see an opportunity, or because you're mad you missed the bottom?
Asked me if the coast was clear.
I opened the chart and just nodded.
It's not a bloodbath.
It's not a rocket.
It's just a slow, grinding chop.
And that's the hardest thing to trade.
Look at $BTC right now.
It ran from 74,909 all the way to 87,385.
That's a wild leg up.
Now it's sitting at 84,323.
Just chilling in the middle of nowhere.
No man's land.
The SuperTrend is at 85,114.
Price is below it.
That's a red flag.
It means the buyers lost the immediate fight.
The volume is heavy though.
14.77 billion in USDT traded.
That's a lot of money changing hands.
OBV is sitting at 466,000.
It's holding up.
People aren't dumping.
They're just waiting.
Watching.
RSI is at 65.8.
Not overbought. Not oversold.
Just a coin flip waiting to happen.
Look at $BTC on this 4-hour chart.
It can't make up its mind.
It wants to go up, but it's tired.
Every dip gets bought up quickly.
Every rip gets sold into.
It's a tug of war.
The crowd is leaning the wrong way.
They think we're going straight back to 90k.
They're ignoring the resistance.
That 87,385 level is the wall.
It's the recent high.
It's where the sellers are waiting.
If we clear it, it's game on.
If we don't, we chop.
And chopping kills accounts.
It bores you to death.
Then it liquidates you.
That's the game.
Let's talk about the wider market.
Bitcoin dominance is holding steady.
Money isn't leaving the space.
It's just rotating.
Moving from the majors to the alts.
Then back to the majors.
The crowd is betting on a breakout.
They're buying calls, longing the perp.
But the tape says otherwise.
The tape says we need to cool off.
The ATR is at 907.
That means daily swings are wild.
You can't be loose with your stops.
You'll get wicked out in minutes.
I've seen it happen a hundred times.
I've watched accounts die because they couldn't walk away.
I've watched them come back because they finally learned to wait.
I've watched people quit at the worst time.
Right at the bottom.
Right before the rip.
It's heartbreaking.
But it's the game.
$BTC is just a reflection of human emotion.
Greed and fear, painted in green and red.
When you understand that, you stop fighting it.
You start flowing with it.
You wait for the fear to peak, then you buy.
You wait for the greed to peak, then you sell.
That's the whole secret.
It's simple, but it's not easy.
Most people can't do it.
I see people on Twitter calling the top.
They always call the top.
They'll be calling the top at ninety.
It's just noise.
Turn off the noise.
Look at the chart.
Look at the volume.
That's the only truth.
Above 85,100 and I'm watching 87,300, then 90,000.
Lose 82,900 and I'm stepping aside.
It's that simple.
Don't marry a chart.
It doesn't love you back.
You have to detach.
You have to look at the screen like it's a puzzle.
Not like it's your retirement.
The market is a ruthless teacher.
It doesn't care about your feelings.
It doesn't care about your bags.
Take a breath.
Step away from the screen.
The charts will still be here tomorrow.
I missed the first leg, and that's fine.
I'd rather miss a bounce than catch a twenty percent drop.
The goal isn't to catch the exact bottom.
The goal is to survive the chop.
Cash is a position.
Remember that.
Chasing pumps is how you blow up.
Waiting for the pullback takes patience.
Most people don't have it.
They want the reward without the screen time.
The market doesn't care if you're bored.
It doesn't care if you missed the move.
It only cares about price and volume.
Everything else is noise.
So what's your plan here?
Are you buying this because you see an opportunity, or because you're mad you missed the bottom?
32
·
--
Listen Man I swore I'd never touch $AZTEC again after that February listing pump dumped on my head. Yet here I am staring at this chart again.
Look — it's still 55% off the $ATH and funding is sitting slightly positive around +1bps on Binance, nothing overheated. OI is small, like 16M against a 50M cap, so moves get violent fast. I'm leaning long on a pullback into 0.0163-0.0165. Targets 0.0189 then 0.0213, that old spike high. Stop under 0.0151, no debate.
Keeping it 5x max, small size. Thin books liquidate gamblers, not traders.
Am I actually about to round-trip this thing twice?
{future}(AZTECUSDT)
{future}(ATHUSDT)
Listen Man I swore I'd never touch $AZTEC again after that February listing pump dumped on my head. Yet here I am staring at this chart again.
Look — it's still 55% off the $ATH and funding is sitting slightly positive around +1bps on Binance, nothing overheated. OI is small, like 16M against a 50M cap, so moves get violent fast. I'm leaning long on a pullback into 0.0163-0.0165. Targets 0.0189 then 0.0213, that old spike high. Stop under 0.0151, no debate.
Keeping it 5x max, small size. Thin books liquidate gamblers, not traders.
Am I actually about to round-trip this thing twice?
Look — it's still 55% off the $ATH and funding is sitting slightly positive around +1bps on Binance, nothing overheated. OI is small, like 16M against a 50M cap, so moves get violent fast. I'm leaning long on a pullback into 0.0163-0.0165. Targets 0.0189 then 0.0213, that old spike high. Stop under 0.0151, no debate.
Keeping it 5x max, small size. Thin books liquidate gamblers, not traders.
Am I actually about to round-trip this thing twice?
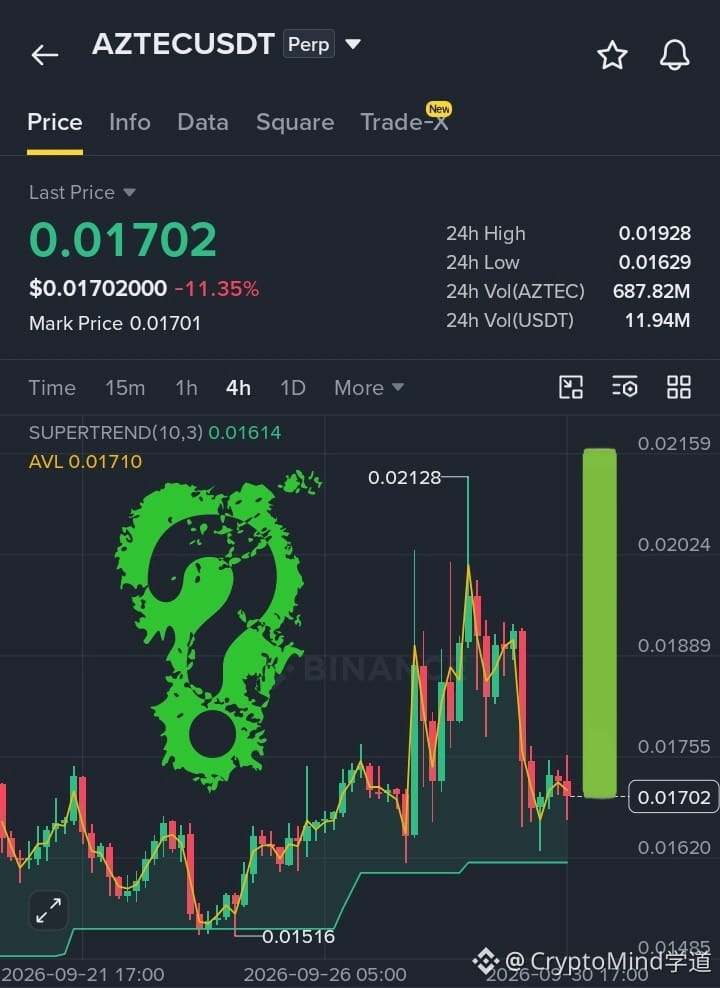
60
·
--
Still holding a bag from the last time I chased a stock perp without a plan. That one stung for weeks.
$CBRS got wrecked 13% after the OpenAI "Ultrafast" news made the rounds. Price is sitting at 182 after bouncing off 178. Funding is +0.0087% and OI is around $39.7M on Hyperliquid, so there's still leverage trapped in this thing.
Bias is long.
Entry 178–182. Targets 195 and 210. Stop below 172.
Quarter-size max, 5x. This $CBRS move is tied to equity market hours, not crypto.
If OpenAI really bypassed Cerebras, why is $CBRS not breaking 170?
{future}(CBRSUSDT)
Still holding a bag from the last time I chased a stock perp without a plan. That one stung for weeks.
$CBRS got wrecked 13% after the OpenAI "Ultrafast" news made the rounds. Price is sitting at 182 after bouncing off 178. Funding is +0.0087% and OI is around $39.7M on Hyperliquid, so there's still leverage trapped in this thing.
Bias is long.
Entry 178–182. Targets 195 and 210. Stop below 172.
Quarter-size max, 5x. This $CBRS move is tied to equity market hours, not crypto.
If OpenAI really bypassed Cerebras, why is $CBRS not breaking 170?
$CBRS got wrecked 13% after the OpenAI "Ultrafast" news made the rounds. Price is sitting at 182 after bouncing off 178. Funding is +0.0087% and OI is around $39.7M on Hyperliquid, so there's still leverage trapped in this thing.
Bias is long.
Entry 178–182. Targets 195 and 210. Stop below 172.
Quarter-size max, 5x. This $CBRS move is tied to equity market hours, not crypto.
If OpenAI really bypassed Cerebras, why is $CBRS not breaking 170?
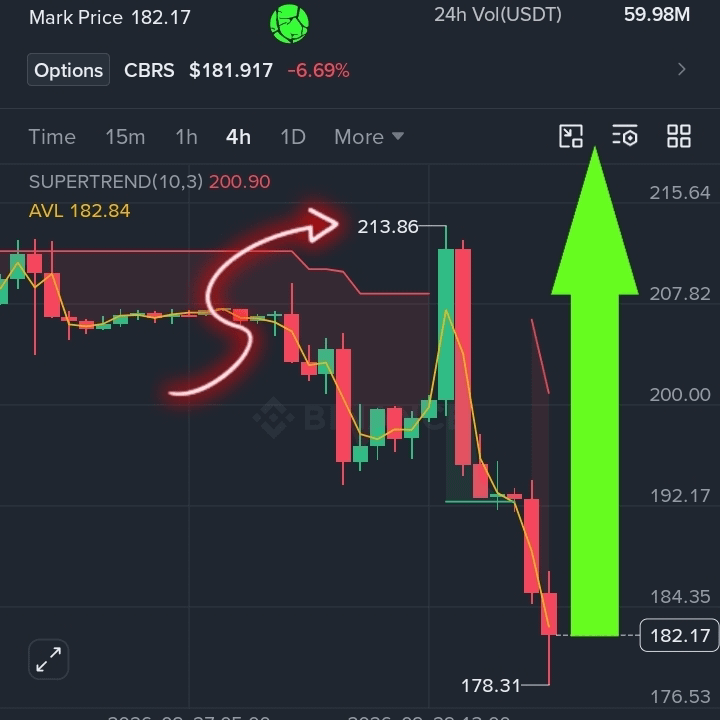
33
Connectez-vous pour découvrir plus de contenu
Rejoignez la communauté mondiale des adeptes de cryptomonnaies sur Binance Square
⚡️ Suviez les dernières informations importantes sur les cryptomonnaies.
💬 Jugé digne de confiance par la plus grande plateforme d’échange de cryptomonnaies au monde.
👍 Découvrez les connaissances que partagent les créateurs vérifiés.
Adresse e-mail/Nº de téléphone