

Cicada Capital
125 Publications

Cicada Capital
 Binance Square Vérifié
Signaler
Bloquer l’utilisateur
Backing over 50 projects with expert market-making and liquidity management.
0 Suivis
1.0K+ Abonnés
260 J’aime
2 Badges
Publications
Tous
Citations
PINNED
Article
What Is the Real Cost of a Market Maker?By Max Moris, CEO and Аounder of Cicada - a Dubai-based Market Making company with 6 years of personal experience, 1,000+ projects, and 500+ exchange listings.
• Watch on YouTube: https://youtu.be/KjoDUuXwQ_g
Last year, a founder signed a contract for free market making services. Four months later, the project had lost six million dollars. The market maker had made six million dollars. And hadn't violated a single line of the agreement. Everything was in the contract. Nobody read it.
This is the story of the three contract models that exist in this industry, what they actually cost, and why "free" is the most expensive word in crypto market making.
Three MM Models - Different Rules
Every market making contract falls into one of three categories. Retainer: you pay a fixed monthly fee. Loan: you give the market maker your tokens. And "free": which is how loans get sold to founders who don't understand what they're signing.
Retainer: Clean and Honest
The retainer model is the simplest. The project pays a fixed monthly fee. The market maker operates on your exchange accounts via API keys, with no ability to deposit or withdraw funds. You keep full control of your money. All profit generated from volatility goes to you, not to the market maker. They receive only what's written in the invoice.
This is the only model in the industry where incentives are completely transparent. We get paid for the work. We do the work.
At Cicada, services start at $3,500 per month, ranging up to $8,000 depending on the number of exchanges. Pay several months upfront and you get a discount.
What that fee covers:
A professional trading team and 24/7 support.Dozens of algorithms running simultaneously on your token, built on C++ infrastructure with fast updates for every exchange.An online dashboard with full real-time statistics. Every trade, every order, every metric, visible at any moment.Risk control and weekly reports.
There's also something I offer clients inside the retainer that's entirely voluntary and not written into the contract. For clients who want it, we open a separate account holding only the project's tokens.
Our job is to work that account so that by the end of month, the token balance is unchanged and there's an additional $USDT position on top. We don't touch your token holdings, but through volatility work, we generate a dollar-denominated gain.
If there's a positive result at month end, the client can choose to share part of it with us. If there's no result, no claims - we keep working the following month.
For most projects, especially at listing, retainer is the only real option. If your market cap is under $100 million, it's retainer. No exceptions. The loan model will explain why.
Loan: The Trojan Horse
The loan model looks attractive on paper. The project lends tokens to the market maker, sometimes with stablecoin added. The MM uses those tokens as liquidity in the order book. No monthly invoice. No payment schedule. The launch chart looks clean. Everyone seems happy.
Here's the math on what actually happens:
Take a hypothetical project. FDV of $50 million. Token price at TGE: $1.00. You lend the market maker 5% of the supply - 2.5 million tokens, worth $2.5 million.Listing day comes with hype. Price rises to $3.00. The market maker sells your tokens, the ones you lent them - at an average of $3.00. They now hold $7.5 million in cash.Three to six months pass. Unlocks start. The marketing budget runs dry. Hype fades. Price drops to $0.50.The entire time, the market maker has been trading. Not sitting on cash - actively profiting from every move up and down. Each swing in price is potential revenue for them, not for you.Then comes the final move. The market maker buys back those 2.5 million tokens at $0.50. Spends $1.25 million. Returns the tokens to your project per contract. Terms fulfilled. Signature valid.
Net profit for the market maker: $6.25 million on the price difference alone, plus everything earned on volatility across those months. What the project has: a collapsed chart, a damaged reputation, and the same 2.5 million tokens that are now worth a fraction of what they were.
And the market maker didn't break the contract. They did exactly what you agreed to. You handed them your tokens and said "trade." They traded. In their favor. Every day. On every move.
This is the most common reason founders come to us after leaving another market maker. Every one of them thought their situation was different.
Free: There's No Such Thing
When someone tells you their services are free, translate it as: "We'll make our money another way, and we won't be telling you how."
Free market makers don't exist. If no invoice is coming your way, that doesn't mean you're not paying. It means you're paying in tokens, in price control, in community trust, and eventually in the project itself.
When Loan Actually Works
The loan structure isn't inherently bad. It's a tool. The question is who's holding it and under what conditions. Loan works when your market cap is above $100 million. At that capitalization, no single loan can meaningfully manipulate the price - the math doesn't allow it.
It works for smaller exchanges you don't want to actively manage. Send a loan and let it run. It's required on certain exchanges. Coinbase is the most prominent example. Without a loan structure, you can't list there.
And for large projects, it creates something powerful: you can split the loan across multiple market makers who then compete with each other. Liquidity multiplies. Spreads tighten. Users trading your token benefit directly.
The question isn't "is loan good or bad." The question is where you are and what you're trying to accomplish.
Three Questions to Ask Before Signing:
What happens to my tokens if the market maker sells them and the price drops?
If the answer is "we'll buy back at market" - you already know how this ends.How quickly can I exit the contract if something goes wrong?
If the answer is "not for two years" - that's a red flag.Do our incentives actually align?
If the market maker can profit when your project is doing badly - something went wrong before the contract was even signed.
Good contracts survive these questions. Bad ones fall apart on the first one. Read the contract before you sign it, not after the chart collapses and the treasury is empty.
Your MM Should Win When You Win
Retainer is the right structure for most projects, especially at listing. You pay clearly and you sleep at night. Volatility profit is yours. Control is yours, the market maker receives only what's in the invoice.
Loan is a functional tool, but in this model, volatility profit goes to the market maker, not to you. That's fine at the right capitalization, for the right exchanges, when you're running competition between multiple providers.
One more thing worth understanding. Your market maker needs to make money too. This isn't charity. It's a business. A market maker that doesn't earn doesn't survive, doesn't invest in technology, doesn't keep a strong team. And ultimately, you lose.
So sometimes a loan is a good model. You solve your problems. The market maker earns. Both sides win.
The question isn't whether your market maker should make money. They should. The question is balance. If your market maker makes six million and you lose six million - that's extraction. If your market maker profits from the project growing alongside you - that's the relationship you want.
"Free" doesn't exist. If there's no invoice in the contract, there's something else in there. Read it. Find it. Run the numbers.
I'm Maxim Moris, Founder of Cicada Market Making. If you need help reviewing a contract before you sign - reach out. I personally review every incoming request together with the team.
[Do You Need a Market Maker?](https://www.binance.com/en/square/post/324474724751857)
What Is the Real Cost of a Market Maker?
By Max Moris, CEO and Аounder of Cicada - a Dubai-based Market Making company with 6 years of personal experience, 1,000+ projects, and 500+ exchange listings.
• Watch on YouTube: https://youtu.be/KjoDUuXwQ_g
Last year, a founder signed a contract for free market making services. Four months later, the project had lost six million dollars. The market maker had made six million dollars. And hadn't violated a single line of the agreement. Everything was in the contract. Nobody read it.
This is the story of the three contract models that exist in this industry, what they actually cost, and why "free" is the most expensive word in crypto market making.
Three MM Models - Different Rules
Every market making contract falls into one of three categories. Retainer: you pay a fixed monthly fee. Loan: you give the market maker your tokens. And "free": which is how loans get sold to founders who don't understand what they're signing.
Retainer: Clean and Honest
The retainer model is the simplest. The project pays a fixed monthly fee. The market maker operates on your exchange accounts via API keys, with no ability to deposit or withdraw funds. You keep full control of your money. All profit generated from volatility goes to you, not to the market maker. They receive only what's written in the invoice.
This is the only model in the industry where incentives are completely transparent. We get paid for the work. We do the work.
At Cicada, services start at $3,500 per month, ranging up to $8,000 depending on the number of exchanges. Pay several months upfront and you get a discount.
What that fee covers:
A professional trading team and 24/7 support.Dozens of algorithms running simultaneously on your token, built on C++ infrastructure with fast updates for every exchange.An online dashboard with full real-time statistics. Every trade, every order, every metric, visible at any moment.Risk control and weekly reports.
There's also something I offer clients inside the retainer that's entirely voluntary and not written into the contract. For clients who want it, we open a separate account holding only the project's tokens.
Our job is to work that account so that by the end of month, the token balance is unchanged and there's an additional $USDT position on top. We don't touch your token holdings, but through volatility work, we generate a dollar-denominated gain.
If there's a positive result at month end, the client can choose to share part of it with us. If there's no result, no claims - we keep working the following month.
For most projects, especially at listing, retainer is the only real option. If your market cap is under $100 million, it's retainer. No exceptions. The loan model will explain why.
Loan: The Trojan Horse
The loan model looks attractive on paper. The project lends tokens to the market maker, sometimes with stablecoin added. The MM uses those tokens as liquidity in the order book. No monthly invoice. No payment schedule. The launch chart looks clean. Everyone seems happy.
Here's the math on what actually happens:
Take a hypothetical project. FDV of $50 million. Token price at TGE: $1.00. You lend the market maker 5% of the supply - 2.5 million tokens, worth $2.5 million.Listing day comes with hype. Price rises to $3.00. The market maker sells your tokens, the ones you lent them - at an average of $3.00. They now hold $7.5 million in cash.Three to six months pass. Unlocks start. The marketing budget runs dry. Hype fades. Price drops to $0.50.The entire time, the market maker has been trading. Not sitting on cash - actively profiting from every move up and down. Each swing in price is potential revenue for them, not for you.Then comes the final move. The market maker buys back those 2.5 million tokens at $0.50. Spends $1.25 million. Returns the tokens to your project per contract. Terms fulfilled. Signature valid.
Net profit for the market maker: $6.25 million on the price difference alone, plus everything earned on volatility across those months. What the project has: a collapsed chart, a damaged reputation, and the same 2.5 million tokens that are now worth a fraction of what they were.
And the market maker didn't break the contract. They did exactly what you agreed to. You handed them your tokens and said "trade." They traded. In their favor. Every day. On every move.
This is the most common reason founders come to us after leaving another market maker. Every one of them thought their situation was different.
Free: There's No Such Thing
When someone tells you their services are free, translate it as: "We'll make our money another way, and we won't be telling you how."
Free market makers don't exist. If no invoice is coming your way, that doesn't mean you're not paying. It means you're paying in tokens, in price control, in community trust, and eventually in the project itself.
When Loan Actually Works
The loan structure isn't inherently bad. It's a tool. The question is who's holding it and under what conditions. Loan works when your market cap is above $100 million. At that capitalization, no single loan can meaningfully manipulate the price - the math doesn't allow it.
It works for smaller exchanges you don't want to actively manage. Send a loan and let it run. It's required on certain exchanges. Coinbase is the most prominent example. Without a loan structure, you can't list there.
And for large projects, it creates something powerful: you can split the loan across multiple market makers who then compete with each other. Liquidity multiplies. Spreads tighten. Users trading your token benefit directly.
The question isn't "is loan good or bad." The question is where you are and what you're trying to accomplish.
Three Questions to Ask Before Signing:
What happens to my tokens if the market maker sells them and the price drops?
If the answer is "we'll buy back at market" - you already know how this ends.How quickly can I exit the contract if something goes wrong?
If the answer is "not for two years" - that's a red flag.Do our incentives actually align?
If the market maker can profit when your project is doing badly - something went wrong before the contract was even signed.
Good contracts survive these questions. Bad ones fall apart on the first one. Read the contract before you sign it, not after the chart collapses and the treasury is empty.
Your MM Should Win When You Win
Retainer is the right structure for most projects, especially at listing. You pay clearly and you sleep at night. Volatility profit is yours. Control is yours, the market maker receives only what's in the invoice.
Loan is a functional tool, but in this model, volatility profit goes to the market maker, not to you. That's fine at the right capitalization, for the right exchanges, when you're running competition between multiple providers.
One more thing worth understanding. Your market maker needs to make money too. This isn't charity. It's a business. A market maker that doesn't earn doesn't survive, doesn't invest in technology, doesn't keep a strong team. And ultimately, you lose.
So sometimes a loan is a good model. You solve your problems. The market maker earns. Both sides win.
The question isn't whether your market maker should make money. They should. The question is balance. If your market maker makes six million and you lose six million - that's extraction. If your market maker profits from the project growing alongside you - that's the relationship you want.
"Free" doesn't exist. If there's no invoice in the contract, there's something else in there. Read it. Find it. Run the numbers.
I'm Maxim Moris, Founder of Cicada Market Making. If you need help reviewing a contract before you sign - reach out. I personally review every incoming request together with the team.
Do You Need a Market Maker?
• Watch on YouTube: https://youtu.be/KjoDUuXwQ_g
Last year, a founder signed a contract for free market making services. Four months later, the project had lost six million dollars. The market maker had made six million dollars. And hadn't violated a single line of the agreement. Everything was in the contract. Nobody read it.
This is the story of the three contract models that exist in this industry, what they actually cost, and why "free" is the most expensive word in crypto market making.
Three MM Models - Different Rules
Every market making contract falls into one of three categories. Retainer: you pay a fixed monthly fee. Loan: you give the market maker your tokens. And "free": which is how loans get sold to founders who don't understand what they're signing.
Retainer: Clean and Honest
The retainer model is the simplest. The project pays a fixed monthly fee. The market maker operates on your exchange accounts via API keys, with no ability to deposit or withdraw funds. You keep full control of your money. All profit generated from volatility goes to you, not to the market maker. They receive only what's written in the invoice.
This is the only model in the industry where incentives are completely transparent. We get paid for the work. We do the work.
At Cicada, services start at $3,500 per month, ranging up to $8,000 depending on the number of exchanges. Pay several months upfront and you get a discount.
What that fee covers:
A professional trading team and 24/7 support.Dozens of algorithms running simultaneously on your token, built on C++ infrastructure with fast updates for every exchange.An online dashboard with full real-time statistics. Every trade, every order, every metric, visible at any moment.Risk control and weekly reports.
There's also something I offer clients inside the retainer that's entirely voluntary and not written into the contract. For clients who want it, we open a separate account holding only the project's tokens.
Our job is to work that account so that by the end of month, the token balance is unchanged and there's an additional $USDT position on top. We don't touch your token holdings, but through volatility work, we generate a dollar-denominated gain.
If there's a positive result at month end, the client can choose to share part of it with us. If there's no result, no claims - we keep working the following month.
For most projects, especially at listing, retainer is the only real option. If your market cap is under $100 million, it's retainer. No exceptions. The loan model will explain why.
Loan: The Trojan Horse
The loan model looks attractive on paper. The project lends tokens to the market maker, sometimes with stablecoin added. The MM uses those tokens as liquidity in the order book. No monthly invoice. No payment schedule. The launch chart looks clean. Everyone seems happy.
Here's the math on what actually happens:
Take a hypothetical project. FDV of $50 million. Token price at TGE: $1.00. You lend the market maker 5% of the supply - 2.5 million tokens, worth $2.5 million.Listing day comes with hype. Price rises to $3.00. The market maker sells your tokens, the ones you lent them - at an average of $3.00. They now hold $7.5 million in cash.Three to six months pass. Unlocks start. The marketing budget runs dry. Hype fades. Price drops to $0.50.The entire time, the market maker has been trading. Not sitting on cash - actively profiting from every move up and down. Each swing in price is potential revenue for them, not for you.Then comes the final move. The market maker buys back those 2.5 million tokens at $0.50. Spends $1.25 million. Returns the tokens to your project per contract. Terms fulfilled. Signature valid.
Net profit for the market maker: $6.25 million on the price difference alone, plus everything earned on volatility across those months. What the project has: a collapsed chart, a damaged reputation, and the same 2.5 million tokens that are now worth a fraction of what they were.
And the market maker didn't break the contract. They did exactly what you agreed to. You handed them your tokens and said "trade." They traded. In their favor. Every day. On every move.
This is the most common reason founders come to us after leaving another market maker. Every one of them thought their situation was different.
Free: There's No Such Thing
When someone tells you their services are free, translate it as: "We'll make our money another way, and we won't be telling you how."
Free market makers don't exist. If no invoice is coming your way, that doesn't mean you're not paying. It means you're paying in tokens, in price control, in community trust, and eventually in the project itself.
When Loan Actually Works
The loan structure isn't inherently bad. It's a tool. The question is who's holding it and under what conditions. Loan works when your market cap is above $100 million. At that capitalization, no single loan can meaningfully manipulate the price - the math doesn't allow it.
It works for smaller exchanges you don't want to actively manage. Send a loan and let it run. It's required on certain exchanges. Coinbase is the most prominent example. Without a loan structure, you can't list there.
And for large projects, it creates something powerful: you can split the loan across multiple market makers who then compete with each other. Liquidity multiplies. Spreads tighten. Users trading your token benefit directly.
The question isn't "is loan good or bad." The question is where you are and what you're trying to accomplish.
Three Questions to Ask Before Signing:
What happens to my tokens if the market maker sells them and the price drops?
If the answer is "we'll buy back at market" - you already know how this ends.How quickly can I exit the contract if something goes wrong?
If the answer is "not for two years" - that's a red flag.Do our incentives actually align?
If the market maker can profit when your project is doing badly - something went wrong before the contract was even signed.
Good contracts survive these questions. Bad ones fall apart on the first one. Read the contract before you sign it, not after the chart collapses and the treasury is empty.
Your MM Should Win When You Win
Retainer is the right structure for most projects, especially at listing. You pay clearly and you sleep at night. Volatility profit is yours. Control is yours, the market maker receives only what's in the invoice.
Loan is a functional tool, but in this model, volatility profit goes to the market maker, not to you. That's fine at the right capitalization, for the right exchanges, when you're running competition between multiple providers.
One more thing worth understanding. Your market maker needs to make money too. This isn't charity. It's a business. A market maker that doesn't earn doesn't survive, doesn't invest in technology, doesn't keep a strong team. And ultimately, you lose.
So sometimes a loan is a good model. You solve your problems. The market maker earns. Both sides win.
The question isn't whether your market maker should make money. They should. The question is balance. If your market maker makes six million and you lose six million - that's extraction. If your market maker profits from the project growing alongside you - that's the relationship you want.
"Free" doesn't exist. If there's no invoice in the contract, there's something else in there. Read it. Find it. Run the numbers.
I'm Maxim Moris, Founder of Cicada Market Making. If you need help reviewing a contract before you sign - reach out. I personally review every incoming request together with the team.
Do You Need a Market Maker?
175
Partiellement vrai

Article
The DePIN Nobody Had to BuildFeaturing insights from Acurast & TokenLockr
Practically the entire internet today runs on top of infrastructure controlled by a handful of companies. AWS, Google Cloud, and Microsoft Azure hold, inside their data centers, the actual right to decide who gets access to the cloud, on what terms, and with what level of privacy.
Tech critics have long compared this model to feudalism: users and developers are forced to trust the "Cloud Lords," with no way to verify what happens to their data inside someone else's infrastructure.
Cloud Feudalism
In 2012, cryptography expert Bruce Schneier put it plainly: trust in the digital age stopped being a choice and became a forced necessity. Users don't know what security methods their "Cloud Lords" use or how those methods are configured, but they are obligated to trust them, because there simply is no alternative.
Cloud centralization creates risks for privacy and systemic fragility. The same set of companies decides whose data will be protected, whose applications stay online, and whose computations get censored or blocked based on geography.
For infrastructure that the entire digital economy rests on, this kind of dependence on a few players looks like a structural problem. The way forward lies through decentralizing it at a fundamental level. A cloud built on open-source principles.
Billions of Idle Phones
That kind of decentralization needs a resource capable of competing with data centers on scale. That resource already exists, and it's sitting in the pockets of billions of people.
Roughly 1.39 billion smartphones are sold every year, and the average device replacement cycle is 2.75 years. This is the most widespread, most frequently refreshed computing hardware on the planet, and most of the time it just sits idle.
A telling example: a used Google Pixel 7a with a cracked screen can be found on the secondhand market for around $25, and its processor is in no way inferior to a Dell PowerEdge R350 server costing $2,933. That's a 117-fold price difference for comparable computing power.
Instead of building new physical infrastructure, buying server racks, and paying for data center electricity, this model activates hardware that already exists: old smartphones, devices with cracked screens, gadgets that would otherwise simply be thrown away.
This is at once a question of compute accessibility and a question of ecology. It gives devices a second life instead of turning them into electronic waste.
Security Already Paid For
Mass decentralization through ordinary consumer hardware has an obvious objection. How do you trust computation happening on some random person's phone, if the device's own owner could theoretically interfere with the process? The answer lies in architecture that's already built into modern smartphones.
Flagship devices come equipped with a Trusted Execution Environment (TEE) and a Hardware Security Module (HSM) at a level data centers still have to build from scratch.
This is concrete, physically isolated hardware, already built into billions of devices:
Google Titan M2 in Pixel devices: a separate coprocessor with its own flash memory and a minimal OS (microkernel), never compromised in its entire time in use.Qualcomm Secure Execution Environment (QSEE) in Snapdragon chips: an isolated execution environment on most Android devices outside the Google ecosystem.ARM TrustZone: a hardware split between a "trusted" and a "normal" world right at the processor level, used as the baseline protection layer in almost every modern mobile SoC.
None of these components share memory or cache with the device's main processor, which means compromising the main operating system isn't enough to reach the computation happening inside the enclave.
Technically, this is built smarter than just an isolated sandbox. A key pair tied to the executable code works only with that specific code. Change the code by even a single bit, and access to the private key is lost for good.
This cryptographically ties the result of a computation to the exact set of instructions that produced it, all the way back to the hardware manufacturer, the device owner included.
What DePIN Doesn't Prove
Most existing DePIN networks solve the problem of hardware coordination. They pool distributed storage, bandwidth, or data center compute into a single network and reward participants with tokens.
But coordinating hardware and verifying what's actually happening on that hardware are two different problems, and the vast majority of these networks simply don't solve the second one.
The cost of this blind spot is clearly visible in the case of cross-chain bridges. According to analytics firm Chainalysis, roughly $2 billion was stolen across 13 different bridge hacks, accounting for 69% of all funds stolen across the crypto industry in 2022.
Bridges and sequencers are often positioned as decentralized infrastructure, but in practice they frequently run on the same centralized cloud providers whose trust requirement the industry is supposedly trying to eliminate.
The result is a paradox: a network can be physically distributed (thousands of independent nodes around the world), while the auxiliary systems that serve that network remain centralized and vulnerable.
The verifiability of computation, meaning cryptographic proof that code executed exactly as intended, on genuine hardware, without outside interference. That's a separate and far rarer property than mere distribution.
The Blockchain Quadrilemma
The classic blockchain trilemma describes the tradeoff between decentralization, security, and scalability. Improving one parameter almost always comes at the expense of another. But this model has a blind spot that becomes critical specifically for compute infrastructure.
An extended version, the quadrilemma, adds two more dimensions: computational effectiveness (the ability to run complex decentralized computations at an affordable cost) and confidentiality (the ability to process sensitive data without exposing it publicly). Classic blockchain consensus requires every participating node to duplicate the computation, which makes complex computations expensive or outright impossible.
At the same time, blockchain transparency, usually considered one of its strengths, turns into a problem the moment a computation requires confidentiality.
It is exactly at the intersection of these five requirements, decentralization, security, scalability, effectiveness, and confidentiality, that the problem Acurast is trying to solve sits.
Acurast's Serverless Cloud
Acurast splits its architecture into three layers: consensus, execution, and application. The consensus layer is built on a modification of Nominated Proof-of-Stake and includes an orchestrator that matches developers' compute tasks to available processors, a reputation engine that tracks the reliability of each device, and an attestation service responsible for cryptographically verifying the hardware's authenticity.
The execution layer, the Acurast Trusted Execution Environment, is where the computation actually happens. Confidentially, inside the phone's isolated hardware enclave, and verifiably, with cryptographic proof that the code executed without interference.
The network supports several runtimes, including Node.js, JavaScript v8, and Python, and keeps adding new ones.
According to the network's current data, more than 308,000 phones are already connected to Acurast across 175+ countries, more than 1 billion transactions have been processed, and more than 646,000 applications have been deployed. The network already secures more than $200 million in digital assets across Bitcoin, Ethereum, Tezos, Polkadot, peaq, and other networks.
The range of real-world use cases is wider than one might expect:
Confidential LLM inference, where the model runs without the cloud provider getting access to the data itself.Decentralized web scraping and market intelligence: in 2022, bots accounted for 47.4% of all internet traffic, and ordinary companies doing competitive analysis need infrastructure that doesn't expose the IP or intent of the requesting party.Decentralized price oracles and on-chain automation for DeFi protocols.Incorruptible transaction sequencer, resistant to MEV attacks like frontrunning and sandwich attacks.
The reward model is built on a fixed emission of the $ACU token: 70% of inflation is distributed to the Staked Compute Pool among processors participating in staking, 15% goes to the on-chain treasury, 10% makes up base benchmark rewards regardless of staking, and 5% goes to the collators producing blocks.
At the same time, the cost of executing each deployment is burned after successful execution, creating deflationary pressure on the token's supply.
Connecting to the network is already possible: the Acurast Processor Lite app is available on the App Store and Google Play, and the phone starts providing compute in the background with no special equipment. A more dedicated mode, Acurast Core, is set up by scanning a QR code in about three minutes.
Plans for the network, labeled Codename Cray, call for combining hundreds of phones into a single cluster capable of running inference for the largest existing LLMs, which should remove the model's main structural limitation: the vertical power ceiling of a single smartphone.
Insights from Acurast
The Acurast team has been building in the DePIN space since well before it had that name, and their approach reflects that: more emphasis on the mechanics that make a distributed compute network actually hold together under real-world conditions.
We caught up with them to hear how they think about reliability, what's coming next for the network, and how they see the whole system balancing itself out as it grows.
Q: What happens to an already-placed deployment if the processor's battery dies or it loses connection mid-execution?
If the deployment ran with a replica set of bigger than 1, the single replica will fail while the other continue, the deployer is refunded for the failed replica. Acurast ensures verifiability and confidentiality of the compute by leveraging the TEE, but liveliness is covered with staked compute: through staked compute the protocol creates an economic incentive for liveliness. If a compute provider is not providing the compute it said it would to the network, that provider will get slashed.
Q: Codename Cray clusters hundreds of phones for large LLMs. How do you sync execution across devices with different performance and connectivity?
Codename Cray shards LLMs on Acurast device clusters. These are typically interconnected via OTG/USB 4.2 and offer a stable, low latency interconnection. This allows for such sharding to happen effectively. In business terms, this allows Acurast compute to run the largest LLMs that would otherwise not fit on a single device's memory.
Q: How do you balance growth in the number of processors against real developer demand for compute?
Similar to how Bitcoin works, the protocol has a fixed inflation which is distributed to the participating compute providers. If only a few provide compute, those receive individually a larger share of the inflation. Compute demand, on the other hand, consumes tokens: big demand means big token consumption and burn. So the protocol is self-regulating demand and supply of token and compute with those two mechanisms.
Taken together, the answers describe a system with two separate feedback loops doing the work: staking and slashing keep individual phones honest and online, while token issuance and burn keep the size of the compute fleet roughly in step with how much of it developers are actually using.
TokenLockr: Growth, Beyond the Tech
One detail shows how networks like this grow not just through technology, but through community work as well. In the summer of 2026, Acurast launched a joint campaign with TokenLockr, a platform that turns creators' content and activity into real rewards from projects.
TokenLockr's model is built on three principles: transparency, reputation, and real rewards. Every creator has a public profile with a rating, a current tier, and a history of completed tasks. The platform itself pre-vets every creator through AI and on-chain data before they're admitted to a project's campaigns.
The mechanics are built to pay only for real results:
Rewards are tied to specific metrics, KPIs, and measurable results.Part of the rewards is structured through token locks and linear vesting, to keep creators engaged over the long term.Unlocking part of the rewards can be tied to specific events, whether that's token price, trading volume, or another KPI.Bonuses are only paid out once a project actually hits its target metrics.
In Acurast's case, this ran as two campaign types:
Activity on X with fixed and KPI-based payouts.Short-video campaign with fixed payouts.
Out of a total pool of 500,000 $ACU, only 10% was allocated to the fixed portion, while 90% depended on hitting the token's target price milestones: $0.078, $0.100, $0.128, $0.155, and $0.183. The campaign ran for two months, from July 14 to September 14.
In the end, 4 out of 5 stated price KPIs were hit, more than 45 creators took part in the campaign and put out more than 200 pieces of content. All participants received the rewards they were owed.
Campaigns like this show the other side of how DePIN projects grow: turning organic and incentivized content into an additional visibility channel for the network.
Notes from Founder of TokenLockr
We also spoke with Maxim Moris, founder of TokenLockr, about where the platform is headed next and how it holds the line between genuine project storytelling and pure price-shilling.
Q: What's next for TokenLockr, what new campaign formats are you planning?
We're planning to add creator analysis using LLMs soon. We'll check creators' connections so we can ban, or at least warn projects about, farmed and connected accounts that interact with and repost each other, essentially inflated accounts.We want to fight that, because this platform is built for people who genuinely want to support a project. A project has its own community, its own followers, people who like the project, and the project should use TokenLockr to additionally incentivize that community.The community should know they can keep supporting the project, more strongly and at greater scale, and that they'll be rewarded for it if the project is doing well. We want to build a system where, if the project is doing well, the community is doing well too, and the people supporting it are doing well. And we want that to be fair, and impossible to game.
Q: Doesn't the KPI system create an incentive for creators to promote the price rather than the product?
You can't directly shill tokens on Twitter, Twitter itself fights that, so yes, we also make sure creators are actually talking about the project: about the team, about what the project is building. The job is to get the story of how the project is developing out to a wide audience.If a project has nothing to talk about, it's unlikely anyone can just be bought with price alone, I doubt it, though of course I can't rule it out completely, because this is still an open platform, and there's no mechanism where you can foresee everything. There will always be someone trying to create something interesting, and someone trying to game it. We deal with that as it comes.
Q: What advice would you give a project just starting to work with creators?
I think TokenLockr right now is a unique platform that every project needs, especially any project going into a TGE, because it's a win-win situation. Projects incentivize the community to talk about the project, and the community gets extra rewards for that if the project is doing well, if the price is growing. I think this is the optimal format for any project right now, and there's nothing else like it on the market.
What comes through is a platform trying to police itself as it scales: catching farmed engagement before it reaches a project, while betting that a project with nothing real to say won't get far on price talk alone.
Conclusion
The idea of a decentralized cloud isn't new, but most attempts to build one have stumbled either on a lack of scale or on the impossibility of verifying what's actually happening on distributed hardware.
Smartphones solve much of this: they already exist in the numbers needed, and they already come with hardware security comparable to that of corporate data centers.
Acurast's example shows that the shift from concept to a working network with hundreds of thousands of connected devices and a billion processed transactions is happening right now.
The question of confidentiality and computational verifiability, which the classic blockchain trilemma left out of the picture, gets a concrete technical answer here: hardware trust that billions of people are already carrying in their pockets.
Read more: [Inside Robotics and Physical AI](https://www.binance.com/en/square/post/360597647215679)
The DePIN Nobody Had to Build
Featuring insights from Acurast & TokenLockr
Practically the entire internet today runs on top of infrastructure controlled by a handful of companies. AWS, Google Cloud, and Microsoft Azure hold, inside their data centers, the actual right to decide who gets access to the cloud, on what terms, and with what level of privacy.
Tech critics have long compared this model to feudalism: users and developers are forced to trust the "Cloud Lords," with no way to verify what happens to their data inside someone else's infrastructure.
Cloud Feudalism
In 2012, cryptography expert Bruce Schneier put it plainly: trust in the digital age stopped being a choice and became a forced necessity. Users don't know what security methods their "Cloud Lords" use or how those methods are configured, but they are obligated to trust them, because there simply is no alternative.
Cloud centralization creates risks for privacy and systemic fragility. The same set of companies decides whose data will be protected, whose applications stay online, and whose computations get censored or blocked based on geography.
For infrastructure that the entire digital economy rests on, this kind of dependence on a few players looks like a structural problem. The way forward lies through decentralizing it at a fundamental level. A cloud built on open-source principles.
Billions of Idle Phones
That kind of decentralization needs a resource capable of competing with data centers on scale. That resource already exists, and it's sitting in the pockets of billions of people.
Roughly 1.39 billion smartphones are sold every year, and the average device replacement cycle is 2.75 years. This is the most widespread, most frequently refreshed computing hardware on the planet, and most of the time it just sits idle.
A telling example: a used Google Pixel 7a with a cracked screen can be found on the secondhand market for around $25, and its processor is in no way inferior to a Dell PowerEdge R350 server costing $2,933. That's a 117-fold price difference for comparable computing power.
Instead of building new physical infrastructure, buying server racks, and paying for data center electricity, this model activates hardware that already exists: old smartphones, devices with cracked screens, gadgets that would otherwise simply be thrown away.
This is at once a question of compute accessibility and a question of ecology. It gives devices a second life instead of turning them into electronic waste.
Security Already Paid For
Mass decentralization through ordinary consumer hardware has an obvious objection. How do you trust computation happening on some random person's phone, if the device's own owner could theoretically interfere with the process? The answer lies in architecture that's already built into modern smartphones.
Flagship devices come equipped with a Trusted Execution Environment (TEE) and a Hardware Security Module (HSM) at a level data centers still have to build from scratch.
This is concrete, physically isolated hardware, already built into billions of devices:
Google Titan M2 in Pixel devices: a separate coprocessor with its own flash memory and a minimal OS (microkernel), never compromised in its entire time in use.Qualcomm Secure Execution Environment (QSEE) in Snapdragon chips: an isolated execution environment on most Android devices outside the Google ecosystem.ARM TrustZone: a hardware split between a "trusted" and a "normal" world right at the processor level, used as the baseline protection layer in almost every modern mobile SoC.
None of these components share memory or cache with the device's main processor, which means compromising the main operating system isn't enough to reach the computation happening inside the enclave.
Technically, this is built smarter than just an isolated sandbox. A key pair tied to the executable code works only with that specific code. Change the code by even a single bit, and access to the private key is lost for good.
This cryptographically ties the result of a computation to the exact set of instructions that produced it, all the way back to the hardware manufacturer, the device owner included.
What DePIN Doesn't Prove
Most existing DePIN networks solve the problem of hardware coordination. They pool distributed storage, bandwidth, or data center compute into a single network and reward participants with tokens.
But coordinating hardware and verifying what's actually happening on that hardware are two different problems, and the vast majority of these networks simply don't solve the second one.
The cost of this blind spot is clearly visible in the case of cross-chain bridges. According to analytics firm Chainalysis, roughly $2 billion was stolen across 13 different bridge hacks, accounting for 69% of all funds stolen across the crypto industry in 2022.
Bridges and sequencers are often positioned as decentralized infrastructure, but in practice they frequently run on the same centralized cloud providers whose trust requirement the industry is supposedly trying to eliminate.
The result is a paradox: a network can be physically distributed (thousands of independent nodes around the world), while the auxiliary systems that serve that network remain centralized and vulnerable.
The verifiability of computation, meaning cryptographic proof that code executed exactly as intended, on genuine hardware, without outside interference. That's a separate and far rarer property than mere distribution.
The Blockchain Quadrilemma
The classic blockchain trilemma describes the tradeoff between decentralization, security, and scalability. Improving one parameter almost always comes at the expense of another. But this model has a blind spot that becomes critical specifically for compute infrastructure.
An extended version, the quadrilemma, adds two more dimensions: computational effectiveness (the ability to run complex decentralized computations at an affordable cost) and confidentiality (the ability to process sensitive data without exposing it publicly). Classic blockchain consensus requires every participating node to duplicate the computation, which makes complex computations expensive or outright impossible.
At the same time, blockchain transparency, usually considered one of its strengths, turns into a problem the moment a computation requires confidentiality.
It is exactly at the intersection of these five requirements, decentralization, security, scalability, effectiveness, and confidentiality, that the problem Acurast is trying to solve sits.
Acurast's Serverless Cloud
Acurast splits its architecture into three layers: consensus, execution, and application. The consensus layer is built on a modification of Nominated Proof-of-Stake and includes an orchestrator that matches developers' compute tasks to available processors, a reputation engine that tracks the reliability of each device, and an attestation service responsible for cryptographically verifying the hardware's authenticity.
The execution layer, the Acurast Trusted Execution Environment, is where the computation actually happens. Confidentially, inside the phone's isolated hardware enclave, and verifiably, with cryptographic proof that the code executed without interference.
The network supports several runtimes, including Node.js, JavaScript v8, and Python, and keeps adding new ones.
According to the network's current data, more than 308,000 phones are already connected to Acurast across 175+ countries, more than 1 billion transactions have been processed, and more than 646,000 applications have been deployed. The network already secures more than $200 million in digital assets across Bitcoin, Ethereum, Tezos, Polkadot, peaq, and other networks.
The range of real-world use cases is wider than one might expect:
Confidential LLM inference, where the model runs without the cloud provider getting access to the data itself.Decentralized web scraping and market intelligence: in 2022, bots accounted for 47.4% of all internet traffic, and ordinary companies doing competitive analysis need infrastructure that doesn't expose the IP or intent of the requesting party.Decentralized price oracles and on-chain automation for DeFi protocols.Incorruptible transaction sequencer, resistant to MEV attacks like frontrunning and sandwich attacks.
The reward model is built on a fixed emission of the $ACU token: 70% of inflation is distributed to the Staked Compute Pool among processors participating in staking, 15% goes to the on-chain treasury, 10% makes up base benchmark rewards regardless of staking, and 5% goes to the collators producing blocks.
At the same time, the cost of executing each deployment is burned after successful execution, creating deflationary pressure on the token's supply.
Connecting to the network is already possible: the Acurast Processor Lite app is available on the App Store and Google Play, and the phone starts providing compute in the background with no special equipment. A more dedicated mode, Acurast Core, is set up by scanning a QR code in about three minutes.
Plans for the network, labeled Codename Cray, call for combining hundreds of phones into a single cluster capable of running inference for the largest existing LLMs, which should remove the model's main structural limitation: the vertical power ceiling of a single smartphone.
Insights from Acurast
The Acurast team has been building in the DePIN space since well before it had that name, and their approach reflects that: more emphasis on the mechanics that make a distributed compute network actually hold together under real-world conditions.
We caught up with them to hear how they think about reliability, what's coming next for the network, and how they see the whole system balancing itself out as it grows.
Q: What happens to an already-placed deployment if the processor's battery dies or it loses connection mid-execution?
If the deployment ran with a replica set of bigger than 1, the single replica will fail while the other continue, the deployer is refunded for the failed replica. Acurast ensures verifiability and confidentiality of the compute by leveraging the TEE, but liveliness is covered with staked compute: through staked compute the protocol creates an economic incentive for liveliness. If a compute provider is not providing the compute it said it would to the network, that provider will get slashed.
Q: Codename Cray clusters hundreds of phones for large LLMs. How do you sync execution across devices with different performance and connectivity?
Codename Cray shards LLMs on Acurast device clusters. These are typically interconnected via OTG/USB 4.2 and offer a stable, low latency interconnection. This allows for such sharding to happen effectively. In business terms, this allows Acurast compute to run the largest LLMs that would otherwise not fit on a single device's memory.
Q: How do you balance growth in the number of processors against real developer demand for compute?
Similar to how Bitcoin works, the protocol has a fixed inflation which is distributed to the participating compute providers. If only a few provide compute, those receive individually a larger share of the inflation. Compute demand, on the other hand, consumes tokens: big demand means big token consumption and burn. So the protocol is self-regulating demand and supply of token and compute with those two mechanisms.
Taken together, the answers describe a system with two separate feedback loops doing the work: staking and slashing keep individual phones honest and online, while token issuance and burn keep the size of the compute fleet roughly in step with how much of it developers are actually using.
TokenLockr: Growth, Beyond the Tech
One detail shows how networks like this grow not just through technology, but through community work as well. In the summer of 2026, Acurast launched a joint campaign with TokenLockr, a platform that turns creators' content and activity into real rewards from projects.
TokenLockr's model is built on three principles: transparency, reputation, and real rewards. Every creator has a public profile with a rating, a current tier, and a history of completed tasks. The platform itself pre-vets every creator through AI and on-chain data before they're admitted to a project's campaigns.
The mechanics are built to pay only for real results:
Rewards are tied to specific metrics, KPIs, and measurable results.Part of the rewards is structured through token locks and linear vesting, to keep creators engaged over the long term.Unlocking part of the rewards can be tied to specific events, whether that's token price, trading volume, or another KPI.Bonuses are only paid out once a project actually hits its target metrics.
In Acurast's case, this ran as two campaign types:
Activity on X with fixed and KPI-based payouts.Short-video campaign with fixed payouts.
Out of a total pool of 500,000 $ACU, only 10% was allocated to the fixed portion, while 90% depended on hitting the token's target price milestones: $0.078, $0.100, $0.128, $0.155, and $0.183. The campaign ran for two months, from July 14 to September 14.
In the end, 4 out of 5 stated price KPIs were hit, more than 45 creators took part in the campaign and put out more than 200 pieces of content. All participants received the rewards they were owed.
Campaigns like this show the other side of how DePIN projects grow: turning organic and incentivized content into an additional visibility channel for the network.
Notes from Founder of TokenLockr
We also spoke with Maxim Moris, founder of TokenLockr, about where the platform is headed next and how it holds the line between genuine project storytelling and pure price-shilling.
Q: What's next for TokenLockr, what new campaign formats are you planning?
We're planning to add creator analysis using LLMs soon. We'll check creators' connections so we can ban, or at least warn projects about, farmed and connected accounts that interact with and repost each other, essentially inflated accounts.We want to fight that, because this platform is built for people who genuinely want to support a project. A project has its own community, its own followers, people who like the project, and the project should use TokenLockr to additionally incentivize that community.The community should know they can keep supporting the project, more strongly and at greater scale, and that they'll be rewarded for it if the project is doing well. We want to build a system where, if the project is doing well, the community is doing well too, and the people supporting it are doing well. And we want that to be fair, and impossible to game.
Q: Doesn't the KPI system create an incentive for creators to promote the price rather than the product?
You can't directly shill tokens on Twitter, Twitter itself fights that, so yes, we also make sure creators are actually talking about the project: about the team, about what the project is building. The job is to get the story of how the project is developing out to a wide audience.If a project has nothing to talk about, it's unlikely anyone can just be bought with price alone, I doubt it, though of course I can't rule it out completely, because this is still an open platform, and there's no mechanism where you can foresee everything. There will always be someone trying to create something interesting, and someone trying to game it. We deal with that as it comes.
Q: What advice would you give a project just starting to work with creators?
I think TokenLockr right now is a unique platform that every project needs, especially any project going into a TGE, because it's a win-win situation. Projects incentivize the community to talk about the project, and the community gets extra rewards for that if the project is doing well, if the price is growing. I think this is the optimal format for any project right now, and there's nothing else like it on the market.
What comes through is a platform trying to police itself as it scales: catching farmed engagement before it reaches a project, while betting that a project with nothing real to say won't get far on price talk alone.
Conclusion
The idea of a decentralized cloud isn't new, but most attempts to build one have stumbled either on a lack of scale or on the impossibility of verifying what's actually happening on distributed hardware.
Smartphones solve much of this: they already exist in the numbers needed, and they already come with hardware security comparable to that of corporate data centers.
Acurast's example shows that the shift from concept to a working network with hundreds of thousands of connected devices and a billion processed transactions is happening right now.
The question of confidentiality and computational verifiability, which the classic blockchain trilemma left out of the picture, gets a concrete technical answer here: hardware trust that billions of people are already carrying in their pockets.
Read more: Inside Robotics and Physical AI
Practically the entire internet today runs on top of infrastructure controlled by a handful of companies. AWS, Google Cloud, and Microsoft Azure hold, inside their data centers, the actual right to decide who gets access to the cloud, on what terms, and with what level of privacy.
Tech critics have long compared this model to feudalism: users and developers are forced to trust the "Cloud Lords," with no way to verify what happens to their data inside someone else's infrastructure.
Cloud Feudalism
In 2012, cryptography expert Bruce Schneier put it plainly: trust in the digital age stopped being a choice and became a forced necessity. Users don't know what security methods their "Cloud Lords" use or how those methods are configured, but they are obligated to trust them, because there simply is no alternative.
Cloud centralization creates risks for privacy and systemic fragility. The same set of companies decides whose data will be protected, whose applications stay online, and whose computations get censored or blocked based on geography.
For infrastructure that the entire digital economy rests on, this kind of dependence on a few players looks like a structural problem. The way forward lies through decentralizing it at a fundamental level. A cloud built on open-source principles.
Billions of Idle Phones
That kind of decentralization needs a resource capable of competing with data centers on scale. That resource already exists, and it's sitting in the pockets of billions of people.
Roughly 1.39 billion smartphones are sold every year, and the average device replacement cycle is 2.75 years. This is the most widespread, most frequently refreshed computing hardware on the planet, and most of the time it just sits idle.
A telling example: a used Google Pixel 7a with a cracked screen can be found on the secondhand market for around $25, and its processor is in no way inferior to a Dell PowerEdge R350 server costing $2,933. That's a 117-fold price difference for comparable computing power.
Instead of building new physical infrastructure, buying server racks, and paying for data center electricity, this model activates hardware that already exists: old smartphones, devices with cracked screens, gadgets that would otherwise simply be thrown away.
This is at once a question of compute accessibility and a question of ecology. It gives devices a second life instead of turning them into electronic waste.
Security Already Paid For
Mass decentralization through ordinary consumer hardware has an obvious objection. How do you trust computation happening on some random person's phone, if the device's own owner could theoretically interfere with the process? The answer lies in architecture that's already built into modern smartphones.
Flagship devices come equipped with a Trusted Execution Environment (TEE) and a Hardware Security Module (HSM) at a level data centers still have to build from scratch.
This is concrete, physically isolated hardware, already built into billions of devices:
Google Titan M2 in Pixel devices: a separate coprocessor with its own flash memory and a minimal OS (microkernel), never compromised in its entire time in use.Qualcomm Secure Execution Environment (QSEE) in Snapdragon chips: an isolated execution environment on most Android devices outside the Google ecosystem.ARM TrustZone: a hardware split between a "trusted" and a "normal" world right at the processor level, used as the baseline protection layer in almost every modern mobile SoC.
None of these components share memory or cache with the device's main processor, which means compromising the main operating system isn't enough to reach the computation happening inside the enclave.
Technically, this is built smarter than just an isolated sandbox. A key pair tied to the executable code works only with that specific code. Change the code by even a single bit, and access to the private key is lost for good.
This cryptographically ties the result of a computation to the exact set of instructions that produced it, all the way back to the hardware manufacturer, the device owner included.
What DePIN Doesn't Prove
Most existing DePIN networks solve the problem of hardware coordination. They pool distributed storage, bandwidth, or data center compute into a single network and reward participants with tokens.
But coordinating hardware and verifying what's actually happening on that hardware are two different problems, and the vast majority of these networks simply don't solve the second one.
The cost of this blind spot is clearly visible in the case of cross-chain bridges. According to analytics firm Chainalysis, roughly $2 billion was stolen across 13 different bridge hacks, accounting for 69% of all funds stolen across the crypto industry in 2022.
Bridges and sequencers are often positioned as decentralized infrastructure, but in practice they frequently run on the same centralized cloud providers whose trust requirement the industry is supposedly trying to eliminate.
The result is a paradox: a network can be physically distributed (thousands of independent nodes around the world), while the auxiliary systems that serve that network remain centralized and vulnerable.
The verifiability of computation, meaning cryptographic proof that code executed exactly as intended, on genuine hardware, without outside interference. That's a separate and far rarer property than mere distribution.
The Blockchain Quadrilemma
The classic blockchain trilemma describes the tradeoff between decentralization, security, and scalability. Improving one parameter almost always comes at the expense of another. But this model has a blind spot that becomes critical specifically for compute infrastructure.
An extended version, the quadrilemma, adds two more dimensions: computational effectiveness (the ability to run complex decentralized computations at an affordable cost) and confidentiality (the ability to process sensitive data without exposing it publicly). Classic blockchain consensus requires every participating node to duplicate the computation, which makes complex computations expensive or outright impossible.
At the same time, blockchain transparency, usually considered one of its strengths, turns into a problem the moment a computation requires confidentiality.
It is exactly at the intersection of these five requirements, decentralization, security, scalability, effectiveness, and confidentiality, that the problem Acurast is trying to solve sits.
Acurast's Serverless Cloud
Acurast splits its architecture into three layers: consensus, execution, and application. The consensus layer is built on a modification of Nominated Proof-of-Stake and includes an orchestrator that matches developers' compute tasks to available processors, a reputation engine that tracks the reliability of each device, and an attestation service responsible for cryptographically verifying the hardware's authenticity.
The execution layer, the Acurast Trusted Execution Environment, is where the computation actually happens. Confidentially, inside the phone's isolated hardware enclave, and verifiably, with cryptographic proof that the code executed without interference.
The network supports several runtimes, including Node.js, JavaScript v8, and Python, and keeps adding new ones.
According to the network's current data, more than 308,000 phones are already connected to Acurast across 175+ countries, more than 1 billion transactions have been processed, and more than 646,000 applications have been deployed. The network already secures more than $200 million in digital assets across Bitcoin, Ethereum, Tezos, Polkadot, peaq, and other networks.
The range of real-world use cases is wider than one might expect:
Confidential LLM inference, where the model runs without the cloud provider getting access to the data itself.Decentralized web scraping and market intelligence: in 2022, bots accounted for 47.4% of all internet traffic, and ordinary companies doing competitive analysis need infrastructure that doesn't expose the IP or intent of the requesting party.Decentralized price oracles and on-chain automation for DeFi protocols.Incorruptible transaction sequencer, resistant to MEV attacks like frontrunning and sandwich attacks.
The reward model is built on a fixed emission of the $ACU token: 70% of inflation is distributed to the Staked Compute Pool among processors participating in staking, 15% goes to the on-chain treasury, 10% makes up base benchmark rewards regardless of staking, and 5% goes to the collators producing blocks.
At the same time, the cost of executing each deployment is burned after successful execution, creating deflationary pressure on the token's supply.
Connecting to the network is already possible: the Acurast Processor Lite app is available on the App Store and Google Play, and the phone starts providing compute in the background with no special equipment. A more dedicated mode, Acurast Core, is set up by scanning a QR code in about three minutes.
Plans for the network, labeled Codename Cray, call for combining hundreds of phones into a single cluster capable of running inference for the largest existing LLMs, which should remove the model's main structural limitation: the vertical power ceiling of a single smartphone.
Insights from Acurast
The Acurast team has been building in the DePIN space since well before it had that name, and their approach reflects that: more emphasis on the mechanics that make a distributed compute network actually hold together under real-world conditions.
We caught up with them to hear how they think about reliability, what's coming next for the network, and how they see the whole system balancing itself out as it grows.
Q: What happens to an already-placed deployment if the processor's battery dies or it loses connection mid-execution?
If the deployment ran with a replica set of bigger than 1, the single replica will fail while the other continue, the deployer is refunded for the failed replica. Acurast ensures verifiability and confidentiality of the compute by leveraging the TEE, but liveliness is covered with staked compute: through staked compute the protocol creates an economic incentive for liveliness. If a compute provider is not providing the compute it said it would to the network, that provider will get slashed.
Q: Codename Cray clusters hundreds of phones for large LLMs. How do you sync execution across devices with different performance and connectivity?
Codename Cray shards LLMs on Acurast device clusters. These are typically interconnected via OTG/USB 4.2 and offer a stable, low latency interconnection. This allows for such sharding to happen effectively. In business terms, this allows Acurast compute to run the largest LLMs that would otherwise not fit on a single device's memory.
Q: How do you balance growth in the number of processors against real developer demand for compute?
Similar to how Bitcoin works, the protocol has a fixed inflation which is distributed to the participating compute providers. If only a few provide compute, those receive individually a larger share of the inflation. Compute demand, on the other hand, consumes tokens: big demand means big token consumption and burn. So the protocol is self-regulating demand and supply of token and compute with those two mechanisms.
Taken together, the answers describe a system with two separate feedback loops doing the work: staking and slashing keep individual phones honest and online, while token issuance and burn keep the size of the compute fleet roughly in step with how much of it developers are actually using.
TokenLockr: Growth, Beyond the Tech
One detail shows how networks like this grow not just through technology, but through community work as well. In the summer of 2026, Acurast launched a joint campaign with TokenLockr, a platform that turns creators' content and activity into real rewards from projects.
TokenLockr's model is built on three principles: transparency, reputation, and real rewards. Every creator has a public profile with a rating, a current tier, and a history of completed tasks. The platform itself pre-vets every creator through AI and on-chain data before they're admitted to a project's campaigns.
The mechanics are built to pay only for real results:
Rewards are tied to specific metrics, KPIs, and measurable results.Part of the rewards is structured through token locks and linear vesting, to keep creators engaged over the long term.Unlocking part of the rewards can be tied to specific events, whether that's token price, trading volume, or another KPI.Bonuses are only paid out once a project actually hits its target metrics.
In Acurast's case, this ran as two campaign types:
Activity on X with fixed and KPI-based payouts.Short-video campaign with fixed payouts.
Out of a total pool of 500,000 $ACU, only 10% was allocated to the fixed portion, while 90% depended on hitting the token's target price milestones: $0.078, $0.100, $0.128, $0.155, and $0.183. The campaign ran for two months, from July 14 to September 14.
In the end, 4 out of 5 stated price KPIs were hit, more than 45 creators took part in the campaign and put out more than 200 pieces of content. All participants received the rewards they were owed.
Campaigns like this show the other side of how DePIN projects grow: turning organic and incentivized content into an additional visibility channel for the network.
Notes from Founder of TokenLockr
We also spoke with Maxim Moris, founder of TokenLockr, about where the platform is headed next and how it holds the line between genuine project storytelling and pure price-shilling.
Q: What's next for TokenLockr, what new campaign formats are you planning?
We're planning to add creator analysis using LLMs soon. We'll check creators' connections so we can ban, or at least warn projects about, farmed and connected accounts that interact with and repost each other, essentially inflated accounts.We want to fight that, because this platform is built for people who genuinely want to support a project. A project has its own community, its own followers, people who like the project, and the project should use TokenLockr to additionally incentivize that community.The community should know they can keep supporting the project, more strongly and at greater scale, and that they'll be rewarded for it if the project is doing well. We want to build a system where, if the project is doing well, the community is doing well too, and the people supporting it are doing well. And we want that to be fair, and impossible to game.
Q: Doesn't the KPI system create an incentive for creators to promote the price rather than the product?
You can't directly shill tokens on Twitter, Twitter itself fights that, so yes, we also make sure creators are actually talking about the project: about the team, about what the project is building. The job is to get the story of how the project is developing out to a wide audience.If a project has nothing to talk about, it's unlikely anyone can just be bought with price alone, I doubt it, though of course I can't rule it out completely, because this is still an open platform, and there's no mechanism where you can foresee everything. There will always be someone trying to create something interesting, and someone trying to game it. We deal with that as it comes.
Q: What advice would you give a project just starting to work with creators?
I think TokenLockr right now is a unique platform that every project needs, especially any project going into a TGE, because it's a win-win situation. Projects incentivize the community to talk about the project, and the community gets extra rewards for that if the project is doing well, if the price is growing. I think this is the optimal format for any project right now, and there's nothing else like it on the market.
What comes through is a platform trying to police itself as it scales: catching farmed engagement before it reaches a project, while betting that a project with nothing real to say won't get far on price talk alone.
Conclusion
The idea of a decentralized cloud isn't new, but most attempts to build one have stumbled either on a lack of scale or on the impossibility of verifying what's actually happening on distributed hardware.
Smartphones solve much of this: they already exist in the numbers needed, and they already come with hardware security comparable to that of corporate data centers.
Acurast's example shows that the shift from concept to a working network with hundreds of thousands of connected devices and a billion processed transactions is happening right now.
The question of confidentiality and computational verifiability, which the classic blockchain trilemma left out of the picture, gets a concrete technical answer here: hardware trust that billions of people are already carrying in their pockets.
Read more: Inside Robotics and Physical AI
3
23
2.4k
📊 Weekly Recap: The Clarity Act Flop & The Fed's First Hike
Crypto de-risked into a wall of major decisions this week. Bitcoin fell from $79k to $75.6k as the Senate killed the CLARITY Act and markets prepared for the Fed's first rate hike since 2023.
📌 The Macro Pivot
Energy-driven inflation and hawkish central bank expectations set a risk-off tone across markets.
• Inflation Spike: August PPI reached 5.4 percent year over year, driven by a 24.1 percent monthly jump in diesel. CPI rose to 3.4 percent, with gasoline accounting for over a third of the monthly increase.
• Rate Hike Odds: Markets now price a 90 percent chance of a 25 basis point Fed rate hike to 3.75–4.00 percent on September 16, with expectations scaling to four hikes by June 2027.
• Energy and Markets: Brent crude spiked 8.9 percent to peak at $109.80 before pulling back on Oman meeting reports. 10 year Treasury yields pushed above 5 percent.
📌 Bitcoin Flash Cut
$BTC dropped from $78.4k down to $75.6k following the failed Senate cloture vote, marking its biggest single day drop since June.
• Price Action: BTC lost $79k support and touched $75.6k. Overhead resistance sits firmly at $83k, though a daily golden cross recently formed.
• ETF Flows: $BTC ETFs saw four straight outflow days, losing $462.7M for the week. September 15 recorded a single day net outflow of $450.4M, bringing YTD net flows back to negative $1.46B.
• ETH Relative Strength: $ETH ETFs pulled in $197M for the week and hold over $1.06B YTD. ETH held support between $2,432 and $2,505.
• Corporate Buys: Strive added 469 BTC to hit a 25,000 BTC total, while BitMine added over 27,000 ETH.
📌 Sentiment and Regulation
The Fear and Greed index cooled from 76 to 62. The Senate cloture vote failed on September 15, removing a major regulatory catalyst.
Liquidations reached $685.6M with open interest dropping to $133.4B. Major liquidation clusters now rest at $74.7k and $76.8k.
📊 Weekly Recap: The Clarity Act Flop & The Fed's First Hike
Crypto de-risked into a wall of major decisions this week. Bitcoin fell from $79k to $75.6k as the Senate killed the CLARITY Act and markets prepared for the Fed's first rate hike since 2023.
📌 The Macro Pivot
Energy-driven inflation and hawkish central bank expectations set a risk-off tone across markets.
• Inflation Spike: August PPI reached 5.4 percent year over year, driven by a 24.1 percent monthly jump in diesel. CPI rose to 3.4 percent, with gasoline accounting for over a third of the monthly increase.
• Rate Hike Odds: Markets now price a 90 percent chance of a 25 basis point Fed rate hike to 3.75–4.00 percent on September 16, with expectations scaling to four hikes by June 2027.
• Energy and Markets: Brent crude spiked 8.9 percent to peak at $109.80 before pulling back on Oman meeting reports. 10 year Treasury yields pushed above 5 percent.
📌 Bitcoin Flash Cut
$BTC dropped from $78.4k down to $75.6k following the failed Senate cloture vote, marking its biggest single day drop since June.
• Price Action: BTC lost $79k support and touched $75.6k. Overhead resistance sits firmly at $83k, though a daily golden cross recently formed.
• ETF Flows: $BTC ETFs saw four straight outflow days, losing $462.7M for the week. September 15 recorded a single day net outflow of $450.4M, bringing YTD net flows back to negative $1.46B.
• ETH Relative Strength: $ETH ETFs pulled in $197M for the week and hold over $1.06B YTD. ETH held support between $2,432 and $2,505.
• Corporate Buys: Strive added 469 BTC to hit a 25,000 BTC total, while BitMine added over 27,000 ETH.
📌 Sentiment and Regulation
The Fear and Greed index cooled from 76 to 62. The Senate cloture vote failed on September 15, removing a major regulatory catalyst.
Liquidations reached $685.6M with open interest dropping to $133.4B. Major liquidation clusters now rest at $74.7k and $76.8k.
Crypto de-risked into a wall of major decisions this week. Bitcoin fell from $79k to $75.6k as the Senate killed the CLARITY Act and markets prepared for the Fed's first rate hike since 2023.
📌 The Macro Pivot
Energy-driven inflation and hawkish central bank expectations set a risk-off tone across markets.
• Inflation Spike: August PPI reached 5.4 percent year over year, driven by a 24.1 percent monthly jump in diesel. CPI rose to 3.4 percent, with gasoline accounting for over a third of the monthly increase.
• Rate Hike Odds: Markets now price a 90 percent chance of a 25 basis point Fed rate hike to 3.75–4.00 percent on September 16, with expectations scaling to four hikes by June 2027.
• Energy and Markets: Brent crude spiked 8.9 percent to peak at $109.80 before pulling back on Oman meeting reports. 10 year Treasury yields pushed above 5 percent.
📌 Bitcoin Flash Cut
$BTC dropped from $78.4k down to $75.6k following the failed Senate cloture vote, marking its biggest single day drop since June.
• Price Action: BTC lost $79k support and touched $75.6k. Overhead resistance sits firmly at $83k, though a daily golden cross recently formed.
• ETF Flows: $BTC ETFs saw four straight outflow days, losing $462.7M for the week. September 15 recorded a single day net outflow of $450.4M, bringing YTD net flows back to negative $1.46B.
• ETH Relative Strength: $ETH ETFs pulled in $197M for the week and hold over $1.06B YTD. ETH held support between $2,432 and $2,505.
• Corporate Buys: Strive added 469 BTC to hit a 25,000 BTC total, while BitMine added over 27,000 ETH.
📌 Sentiment and Regulation
The Fear and Greed index cooled from 76 to 62. The Senate cloture vote failed on September 15, removing a major regulatory catalyst.
Liquidations reached $685.6M with open interest dropping to $133.4B. Major liquidation clusters now rest at $74.7k and $76.8k.
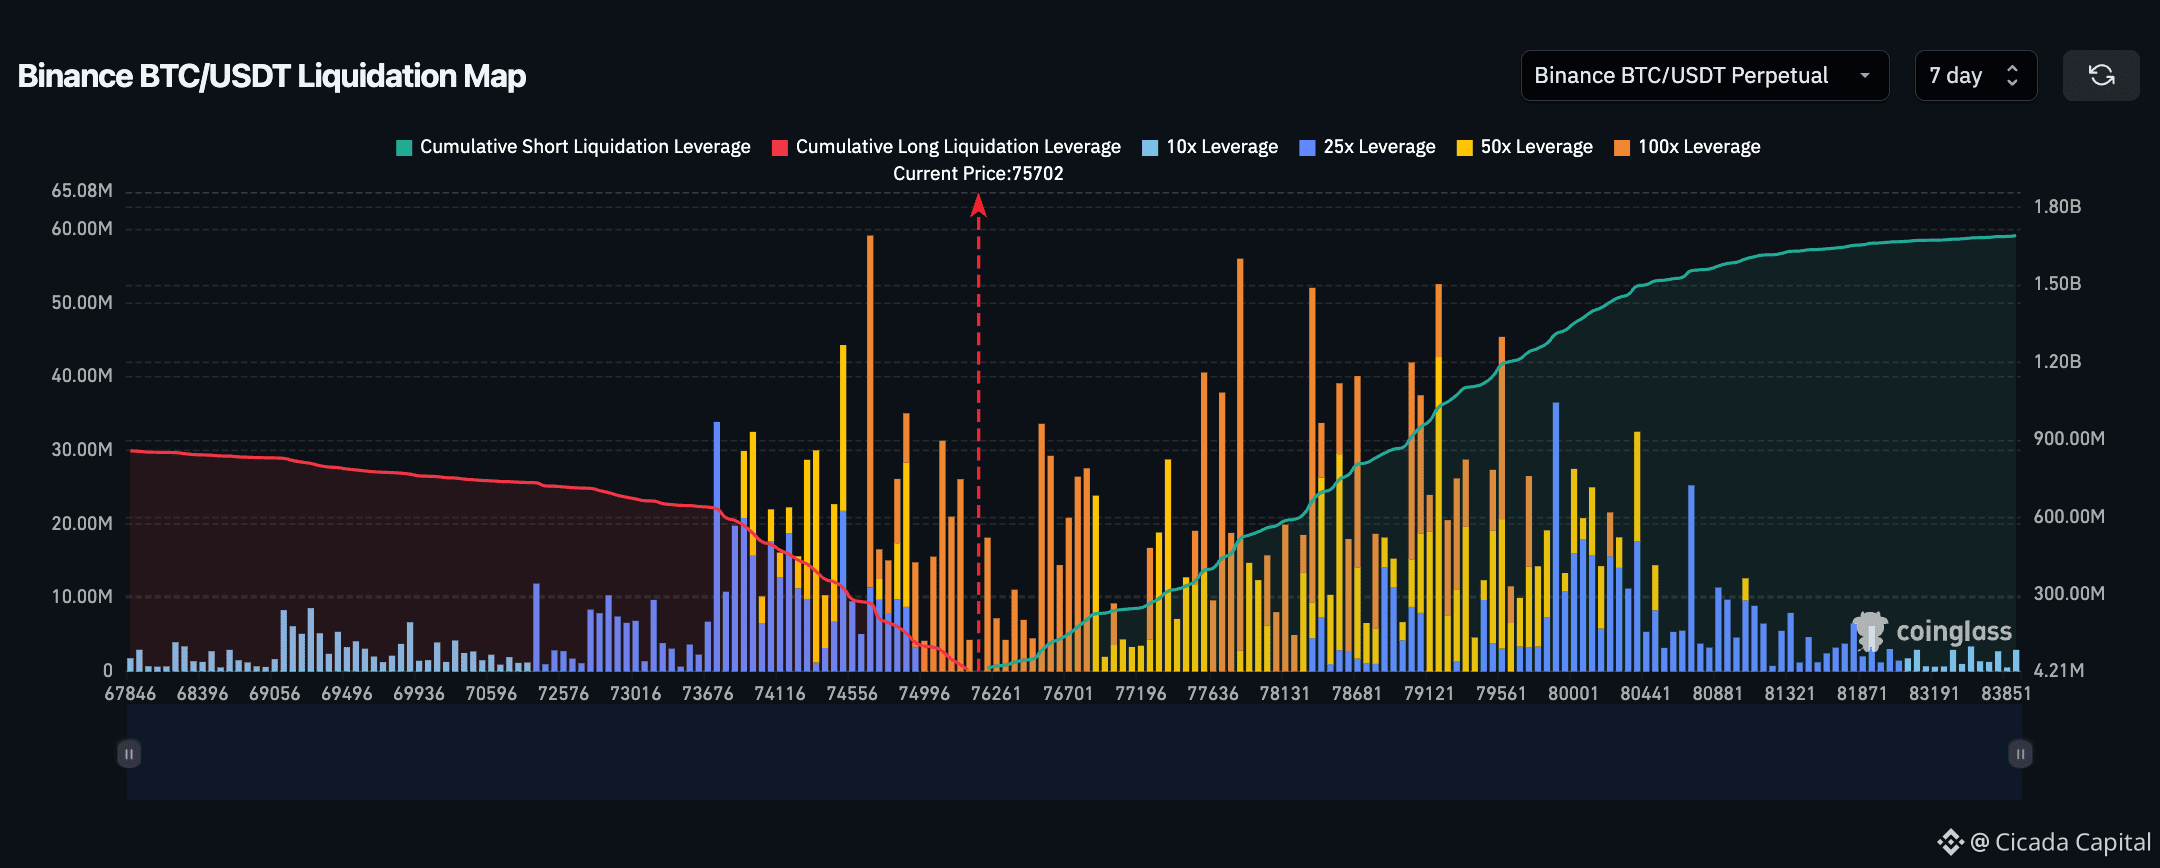
697
📊 Weekly Recap: The $81k Rejection and The Warsh Shock
Bitcoin tagged a three month high above $81,000 before Fed Chair Warsh hawk debut knocked it down to $76k. A violent V-reversal then pushed price back above $80k.
📌 The Macro Pivot
AI tech rallied while the Fed repriced September rate expectations.
• Nvidia Rally: Q2 revenue hit $96.2B. Shares surged 8.7 percent in a single session, adding roughly $442B in market cap as the AI bid survived.
• Warsh Keynote: At Jackson Hole, Warsh stated financial conditions are not restrictive. July core PCE stayed at 3.3 percent. FedWatch odds for a September hike jumped to roughly 63 percent.
• Jitters: Brent oil approached $95 on geopolitics and tariffs. The Nasdaq posted its worst day in two weeks as 10Y yields hovered near 4.8 percent.
📌 Bitcoin Round Trip
$BTC moved from $79k to $81,347, flushed to $76,248 following Warsh remarks, and then bounced back to $80,400.
• Price Action: The $75k to $76k support zone held firmly, absorbing the leverage flush. BTC finished relatively flat on the week after digesting its previous 23 percent run.
• ETF Flows: A nine day streak ended on August 28 with outflows, but net weekly flows remained positive at +$122M. AUM sits near $97B, marking August as the best month since October 2025 at +$3.32B.
• ETH Buys: $ETH ETFs saw a 12 day inflow streak totaling +$376M. MicroStrategy bought 4,603 BTC for $370M, while total corporate net buying surged 530 percent week over week to $513M.
📌 Sentiment and Liquidity
The Fear and Greed index settled at 76. Roughly $488M in long positions were liquidated during the August 28 pullback, dropping open interest to $135B.
Meanwhile, CLARITY Act passage odds on Polymarket dropped to 13 percent ahead of the September 15 vote. Major support rests at $75k with resistance at $82k.
📊 Weekly Recap: The $81k Rejection and The Warsh Shock
Bitcoin tagged a three month high above $81,000 before Fed Chair Warsh hawk debut knocked it down to $76k. A violent V-reversal then pushed price back above $80k.
📌 The Macro Pivot
AI tech rallied while the Fed repriced September rate expectations.
• Nvidia Rally: Q2 revenue hit $96.2B. Shares surged 8.7 percent in a single session, adding roughly $442B in market cap as the AI bid survived.
• Warsh Keynote: At Jackson Hole, Warsh stated financial conditions are not restrictive. July core PCE stayed at 3.3 percent. FedWatch odds for a September hike jumped to roughly 63 percent.
• Jitters: Brent oil approached $95 on geopolitics and tariffs. The Nasdaq posted its worst day in two weeks as 10Y yields hovered near 4.8 percent.
📌 Bitcoin Round Trip
$BTC moved from $79k to $81,347, flushed to $76,248 following Warsh remarks, and then bounced back to $80,400.
• Price Action: The $75k to $76k support zone held firmly, absorbing the leverage flush. BTC finished relatively flat on the week after digesting its previous 23 percent run.
• ETF Flows: A nine day streak ended on August 28 with outflows, but net weekly flows remained positive at +$122M. AUM sits near $97B, marking August as the best month since October 2025 at +$3.32B.
• ETH Buys: $ETH ETFs saw a 12 day inflow streak totaling +$376M. MicroStrategy bought 4,603 BTC for $370M, while total corporate net buying surged 530 percent week over week to $513M.
📌 Sentiment and Liquidity
The Fear and Greed index settled at 76. Roughly $488M in long positions were liquidated during the August 28 pullback, dropping open interest to $135B.
Meanwhile, CLARITY Act passage odds on Polymarket dropped to 13 percent ahead of the September 15 vote. Major support rests at $75k with resistance at $82k.
Bitcoin tagged a three month high above $81,000 before Fed Chair Warsh hawk debut knocked it down to $76k. A violent V-reversal then pushed price back above $80k.
📌 The Macro Pivot
AI tech rallied while the Fed repriced September rate expectations.
• Nvidia Rally: Q2 revenue hit $96.2B. Shares surged 8.7 percent in a single session, adding roughly $442B in market cap as the AI bid survived.
• Warsh Keynote: At Jackson Hole, Warsh stated financial conditions are not restrictive. July core PCE stayed at 3.3 percent. FedWatch odds for a September hike jumped to roughly 63 percent.
• Jitters: Brent oil approached $95 on geopolitics and tariffs. The Nasdaq posted its worst day in two weeks as 10Y yields hovered near 4.8 percent.
📌 Bitcoin Round Trip
$BTC moved from $79k to $81,347, flushed to $76,248 following Warsh remarks, and then bounced back to $80,400.
• Price Action: The $75k to $76k support zone held firmly, absorbing the leverage flush. BTC finished relatively flat on the week after digesting its previous 23 percent run.
• ETF Flows: A nine day streak ended on August 28 with outflows, but net weekly flows remained positive at +$122M. AUM sits near $97B, marking August as the best month since October 2025 at +$3.32B.
• ETH Buys: $ETH ETFs saw a 12 day inflow streak totaling +$376M. MicroStrategy bought 4,603 BTC for $370M, while total corporate net buying surged 530 percent week over week to $513M.
📌 Sentiment and Liquidity
The Fear and Greed index settled at 76. Roughly $488M in long positions were liquidated during the August 28 pullback, dropping open interest to $135B.
Meanwhile, CLARITY Act passage odds on Polymarket dropped to 13 percent ahead of the September 15 vote. Major support rests at $75k with resistance at $82k.

154
📊 Weekly Recap: The $81k Rejection and The Warsh Shock
Bitcoin tagged a three month high above $81,000 before Fed Chair Warsh hawk debut knocked it down to $76k. A violent V-reversal then pushed price back above $80k.
📌 The Macro Pivot
AI tech rallied while the Fed repriced September rate expectations.
• Nvidia Rally: Q2 revenue hit $96.2B. Shares surged 8.7 percent in a single session, adding roughly $442B in market cap as the AI bid survived.
• Warsh Keynote: At Jackson Hole, Warsh stated financial conditions are not restrictive. July core PCE stayed at 3.3 percent. FedWatch odds for a September hike jumped to roughly 63 percent.
• Bond Jitters: Brent oil approached $95 on geopolitics and tariffs. The Nasdaq posted its worst day in two weeks as 10Y yields hovered near 4.8 percent.
📌 Bitcoin Round Trip
$BTC moved from $79k to $81,347, flushed to $76,248 following Warsh remarks, and then bounced back to $80,400.
• Price Action: The $75k to $76k support zone held firmly, absorbing the leverage flush. BTC finished relatively flat on the week after digesting its previous 23 percent run.
• ETF Flows: A nine day streak ended on August 28 with outflows, but net weekly flows remained positive at +$122M. AUM sits near $97B, marking August as the best month since October 2025 at +$3.32B.
• ETH and Corporate Buys: $ETH ETFs saw a 12 day inflow streak totaling +$376M. MicroStrategy bought 4,603 BTC for $370M, while total corporate net buying surged 530 percent week over week to $513M.
📌 Sentiment and Liquidity
The Fear and Greed index settled at 76. Roughly $488M in long positions were liquidated during the August 28 pullback, dropping open interest to $135B.
Meanwhile, CLARITY Act passage odds on Polymarket dropped to 13 percent ahead of the September 15 vote. Major support rests at $75k with resistance at $82k.
📊 Weekly Recap: The $81k Rejection and The Warsh Shock
Bitcoin tagged a three month high above $81,000 before Fed Chair Warsh hawk debut knocked it down to $76k. A violent V-reversal then pushed price back above $80k.
📌 The Macro Pivot
AI tech rallied while the Fed repriced September rate expectations.
• Nvidia Rally: Q2 revenue hit $96.2B. Shares surged 8.7 percent in a single session, adding roughly $442B in market cap as the AI bid survived.
• Warsh Keynote: At Jackson Hole, Warsh stated financial conditions are not restrictive. July core PCE stayed at 3.3 percent. FedWatch odds for a September hike jumped to roughly 63 percent.
• Bond Jitters: Brent oil approached $95 on geopolitics and tariffs. The Nasdaq posted its worst day in two weeks as 10Y yields hovered near 4.8 percent.
📌 Bitcoin Round Trip
$BTC moved from $79k to $81,347, flushed to $76,248 following Warsh remarks, and then bounced back to $80,400.
• Price Action: The $75k to $76k support zone held firmly, absorbing the leverage flush. BTC finished relatively flat on the week after digesting its previous 23 percent run.
• ETF Flows: A nine day streak ended on August 28 with outflows, but net weekly flows remained positive at +$122M. AUM sits near $97B, marking August as the best month since October 2025 at +$3.32B.
• ETH and Corporate Buys: $ETH ETFs saw a 12 day inflow streak totaling +$376M. MicroStrategy bought 4,603 BTC for $370M, while total corporate net buying surged 530 percent week over week to $513M.
📌 Sentiment and Liquidity
The Fear and Greed index settled at 76. Roughly $488M in long positions were liquidated during the August 28 pullback, dropping open interest to $135B.
Meanwhile, CLARITY Act passage odds on Polymarket dropped to 13 percent ahead of the September 15 vote. Major support rests at $75k with resistance at $82k.
Bitcoin tagged a three month high above $81,000 before Fed Chair Warsh hawk debut knocked it down to $76k. A violent V-reversal then pushed price back above $80k.
📌 The Macro Pivot
AI tech rallied while the Fed repriced September rate expectations.
• Nvidia Rally: Q2 revenue hit $96.2B. Shares surged 8.7 percent in a single session, adding roughly $442B in market cap as the AI bid survived.
• Warsh Keynote: At Jackson Hole, Warsh stated financial conditions are not restrictive. July core PCE stayed at 3.3 percent. FedWatch odds for a September hike jumped to roughly 63 percent.
• Bond Jitters: Brent oil approached $95 on geopolitics and tariffs. The Nasdaq posted its worst day in two weeks as 10Y yields hovered near 4.8 percent.
📌 Bitcoin Round Trip
$BTC moved from $79k to $81,347, flushed to $76,248 following Warsh remarks, and then bounced back to $80,400.
• Price Action: The $75k to $76k support zone held firmly, absorbing the leverage flush. BTC finished relatively flat on the week after digesting its previous 23 percent run.
• ETF Flows: A nine day streak ended on August 28 with outflows, but net weekly flows remained positive at +$122M. AUM sits near $97B, marking August as the best month since October 2025 at +$3.32B.
• ETH and Corporate Buys: $ETH ETFs saw a 12 day inflow streak totaling +$376M. MicroStrategy bought 4,603 BTC for $370M, while total corporate net buying surged 530 percent week over week to $513M.
📌 Sentiment and Liquidity
The Fear and Greed index settled at 76. Roughly $488M in long positions were liquidated during the August 28 pullback, dropping open interest to $135B.
Meanwhile, CLARITY Act passage odds on Polymarket dropped to 13 percent ahead of the September 15 vote. Major support rests at $75k with resistance at $82k.
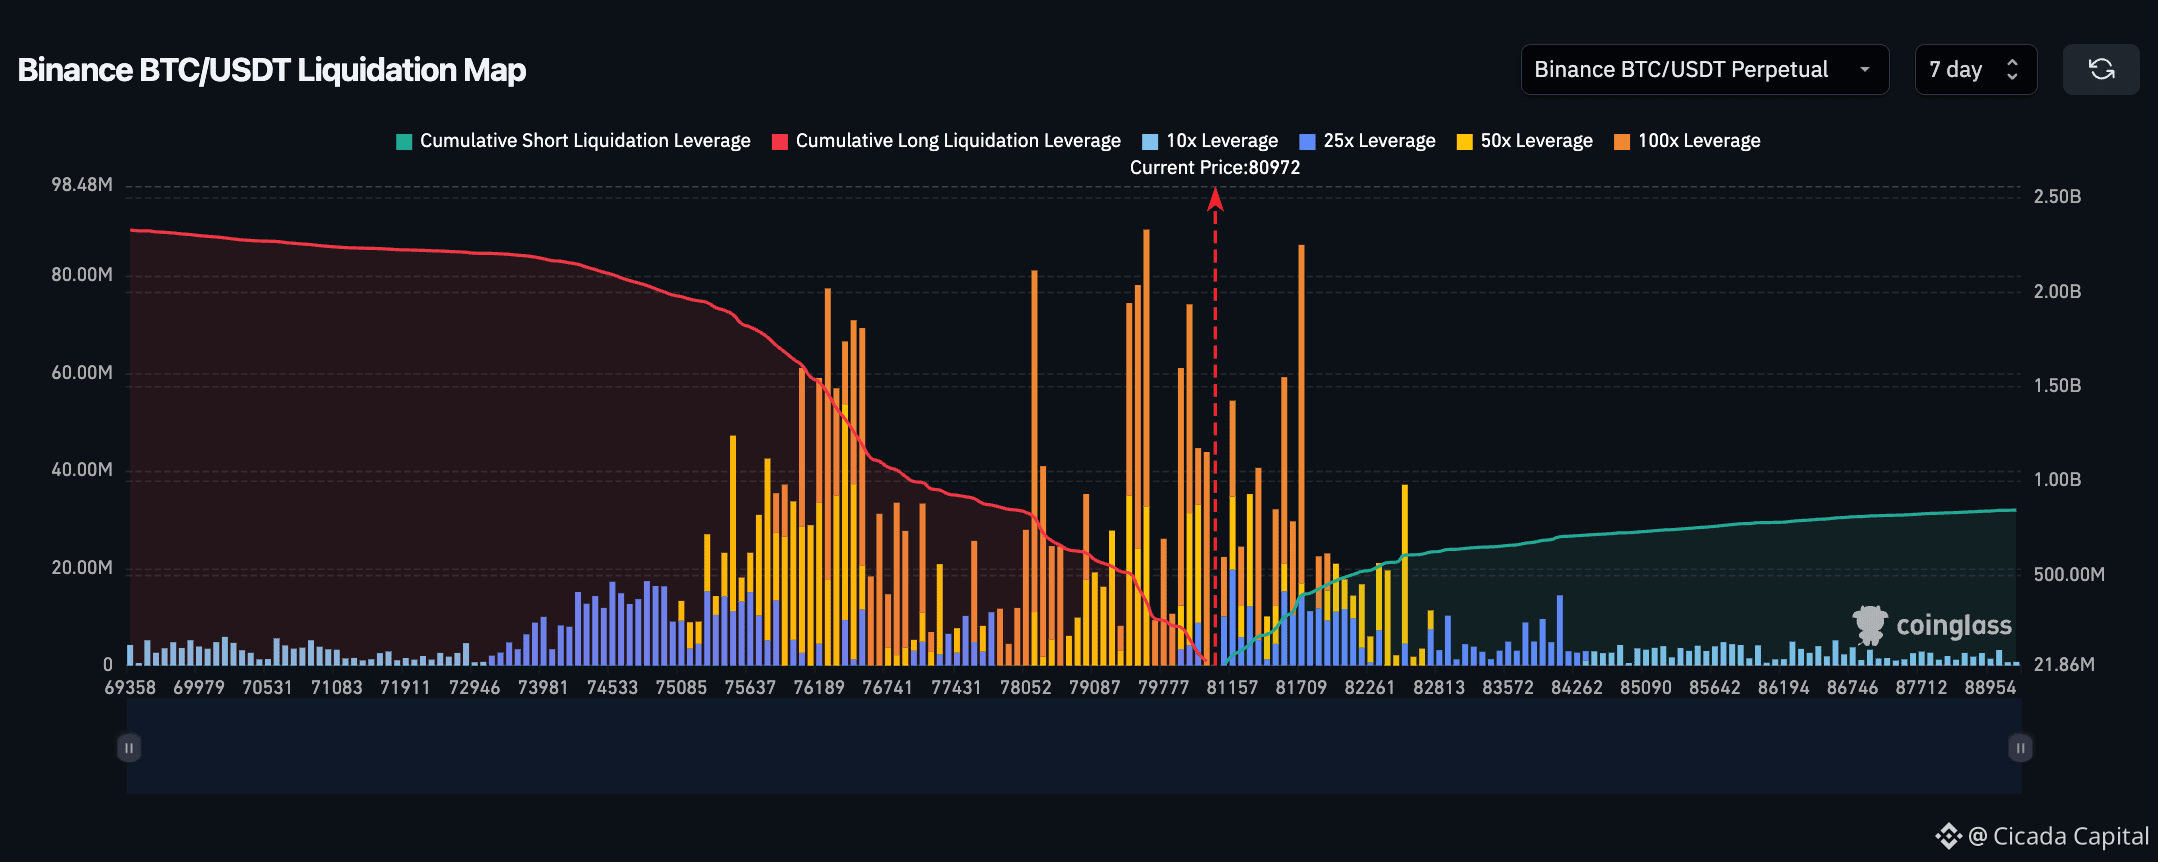
1.8k
📊 On‑Chain & Futures Analysis
— Weekly Market Brief
📌 Deleveraging After the Local Top
Futures leverage reset significantly over the week. $BTC opened at $77,749 and surged past $80K to print a three-month high of $81,347. The subsequent hawkish Fed commentary triggered a $481M liquidation event, pulling prices down to $76,909 before a weekend recovery back to $78.4K.
$ETH tracked closely, consolidating around $2,448 after reaching an intraday peak of $2,564.
📌 Derivatives Reset to Neutral
Futures open interest dropped 11% in coin terms during the pull-back. Funding rates remained positive but normalized rapidly, indicating that the rally was driven primarily by spot market buying and short covering rather than over-leveraged long positions.
📌 Whale Accumulation vs Retail Selling
Large wallets holding over 100 BTC added 39K BTC to their balances this week, contrasting with heavy retail distribution. On-chain bull metrics reached their highest levels since late 2025, though short-term holder profit realization hit $1.2B over a three-day window.
Crucial support sits at $76.9K down to the $73.7K defense zone, while resistance remains firm at the $81K to $83K technical wall.
📊 On‑Chain & Futures Analysis
— Weekly Market Brief
📌 Deleveraging After the Local Top
Futures leverage reset significantly over the week. $BTC opened at $77,749 and surged past $80K to print a three-month high of $81,347. The subsequent hawkish Fed commentary triggered a $481M liquidation event, pulling prices down to $76,909 before a weekend recovery back to $78.4K.
$ETH tracked closely, consolidating around $2,448 after reaching an intraday peak of $2,564.
📌 Derivatives Reset to Neutral
Futures open interest dropped 11% in coin terms during the pull-back. Funding rates remained positive but normalized rapidly, indicating that the rally was driven primarily by spot market buying and short covering rather than over-leveraged long positions.
📌 Whale Accumulation vs Retail Selling
Large wallets holding over 100 BTC added 39K BTC to their balances this week, contrasting with heavy retail distribution. On-chain bull metrics reached their highest levels since late 2025, though short-term holder profit realization hit $1.2B over a three-day window.
Crucial support sits at $76.9K down to the $73.7K defense zone, while resistance remains firm at the $81K to $83K technical wall.
— Weekly Market Brief
📌 Deleveraging After the Local Top
Futures leverage reset significantly over the week. $BTC opened at $77,749 and surged past $80K to print a three-month high of $81,347. The subsequent hawkish Fed commentary triggered a $481M liquidation event, pulling prices down to $76,909 before a weekend recovery back to $78.4K.
$ETH tracked closely, consolidating around $2,448 after reaching an intraday peak of $2,564.
📌 Derivatives Reset to Neutral
Futures open interest dropped 11% in coin terms during the pull-back. Funding rates remained positive but normalized rapidly, indicating that the rally was driven primarily by spot market buying and short covering rather than over-leveraged long positions.
📌 Whale Accumulation vs Retail Selling
Large wallets holding over 100 BTC added 39K BTC to their balances this week, contrasting with heavy retail distribution. On-chain bull metrics reached their highest levels since late 2025, though short-term holder profit realization hit $1.2B over a three-day window.
Crucial support sits at $76.9K down to the $73.7K defense zone, while resistance remains firm at the $81K to $83K technical wall.
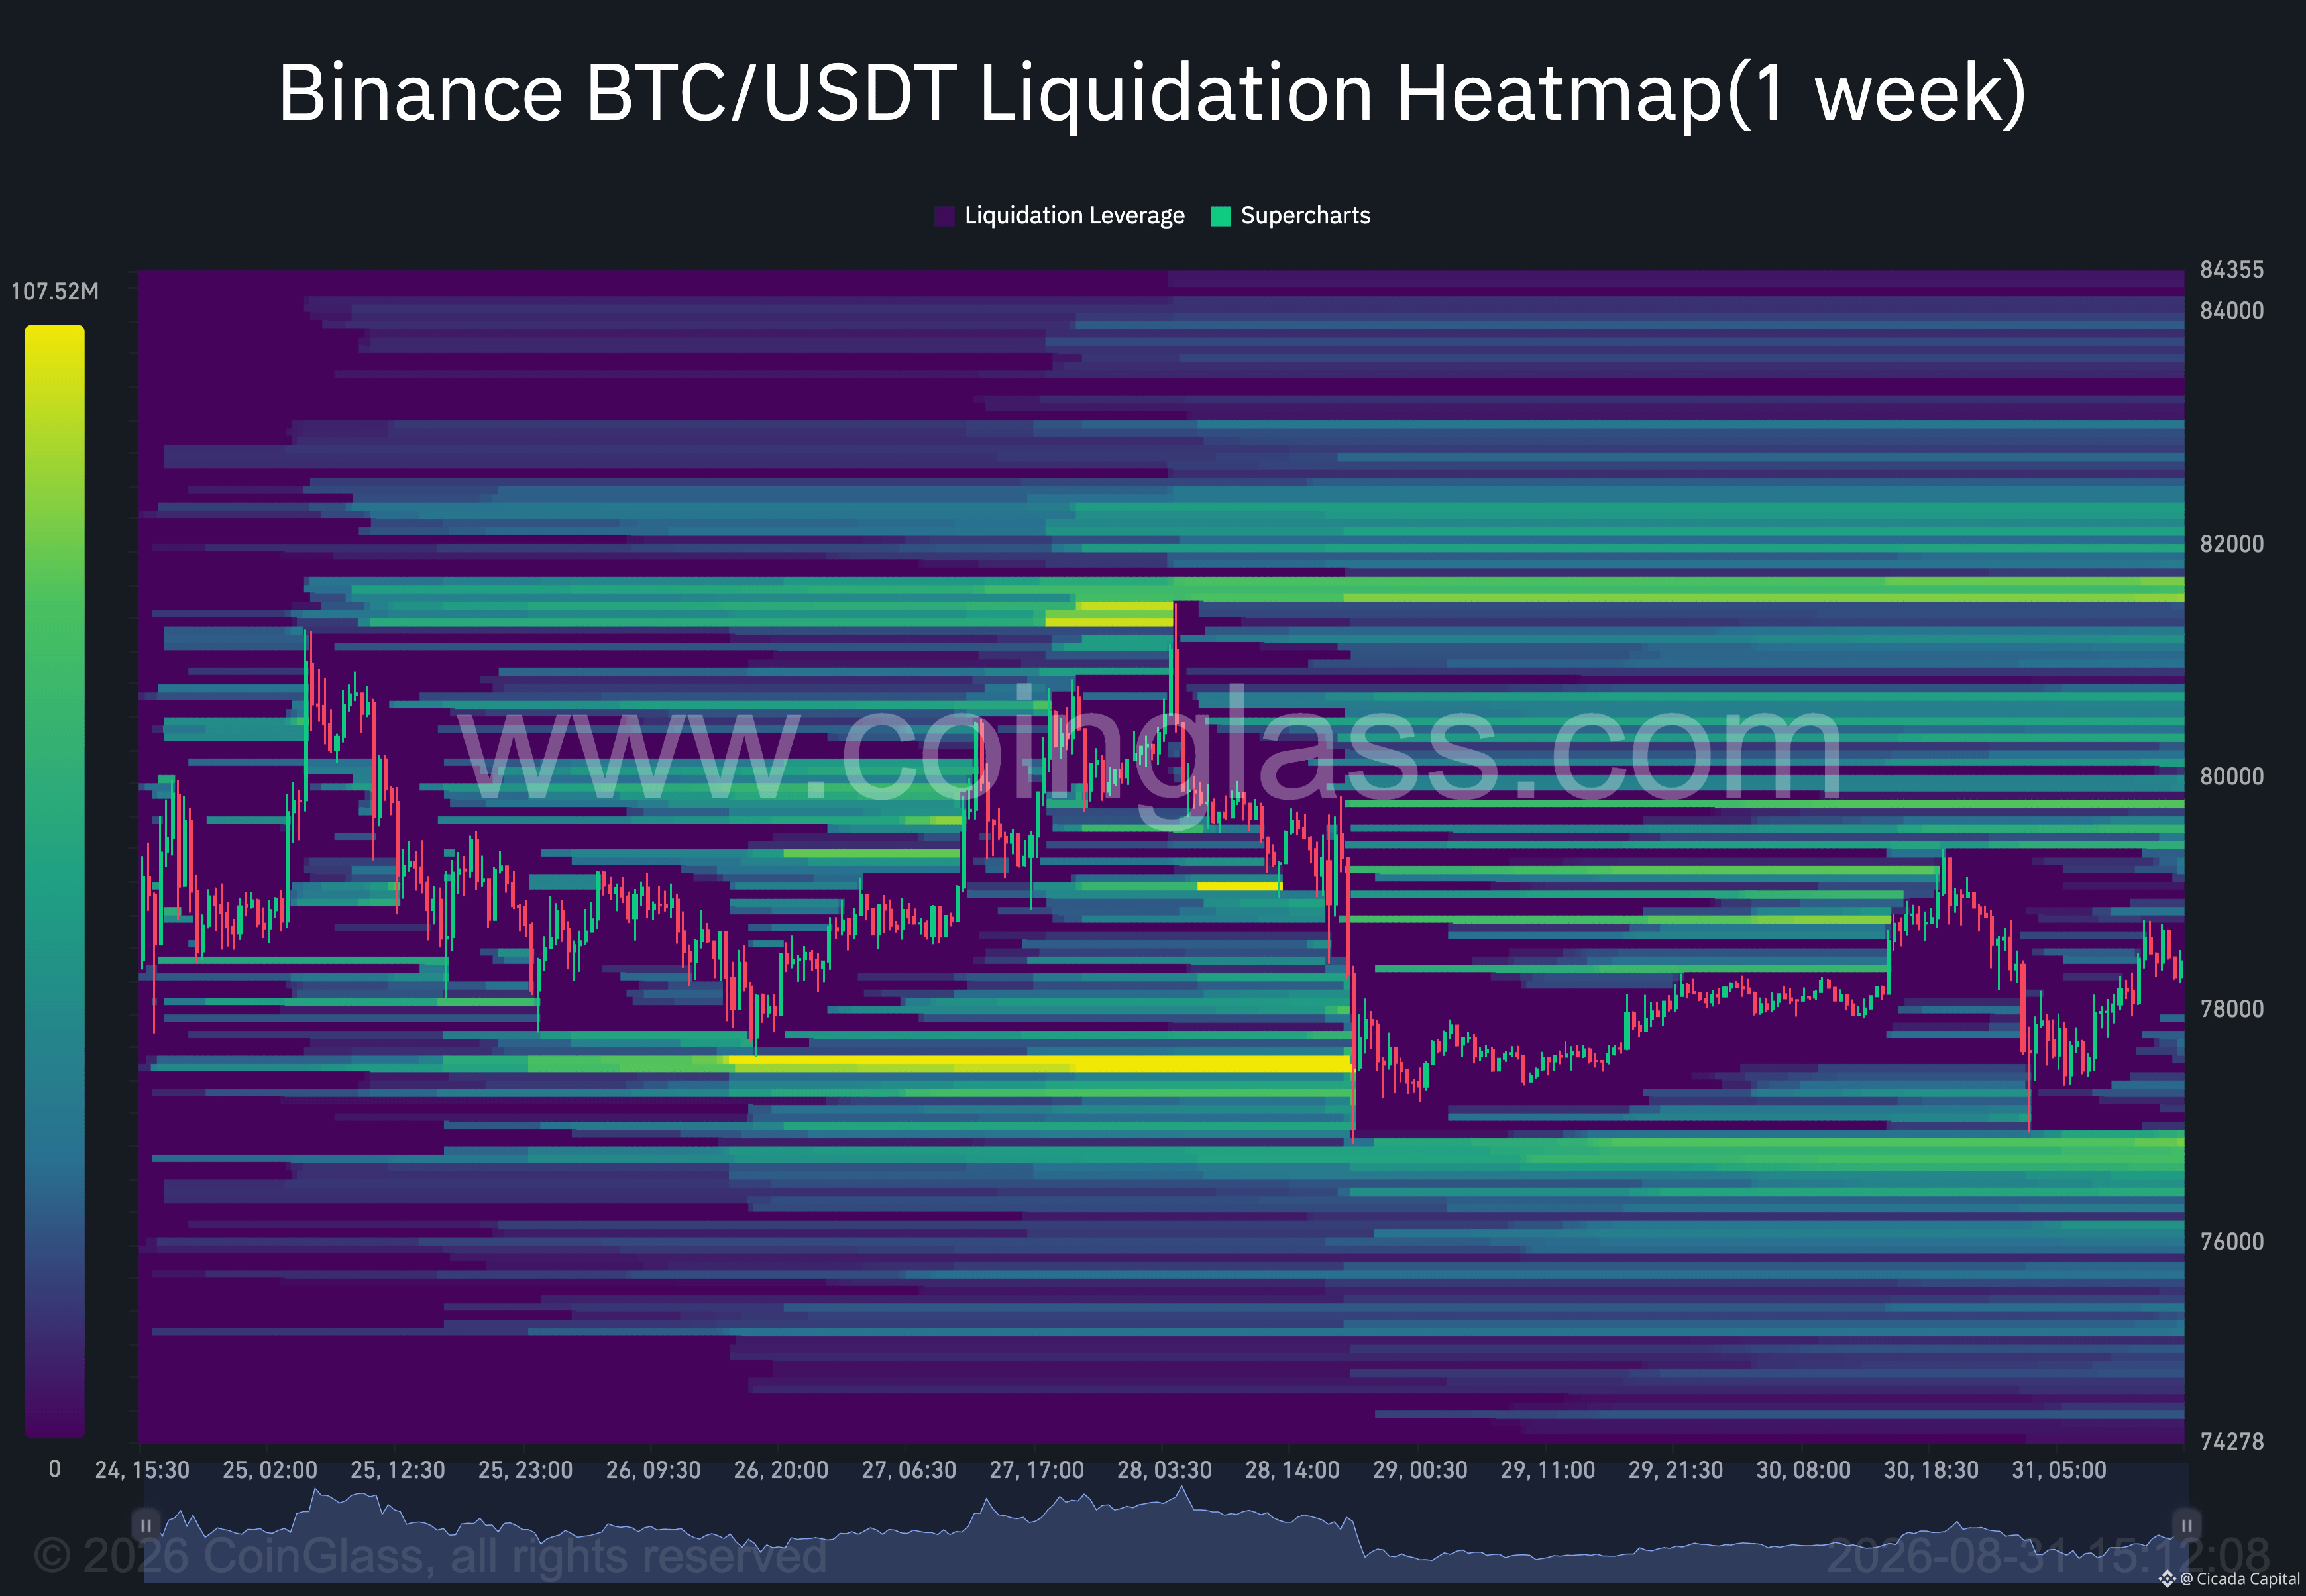
275
📊 Crypto Capital Flows
— Weekly Market Brief
📌 August Delivers Massive Inflows
Institutional demand remained resilient throughout the week, pulling $924.5M into Bitcoin ETFs and $824.4M into Ethereum ETFs. August officially closed as the strongest ETF month since October 2025, even as broader market momentum began to slow toward the weekend.
📌 Bitcoin vs Ethereum ETF Activity
$BTC ETFs saw four consecutive days of strong buying before recording a $201.9M outflow on Friday following Fed rate concerns. BlackRock's IBIT dominated the weekly volume with $937.2M in net buys, pushing total US spot ETF holdings to 1.25M BTC.
$ETH ETFs proved even more consistent, extending a 10-day streak of positive net inflows and bringing cumulative totals to $12.9B.
📌 Exchange Dynamics and Corporate Reserves
On-chain data showed 15.0K BTC leaving exchanges over the week, confirming steady spot accumulation through price dips. Conversely, Ethereum saw 43.4K ETH flow into exchanges as short-term traders took profits after the recent 32% pump.
Corporate players remained active: Metaplanet moved 2,400 BTC to Coinbase Prime, MicroStrategy raised $2.01B through share sales, and BitMine expanded its treasury to 5.85M ETH.
📊 Crypto Capital Flows
— Weekly Market Brief
📌 August Delivers Massive Inflows
Institutional demand remained resilient throughout the week, pulling $924.5M into Bitcoin ETFs and $824.4M into Ethereum ETFs. August officially closed as the strongest ETF month since October 2025, even as broader market momentum began to slow toward the weekend.
📌 Bitcoin vs Ethereum ETF Activity
$BTC ETFs saw four consecutive days of strong buying before recording a $201.9M outflow on Friday following Fed rate concerns. BlackRock's IBIT dominated the weekly volume with $937.2M in net buys, pushing total US spot ETF holdings to 1.25M BTC.
$ETH ETFs proved even more consistent, extending a 10-day streak of positive net inflows and bringing cumulative totals to $12.9B.
📌 Exchange Dynamics and Corporate Reserves
On-chain data showed 15.0K BTC leaving exchanges over the week, confirming steady spot accumulation through price dips. Conversely, Ethereum saw 43.4K ETH flow into exchanges as short-term traders took profits after the recent 32% pump.
Corporate players remained active: Metaplanet moved 2,400 BTC to Coinbase Prime, MicroStrategy raised $2.01B through share sales, and BitMine expanded its treasury to 5.85M ETH.
— Weekly Market Brief
📌 August Delivers Massive Inflows
Institutional demand remained resilient throughout the week, pulling $924.5M into Bitcoin ETFs and $824.4M into Ethereum ETFs. August officially closed as the strongest ETF month since October 2025, even as broader market momentum began to slow toward the weekend.
📌 Bitcoin vs Ethereum ETF Activity
$BTC ETFs saw four consecutive days of strong buying before recording a $201.9M outflow on Friday following Fed rate concerns. BlackRock's IBIT dominated the weekly volume with $937.2M in net buys, pushing total US spot ETF holdings to 1.25M BTC.
$ETH ETFs proved even more consistent, extending a 10-day streak of positive net inflows and bringing cumulative totals to $12.9B.
📌 Exchange Dynamics and Corporate Reserves
On-chain data showed 15.0K BTC leaving exchanges over the week, confirming steady spot accumulation through price dips. Conversely, Ethereum saw 43.4K ETH flow into exchanges as short-term traders took profits after the recent 32% pump.
Corporate players remained active: Metaplanet moved 2,400 BTC to Coinbase Prime, MicroStrategy raised $2.01B through share sales, and BitMine expanded its treasury to 5.85M ETH.
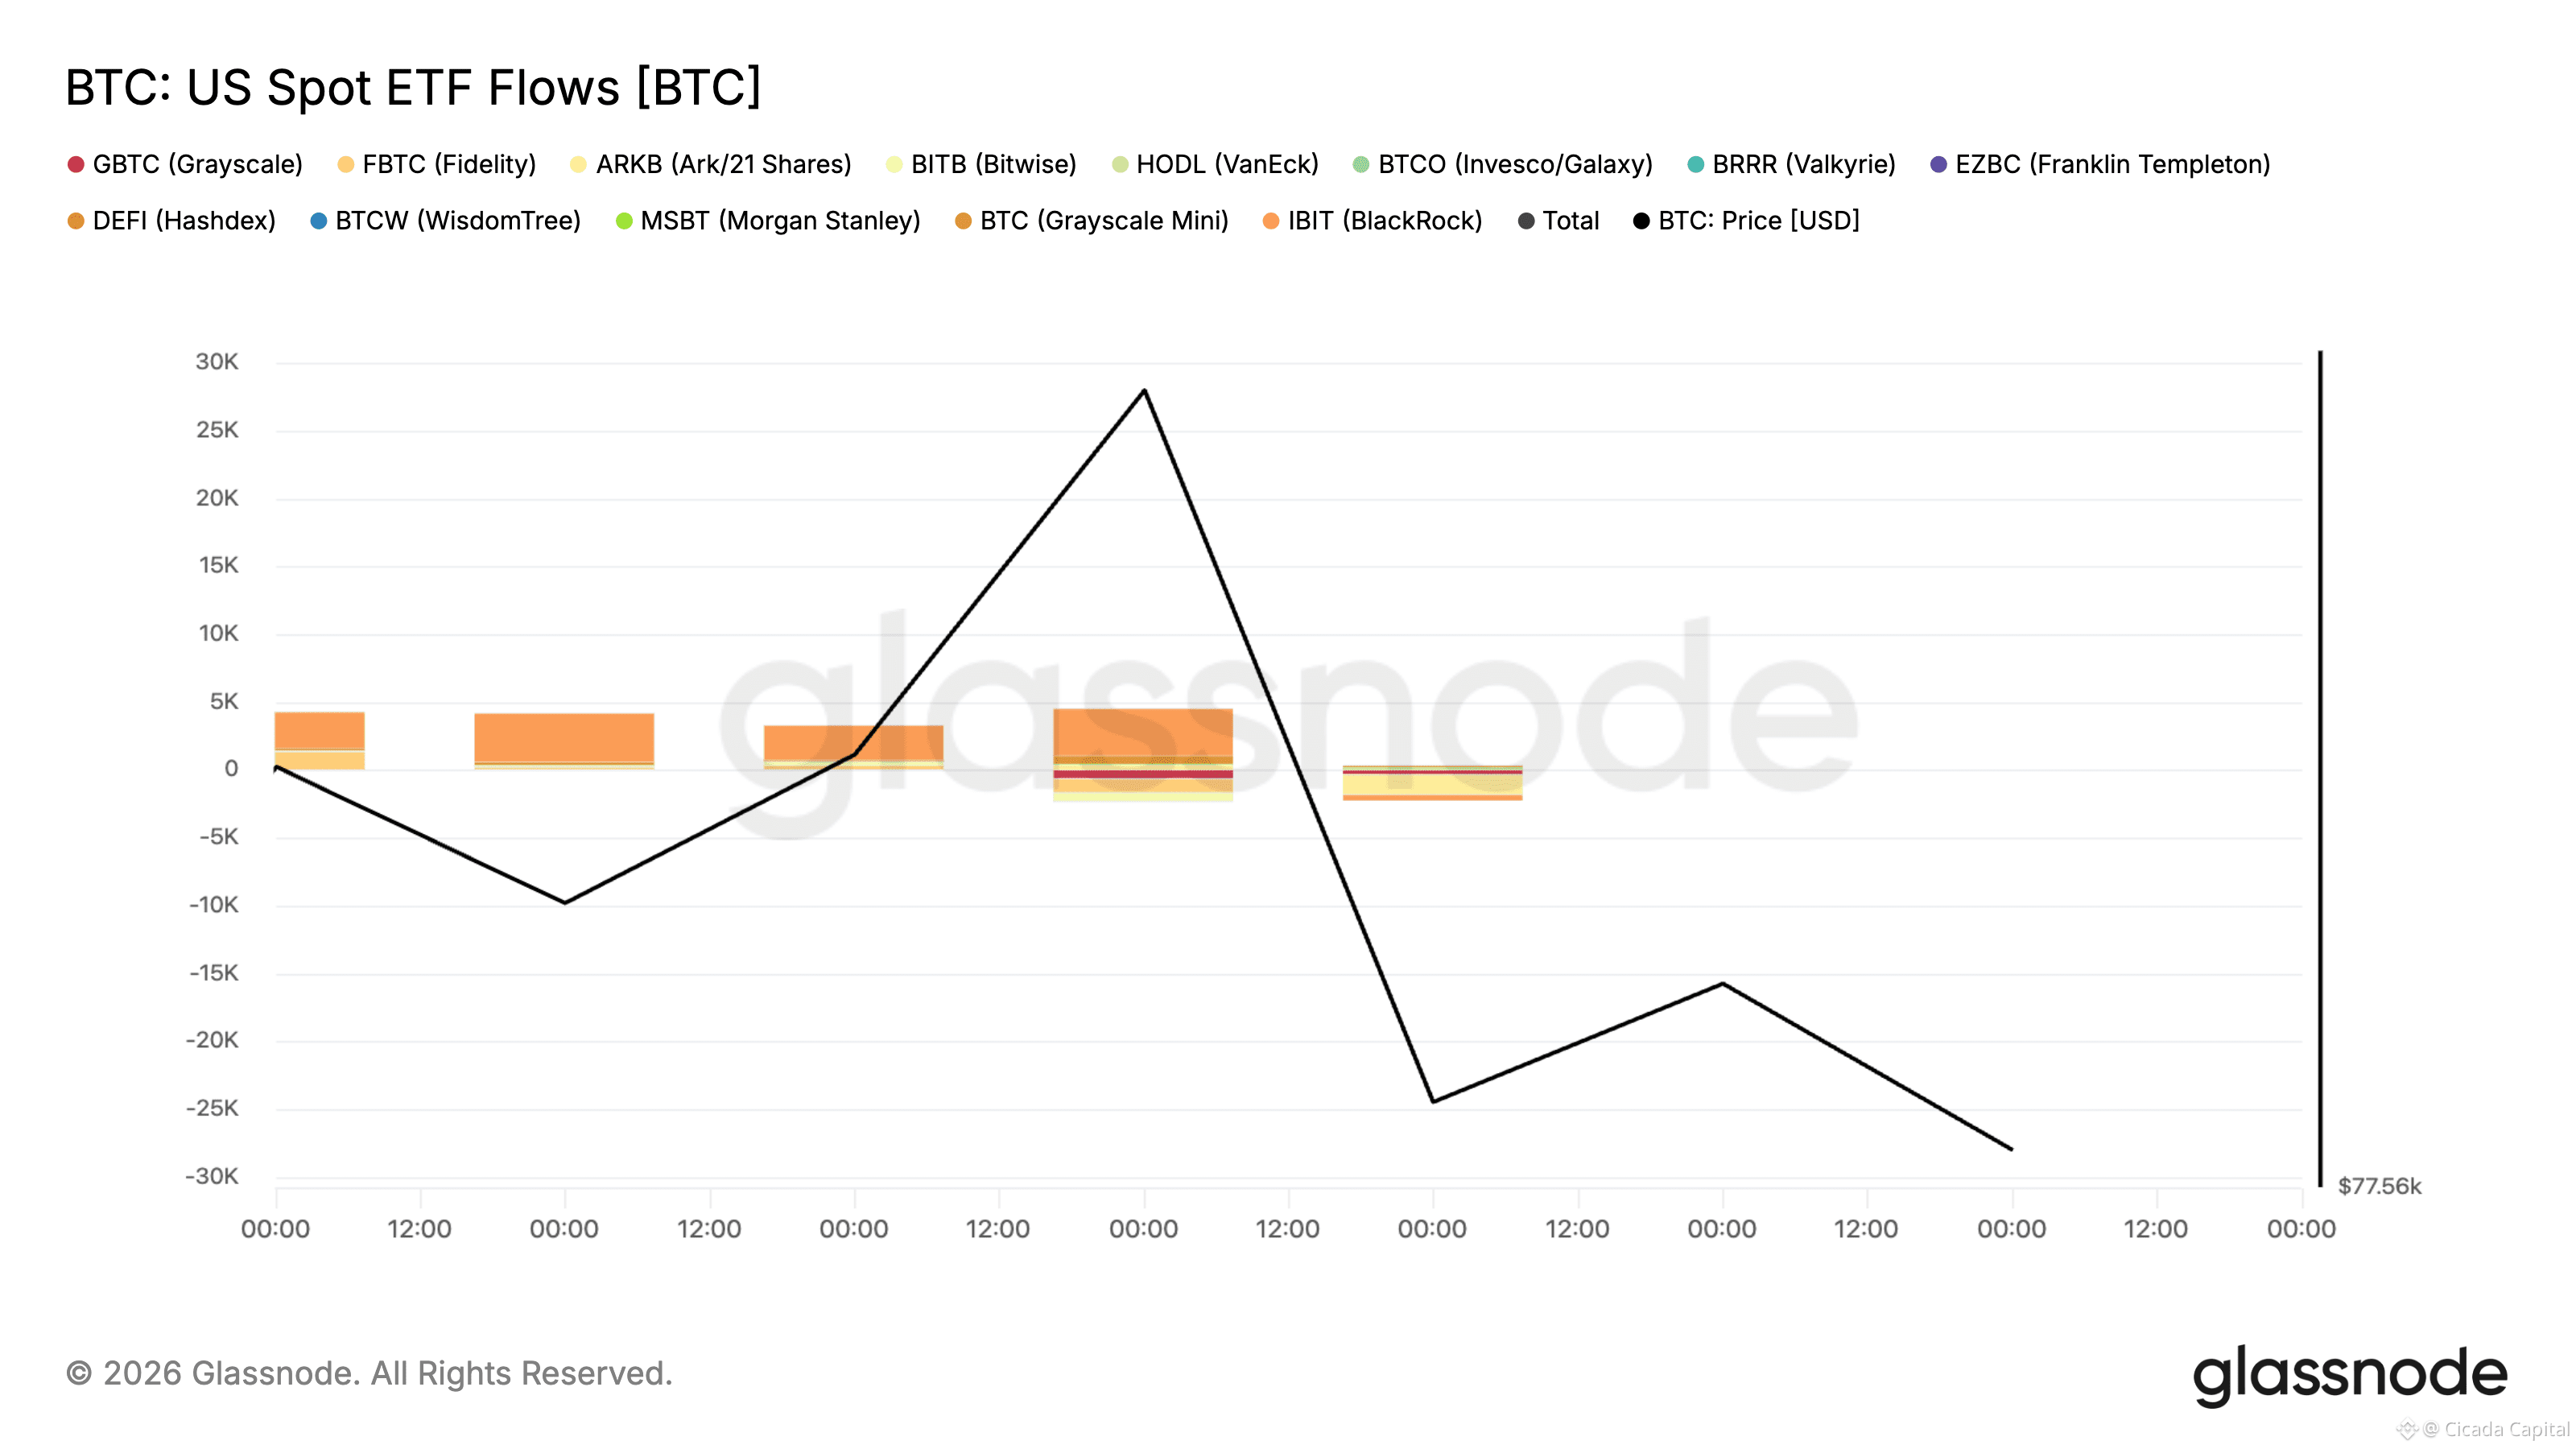
160
📊 Macro Overview
— Weekly Market Brief
📌 The Dovish Honeymoon Is Over
Warsh's first keynote as Fed Chair ended the market's optimism. By calling the 2% inflation target firm and fixed, he warned that policymakers still have work to do.
Market odds for a September rate hike jumped straight to 60%, with major banks now projecting two rate increases ahead. The US Dollar Index ripped higher to 99.69, while Gold fell over 3% despite briefly touching $4,500.
📌 Sticky Inflation and Corporate Surges
The hawkish pivot comes alongside sticky July PCE data at 3.7% YoY. Jobless claims fell to 203K, showing continued labor resilience, though new-home sales dropped 10.5%.
Stock markets traded mixed: the S&P 500 closed slightly lower at 7,711.76 while the Nasdaq pulled back. NVIDIA acted as the main counterweight, surging nearly 9% after reporting $96.2B in revenue and adding $442B in market cap in a single day.
📌 Regulatory Deadlines Ahead
Geopolitical tension pushed Brent crude above $90 following US strikes on Iran. Meanwhile, the Clarity Act faces a crucial cloture vote on September 15 requiring 60 votes, though passage odds have fallen to 19.5% over bank yield disputes.
The upcoming August NFP report on September 4 stands as the final major economic release before the next FOMC meeting.
📊 Macro Overview
— Weekly Market Brief
📌 The Dovish Honeymoon Is Over
Warsh's first keynote as Fed Chair ended the market's optimism. By calling the 2% inflation target firm and fixed, he warned that policymakers still have work to do.
Market odds for a September rate hike jumped straight to 60%, with major banks now projecting two rate increases ahead. The US Dollar Index ripped higher to 99.69, while Gold fell over 3% despite briefly touching $4,500.
📌 Sticky Inflation and Corporate Surges
The hawkish pivot comes alongside sticky July PCE data at 3.7% YoY. Jobless claims fell to 203K, showing continued labor resilience, though new-home sales dropped 10.5%.
Stock markets traded mixed: the S&P 500 closed slightly lower at 7,711.76 while the Nasdaq pulled back. NVIDIA acted as the main counterweight, surging nearly 9% after reporting $96.2B in revenue and adding $442B in market cap in a single day.
📌 Regulatory Deadlines Ahead
Geopolitical tension pushed Brent crude above $90 following US strikes on Iran. Meanwhile, the Clarity Act faces a crucial cloture vote on September 15 requiring 60 votes, though passage odds have fallen to 19.5% over bank yield disputes.
The upcoming August NFP report on September 4 stands as the final major economic release before the next FOMC meeting.
— Weekly Market Brief
📌 The Dovish Honeymoon Is Over
Warsh's first keynote as Fed Chair ended the market's optimism. By calling the 2% inflation target firm and fixed, he warned that policymakers still have work to do.
Market odds for a September rate hike jumped straight to 60%, with major banks now projecting two rate increases ahead. The US Dollar Index ripped higher to 99.69, while Gold fell over 3% despite briefly touching $4,500.
📌 Sticky Inflation and Corporate Surges
The hawkish pivot comes alongside sticky July PCE data at 3.7% YoY. Jobless claims fell to 203K, showing continued labor resilience, though new-home sales dropped 10.5%.
Stock markets traded mixed: the S&P 500 closed slightly lower at 7,711.76 while the Nasdaq pulled back. NVIDIA acted as the main counterweight, surging nearly 9% after reporting $96.2B in revenue and adding $442B in market cap in a single day.
📌 Regulatory Deadlines Ahead
Geopolitical tension pushed Brent crude above $90 following US strikes on Iran. Meanwhile, the Clarity Act faces a crucial cloture vote on September 15 requiring 60 votes, though passage odds have fallen to 19.5% over bank yield disputes.
The upcoming August NFP report on September 4 stands as the final major economic release before the next FOMC meeting.
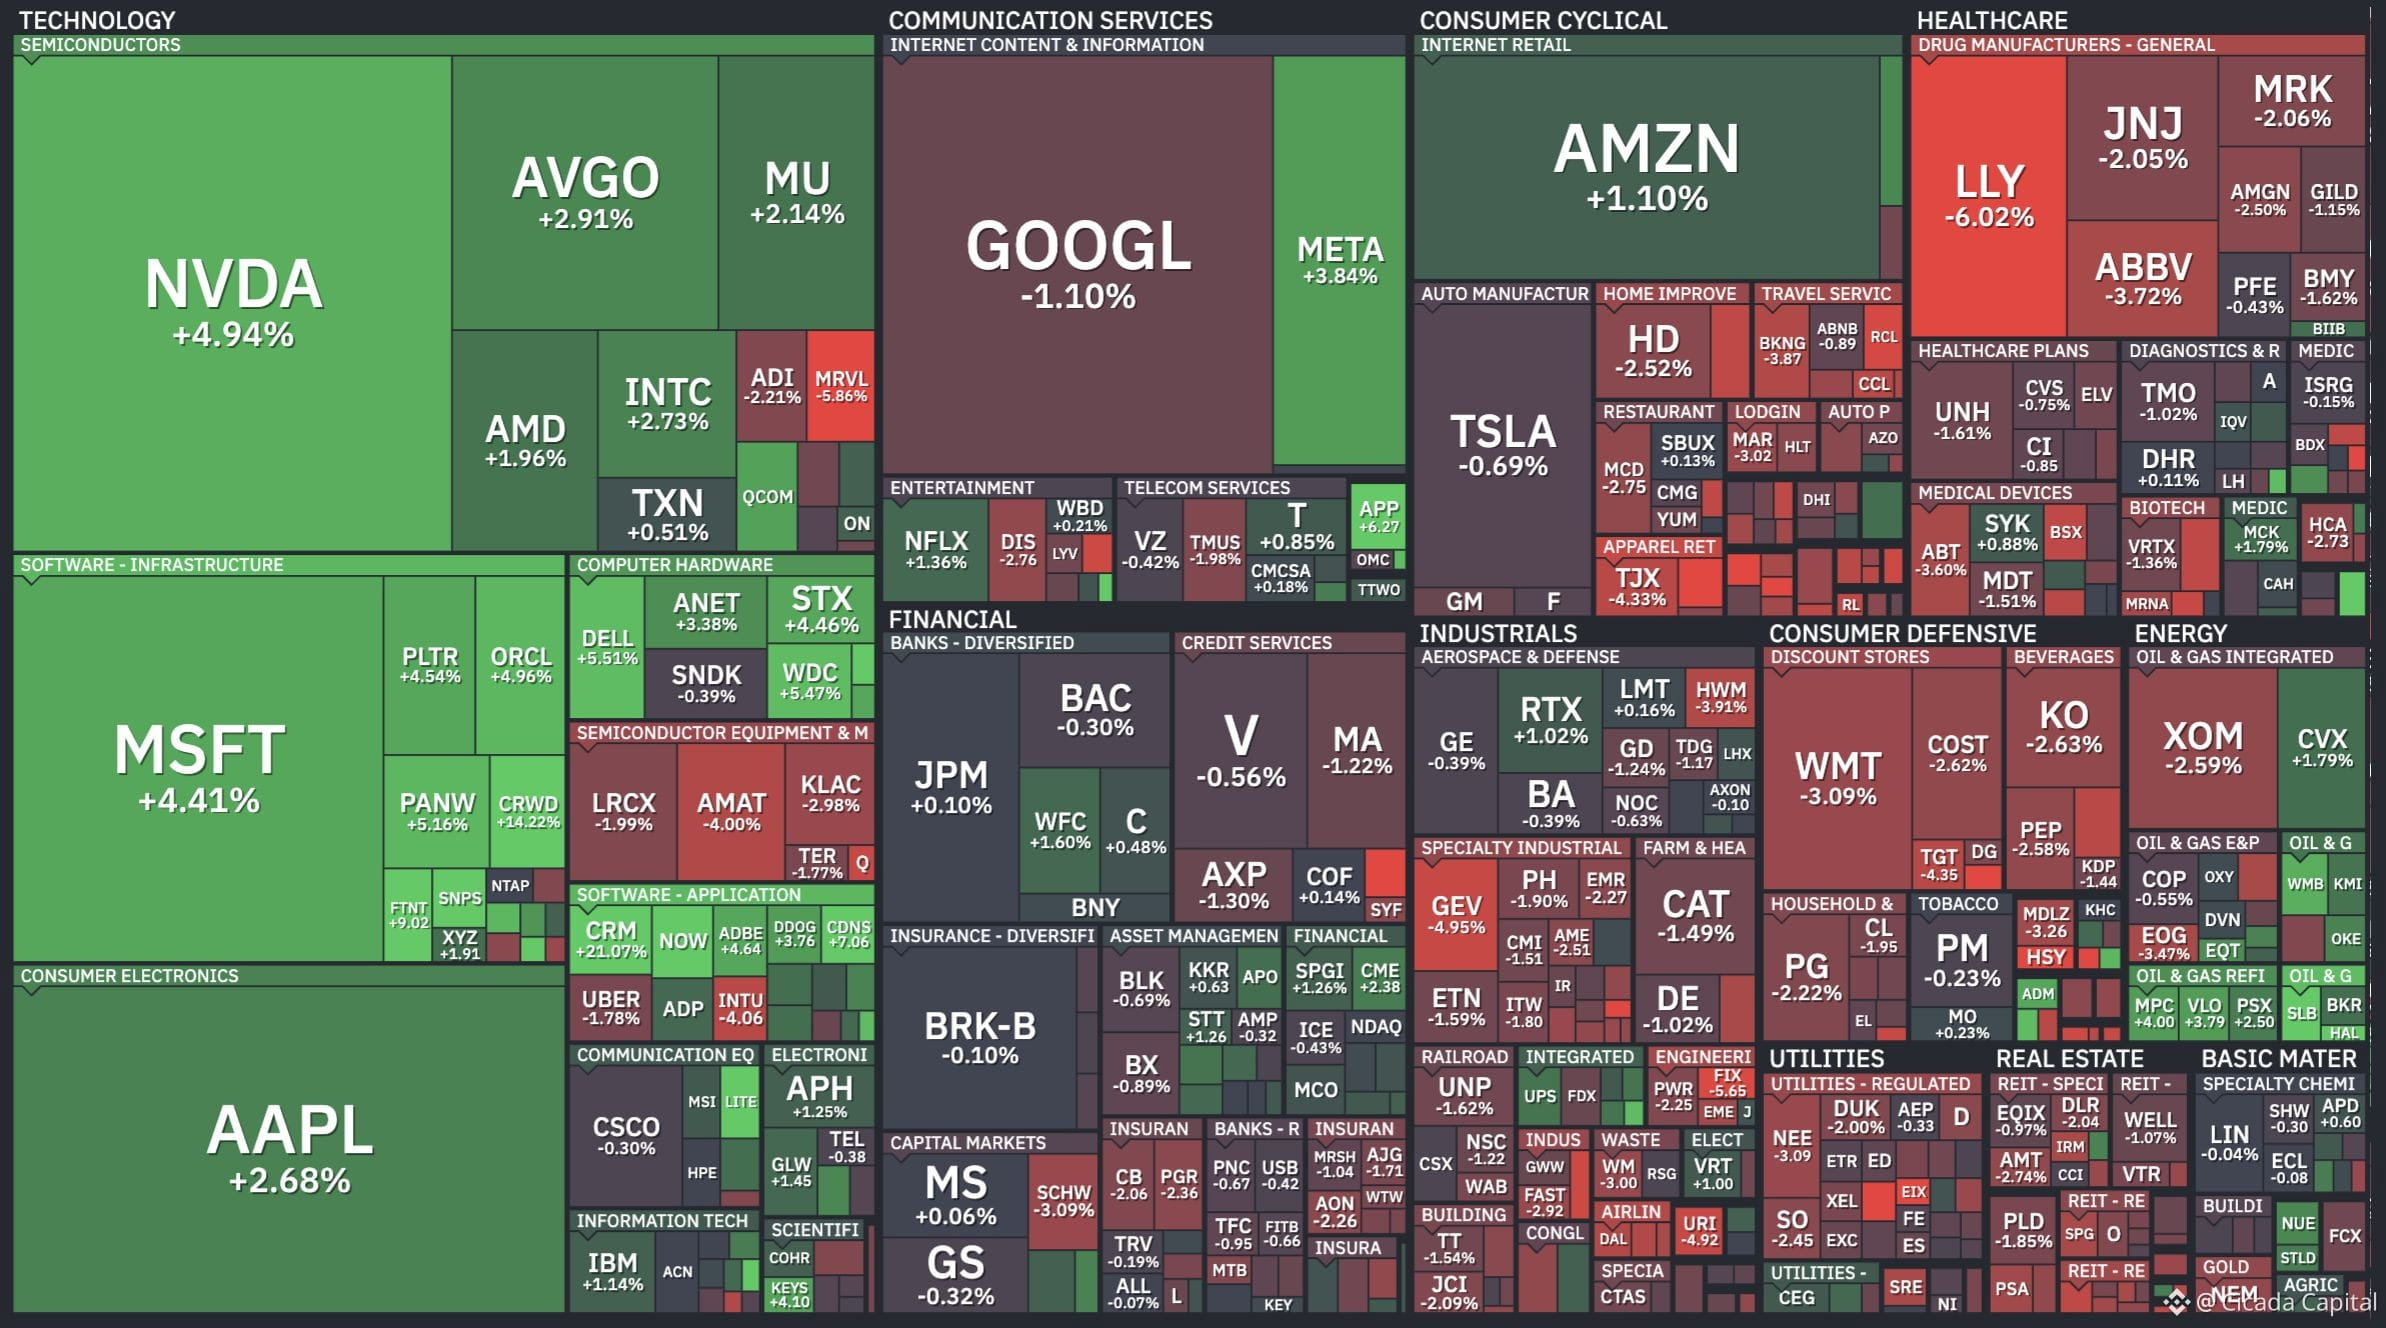
382

Article
Inside Robotics and Physical AIFeaturing insights from Axis Robotics
In 2026, the artificial intelligence industry learned to solve the compute problem. GPUs are becoming more accessible, models are cheaper to run inference on, cloud infrastructure keeps growing. But the next wave of AI, robotics and Physical AI, has a completely different problem. It all comes down to data that simply does not exist in the volume needed.
No Internet for Robots
LLMs grew out of a foundation that already existed. Decades of text on the internet, trillions of tokens spanning almost every domain of human knowledge. With that corpus already in place, progress came down to scaling compute and improving architectures.
Robotics has no such foundation. The physical world has no search index, and there is no “internet of robotic interactions” to train a model on.
The entire volume of data available today for training robots is a tiny fraction of the text corpora that modern language models are trained on. This creates a shortage of foundational data at every level.
Robotics' Missing GPT-1 Moment
The trajectory of language models is instructive, because each step removed a new constraint. GPT-2 trained on roughly 10 billion tokens, about 500,000 hours of reading at a human pace.
That was when emergent model behavior appeared for the first time. GPT-3 trained on roughly 300 billion tokens, about 15 million hours, and without that volume there would be no ChatGPT, and none of what followed.
Robotics has not had that moment yet. Model architectures are converging, algorithms are maturing, but the data itself remains unsettled. Which pre-training distribution is the right one, what the ratio of simulation, real world, and ego-centric data should be. There is simply no consensus on data structure.
If 15 million hours of text produced GPT-3, a truly general-purpose model of physical intelligence may require on the order of 100 million hours of data on human manipulation of objects.
Today, the industry has roughly 2,000 hours, the best public dataset, Open X-Embodiment. A similar gap exists in scene diversity and in the number of mastered atomic skills.
Why Collection Doesn't Scale
Compute, hardware, and algorithms for physical intelligence are already ready. What is genuinely missing is data, and there are three structural reasons for that.
Real-world collection is bottlenecked by hardware. Specialized rigs, safety systems, and one trained operator per robot. This limits both volume and coverage, and makes foundation-model scale structurally unreachable.Manual collection cannot produce the diversity that's needed. Generalization requires compounding diversity across objects, scenes, robot embodiments, and camera angles, which hand-collected datasets are simply unable to provide.Models trained only on expert demonstrations are blind to their own mistakes. The policy only sees the states the expert visited, which means that exactly where it is weakest, there is the least training data. Errors accumulate across the entire task horizon.
Each of these constraints points in the same direction. What's needed is not a more advanced model, but a fundamentally different regime for producing data.
Humanoids Run on Data
2026 became the peak of investment interest in humanoid robots. Billions of dollars poured into hardware, into models, into the production capacity of the industry's major players. But all of that capital runs into the same bottleneck. Money solves the question of hardware and compute, but where to get millions of hours of data on real-world manipulation of objects.
This makes the data problem the very thing that's holding back an industry with multi-billion dollar investment right now. The faster the ambitions to deploy humanoids in real-world conditions grow, the faster the data shortage itself grows too. Every new robot embodiment, new environment, and new skill requires its own share of training data.
Axis Robotics: Compounding Data Engine
Most robotics data pipelines are one-directional. Collect the data, train the model, ship it, start over. Axis is built as a closed loop, in which every contribution improves the next policy, and every improved policy determines what data to collect next. Data stops being a one-time cost and becomes an asset that appreciates.
The cycle consists of five steps: generating the task and scene, collecting behavior through teleoperation in simulation and capturing real-world interactions, processing and cleaning trajectories, training and deploying the policy on real and simulated fleets.
At the end, collecting signals about exactly where the policy is still making mistakes. These signals determine which tasks open up in the next round, and the cycle repeats on harder and more valuable data.
Three platform products cover the entire cycle:
Web Simulation Data Platform: a browser-based simulation with no installation and no hardware requirements, where participants control the robot through teleoperation and generate demonstrations, as well as correct the behavior of an already trained model. Throughput already reaches 10,000 valid trajectories per hour today;Mobile Ego-Centric App: a mobile app for capturing first-person data through hand-pose tracking, with no specialized equipment. Launching in September 2026 with a target of 10,000+ valid hours of data per month;Data-to-Model Pipeline: a unified processing pipeline that cleans, augments through domain randomization, and annotates raw trajectories, turning them into data ready for model training.
The key empirical result is that continued pretraining of Physical Intelligence's π0.5 model on the Axis dataset raised the success rate on the LIBERO-Plus benchmark from 83.9% to 88.8%, and beat the result of a volume-matched control group from RoboCasa365 by 31.3 percentage points. The gain scales with the volume of Axis data, which points to the coherence of the signal coming from crowdsourcing, rather than random noise.
As of late August 2026, the platform has surpassed 150,000 global contributors and collected over 3.7 million trajectories across 4,000+ published tasks.
Among Axis's partners: robotics hardware makers AgiBot, Booster Robotics, Unitree, and Deep Robotics, foundation-model labs such as Manycore Tech, and industrial customers Geely Auto and Lotus Cars, who use the platform to train automation for sorting and other production tasks.
Crypto as Infrastructure
Opening a system like this to a global, permissionless-by-default community of contributors raises a question the data engine itself cannot answer. How do you turn contributions that are noisy, in places suboptimal, and potentially bad-faith, into a reliable training dataset, while keeping an accurate record of who exactly produced what.
Axis answers this with a two-tier evaluation system. The Scoring System evaluates each individual trajectory, while the Point System aggregates a contributor's reputation over time based on volume, task difficulty, quality, and diversity of contribution.
Every accepted trajectory is signed on-chain on the Base Network with a unique Data ID, which binds the contributor's wallet, a timestamp, the quality score, and a task reference into a permanent, tamper-proof record. Crypto here is infrastructure for provenance, transparency, and coordination in the production of Physical AI.
Besides Base, the project also has integrations with BitRobot Network in the Solana ecosystem and with Pi Network, while the provenance architecture itself stays the same regardless of which network is used.
Insights from Axis Robotics
We asked the Axis Robotics team about the mechanics behind scaling a crowdsourced data engine: how quality holds up as the platform grows, how they decide what to collect next, and what "foundation-model scale" would actually mean for them.
Q: How do you maintain data quality as the contributor base keeps growing this fast?
From day one, we built a complete three-layer quality inspection and control system, together with a matching automated data processing pipeline. As a result, our quality control is not meaningfully strained as the contributor base grows.
Specifically, the three layers of quality inspection are:
Layer 1: Real-time validation at submission. When a user submits data, the system uses a success checker to immediately verify whether the task was genuinely completed and whether the resulting state is consistent, and filters out obviously anomalous submissions such as unnatural motions, operational errors, or corrupted files.
Layer 2: Backend trajectory replay. The backend replays the full trajectory, using a cross-simulator replay mechanism to verify whether scripting, cheating tools, or other non-human intervention were involved in completing the task, while further checking the data quality and stability of the trajectory itself.
Layer 3: Batch-level policy validation. Every batch of data is used to quickly train a lightweight policy, and the policy's performance is used to validate the effectiveness and learnability of that batch.
Once all three layers of validation are complete, the system retains the valid data and assigns a quality score. Users can then register the corresponding data trajectory on-chain, ensuring that every piece of valid data carries a long-term, traceable, and verifiable record of provenance.
Q: How do you decide which robot embodiments and scenarios to prioritize adding to the task generation engine?
We determine priority along three main dimensions: generality, diversity, and the specific needs of our partners.
First, sufficiently high generality. We prioritize the robot embodiments and scenarios with the broadest coverage and the most widespread use across the industry. On the embodiment side, for example, we prioritize typical single-arm forms such as the Franka Arm, as well as dual-arm forms such as Open Arm. The platform currently supports more than ten mainstream robot assets, spanning single-arm, dual-arm, wheeled dual-arm, and other types. On the scenario side, we have systematically covered everything from household to industrial settings, ensuring that all mainstream top-level scenarios are supported.
Second, sufficiently rich diversity. We continuously track frontier academic research and industry demand to identify which scenarios, object types, and atomic skills are most urgently missing from current model training, and then expand and fill those gaps quickly. Our goal is for Axis to become the data platform with a clear advantage on both diversity and coverage, creating differentiated value especially in long-tail tasks, edge-case scenarios, and complex interaction capabilities.
Third, the specific needs of our partners. We also prioritize embodiments and scenarios based on partners' real-world needs. For partners such as Booster Robotics, Feagine Robotics, and other hardware and embodiment collaborators, we prioritize adapting to their robot embodiments and design customized data collection and tasks around their visual inputs, action spaces, and model training objectives.
It is worth emphasizing that thanks to the nature of simulation itself, along with the large-scale asset library we have built in-house, we can extend to new robot embodiments, object assets, scene environments, and atomic skills very efficiently. This gives Axis strong flexibility and scalability in data production, allowing us to respond quickly to both shared industry needs and customer-specific requirements.
Q: What would actually convince you that the data engine has reached foundation-model scale?
Judging whether a data engine has truly reached foundation-model scale is not only about accumulating raw data volume, though volume itself still matters a great deal.
On the ego data side, for example, you first need a reserve of at least 1M hours of OTS data spanning hundreds of sub-categories; on the simulation data side, you need millions of validated, effective trajectories. This is the baseline scale required for foundation model training.
But on top of that foundation, the more critical question is whether the platform as a whole can keep evolving: whether it can continuously iterate, expand, and self-reinforce as the boundaries of model capability, research directions, and industry needs shift.
A true foundation-model-scale data engine should be proactive research infrastructure, not a passive data production system that merely responds to incoming orders. It can rapidly and automatically translate research or commercial objectives into structured tasks, and generate data at scale across many robot embodiments, scenarios, and task platforms. At the same time, it must use model training results to validate the effectiveness and value of that data in reverse, forming a continuous closed loop of data production, model training, capability evaluation, and task iteration.
Ultimately, a data engine at foundation-model scale should be able to demonstrate that it can continuously deliver high-quality, highly diverse, broadly covering data at low marginal cost, driving models and robot embodiments to steadily improve their level of intelligence and to show stronger robustness and generalization in real, unscripted environments.
What comes through across all three answers is that Axis treats scale itself as an engineering problem, not just a target number: quality is enforced through layered, automated checks rather than manual review, and the bar for "foundation-model scale" is a self-reinforcing loop.
Notes from CEO of Cicada Market Maker
We went back to Cicada's CEO and co-founder, Maxim Moris, for his read on Physical AI specifically: whether the narrative holds up, and where he thinks a token actually belongs in it.
Q: What puts Physical AI and robotics data on Cicada's radar?
Honestly, first and foremost, it's the next narrative that listings and volume will follow, and we work with liquidity, not robots. There's a real problem underneath it: language models have trillions of tokens, robotics has thousands of hours of physical interaction, and that data can't be scraped, it has to be produced by hand.
Then comes the question that interests me more than the narrative itself: data collection is a normal business, but why does it need its own token? Right now the honest answer from most projects is "so there's a token."
Q: Whether this is a durable narrative or the same hype cycle?
Demand for data is durable, tokens built on that demand aren't, and those are two different stories. The buyer here is a lab that needs clean rights, provenance, and reproducible quality; it pays fiat under a contract and isn't going to hold someone's ticker on its balance sheet.
The DePIN mechanics also break down here because a robot is a capital asset with an operator, not an idle Wi-Fi router, and paying out emissions for volume produces spam, not data, which poisons the dataset, hi Helium. So the narrative will outlive the cycle, and 90% of the tokens riding on it won't.
Q: What happens to the category a year from now?
Physical AI will stay a word for pitch decks and sector indices, while what actually gets traded are the subsegments: VLA models, data collection, simulation, hardware, fleet operations.
Crypto objectively has a place in one narrow layer of that list, machine payments and identity, once there are enough robots that they start paying each other; that's not happening in 2027, and it doesn't require a separate token for every dataset.
Everything else is ordinary companies that need a token as a funding and marketing channel, not as part of the product. I'm not against that, I just prefer to call things what they are.
Maxim's answers draw a clear line: the demand behind Physical AI data is real, but in his view that's an argument for it to stay an ordinary business.
Conclusion
Physical AI is retracing the path language models have already walked. The difference is that for language models, that scale already existed in the form of text on the internet, while for robotics, it still has to be collected.
Projects like Axis Robotics are betting that this process will follow the same path internet text once did. Data for robots will be collected in a distributed way, by many people around the world, rather than by a single lab with a limited fleet of robots.
The result on LIBERO-Plus and the platform's contributor count growing into six figures, together with a growing list of partners among hardware makers, labs, and industrial customers, is early confirmation that this model of data production actually works.
Read more: [GPU Shortage and the Birth of AI DePIN](https://www.binance.com/en/square/post/354194034670562)
Inside Robotics and Physical AI
Featuring insights from Axis Robotics
In 2026, the artificial intelligence industry learned to solve the compute problem. GPUs are becoming more accessible, models are cheaper to run inference on, cloud infrastructure keeps growing. But the next wave of AI, robotics and Physical AI, has a completely different problem. It all comes down to data that simply does not exist in the volume needed.
No Internet for Robots
LLMs grew out of a foundation that already existed. Decades of text on the internet, trillions of tokens spanning almost every domain of human knowledge. With that corpus already in place, progress came down to scaling compute and improving architectures.
Robotics has no such foundation. The physical world has no search index, and there is no “internet of robotic interactions” to train a model on.
The entire volume of data available today for training robots is a tiny fraction of the text corpora that modern language models are trained on. This creates a shortage of foundational data at every level.
Robotics' Missing GPT-1 Moment
The trajectory of language models is instructive, because each step removed a new constraint. GPT-2 trained on roughly 10 billion tokens, about 500,000 hours of reading at a human pace.
That was when emergent model behavior appeared for the first time. GPT-3 trained on roughly 300 billion tokens, about 15 million hours, and without that volume there would be no ChatGPT, and none of what followed.
Robotics has not had that moment yet. Model architectures are converging, algorithms are maturing, but the data itself remains unsettled. Which pre-training distribution is the right one, what the ratio of simulation, real world, and ego-centric data should be. There is simply no consensus on data structure.
If 15 million hours of text produced GPT-3, a truly general-purpose model of physical intelligence may require on the order of 100 million hours of data on human manipulation of objects.
Today, the industry has roughly 2,000 hours, the best public dataset, Open X-Embodiment. A similar gap exists in scene diversity and in the number of mastered atomic skills.
Why Collection Doesn't Scale
Compute, hardware, and algorithms for physical intelligence are already ready. What is genuinely missing is data, and there are three structural reasons for that.
Real-world collection is bottlenecked by hardware. Specialized rigs, safety systems, and one trained operator per robot. This limits both volume and coverage, and makes foundation-model scale structurally unreachable.Manual collection cannot produce the diversity that's needed. Generalization requires compounding diversity across objects, scenes, robot embodiments, and camera angles, which hand-collected datasets are simply unable to provide.Models trained only on expert demonstrations are blind to their own mistakes. The policy only sees the states the expert visited, which means that exactly where it is weakest, there is the least training data. Errors accumulate across the entire task horizon.
Each of these constraints points in the same direction. What's needed is not a more advanced model, but a fundamentally different regime for producing data.
Humanoids Run on Data
2026 became the peak of investment interest in humanoid robots. Billions of dollars poured into hardware, into models, into the production capacity of the industry's major players. But all of that capital runs into the same bottleneck. Money solves the question of hardware and compute, but where to get millions of hours of data on real-world manipulation of objects.
This makes the data problem the very thing that's holding back an industry with multi-billion dollar investment right now. The faster the ambitions to deploy humanoids in real-world conditions grow, the faster the data shortage itself grows too. Every new robot embodiment, new environment, and new skill requires its own share of training data.
Axis Robotics: Compounding Data Engine
Most robotics data pipelines are one-directional. Collect the data, train the model, ship it, start over. Axis is built as a closed loop, in which every contribution improves the next policy, and every improved policy determines what data to collect next. Data stops being a one-time cost and becomes an asset that appreciates.
The cycle consists of five steps: generating the task and scene, collecting behavior through teleoperation in simulation and capturing real-world interactions, processing and cleaning trajectories, training and deploying the policy on real and simulated fleets.
At the end, collecting signals about exactly where the policy is still making mistakes. These signals determine which tasks open up in the next round, and the cycle repeats on harder and more valuable data.
Three platform products cover the entire cycle:
Web Simulation Data Platform: a browser-based simulation with no installation and no hardware requirements, where participants control the robot through teleoperation and generate demonstrations, as well as correct the behavior of an already trained model. Throughput already reaches 10,000 valid trajectories per hour today;Mobile Ego-Centric App: a mobile app for capturing first-person data through hand-pose tracking, with no specialized equipment. Launching in September 2026 with a target of 10,000+ valid hours of data per month;Data-to-Model Pipeline: a unified processing pipeline that cleans, augments through domain randomization, and annotates raw trajectories, turning them into data ready for model training.
The key empirical result is that continued pretraining of Physical Intelligence's π0.5 model on the Axis dataset raised the success rate on the LIBERO-Plus benchmark from 83.9% to 88.8%, and beat the result of a volume-matched control group from RoboCasa365 by 31.3 percentage points. The gain scales with the volume of Axis data, which points to the coherence of the signal coming from crowdsourcing, rather than random noise.
As of late August 2026, the platform has surpassed 150,000 global contributors and collected over 3.7 million trajectories across 4,000+ published tasks.
Among Axis's partners: robotics hardware makers AgiBot, Booster Robotics, Unitree, and Deep Robotics, foundation-model labs such as Manycore Tech, and industrial customers Geely Auto and Lotus Cars, who use the platform to train automation for sorting and other production tasks.
Crypto as Infrastructure
Opening a system like this to a global, permissionless-by-default community of contributors raises a question the data engine itself cannot answer. How do you turn contributions that are noisy, in places suboptimal, and potentially bad-faith, into a reliable training dataset, while keeping an accurate record of who exactly produced what.
Axis answers this with a two-tier evaluation system. The Scoring System evaluates each individual trajectory, while the Point System aggregates a contributor's reputation over time based on volume, task difficulty, quality, and diversity of contribution.
Every accepted trajectory is signed on-chain on the Base Network with a unique Data ID, which binds the contributor's wallet, a timestamp, the quality score, and a task reference into a permanent, tamper-proof record. Crypto here is infrastructure for provenance, transparency, and coordination in the production of Physical AI.
Besides Base, the project also has integrations with BitRobot Network in the Solana ecosystem and with Pi Network, while the provenance architecture itself stays the same regardless of which network is used.
Insights from Axis Robotics
We asked the Axis Robotics team about the mechanics behind scaling a crowdsourced data engine: how quality holds up as the platform grows, how they decide what to collect next, and what "foundation-model scale" would actually mean for them.
Q: How do you maintain data quality as the contributor base keeps growing this fast?
From day one, we built a complete three-layer quality inspection and control system, together with a matching automated data processing pipeline. As a result, our quality control is not meaningfully strained as the contributor base grows.
Specifically, the three layers of quality inspection are:
Layer 1: Real-time validation at submission. When a user submits data, the system uses a success checker to immediately verify whether the task was genuinely completed and whether the resulting state is consistent, and filters out obviously anomalous submissions such as unnatural motions, operational errors, or corrupted files.
Layer 2: Backend trajectory replay. The backend replays the full trajectory, using a cross-simulator replay mechanism to verify whether scripting, cheating tools, or other non-human intervention were involved in completing the task, while further checking the data quality and stability of the trajectory itself.
Layer 3: Batch-level policy validation. Every batch of data is used to quickly train a lightweight policy, and the policy's performance is used to validate the effectiveness and learnability of that batch.
Once all three layers of validation are complete, the system retains the valid data and assigns a quality score. Users can then register the corresponding data trajectory on-chain, ensuring that every piece of valid data carries a long-term, traceable, and verifiable record of provenance.
Q: How do you decide which robot embodiments and scenarios to prioritize adding to the task generation engine?
We determine priority along three main dimensions: generality, diversity, and the specific needs of our partners.
First, sufficiently high generality. We prioritize the robot embodiments and scenarios with the broadest coverage and the most widespread use across the industry. On the embodiment side, for example, we prioritize typical single-arm forms such as the Franka Arm, as well as dual-arm forms such as Open Arm. The platform currently supports more than ten mainstream robot assets, spanning single-arm, dual-arm, wheeled dual-arm, and other types. On the scenario side, we have systematically covered everything from household to industrial settings, ensuring that all mainstream top-level scenarios are supported.
Second, sufficiently rich diversity. We continuously track frontier academic research and industry demand to identify which scenarios, object types, and atomic skills are most urgently missing from current model training, and then expand and fill those gaps quickly. Our goal is for Axis to become the data platform with a clear advantage on both diversity and coverage, creating differentiated value especially in long-tail tasks, edge-case scenarios, and complex interaction capabilities.
Third, the specific needs of our partners. We also prioritize embodiments and scenarios based on partners' real-world needs. For partners such as Booster Robotics, Feagine Robotics, and other hardware and embodiment collaborators, we prioritize adapting to their robot embodiments and design customized data collection and tasks around their visual inputs, action spaces, and model training objectives.
It is worth emphasizing that thanks to the nature of simulation itself, along with the large-scale asset library we have built in-house, we can extend to new robot embodiments, object assets, scene environments, and atomic skills very efficiently. This gives Axis strong flexibility and scalability in data production, allowing us to respond quickly to both shared industry needs and customer-specific requirements.
Q: What would actually convince you that the data engine has reached foundation-model scale?
Judging whether a data engine has truly reached foundation-model scale is not only about accumulating raw data volume, though volume itself still matters a great deal.
On the ego data side, for example, you first need a reserve of at least 1M hours of OTS data spanning hundreds of sub-categories; on the simulation data side, you need millions of validated, effective trajectories. This is the baseline scale required for foundation model training.
But on top of that foundation, the more critical question is whether the platform as a whole can keep evolving: whether it can continuously iterate, expand, and self-reinforce as the boundaries of model capability, research directions, and industry needs shift.
A true foundation-model-scale data engine should be proactive research infrastructure, not a passive data production system that merely responds to incoming orders. It can rapidly and automatically translate research or commercial objectives into structured tasks, and generate data at scale across many robot embodiments, scenarios, and task platforms. At the same time, it must use model training results to validate the effectiveness and value of that data in reverse, forming a continuous closed loop of data production, model training, capability evaluation, and task iteration.
Ultimately, a data engine at foundation-model scale should be able to demonstrate that it can continuously deliver high-quality, highly diverse, broadly covering data at low marginal cost, driving models and robot embodiments to steadily improve their level of intelligence and to show stronger robustness and generalization in real, unscripted environments.
What comes through across all three answers is that Axis treats scale itself as an engineering problem, not just a target number: quality is enforced through layered, automated checks rather than manual review, and the bar for "foundation-model scale" is a self-reinforcing loop.
Notes from CEO of Cicada Market Maker
We went back to Cicada's CEO and co-founder, Maxim Moris, for his read on Physical AI specifically: whether the narrative holds up, and where he thinks a token actually belongs in it.
Q: What puts Physical AI and robotics data on Cicada's radar?
Honestly, first and foremost, it's the next narrative that listings and volume will follow, and we work with liquidity, not robots. There's a real problem underneath it: language models have trillions of tokens, robotics has thousands of hours of physical interaction, and that data can't be scraped, it has to be produced by hand.
Then comes the question that interests me more than the narrative itself: data collection is a normal business, but why does it need its own token? Right now the honest answer from most projects is "so there's a token."
Q: Whether this is a durable narrative or the same hype cycle?
Demand for data is durable, tokens built on that demand aren't, and those are two different stories. The buyer here is a lab that needs clean rights, provenance, and reproducible quality; it pays fiat under a contract and isn't going to hold someone's ticker on its balance sheet.
The DePIN mechanics also break down here because a robot is a capital asset with an operator, not an idle Wi-Fi router, and paying out emissions for volume produces spam, not data, which poisons the dataset, hi Helium. So the narrative will outlive the cycle, and 90% of the tokens riding on it won't.
Q: What happens to the category a year from now?
Physical AI will stay a word for pitch decks and sector indices, while what actually gets traded are the subsegments: VLA models, data collection, simulation, hardware, fleet operations.
Crypto objectively has a place in one narrow layer of that list, machine payments and identity, once there are enough robots that they start paying each other; that's not happening in 2027, and it doesn't require a separate token for every dataset.
Everything else is ordinary companies that need a token as a funding and marketing channel, not as part of the product. I'm not against that, I just prefer to call things what they are.
Maxim's answers draw a clear line: the demand behind Physical AI data is real, but in his view that's an argument for it to stay an ordinary business.
Conclusion
Physical AI is retracing the path language models have already walked. The difference is that for language models, that scale already existed in the form of text on the internet, while for robotics, it still has to be collected.
Projects like Axis Robotics are betting that this process will follow the same path internet text once did. Data for robots will be collected in a distributed way, by many people around the world, rather than by a single lab with a limited fleet of robots.
The result on LIBERO-Plus and the platform's contributor count growing into six figures, together with a growing list of partners among hardware makers, labs, and industrial customers, is early confirmation that this model of data production actually works.
Read more: GPU Shortage and the Birth of AI DePIN
In 2026, the artificial intelligence industry learned to solve the compute problem. GPUs are becoming more accessible, models are cheaper to run inference on, cloud infrastructure keeps growing. But the next wave of AI, robotics and Physical AI, has a completely different problem. It all comes down to data that simply does not exist in the volume needed.
No Internet for Robots
LLMs grew out of a foundation that already existed. Decades of text on the internet, trillions of tokens spanning almost every domain of human knowledge. With that corpus already in place, progress came down to scaling compute and improving architectures.
Robotics has no such foundation. The physical world has no search index, and there is no “internet of robotic interactions” to train a model on.
The entire volume of data available today for training robots is a tiny fraction of the text corpora that modern language models are trained on. This creates a shortage of foundational data at every level.
Robotics' Missing GPT-1 Moment
The trajectory of language models is instructive, because each step removed a new constraint. GPT-2 trained on roughly 10 billion tokens, about 500,000 hours of reading at a human pace.
That was when emergent model behavior appeared for the first time. GPT-3 trained on roughly 300 billion tokens, about 15 million hours, and without that volume there would be no ChatGPT, and none of what followed.
Robotics has not had that moment yet. Model architectures are converging, algorithms are maturing, but the data itself remains unsettled. Which pre-training distribution is the right one, what the ratio of simulation, real world, and ego-centric data should be. There is simply no consensus on data structure.
If 15 million hours of text produced GPT-3, a truly general-purpose model of physical intelligence may require on the order of 100 million hours of data on human manipulation of objects.
Today, the industry has roughly 2,000 hours, the best public dataset, Open X-Embodiment. A similar gap exists in scene diversity and in the number of mastered atomic skills.
Why Collection Doesn't Scale
Compute, hardware, and algorithms for physical intelligence are already ready. What is genuinely missing is data, and there are three structural reasons for that.
Real-world collection is bottlenecked by hardware. Specialized rigs, safety systems, and one trained operator per robot. This limits both volume and coverage, and makes foundation-model scale structurally unreachable.Manual collection cannot produce the diversity that's needed. Generalization requires compounding diversity across objects, scenes, robot embodiments, and camera angles, which hand-collected datasets are simply unable to provide.Models trained only on expert demonstrations are blind to their own mistakes. The policy only sees the states the expert visited, which means that exactly where it is weakest, there is the least training data. Errors accumulate across the entire task horizon.
Each of these constraints points in the same direction. What's needed is not a more advanced model, but a fundamentally different regime for producing data.
Humanoids Run on Data
2026 became the peak of investment interest in humanoid robots. Billions of dollars poured into hardware, into models, into the production capacity of the industry's major players. But all of that capital runs into the same bottleneck. Money solves the question of hardware and compute, but where to get millions of hours of data on real-world manipulation of objects.
This makes the data problem the very thing that's holding back an industry with multi-billion dollar investment right now. The faster the ambitions to deploy humanoids in real-world conditions grow, the faster the data shortage itself grows too. Every new robot embodiment, new environment, and new skill requires its own share of training data.
Axis Robotics: Compounding Data Engine
Most robotics data pipelines are one-directional. Collect the data, train the model, ship it, start over. Axis is built as a closed loop, in which every contribution improves the next policy, and every improved policy determines what data to collect next. Data stops being a one-time cost and becomes an asset that appreciates.
The cycle consists of five steps: generating the task and scene, collecting behavior through teleoperation in simulation and capturing real-world interactions, processing and cleaning trajectories, training and deploying the policy on real and simulated fleets.
At the end, collecting signals about exactly where the policy is still making mistakes. These signals determine which tasks open up in the next round, and the cycle repeats on harder and more valuable data.
Three platform products cover the entire cycle:
Web Simulation Data Platform: a browser-based simulation with no installation and no hardware requirements, where participants control the robot through teleoperation and generate demonstrations, as well as correct the behavior of an already trained model. Throughput already reaches 10,000 valid trajectories per hour today;Mobile Ego-Centric App: a mobile app for capturing first-person data through hand-pose tracking, with no specialized equipment. Launching in September 2026 with a target of 10,000+ valid hours of data per month;Data-to-Model Pipeline: a unified processing pipeline that cleans, augments through domain randomization, and annotates raw trajectories, turning them into data ready for model training.
The key empirical result is that continued pretraining of Physical Intelligence's π0.5 model on the Axis dataset raised the success rate on the LIBERO-Plus benchmark from 83.9% to 88.8%, and beat the result of a volume-matched control group from RoboCasa365 by 31.3 percentage points. The gain scales with the volume of Axis data, which points to the coherence of the signal coming from crowdsourcing, rather than random noise.
As of late August 2026, the platform has surpassed 150,000 global contributors and collected over 3.7 million trajectories across 4,000+ published tasks.
Among Axis's partners: robotics hardware makers AgiBot, Booster Robotics, Unitree, and Deep Robotics, foundation-model labs such as Manycore Tech, and industrial customers Geely Auto and Lotus Cars, who use the platform to train automation for sorting and other production tasks.
Crypto as Infrastructure
Opening a system like this to a global, permissionless-by-default community of contributors raises a question the data engine itself cannot answer. How do you turn contributions that are noisy, in places suboptimal, and potentially bad-faith, into a reliable training dataset, while keeping an accurate record of who exactly produced what.
Axis answers this with a two-tier evaluation system. The Scoring System evaluates each individual trajectory, while the Point System aggregates a contributor's reputation over time based on volume, task difficulty, quality, and diversity of contribution.
Every accepted trajectory is signed on-chain on the Base Network with a unique Data ID, which binds the contributor's wallet, a timestamp, the quality score, and a task reference into a permanent, tamper-proof record. Crypto here is infrastructure for provenance, transparency, and coordination in the production of Physical AI.
Besides Base, the project also has integrations with BitRobot Network in the Solana ecosystem and with Pi Network, while the provenance architecture itself stays the same regardless of which network is used.
Insights from Axis Robotics
We asked the Axis Robotics team about the mechanics behind scaling a crowdsourced data engine: how quality holds up as the platform grows, how they decide what to collect next, and what "foundation-model scale" would actually mean for them.
Q: How do you maintain data quality as the contributor base keeps growing this fast?
From day one, we built a complete three-layer quality inspection and control system, together with a matching automated data processing pipeline. As a result, our quality control is not meaningfully strained as the contributor base grows.
Specifically, the three layers of quality inspection are:
Layer 1: Real-time validation at submission. When a user submits data, the system uses a success checker to immediately verify whether the task was genuinely completed and whether the resulting state is consistent, and filters out obviously anomalous submissions such as unnatural motions, operational errors, or corrupted files.
Layer 2: Backend trajectory replay. The backend replays the full trajectory, using a cross-simulator replay mechanism to verify whether scripting, cheating tools, or other non-human intervention were involved in completing the task, while further checking the data quality and stability of the trajectory itself.
Layer 3: Batch-level policy validation. Every batch of data is used to quickly train a lightweight policy, and the policy's performance is used to validate the effectiveness and learnability of that batch.
Once all three layers of validation are complete, the system retains the valid data and assigns a quality score. Users can then register the corresponding data trajectory on-chain, ensuring that every piece of valid data carries a long-term, traceable, and verifiable record of provenance.
Q: How do you decide which robot embodiments and scenarios to prioritize adding to the task generation engine?
We determine priority along three main dimensions: generality, diversity, and the specific needs of our partners.
First, sufficiently high generality. We prioritize the robot embodiments and scenarios with the broadest coverage and the most widespread use across the industry. On the embodiment side, for example, we prioritize typical single-arm forms such as the Franka Arm, as well as dual-arm forms such as Open Arm. The platform currently supports more than ten mainstream robot assets, spanning single-arm, dual-arm, wheeled dual-arm, and other types. On the scenario side, we have systematically covered everything from household to industrial settings, ensuring that all mainstream top-level scenarios are supported.
Second, sufficiently rich diversity. We continuously track frontier academic research and industry demand to identify which scenarios, object types, and atomic skills are most urgently missing from current model training, and then expand and fill those gaps quickly. Our goal is for Axis to become the data platform with a clear advantage on both diversity and coverage, creating differentiated value especially in long-tail tasks, edge-case scenarios, and complex interaction capabilities.
Third, the specific needs of our partners. We also prioritize embodiments and scenarios based on partners' real-world needs. For partners such as Booster Robotics, Feagine Robotics, and other hardware and embodiment collaborators, we prioritize adapting to their robot embodiments and design customized data collection and tasks around their visual inputs, action spaces, and model training objectives.
It is worth emphasizing that thanks to the nature of simulation itself, along with the large-scale asset library we have built in-house, we can extend to new robot embodiments, object assets, scene environments, and atomic skills very efficiently. This gives Axis strong flexibility and scalability in data production, allowing us to respond quickly to both shared industry needs and customer-specific requirements.
Q: What would actually convince you that the data engine has reached foundation-model scale?
Judging whether a data engine has truly reached foundation-model scale is not only about accumulating raw data volume, though volume itself still matters a great deal.
On the ego data side, for example, you first need a reserve of at least 1M hours of OTS data spanning hundreds of sub-categories; on the simulation data side, you need millions of validated, effective trajectories. This is the baseline scale required for foundation model training.
But on top of that foundation, the more critical question is whether the platform as a whole can keep evolving: whether it can continuously iterate, expand, and self-reinforce as the boundaries of model capability, research directions, and industry needs shift.
A true foundation-model-scale data engine should be proactive research infrastructure, not a passive data production system that merely responds to incoming orders. It can rapidly and automatically translate research or commercial objectives into structured tasks, and generate data at scale across many robot embodiments, scenarios, and task platforms. At the same time, it must use model training results to validate the effectiveness and value of that data in reverse, forming a continuous closed loop of data production, model training, capability evaluation, and task iteration.
Ultimately, a data engine at foundation-model scale should be able to demonstrate that it can continuously deliver high-quality, highly diverse, broadly covering data at low marginal cost, driving models and robot embodiments to steadily improve their level of intelligence and to show stronger robustness and generalization in real, unscripted environments.
What comes through across all three answers is that Axis treats scale itself as an engineering problem, not just a target number: quality is enforced through layered, automated checks rather than manual review, and the bar for "foundation-model scale" is a self-reinforcing loop.
Notes from CEO of Cicada Market Maker
We went back to Cicada's CEO and co-founder, Maxim Moris, for his read on Physical AI specifically: whether the narrative holds up, and where he thinks a token actually belongs in it.
Q: What puts Physical AI and robotics data on Cicada's radar?
Honestly, first and foremost, it's the next narrative that listings and volume will follow, and we work with liquidity, not robots. There's a real problem underneath it: language models have trillions of tokens, robotics has thousands of hours of physical interaction, and that data can't be scraped, it has to be produced by hand.
Then comes the question that interests me more than the narrative itself: data collection is a normal business, but why does it need its own token? Right now the honest answer from most projects is "so there's a token."
Q: Whether this is a durable narrative or the same hype cycle?
Demand for data is durable, tokens built on that demand aren't, and those are two different stories. The buyer here is a lab that needs clean rights, provenance, and reproducible quality; it pays fiat under a contract and isn't going to hold someone's ticker on its balance sheet.
The DePIN mechanics also break down here because a robot is a capital asset with an operator, not an idle Wi-Fi router, and paying out emissions for volume produces spam, not data, which poisons the dataset, hi Helium. So the narrative will outlive the cycle, and 90% of the tokens riding on it won't.
Q: What happens to the category a year from now?
Physical AI will stay a word for pitch decks and sector indices, while what actually gets traded are the subsegments: VLA models, data collection, simulation, hardware, fleet operations.
Crypto objectively has a place in one narrow layer of that list, machine payments and identity, once there are enough robots that they start paying each other; that's not happening in 2027, and it doesn't require a separate token for every dataset.
Everything else is ordinary companies that need a token as a funding and marketing channel, not as part of the product. I'm not against that, I just prefer to call things what they are.
Maxim's answers draw a clear line: the demand behind Physical AI data is real, but in his view that's an argument for it to stay an ordinary business.
Conclusion
Physical AI is retracing the path language models have already walked. The difference is that for language models, that scale already existed in the form of text on the internet, while for robotics, it still has to be collected.
Projects like Axis Robotics are betting that this process will follow the same path internet text once did. Data for robots will be collected in a distributed way, by many people around the world, rather than by a single lab with a limited fleet of robots.
The result on LIBERO-Plus and the platform's contributor count growing into six figures, together with a growing list of partners among hardware makers, labs, and industrial customers, is early confirmation that this model of data production actually works.
Read more: GPU Shortage and the Birth of AI DePIN
1
2.5k
📊 Weekly Recap: The $80k Breakout and The Debasement Trade
Crypto went vertical this week. Bitcoin smashed through $80,000 for the first time since May, ETF inflows hit a record pace, and the debasement trade officially replaced AI mania as the market driving engine.
📌 The Macro Pivot
Bond market intervention, a soft dollar, and fading AI euphoria redirected capital into hard assets.
• Debasement Trade: Treasury Secretary Bessent's bond buybacks capped long term yields and softened the dollar. IBIT and GLD returned to the top 10 most traded ETFs, displacing semiconductor funds.
• AI Fatigue: Nvidia logged a 7 day losing streak into earnings, while IG bond issuance hit a record $1.7T as AI infrastructure financing competes with Treasuries.
• Rates and Inflation: July core PCE held at 3.3 percent, marking 65 straight months above target. FedWatch prices a 60/40 split for a September hold vs hike.
📌 Bitcoin Breakout
$BTC moved from $69.3k to a high of $81,235 in six days, its strongest weekly advance in 2.5 years.
• Price Action: BTC opened near $69.3k and breached $80k on August 25. It is currently consolidating around $79.1k, up roughly 14 percent on the week.
• ETF Flows: Eight consecutive days of inflows generated $1.8B for the week. August totals over $3B, making it the best month of the year.
• $ETH ETFs: Ether funds matched the 8 day streak with $890M in weekly inflows. ETH rallied 11 percent to $2,510.
• Institutional Engine: BTC ETF assets under management stand near $99B. BlackRock cut its in kind conversion minimum from $25M to $1M, driving over $5B in conversions.
📌 Sentiment and Regulation
The Fear and Greed index surged from 29 to 80. Trump urged Congress to pass the CLARITY Act and touted the Strategic Bitcoin Reserve.
Meanwhile, the SEC proposed its Regulation Crypto Assets framework with safe harbors for startups. Strategy (MSTR) continues to hold 840,449 BTC.
📊 Weekly Recap: The $80k Breakout and The Debasement Trade
Crypto went vertical this week. Bitcoin smashed through $80,000 for the first time since May, ETF inflows hit a record pace, and the debasement trade officially replaced AI mania as the market driving engine.
📌 The Macro Pivot
Bond market intervention, a soft dollar, and fading AI euphoria redirected capital into hard assets.
• Debasement Trade: Treasury Secretary Bessent's bond buybacks capped long term yields and softened the dollar. IBIT and GLD returned to the top 10 most traded ETFs, displacing semiconductor funds.
• AI Fatigue: Nvidia logged a 7 day losing streak into earnings, while IG bond issuance hit a record $1.7T as AI infrastructure financing competes with Treasuries.
• Rates and Inflation: July core PCE held at 3.3 percent, marking 65 straight months above target. FedWatch prices a 60/40 split for a September hold vs hike.
📌 Bitcoin Breakout
$BTC moved from $69.3k to a high of $81,235 in six days, its strongest weekly advance in 2.5 years.
• Price Action: BTC opened near $69.3k and breached $80k on August 25. It is currently consolidating around $79.1k, up roughly 14 percent on the week.
• ETF Flows: Eight consecutive days of inflows generated $1.8B for the week. August totals over $3B, making it the best month of the year.
• $ETH ETFs: Ether funds matched the 8 day streak with $890M in weekly inflows. ETH rallied 11 percent to $2,510.
• Institutional Engine: BTC ETF assets under management stand near $99B. BlackRock cut its in kind conversion minimum from $25M to $1M, driving over $5B in conversions.
📌 Sentiment and Regulation
The Fear and Greed index surged from 29 to 80. Trump urged Congress to pass the CLARITY Act and touted the Strategic Bitcoin Reserve.
Meanwhile, the SEC proposed its Regulation Crypto Assets framework with safe harbors for startups. Strategy (MSTR) continues to hold 840,449 BTC.
Crypto went vertical this week. Bitcoin smashed through $80,000 for the first time since May, ETF inflows hit a record pace, and the debasement trade officially replaced AI mania as the market driving engine.
📌 The Macro Pivot
Bond market intervention, a soft dollar, and fading AI euphoria redirected capital into hard assets.
• Debasement Trade: Treasury Secretary Bessent's bond buybacks capped long term yields and softened the dollar. IBIT and GLD returned to the top 10 most traded ETFs, displacing semiconductor funds.
• AI Fatigue: Nvidia logged a 7 day losing streak into earnings, while IG bond issuance hit a record $1.7T as AI infrastructure financing competes with Treasuries.
• Rates and Inflation: July core PCE held at 3.3 percent, marking 65 straight months above target. FedWatch prices a 60/40 split for a September hold vs hike.
📌 Bitcoin Breakout
$BTC moved from $69.3k to a high of $81,235 in six days, its strongest weekly advance in 2.5 years.
• Price Action: BTC opened near $69.3k and breached $80k on August 25. It is currently consolidating around $79.1k, up roughly 14 percent on the week.
• ETF Flows: Eight consecutive days of inflows generated $1.8B for the week. August totals over $3B, making it the best month of the year.
• $ETH ETFs: Ether funds matched the 8 day streak with $890M in weekly inflows. ETH rallied 11 percent to $2,510.
• Institutional Engine: BTC ETF assets under management stand near $99B. BlackRock cut its in kind conversion minimum from $25M to $1M, driving over $5B in conversions.
📌 Sentiment and Regulation
The Fear and Greed index surged from 29 to 80. Trump urged Congress to pass the CLARITY Act and touted the Strategic Bitcoin Reserve.
Meanwhile, the SEC proposed its Regulation Crypto Assets framework with safe harbors for startups. Strategy (MSTR) continues to hold 840,449 BTC.
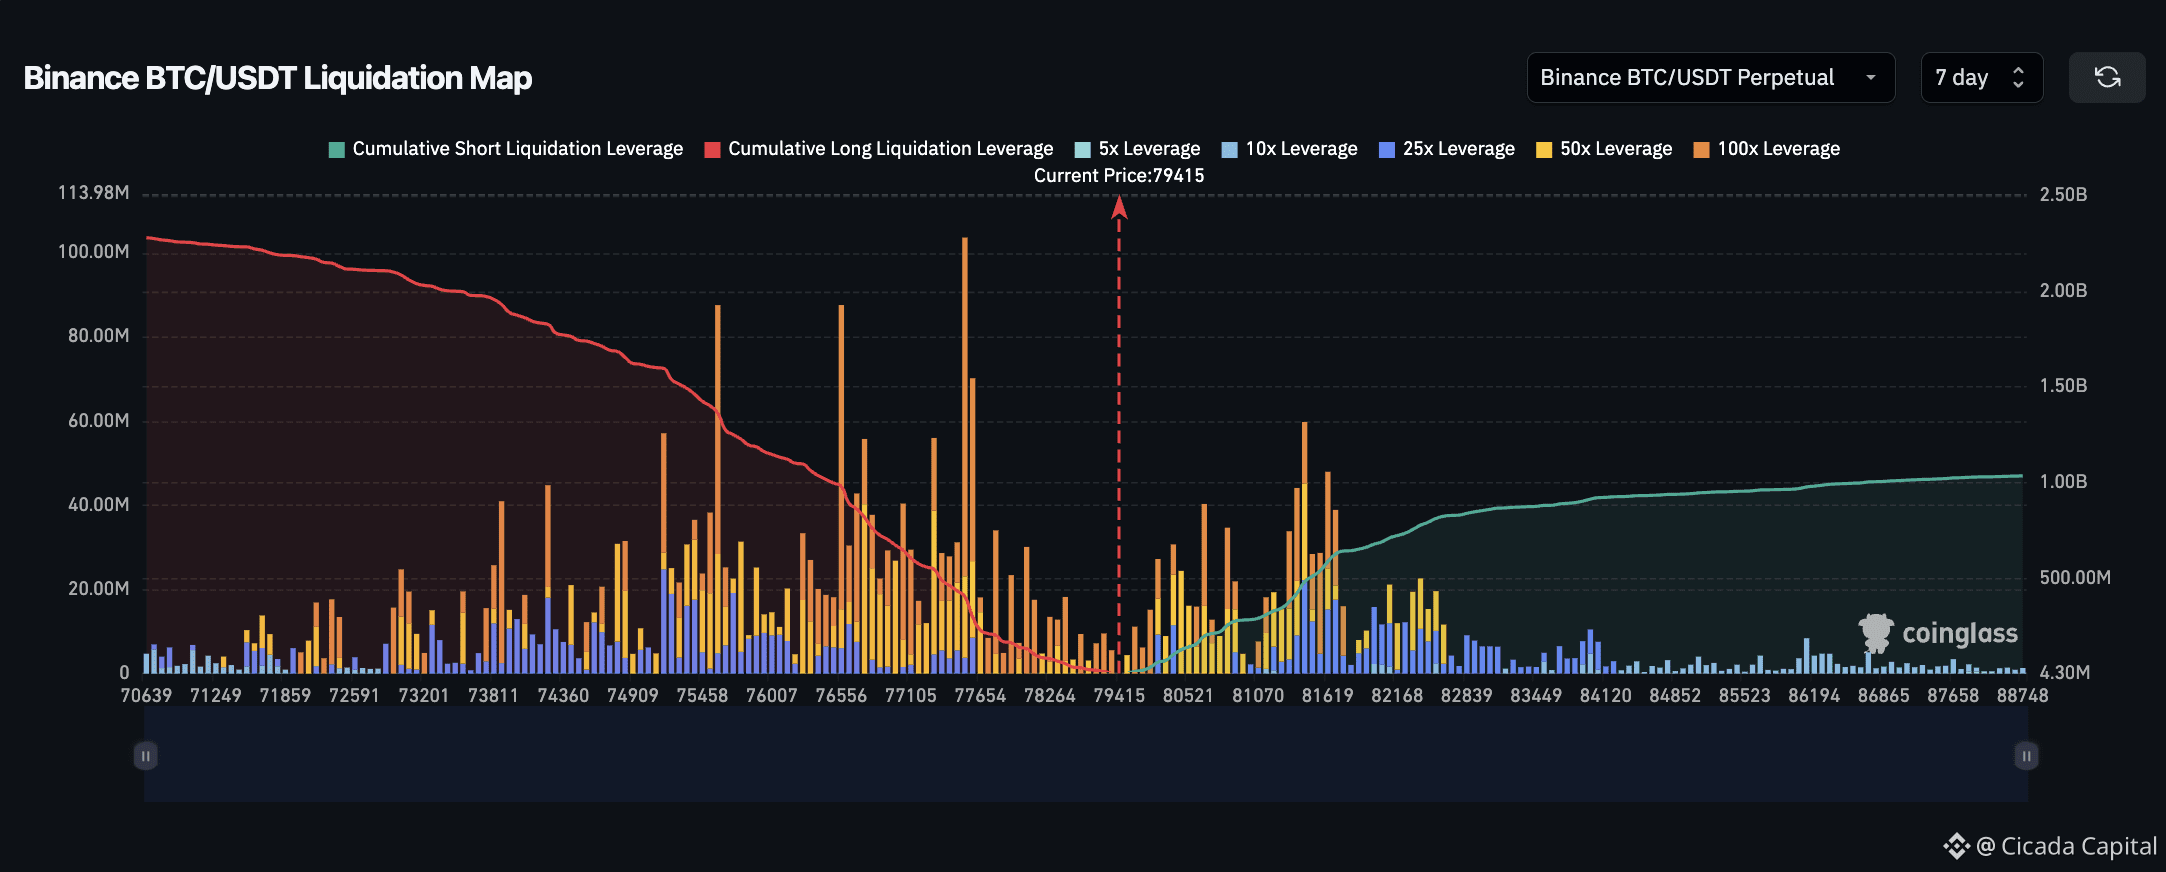
1
1.9k
📊 On‑Chain & Futures Analysis
— Weekly Market Brief
Leverage came roaring back: funding went positive and pinned at the 0.01% cap by Friday, OI-weighted funding printed its highest readings since the July flush, and a $1.29B short squeeze ignited the move, yet OI rose only ~4% against a 10-11% price gain, marking this as a spot-driven rally with limited new leverage.
$BTC opened the week at $62,819 on Aug 17 and chopped between $62.7K and $65K through Tuesday as markets waited on the minutes.
Wednesday Aug 19 was the ignition: the Treasury buyback news sent BTC from ~$64.7K to a close of $69,266, a 7% single-day rip that liquidated $1.29B of shorts in about an hour. Thursday added +5.4% to $73,033 as ETF inflows peaked; Friday BTC broke $76K and closed at $78,335.
$ETH was the star: 1,874 → $2,482, its best week since May 2025, breaking the $1,980 resistance and printing a golden cross.
• Funding rates stayed positive all week, and got hot. Combined funding closed 0.0052% → 0.0016% → 0.0097% → 0.0050% → pinned at 0.01% Fri-Sun → 0.0059%.
OI-weighted funding spiked to 0.0114% on Aug 22, the highest since the July flush, and ETH OI-weighted hit 0.0174% intraday that day, showing leverage rebuilding into the second leg of the rally.
Bitfinex's read: OI +4% vs price +10-11% means the move is spot demand and short covering, not leveraged euphoria, giving it longer staying power than a typical short squeeze.
• Key levels: Bitfinex flags the $68-69K zone as the must-hold support, near the average cost basis of buyers over the past five months, with profit-taking flows into exchanges as the biggest risk to the rally.
The 365-day moving average near $83K is now the final boss technical test. Bitcoin dominance rose to a 15-week peak. Elsewhere: the Coldcard-hack tally was revised up to 1,789 BTC, with 87% still unmoved.
📊 On‑Chain & Futures Analysis
— Weekly Market Brief
Leverage came roaring back: funding went positive and pinned at the 0.01% cap by Friday, OI-weighted funding printed its highest readings since the July flush, and a $1.29B short squeeze ignited the move, yet OI rose only ~4% against a 10-11% price gain, marking this as a spot-driven rally with limited new leverage.
$BTC opened the week at $62,819 on Aug 17 and chopped between $62.7K and $65K through Tuesday as markets waited on the minutes.
Wednesday Aug 19 was the ignition: the Treasury buyback news sent BTC from ~$64.7K to a close of $69,266, a 7% single-day rip that liquidated $1.29B of shorts in about an hour. Thursday added +5.4% to $73,033 as ETF inflows peaked; Friday BTC broke $76K and closed at $78,335.
$ETH was the star: 1,874 → $2,482, its best week since May 2025, breaking the $1,980 resistance and printing a golden cross.
• Funding rates stayed positive all week, and got hot. Combined funding closed 0.0052% → 0.0016% → 0.0097% → 0.0050% → pinned at 0.01% Fri-Sun → 0.0059%.
OI-weighted funding spiked to 0.0114% on Aug 22, the highest since the July flush, and ETH OI-weighted hit 0.0174% intraday that day, showing leverage rebuilding into the second leg of the rally.
Bitfinex's read: OI +4% vs price +10-11% means the move is spot demand and short covering, not leveraged euphoria, giving it longer staying power than a typical short squeeze.
• Key levels: Bitfinex flags the $68-69K zone as the must-hold support, near the average cost basis of buyers over the past five months, with profit-taking flows into exchanges as the biggest risk to the rally.
The 365-day moving average near $83K is now the final boss technical test. Bitcoin dominance rose to a 15-week peak. Elsewhere: the Coldcard-hack tally was revised up to 1,789 BTC, with 87% still unmoved.
— Weekly Market Brief
Leverage came roaring back: funding went positive and pinned at the 0.01% cap by Friday, OI-weighted funding printed its highest readings since the July flush, and a $1.29B short squeeze ignited the move, yet OI rose only ~4% against a 10-11% price gain, marking this as a spot-driven rally with limited new leverage.
$BTC opened the week at $62,819 on Aug 17 and chopped between $62.7K and $65K through Tuesday as markets waited on the minutes.
Wednesday Aug 19 was the ignition: the Treasury buyback news sent BTC from ~$64.7K to a close of $69,266, a 7% single-day rip that liquidated $1.29B of shorts in about an hour. Thursday added +5.4% to $73,033 as ETF inflows peaked; Friday BTC broke $76K and closed at $78,335.
$ETH was the star: 1,874 → $2,482, its best week since May 2025, breaking the $1,980 resistance and printing a golden cross.
• Funding rates stayed positive all week, and got hot. Combined funding closed 0.0052% → 0.0016% → 0.0097% → 0.0050% → pinned at 0.01% Fri-Sun → 0.0059%.
OI-weighted funding spiked to 0.0114% on Aug 22, the highest since the July flush, and ETH OI-weighted hit 0.0174% intraday that day, showing leverage rebuilding into the second leg of the rally.
Bitfinex's read: OI +4% vs price +10-11% means the move is spot demand and short covering, not leveraged euphoria, giving it longer staying power than a typical short squeeze.
• Key levels: Bitfinex flags the $68-69K zone as the must-hold support, near the average cost basis of buyers over the past five months, with profit-taking flows into exchanges as the biggest risk to the rally.
The 365-day moving average near $83K is now the final boss technical test. Bitcoin dominance rose to a 15-week peak. Elsewhere: the Coldcard-hack tally was revised up to 1,789 BTC, with 87% still unmoved.
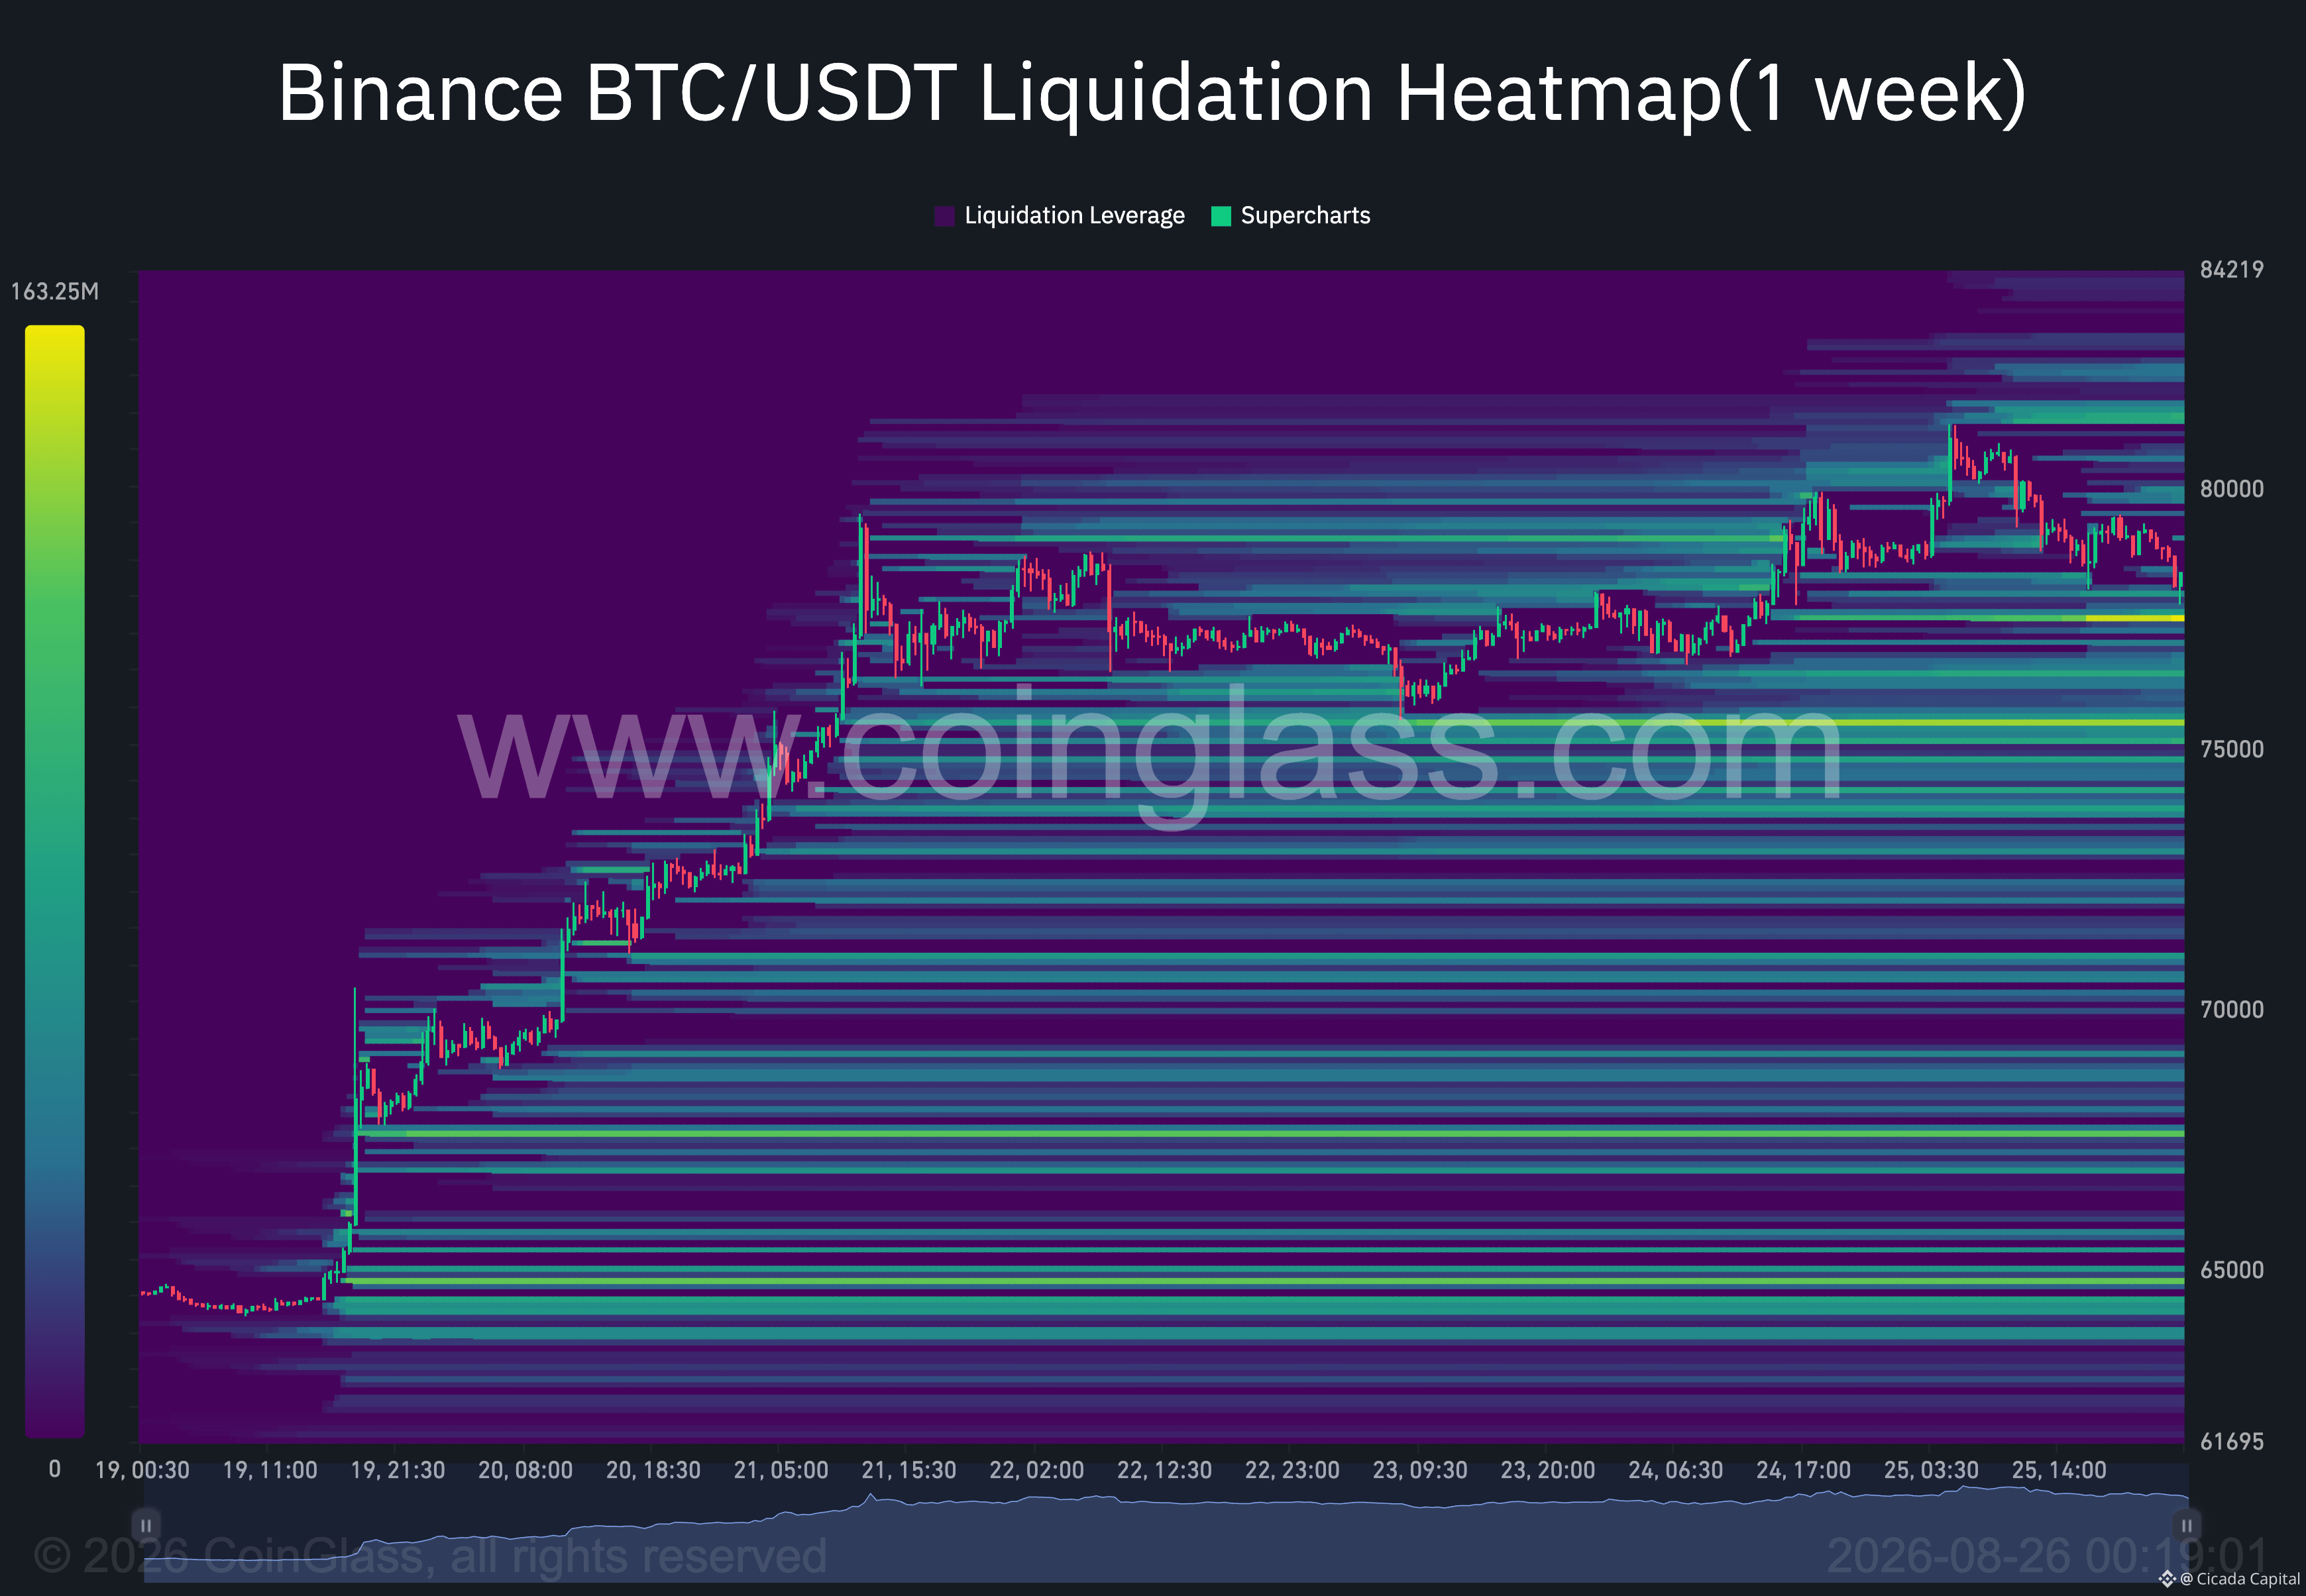
175
📊 Crypto Capital Flows
— Weekly Market Brief
Institutional flows delivered the strongest week since October 2025: $2.6B combined into BTC and ETH ETFs, with BTC alone adding $1.92B as BlackRock's IBIT vacuumed up the majority.
• $BTC ETF flows: Mon +$297.5M, Tue +$189.3M, Wed +$517.2M, Thu +$606.3M, the largest single-day inflow since May 1, ~82% via IBIT, and Fri +$307.5M.
Weekly net: roughly +$1.92B, the biggest week of 2026, led by IBIT and FBTC; VanEck HODL was the only weekly outflow. The streak extended through Monday Aug 24, taking the six-day run to $2.26B and trimming YTD net outflows to ~$2.57B. BTC ETF NAV hit $96.1B; cumulative inflows $53.7B.
• $ETH ETF flows: Ethereum ETFs notched their largest weekly inflow since October 2025: +$697.2M, extended by +$115.6M on Aug 24. Combined BTC+ETH ETF volume tripled to $29B.
Exchange Netflow: On-chain data shows BTC continuing to leave exchanges: roughly -12.3K BTC net outflows, accumulation persisted even as price ripped higher.
ETH painted a two-sided picture: +245K ETH net flowed INTO exchanges over Aug 20-24, profit-taking deposits during the +32% pump, partially offset by BitMine's OTC accumulation.
Corporate demand remained the structural bid: BitMine added 32,447 ETH, its largest weekly buy since early July, lifting its stack to 5.85M ETH; listed companies now hold 7.86M ETH. Metaplanet moved 1,000 BTC to Coinbase Prime on Aug 25 amid sale speculation.
Strategy reported no new BTC activity but sold $2.01B of MSTR shares as BTC crossed $80K, raising cash ahead of a potential re-entry.
For the first time since the recovery began, ETF demand, corporate treasuries and exchange withdrawals moved in the same direction.
📊 Crypto Capital Flows
— Weekly Market Brief
Institutional flows delivered the strongest week since October 2025: $2.6B combined into BTC and ETH ETFs, with BTC alone adding $1.92B as BlackRock's IBIT vacuumed up the majority.
• $BTC ETF flows: Mon +$297.5M, Tue +$189.3M, Wed +$517.2M, Thu +$606.3M, the largest single-day inflow since May 1, ~82% via IBIT, and Fri +$307.5M.
Weekly net: roughly +$1.92B, the biggest week of 2026, led by IBIT and FBTC; VanEck HODL was the only weekly outflow. The streak extended through Monday Aug 24, taking the six-day run to $2.26B and trimming YTD net outflows to ~$2.57B. BTC ETF NAV hit $96.1B; cumulative inflows $53.7B.
• $ETH ETF flows: Ethereum ETFs notched their largest weekly inflow since October 2025: +$697.2M, extended by +$115.6M on Aug 24. Combined BTC+ETH ETF volume tripled to $29B.
Exchange Netflow: On-chain data shows BTC continuing to leave exchanges: roughly -12.3K BTC net outflows, accumulation persisted even as price ripped higher.
ETH painted a two-sided picture: +245K ETH net flowed INTO exchanges over Aug 20-24, profit-taking deposits during the +32% pump, partially offset by BitMine's OTC accumulation.
Corporate demand remained the structural bid: BitMine added 32,447 ETH, its largest weekly buy since early July, lifting its stack to 5.85M ETH; listed companies now hold 7.86M ETH. Metaplanet moved 1,000 BTC to Coinbase Prime on Aug 25 amid sale speculation.
Strategy reported no new BTC activity but sold $2.01B of MSTR shares as BTC crossed $80K, raising cash ahead of a potential re-entry.
For the first time since the recovery began, ETF demand, corporate treasuries and exchange withdrawals moved in the same direction.
— Weekly Market Brief
Institutional flows delivered the strongest week since October 2025: $2.6B combined into BTC and ETH ETFs, with BTC alone adding $1.92B as BlackRock's IBIT vacuumed up the majority.
• $BTC ETF flows: Mon +$297.5M, Tue +$189.3M, Wed +$517.2M, Thu +$606.3M, the largest single-day inflow since May 1, ~82% via IBIT, and Fri +$307.5M.
Weekly net: roughly +$1.92B, the biggest week of 2026, led by IBIT and FBTC; VanEck HODL was the only weekly outflow. The streak extended through Monday Aug 24, taking the six-day run to $2.26B and trimming YTD net outflows to ~$2.57B. BTC ETF NAV hit $96.1B; cumulative inflows $53.7B.
• $ETH ETF flows: Ethereum ETFs notched their largest weekly inflow since October 2025: +$697.2M, extended by +$115.6M on Aug 24. Combined BTC+ETH ETF volume tripled to $29B.
Exchange Netflow: On-chain data shows BTC continuing to leave exchanges: roughly -12.3K BTC net outflows, accumulation persisted even as price ripped higher.
ETH painted a two-sided picture: +245K ETH net flowed INTO exchanges over Aug 20-24, profit-taking deposits during the +32% pump, partially offset by BitMine's OTC accumulation.
Corporate demand remained the structural bid: BitMine added 32,447 ETH, its largest weekly buy since early July, lifting its stack to 5.85M ETH; listed companies now hold 7.86M ETH. Metaplanet moved 1,000 BTC to Coinbase Prime on Aug 25 amid sale speculation.
Strategy reported no new BTC activity but sold $2.01B of MSTR shares as BTC crossed $80K, raising cash ahead of a potential re-entry.
For the first time since the recovery began, ETF demand, corporate treasuries and exchange withdrawals moved in the same direction.
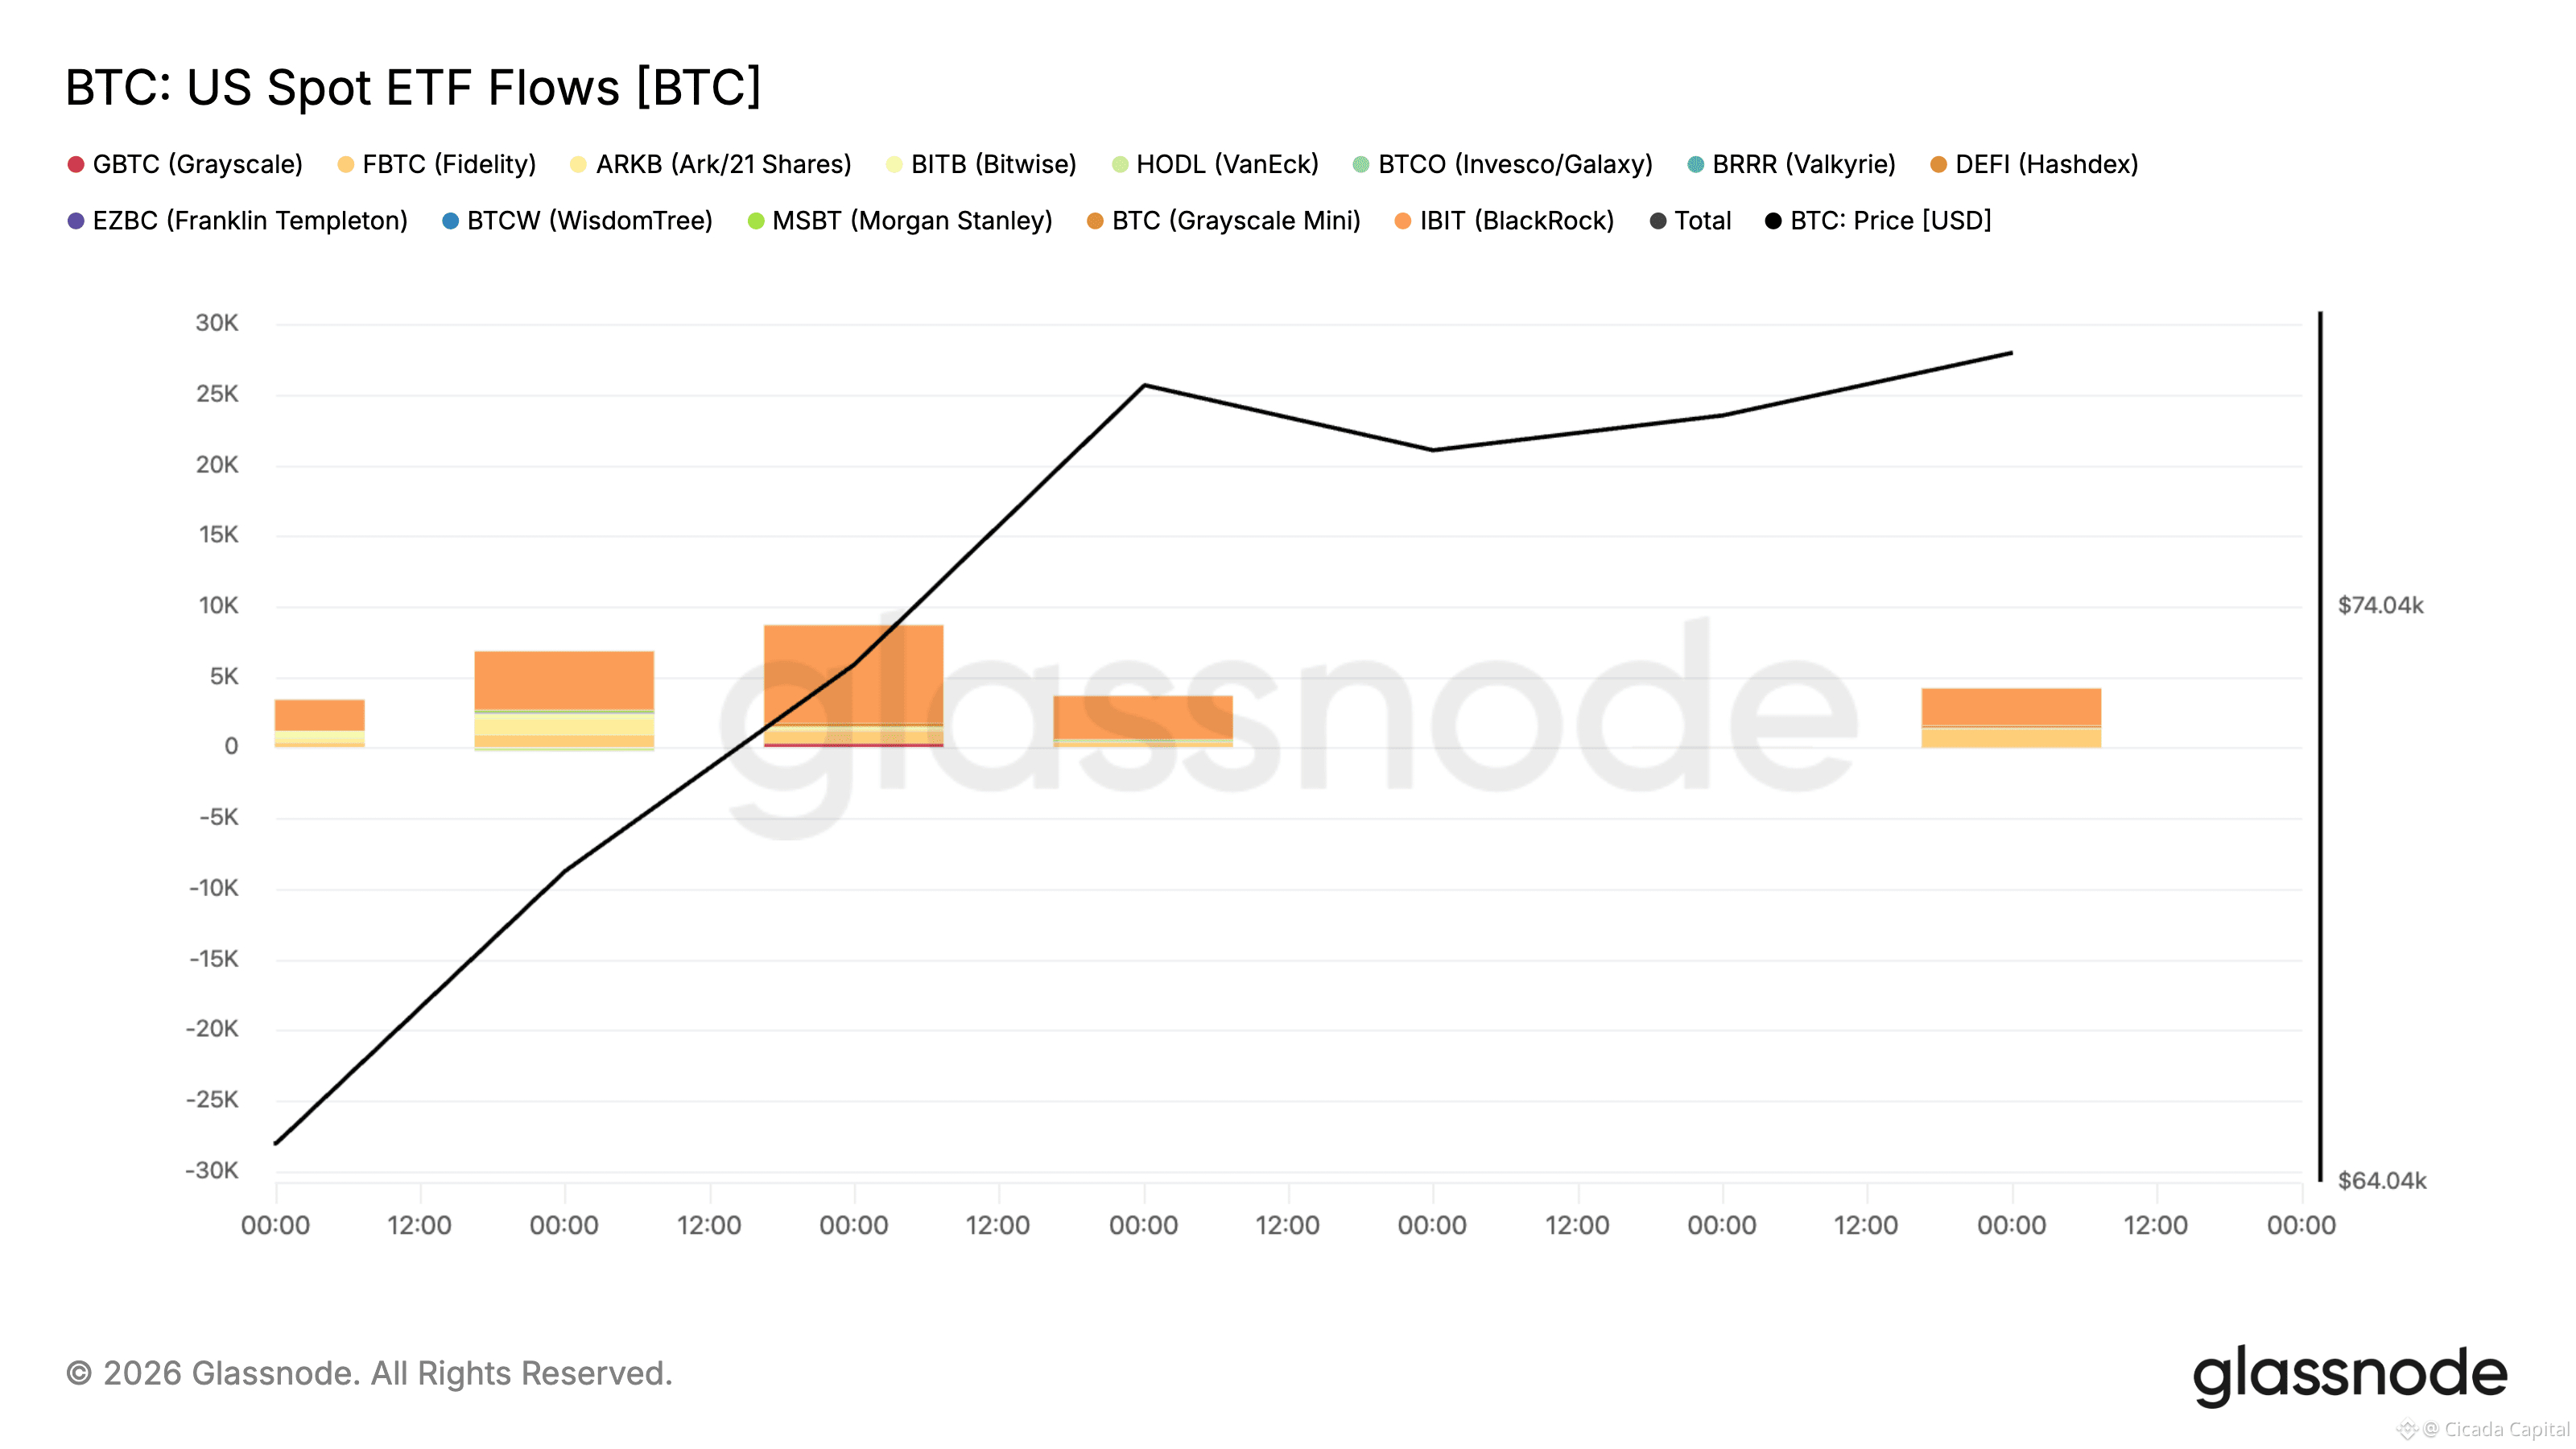
275
📊 Macro Overview
— Weekly Market Brief
The macro week flipped the script: equities pulled back from records while crypto ripped higher, after the U.S. Treasury announced a dramatic expansion of its long-term bond buyback program on Aug 19, a liquidity injection that crushed long-end yields, weakened the dollar and detonated a $1.29B short squeeze in BTC.
• S&P 500 -1.4% | DXY ~99
Stocks cooled after the record run: the S&P 500 closed at 7,674.37 on Aug 21, down 1.4% for the week, the Dow slipped 0.8% to 53,277.01 and the Nasdaq fell 2.1% to 26,180.45 as hawkish minutes and AI-valuation worries took the air out of the August rally.
Flash PMIs were mixed-strong: Manufacturing 53.2, Services jumped to 56.8. Consumer Confidence slid to 51 from 55.2 and July retail sales fell -0.6% MoM, soft spots that underpin Goldman's view that a September hike is very low probability.
The bond market was the epicenter: on Aug 19 the Treasury announced it would at least double its long-term bond buyback operations to $4B each, and CNBC later reported it is weighing tapping its ~$950B Treasury General Account cash pile to expand the program further.
On regulation, the SEC on Aug 18 proposed Regulation Crypto Assets, its most significant step toward a bespoke offering regime for crypto. The Clarity Act stayed in limbo, Senate vote now expected in September. Jackson Hole is next week's macro event.
For $BTC, the macro mix turned decisively constructive, a weaker dollar, falling long-end yields and a fresh liquidity channel from the Treasury program, which Standard Chartered's Geoff Kendrick called exactly the type favored by Bitcoin, reiterating a $100K year-end target.
📊 Macro Overview
— Weekly Market Brief
The macro week flipped the script: equities pulled back from records while crypto ripped higher, after the U.S. Treasury announced a dramatic expansion of its long-term bond buyback program on Aug 19, a liquidity injection that crushed long-end yields, weakened the dollar and detonated a $1.29B short squeeze in BTC.
• S&P 500 -1.4% | DXY ~99
Stocks cooled after the record run: the S&P 500 closed at 7,674.37 on Aug 21, down 1.4% for the week, the Dow slipped 0.8% to 53,277.01 and the Nasdaq fell 2.1% to 26,180.45 as hawkish minutes and AI-valuation worries took the air out of the August rally.
Flash PMIs were mixed-strong: Manufacturing 53.2, Services jumped to 56.8. Consumer Confidence slid to 51 from 55.2 and July retail sales fell -0.6% MoM, soft spots that underpin Goldman's view that a September hike is very low probability.
The bond market was the epicenter: on Aug 19 the Treasury announced it would at least double its long-term bond buyback operations to $4B each, and CNBC later reported it is weighing tapping its ~$950B Treasury General Account cash pile to expand the program further.
On regulation, the SEC on Aug 18 proposed Regulation Crypto Assets, its most significant step toward a bespoke offering regime for crypto. The Clarity Act stayed in limbo, Senate vote now expected in September. Jackson Hole is next week's macro event.
For $BTC, the macro mix turned decisively constructive, a weaker dollar, falling long-end yields and a fresh liquidity channel from the Treasury program, which Standard Chartered's Geoff Kendrick called exactly the type favored by Bitcoin, reiterating a $100K year-end target.
— Weekly Market Brief
The macro week flipped the script: equities pulled back from records while crypto ripped higher, after the U.S. Treasury announced a dramatic expansion of its long-term bond buyback program on Aug 19, a liquidity injection that crushed long-end yields, weakened the dollar and detonated a $1.29B short squeeze in BTC.
• S&P 500 -1.4% | DXY ~99
Stocks cooled after the record run: the S&P 500 closed at 7,674.37 on Aug 21, down 1.4% for the week, the Dow slipped 0.8% to 53,277.01 and the Nasdaq fell 2.1% to 26,180.45 as hawkish minutes and AI-valuation worries took the air out of the August rally.
Flash PMIs were mixed-strong: Manufacturing 53.2, Services jumped to 56.8. Consumer Confidence slid to 51 from 55.2 and July retail sales fell -0.6% MoM, soft spots that underpin Goldman's view that a September hike is very low probability.
The bond market was the epicenter: on Aug 19 the Treasury announced it would at least double its long-term bond buyback operations to $4B each, and CNBC later reported it is weighing tapping its ~$950B Treasury General Account cash pile to expand the program further.
On regulation, the SEC on Aug 18 proposed Regulation Crypto Assets, its most significant step toward a bespoke offering regime for crypto. The Clarity Act stayed in limbo, Senate vote now expected in September. Jackson Hole is next week's macro event.
For $BTC, the macro mix turned decisively constructive, a weaker dollar, falling long-end yields and a fresh liquidity channel from the Treasury program, which Standard Chartered's Geoff Kendrick called exactly the type favored by Bitcoin, reiterating a $100K year-end target.
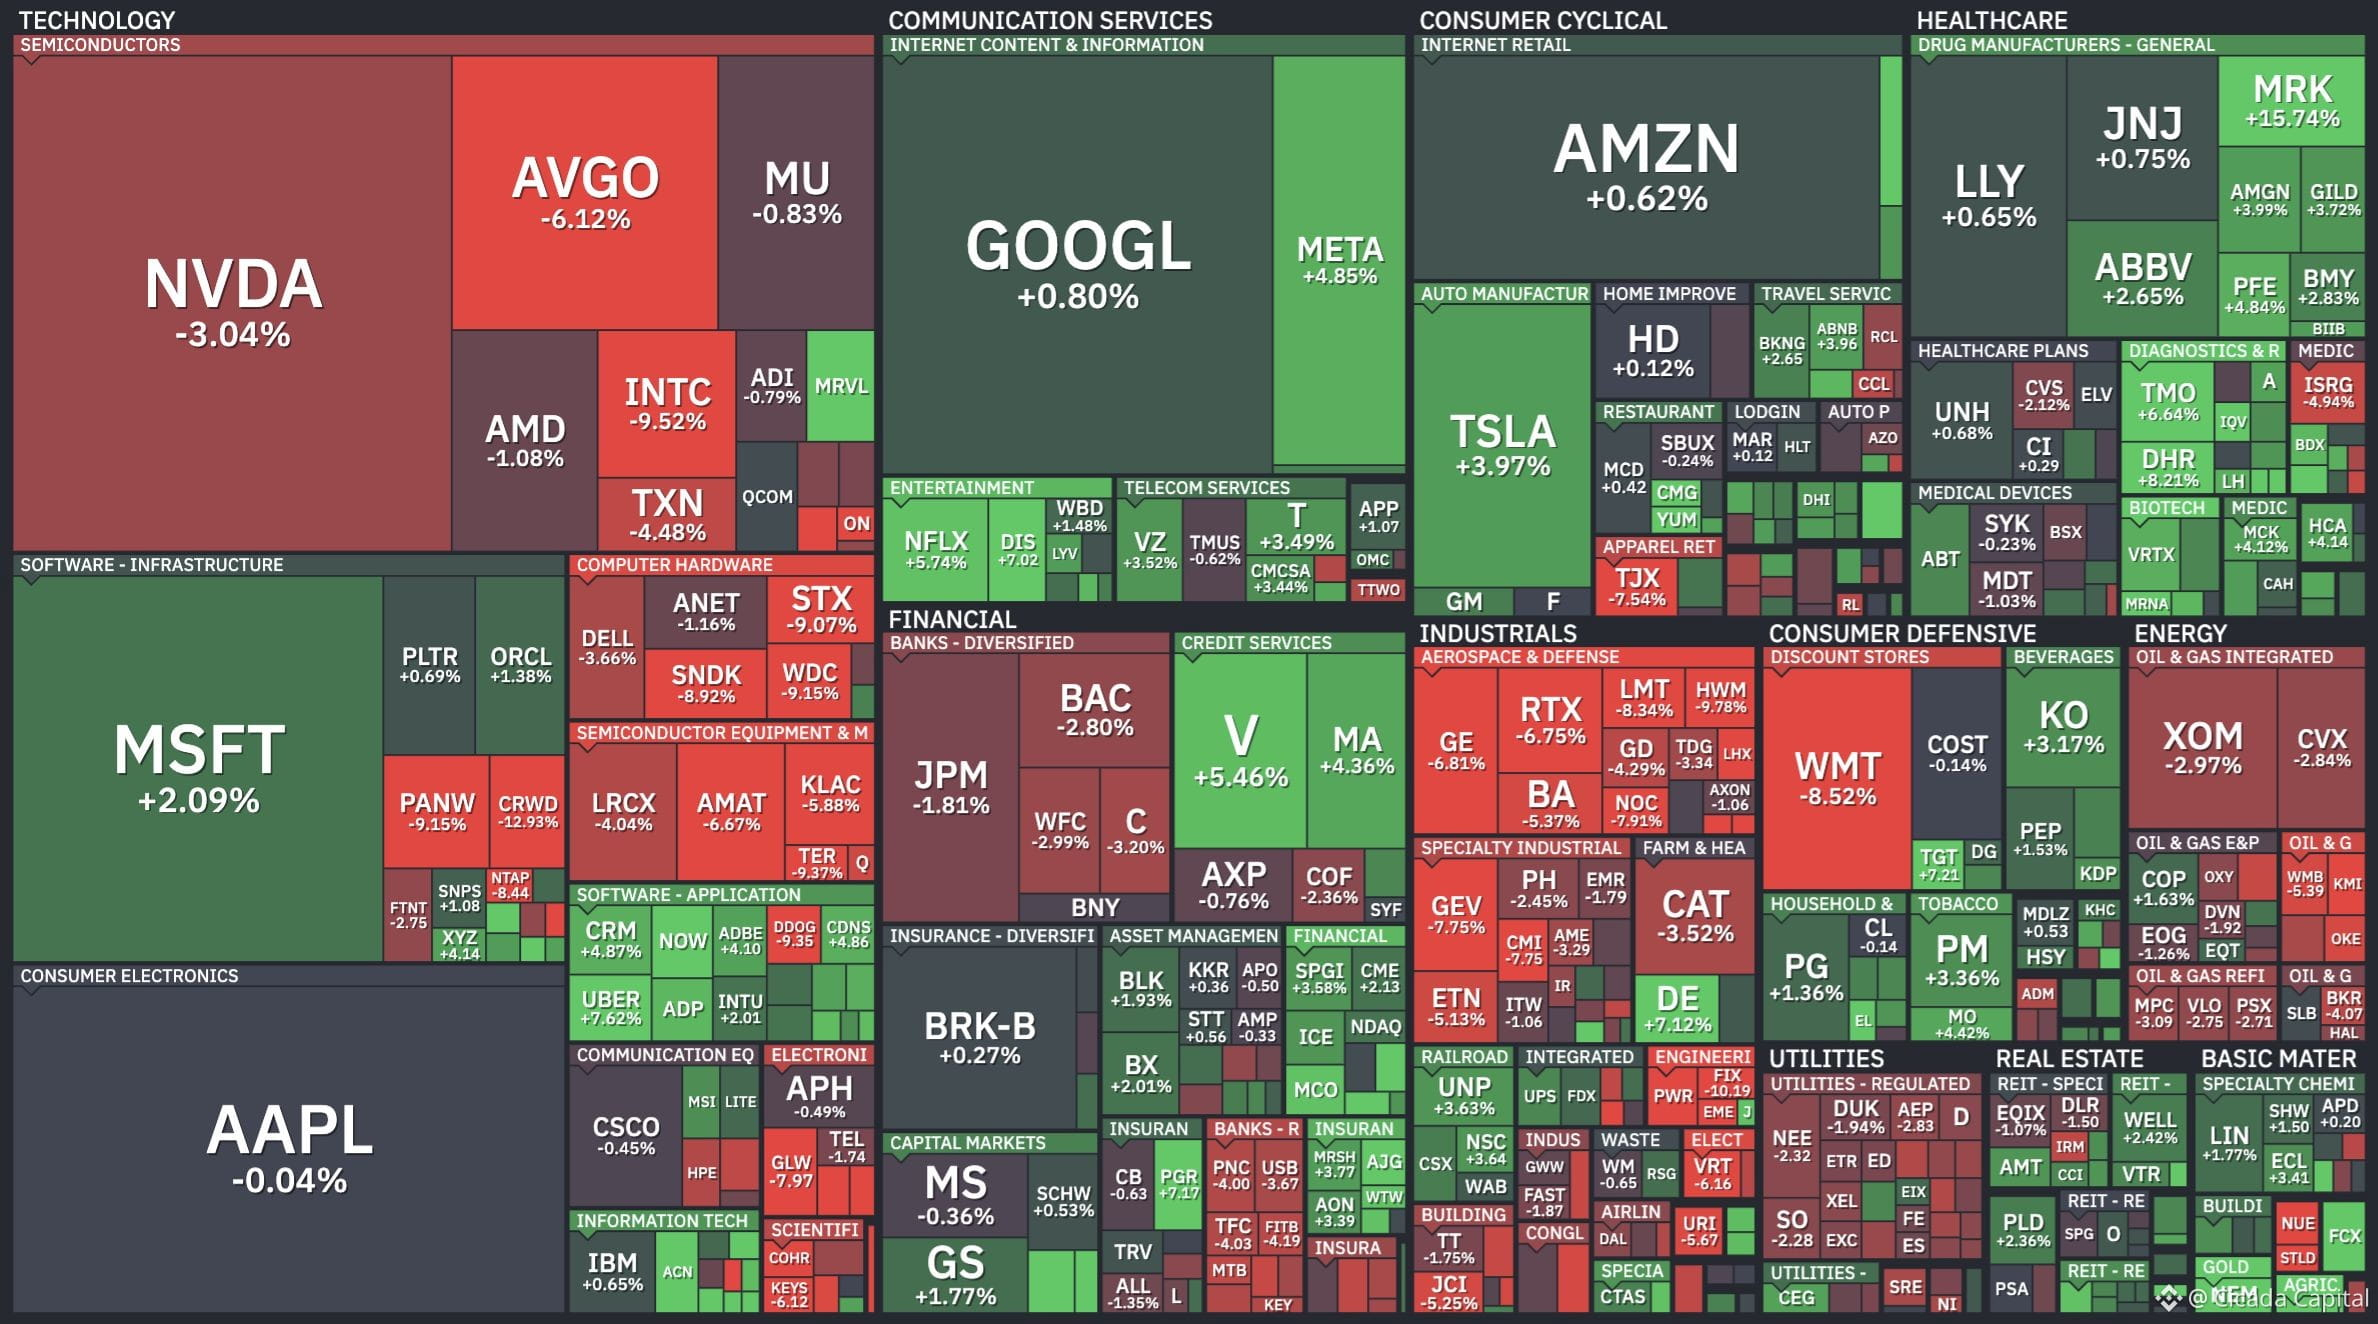
190

Article
Anatomy of a Healthy MarketBy Maxim Moris, CEO and co-founder of Cicada - a Dubai-based Market Making company with 6 years of personal experience, 1,000+ projects, and 500+ exchange listings.
Your token is up 100% in one day. Is that good or bad? Don't rush the answer. The correct answer is you don't know, because price by itself tells you nothing.
A 100% jump can be a sign of healthy demand. Or it can mean your order book is empty and a single hundred-dollar order can move the price wherever it wants.
This is how to read a market. After this, you'll be able to open any token's order book and tell within a minute whether it's alive or artificial.
Where Price Is Born
The order book is every buy and sell order in one place. At the bottom sit the bids, the buy orders. That's the demand. At the top sit the asks, the sell orders. That's supply. Between them sits the mid-price, the market's balance point.
A few terms are worth knowing here:
A limit order sits in the book and waits for its price. A market order fills immediately at the best available price.Placing a limit order adds liquidity and makes you a maker. Hitting the market takes liquidity and makes you a taker. Exchanges charge them differently, and makers pay less.
The book isn't a static picture either. When prices rise, new sellers appear that you never saw before. When price falls, buyers pull their orders and liquidity disappears.
Some of that comes from hidden orders, orders that only appear once a target price is hit. If I want to sell Bitcoin at $100,000, I can place that order in advance and it stays invisible until the market actually reaches $100,000.
Reading the Spread
The first health metric is the spread, the gap between the best bid and the best ask.
The spread is effectively your cost of getting in and out. Buy at $100, sell at $50, and you've lost half your money without anything else happening. The spread alone did that.
A liquid pair should trade at tenths of a percent, sometimes hundredths. Smaller coins can run up to half a percent. Anything above 1% is a red flag: liquidity is thin, every entry and exit is expensive, and serious traders avoid that market on sight.
It's the first number a professional checks on an unfamiliar token, and it's already half the diagnosis.
Depth Is Liquidity
Spread tells you the price. Depth tells you how much that price can actually hold. When people talk about a token's liquidity, this is what they mean. Depth is how many orders sit in the book at different distances from the current price, typically checked at 0.5%, 1%, 2%, 5%, and 10%. The level exchanges and aggregators watch most closely is around 2%, how many dollars are sitting in the book that close to the current price.
If there's $1,000 at the 2% level, a $5,000 order punches straight through it and the price jumps. That's slippage. You wanted to buy at $1.00 and your average fill lands at $1.20 or worse. The thinner the book, the harder every trade hits the price.
The more dangerous version is a liquidity gap, a hole in the book. Orders sit down to minus 2%, then nothing, with the next real liquidity down at minus 10%. One large sell order falls through that hole and the price is instantly down 10%.
That's where vertical candles and flash crashes come from, and where a community's panicked "what just happened" comes from too. Nothing happened. There was just a hole in the book. A healthy market has none, even liquidity across every level on both sides, held there around the clock.
Seeing Isn't Believing
Volume is how much traded over a period, and a big daily number looks convincing on its own. The problem is that volume is the easiest metric on the market to fake. Wash trading means buying from yourself and selling to yourself. The number grows and no real market sits underneath it.
That era is fading. A few years ago wash trading was everywhere. Today there's a fraction of it, mostly because it stopped working. Exchanges police it harder and traders can spot fake volume in seconds. Real volume always shows up with real depth and a tight spread behind it.If daily volume reads $1M and the book holds $300 at the 2% level, that mismatch tells you everything without any further digging.
There's one more check worth thirty seconds, the trade history itself. Modern wash trading rarely uses big blocks anymore. It shows up as many small, identical orders inside the spread, a matched buy and sell of the same size, repeating at a steady interval.
Real trading looks chaotic, different sizes, different timing, different prices. Fake volume looks rhythmic. A live market reads like noise. A fake one reads like a pattern. Volume without depth is decoration. Check volume, depth, spread, and trade history together, because as a set, they don't lie.
The Six-Point Checklist
Everything above boils down to six checks. None of them need a paid tool or a background in trading, just the order book itself and a couple of minutes of attention.
Open your token's order book and run through these:
Spread within norm, tenths of a percent for liquid pairs, up to half a percent for smaller ones, anything above 1% is a red flag.Real depth at 2% on both sides, and again at 5% and 10%.No liquidity gaps between levels.Volume actually backed by depth, with a ratio that looks plausible.Trade history reads as chaotic, not identical paired orders inside the spread.The book is symmetric, bids and asks roughly balanced, with no heavy skew to one side.
Six yeses and your market is healthy. Even one no means the market has a problem, and it won't fix itself. It's a lot like a cavity. The longer it's ignored, the more expensive it gets to treat.
Price Is What Everyone Sees
The order book is what professionals see. Anyone can paint a chart. A healthy order book only comes from a real market or a good market maker behind it.
Once you know how to read spread, depth, volume, and trade history, one minute in the order book tells you more about a token than an hour staring at candles.
I'm Maxim Moris, Founder of Cicada Market Making. If you need help reviewing a contract before you sign - reach out. I personally review every incoming request together with the team.
[Can you trust your Market Maker?](https://www.binance.com/en/square/post/347507256543714)
Anatomy of a Healthy Market
By Maxim Moris, CEO and co-founder of Cicada - a Dubai-based Market Making company with 6 years of personal experience, 1,000+ projects, and 500+ exchange listings.
Your token is up 100% in one day. Is that good or bad? Don't rush the answer. The correct answer is you don't know, because price by itself tells you nothing.
A 100% jump can be a sign of healthy demand. Or it can mean your order book is empty and a single hundred-dollar order can move the price wherever it wants.
This is how to read a market. After this, you'll be able to open any token's order book and tell within a minute whether it's alive or artificial.
Where Price Is Born
The order book is every buy and sell order in one place. At the bottom sit the bids, the buy orders. That's the demand. At the top sit the asks, the sell orders. That's supply. Between them sits the mid-price, the market's balance point.
A few terms are worth knowing here:
A limit order sits in the book and waits for its price. A market order fills immediately at the best available price.Placing a limit order adds liquidity and makes you a maker. Hitting the market takes liquidity and makes you a taker. Exchanges charge them differently, and makers pay less.
The book isn't a static picture either. When prices rise, new sellers appear that you never saw before. When price falls, buyers pull their orders and liquidity disappears.
Some of that comes from hidden orders, orders that only appear once a target price is hit. If I want to sell Bitcoin at $100,000, I can place that order in advance and it stays invisible until the market actually reaches $100,000.
Reading the Spread
The first health metric is the spread, the gap between the best bid and the best ask.
The spread is effectively your cost of getting in and out. Buy at $100, sell at $50, and you've lost half your money without anything else happening. The spread alone did that.
A liquid pair should trade at tenths of a percent, sometimes hundredths. Smaller coins can run up to half a percent. Anything above 1% is a red flag: liquidity is thin, every entry and exit is expensive, and serious traders avoid that market on sight.
It's the first number a professional checks on an unfamiliar token, and it's already half the diagnosis.
Depth Is Liquidity
Spread tells you the price. Depth tells you how much that price can actually hold. When people talk about a token's liquidity, this is what they mean. Depth is how many orders sit in the book at different distances from the current price, typically checked at 0.5%, 1%, 2%, 5%, and 10%. The level exchanges and aggregators watch most closely is around 2%, how many dollars are sitting in the book that close to the current price.
If there's $1,000 at the 2% level, a $5,000 order punches straight through it and the price jumps. That's slippage. You wanted to buy at $1.00 and your average fill lands at $1.20 or worse. The thinner the book, the harder every trade hits the price.
The more dangerous version is a liquidity gap, a hole in the book. Orders sit down to minus 2%, then nothing, with the next real liquidity down at minus 10%. One large sell order falls through that hole and the price is instantly down 10%.
That's where vertical candles and flash crashes come from, and where a community's panicked "what just happened" comes from too. Nothing happened. There was just a hole in the book. A healthy market has none, even liquidity across every level on both sides, held there around the clock.
Seeing Isn't Believing
Volume is how much traded over a period, and a big daily number looks convincing on its own. The problem is that volume is the easiest metric on the market to fake. Wash trading means buying from yourself and selling to yourself. The number grows and no real market sits underneath it.
That era is fading. A few years ago wash trading was everywhere. Today there's a fraction of it, mostly because it stopped working. Exchanges police it harder and traders can spot fake volume in seconds. Real volume always shows up with real depth and a tight spread behind it.If daily volume reads $1M and the book holds $300 at the 2% level, that mismatch tells you everything without any further digging.
There's one more check worth thirty seconds, the trade history itself. Modern wash trading rarely uses big blocks anymore. It shows up as many small, identical orders inside the spread, a matched buy and sell of the same size, repeating at a steady interval.
Real trading looks chaotic, different sizes, different timing, different prices. Fake volume looks rhythmic. A live market reads like noise. A fake one reads like a pattern. Volume without depth is decoration. Check volume, depth, spread, and trade history together, because as a set, they don't lie.
The Six-Point Checklist
Everything above boils down to six checks. None of them need a paid tool or a background in trading, just the order book itself and a couple of minutes of attention.
Open your token's order book and run through these:
Spread within norm, tenths of a percent for liquid pairs, up to half a percent for smaller ones, anything above 1% is a red flag.Real depth at 2% on both sides, and again at 5% and 10%.No liquidity gaps between levels.Volume actually backed by depth, with a ratio that looks plausible.Trade history reads as chaotic, not identical paired orders inside the spread.The book is symmetric, bids and asks roughly balanced, with no heavy skew to one side.
Six yeses and your market is healthy. Even one no means the market has a problem, and it won't fix itself. It's a lot like a cavity. The longer it's ignored, the more expensive it gets to treat.
Price Is What Everyone Sees
The order book is what professionals see. Anyone can paint a chart. A healthy order book only comes from a real market or a good market maker behind it.
Once you know how to read spread, depth, volume, and trade history, one minute in the order book tells you more about a token than an hour staring at candles.
I'm Maxim Moris, Founder of Cicada Market Making. If you need help reviewing a contract before you sign - reach out. I personally review every incoming request together with the team.
Can you trust your Market Maker?
Your token is up 100% in one day. Is that good or bad? Don't rush the answer. The correct answer is you don't know, because price by itself tells you nothing.
A 100% jump can be a sign of healthy demand. Or it can mean your order book is empty and a single hundred-dollar order can move the price wherever it wants.
This is how to read a market. After this, you'll be able to open any token's order book and tell within a minute whether it's alive or artificial.
Where Price Is Born
The order book is every buy and sell order in one place. At the bottom sit the bids, the buy orders. That's the demand. At the top sit the asks, the sell orders. That's supply. Between them sits the mid-price, the market's balance point.
A few terms are worth knowing here:
A limit order sits in the book and waits for its price. A market order fills immediately at the best available price.Placing a limit order adds liquidity and makes you a maker. Hitting the market takes liquidity and makes you a taker. Exchanges charge them differently, and makers pay less.
The book isn't a static picture either. When prices rise, new sellers appear that you never saw before. When price falls, buyers pull their orders and liquidity disappears.
Some of that comes from hidden orders, orders that only appear once a target price is hit. If I want to sell Bitcoin at $100,000, I can place that order in advance and it stays invisible until the market actually reaches $100,000.
Reading the Spread
The first health metric is the spread, the gap between the best bid and the best ask.
The spread is effectively your cost of getting in and out. Buy at $100, sell at $50, and you've lost half your money without anything else happening. The spread alone did that.
A liquid pair should trade at tenths of a percent, sometimes hundredths. Smaller coins can run up to half a percent. Anything above 1% is a red flag: liquidity is thin, every entry and exit is expensive, and serious traders avoid that market on sight.
It's the first number a professional checks on an unfamiliar token, and it's already half the diagnosis.
Depth Is Liquidity
Spread tells you the price. Depth tells you how much that price can actually hold. When people talk about a token's liquidity, this is what they mean. Depth is how many orders sit in the book at different distances from the current price, typically checked at 0.5%, 1%, 2%, 5%, and 10%. The level exchanges and aggregators watch most closely is around 2%, how many dollars are sitting in the book that close to the current price.
If there's $1,000 at the 2% level, a $5,000 order punches straight through it and the price jumps. That's slippage. You wanted to buy at $1.00 and your average fill lands at $1.20 or worse. The thinner the book, the harder every trade hits the price.
The more dangerous version is a liquidity gap, a hole in the book. Orders sit down to minus 2%, then nothing, with the next real liquidity down at minus 10%. One large sell order falls through that hole and the price is instantly down 10%.
That's where vertical candles and flash crashes come from, and where a community's panicked "what just happened" comes from too. Nothing happened. There was just a hole in the book. A healthy market has none, even liquidity across every level on both sides, held there around the clock.
Seeing Isn't Believing
Volume is how much traded over a period, and a big daily number looks convincing on its own. The problem is that volume is the easiest metric on the market to fake. Wash trading means buying from yourself and selling to yourself. The number grows and no real market sits underneath it.
That era is fading. A few years ago wash trading was everywhere. Today there's a fraction of it, mostly because it stopped working. Exchanges police it harder and traders can spot fake volume in seconds. Real volume always shows up with real depth and a tight spread behind it.If daily volume reads $1M and the book holds $300 at the 2% level, that mismatch tells you everything without any further digging.
There's one more check worth thirty seconds, the trade history itself. Modern wash trading rarely uses big blocks anymore. It shows up as many small, identical orders inside the spread, a matched buy and sell of the same size, repeating at a steady interval.
Real trading looks chaotic, different sizes, different timing, different prices. Fake volume looks rhythmic. A live market reads like noise. A fake one reads like a pattern. Volume without depth is decoration. Check volume, depth, spread, and trade history together, because as a set, they don't lie.
The Six-Point Checklist
Everything above boils down to six checks. None of them need a paid tool or a background in trading, just the order book itself and a couple of minutes of attention.
Open your token's order book and run through these:
Spread within norm, tenths of a percent for liquid pairs, up to half a percent for smaller ones, anything above 1% is a red flag.Real depth at 2% on both sides, and again at 5% and 10%.No liquidity gaps between levels.Volume actually backed by depth, with a ratio that looks plausible.Trade history reads as chaotic, not identical paired orders inside the spread.The book is symmetric, bids and asks roughly balanced, with no heavy skew to one side.
Six yeses and your market is healthy. Even one no means the market has a problem, and it won't fix itself. It's a lot like a cavity. The longer it's ignored, the more expensive it gets to treat.
Price Is What Everyone Sees
The order book is what professionals see. Anyone can paint a chart. A healthy order book only comes from a real market or a good market maker behind it.
Once you know how to read spread, depth, volume, and trade history, one minute in the order book tells you more about a token than an hour staring at candles.
I'm Maxim Moris, Founder of Cicada Market Making. If you need help reviewing a contract before you sign - reach out. I personally review every incoming request together with the team.
Can you trust your Market Maker?
126
📊 On‑Chain & Futures Analysis
— Weekly Market Brief
Leverage told a clear buy the CPI, sell the news story: funding stayed positive all week, but OI-weighted funding spiked to its highest since the July flush right into the CPI print, then got unwound as the week faded.
$BTC opened the week at $64,845 on Aug 10 and immediately printed the weekly high of $65,322, the third failed attempt at $65K+ in three weeks. From there it bled lower all week: $63,911, a CPI-day pop to $64,381 that failed, then a slide through $63.4K to the weekly low of $62,488 on Aug 14, the lowest print since August 1.
A quiet weekend left BTC at $62,819 on Aug 16, roughly -3.1% WoW and its weakest weekly close since early August; Monday Aug 17 holds ~$62.7K. $ETH held up comparatively well: 1,909 → $1,874, spiking to $1,922 intraday on CPI before fading, with ETH/BTC pressing against the 0.03 level.
• Funding rates stayed positive all week, the fourth consecutive positive week, but the shape matters: combined funding jumped to 0.01% on Aug 11 and OI-weighted funding climbed from 0.0062% to a post-flush high of 0.0101% intraday on Aug 13, longs were levering into the CPI print.
• Strategy stayed quiet, no new weekly report. CEO Phong Le instead spent the week selling the story: he sees 7 fall catalysts, regulatory action, bank participation, digital financial products, and reiterated we'll get back to buying more.
📌 Bottom Line
Macro bullishness (3.4% CPI, 40% hike odds, record stocks) failed to lift BTC, which fell -3.1% to $62.8K after a third rejected breakout at $65K, driven by -$385M ETF outflows and a 90-day negative Coinbase Premium pointing to U.S.-led selling.
Clarity Act passage odds dropped to 10%, shifting crypto regulation to slower SEC rulemaking. Key support holds at $62.2-62.5K (losing it opens $60K), while recovery requires a close above $63.5K to target $65.3K ahead of upcoming FOMC minutes and Jackson Hole.
📊 On‑Chain & Futures Analysis
— Weekly Market Brief
Leverage told a clear buy the CPI, sell the news story: funding stayed positive all week, but OI-weighted funding spiked to its highest since the July flush right into the CPI print, then got unwound as the week faded.
$BTC opened the week at $64,845 on Aug 10 and immediately printed the weekly high of $65,322, the third failed attempt at $65K+ in three weeks. From there it bled lower all week: $63,911, a CPI-day pop to $64,381 that failed, then a slide through $63.4K to the weekly low of $62,488 on Aug 14, the lowest print since August 1.
A quiet weekend left BTC at $62,819 on Aug 16, roughly -3.1% WoW and its weakest weekly close since early August; Monday Aug 17 holds ~$62.7K. $ETH held up comparatively well: 1,909 → $1,874, spiking to $1,922 intraday on CPI before fading, with ETH/BTC pressing against the 0.03 level.
• Funding rates stayed positive all week, the fourth consecutive positive week, but the shape matters: combined funding jumped to 0.01% on Aug 11 and OI-weighted funding climbed from 0.0062% to a post-flush high of 0.0101% intraday on Aug 13, longs were levering into the CPI print.
• Strategy stayed quiet, no new weekly report. CEO Phong Le instead spent the week selling the story: he sees 7 fall catalysts, regulatory action, bank participation, digital financial products, and reiterated we'll get back to buying more.
📌 Bottom Line
Macro bullishness (3.4% CPI, 40% hike odds, record stocks) failed to lift BTC, which fell -3.1% to $62.8K after a third rejected breakout at $65K, driven by -$385M ETF outflows and a 90-day negative Coinbase Premium pointing to U.S.-led selling.
Clarity Act passage odds dropped to 10%, shifting crypto regulation to slower SEC rulemaking. Key support holds at $62.2-62.5K (losing it opens $60K), while recovery requires a close above $63.5K to target $65.3K ahead of upcoming FOMC minutes and Jackson Hole.
— Weekly Market Brief
Leverage told a clear buy the CPI, sell the news story: funding stayed positive all week, but OI-weighted funding spiked to its highest since the July flush right into the CPI print, then got unwound as the week faded.
$BTC opened the week at $64,845 on Aug 10 and immediately printed the weekly high of $65,322, the third failed attempt at $65K+ in three weeks. From there it bled lower all week: $63,911, a CPI-day pop to $64,381 that failed, then a slide through $63.4K to the weekly low of $62,488 on Aug 14, the lowest print since August 1.
A quiet weekend left BTC at $62,819 on Aug 16, roughly -3.1% WoW and its weakest weekly close since early August; Monday Aug 17 holds ~$62.7K. $ETH held up comparatively well: 1,909 → $1,874, spiking to $1,922 intraday on CPI before fading, with ETH/BTC pressing against the 0.03 level.
• Funding rates stayed positive all week, the fourth consecutive positive week, but the shape matters: combined funding jumped to 0.01% on Aug 11 and OI-weighted funding climbed from 0.0062% to a post-flush high of 0.0101% intraday on Aug 13, longs were levering into the CPI print.
• Strategy stayed quiet, no new weekly report. CEO Phong Le instead spent the week selling the story: he sees 7 fall catalysts, regulatory action, bank participation, digital financial products, and reiterated we'll get back to buying more.
📌 Bottom Line
Macro bullishness (3.4% CPI, 40% hike odds, record stocks) failed to lift BTC, which fell -3.1% to $62.8K after a third rejected breakout at $65K, driven by -$385M ETF outflows and a 90-day negative Coinbase Premium pointing to U.S.-led selling.
Clarity Act passage odds dropped to 10%, shifting crypto regulation to slower SEC rulemaking. Key support holds at $62.2-62.5K (losing it opens $60K), while recovery requires a close above $63.5K to target $65.3K ahead of upcoming FOMC minutes and Jackson Hole.
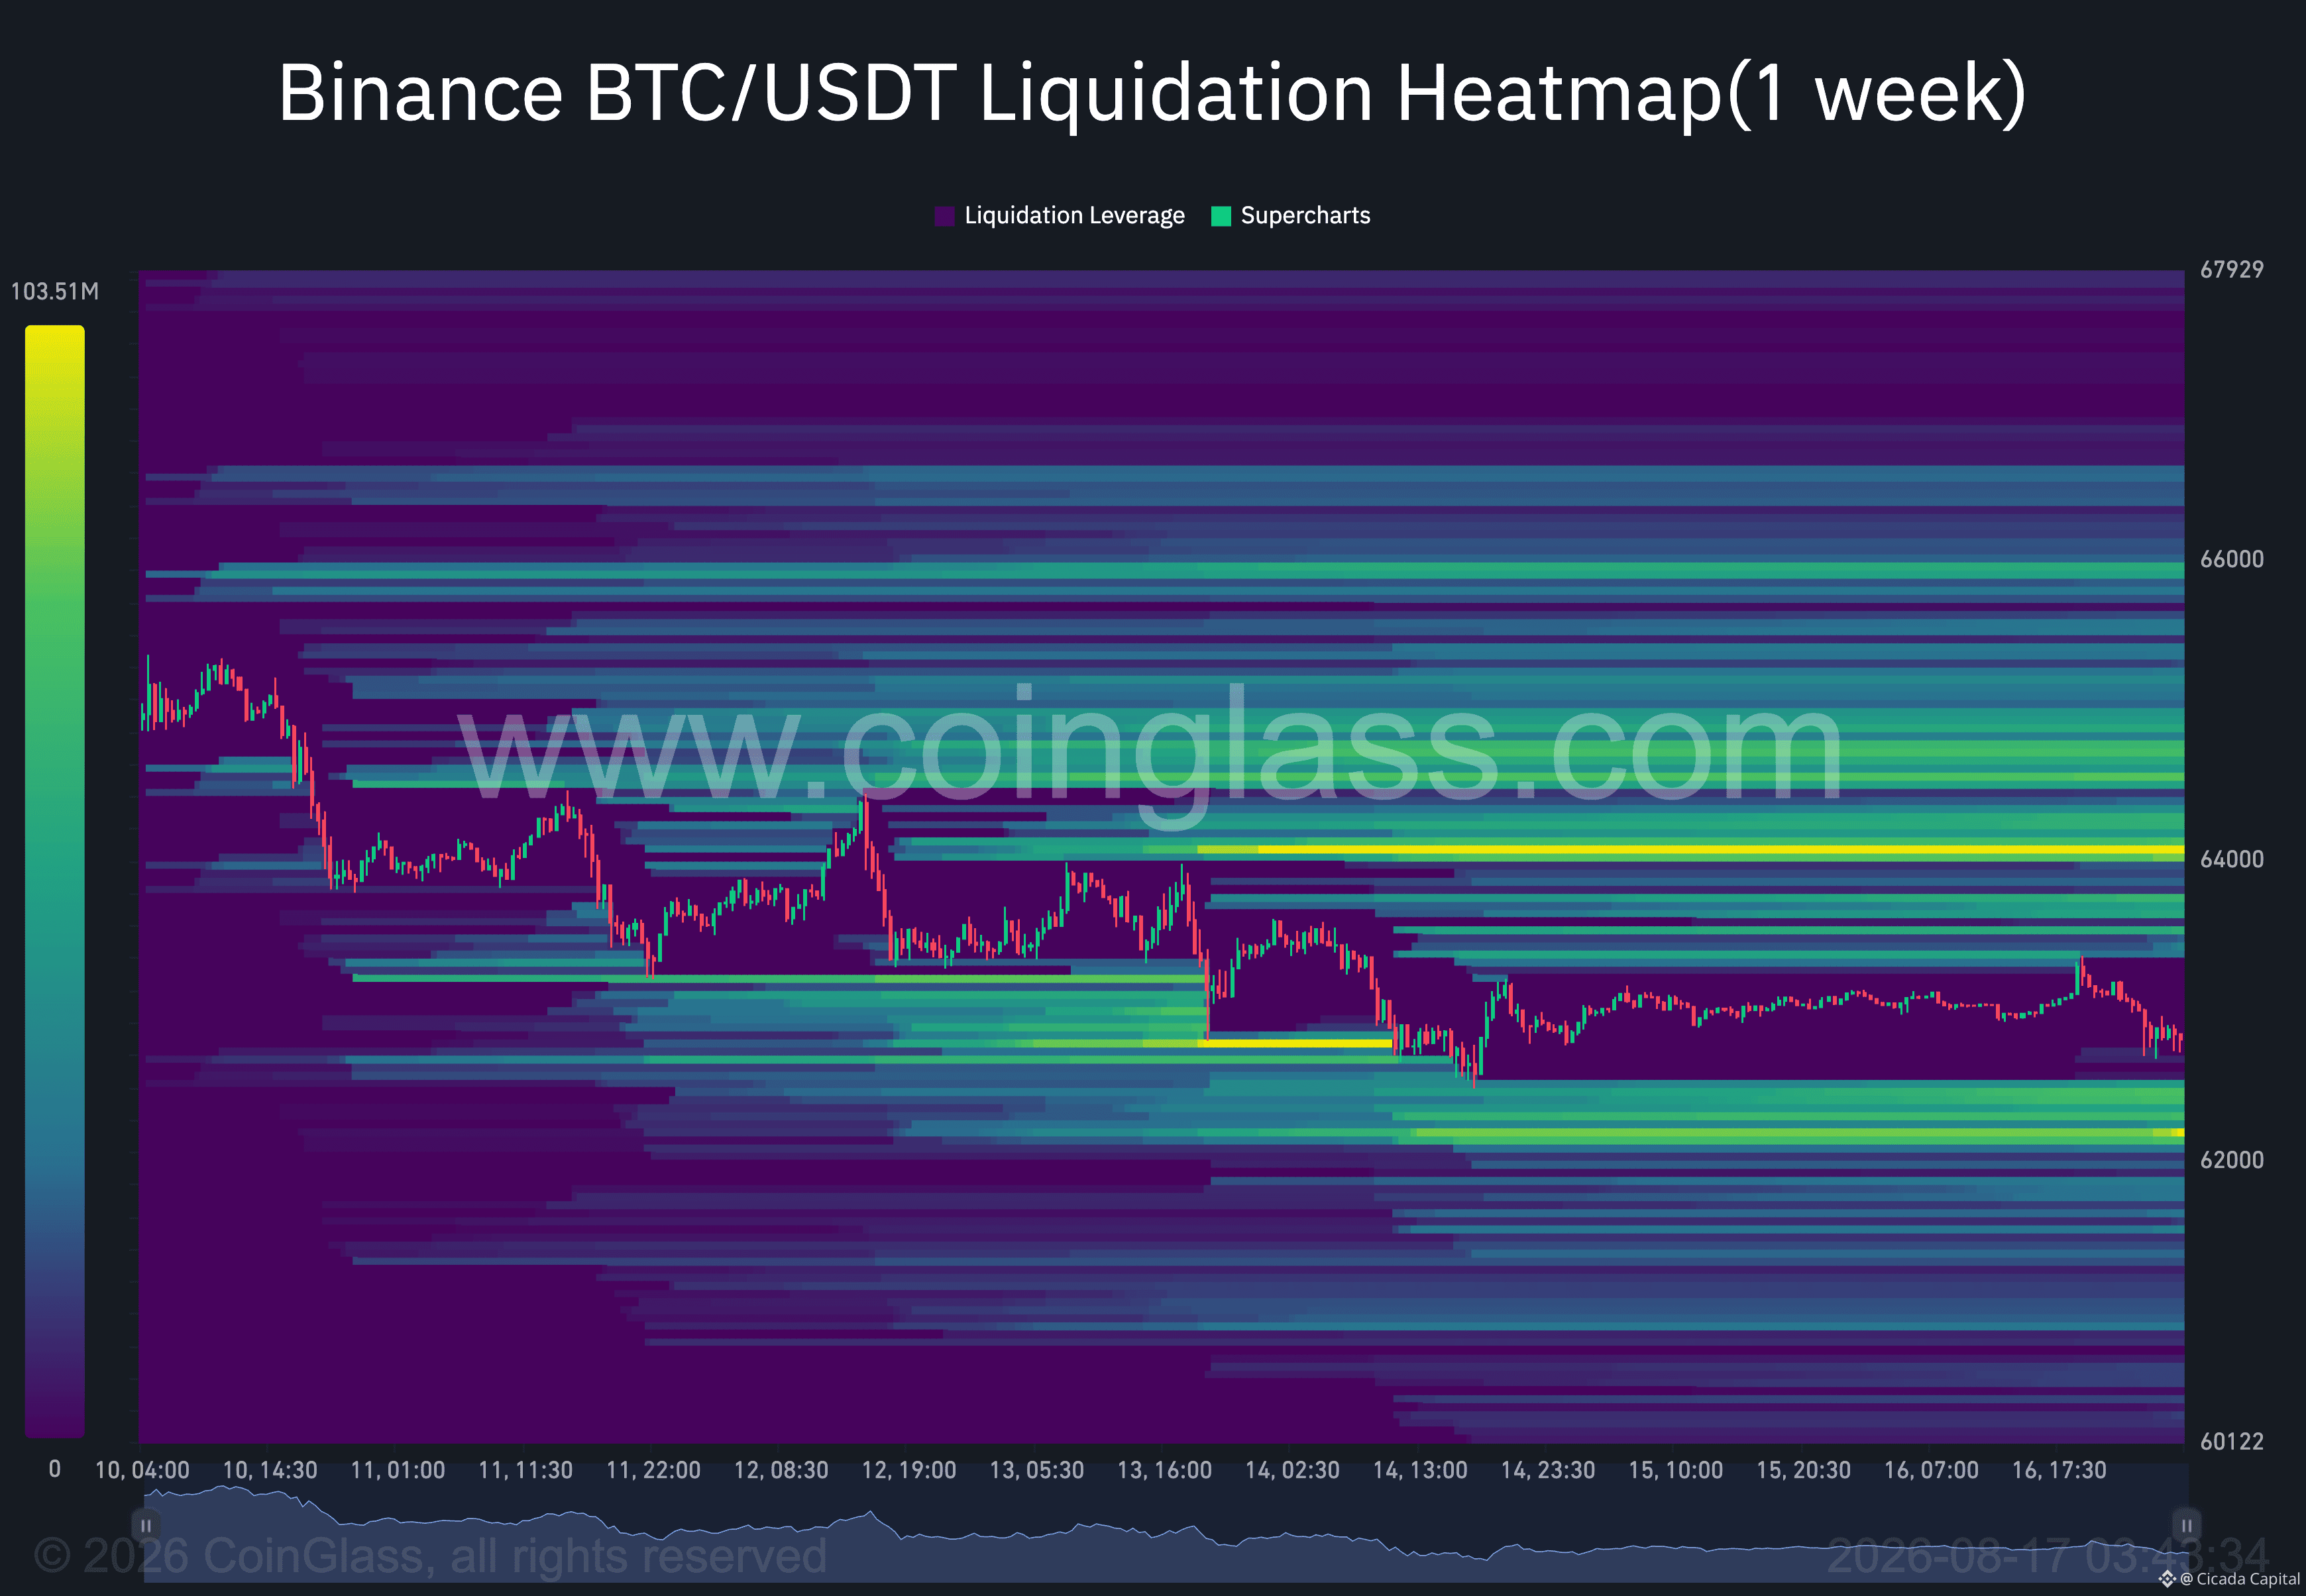
139
📊 Crypto Capital Flows
— Weekly Market Brief
Institutional flows reversed hard: after the strongest ETF week since June, BTC ETFs gave back roughly half of it in five days, while ETH ETFs went flat, and on-chain exchange flows flipped to net BTC inflows, a two-sided warning.
• $BTC ETF flows: The week opened with -$144.6M on Aug 10, a token +$7.8M on Aug 11, then -$61.1M on CPI day Aug 12, -$131.1M on Aug 13 and -$56.2M on Aug 14.
Weekly net: roughly -$385.2M, the first negative week since the July 28 FOMC week and the weakest performance of the recovery period. Notably, the outflows came on a week of good macro news, suggesting positioning-driven selling rather than macro flight.
• $ETH ETF flows: Ethereum held up far better: -$14.6M, -$1.7M, +$7.4M, +$5.9M, and flat on Aug 14, roughly -$3.0M net, essentially neutral after last week's +$244M burst. The ETH rotation narrative paused but didn't break; spot ETH outperformed BTC on the week.
Exchange Netflow: On-chain data turned negative for BTC: roughly +16.5K BTC net flowed INTO exchanges over Aug 10-16, the heaviest weekly inflow since the flush, a sign of supply moving toward sell-side liquidity.
ETH painted a roughly flat picture at +5.1K ETH with a violent two-sided week: a -55.8K outflow print was almost fully offset by a +43.0K inflow day.
The flow mosaic flipped from last week: ETF demand is no longer absorbing exchange inflows. The offsetting bid now comes from corporates, BitMine pushed its ETH stack to 5.81M ETH, lifting total listed-company ETH holdings to 7.82M ETH, and from persistent reports of U.S. spot weakness: AMBCrypto flags an extended negative Coinbase Premium as a 90-day warning on American demand.
📊 Crypto Capital Flows
— Weekly Market Brief
Institutional flows reversed hard: after the strongest ETF week since June, BTC ETFs gave back roughly half of it in five days, while ETH ETFs went flat, and on-chain exchange flows flipped to net BTC inflows, a two-sided warning.
• $BTC ETF flows: The week opened with -$144.6M on Aug 10, a token +$7.8M on Aug 11, then -$61.1M on CPI day Aug 12, -$131.1M on Aug 13 and -$56.2M on Aug 14.
Weekly net: roughly -$385.2M, the first negative week since the July 28 FOMC week and the weakest performance of the recovery period. Notably, the outflows came on a week of good macro news, suggesting positioning-driven selling rather than macro flight.
• $ETH ETF flows: Ethereum held up far better: -$14.6M, -$1.7M, +$7.4M, +$5.9M, and flat on Aug 14, roughly -$3.0M net, essentially neutral after last week's +$244M burst. The ETH rotation narrative paused but didn't break; spot ETH outperformed BTC on the week.
Exchange Netflow: On-chain data turned negative for BTC: roughly +16.5K BTC net flowed INTO exchanges over Aug 10-16, the heaviest weekly inflow since the flush, a sign of supply moving toward sell-side liquidity.
ETH painted a roughly flat picture at +5.1K ETH with a violent two-sided week: a -55.8K outflow print was almost fully offset by a +43.0K inflow day.
The flow mosaic flipped from last week: ETF demand is no longer absorbing exchange inflows. The offsetting bid now comes from corporates, BitMine pushed its ETH stack to 5.81M ETH, lifting total listed-company ETH holdings to 7.82M ETH, and from persistent reports of U.S. spot weakness: AMBCrypto flags an extended negative Coinbase Premium as a 90-day warning on American demand.
— Weekly Market Brief
Institutional flows reversed hard: after the strongest ETF week since June, BTC ETFs gave back roughly half of it in five days, while ETH ETFs went flat, and on-chain exchange flows flipped to net BTC inflows, a two-sided warning.
• $BTC ETF flows: The week opened with -$144.6M on Aug 10, a token +$7.8M on Aug 11, then -$61.1M on CPI day Aug 12, -$131.1M on Aug 13 and -$56.2M on Aug 14.
Weekly net: roughly -$385.2M, the first negative week since the July 28 FOMC week and the weakest performance of the recovery period. Notably, the outflows came on a week of good macro news, suggesting positioning-driven selling rather than macro flight.
• $ETH ETF flows: Ethereum held up far better: -$14.6M, -$1.7M, +$7.4M, +$5.9M, and flat on Aug 14, roughly -$3.0M net, essentially neutral after last week's +$244M burst. The ETH rotation narrative paused but didn't break; spot ETH outperformed BTC on the week.
Exchange Netflow: On-chain data turned negative for BTC: roughly +16.5K BTC net flowed INTO exchanges over Aug 10-16, the heaviest weekly inflow since the flush, a sign of supply moving toward sell-side liquidity.
ETH painted a roughly flat picture at +5.1K ETH with a violent two-sided week: a -55.8K outflow print was almost fully offset by a +43.0K inflow day.
The flow mosaic flipped from last week: ETF demand is no longer absorbing exchange inflows. The offsetting bid now comes from corporates, BitMine pushed its ETH stack to 5.81M ETH, lifting total listed-company ETH holdings to 7.82M ETH, and from persistent reports of U.S. spot weakness: AMBCrypto flags an extended negative Coinbase Premium as a 90-day warning on American demand.
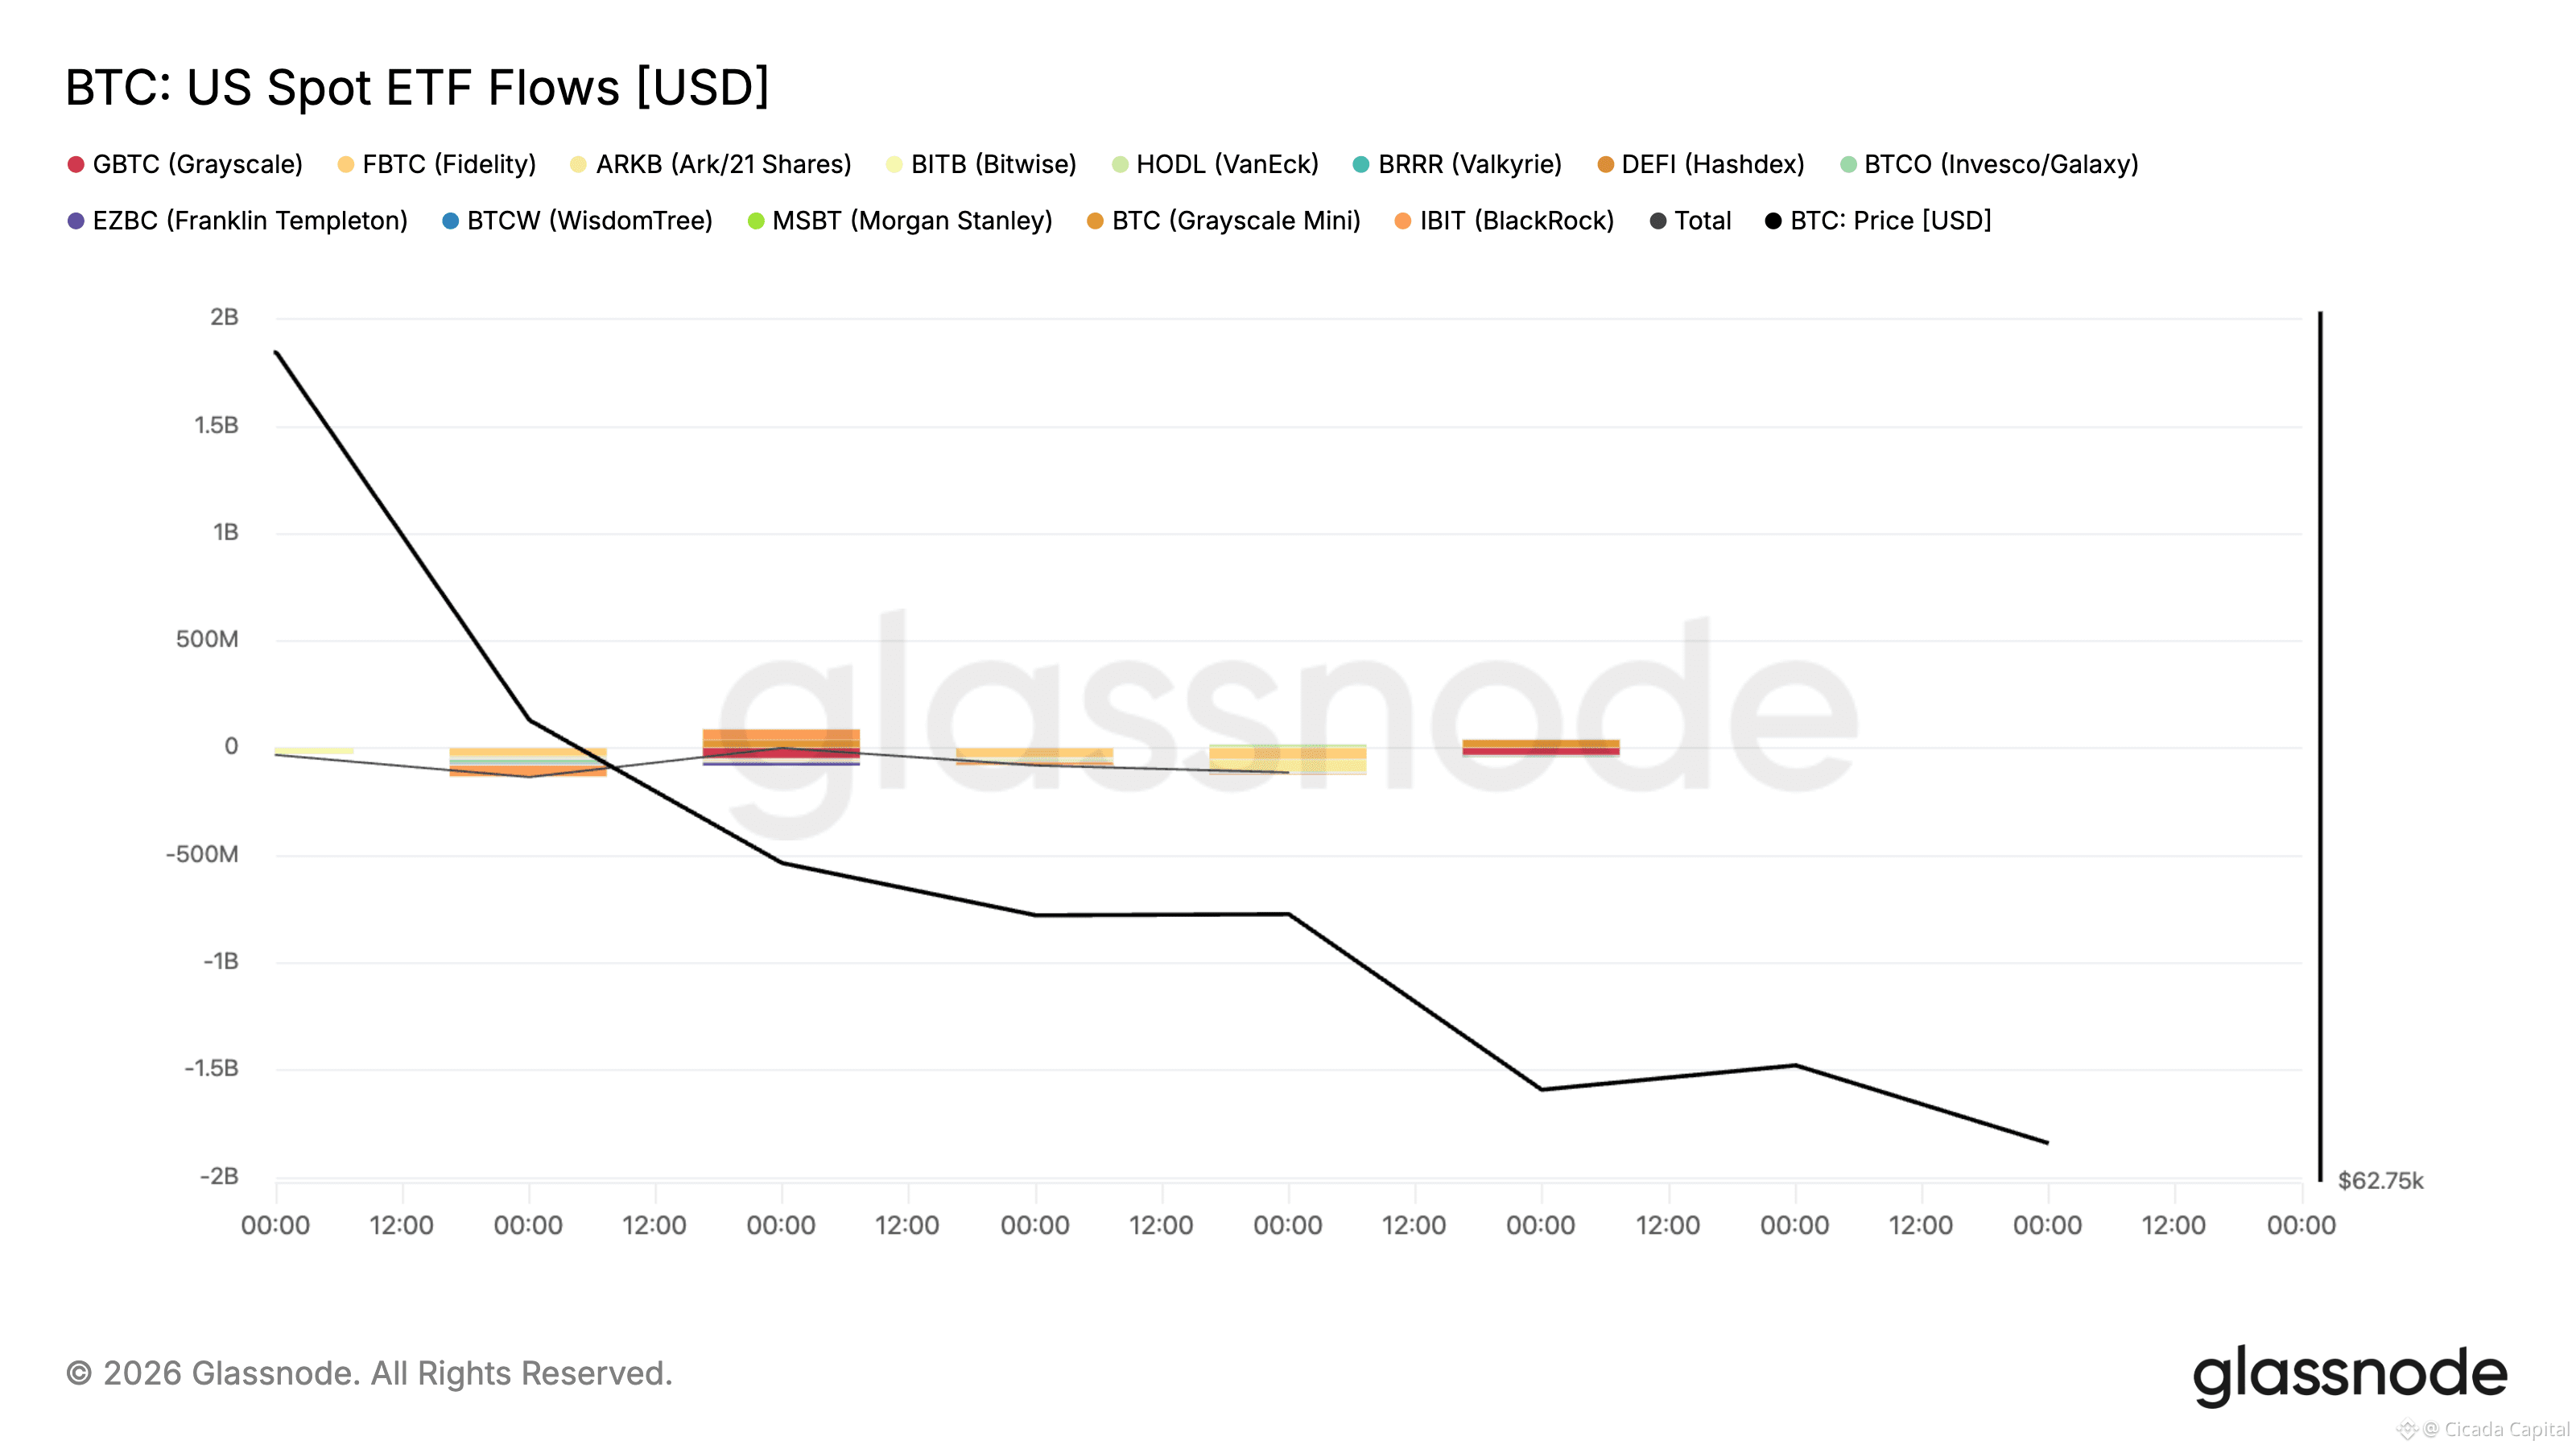
139
📊 Macro Overview
— Weekly Market Brief
The macro week delivered the relief rally stocks were waiting for, but crypto sat it out: July CPI came in at 3.4%, PPI printed flat, and September hike odds collapsed to ~40%, yet Bitcoin sold off to its weakest weekly close since early August, decoupling from an S&P 500 that kept making records.
• S&P 500 +0.4% | DXY ~99.5
The S&P 500 closed at a record 7,798 on August 13 after CPI, with the Dow at 54,085 and the Nasdaq at 26,803, chips led. July CPI printed 3.4% YoY with core at 2.5% and a 1.5% energy drop from the Middle East ceasefire, while July PPI was flat MoM at 4.7% YoY, the lowest since March.
Rate-hike pricing for September fell to ~40%, but hawks pushed back, Cleveland's Hamaker insisted policy is not restrictive enough, and Barkin called a hike an open question.
The cracks are showing under the record equity prints: retail sales fell -0.6% MoM, Consumer Confidence dropped to 51 from 55.2, and jobless claims hit 209K, the highest since mid-July. The DXY slipped to 99.54, global bond yields sit at levels last seen in July 2008, and Goldman now expects the Fed on hold through year-end with core PCE at +0.23% MoM.
On regulation, the Clarity Act is effectively on ice: Galaxy cut passage odds to 10% as the September session is only 2-3 weeks long, and the Senate's final vote may come down to the stablecoin-yield fight between banks and crypto platforms.
The SEC canceled its Friday Regulation Crypto meeting at the last minute but is preparing an innovation exemption for 24/7 on-chain trading of tokenized stocks like Apple, Tesla and Nvidia, and is reviewing Cboe's bid to list 3x BTC/ETH ETFs.
For $BTC , a soft-inflation week that should have been bullish instead became the week ETF flows reversed and U.S. demand went quiet, the clearest decoupling from equities since the recovery began.
📊 Macro Overview
— Weekly Market Brief
The macro week delivered the relief rally stocks were waiting for, but crypto sat it out: July CPI came in at 3.4%, PPI printed flat, and September hike odds collapsed to ~40%, yet Bitcoin sold off to its weakest weekly close since early August, decoupling from an S&P 500 that kept making records.
• S&P 500 +0.4% | DXY ~99.5
The S&P 500 closed at a record 7,798 on August 13 after CPI, with the Dow at 54,085 and the Nasdaq at 26,803, chips led. July CPI printed 3.4% YoY with core at 2.5% and a 1.5% energy drop from the Middle East ceasefire, while July PPI was flat MoM at 4.7% YoY, the lowest since March.
Rate-hike pricing for September fell to ~40%, but hawks pushed back, Cleveland's Hamaker insisted policy is not restrictive enough, and Barkin called a hike an open question.
The cracks are showing under the record equity prints: retail sales fell -0.6% MoM, Consumer Confidence dropped to 51 from 55.2, and jobless claims hit 209K, the highest since mid-July. The DXY slipped to 99.54, global bond yields sit at levels last seen in July 2008, and Goldman now expects the Fed on hold through year-end with core PCE at +0.23% MoM.
On regulation, the Clarity Act is effectively on ice: Galaxy cut passage odds to 10% as the September session is only 2-3 weeks long, and the Senate's final vote may come down to the stablecoin-yield fight between banks and crypto platforms.
The SEC canceled its Friday Regulation Crypto meeting at the last minute but is preparing an innovation exemption for 24/7 on-chain trading of tokenized stocks like Apple, Tesla and Nvidia, and is reviewing Cboe's bid to list 3x BTC/ETH ETFs.
For $BTC , a soft-inflation week that should have been bullish instead became the week ETF flows reversed and U.S. demand went quiet, the clearest decoupling from equities since the recovery began.
— Weekly Market Brief
The macro week delivered the relief rally stocks were waiting for, but crypto sat it out: July CPI came in at 3.4%, PPI printed flat, and September hike odds collapsed to ~40%, yet Bitcoin sold off to its weakest weekly close since early August, decoupling from an S&P 500 that kept making records.
• S&P 500 +0.4% | DXY ~99.5
The S&P 500 closed at a record 7,798 on August 13 after CPI, with the Dow at 54,085 and the Nasdaq at 26,803, chips led. July CPI printed 3.4% YoY with core at 2.5% and a 1.5% energy drop from the Middle East ceasefire, while July PPI was flat MoM at 4.7% YoY, the lowest since March.
Rate-hike pricing for September fell to ~40%, but hawks pushed back, Cleveland's Hamaker insisted policy is not restrictive enough, and Barkin called a hike an open question.
The cracks are showing under the record equity prints: retail sales fell -0.6% MoM, Consumer Confidence dropped to 51 from 55.2, and jobless claims hit 209K, the highest since mid-July. The DXY slipped to 99.54, global bond yields sit at levels last seen in July 2008, and Goldman now expects the Fed on hold through year-end with core PCE at +0.23% MoM.
On regulation, the Clarity Act is effectively on ice: Galaxy cut passage odds to 10% as the September session is only 2-3 weeks long, and the Senate's final vote may come down to the stablecoin-yield fight between banks and crypto platforms.
The SEC canceled its Friday Regulation Crypto meeting at the last minute but is preparing an innovation exemption for 24/7 on-chain trading of tokenized stocks like Apple, Tesla and Nvidia, and is reviewing Cboe's bid to list 3x BTC/ETH ETFs.
For $BTC , a soft-inflation week that should have been bullish instead became the week ETF flows reversed and U.S. demand went quiet, the clearest decoupling from equities since the recovery began.
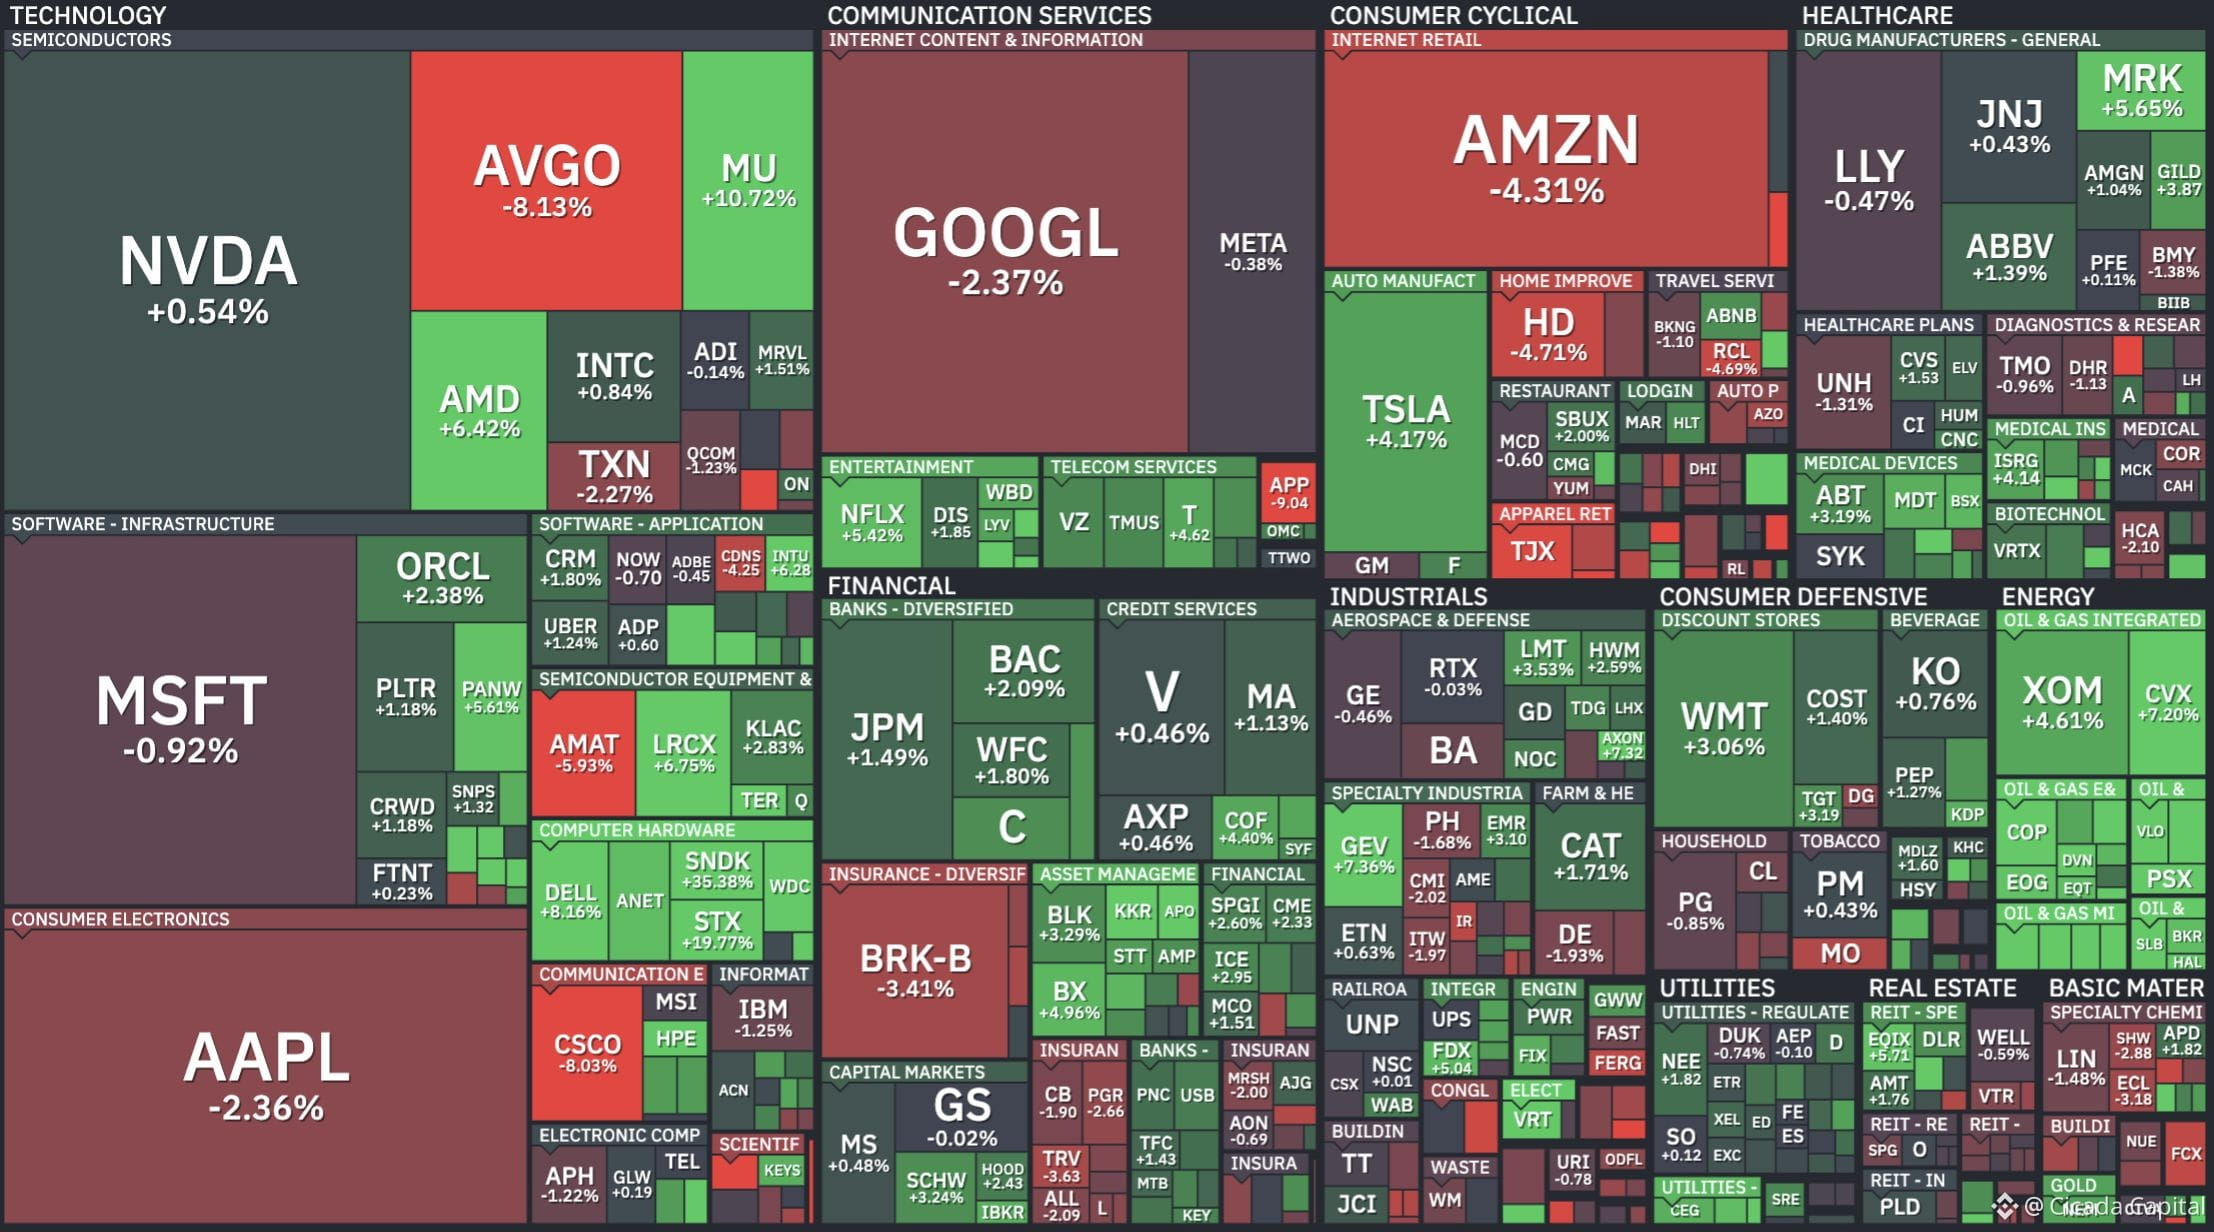
159
📊 On‑Chain & Futures Analysis
— Weekly Market Brief
Leverage dynamics were the calmest in weeks: funding stayed positive all seven days while OI-weighted funding firmed into the weekend, a sign of controlled leverage rebuilding rather than euphoria.
$BTC opened the week at ~$63.5K on Aug 3 and chopped between $63.4K and $64.1K through Wednesday as markets waited on the jobs report.
Thursday's +$244.4M ETF day pushed price through $64K; Friday's record S&P close left BTC at $64,300. The weekend grind carried it to $64.9K, and Monday Aug 10 brought the weekly high of $65.2K intraday before rejection.
The failure at $65.2K triggered a pullback to ~$63.9K by Aug 11 as Clarity Act disappointment combined with pre-CPI caution. Net weekly change: roughly +2.1% before Tuesday's fade.
• Funding rates stayed positive all week. The combined funding rate closed at 0.0030% on Aug 3, dipped to 0.0017% on Aug 4, spiked to 0.0066% on Aug 5, faded to 0.0008% on Aug 6, and recovered through the weekend to 0.0075% on Aug 9.
• Strategy sold Bitcoin for the second consecutive week: on Aug 10 the company offloaded 1,690 BTC at $64,262, cutting holdings to 840,449 BTC. BTC Yield YTD slipped to 1.7% with QTD at -6.4%, and CryptoQuant counts >$102M in realized losses on 2026 sales.
On-chain/ecosystem noise for the week: the BIP-110 faction split onto a smaller side chain at height 961,632 with Luke Dashjr removed as BIP editor, and the Coldcard hack became the security story of the week.
📌 Bottom Line
The macro backdrop turned bullish as weak NFP data cut September hike odds to 44%, driving record equities and $865M in BTC ETF inflows. A missed August 7 Clarity Act deadline caused a short-term pullback, but procedural progress keeps the bill alive for September alongside SEC rulemaking fallbacks.
Corporate selling remains the main headwind, but healthy leverage and strong ETF demand support key levels: resistance at $65.2K and support at $62.8–63.5K ahead of today's CPI.
📊 On‑Chain & Futures Analysis
— Weekly Market Brief
Leverage dynamics were the calmest in weeks: funding stayed positive all seven days while OI-weighted funding firmed into the weekend, a sign of controlled leverage rebuilding rather than euphoria.
$BTC opened the week at ~$63.5K on Aug 3 and chopped between $63.4K and $64.1K through Wednesday as markets waited on the jobs report.
Thursday's +$244.4M ETF day pushed price through $64K; Friday's record S&P close left BTC at $64,300. The weekend grind carried it to $64.9K, and Monday Aug 10 brought the weekly high of $65.2K intraday before rejection.
The failure at $65.2K triggered a pullback to ~$63.9K by Aug 11 as Clarity Act disappointment combined with pre-CPI caution. Net weekly change: roughly +2.1% before Tuesday's fade.
• Funding rates stayed positive all week. The combined funding rate closed at 0.0030% on Aug 3, dipped to 0.0017% on Aug 4, spiked to 0.0066% on Aug 5, faded to 0.0008% on Aug 6, and recovered through the weekend to 0.0075% on Aug 9.
• Strategy sold Bitcoin for the second consecutive week: on Aug 10 the company offloaded 1,690 BTC at $64,262, cutting holdings to 840,449 BTC. BTC Yield YTD slipped to 1.7% with QTD at -6.4%, and CryptoQuant counts >$102M in realized losses on 2026 sales.
On-chain/ecosystem noise for the week: the BIP-110 faction split onto a smaller side chain at height 961,632 with Luke Dashjr removed as BIP editor, and the Coldcard hack became the security story of the week.
📌 Bottom Line
The macro backdrop turned bullish as weak NFP data cut September hike odds to 44%, driving record equities and $865M in BTC ETF inflows. A missed August 7 Clarity Act deadline caused a short-term pullback, but procedural progress keeps the bill alive for September alongside SEC rulemaking fallbacks.
Corporate selling remains the main headwind, but healthy leverage and strong ETF demand support key levels: resistance at $65.2K and support at $62.8–63.5K ahead of today's CPI.
— Weekly Market Brief
Leverage dynamics were the calmest in weeks: funding stayed positive all seven days while OI-weighted funding firmed into the weekend, a sign of controlled leverage rebuilding rather than euphoria.
$BTC opened the week at ~$63.5K on Aug 3 and chopped between $63.4K and $64.1K through Wednesday as markets waited on the jobs report.
Thursday's +$244.4M ETF day pushed price through $64K; Friday's record S&P close left BTC at $64,300. The weekend grind carried it to $64.9K, and Monday Aug 10 brought the weekly high of $65.2K intraday before rejection.
The failure at $65.2K triggered a pullback to ~$63.9K by Aug 11 as Clarity Act disappointment combined with pre-CPI caution. Net weekly change: roughly +2.1% before Tuesday's fade.
• Funding rates stayed positive all week. The combined funding rate closed at 0.0030% on Aug 3, dipped to 0.0017% on Aug 4, spiked to 0.0066% on Aug 5, faded to 0.0008% on Aug 6, and recovered through the weekend to 0.0075% on Aug 9.
• Strategy sold Bitcoin for the second consecutive week: on Aug 10 the company offloaded 1,690 BTC at $64,262, cutting holdings to 840,449 BTC. BTC Yield YTD slipped to 1.7% with QTD at -6.4%, and CryptoQuant counts >$102M in realized losses on 2026 sales.
On-chain/ecosystem noise for the week: the BIP-110 faction split onto a smaller side chain at height 961,632 with Luke Dashjr removed as BIP editor, and the Coldcard hack became the security story of the week.
📌 Bottom Line
The macro backdrop turned bullish as weak NFP data cut September hike odds to 44%, driving record equities and $865M in BTC ETF inflows. A missed August 7 Clarity Act deadline caused a short-term pullback, but procedural progress keeps the bill alive for September alongside SEC rulemaking fallbacks.
Corporate selling remains the main headwind, but healthy leverage and strong ETF demand support key levels: resistance at $65.2K and support at $62.8–63.5K ahead of today's CPI.
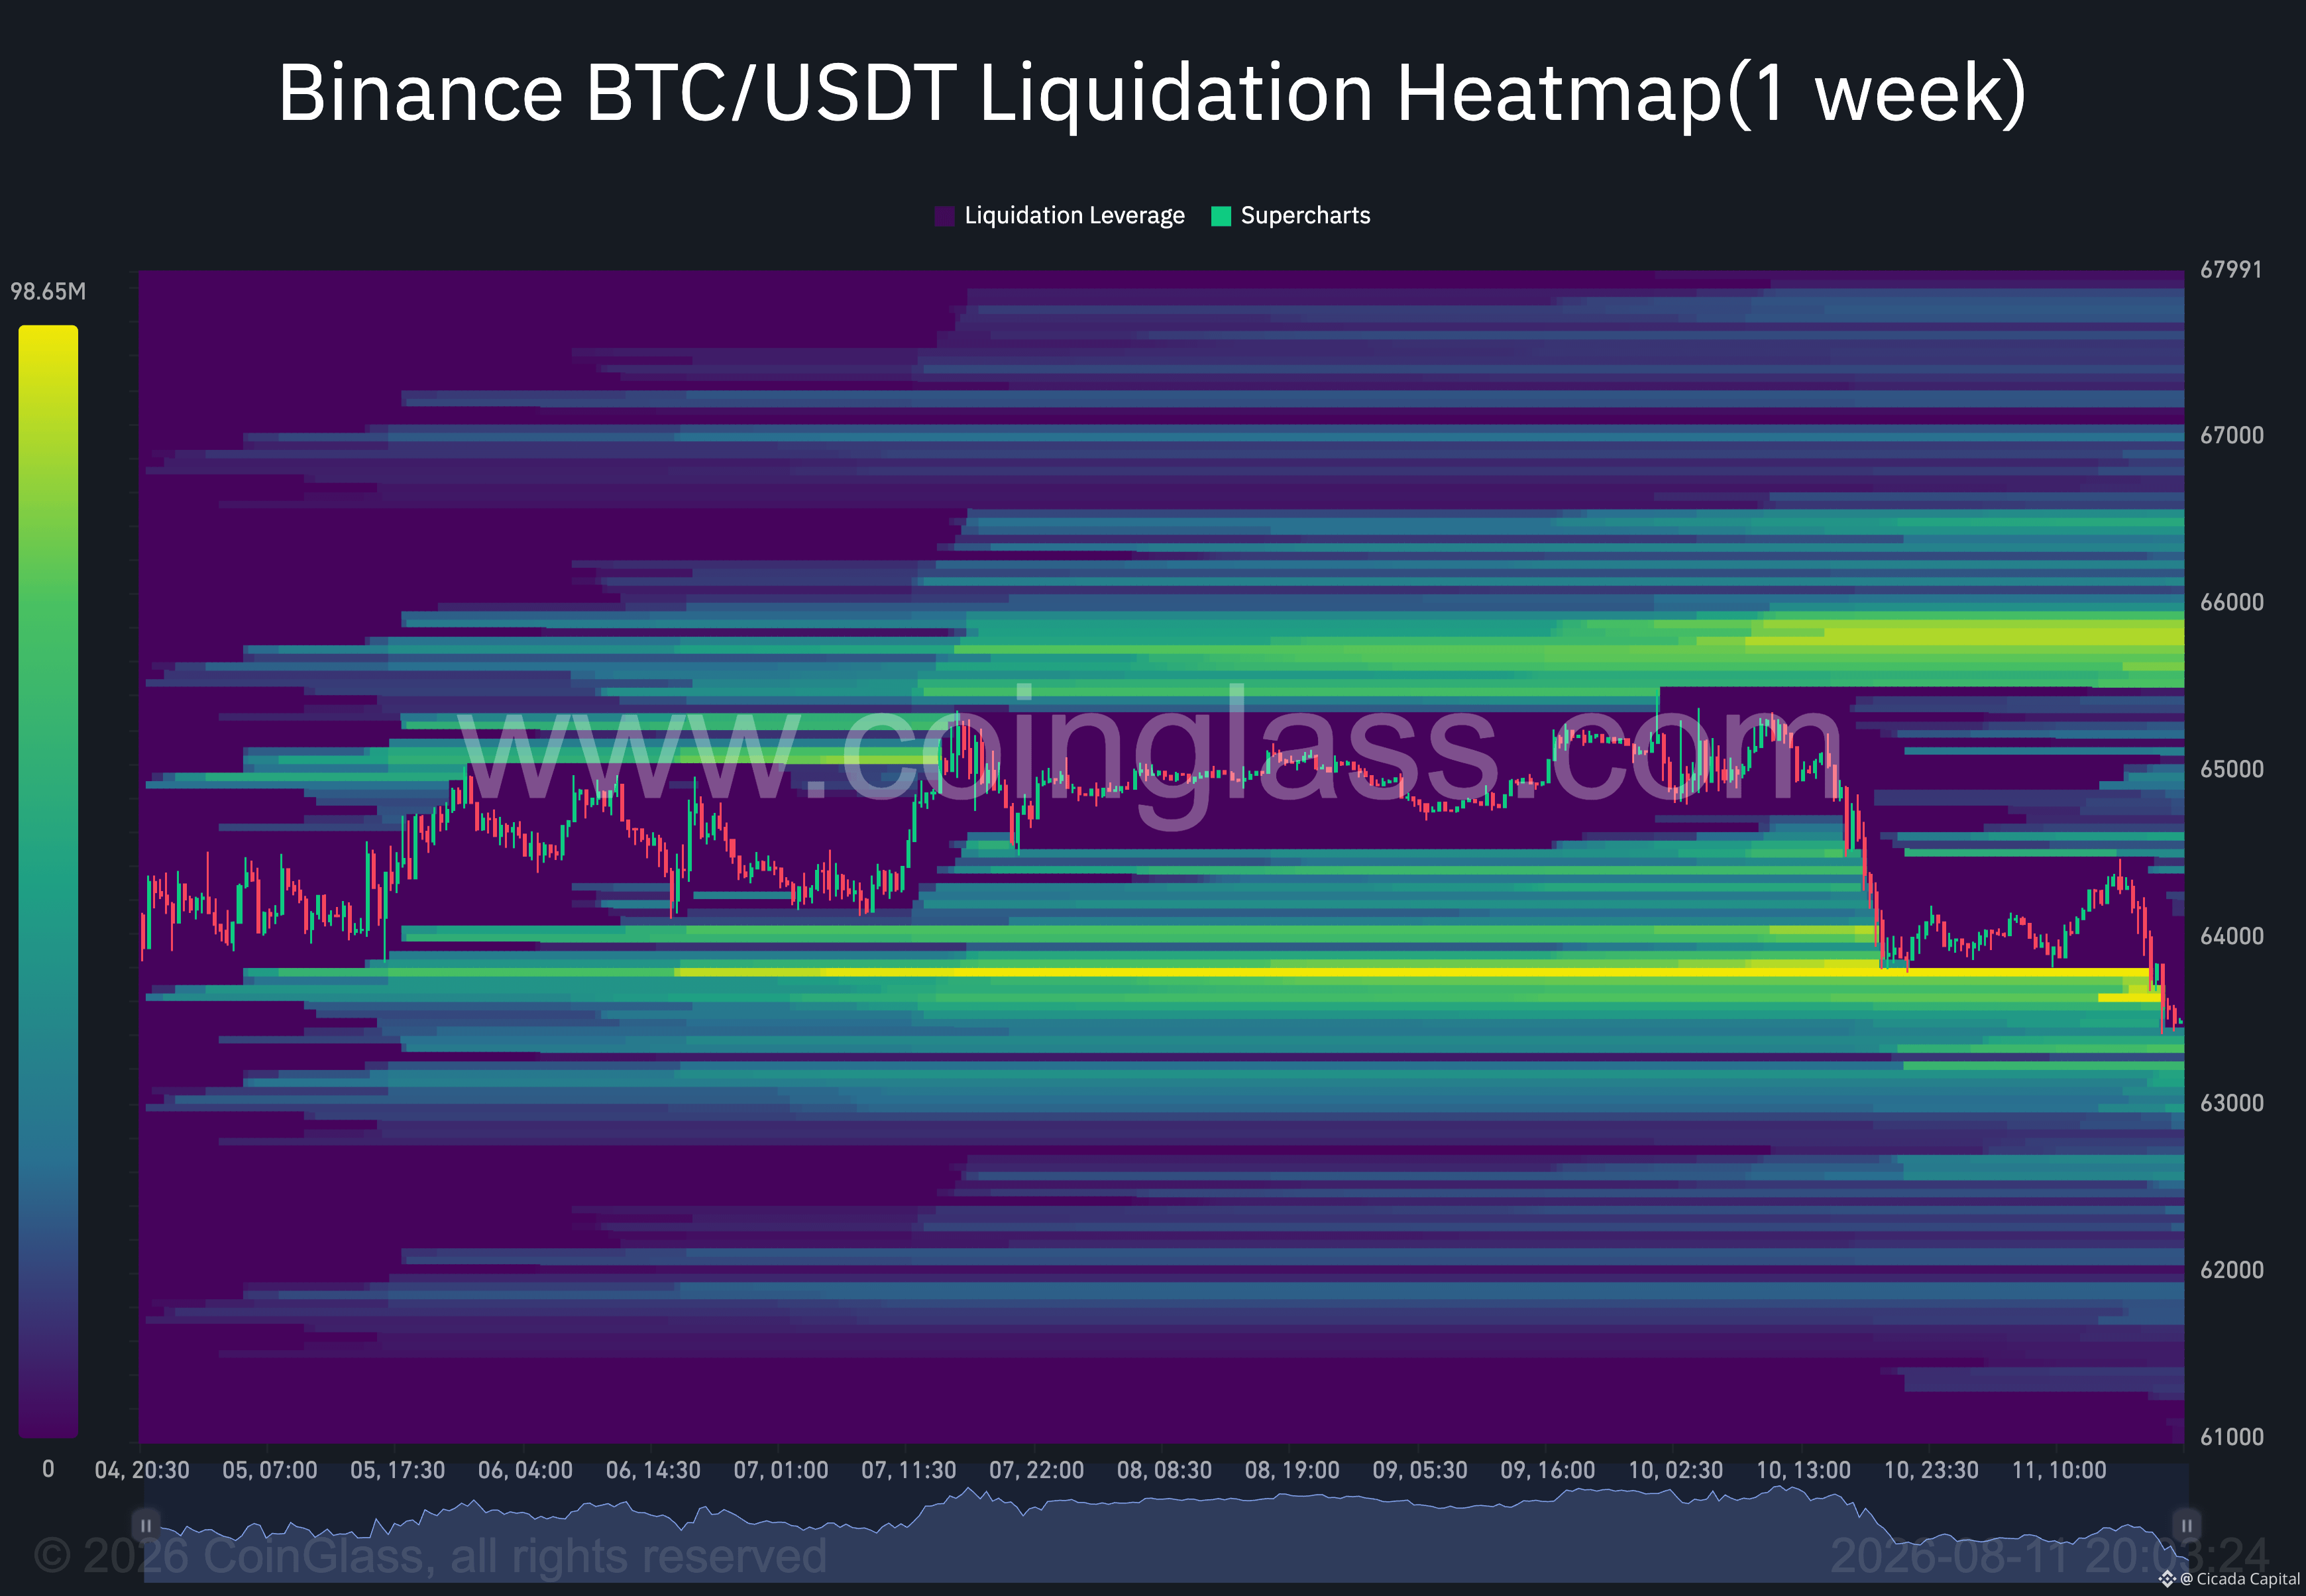
173
📊 Crypto Capital Flows
— Weekly Market Brief
Institutional flows staged their strongest week since early June: BTC ETFs posted four consecutive days of triple-digit inflows before Monday's reversal, while ETH ETFs snapped back to heavy accumulation.
• $BTC ETF flows: The week opened with +$170.1M on Aug 3, accelerated to +$211.5M on Aug 4, +$244.4M on Aug 5 and +$137.6M on Aug 6, before cooling to +$101.7M on Aug 7.
The Mon-Fri tally: roughly +$865.3M net, the best week since the June recovery began, driven by a weakening dollar and pre-CPI positioning. The reversal came Monday Aug 10: -$144.6M as the Clarity Act disappointment and CPI de-risking took hold.
• $ETH ETF flows: Ethereum returned to heavy inflows: -$11.9M on Aug 3, then +$53.1M, +$60.8M, +$92.1M and +$49.6M. Monday Aug 10 dipped to -$14.6M. The rotation narrative is firmly back.
Exchange Netflow: Available daily prints show BTC mildly net-negative mid-week before reversing to inflows over the weekend.
Net for the observed window: roughly -0.6K BTC, a mild continuation of the accumulation pattern. ETH painted a two-sided picture: +8.04K in on Aug 6, -9.64K out on Aug 7, a large +30.33K print on Aug 8, -8.03K on Aug 9, then small inflows on Aug 10-11.
Corporate activity stayed two-sided: BitMine added another 7,391 ETH, pushing its stack past 5.8M ETH, and Trump Media disclosed a ~$293M BTC position.
On the sell side, miners remain forced sellers: Riot is selling BTC to fund its $9.1B Anthropic deal, and Twenty One Capital booked a $413.5M Q2 loss on its treasury.
The divergence is notable: ETF demand and treasury accumulation are absorbing miner supply.
📊 Crypto Capital Flows
— Weekly Market Brief
Institutional flows staged their strongest week since early June: BTC ETFs posted four consecutive days of triple-digit inflows before Monday's reversal, while ETH ETFs snapped back to heavy accumulation.
• $BTC ETF flows: The week opened with +$170.1M on Aug 3, accelerated to +$211.5M on Aug 4, +$244.4M on Aug 5 and +$137.6M on Aug 6, before cooling to +$101.7M on Aug 7.
The Mon-Fri tally: roughly +$865.3M net, the best week since the June recovery began, driven by a weakening dollar and pre-CPI positioning. The reversal came Monday Aug 10: -$144.6M as the Clarity Act disappointment and CPI de-risking took hold.
• $ETH ETF flows: Ethereum returned to heavy inflows: -$11.9M on Aug 3, then +$53.1M, +$60.8M, +$92.1M and +$49.6M. Monday Aug 10 dipped to -$14.6M. The rotation narrative is firmly back.
Exchange Netflow: Available daily prints show BTC mildly net-negative mid-week before reversing to inflows over the weekend.
Net for the observed window: roughly -0.6K BTC, a mild continuation of the accumulation pattern. ETH painted a two-sided picture: +8.04K in on Aug 6, -9.64K out on Aug 7, a large +30.33K print on Aug 8, -8.03K on Aug 9, then small inflows on Aug 10-11.
Corporate activity stayed two-sided: BitMine added another 7,391 ETH, pushing its stack past 5.8M ETH, and Trump Media disclosed a ~$293M BTC position.
On the sell side, miners remain forced sellers: Riot is selling BTC to fund its $9.1B Anthropic deal, and Twenty One Capital booked a $413.5M Q2 loss on its treasury.
The divergence is notable: ETF demand and treasury accumulation are absorbing miner supply.
— Weekly Market Brief
Institutional flows staged their strongest week since early June: BTC ETFs posted four consecutive days of triple-digit inflows before Monday's reversal, while ETH ETFs snapped back to heavy accumulation.
• $BTC ETF flows: The week opened with +$170.1M on Aug 3, accelerated to +$211.5M on Aug 4, +$244.4M on Aug 5 and +$137.6M on Aug 6, before cooling to +$101.7M on Aug 7.
The Mon-Fri tally: roughly +$865.3M net, the best week since the June recovery began, driven by a weakening dollar and pre-CPI positioning. The reversal came Monday Aug 10: -$144.6M as the Clarity Act disappointment and CPI de-risking took hold.
• $ETH ETF flows: Ethereum returned to heavy inflows: -$11.9M on Aug 3, then +$53.1M, +$60.8M, +$92.1M and +$49.6M. Monday Aug 10 dipped to -$14.6M. The rotation narrative is firmly back.
Exchange Netflow: Available daily prints show BTC mildly net-negative mid-week before reversing to inflows over the weekend.
Net for the observed window: roughly -0.6K BTC, a mild continuation of the accumulation pattern. ETH painted a two-sided picture: +8.04K in on Aug 6, -9.64K out on Aug 7, a large +30.33K print on Aug 8, -8.03K on Aug 9, then small inflows on Aug 10-11.
Corporate activity stayed two-sided: BitMine added another 7,391 ETH, pushing its stack past 5.8M ETH, and Trump Media disclosed a ~$293M BTC position.
On the sell side, miners remain forced sellers: Riot is selling BTC to fund its $9.1B Anthropic deal, and Twenty One Capital booked a $413.5M Q2 loss on its treasury.
The divergence is notable: ETF demand and treasury accumulation are absorbing miner supply.
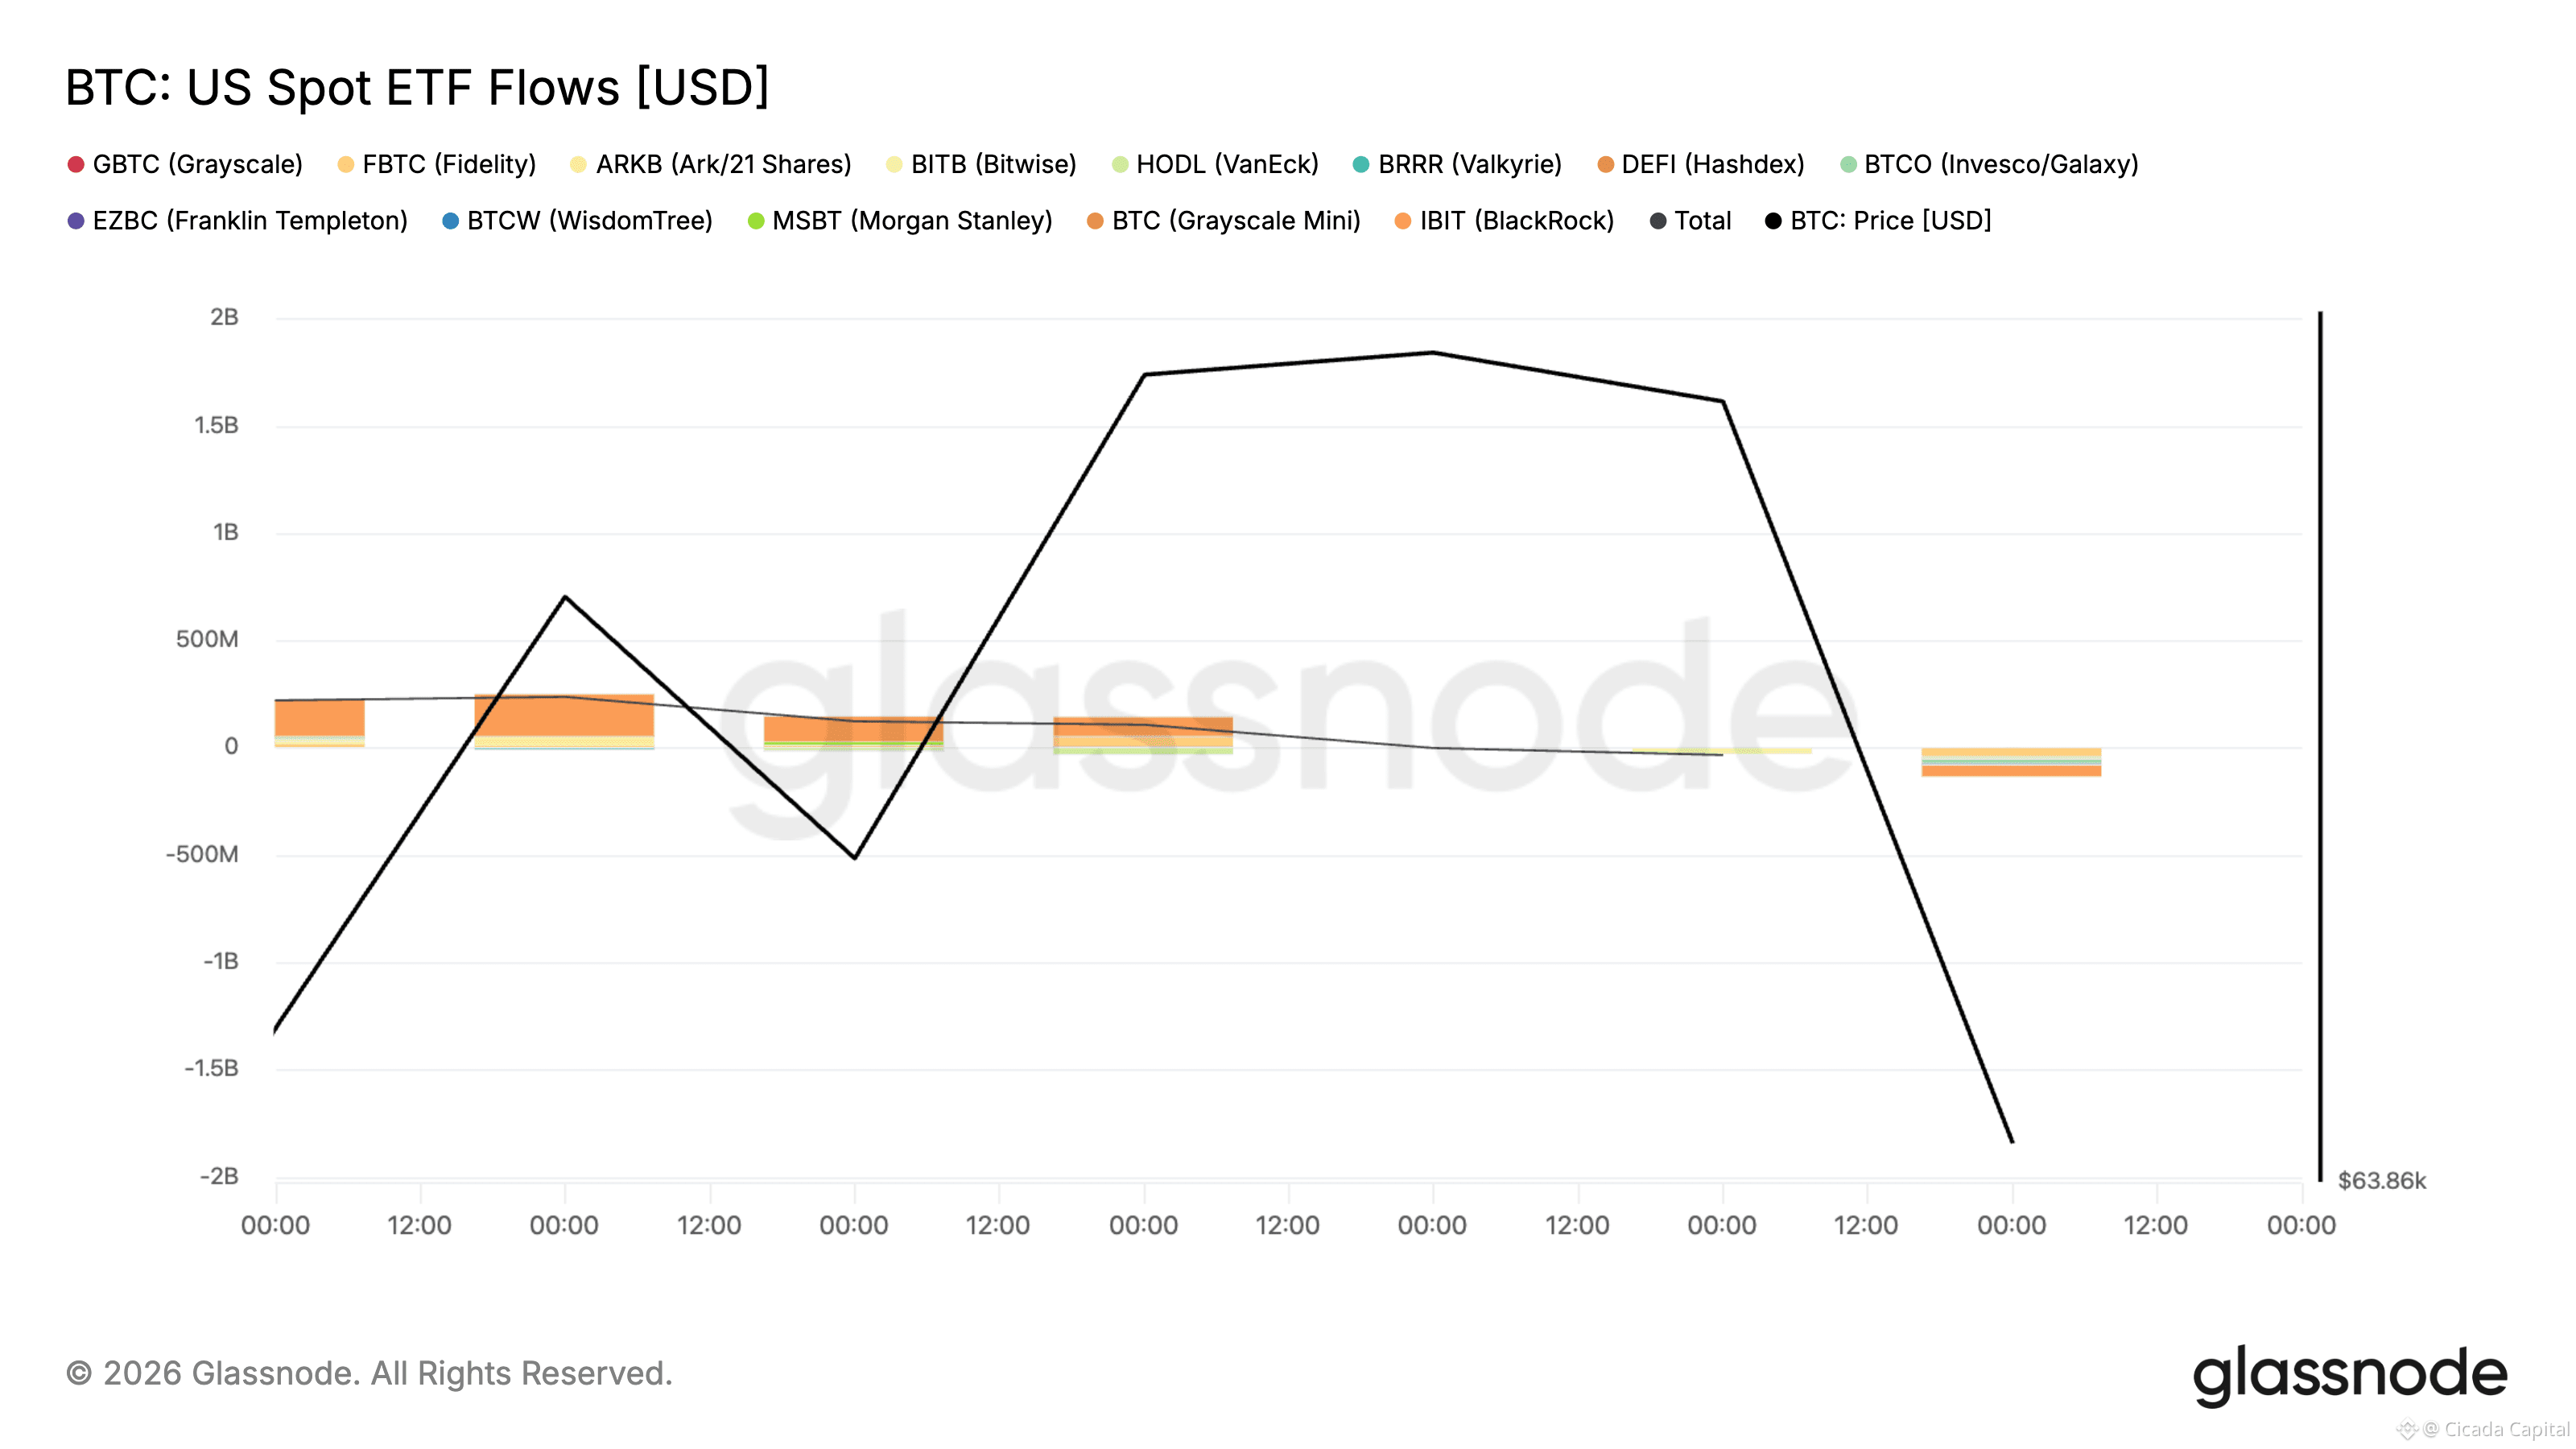
171
📊 Macro Overview
— Weekly Market Brief
The macro landscape flipped risk-on this week: a shockingly weak July jobs report crushed September hike odds and sent stocks to records, while Bitcoin ground higher on the strongest ETF week since the recovery began, capping Monday's breakout attempt.
• S&P 500 +3.6% | DXY ~99.8
The S&P 500 closed at a record 7,757.64 on August 7, the Dow rose 3% to 54,036.93 and the Nasdaq jumped 5.2% to 26,690.62 as the AI trade roared back.
The trigger: Friday's July NFP showed -23,000 jobs with 103K of prior revisions shaved off, pushing the unemployment rate to 4.1% as participation slid to 61.4%. CME odds of a September hike collapsed from 55% to 44%, and the 10-year yield fell to 4.64%.
The dollar weakened to ~99.8 on the DXY, gold consolidated at $4,176-4,202/oz after its Fed-day spike, and the 30-year yield hovered near 5.2%. ISM Manufacturing held at 53.9 and ISM Services ticked up to 54.1.
On the legislative front, the Senate did not reach final passage before recess, but Majority Leader Thune filed cloture and opened the first procedural vote on August 8, keeping the bill alive for a September vote.
Tim Scott insisted a vote would come, while Bernstein warned that outright failure could send crypto valuations lower. As a parallel track, the SEC is preparing its own token-issuance rulemaking. The Bank of Russia separately proposed BTC, ETH and USDT for regulated exchange trading.
For $BTC , the regulatory picture turned from catalyst to limbo: the bill survived procedural votes but the missed deadline translated into disappointment.
The next macro catalyst: July CPI due August 12.
📊 Macro Overview
— Weekly Market Brief
The macro landscape flipped risk-on this week: a shockingly weak July jobs report crushed September hike odds and sent stocks to records, while Bitcoin ground higher on the strongest ETF week since the recovery began, capping Monday's breakout attempt.
• S&P 500 +3.6% | DXY ~99.8
The S&P 500 closed at a record 7,757.64 on August 7, the Dow rose 3% to 54,036.93 and the Nasdaq jumped 5.2% to 26,690.62 as the AI trade roared back.
The trigger: Friday's July NFP showed -23,000 jobs with 103K of prior revisions shaved off, pushing the unemployment rate to 4.1% as participation slid to 61.4%. CME odds of a September hike collapsed from 55% to 44%, and the 10-year yield fell to 4.64%.
The dollar weakened to ~99.8 on the DXY, gold consolidated at $4,176-4,202/oz after its Fed-day spike, and the 30-year yield hovered near 5.2%. ISM Manufacturing held at 53.9 and ISM Services ticked up to 54.1.
On the legislative front, the Senate did not reach final passage before recess, but Majority Leader Thune filed cloture and opened the first procedural vote on August 8, keeping the bill alive for a September vote.
Tim Scott insisted a vote would come, while Bernstein warned that outright failure could send crypto valuations lower. As a parallel track, the SEC is preparing its own token-issuance rulemaking. The Bank of Russia separately proposed BTC, ETH and USDT for regulated exchange trading.
For $BTC , the regulatory picture turned from catalyst to limbo: the bill survived procedural votes but the missed deadline translated into disappointment.
The next macro catalyst: July CPI due August 12.
— Weekly Market Brief
The macro landscape flipped risk-on this week: a shockingly weak July jobs report crushed September hike odds and sent stocks to records, while Bitcoin ground higher on the strongest ETF week since the recovery began, capping Monday's breakout attempt.
• S&P 500 +3.6% | DXY ~99.8
The S&P 500 closed at a record 7,757.64 on August 7, the Dow rose 3% to 54,036.93 and the Nasdaq jumped 5.2% to 26,690.62 as the AI trade roared back.
The trigger: Friday's July NFP showed -23,000 jobs with 103K of prior revisions shaved off, pushing the unemployment rate to 4.1% as participation slid to 61.4%. CME odds of a September hike collapsed from 55% to 44%, and the 10-year yield fell to 4.64%.
The dollar weakened to ~99.8 on the DXY, gold consolidated at $4,176-4,202/oz after its Fed-day spike, and the 30-year yield hovered near 5.2%. ISM Manufacturing held at 53.9 and ISM Services ticked up to 54.1.
On the legislative front, the Senate did not reach final passage before recess, but Majority Leader Thune filed cloture and opened the first procedural vote on August 8, keeping the bill alive for a September vote.
Tim Scott insisted a vote would come, while Bernstein warned that outright failure could send crypto valuations lower. As a parallel track, the SEC is preparing its own token-issuance rulemaking. The Bank of Russia separately proposed BTC, ETH and USDT for regulated exchange trading.
For $BTC , the regulatory picture turned from catalyst to limbo: the bill survived procedural votes but the missed deadline translated into disappointment.
The next macro catalyst: July CPI due August 12.
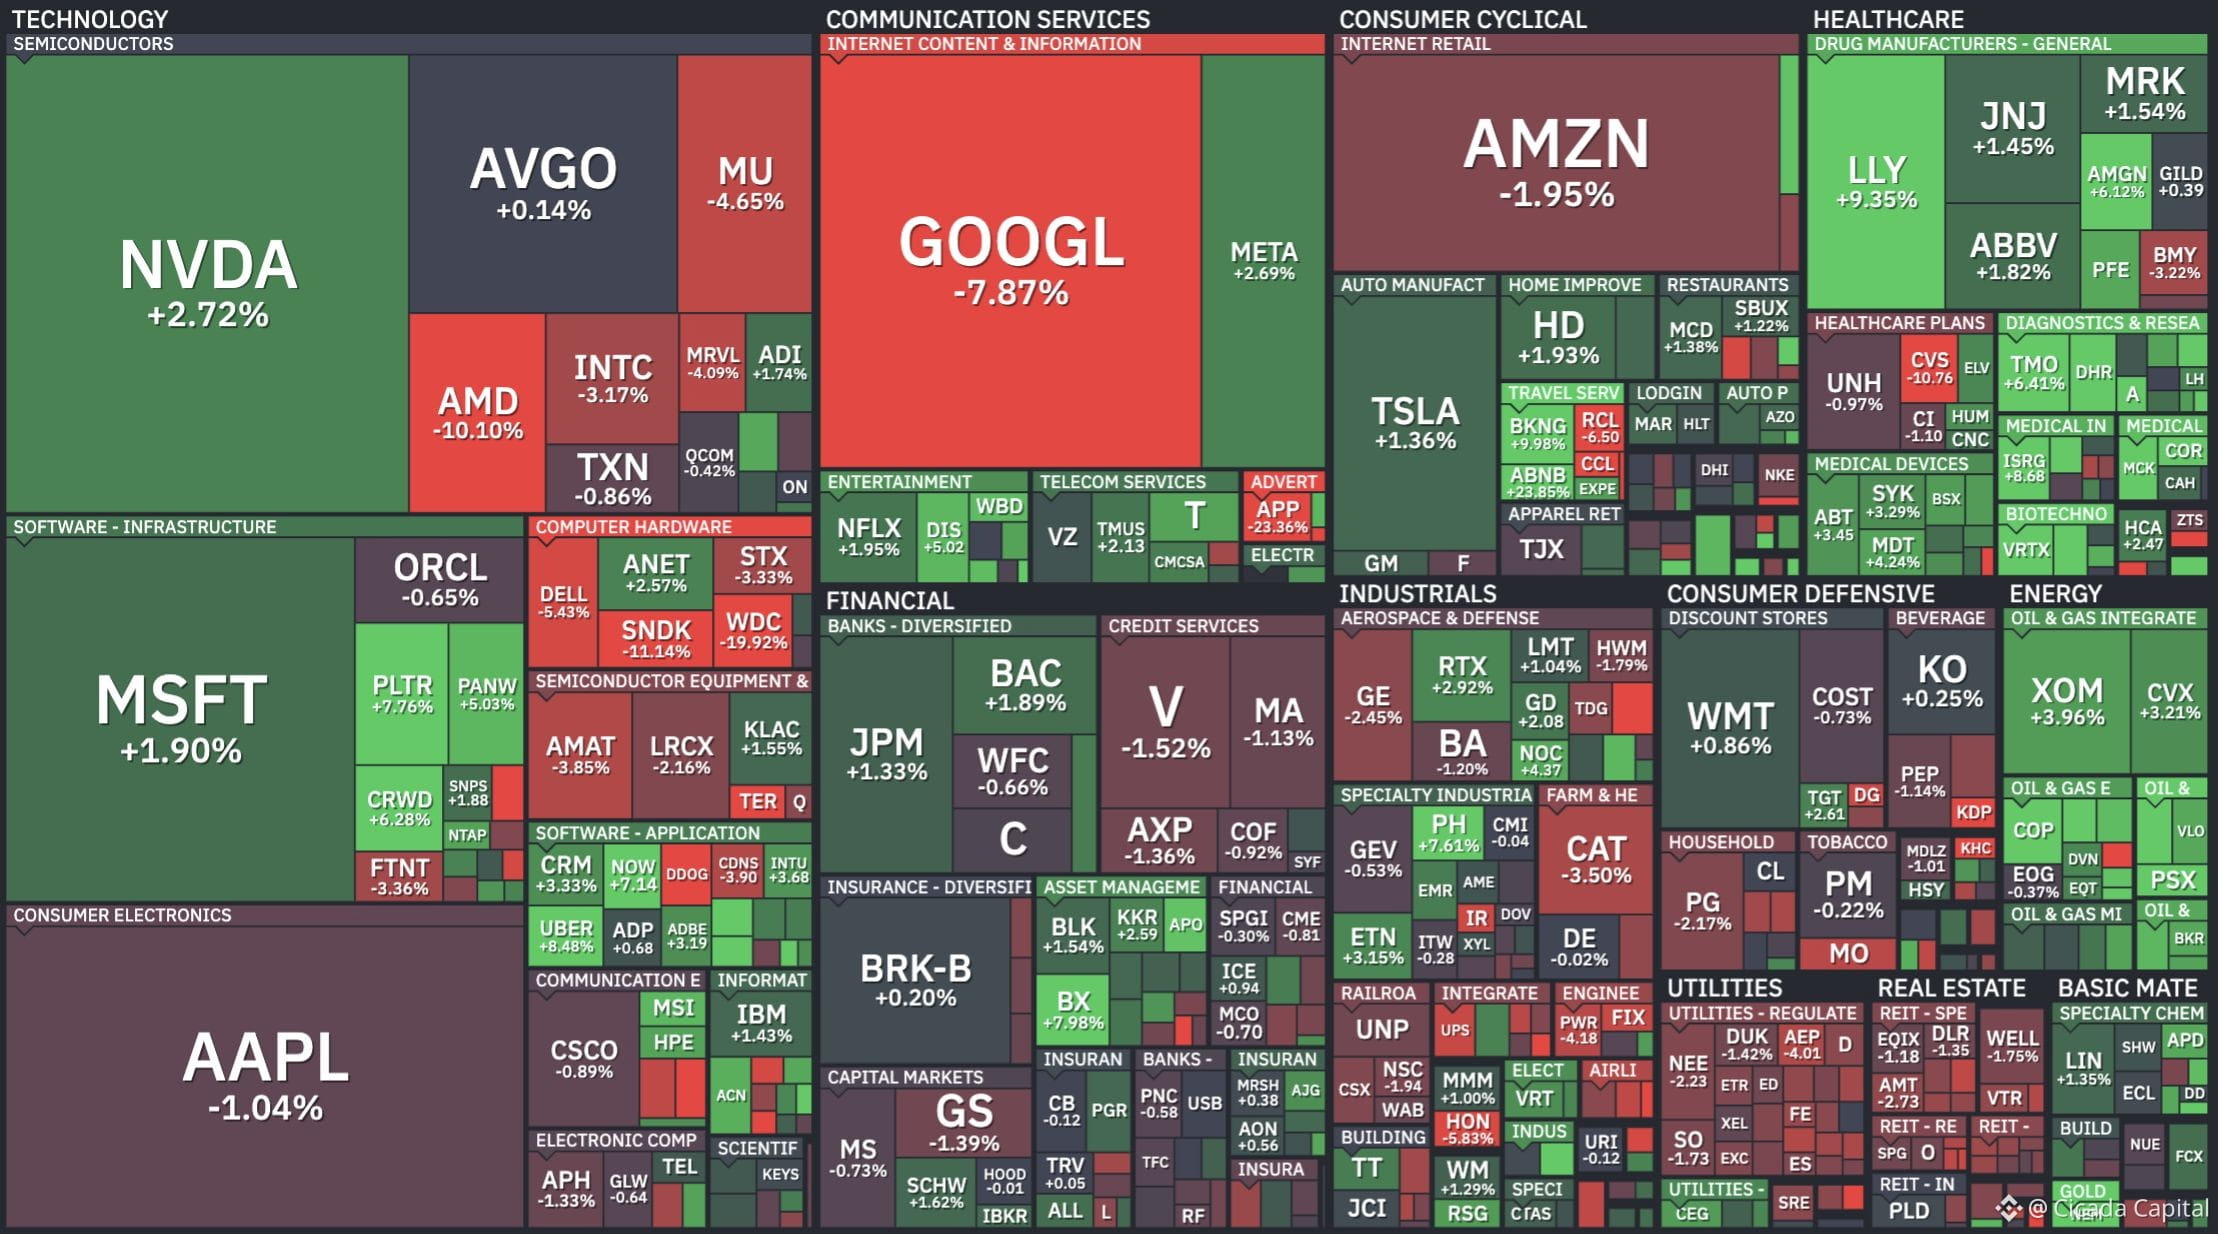
239
Connectez-vous pour découvrir plus de contenu
Rejoignez la communauté mondiale des adeptes de cryptomonnaies sur Binance Square
⚡️ Suviez les dernières informations importantes sur les cryptomonnaies.
💬 Jugé digne de confiance par la plus grande plateforme d’échange de cryptomonnaies au monde.
👍 Découvrez les connaissances que partagent les créateurs vérifiés.
Adresse e-mail/Nº de téléphone
Sujets d’actualité
NvidiaApproves$150BBuyback
722 vues
21 mentions
#NvidiaApproves$150BBuyback
Nvidia’s $150 Billion Buyback Shockwave: Is AI Cash Flow Driving the Next Market Rally? 🚀
The AI supercycle just sent shockwaves across tradfi and crypto markets! NVIDIA's Board of Directors authorized a massive $150 Billion increase to its share repurchase program, expanding the company's total remaining buyback authorization to $235 Billion.
This marks the largest share buyback authorization in U.S. corporate history, surpassing Apple’s $110 billion benchmark.
📰 Key Headlines & Market Breakdown
Record-Breaking Capital Return: NVIDIA founder and CEO Jensen Huang cited "once-in-a-generation platform shift to AI" and strong corporate cash flow as the main drivers behind returning capital to shareholders.
Defying Market Downturns: Despite broader equity pressure and rising U.S. Treasury yields, $NVDA shares surged over 3% on the announcement, showing institutional confidence in tech assets.
Spillover into Decentralized AI: Historically, major bullish headlines for NVIDIA trigger positive sentiment for decentralized AI infrastructure protocols (such as NEAR, RENDER, and FET), as web3 AI projects track broader AI sector valuations.
❓ Discussion Point
Nvidia announces a massive $150B buyback! Will tech stock gains bleed over into Bitcoin and AI tokens?
$RENDER
📊 Related Crypto Trade Signal: RENDER/USDT
Trade Bias: Bullish
Entry Zone: $5.20 – $5.45
Target 1 (TP1): $6.10
Target 2 (TP2): $6.85
Stop Loss (SL): $4.85
Leverage (Futures): 3x – 5x (Isolated)
Technical Rationale: RENDER tends to react strongly to Nvidia hardware and AI capital developments. Price is consolidating near key moving average support with rising spot volume following the $NVDAB
news.
#HackersDrainOver12.4MXRPFromDCENTWallets #CryptoNews #AITokens #TradingSignals
Lily星星
·0 mentions J’aime
·30 vues
OpenAIDelaysGPT6.1OverSafetyIssues
2,992 vues
148 mentions
AMDToAcquireWorldLabsFor$8.2B
531 vues
23 mentions