

China_BNB
7.8k Publications

China_BNB
 Compte Square Vérifié+
Signaler
Bloquer l’utilisateur
Content Creator [@ChinaBNB1 - X] Community Builder✨My Choice✨Trading Expert✨
Ouvert au trading
Trade fréquemment
2 an(s)
559 Suivis
39.3K+ Abonnés
23.3K+ J’aime
Publications
Portefeuille
Tous
Citations
Vidéos
Direct
·
--
Article
BITCOIN’S NEXT MOVE MAY DEPEND ON ONE KEY ZONEBitcoin is starting the week under pressure, but the bigger story is not the pullback — it is what happens around $82K–$84K.
BTC recently pushed above $87,000, reaching an eight-month high, before falling back toward the $83K–$84K area. On September 28, Bitcoin was trading around $83K, with short-term selling pressure returning.
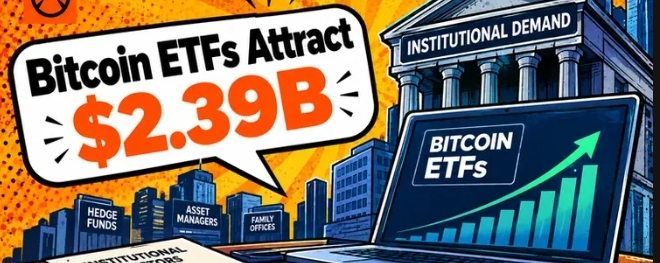
The interesting part is that institutional demand has not disappeared. U.S. spot Bitcoin ETFs recorded around $2.39 billion in net inflows during September 21–25, marking a very strong week for ETF demand.
📊 What the chart is saying
For short-term traders, $82K–$83K is an important area to watch.
If BTC holds this zone, buyers may try to push price back toward $85K, followed by the recent $87K–$87.4K resistance area.
If $82K breaks with strong selling volume, attention could shift toward the $80K area and lower support zones.
The market is also dealing with macro pressure and changing leverage, so a breakout without confirmation can quickly turn into another rejection.
Right now, Bitcoin looks less like a simple bullish-or-bearish story and more like a battle between strong ETF demand and short-term selling pressure.
The real question is: will BTC defend $82K and attempt another attack on $87K, or is this pullback only the beginning of a deeper correction?
#BitcoinSpotETFs$2.39BWeeklyNetInflow $BTC
{spot}(BTCUSDT)
BITCOIN’S NEXT MOVE MAY DEPEND ON ONE KEY ZONE
Bitcoin is starting the week under pressure, but the bigger story is not the pullback — it is what happens around $82K–$84K.
BTC recently pushed above $87,000, reaching an eight-month high, before falling back toward the $83K–$84K area. On September 28, Bitcoin was trading around $83K, with short-term selling pressure returning.
The interesting part is that institutional demand has not disappeared. U.S. spot Bitcoin ETFs recorded around $2.39 billion in net inflows during September 21–25, marking a very strong week for ETF demand.
📊 What the chart is saying
For short-term traders, $82K–$83K is an important area to watch.
If BTC holds this zone, buyers may try to push price back toward $85K, followed by the recent $87K–$87.4K resistance area.
If $82K breaks with strong selling volume, attention could shift toward the $80K area and lower support zones.
The market is also dealing with macro pressure and changing leverage, so a breakout without confirmation can quickly turn into another rejection.
Right now, Bitcoin looks less like a simple bullish-or-bearish story and more like a battle between strong ETF demand and short-term selling pressure.
The real question is: will BTC defend $82K and attempt another attack on $87K, or is this pullback only the beginning of a deeper correction?
#BitcoinSpotETFs$2.39BWeeklyNetInflow $BTC
BTC recently pushed above $87,000, reaching an eight-month high, before falling back toward the $83K–$84K area. On September 28, Bitcoin was trading around $83K, with short-term selling pressure returning.
The interesting part is that institutional demand has not disappeared. U.S. spot Bitcoin ETFs recorded around $2.39 billion in net inflows during September 21–25, marking a very strong week for ETF demand.
📊 What the chart is saying
For short-term traders, $82K–$83K is an important area to watch.
If BTC holds this zone, buyers may try to push price back toward $85K, followed by the recent $87K–$87.4K resistance area.
If $82K breaks with strong selling volume, attention could shift toward the $80K area and lower support zones.
The market is also dealing with macro pressure and changing leverage, so a breakout without confirmation can quickly turn into another rejection.
Right now, Bitcoin looks less like a simple bullish-or-bearish story and more like a battle between strong ETF demand and short-term selling pressure.
The real question is: will BTC defend $82K and attempt another attack on $87K, or is this pullback only the beginning of a deeper correction?
#BitcoinSpotETFs$2.39BWeeklyNetInflow $BTC
154
·
--
Haussier
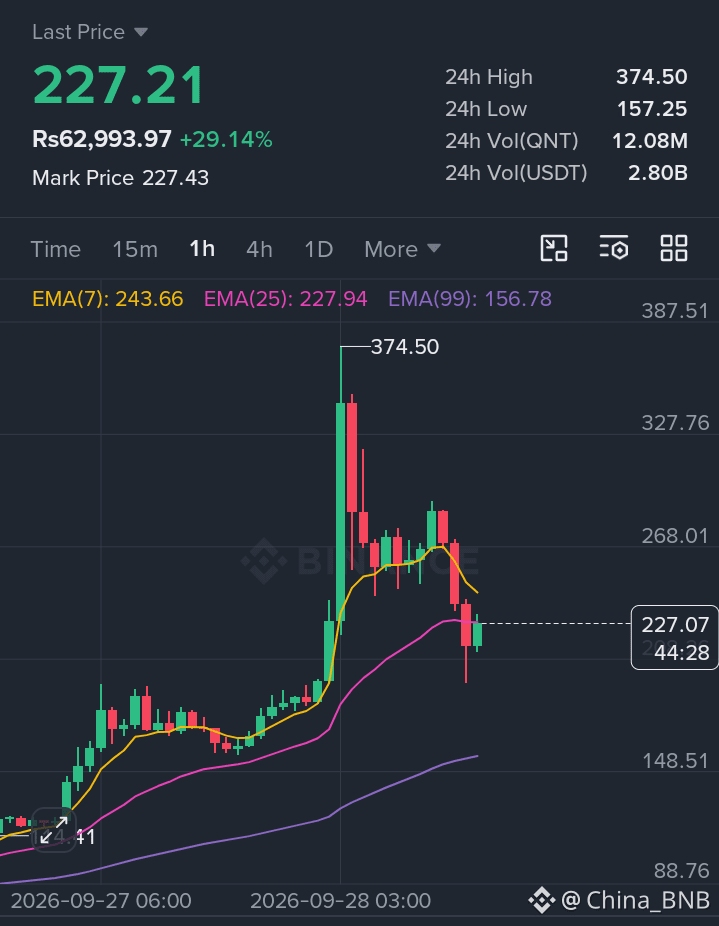
$QNT/USDT — Technical Analysis (28 Sep 2026)
QNT is around $270–$272 on the latest available Binance-linked data. Today’s range has been extremely wide: roughly $242–$320, after yesterday’s move from about $150 to a high near $361.
Key levels:
🔴 Resistance 1: $275–$285
🔴 Resistance 2: $300–$320
🔴 Major resistance: $350–$361
🟢 Support 1: $265–$266
🟢 Support 2: $238–$245
🟢 Major support: $210–$220
Momentum: The broader short-term trend remains strongly bullish, but indicators are becoming stretched. Investing.com's latest technical snapshot showed RSI around 68.6, while StochRSI and Williams %R were already in overbought territory.
Important setup:
If QNT holds $265–266 and reclaims $285, the next technical test is $300–320. A sustained move above $320 would put $350–361 back into focus.
If $265 breaks decisively, watch $238–245. Below that, the deeper correction zone is approximately $210–220. CMC's current analysis similarly identifies $266 and $239 as key Fibonacci support areas.
⚠️ Because QNT has moved more than 400% in only a few days, normal support/resistance levels can be broken very quickly; position sizing and confirmation matter here.
$QNT $ZEC
$QNT /USDT — Technical Analysis (28 Sep 2026)
QNT is around $270–$272 on the latest available Binance-linked data. Today’s range has been extremely wide: roughly $242–$320, after yesterday’s move from about $150 to a high near $361.
Key levels:
🔴 Resistance 1: $275–$285
🔴 Resistance 2: $300–$320
🔴 Major resistance: $350–$361
🟢 Support 1: $265–$266
🟢 Support 2: $238–$245
🟢 Major support: $210–$220
Momentum: The broader short-term trend remains strongly bullish, but indicators are becoming stretched. Investing.com's latest technical snapshot showed RSI around 68.6, while StochRSI and Williams %R were already in overbought territory.
Important setup:
If QNT holds $265–266 and reclaims $285, the next technical test is $300–320. A sustained move above $320 would put $350–361 back into focus.
If $265 breaks decisively, watch $238–245. Below that, the deeper correction zone is approximately $210–220. CMC's current analysis similarly identifies $266 and $239 as key Fibonacci support areas.
⚠️ Because QNT has moved more than 400% in only a few days, normal support/resistance levels can be broken very quickly; position sizing and confirmation matter here.
$QNT $ZEC
QNT is around $270–$272 on the latest available Binance-linked data. Today’s range has been extremely wide: roughly $242–$320, after yesterday’s move from about $150 to a high near $361.
Key levels:
🔴 Resistance 1: $275–$285
🔴 Resistance 2: $300–$320
🔴 Major resistance: $350–$361
🟢 Support 1: $265–$266
🟢 Support 2: $238–$245
🟢 Major support: $210–$220
Momentum: The broader short-term trend remains strongly bullish, but indicators are becoming stretched. Investing.com's latest technical snapshot showed RSI around 68.6, while StochRSI and Williams %R were already in overbought territory.
Important setup:
If QNT holds $265–266 and reclaims $285, the next technical test is $300–320. A sustained move above $320 would put $350–361 back into focus.
If $265 breaks decisively, watch $238–245. Below that, the deeper correction zone is approximately $210–220. CMC's current analysis similarly identifies $266 and $239 as key Fibonacci support areas.
⚠️ Because QNT has moved more than 400% in only a few days, normal support/resistance levels can be broken very quickly; position sizing and confirmation matter here.
$QNT $ZEC
1
273
·
--
Article
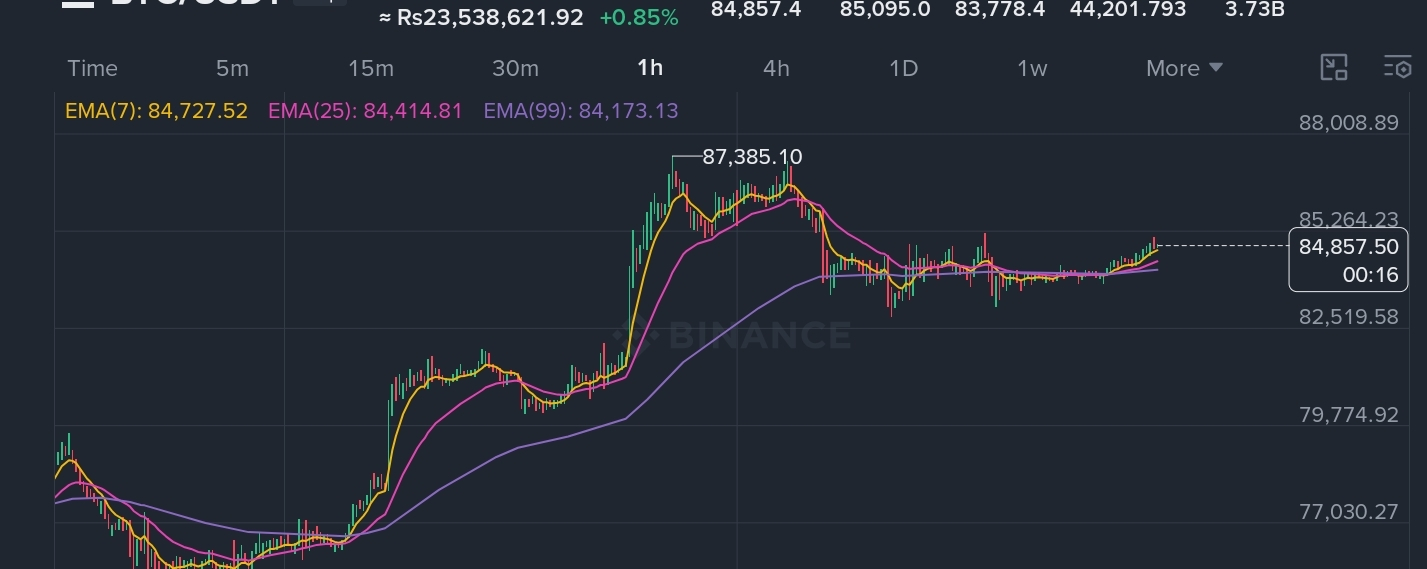
BITCOIN SLIPS BELOW $85K — NOW THE SUPPORT ZONES MATTERBitcoin is trading around $84.5K, after failing to hold above the $85K area. Recent data shows BTC has already pulled back from the $87.3K region, making the current zone important for short-term traders.
The first thing I’m watching is $84K.
If BTC stays above this area, buyers may try to reclaim $85K–$86K. But if selling pressure increases and $84K breaks clearly, attention could shift toward $82K, followed by the $80K–$81K support region.
This is where the market can become interesting
Bitcoin recently showed strong volatility, with September 21 recording a wide range between roughly $80.9K and $87.4K. That tells me liquidity is sitting on both sides, and a clean break could bring another fast move.
For now, I would watch $84K support vs. $85K resistance instead of chasing the move.
If $84K breaks, will Bitcoin finally test the $82K–$80K zone, or will buyers defend this level again?
#btc70k $BTC
{spot}(BTCUSDT)
BITCOIN SLIPS BELOW $85K — NOW THE SUPPORT ZONES MATTER
Bitcoin is trading around $84.5K, after failing to hold above the $85K area. Recent data shows BTC has already pulled back from the $87.3K region, making the current zone important for short-term traders.
The first thing I’m watching is $84K.
If BTC stays above this area, buyers may try to reclaim $85K–$86K. But if selling pressure increases and $84K breaks clearly, attention could shift toward $82K, followed by the $80K–$81K support region.
This is where the market can become interesting
Bitcoin recently showed strong volatility, with September 21 recording a wide range between roughly $80.9K and $87.4K. That tells me liquidity is sitting on both sides, and a clean break could bring another fast move.
For now, I would watch $84K support vs. $85K resistance instead of chasing the move.
If $84K breaks, will Bitcoin finally test the $82K–$80K zone, or will buyers defend this level again?
#btc70k $BTC
The first thing I’m watching is $84K.
If BTC stays above this area, buyers may try to reclaim $85K–$86K. But if selling pressure increases and $84K breaks clearly, attention could shift toward $82K, followed by the $80K–$81K support region.
This is where the market can become interesting
Bitcoin recently showed strong volatility, with September 21 recording a wide range between roughly $80.9K and $87.4K. That tells me liquidity is sitting on both sides, and a clean break could bring another fast move.
For now, I would watch $84K support vs. $85K resistance instead of chasing the move.
If $84K breaks, will Bitcoin finally test the $82K–$80K zone, or will buyers defend this level again?
#btc70k $BTC
1
106
·
--
🎙️ BITCOIN SHORT $BTC $ETH AND ALTCOIN LONGER THAN BE CAREFUL MARKET 🔜
Fin
01 h 53 min 11 sec
256
QNTUSDT
Perp
Limit/Short
3
1
·
--
Baissier
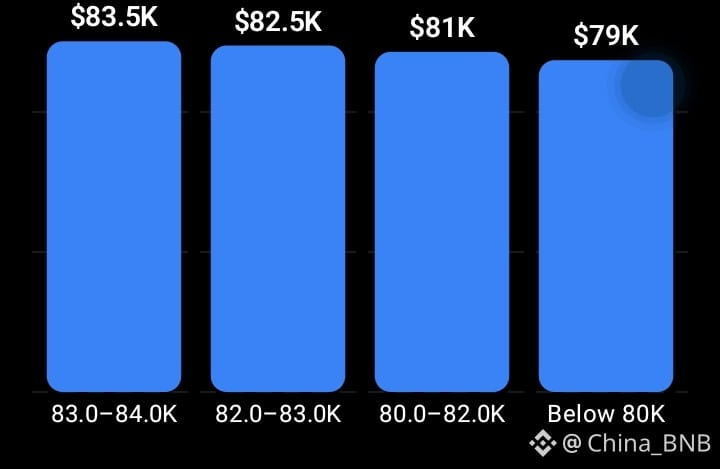
🔻 BTC Long-Liquidation Map — Below $84K
Current market data shows the key liquidity sitting below $84K, with the most important areas:
🔴 $82.0K–$83.0K — first liquidation zone
🔴 $80.0K–$82.0K — major liquidation zone
⚠️ Below $80K — deeper liquidation risk
🎯 Key technical level: ~$81.4K
🚨 Major breakdown area: ~$81K
Recent data reported roughly $1.3B of potential liquidation liquidity between $80K–$83K, while BTC's immediate technical support is around $83.8K.
Short-term read: If BTC loses $83.8K, the next area to watch is $82K–$83K. A sustained break toward $81K could expose the larger $80K–$82K liquidation pocket. A move below $84K has already produced significant long liquidations in recent sessions, including about $280M over four hours on Sep. 23.
These are liquidity zones, not exact liquidation prices; exact levels vary by exchange and leverage. �
coinmarketcap
#bitcoin #Liquidations #btc70k $BTC
🔻 BTC Long-Liquidation Map — Below $84K
Current market data shows the key liquidity sitting below $84K, with the most important areas:
🔴 $82.0K–$83.0K — first liquidation zone
🔴 $80.0K–$82.0K — major liquidation zone
⚠️ Below $80K — deeper liquidation risk
🎯 Key technical level: ~$81.4K
🚨 Major breakdown area: ~$81K
Recent data reported roughly $1.3B of potential liquidation liquidity between $80K–$83K, while BTC's immediate technical support is around $83.8K.
Short-term read: If BTC loses $83.8K, the next area to watch is $82K–$83K. A sustained break toward $81K could expose the larger $80K–$82K liquidation pocket. A move below $84K has already produced significant long liquidations in recent sessions, including about $280M over four hours on Sep. 23.
These are liquidity zones, not exact liquidation prices; exact levels vary by exchange and leverage. �
coinmarketcap
#bitcoin #Liquidations #btc70k $BTC
Current market data shows the key liquidity sitting below $84K, with the most important areas:
🔴 $82.0K–$83.0K — first liquidation zone
🔴 $80.0K–$82.0K — major liquidation zone
⚠️ Below $80K — deeper liquidation risk
🎯 Key technical level: ~$81.4K
🚨 Major breakdown area: ~$81K
Recent data reported roughly $1.3B of potential liquidation liquidity between $80K–$83K, while BTC's immediate technical support is around $83.8K.
Short-term read: If BTC loses $83.8K, the next area to watch is $82K–$83K. A sustained break toward $81K could expose the larger $80K–$82K liquidation pocket. A move below $84K has already produced significant long liquidations in recent sessions, including about $280M over four hours on Sep. 23.
These are liquidity zones, not exact liquidation prices; exact levels vary by exchange and leverage. �
coinmarketcap
#bitcoin #Liquidations #btc70k $BTC
2
220


·
--

Article
💥ZEC/USDT IS MOVING FAST — AND THE MARKET IS WATCHING! 🔥Zcash is suddenly back in the spotlight.
ZEC has delivered a powerful rally in September, with the price recently pushing toward the $1,600–$1,700 zone. On September 26, ZEC briefly reached around $1,684 on Binance spot, while heavy short liquidations added fuel to the move.
But here is the important part:
After a move this strong, volatility can become extreme.
ZEC is now trading in a market where buyers are showing strong momentum, but traders also need to watch whether the price can hold higher levels after the rally.
Institutional interest is another factor. Grayscale's Zcash ETF reportedly reached around $1 billion in assets under management, although much of that increase came from ZEC's rising price rather than new investor inflows.
For ZEC/USDT traders, the key things to watch are:
📌 $1,600–$1,700: Important recent price zone
📌 Trading volume: Confirmation of strength
📌 Liquidations: High leverage can create sudden moves
📌 Bitcoin direction: BTC can influence the wider crypto market
📌 Support: Losing important levels could trigger a sharp pullback
Zcash is proving that the privacy-coin sector can still attract serious market attention.
🔥 The momentum is strong. But after a huge rally, risk management matters even more.
Watch the chart.
Watch the volume.
Don't chase the candle.
ZEC/USDT is definitely one of the pairs to watch. 👀⚡
#ZEC #zcash $ZEC
{spot}(ZECUSDT)
💥ZEC/USDT IS MOVING FAST — AND THE MARKET IS WATCHING! 🔥
Zcash is suddenly back in the spotlight.
ZEC has delivered a powerful rally in September, with the price recently pushing toward the $1,600–$1,700 zone. On September 26, ZEC briefly reached around $1,684 on Binance spot, while heavy short liquidations added fuel to the move.
But here is the important part:
After a move this strong, volatility can become extreme.
ZEC is now trading in a market where buyers are showing strong momentum, but traders also need to watch whether the price can hold higher levels after the rally.
Institutional interest is another factor. Grayscale's Zcash ETF reportedly reached around $1 billion in assets under management, although much of that increase came from ZEC's rising price rather than new investor inflows.
For ZEC/USDT traders, the key things to watch are:
📌 $1,600–$1,700: Important recent price zone
📌 Trading volume: Confirmation of strength
📌 Liquidations: High leverage can create sudden moves
📌 Bitcoin direction: BTC can influence the wider crypto market
📌 Support: Losing important levels could trigger a sharp pullback
Zcash is proving that the privacy-coin sector can still attract serious market attention.
🔥 The momentum is strong. But after a huge rally, risk management matters even more.
Watch the chart.
Watch the volume.
Don't chase the candle.
ZEC/USDT is definitely one of the pairs to watch. 👀⚡
#ZEC #zcash $ZEC
ZEC has delivered a powerful rally in September, with the price recently pushing toward the $1,600–$1,700 zone. On September 26, ZEC briefly reached around $1,684 on Binance spot, while heavy short liquidations added fuel to the move.
But here is the important part:
After a move this strong, volatility can become extreme.
ZEC is now trading in a market where buyers are showing strong momentum, but traders also need to watch whether the price can hold higher levels after the rally.
Institutional interest is another factor. Grayscale's Zcash ETF reportedly reached around $1 billion in assets under management, although much of that increase came from ZEC's rising price rather than new investor inflows.
For ZEC/USDT traders, the key things to watch are:
📌 $1,600–$1,700: Important recent price zone
📌 Trading volume: Confirmation of strength
📌 Liquidations: High leverage can create sudden moves
📌 Bitcoin direction: BTC can influence the wider crypto market
📌 Support: Losing important levels could trigger a sharp pullback
Zcash is proving that the privacy-coin sector can still attract serious market attention.
🔥 The momentum is strong. But after a huge rally, risk management matters even more.
Watch the chart.
Watch the volume.
Don't chase the candle.
ZEC/USDT is definitely one of the pairs to watch. 👀⚡
#ZEC #zcash $ZEC
2
243
·
--
Article
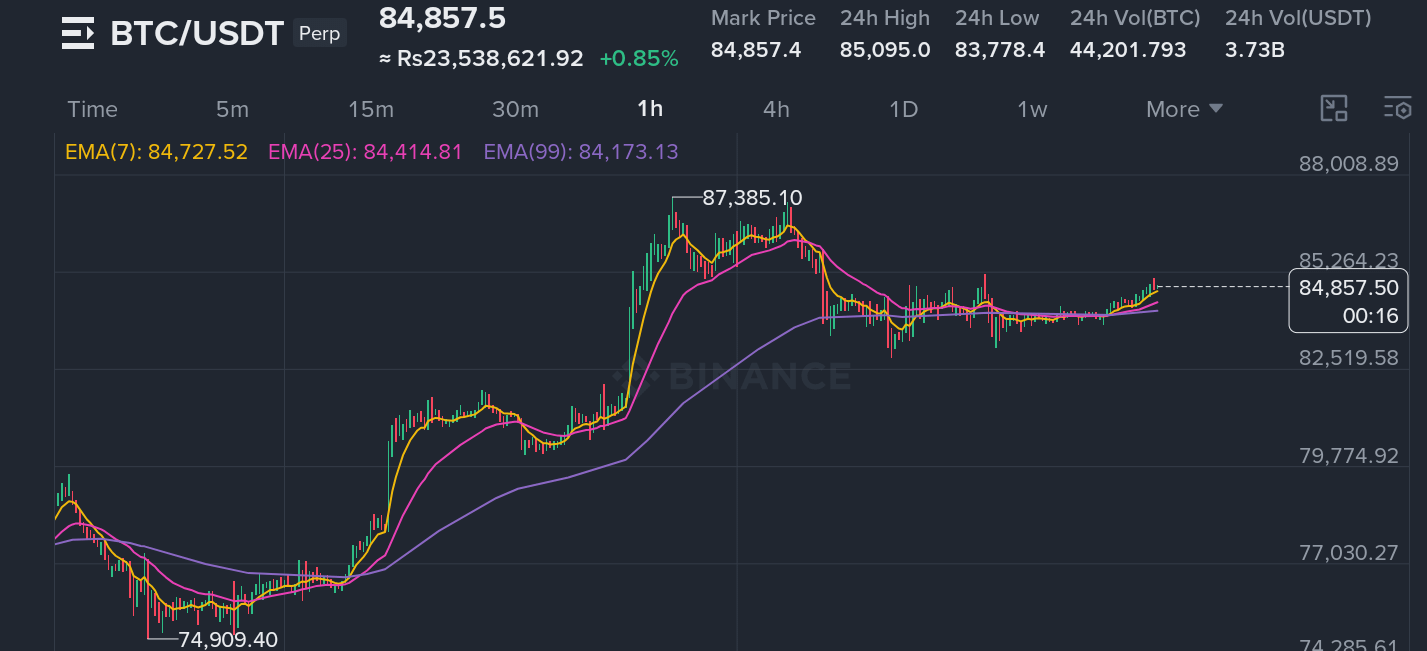
🚨BITCOIN IS AT A CRITICAL TURNING POINT — THE NEXT MOVE COULD SHAKE THE ENTIRE CRYPTO MARKET! ₿🔥Bitcoin is holding near the $84K area, and traders are watching closely.
The big question is:
🚀 Breakout or correction?
BTC is currently caught between strong buying interest and macroeconomic pressure. Institutional demand and Bitcoin ETF flows remain important, while higher Treasury yields are creating pressure across risk assets.
If Bitcoin holds its key support and buying volume increases, the next strong move could come quickly.
But if BTC loses support, short-term selling pressure could push the wider crypto market lower — and altcoins could feel the impact even more.
Meanwhile, some altcoins are showing stronger momentum while Bitcoin consolidates. This could mean traders are rotating capital into selected altcoins.
One thing remains clear:
When Bitcoin moves, the entire crypto market listens.
👀 Watch BTC support, resistance, volume, ETF flows and market sentiment closely.
The next move may define the direction of the market.
Stay patient. Stay alert. Manage your risk. ₿🚀
#Bitcoin #BTC #altcoins $BTC
{spot}(BTCUSDT)
🚨BITCOIN IS AT A CRITICAL TURNING POINT — THE NEXT MOVE COULD SHAKE THE ENTIRE CRYPTO MARKET! ₿🔥
Bitcoin is holding near the $84K area, and traders are watching closely.
The big question is:
🚀 Breakout or correction?
BTC is currently caught between strong buying interest and macroeconomic pressure. Institutional demand and Bitcoin ETF flows remain important, while higher Treasury yields are creating pressure across risk assets.
If Bitcoin holds its key support and buying volume increases, the next strong move could come quickly.
But if BTC loses support, short-term selling pressure could push the wider crypto market lower — and altcoins could feel the impact even more.
Meanwhile, some altcoins are showing stronger momentum while Bitcoin consolidates. This could mean traders are rotating capital into selected altcoins.
One thing remains clear:
When Bitcoin moves, the entire crypto market listens.
👀 Watch BTC support, resistance, volume, ETF flows and market sentiment closely.
The next move may define the direction of the market.
Stay patient. Stay alert. Manage your risk. ₿🚀
#Bitcoin #BTC #altcoins $BTC
The big question is:
🚀 Breakout or correction?
BTC is currently caught between strong buying interest and macroeconomic pressure. Institutional demand and Bitcoin ETF flows remain important, while higher Treasury yields are creating pressure across risk assets.
If Bitcoin holds its key support and buying volume increases, the next strong move could come quickly.
But if BTC loses support, short-term selling pressure could push the wider crypto market lower — and altcoins could feel the impact even more.
Meanwhile, some altcoins are showing stronger momentum while Bitcoin consolidates. This could mean traders are rotating capital into selected altcoins.
One thing remains clear:
When Bitcoin moves, the entire crypto market listens.
👀 Watch BTC support, resistance, volume, ETF flows and market sentiment closely.
The next move may define the direction of the market.
Stay patient. Stay alert. Manage your risk. ₿🚀
#Bitcoin #BTC #altcoins $BTC
3
2
122
·
--
🎙️ Welcome to Suleman 特币 Live — Crypto Talks, Charts & Market Moves 🚀📊

Fin
03 h 46 min 04 sec
213
2
0
·
--
Vérifié

Article
BLACKROCK JUST PUT PORTFOLIO STRATEGIES ONCHAINWhat if you didn’t need to build a portfolio asset by asset anymore?
On September 24, Ondo Finance launched Ondo Intelligent Portfolios, introducing single onchain tokens built around portfolio strategies developed by BlackRock for Ondo.
The first three BlackRock-based products cover High Income, Diversified Growth, and High Growth strategies. Instead of managing multiple positions separately, eligible non-U.S. investors can hold one token representing exposure to an underlying basket.
But the bigger story is not simply
“BlackRock + crypto.”
It is the portfolio itself becoming a blockchain asset.
Ondo says constituents, target weights and rebalances are visible onchain, with programmatic rebalancing designed into the product. The tokens can also be transferred peer-to-peer and used across supported DeFi infrastructure, subject to restrictions.
And there is an important distinction: BlackRock designed the model strategies; Ondo issues, manages and operates the tokenized portfolios. BlackRock is not the issuer or portfolio manager of these tokens.
This could mark another step in the evolution from tokenizing individual assets → tokenizing entire investment strategies.
The real question is: if an entire portfolio can live inside one token, what becomes the next financial product to move onchain?
#BlackRockBuildsTokenizedPortfoliosForOndo $ONDO
{spot}(ONDOUSDT)
BLACKROCK JUST PUT PORTFOLIO STRATEGIES ONCHAIN
What if you didn’t need to build a portfolio asset by asset anymore?
On September 24, Ondo Finance launched Ondo Intelligent Portfolios, introducing single onchain tokens built around portfolio strategies developed by BlackRock for Ondo.
The first three BlackRock-based products cover High Income, Diversified Growth, and High Growth strategies. Instead of managing multiple positions separately, eligible non-U.S. investors can hold one token representing exposure to an underlying basket.
But the bigger story is not simply
“BlackRock + crypto.”
It is the portfolio itself becoming a blockchain asset.
Ondo says constituents, target weights and rebalances are visible onchain, with programmatic rebalancing designed into the product. The tokens can also be transferred peer-to-peer and used across supported DeFi infrastructure, subject to restrictions.
And there is an important distinction: BlackRock designed the model strategies; Ondo issues, manages and operates the tokenized portfolios. BlackRock is not the issuer or portfolio manager of these tokens.
This could mark another step in the evolution from tokenizing individual assets → tokenizing entire investment strategies.
The real question is: if an entire portfolio can live inside one token, what becomes the next financial product to move onchain?
#BlackRockBuildsTokenizedPortfoliosForOndo $ONDO
On September 24, Ondo Finance launched Ondo Intelligent Portfolios, introducing single onchain tokens built around portfolio strategies developed by BlackRock for Ondo.
The first three BlackRock-based products cover High Income, Diversified Growth, and High Growth strategies. Instead of managing multiple positions separately, eligible non-U.S. investors can hold one token representing exposure to an underlying basket.
But the bigger story is not simply
“BlackRock + crypto.”
It is the portfolio itself becoming a blockchain asset.
Ondo says constituents, target weights and rebalances are visible onchain, with programmatic rebalancing designed into the product. The tokens can also be transferred peer-to-peer and used across supported DeFi infrastructure, subject to restrictions.
And there is an important distinction: BlackRock designed the model strategies; Ondo issues, manages and operates the tokenized portfolios. BlackRock is not the issuer or portfolio manager of these tokens.
This could mark another step in the evolution from tokenizing individual assets → tokenizing entire investment strategies.
The real question is: if an entire portfolio can live inside one token, what becomes the next financial product to move onchain?
#BlackRockBuildsTokenizedPortfoliosForOndo $ONDO
3
168
·
--
Haussier
BlackRock’s Portfolio Strategies Are Moving On-Chain — Through Ondo
What happens when traditional portfolio construction meets blockchain infrastructure?
Ondo Finance has launched Ondo Intelligent Portfolios, with three new On-Chain portfolio tokens based on strategies developed by BlackRock specifically for Ondo. The launch was announced on September 24, 2026.
The first products cover High Income, Diversified Growth, and High Growth strategies. Instead of managing multiple assets separately, eligible investors outside the U.S. can receive exposure to a diversified basket through a single transferable token. Holdings, target weights and scheduled rebalances are designed to be visible On-Chain.
One important detail: BlackRock provides the model strategies, while Ondo issues and operates the tokenized portfolios. BlackRock is not managing, issuing, distributing or holding these portfolio tokens.
For the broader crypto market, this is another example of how tokenization is moving beyond simply putting one stock or fund on a blockchain. The focus is increasingly shifting toward entire investment strategies becoming programmable On-Chain products.
The interesting question now is whether investors will ultimately prefer holding individual tokenized assets—or simply holding one token that represents an entire portfolio.
$ONDO
#BlackRockBuildsTokenizedPortfoliosForOndo
BlackRock’s Portfolio Strategies Are Moving On-Chain — Through Ondo
What happens when traditional portfolio construction meets blockchain infrastructure?
Ondo Finance has launched Ondo Intelligent Portfolios, with three new On-Chain portfolio tokens based on strategies developed by BlackRock specifically for Ondo. The launch was announced on September 24, 2026.
The first products cover High Income, Diversified Growth, and High Growth strategies. Instead of managing multiple assets separately, eligible investors outside the U.S. can receive exposure to a diversified basket through a single transferable token. Holdings, target weights and scheduled rebalances are designed to be visible On-Chain.
One important detail: BlackRock provides the model strategies, while Ondo issues and operates the tokenized portfolios. BlackRock is not managing, issuing, distributing or holding these portfolio tokens.
For the broader crypto market, this is another example of how tokenization is moving beyond simply putting one stock or fund on a blockchain. The focus is increasingly shifting toward entire investment strategies becoming programmable On-Chain products.
The interesting question now is whether investors will ultimately prefer holding individual tokenized assets—or simply holding one token that represents an entire portfolio.
$ONDO
#BlackRockBuildsTokenizedPortfoliosForOndo
What happens when traditional portfolio construction meets blockchain infrastructure?
Ondo Finance has launched Ondo Intelligent Portfolios, with three new On-Chain portfolio tokens based on strategies developed by BlackRock specifically for Ondo. The launch was announced on September 24, 2026.
The first products cover High Income, Diversified Growth, and High Growth strategies. Instead of managing multiple assets separately, eligible investors outside the U.S. can receive exposure to a diversified basket through a single transferable token. Holdings, target weights and scheduled rebalances are designed to be visible On-Chain.
One important detail: BlackRock provides the model strategies, while Ondo issues and operates the tokenized portfolios. BlackRock is not managing, issuing, distributing or holding these portfolio tokens.
For the broader crypto market, this is another example of how tokenization is moving beyond simply putting one stock or fund on a blockchain. The focus is increasingly shifting toward entire investment strategies becoming programmable On-Chain products.
The interesting question now is whether investors will ultimately prefer holding individual tokenized assets—or simply holding one token that represents an entire portfolio.
$ONDO
#BlackRockBuildsTokenizedPortfoliosForOndo
2
348
·
--
Haussier
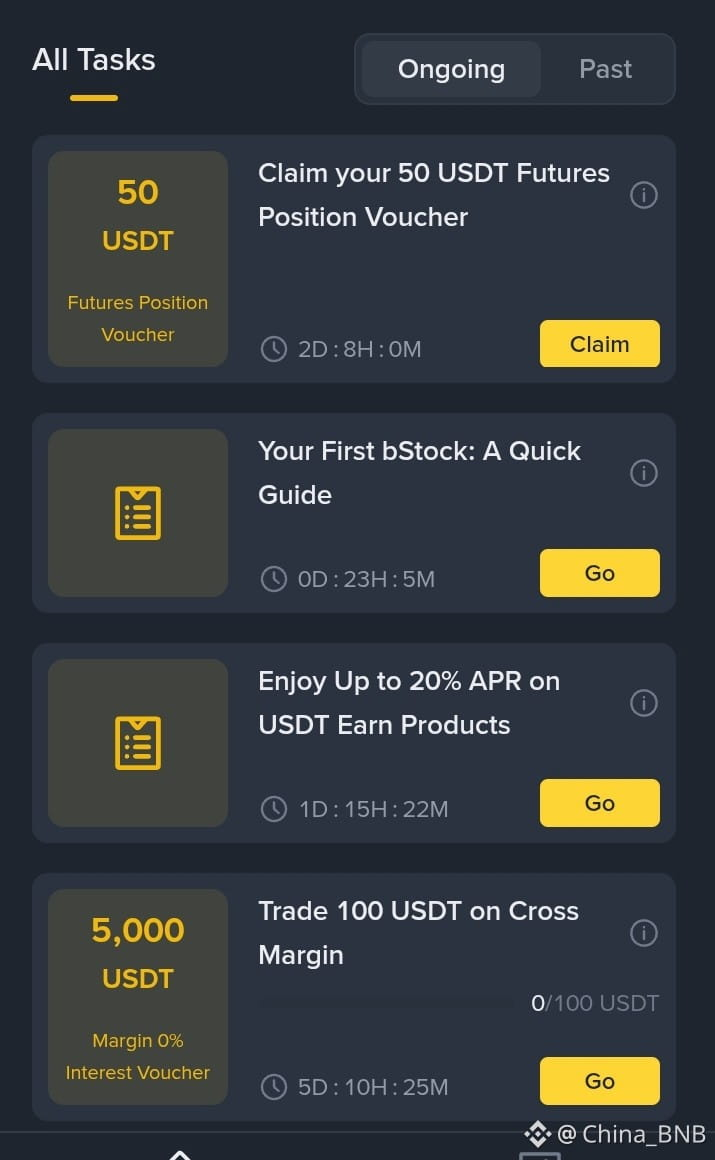
Hi 👋 everyone Focus traders my image voucher can explain it !
Binance send me 5000$ voucher bStocks trade 100$ margin but have not played this market bStock can please help !?
$NVDAB $AAPLB $NVDA.US
{stock_us}(NVDA.US)
Hi 👋 everyone Focus traders my image voucher can explain it !
Binance send me 5000$ voucher bStocks trade 100$ margin but have not played this market bStock can please help !?
$NVDAB $AAPLB $NVDA.US
Binance send me 5000$ voucher bStocks trade 100$ margin but have not played this market bStock can please help !?
$NVDAB $AAPLB $NVDA.US
22
5
51
19k
·
--

Article
🚨 BITCOIN’S $16 BILLION MOMENT IS HEREToday could be one of the most important volatility sessions for BTC.
Around $15.6B of Bitcoin options are expiring on Deribit, involving roughly 182,000 BTC contracts.
Why does this matter?
Options expiry can change how market makers hedge their positions. As contracts expire, those hedges can be adjusted or removed, potentially creating larger price swings.
Bitcoin is also entering this event with strong recent momentum. Recent reports show BTC trading around the $85K–$86K area, while spot crypto ETFs recorded approximately $477M in net inflows in the latest settled session.
So traders are watching two forces at once:
Heavy derivatives positioning ⚡Strong spot ETF demand 💰
The important point is that a large options expiry does not automatically mean BTC will go up or down. It means the market structure is changing, and volatility can increase as positions are settled and new ones are opened.
For short-term traders, the key signal may come after the expiry, when fresh positioning reveals where the market wants to move.
Will Bitcoin hold the $85K area after the options dust settles—or will volatility reveal a completely different direction?
#BitcoinSpotETFsNetInflow$191M
🚨 BITCOIN’S $16 BILLION MOMENT IS HERE
Today could be one of the most important volatility sessions for BTC.
Around $15.6B of Bitcoin options are expiring on Deribit, involving roughly 182,000 BTC contracts.
Why does this matter?
Options expiry can change how market makers hedge their positions. As contracts expire, those hedges can be adjusted or removed, potentially creating larger price swings.
Bitcoin is also entering this event with strong recent momentum. Recent reports show BTC trading around the $85K–$86K area, while spot crypto ETFs recorded approximately $477M in net inflows in the latest settled session.
So traders are watching two forces at once:
Heavy derivatives positioning ⚡Strong spot ETF demand 💰
The important point is that a large options expiry does not automatically mean BTC will go up or down. It means the market structure is changing, and volatility can increase as positions are settled and new ones are opened.
For short-term traders, the key signal may come after the expiry, when fresh positioning reveals where the market wants to move.
Will Bitcoin hold the $85K area after the options dust settles—or will volatility reveal a completely different direction?
#BitcoinSpotETFsNetInflow$191M
Around $15.6B of Bitcoin options are expiring on Deribit, involving roughly 182,000 BTC contracts.
Why does this matter?
Options expiry can change how market makers hedge their positions. As contracts expire, those hedges can be adjusted or removed, potentially creating larger price swings.
Bitcoin is also entering this event with strong recent momentum. Recent reports show BTC trading around the $85K–$86K area, while spot crypto ETFs recorded approximately $477M in net inflows in the latest settled session.
So traders are watching two forces at once:
Heavy derivatives positioning ⚡Strong spot ETF demand 💰
The important point is that a large options expiry does not automatically mean BTC will go up or down. It means the market structure is changing, and volatility can increase as positions are settled and new ones are opened.
For short-term traders, the key signal may come after the expiry, when fresh positioning reveals where the market wants to move.
Will Bitcoin hold the $85K area after the options dust settles—or will volatility reveal a completely different direction?
#BitcoinSpotETFsNetInflow$191M
2
180
·
--
Baissier
Trading sur 30 j de 8.6K USDT en $BTC
What does liquidation mean?
Liquidation happens when a trader uses leverage and the market moves strongly against their position.
For example, if a trader opens a $1,000 long position using $100 of their own money, a sharp BTC decline can reduce their margin until the exchange automatically closes the position. That forced closure is called liquidation.
Long liquidation: BTC falls → leveraged buyers are forced to close.
Short liquidation: BTC rises → leveraged sellers are forced to close.
Large liquidations: Often mean excessive leverage has been removed from the market.
Important: Liquidations do not automatically mean Bitcoin will fall or rise next. They mainly show that leveraged traders were caught on the wrong side of a move.
So, when we say “$462M was liquidated,” it means roughly $462M worth of leveraged futures positions were forcibly closed—not that $462M of Bitcoin was simply sold in the spot market.
#Liquidations $BTC
What does liquidation mean?
Liquidation happens when a trader uses leverage and the market moves strongly against their position.
For example, if a trader opens a $1,000 long position using $100 of their own money, a sharp BTC decline can reduce their margin until the exchange automatically closes the position. That forced closure is called liquidation.
Long liquidation: BTC falls → leveraged buyers are forced to close.
Short liquidation: BTC rises → leveraged sellers are forced to close.
Large liquidations: Often mean excessive leverage has been removed from the market.
Important: Liquidations do not automatically mean Bitcoin will fall or rise next. They mainly show that leveraged traders were caught on the wrong side of a move.
So, when we say “$462M was liquidated,” it means roughly $462M worth of leveraged futures positions were forcibly closed—not that $462M of Bitcoin was simply sold in the spot market.
#Liquidations $BTC
Liquidation happens when a trader uses leverage and the market moves strongly against their position.
For example, if a trader opens a $1,000 long position using $100 of their own money, a sharp BTC decline can reduce their margin until the exchange automatically closes the position. That forced closure is called liquidation.
Long liquidation: BTC falls → leveraged buyers are forced to close.
Short liquidation: BTC rises → leveraged sellers are forced to close.
Large liquidations: Often mean excessive leverage has been removed from the market.
Important: Liquidations do not automatically mean Bitcoin will fall or rise next. They mainly show that leveraged traders were caught on the wrong side of a move.
So, when we say “$462M was liquidated,” it means roughly $462M worth of leveraged futures positions were forcibly closed—not that $462M of Bitcoin was simply sold in the spot market.
#Liquidations $BTC
1
221
·
--
Haussier
$BCH is bullish while it holds the cloud/support zone.
$BCH Bullish Setup
Current zone: ~$336
🟢 Bullish support: $330–333
🚀 Breakout: $340–346
🎯 Upside levels: $350 → $360
🛡️ Invalidation: 1H close below ~$330
View: Price holding above the cloud favors continuation.
Key trigger: A clean 1H candle close above $346 with volume would strengthen the bullish setup.
My analysis check this 1hour have takeaway $346 🔜
{future}(BCHUSDT)
$BCH is bullish while it holds the cloud/support zone.
$BCH Bullish Setup
Current zone: ~$336
🟢 Bullish support: $330–333
🚀 Breakout: $340–346
🎯 Upside levels: $350 → $360
🛡️ Invalidation: 1H close below ~$330
View: Price holding above the cloud favors continuation.
Key trigger: A clean 1H candle close above $346 with volume would strengthen the bullish setup.
My analysis check this 1hour have takeaway $346 🔜
$BCH Bullish Setup
Current zone: ~$336
🟢 Bullish support: $330–333
🚀 Breakout: $340–346
🎯 Upside levels: $350 → $360
🛡️ Invalidation: 1H close below ~$330
View: Price holding above the cloud favors continuation.
Key trigger: A clean 1H candle close above $346 with volume would strengthen the bullish setup.
My analysis check this 1hour have takeaway $346 🔜
2
243
·
--
Haussier
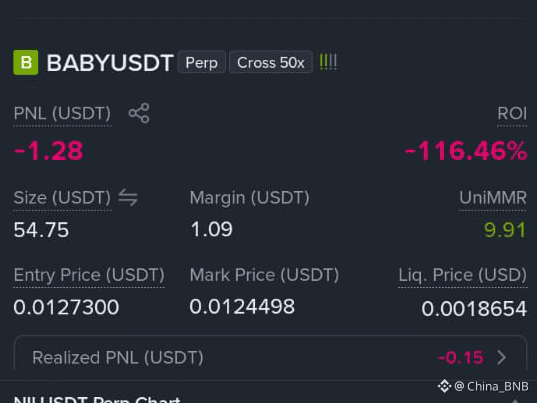
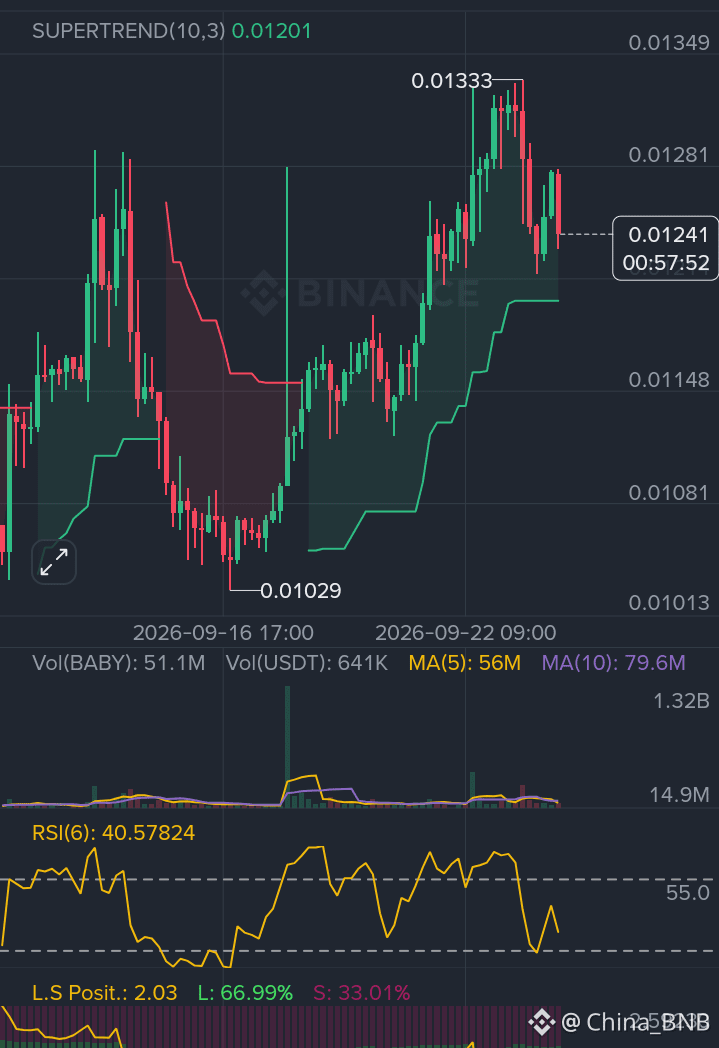
🚀✨For long-term BABY/USDT, I’d use staggered entries rather than buying the whole position at once. BABY is currently around $0.0124–$0.0127, with recent lows around $0.0112–$0.0114.
$BABY Long-Term Entry Zones
Zone Entry Area Approach
🟢 Entry 1 $0.0115–$0.0122 25%
🟢 Entry 2 $0.0103–$0.0113 35%
🟢 Entry 3 $0.0095–$0.0102 40%
Key support: ~$0.0095–$0.0100, close to BABY's historical low around $0.00951.
Long-term invalidation: A sustained breakdown below $0.0090 would materially weaken this accumulation setup.
Potential profit-taking zones
$0.015–0.017 → $0.020–0.025 → $0.030+
One important factor for a long-term holder: BABY still has scheduled token unlocks, including an upcoming October 10, 2026 unlock of about 248.6M BABY, so supply pressure should be considered when sizing a position.
🚀✨For long-term BABY/USDT, I’d use staggered entries rather than buying the whole position at once. BABY is currently around $0.0124–$0.0127, with recent lows around $0.0112–$0.0114.
$BABY Long-Term Entry Zones
Zone Entry Area Approach
🟢 Entry 1 $0.0115–$0.0122 25%
🟢 Entry 2 $0.0103–$0.0113 35%
🟢 Entry 3 $0.0095–$0.0102 40%
Key support: ~$0.0095–$0.0100, close to BABY's historical low around $0.00951.
Long-term invalidation: A sustained breakdown below $0.0090 would materially weaken this accumulation setup.
Potential profit-taking zones
$0.015–0.017 → $0.020–0.025 → $0.030+
One important factor for a long-term holder: BABY still has scheduled token unlocks, including an upcoming October 10, 2026 unlock of about 248.6M BABY, so supply pressure should be considered when sizing a position.
$BABY Long-Term Entry Zones
Zone Entry Area Approach
🟢 Entry 1 $0.0115–$0.0122 25%
🟢 Entry 2 $0.0103–$0.0113 35%
🟢 Entry 3 $0.0095–$0.0102 40%
Key support: ~$0.0095–$0.0100, close to BABY's historical low around $0.00951.
Long-term invalidation: A sustained breakdown below $0.0090 would materially weaken this accumulation setup.
Potential profit-taking zones
$0.015–0.017 → $0.020–0.025 → $0.030+
One important factor for a long-term holder: BABY still has scheduled token unlocks, including an upcoming October 10, 2026 unlock of about 248.6M BABY, so supply pressure should be considered when sizing a position.
1
515
Connectez-vous pour découvrir plus de contenu
Rejoignez la communauté mondiale des adeptes de cryptomonnaies sur Binance Square
⚡️ Suviez les dernières informations importantes sur les cryptomonnaies.
💬 Jugé digne de confiance par la plus grande plateforme d’échange de cryptomonnaies au monde.
👍 Découvrez les connaissances que partagent les créateurs vérifiés.
Adresse e-mail/Nº de téléphone
Sujets d’actualité
NvidiaApproves$150BBuyback
1,178 vues
29 mentions
#NvidiaApproves$150BBuyback
Nvidia’s $150 Billion Buyback Shockwave: Is AI Cash Flow Driving the Next Market Rally? 🚀
The AI supercycle just sent shockwaves across tradfi and crypto markets! NVIDIA's Board of Directors authorized a massive $150 Billion increase to its share repurchase program, expanding the company's total remaining buyback authorization to $235 Billion.
This marks the largest share buyback authorization in U.S. corporate history, surpassing Apple’s $110 billion benchmark.
📰 Key Headlines & Market Breakdown
Record-Breaking Capital Return: NVIDIA founder and CEO Jensen Huang cited "once-in-a-generation platform shift to AI" and strong corporate cash flow as the main drivers behind returning capital to shareholders.
Defying Market Downturns: Despite broader equity pressure and rising U.S. Treasury yields, $NVDA shares surged over 3% on the announcement, showing institutional confidence in tech assets.
Spillover into Decentralized AI: Historically, major bullish headlines for NVIDIA trigger positive sentiment for decentralized AI infrastructure protocols (such as NEAR, RENDER, and FET), as web3 AI projects track broader AI sector valuations.
❓ Discussion Point
Nvidia announces a massive $150B buyback! Will tech stock gains bleed over into Bitcoin and AI tokens?
$RENDER
📊 Related Crypto Trade Signal: RENDER/USDT
Trade Bias: Bullish
Entry Zone: $5.20 – $5.45
Target 1 (TP1): $6.10
Target 2 (TP2): $6.85
Stop Loss (SL): $4.85
Leverage (Futures): 3x – 5x (Isolated)
Technical Rationale: RENDER tends to react strongly to Nvidia hardware and AI capital developments. Price is consolidating near key moving average support with rising spot volume following the $NVDAB
news.
#HackersDrainOver12.4MXRPFromDCENTWallets #CryptoNews #AITokens #TradingSignals
Lily星星
·1 mentions J’aime
·95 vues
OpenAIDelaysGPT6.1OverSafetyIssues
5,265 vues
236 mentions
AMDToAcquireWorldLabsFor$8.2B
788 vues
28 mentions