

Mr_chosen1
1.4k Publications

Mr_chosen1
Signaler
Bloquer l’utilisateur
2 Suivis
65 Abonnés
476 J’aime
Publications
Tous
Citations
·
--
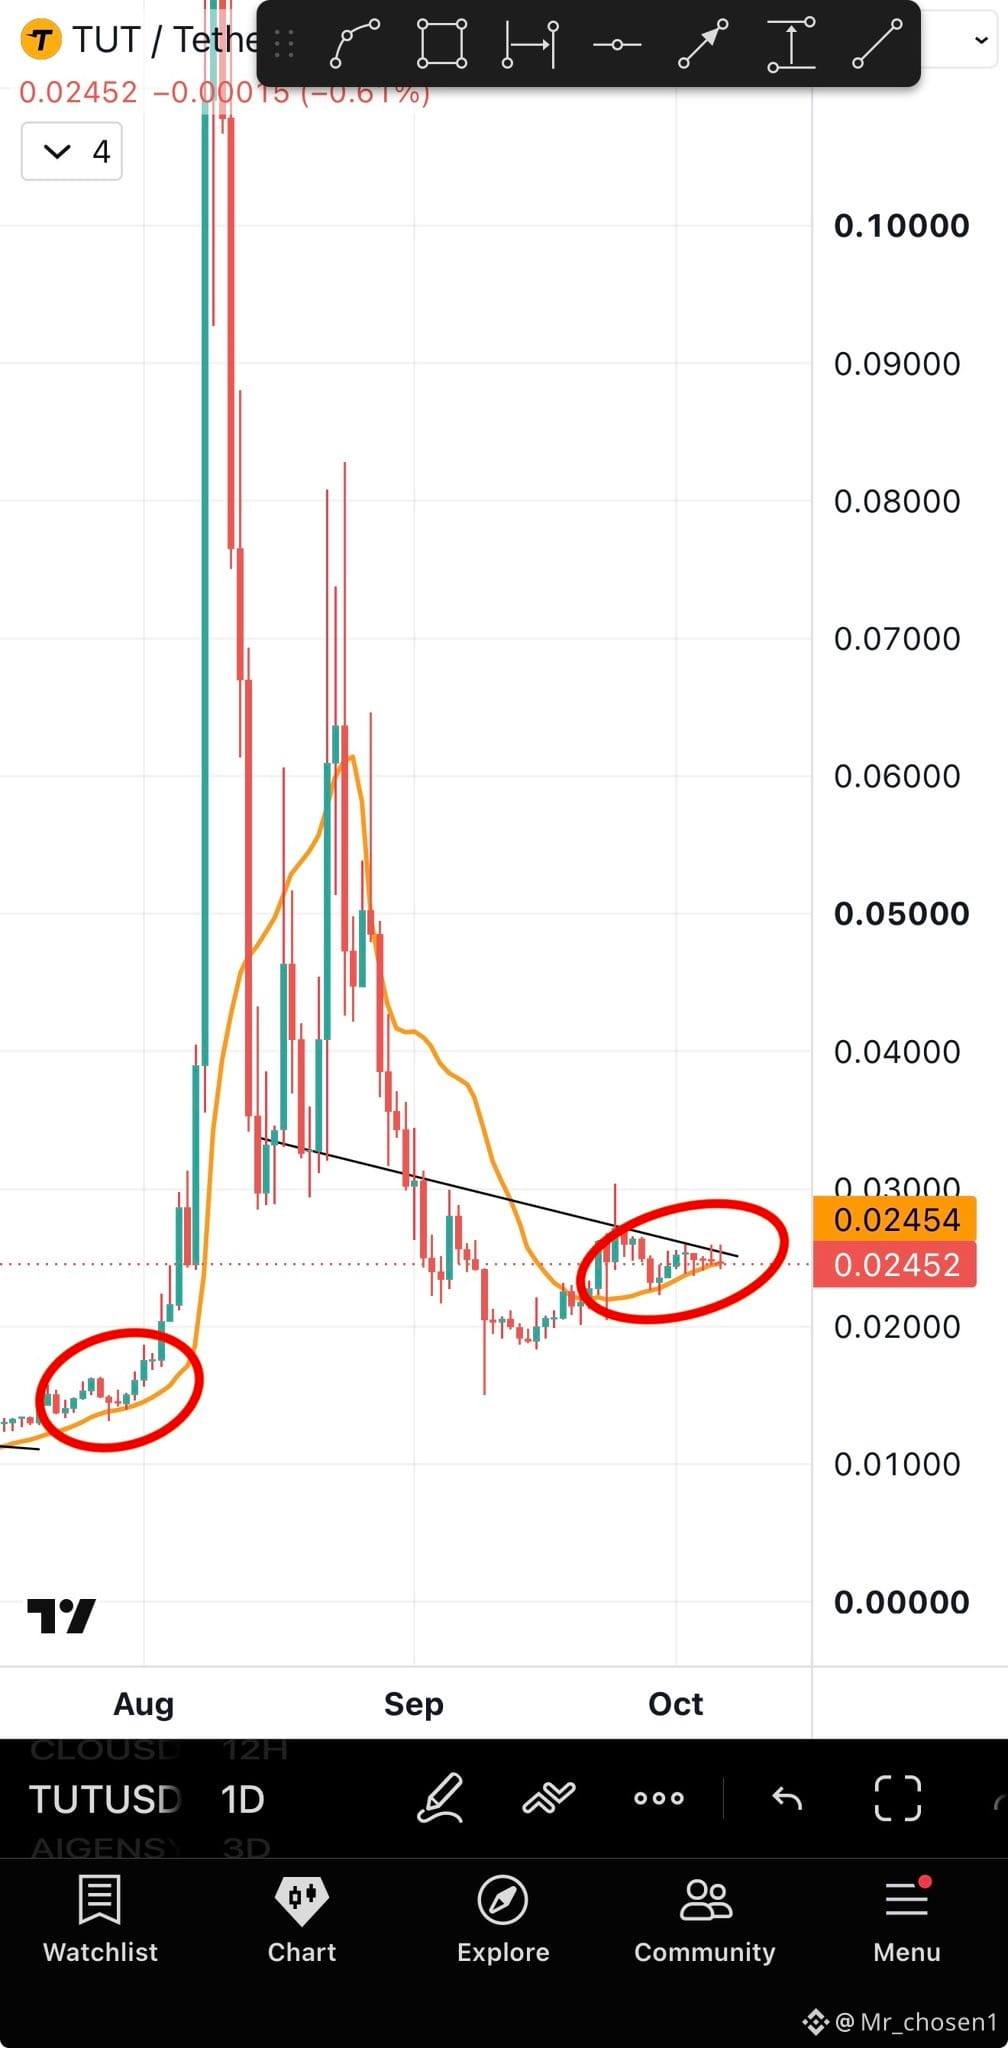
$TUT Just crossed above its super bulltrend line & retested it.
Last time this happened it went 40x.
Let’s see how high it goes from here.
Also note that BnB gems are slowly starting $TUT is a leader that never disappointed during this trend.
$TUT Just crossed above its super bulltrend line & retested it.
Last time this happened it went 40x.
Let’s see how high it goes from here.
Also note that BnB gems are slowly starting $TUT is a leader that never disappointed during this trend.
Last time this happened it went 40x.
Let’s see how high it goes from here.
Also note that BnB gems are slowly starting $TUT is a leader that never disappointed during this trend.
6
·
--
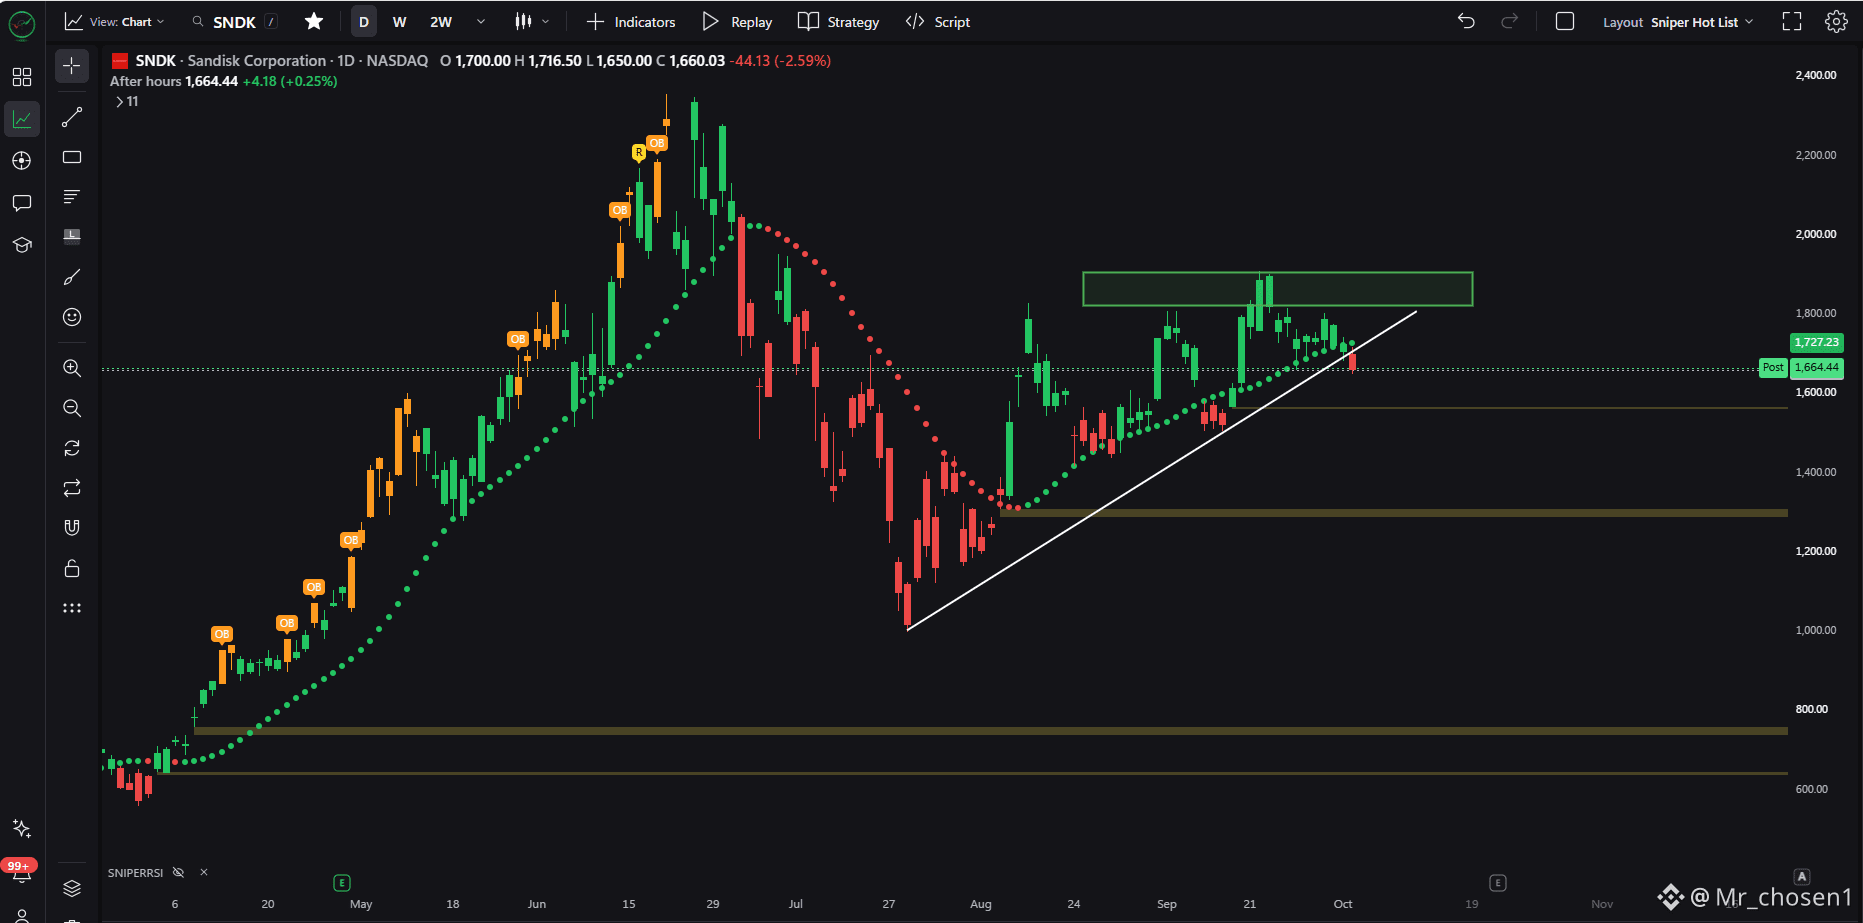
$SNDK.US just printed a sell signal on the daily chart.
Price hit four of four retracement targets, closed below the trending dots and trend line.
Is the relief rally over?
$SNDK.US just printed a sell signal on the daily chart.
Price hit four of four retracement targets, closed below the trending dots and trend line.
Is the relief rally over?
Price hit four of four retracement targets, closed below the trending dots and trend line.
Is the relief rally over?
SNDKUS-0,92%
5
·
--
$BTC
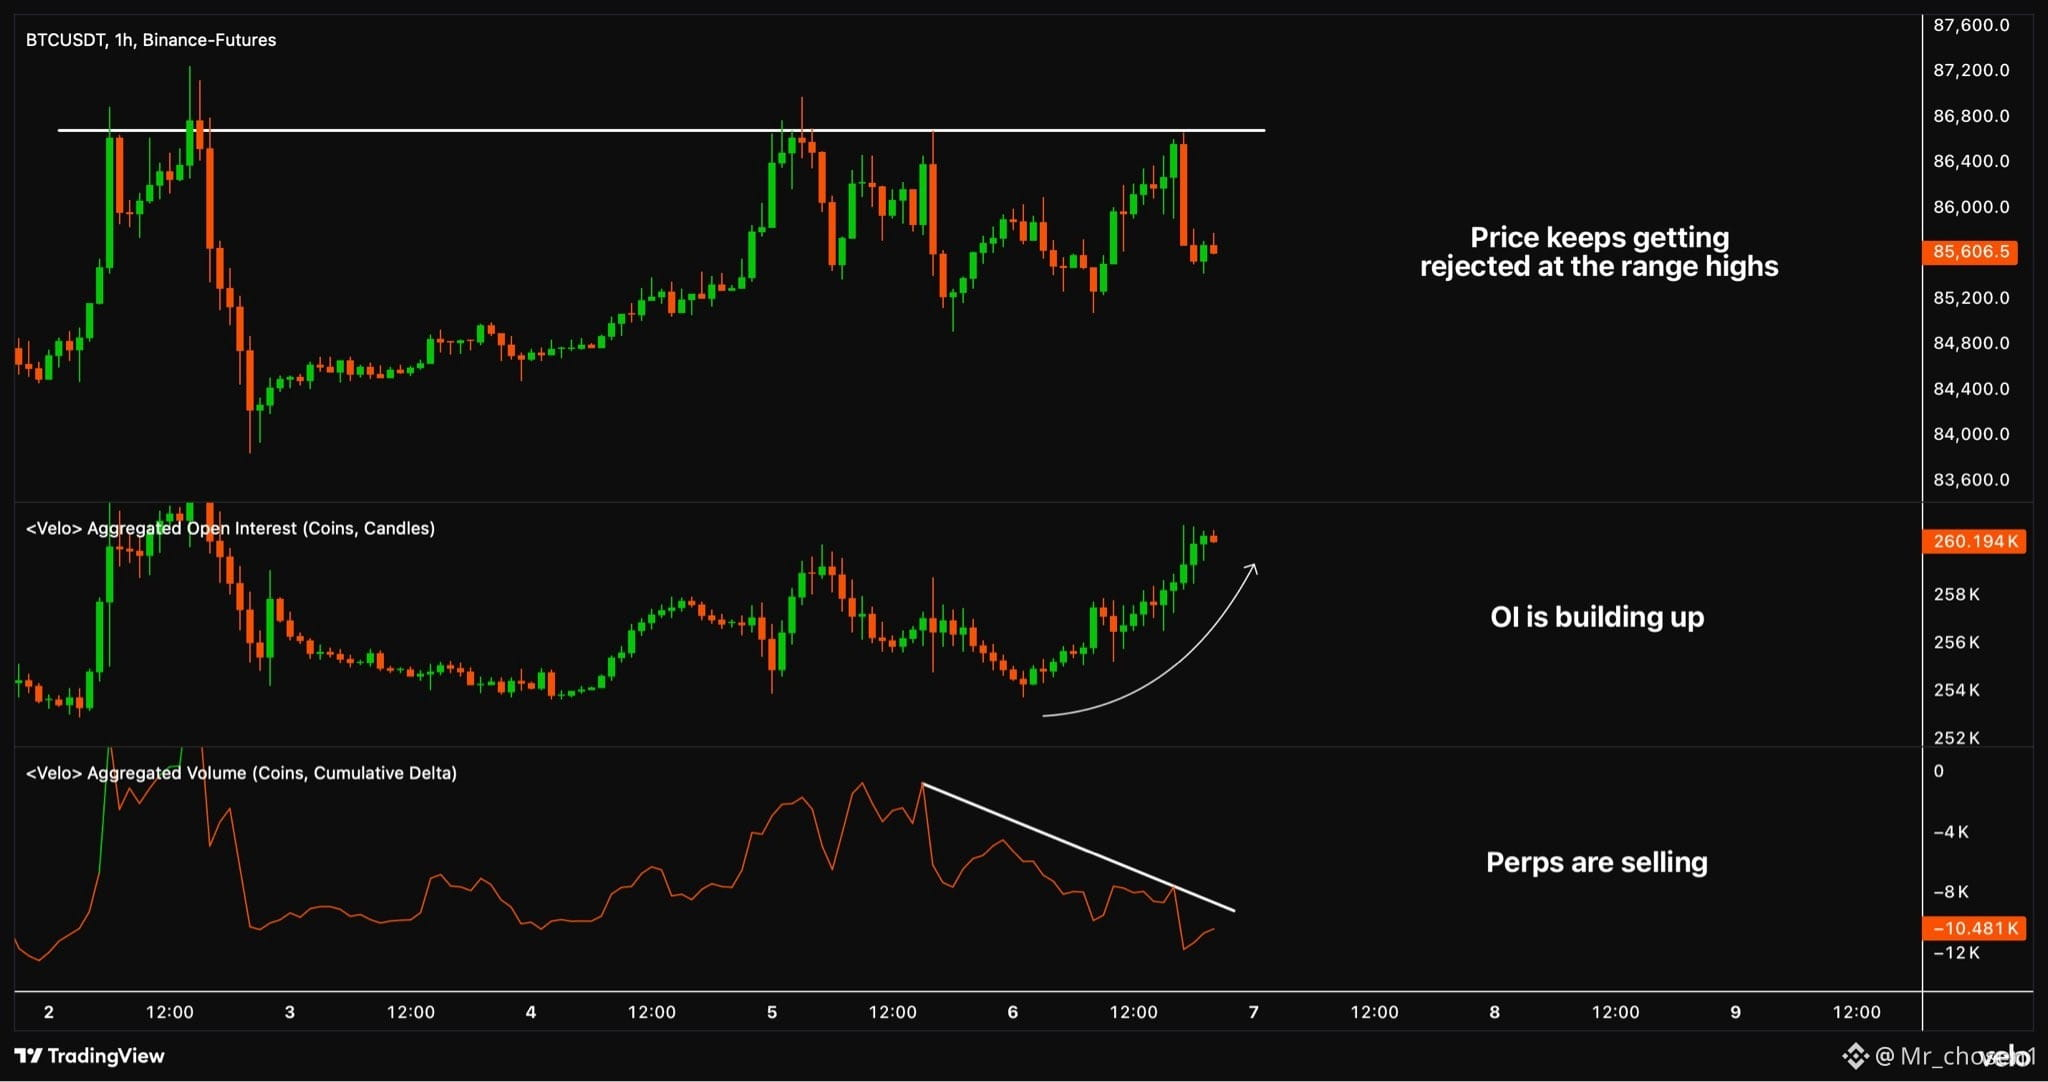
Perps are causing this pullback.
Futures CVD has continued to move lower while open interest has been building up.
This suggests that whenever BTC has pushed into the range highs, perps have stepped in, aggressively increasing the selling pressure.
However, none of these rejections were significant enough to push price back below $85k.
Instead, price always found support around this level and quickly pushed back up towards the highs.
With more shorts continuing to enter the market, they could quickly get squeezed if buyers keep absorbing this selling pressure, potentially fueling another move into the highs or even above them.
$85k therefore remains the line in the sand for me. As long as buyers manage to defend this area, a break above $87k becomes increasingly likely.
$BTC
{spot}(BTCUSDT)
$BTC
Perps are causing this pullback.
Futures CVD has continued to move lower while open interest has been building up.
This suggests that whenever BTC has pushed into the range highs, perps have stepped in, aggressively increasing the selling pressure.
However, none of these rejections were significant enough to push price back below $85k.
Instead, price always found support around this level and quickly pushed back up towards the highs.
With more shorts continuing to enter the market, they could quickly get squeezed if buyers keep absorbing this selling pressure, potentially fueling another move into the highs or even above them.
$85k therefore remains the line in the sand for me. As long as buyers manage to defend this area, a break above $87k becomes increasingly likely.
$BTC
Perps are causing this pullback.
Futures CVD has continued to move lower while open interest has been building up.
This suggests that whenever BTC has pushed into the range highs, perps have stepped in, aggressively increasing the selling pressure.
However, none of these rejections were significant enough to push price back below $85k.
Instead, price always found support around this level and quickly pushed back up towards the highs.
With more shorts continuing to enter the market, they could quickly get squeezed if buyers keep absorbing this selling pressure, potentially fueling another move into the highs or even above them.
$85k therefore remains the line in the sand for me. As long as buyers manage to defend this area, a break above $87k becomes increasingly likely.
$BTC
14
·
--
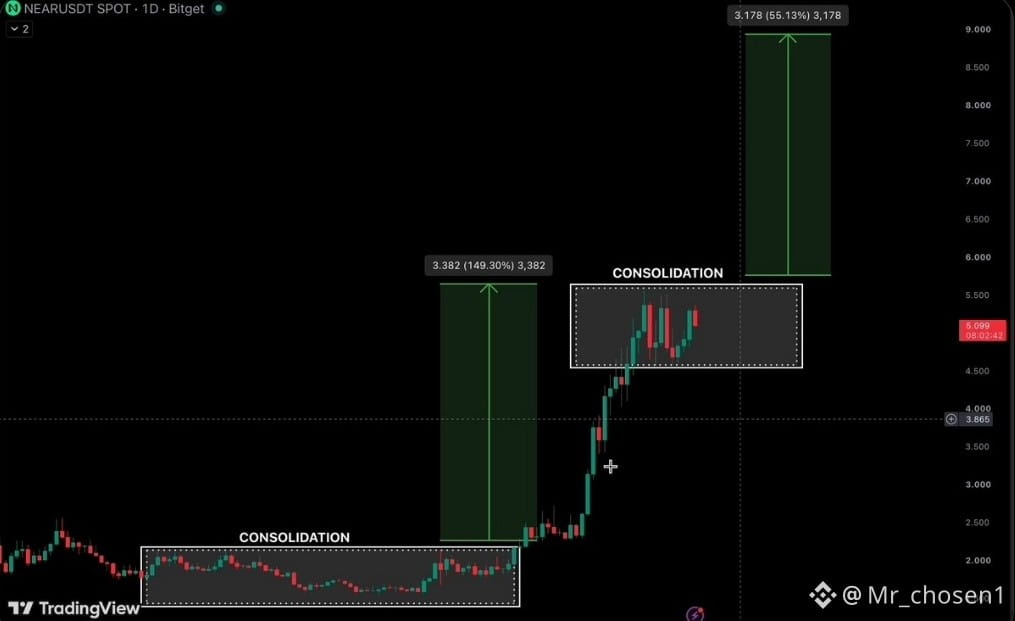
I’m keeping $NEAR on my watchlist.
The structure is pretty clean tbh
→ long consolidation
→ breakout
→ +149% move
→ new consolidation
→ waiting for the next expansion
If buyers finally take $5.6 cleanly, $9 could be our next TP
$NEAR
{spot}(NEARUSDT)
I’m keeping $NEAR on my watchlist.
The structure is pretty clean tbh
→ long consolidation
→ breakout
→ +149% move
→ new consolidation
→ waiting for the next expansion
If buyers finally take $5.6 cleanly, $9 could be our next TP
$NEAR
The structure is pretty clean tbh
→ long consolidation
→ breakout
→ +149% move
→ new consolidation
→ waiting for the next expansion
If buyers finally take $5.6 cleanly, $9 could be our next TP
$NEAR
19
·
--
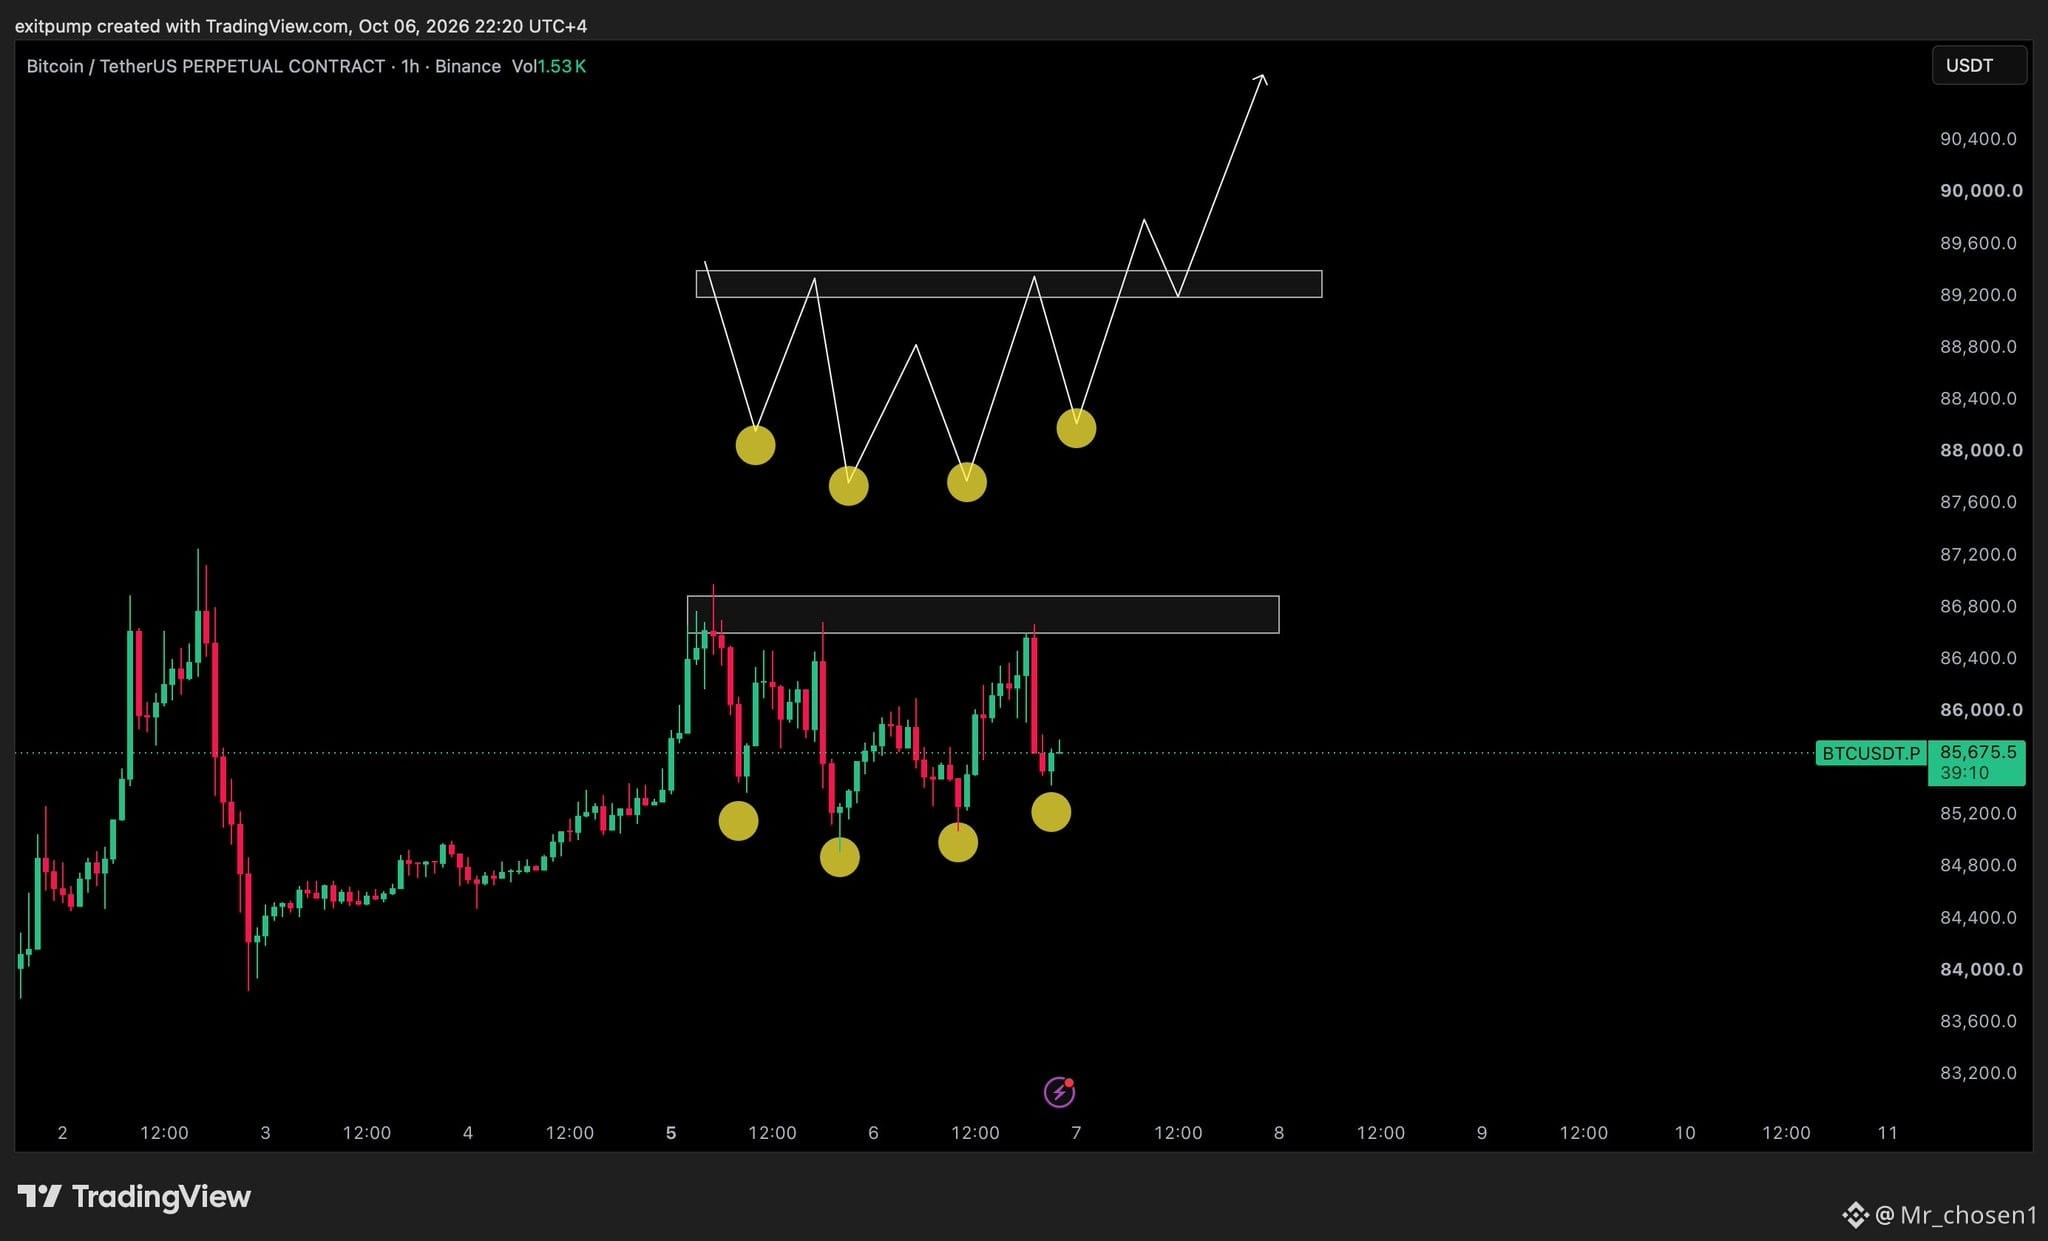
$BTC Lows may hold here, forming an interesting price structure.
$BTC
{spot}(BTCUSDT)
$BTC Lows may hold here, forming an interesting price structure.
$BTC
$BTC
5
·
--
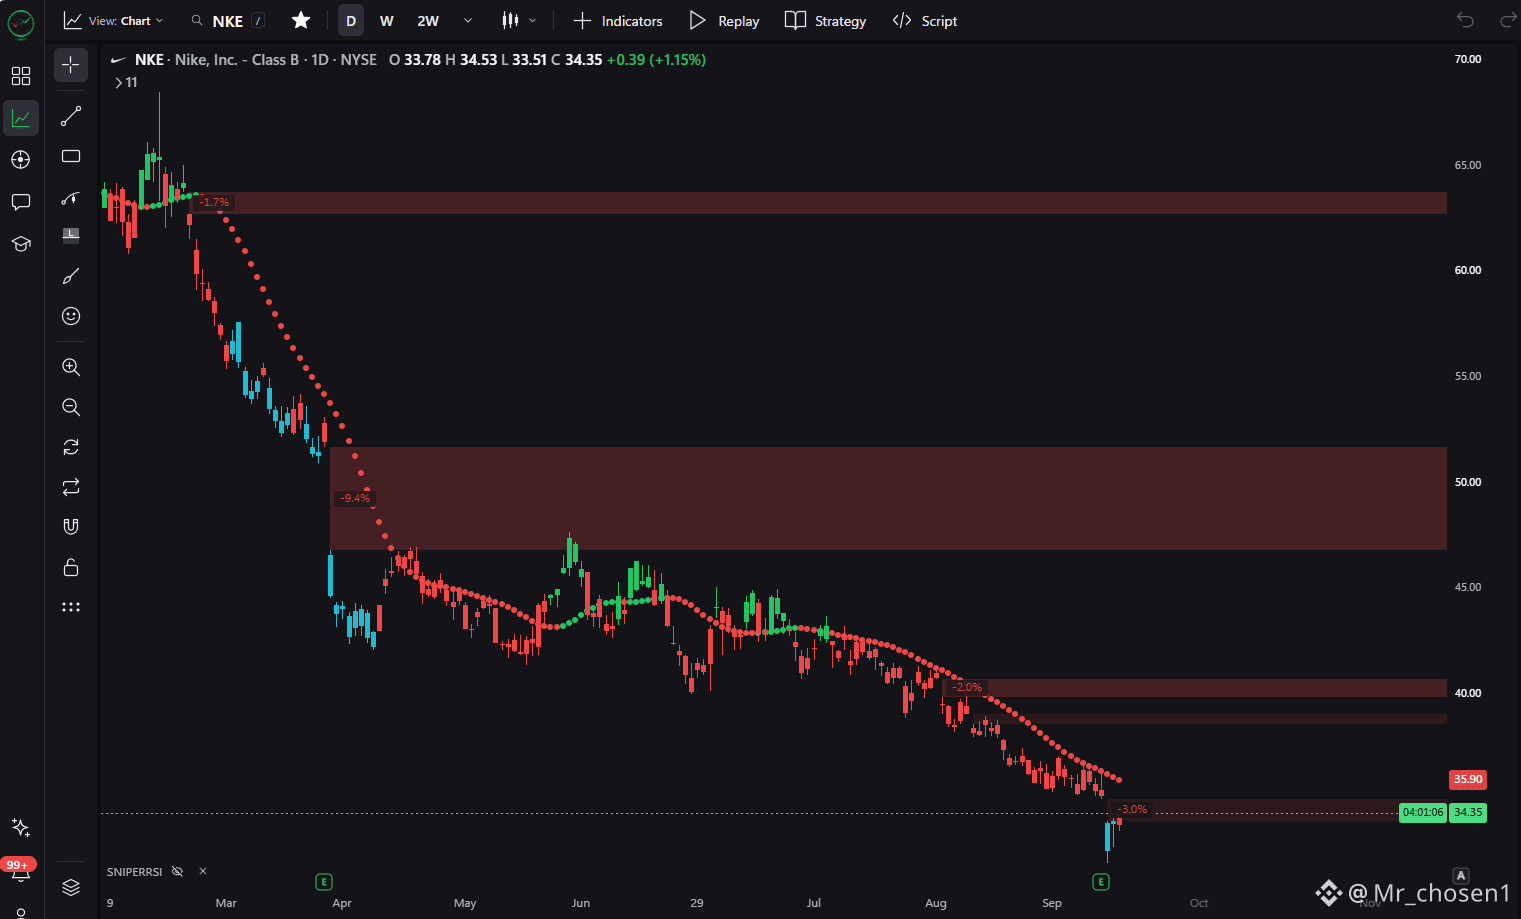
$NKE is still bearish on the daily chart, but what if that was the bottom...
Nike has dropped -82% in the last four years. Price is back to levels not seen since 2013. Oversold candles on every time frame. Gaps above.
I'll wait for a reversal because the dip keeps dipping.
$NKE
{future}(NKEUSDT)
$NKE is still bearish on the daily chart, but what if that was the bottom...
Nike has dropped -82% in the last four years. Price is back to levels not seen since 2013. Oversold candles on every time frame. Gaps above.
I'll wait for a reversal because the dip keeps dipping.
$NKE
Nike has dropped -82% in the last four years. Price is back to levels not seen since 2013. Oversold candles on every time frame. Gaps above.
I'll wait for a reversal because the dip keeps dipping.
$NKE
2
·
--
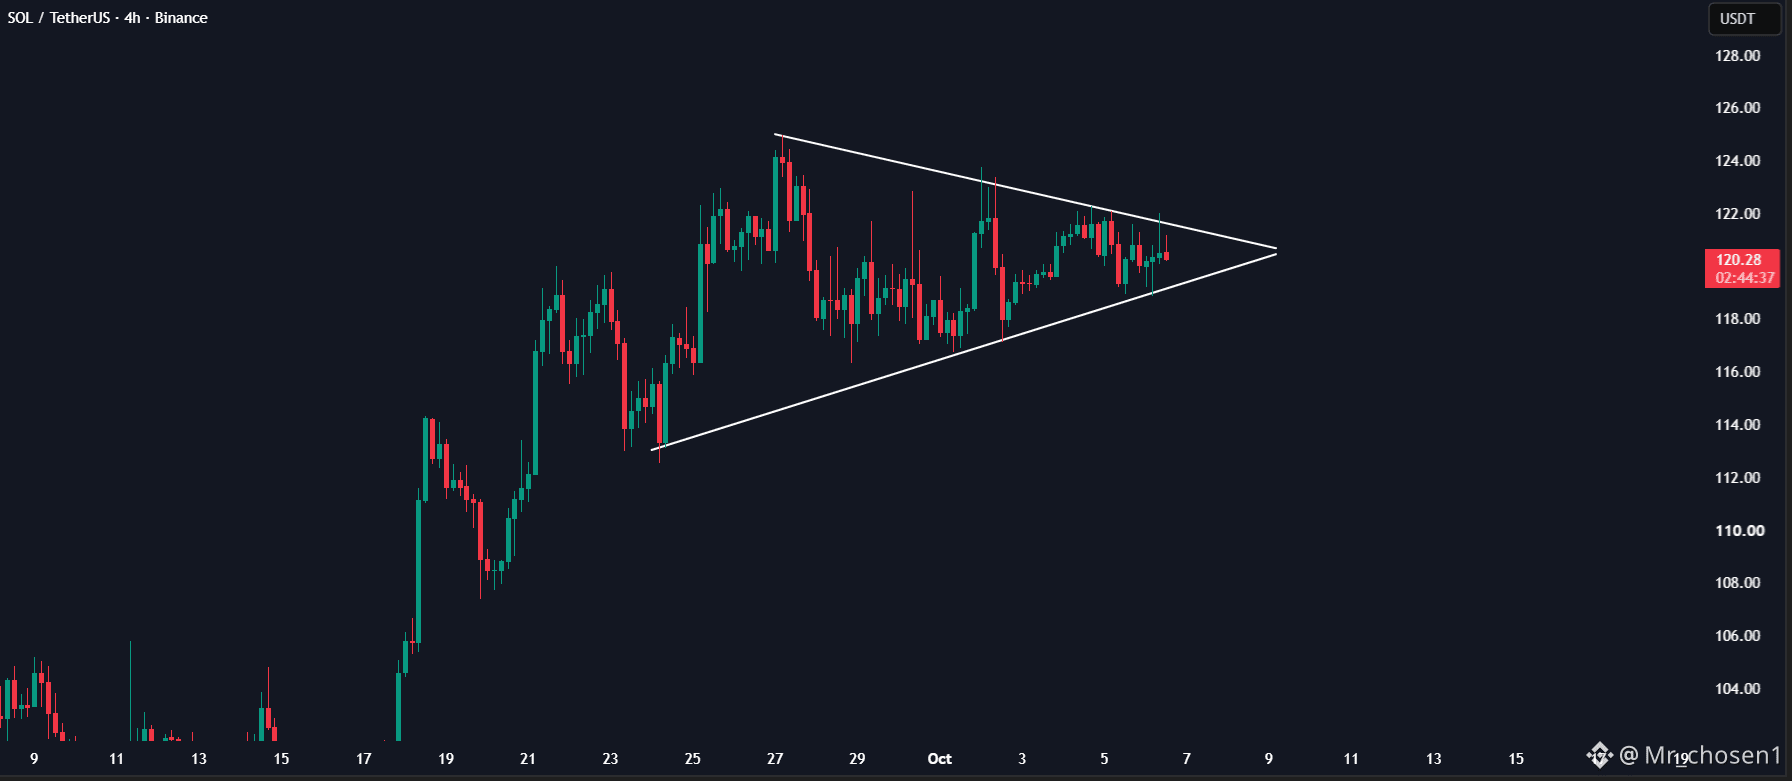
$SOL is forming a tight triangle.
Price is making lower highs and higher lows as the range gets smaller.
No breakout yet. The next move could be close.
$SOL
{spot}(SOLUSDT)
$SOL is forming a tight triangle.
Price is making lower highs and higher lows as the range gets smaller.
No breakout yet. The next move could be close.
$SOL
Price is making lower highs and higher lows as the range gets smaller.
No breakout yet. The next move could be close.
$SOL
32
·
--
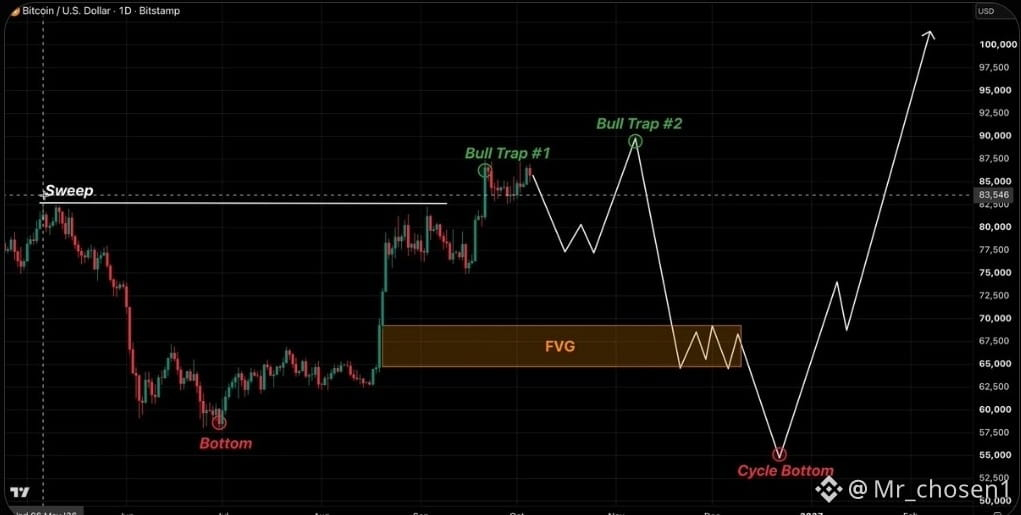
$BTC WILL FAKE YOU OUT AT $90K
A huge cluster is building around $87K and I expect 3 to 5 quiet days before an impulsive push into $90K that fails to close above it
The bottom is probably in for now but the liquidity sitting under $80K still has to get taken
Here is how I see the next few months playing out
> 1 a wick into $90K with no close above it
> 2 a sweep of the key liquidity at $82K, $75K and $70K
> 3 confirmation that the bottom is set
> 4 the real rally starts and $BTC breaks $90K for good
> 5 $100K taken out by Q1 2027
You know the plan now, so do not tell me later I never warned you
$BTC WILL FAKE YOU OUT AT $90K
A huge cluster is building around $87K and I expect 3 to 5 quiet days before an impulsive push into $90K that fails to close above it
The bottom is probably in for now but the liquidity sitting under $80K still has to get taken
Here is how I see the next few months playing out
> 1 a wick into $90K with no close above it
> 2 a sweep of the key liquidity at $82K, $75K and $70K
> 3 confirmation that the bottom is set
> 4 the real rally starts and $BTC breaks $90K for good
> 5 $100K taken out by Q1 2027
You know the plan now, so do not tell me later I never warned you
A huge cluster is building around $87K and I expect 3 to 5 quiet days before an impulsive push into $90K that fails to close above it
The bottom is probably in for now but the liquidity sitting under $80K still has to get taken
Here is how I see the next few months playing out
> 1 a wick into $90K with no close above it
> 2 a sweep of the key liquidity at $82K, $75K and $70K
> 3 confirmation that the bottom is set
> 4 the real rally starts and $BTC breaks $90K for good
> 5 $100K taken out by Q1 2027
You know the plan now, so do not tell me later I never warned you
39
·
--
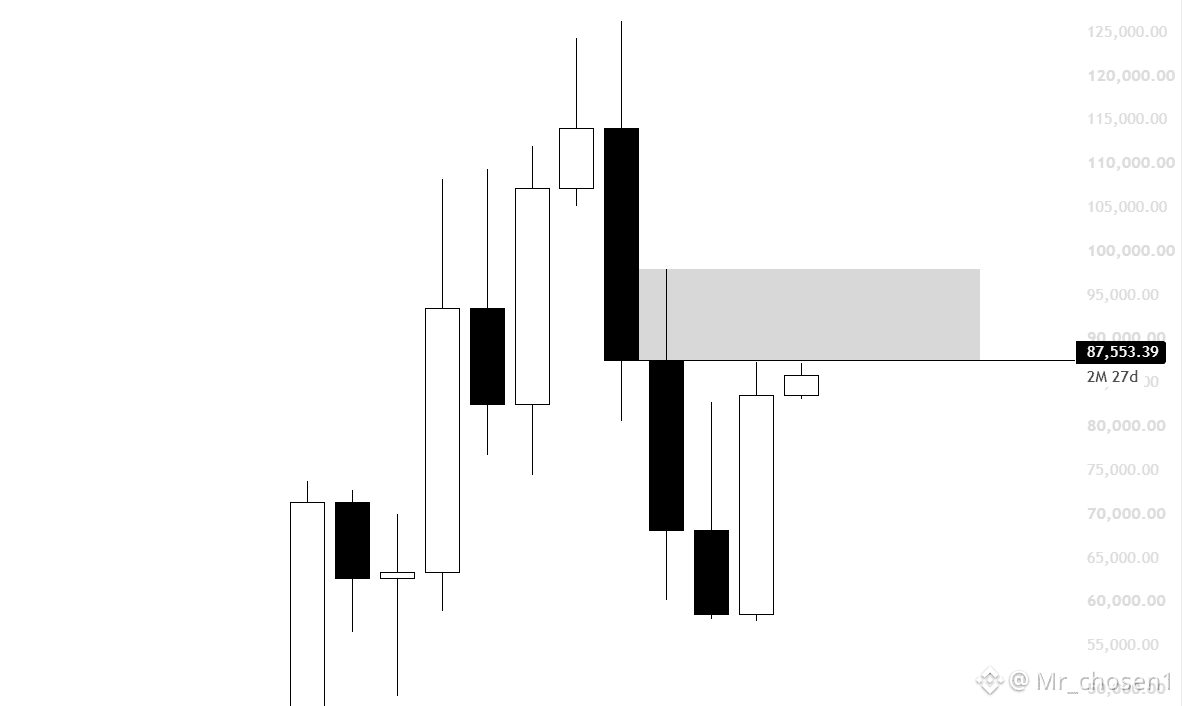
My plan is simple.
We have just had a very strong quarterly close. In my view, there is a 75% chance $BTC sees some form of rejection within this new quarter.
Personally, I have no interest in shorting below the 87.2K highs like many are doing. That is scraping for peanuts.
I prefer positioning for larger moves, and that is where I am most effective. As the quarter develops, I will be watching for deviations into this box to hedge some of my continuation longs.
Other than that, unless we sweep into the area, I am simply not interested in entering.
$BTC
{spot}(BTCUSDT)
My plan is simple.
We have just had a very strong quarterly close. In my view, there is a 75% chance $BTC sees some form of rejection within this new quarter.
Personally, I have no interest in shorting below the 87.2K highs like many are doing. That is scraping for peanuts.
I prefer positioning for larger moves, and that is where I am most effective. As the quarter develops, I will be watching for deviations into this box to hedge some of my continuation longs.
Other than that, unless we sweep into the area, I am simply not interested in entering.
$BTC
We have just had a very strong quarterly close. In my view, there is a 75% chance $BTC sees some form of rejection within this new quarter.
Personally, I have no interest in shorting below the 87.2K highs like many are doing. That is scraping for peanuts.
I prefer positioning for larger moves, and that is where I am most effective. As the quarter develops, I will be watching for deviations into this box to hedge some of my continuation longs.
Other than that, unless we sweep into the area, I am simply not interested in entering.
$BTC
49
·
--
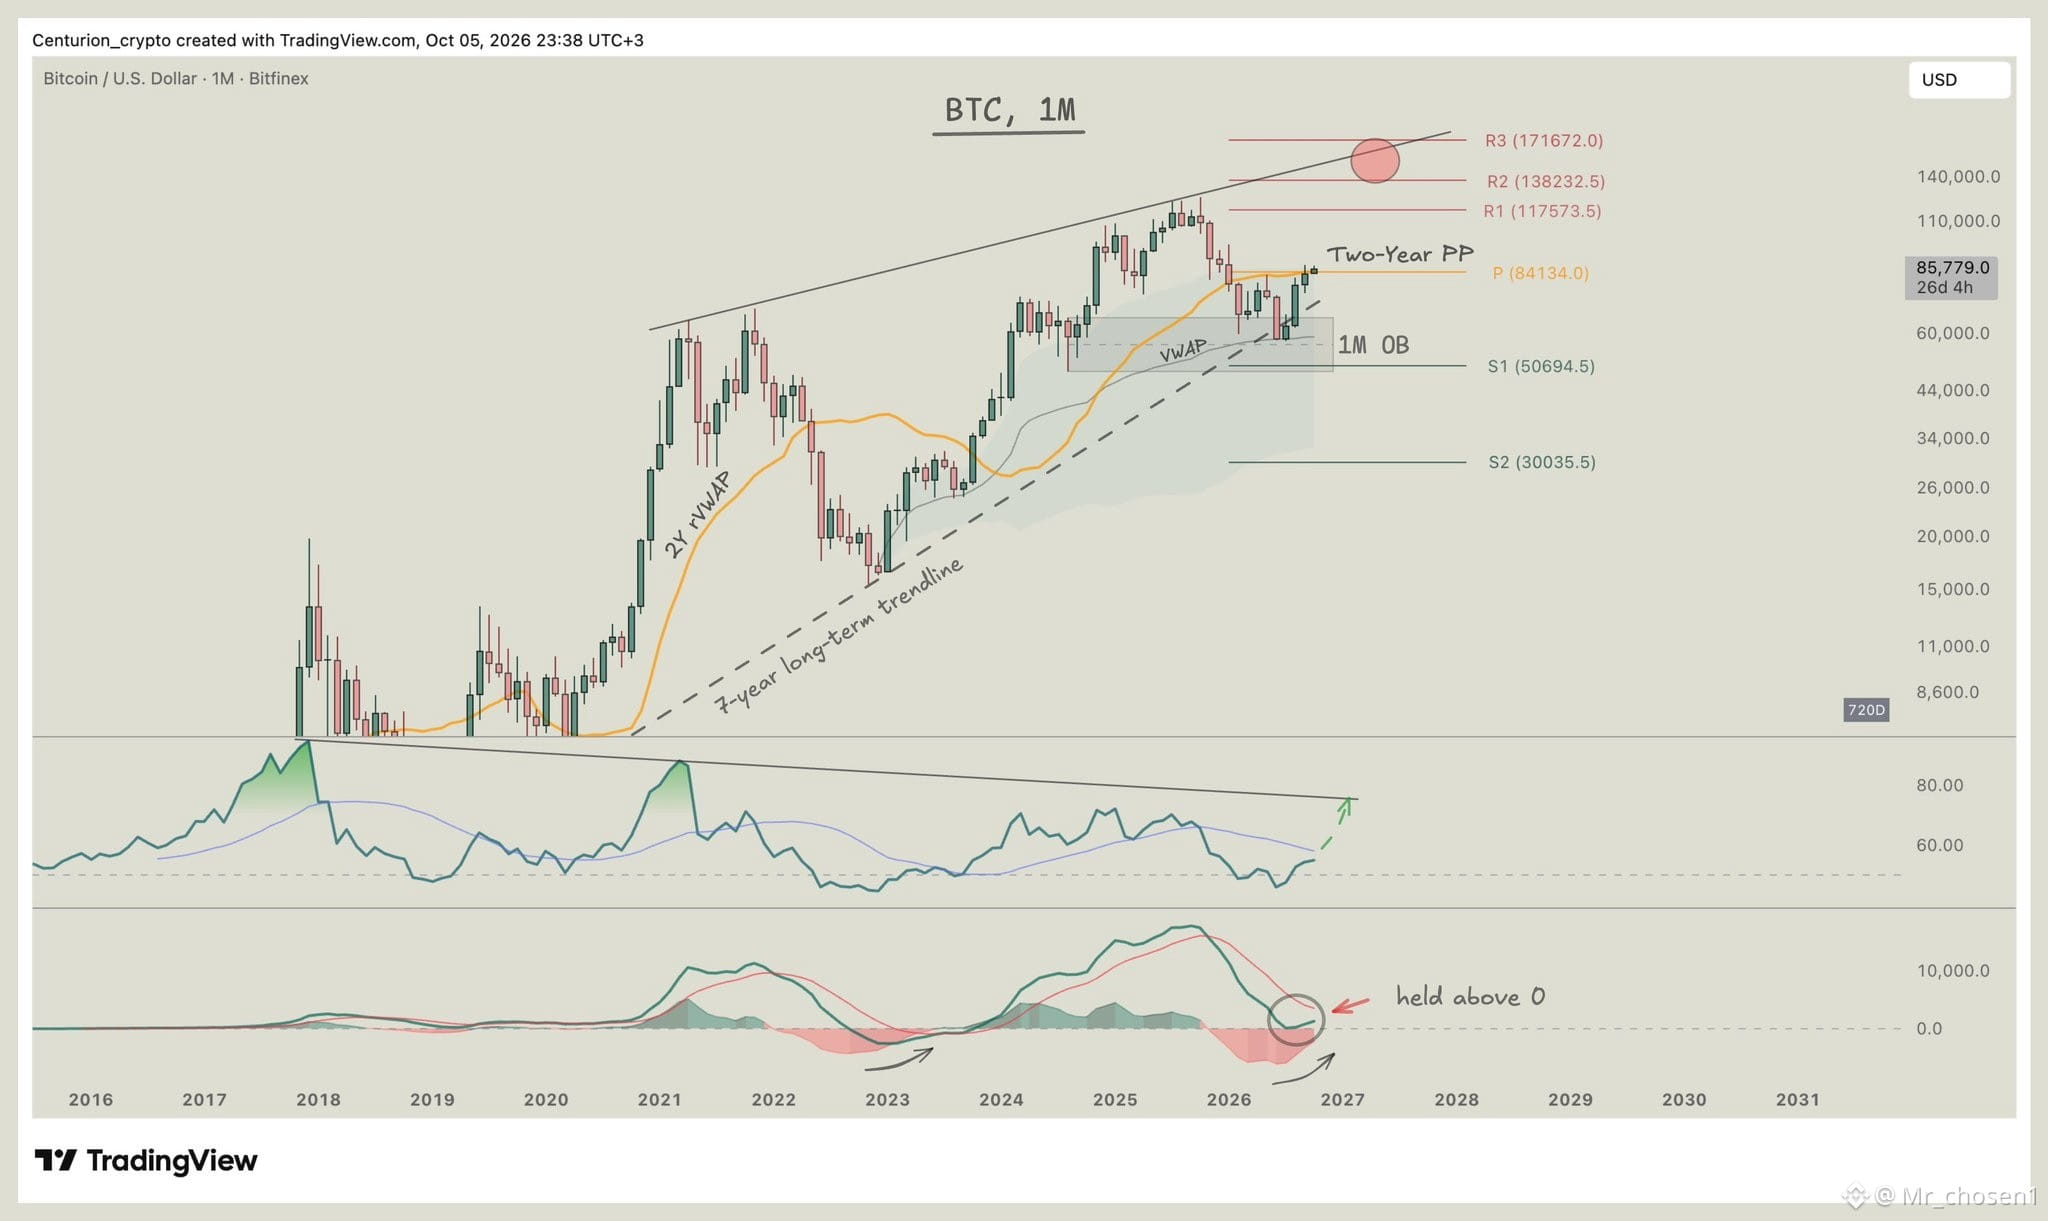
$BTC , 1M
At the moment, price has reclaimed 2Y rVWAP & Two-Year PP 84.1K, and for confirmation we need to see current month close above it. Reclaiming and holding this confluence opens the way toward targets above at R1, R2–R3, where TL is also running
Previously, I presented a number of arguments that increased probability that bottom was in 50–60K area, where we had confluence of supports: long-term 7-year TL, VWAP from '22 uptrend, bullish monthly OB and UO signaling oversold conditions. Now I also want to add that MACD has held the 0 level and is turning up, while RSI has moved back above 50 and is approaching MA again.
$BTC
{spot}(BTCUSDT)
$BTC , 1M
At the moment, price has reclaimed 2Y rVWAP & Two-Year PP 84.1K, and for confirmation we need to see current month close above it. Reclaiming and holding this confluence opens the way toward targets above at R1, R2–R3, where TL is also running
Previously, I presented a number of arguments that increased probability that bottom was in 50–60K area, where we had confluence of supports: long-term 7-year TL, VWAP from '22 uptrend, bullish monthly OB and UO signaling oversold conditions. Now I also want to add that MACD has held the 0 level and is turning up, while RSI has moved back above 50 and is approaching MA again.
$BTC
At the moment, price has reclaimed 2Y rVWAP & Two-Year PP 84.1K, and for confirmation we need to see current month close above it. Reclaiming and holding this confluence opens the way toward targets above at R1, R2–R3, where TL is also running
Previously, I presented a number of arguments that increased probability that bottom was in 50–60K area, where we had confluence of supports: long-term 7-year TL, VWAP from '22 uptrend, bullish monthly OB and UO signaling oversold conditions. Now I also want to add that MACD has held the 0 level and is turning up, while RSI has moved back above 50 and is approaching MA again.
$BTC
65
·
--
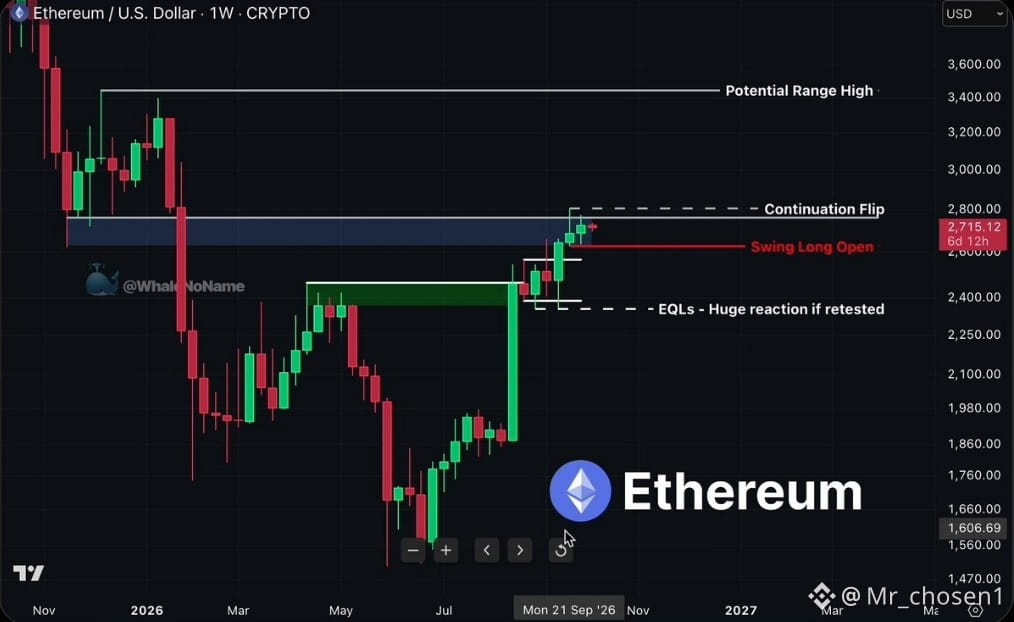
🚨 $ETH HAS FLIPPED THE WEEKLY STRUCTURE
ETH has finally broken the bearish structure and printed a clear CHoCH
The bigger shift is on the weekly chart - structure is now bullish
From here, I’m watching how price behaves around the $2.4K EQLs
A retest of that area would be completely fine and wouldn’t change the bullish setup
The important part is that the new structure holds and buyers keep control
If that remains intact, the main target stays $3K
For now, I’m following the structure
Be sure to FOLLLOW ME not to miss on updates!
$ETH
{spot}(ETHUSDT)
🚨 $ETH HAS FLIPPED THE WEEKLY STRUCTURE
ETH has finally broken the bearish structure and printed a clear CHoCH
The bigger shift is on the weekly chart - structure is now bullish
From here, I’m watching how price behaves around the $2.4K EQLs
A retest of that area would be completely fine and wouldn’t change the bullish setup
The important part is that the new structure holds and buyers keep control
If that remains intact, the main target stays $3K
For now, I’m following the structure
Be sure to FOLLLOW ME not to miss on updates!
$ETH
ETH has finally broken the bearish structure and printed a clear CHoCH
The bigger shift is on the weekly chart - structure is now bullish
From here, I’m watching how price behaves around the $2.4K EQLs
A retest of that area would be completely fine and wouldn’t change the bullish setup
The important part is that the new structure holds and buyers keep control
If that remains intact, the main target stays $3K
For now, I’m following the structure
Be sure to FOLLLOW ME not to miss on updates!
$ETH
81
·
--
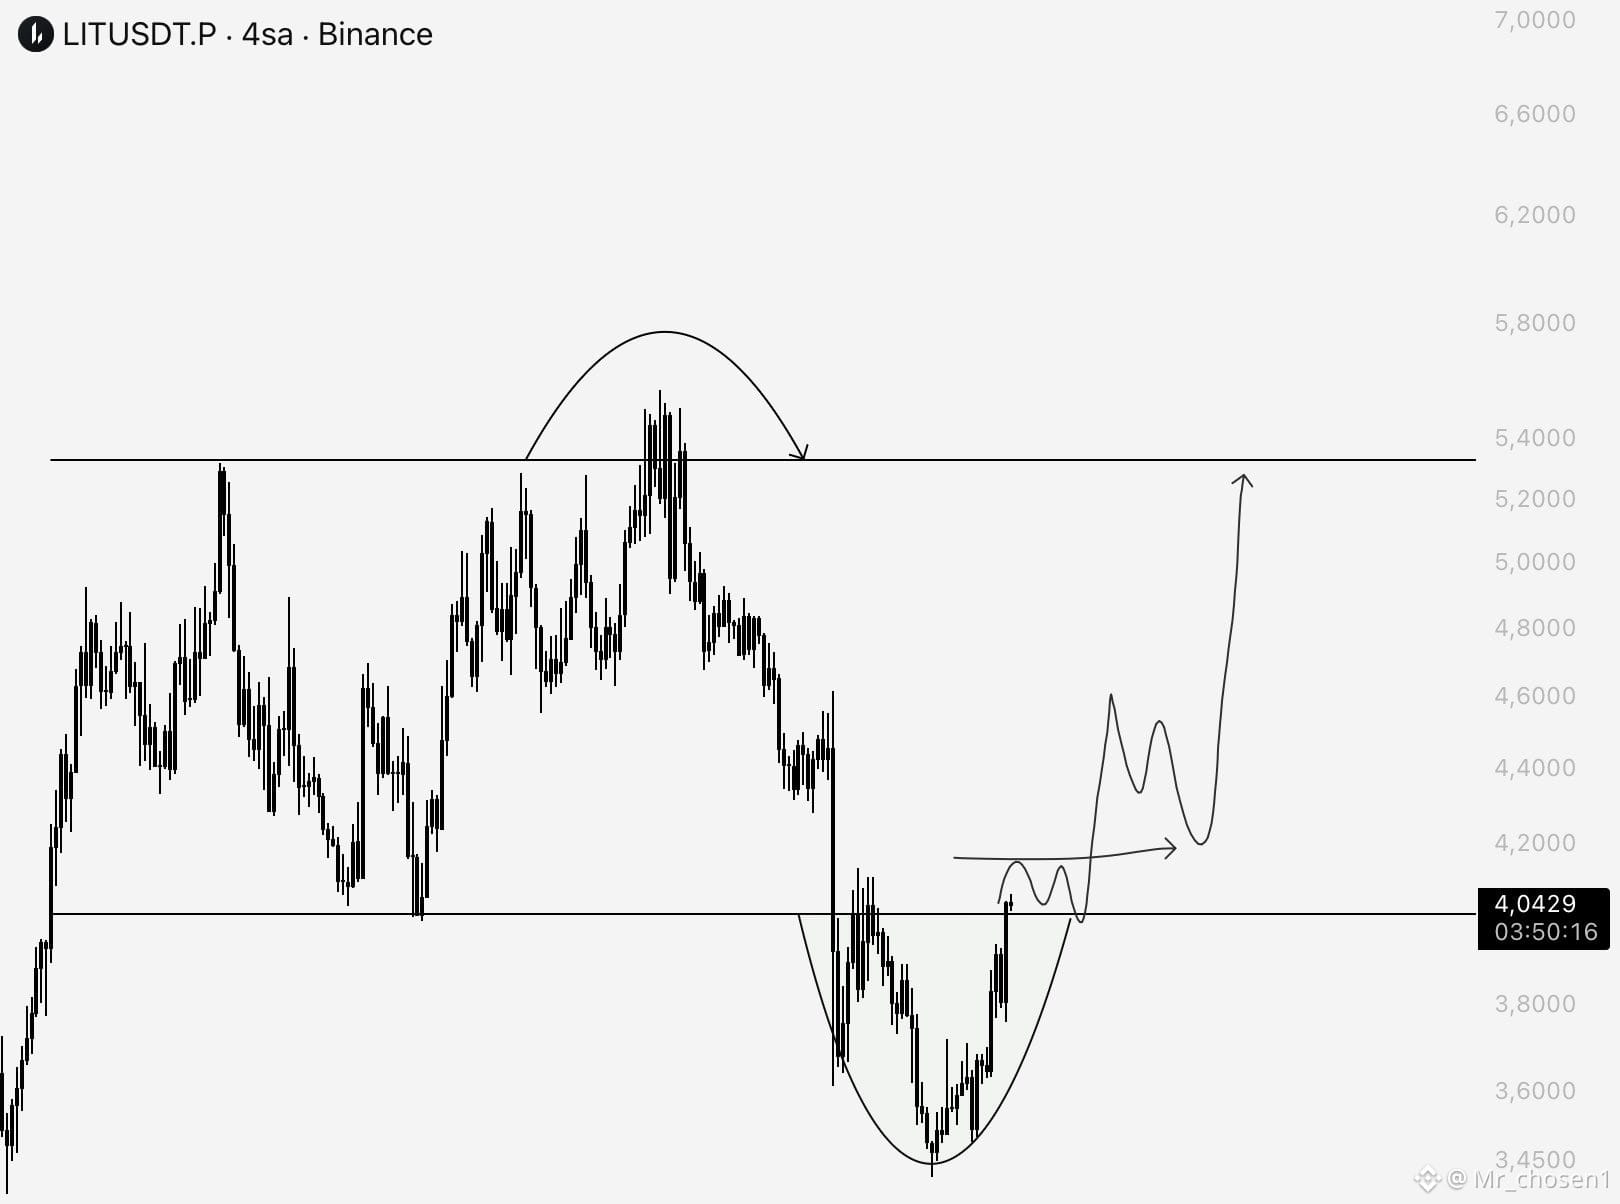
$LIT
If we hold above the $4 level, we can consider the area a manipulation on the 4H timeframe. It’s a chart we’re following.
Many of my charts across the market have reached TP.
Right now, I have almost no trading positions. My risk is close to zero. I have small risks.
I’m not rushing unless the market offers new opportunities. We’re already able to enter at the right levels.
$LIT
{future}(LITUSDT)
$LIT
If we hold above the $4 level, we can consider the area a manipulation on the 4H timeframe. It’s a chart we’re following.
Many of my charts across the market have reached TP.
Right now, I have almost no trading positions. My risk is close to zero. I have small risks.
I’m not rushing unless the market offers new opportunities. We’re already able to enter at the right levels.
$LIT
If we hold above the $4 level, we can consider the area a manipulation on the 4H timeframe. It’s a chart we’re following.
Many of my charts across the market have reached TP.
Right now, I have almost no trading positions. My risk is close to zero. I have small risks.
I’m not rushing unless the market offers new opportunities. We’re already able to enter at the right levels.
$LIT
9
·
--
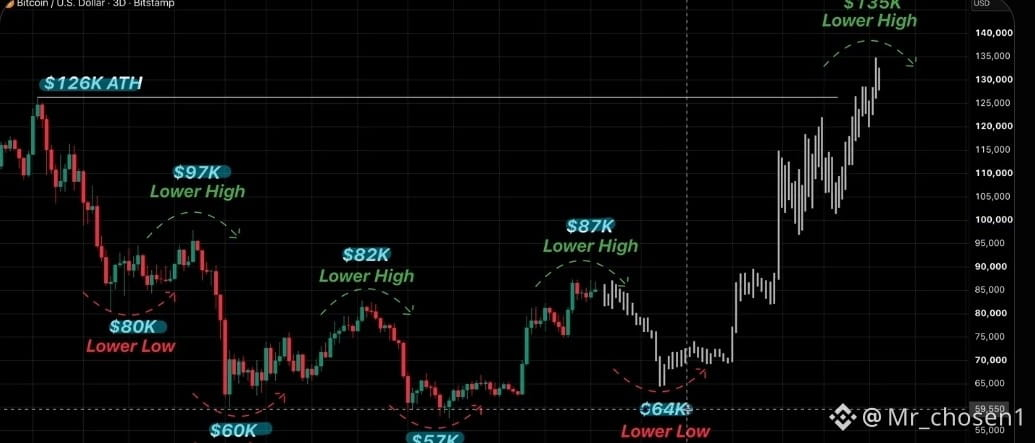
🚨SHORT FCKING $BTC NOW
AND LONG FCKING $BTC IN 30 DAYS
I flagged this fakeout a few days ago and it is playing out exactly how I said it would
The bull trap is almost finished and my plan has not changed once
$85K -> $81K -> $78K -> $75K -> $70K
Save this chart and check back in a few days
For anyone new here, I called the $17K bottom in 2022 and the $126K top in 2025
Then I called the $58K bottom this year
My next call drops here before anywhere else
Follow and turn notifs on
🚨SHORT FCKING $BTC NOW
AND LONG FCKING $BTC IN 30 DAYS
I flagged this fakeout a few days ago and it is playing out exactly how I said it would
The bull trap is almost finished and my plan has not changed once
$85K -> $81K -> $78K -> $75K -> $70K
Save this chart and check back in a few days
For anyone new here, I called the $17K bottom in 2022 and the $126K top in 2025
Then I called the $58K bottom this year
My next call drops here before anywhere else
Follow and turn notifs on
AND LONG FCKING $BTC IN 30 DAYS
I flagged this fakeout a few days ago and it is playing out exactly how I said it would
The bull trap is almost finished and my plan has not changed once
$85K -> $81K -> $78K -> $75K -> $70K
Save this chart and check back in a few days
For anyone new here, I called the $17K bottom in 2022 and the $126K top in 2025
Then I called the $58K bottom this year
My next call drops here before anywhere else
Follow and turn notifs on
11
·
--
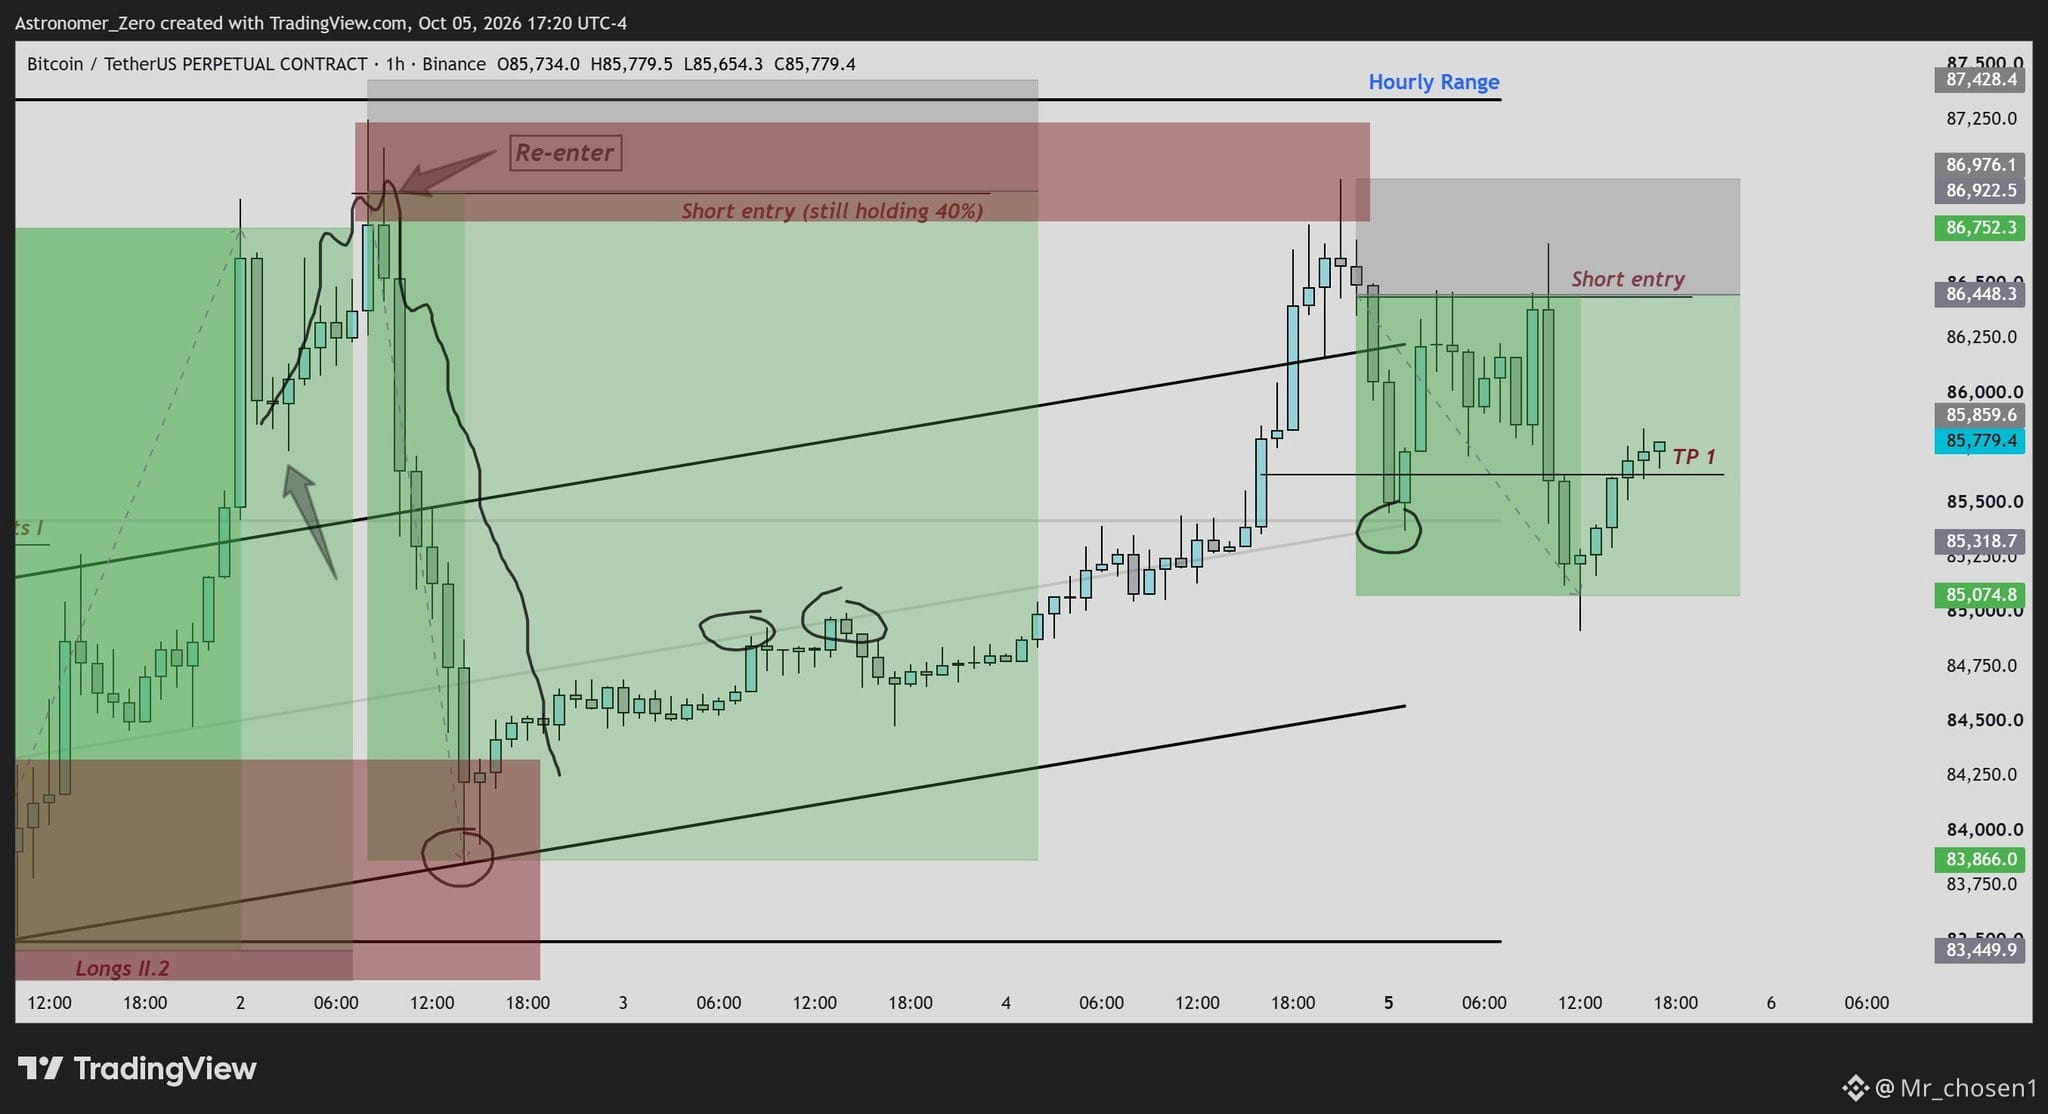
$BTC shorts
More downside achieved.
Talked about why Yesterday.
Also touched the entry for another test of the short.
Test succeeded and another excellent example as to why to never set SL BE.
$BTC
{spot}(BTCUSDT)
$BTC shorts
More downside achieved.
Talked about why Yesterday.
Also touched the entry for another test of the short.
Test succeeded and another excellent example as to why to never set SL BE.
$BTC
More downside achieved.
Talked about why Yesterday.
Also touched the entry for another test of the short.
Test succeeded and another excellent example as to why to never set SL BE.
$BTC
7
·
--
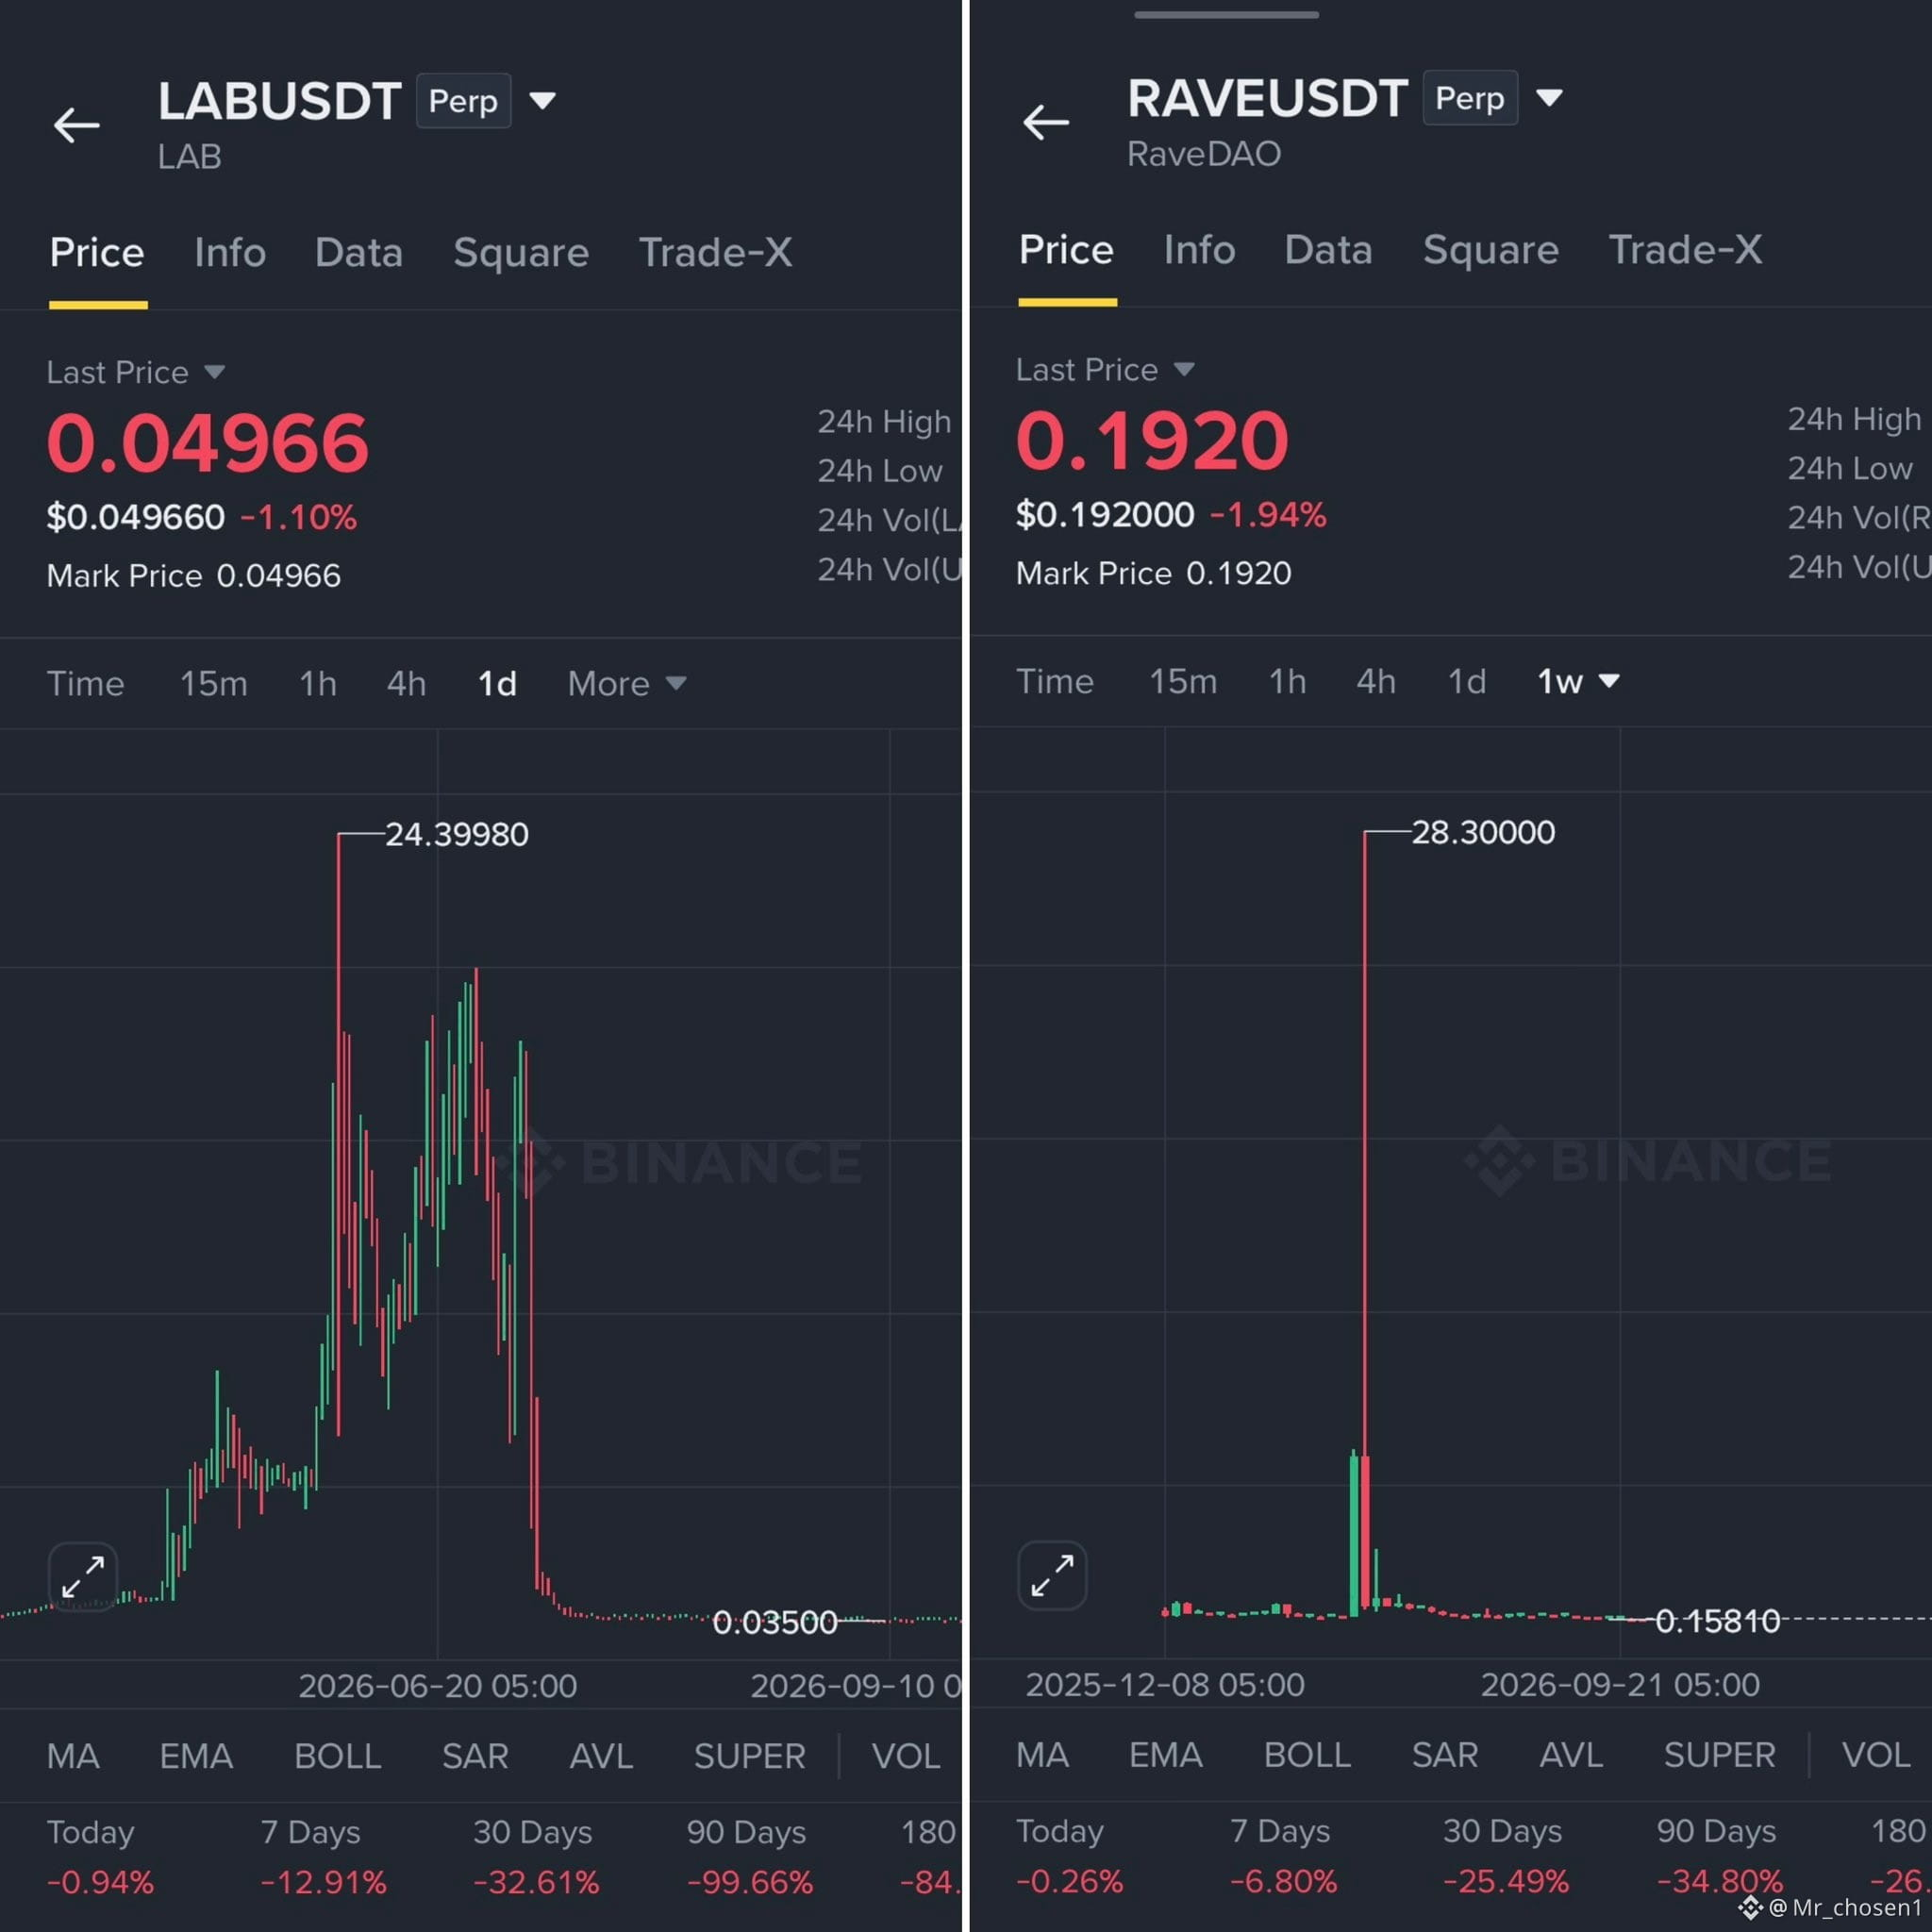
Even if you are expecting 10x from $LAB , this is still not the right time to buy.
There is no clear recovery on the chart yet, same with $RAVE .
A coin being down 90% or 99% does not mean bottom is confirmed. It can stay there for weeks, or dump more.
First let price show some strength, break the downtrend and hold the recovery. Then think about buying.
Catching the exact bottom sounds good, but waiting for confirmation is much safer.
Even if you are expecting 10x from $LAB , this is still not the right time to buy.
There is no clear recovery on the chart yet, same with $RAVE .
A coin being down 90% or 99% does not mean bottom is confirmed. It can stay there for weeks, or dump more.
First let price show some strength, break the downtrend and hold the recovery. Then think about buying.
Catching the exact bottom sounds good, but waiting for confirmation is much safer.
There is no clear recovery on the chart yet, same with $RAVE .
A coin being down 90% or 99% does not mean bottom is confirmed. It can stay there for weeks, or dump more.
First let price show some strength, break the downtrend and hold the recovery. Then think about buying.
Catching the exact bottom sounds good, but waiting for confirmation is much safer.
2
·
--
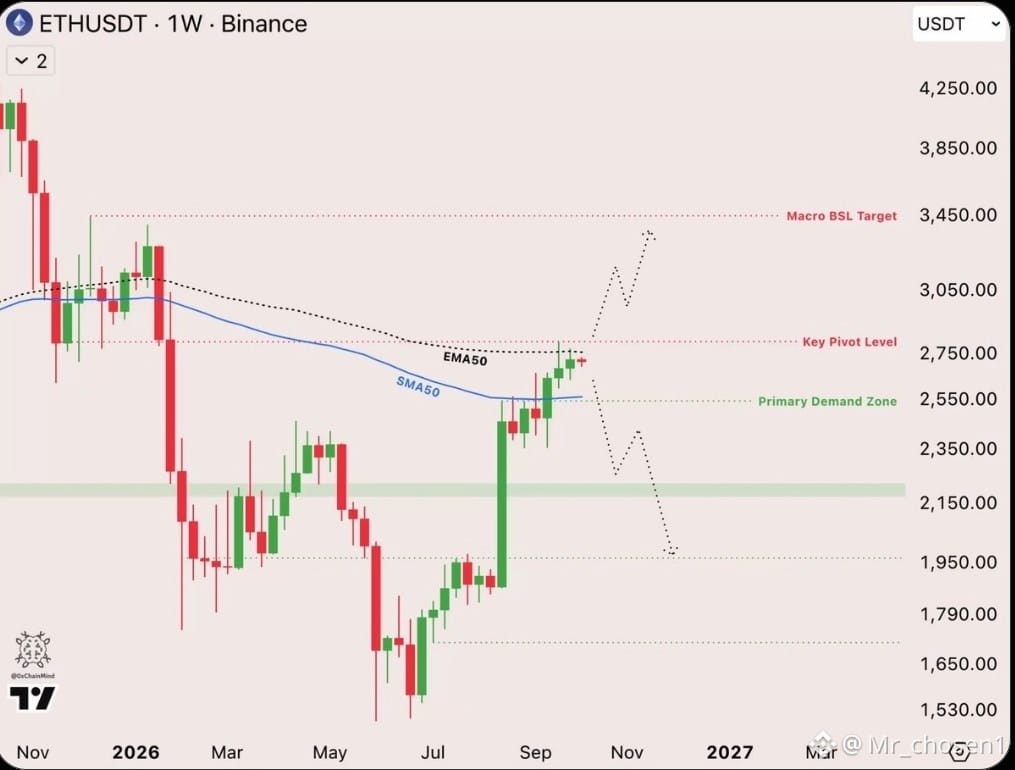
Interesting how $ETH is holding here
We just closed the week at the highest level in 8 months
Close above 2.8K now and the Macro BSL target at 3,450 opens up
Everything hinges on holding this weekly close.
$ETH
{spot}(ETHUSDT)
Interesting how $ETH is holding here
We just closed the week at the highest level in 8 months
Close above 2.8K now and the Macro BSL target at 3,450 opens up
Everything hinges on holding this weekly close.
$ETH
We just closed the week at the highest level in 8 months
Close above 2.8K now and the Macro BSL target at 3,450 opens up
Everything hinges on holding this weekly close.
$ETH
5
·
--
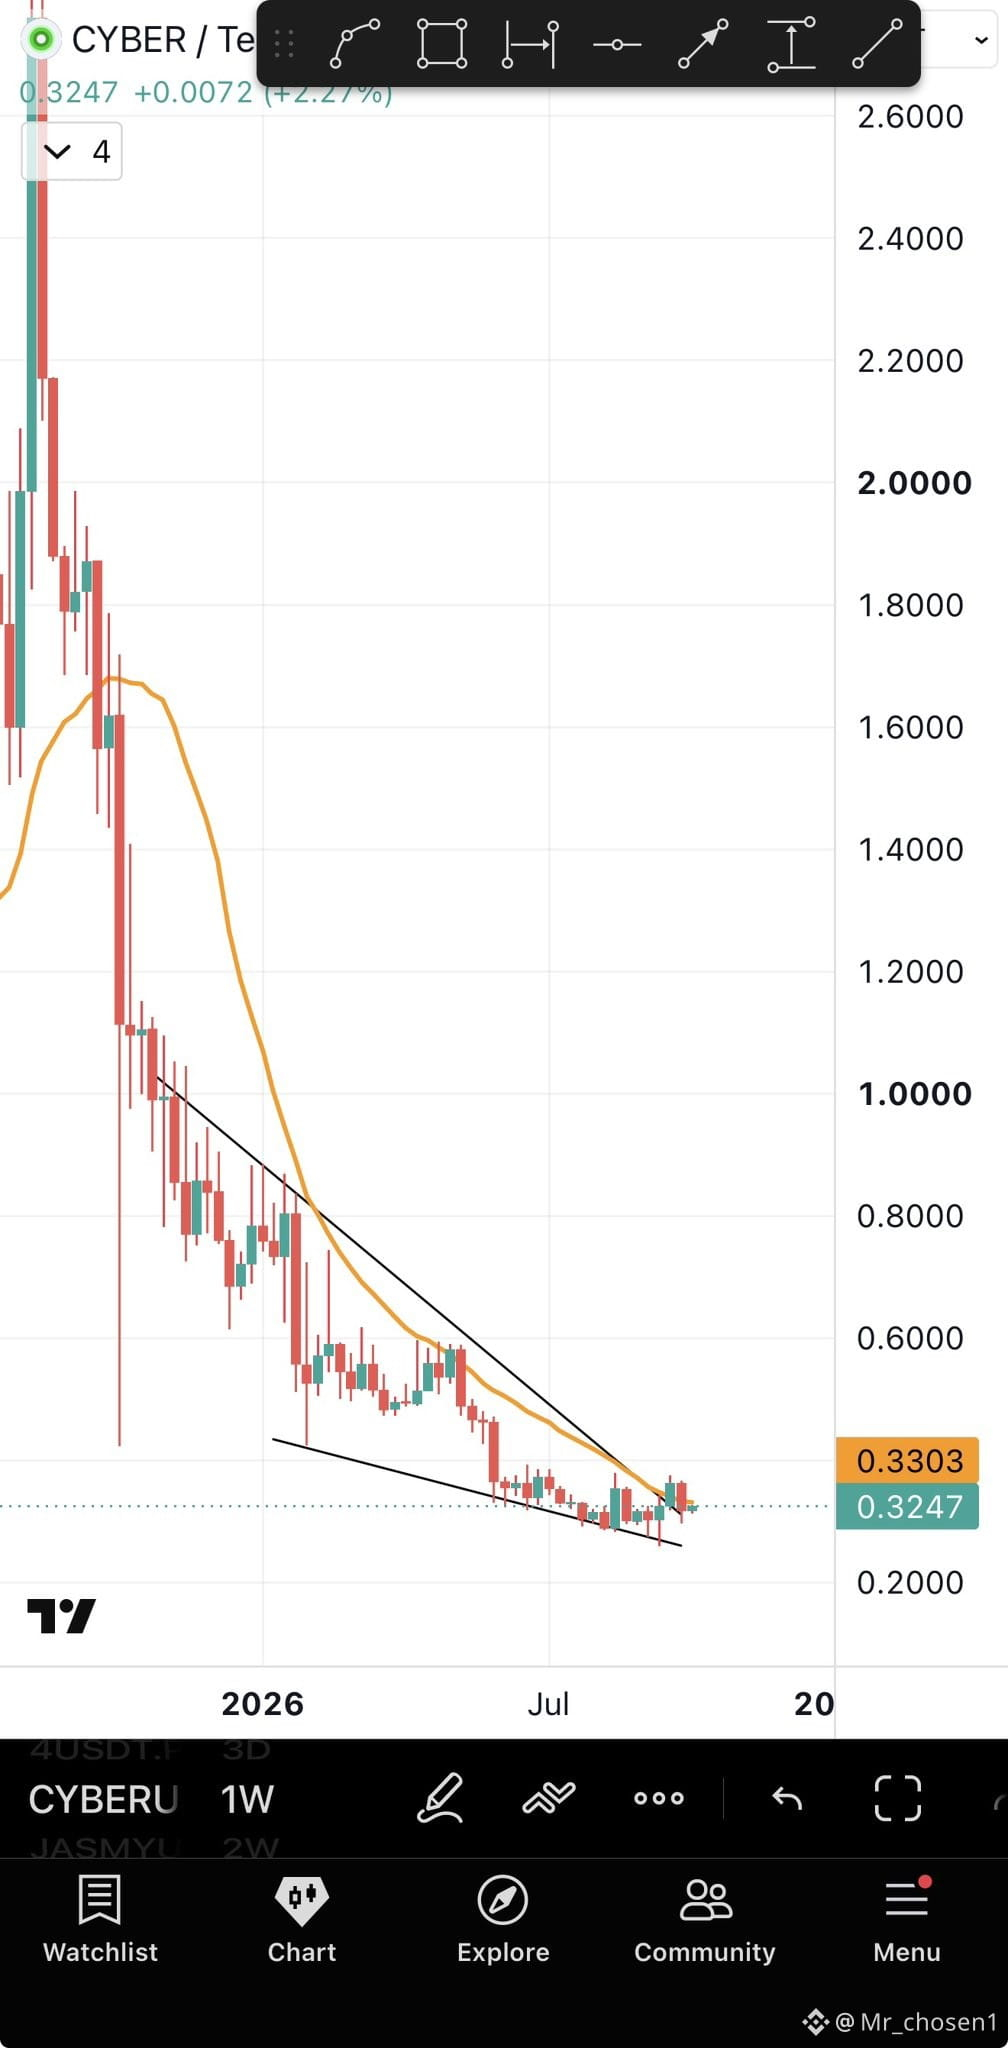
$CYBER is bullish here. I personally love retest entries & I will use this retest to add more. It will move up from here.
$CYBER
{spot}(CYBERUSDT)
$CYBER is bullish here. I personally love retest entries & I will use this retest to add more. It will move up from here.
$CYBER
$CYBER
3
·
--
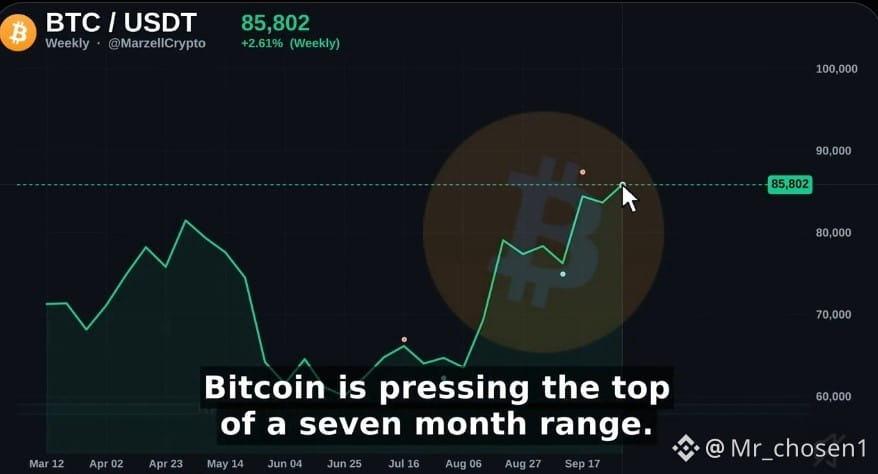
$BTC is pressing the top of a seven month range. $87.4K has rejected it three times in two weeks, and it's back at $85.8K right underneath.
On the weekly the range runs $57.8K to $87.4K with value at $72.6K. A close above $87.4K points at the $102K measured move.
As long as $76K holds I think $87.4K gets taken out. Lose it and the September breakout is in question.
Not financial advice.
$BTC
{spot}(BTCUSDT)
$BTC is pressing the top of a seven month range. $87.4K has rejected it three times in two weeks, and it's back at $85.8K right underneath.
On the weekly the range runs $57.8K to $87.4K with value at $72.6K. A close above $87.4K points at the $102K measured move.
As long as $76K holds I think $87.4K gets taken out. Lose it and the September breakout is in question.
Not financial advice.
$BTC
On the weekly the range runs $57.8K to $87.4K with value at $72.6K. A close above $87.4K points at the $102K measured move.
As long as $76K holds I think $87.4K gets taken out. Lose it and the September breakout is in question.
Not financial advice.
$BTC
16
·
--
$BTC
This is actually insane.
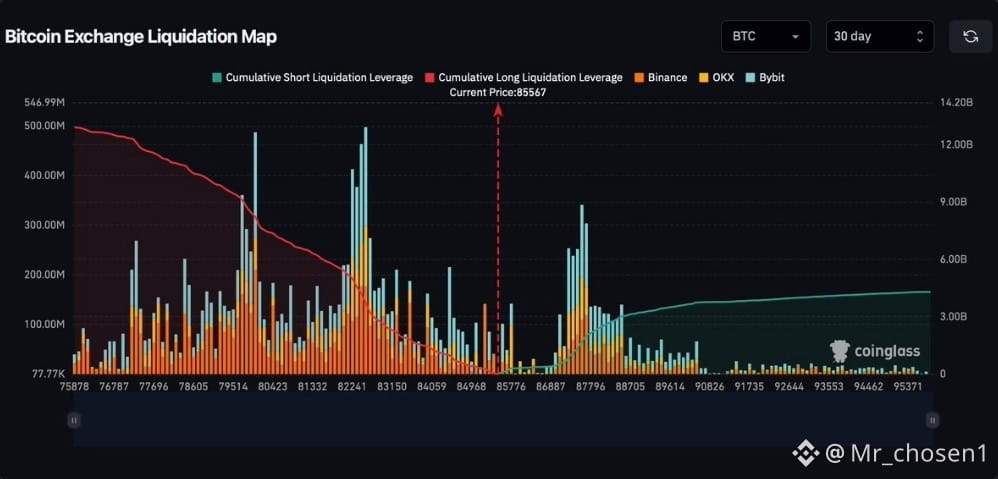
The current liquidation map shows one of the most significant imbalances between long and short liquidations we’ve seen in a while.
There are roughly $13B in long liquidations sitting below price, compared to only around $4B in short liquidations above.
That creates an imbalance of more than 3:1.
From a liquidity perspective, another move lower would therefore make a lot of sense.
That way, BTC could clear out a massive amount of downside liquidity while allowing short liquidations to build back up before the next larger expansion to the upside begins.
$BTC
{spot}(BTCUSDT)
$BTC
This is actually insane.
The current liquidation map shows one of the most significant imbalances between long and short liquidations we’ve seen in a while.
There are roughly $13B in long liquidations sitting below price, compared to only around $4B in short liquidations above.
That creates an imbalance of more than 3:1.
From a liquidity perspective, another move lower would therefore make a lot of sense.
That way, BTC could clear out a massive amount of downside liquidity while allowing short liquidations to build back up before the next larger expansion to the upside begins.
$BTC
This is actually insane.
The current liquidation map shows one of the most significant imbalances between long and short liquidations we’ve seen in a while.
There are roughly $13B in long liquidations sitting below price, compared to only around $4B in short liquidations above.
That creates an imbalance of more than 3:1.
From a liquidity perspective, another move lower would therefore make a lot of sense.
That way, BTC could clear out a massive amount of downside liquidity while allowing short liquidations to build back up before the next larger expansion to the upside begins.
$BTC
15
·
--
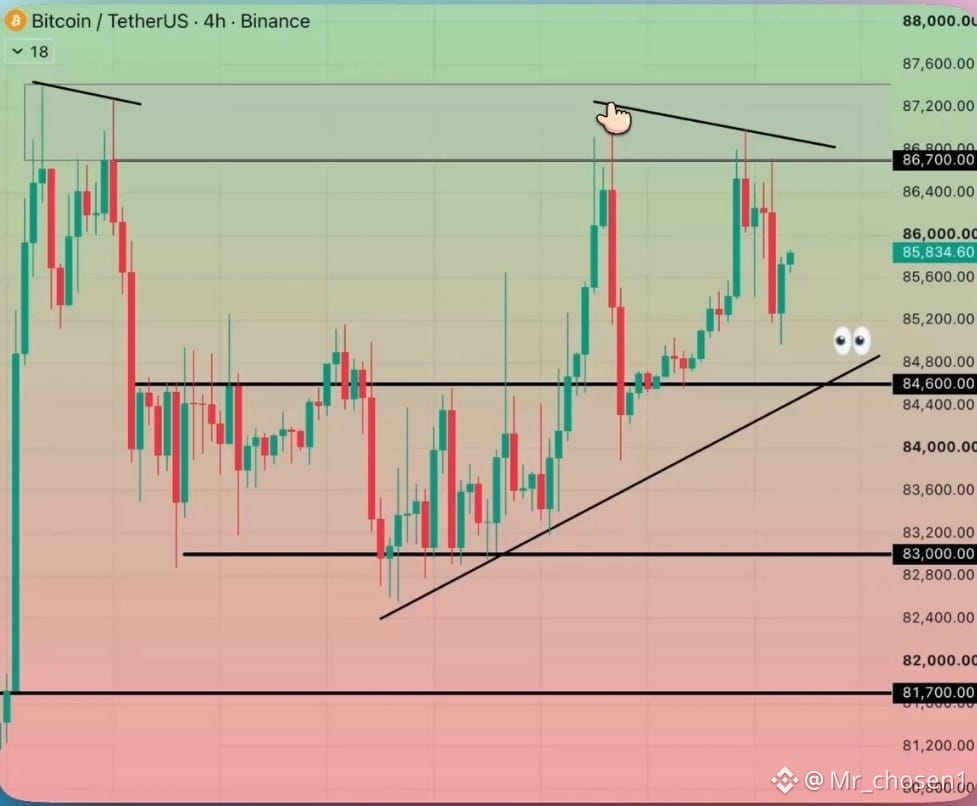
$BTC is printing higher lows over and over
not gonna lie, I'm not a huge fan of the rejections around 87k and the wicks we keep leaving up there
but the latest pullbacks can’t even reach the local ascending trendline - buyers are still in full control and not showing any sign of backing down, at least for now
still not seeing a single valid reason to look for shorts. trend is your friend, and across all timeframes it’s strictly up
or am I wrong?
$BTC
{spot}(BTCUSDT)
$BTC is printing higher lows over and over
not gonna lie, I'm not a huge fan of the rejections around 87k and the wicks we keep leaving up there
but the latest pullbacks can’t even reach the local ascending trendline - buyers are still in full control and not showing any sign of backing down, at least for now
still not seeing a single valid reason to look for shorts. trend is your friend, and across all timeframes it’s strictly up
or am I wrong?
$BTC
not gonna lie, I'm not a huge fan of the rejections around 87k and the wicks we keep leaving up there
but the latest pullbacks can’t even reach the local ascending trendline - buyers are still in full control and not showing any sign of backing down, at least for now
still not seeing a single valid reason to look for shorts. trend is your friend, and across all timeframes it’s strictly up
or am I wrong?
$BTC
15
Connectez-vous pour découvrir plus de contenu
Rejoignez la communauté mondiale des adeptes de cryptomonnaies sur Binance Square
⚡️ Suviez les dernières informations importantes sur les cryptomonnaies.
💬 Jugé digne de confiance par la plus grande plateforme d’échange de cryptomonnaies au monde.
👍 Découvrez les connaissances que partagent les créateurs vérifiés.
Adresse e-mail/Nº de téléphone
Sujets d’actualité
BinanceLaunchesBinanceIntelligence
658,588 vues
4,059 mentions
#binancelaunchesbinanceintelligence 🚨 WHAT IF THE NEXT BIG EXCHANGE BATTLE ISN’T ABOUT FEES? 👀
Binance just made a bigger move than adding another AI chatbot.
With Binance Intelligence, AI is moving deeper into the exchange — from understanding market data to building trading workflows. 🤖⚡
The real question is:
Who has the best liquidity?
Or who has the smartest AI layer?
If users can research, test ideas and manage trading workflows without switching between different tools, the exchange itself could become a financial assistant.
That could be a much bigger shift than it looks today.
If Binance Intelligence drives more users, more strategies and more trading activity, $BNB could become one of the tokens to watch. 👀
Is Binance building the future of AI-powered finance?
$BNB
#binancelaunchesbinanceintelligence #BinanceAI #CryptoAI #AITrading
Suleman Khan Haqqani
·9 mentions J’aime
·13.2k vues
BTCFallsBelow$84K
12,738 vues
50 mentions
DubaiVARAIssuesReserveAssetAuditCircular
438 vues
81 mentions