
BlockchainReporter
27.7k Publications

BlockchainReporter
 Compte Square Vérifié+
Signaler
Bloquer l’utilisateur
The World's Page on Emerging Tech | Cryptocurrencies | Bitcoin | Blockchain | NFT | blockchainreporter.net
2 Suivis
41.9K+ Abonnés
180.0K+ J’aime
Publications
US Treasury Names Crypto Processor in Iran Sanctions SweepThe US Treasury has put a name and a dollar figure on the digital-asset plumbing behind Iranian oil sales. Ivan Obukhov allegedly processed more than $100 million in crypto for IRGC-QF oil sales since 2023, according to the original report. The designation lands as Washington expands the crackdown beyond crypto to gold, shipping, and technology networks.
The action targets an operational role, not just a wallet. By naming Obukhov, Treasury is treating crypto processors as financial intermediaries rather than neutral infrastructure. That distinction will matter for exchanges, custodians, bridge operators, and any platform that settles cross-border value.
A Broader Enforcement Net
This designation fits into a wider campaign against Iran’s Islamic Revolutionary Guard Corps Quds Force. The group has long relied on layered networks of brokers, shipping providers, and intermediaries to move oil revenue. Adding a crypto processor to that list signals that US authorities view digital assets as a core part of the evasion stack, not a peripheral experiment.
The $100 million figure is significant because it gives investigators and compliance teams a concrete benchmark. Processing that volume since 2023 would likely require access to multiple off-ramps, exchange accounts, or over-the-counter desks. Those counterparties now face a practical question: whether their screening systems flagged the associated addresses before Treasury did.
For US-based platforms, the legal exposure is direct. For foreign institutions, the more immediate pressure comes from secondary sanctions risk. Compliance teams are already screening addresses linked to OFAC designations, even as banks and lawmakers clash over the future shape of US crypto rules. That fight is playing out at the exact moment enforcement agencies are widening their use of sanctions powers, as seen in the debate over Banks Are Trying to Kill the Biggest Crypto Bill in US History Four Days Before the Senate Vote.
Why the Timing Matters
Expanding the crackdown to gold, shipping, and technology suggests Treasury no longer separates crypto from older sanctions-evasion channels. Instead, digital assets are being treated as one transport layer among several. If that framing sticks, the enforcement focus will shift toward the gatekeepers that convert crypto into usable liquidity.
The move also comes as more traditional assets move on-chain. Institutional tokenization has accelerated, bringing clearer audit trails but also more complex compliance obligations. The same infrastructure that makes tokenized assets attractive can give regulators a richer map of counterparty relationships. For participants watching the Weekly Tokenization Roundup: Bullish Buys Equiniti for $4.2B, Ondo Settles With JPMorgan, RWA Crosses $20B, enforcement visibility is becoming a baseline expectation rather than an afterthought.
Tracing firms and compliance vendors now have a named target to map. High-activity chains remain the primary field for that work, since the transaction volume that attracts developers also produces more data for investigators. The ongoing review of Top 10 Blockchains by Developer Activity This Week illustrates how much on-chain activity is now visible to outside observers.
What Remains Uncertain
The Treasury statement does not identify which blockchains or assets Obukhov used, nor does it detail the specific off-ramps. That leaves counterparties guessing about their exposure. Sanctions screening can be blunt, and misattributed addresses remain a known failure mode. Funds that have passed through mixers or cross-chain bridges are even harder to trace back to a single actor.
The deeper question is whether naming facilitators deters the activity or simply pushes it further into less transparent venues. Historically, sanctions pressure displaces flows rather than eliminating them. The practical market response will likely be more aggressive transaction monitoring, closer review of counterparties in loosely supervised jurisdictions, and a fresh round of risk assessments at exchanges that touch large cross-border volumes.
Treasury has shown that it will name individuals behind crypto processing networks, not just the wallets they control. The missing details may be just as important as the designation itself.
US Treasury Names Crypto Processor in Iran Sanctions Sweep
The US Treasury has put a name and a dollar figure on the digital-asset plumbing behind Iranian oil sales. Ivan Obukhov allegedly processed more than $100 million in crypto for IRGC-QF oil sales since 2023, according to the original report. The designation lands as Washington expands the crackdown beyond crypto to gold, shipping, and technology networks.
The action targets an operational role, not just a wallet. By naming Obukhov, Treasury is treating crypto processors as financial intermediaries rather than neutral infrastructure. That distinction will matter for exchanges, custodians, bridge operators, and any platform that settles cross-border value.
A Broader Enforcement Net
This designation fits into a wider campaign against Iran’s Islamic Revolutionary Guard Corps Quds Force. The group has long relied on layered networks of brokers, shipping providers, and intermediaries to move oil revenue. Adding a crypto processor to that list signals that US authorities view digital assets as a core part of the evasion stack, not a peripheral experiment.
The $100 million figure is significant because it gives investigators and compliance teams a concrete benchmark. Processing that volume since 2023 would likely require access to multiple off-ramps, exchange accounts, or over-the-counter desks. Those counterparties now face a practical question: whether their screening systems flagged the associated addresses before Treasury did.
For US-based platforms, the legal exposure is direct. For foreign institutions, the more immediate pressure comes from secondary sanctions risk. Compliance teams are already screening addresses linked to OFAC designations, even as banks and lawmakers clash over the future shape of US crypto rules. That fight is playing out at the exact moment enforcement agencies are widening their use of sanctions powers, as seen in the debate over Banks Are Trying to Kill the Biggest Crypto Bill in US History Four Days Before the Senate Vote.
Why the Timing Matters
Expanding the crackdown to gold, shipping, and technology suggests Treasury no longer separates crypto from older sanctions-evasion channels. Instead, digital assets are being treated as one transport layer among several. If that framing sticks, the enforcement focus will shift toward the gatekeepers that convert crypto into usable liquidity.
The move also comes as more traditional assets move on-chain. Institutional tokenization has accelerated, bringing clearer audit trails but also more complex compliance obligations. The same infrastructure that makes tokenized assets attractive can give regulators a richer map of counterparty relationships. For participants watching the Weekly Tokenization Roundup: Bullish Buys Equiniti for $4.2B, Ondo Settles With JPMorgan, RWA Crosses $20B, enforcement visibility is becoming a baseline expectation rather than an afterthought.
Tracing firms and compliance vendors now have a named target to map. High-activity chains remain the primary field for that work, since the transaction volume that attracts developers also produces more data for investigators. The ongoing review of Top 10 Blockchains by Developer Activity This Week illustrates how much on-chain activity is now visible to outside observers.
What Remains Uncertain
The Treasury statement does not identify which blockchains or assets Obukhov used, nor does it detail the specific off-ramps. That leaves counterparties guessing about their exposure. Sanctions screening can be blunt, and misattributed addresses remain a known failure mode. Funds that have passed through mixers or cross-chain bridges are even harder to trace back to a single actor.
The deeper question is whether naming facilitators deters the activity or simply pushes it further into less transparent venues. Historically, sanctions pressure displaces flows rather than eliminating them. The practical market response will likely be more aggressive transaction monitoring, closer review of counterparties in loosely supervised jurisdictions, and a fresh round of risk assessments at exchanges that touch large cross-border volumes.
Treasury has shown that it will name individuals behind crypto processing networks, not just the wallets they control. The missing details may be just as important as the designation itself.
The action targets an operational role, not just a wallet. By naming Obukhov, Treasury is treating crypto processors as financial intermediaries rather than neutral infrastructure. That distinction will matter for exchanges, custodians, bridge operators, and any platform that settles cross-border value.
A Broader Enforcement Net
This designation fits into a wider campaign against Iran’s Islamic Revolutionary Guard Corps Quds Force. The group has long relied on layered networks of brokers, shipping providers, and intermediaries to move oil revenue. Adding a crypto processor to that list signals that US authorities view digital assets as a core part of the evasion stack, not a peripheral experiment.
The $100 million figure is significant because it gives investigators and compliance teams a concrete benchmark. Processing that volume since 2023 would likely require access to multiple off-ramps, exchange accounts, or over-the-counter desks. Those counterparties now face a practical question: whether their screening systems flagged the associated addresses before Treasury did.
For US-based platforms, the legal exposure is direct. For foreign institutions, the more immediate pressure comes from secondary sanctions risk. Compliance teams are already screening addresses linked to OFAC designations, even as banks and lawmakers clash over the future shape of US crypto rules. That fight is playing out at the exact moment enforcement agencies are widening their use of sanctions powers, as seen in the debate over Banks Are Trying to Kill the Biggest Crypto Bill in US History Four Days Before the Senate Vote.
Why the Timing Matters
Expanding the crackdown to gold, shipping, and technology suggests Treasury no longer separates crypto from older sanctions-evasion channels. Instead, digital assets are being treated as one transport layer among several. If that framing sticks, the enforcement focus will shift toward the gatekeepers that convert crypto into usable liquidity.
The move also comes as more traditional assets move on-chain. Institutional tokenization has accelerated, bringing clearer audit trails but also more complex compliance obligations. The same infrastructure that makes tokenized assets attractive can give regulators a richer map of counterparty relationships. For participants watching the Weekly Tokenization Roundup: Bullish Buys Equiniti for $4.2B, Ondo Settles With JPMorgan, RWA Crosses $20B, enforcement visibility is becoming a baseline expectation rather than an afterthought.
Tracing firms and compliance vendors now have a named target to map. High-activity chains remain the primary field for that work, since the transaction volume that attracts developers also produces more data for investigators. The ongoing review of Top 10 Blockchains by Developer Activity This Week illustrates how much on-chain activity is now visible to outside observers.
What Remains Uncertain
The Treasury statement does not identify which blockchains or assets Obukhov used, nor does it detail the specific off-ramps. That leaves counterparties guessing about their exposure. Sanctions screening can be blunt, and misattributed addresses remain a known failure mode. Funds that have passed through mixers or cross-chain bridges are even harder to trace back to a single actor.
The deeper question is whether naming facilitators deters the activity or simply pushes it further into less transparent venues. Historically, sanctions pressure displaces flows rather than eliminating them. The practical market response will likely be more aggressive transaction monitoring, closer review of counterparties in loosely supervised jurisdictions, and a fresh round of risk assessments at exchanges that touch large cross-border volumes.
Treasury has shown that it will name individuals behind crypto processing networks, not just the wallets they control. The missing details may be just as important as the designation itself.
58
How Far Is Each Major Crypto From Its All-Time High? and What It Would Take to Get BackOne of the most useful and least discussed numbers in crypto is the distance between where an asset trades and where it once traded. It reframes almost every conversation. A coin can be up 20% this week and still need to quadruple to reach a price it printed two years ago. Below is the current picture across major assets, and then the arithmetic that explains why the gap matters more than most people assume.
The current picture
Distance from all-time high, as of late August 2026:
Asset Below all-time high TRON roughly 21% Bitcoin roughly 37% BNB roughly 49% Ethereum roughly 50% XRP roughly 60% Solana roughly 67%
Figures compiled from CoinGecko, which publishes each asset’s distance from its record price on its coin pages. These move daily; check live figures before relying on any of them.
Two things jump out immediately. Bitcoin, the largest and most institutionally held asset, has the smallest drawdown of the major cryptocurrencies apart from TRON. And Solana, one of the most widely held alternatives, needs to triple from here to reach a price it has already achieved once.
The arithmetic almost nobody runs
A drawdown and its recovery are not symmetrical, and the gap between them widens brutally as losses deepen. This is arithmetic rather than opinion.
If an asset falls It must rise this much to break even 20% 25% 37% about 59% 50% 100% 60% 150% 67% about 203% 90% 900% 93% about 1,300%
The reason is simple. A 50% fall takes $100 to $50, and getting from $50 back to $100 requires doubling, not another 50%. Every further percentage point of decline makes the required recovery disproportionately larger.
Applied to the table above: Bitcoin needs roughly 59% to reach its record. Ethereum needs to double. Solana needs to roughly triple. Those are very different propositions, and they are frequently discussed as though they were the same trade.
This site ran the extreme version of this calculation in August 2026 on a token that fell 93% in ten days, and the finding was stark: an investor who bought the top needed the token to multiply by roughly fourteen just to break even. That is the mathematical shape of the hole, and it explains why post-collapse assets so rarely revisit their highs even when the underlying project continues operating normally.
What the number does and does not tell you
It is not a discount. The most common misuse of this metric is treating distance from the high as a measure of value, as though an asset 67% below its record is therefore 67% cheap. The previous high was a price that existed for a moment under specific conditions, not a fair value the asset is entitled to return to. Plenty of assets never see their old highs again, and the ones that do usually take years.
It is not a prediction either way. A small drawdown does not mean an asset is strong, and a large one does not mean it is broken. TRON’s relatively shallow gap partly reflects a lower peak rather than superior performance since.
What it genuinely tells you is how much of the previous cycle’s damage has been repaired, which is useful context when reading almost any bullish headline. A rally that lifts an asset from 70% below its high to 60% below its high is a large percentage move and a modest structural recovery, and both descriptions are true at once.
It also tells you about overhead supply. Everyone who bought between the current price and the previous high is sitting on a loss, and a share of them will sell to break even as price approaches their entry. That is why recoveries tend to stall at the levels where earlier buying was heaviest, and why deep drawdowns produce charts that grind rather than sprint.
The questions worth asking instead
If distance from a high is a weak measure of value, what should sit next to it?
Does the asset produce anything? For tokens with fee revenue, the ratio of market capitalization to annualized revenue is a far more grounded comparison. This site has measured readings ranging from roughly 1 times to 24 times across different assets this month, which is a spread that tells you considerably more than a drawdown percentage.
Is supply still expanding? An asset with most of its tokens still to unlock faces a headwind that has nothing to do with sentiment, which is why the FDV to market cap ratio belongs beside any recovery thesis. A token can be 60% below its high and still be diluting.
Who owns it now versus then? An asset whose holder base has shifted from retail speculation to institutional vehicles has a structurally different recovery path from one that has simply been abandoned.
And is anyone actually trading it? Turnover, meaning daily volume as a share of market capitalization, separates assets that are being accumulated from ones that are merely sitting still. Volume figures deserve their own scrutiny, since raw volume is inflated in ways that routinely mislead.
Bottom Line
Distance from an all-time high is a useful piece of context and a terrible investment thesis. Read it to understand how much repair work a chart still faces and where overhead sellers are waiting, not as a measure of how cheap something is. And run the recovery arithmetic before deciding a deep drawdown looks like an opportunity, because the difference between needing 59% and needing 203% is the difference between a plausible year and a full cycle.
This article is for information only and is not investment advice. Crypto assets are extremely volatile and you can lose your entire stake. Always do your own research.
How Far Is Each Major Crypto From Its All-Time High? and What It Would Take to Get Back
One of the most useful and least discussed numbers in crypto is the distance between where an asset trades and where it once traded. It reframes almost every conversation. A coin can be up 20% this week and still need to quadruple to reach a price it printed two years ago. Below is the current picture across major assets, and then the arithmetic that explains why the gap matters more than most people assume.
The current picture
Distance from all-time high, as of late August 2026:
Asset Below all-time high TRON roughly 21% Bitcoin roughly 37% BNB roughly 49% Ethereum roughly 50% XRP roughly 60% Solana roughly 67%
Figures compiled from CoinGecko, which publishes each asset’s distance from its record price on its coin pages. These move daily; check live figures before relying on any of them.
Two things jump out immediately. Bitcoin, the largest and most institutionally held asset, has the smallest drawdown of the major cryptocurrencies apart from TRON. And Solana, one of the most widely held alternatives, needs to triple from here to reach a price it has already achieved once.
The arithmetic almost nobody runs
A drawdown and its recovery are not symmetrical, and the gap between them widens brutally as losses deepen. This is arithmetic rather than opinion.
If an asset falls It must rise this much to break even 20% 25% 37% about 59% 50% 100% 60% 150% 67% about 203% 90% 900% 93% about 1,300%
The reason is simple. A 50% fall takes $100 to $50, and getting from $50 back to $100 requires doubling, not another 50%. Every further percentage point of decline makes the required recovery disproportionately larger.
Applied to the table above: Bitcoin needs roughly 59% to reach its record. Ethereum needs to double. Solana needs to roughly triple. Those are very different propositions, and they are frequently discussed as though they were the same trade.
This site ran the extreme version of this calculation in August 2026 on a token that fell 93% in ten days, and the finding was stark: an investor who bought the top needed the token to multiply by roughly fourteen just to break even. That is the mathematical shape of the hole, and it explains why post-collapse assets so rarely revisit their highs even when the underlying project continues operating normally.
What the number does and does not tell you
It is not a discount. The most common misuse of this metric is treating distance from the high as a measure of value, as though an asset 67% below its record is therefore 67% cheap. The previous high was a price that existed for a moment under specific conditions, not a fair value the asset is entitled to return to. Plenty of assets never see their old highs again, and the ones that do usually take years.
It is not a prediction either way. A small drawdown does not mean an asset is strong, and a large one does not mean it is broken. TRON’s relatively shallow gap partly reflects a lower peak rather than superior performance since.
What it genuinely tells you is how much of the previous cycle’s damage has been repaired, which is useful context when reading almost any bullish headline. A rally that lifts an asset from 70% below its high to 60% below its high is a large percentage move and a modest structural recovery, and both descriptions are true at once.
It also tells you about overhead supply. Everyone who bought between the current price and the previous high is sitting on a loss, and a share of them will sell to break even as price approaches their entry. That is why recoveries tend to stall at the levels where earlier buying was heaviest, and why deep drawdowns produce charts that grind rather than sprint.
The questions worth asking instead
If distance from a high is a weak measure of value, what should sit next to it?
Does the asset produce anything? For tokens with fee revenue, the ratio of market capitalization to annualized revenue is a far more grounded comparison. This site has measured readings ranging from roughly 1 times to 24 times across different assets this month, which is a spread that tells you considerably more than a drawdown percentage.
Is supply still expanding? An asset with most of its tokens still to unlock faces a headwind that has nothing to do with sentiment, which is why the FDV to market cap ratio belongs beside any recovery thesis. A token can be 60% below its high and still be diluting.
Who owns it now versus then? An asset whose holder base has shifted from retail speculation to institutional vehicles has a structurally different recovery path from one that has simply been abandoned.
And is anyone actually trading it? Turnover, meaning daily volume as a share of market capitalization, separates assets that are being accumulated from ones that are merely sitting still. Volume figures deserve their own scrutiny, since raw volume is inflated in ways that routinely mislead.
Bottom Line
Distance from an all-time high is a useful piece of context and a terrible investment thesis. Read it to understand how much repair work a chart still faces and where overhead sellers are waiting, not as a measure of how cheap something is. And run the recovery arithmetic before deciding a deep drawdown looks like an opportunity, because the difference between needing 59% and needing 203% is the difference between a plausible year and a full cycle.
This article is for information only and is not investment advice. Crypto assets are extremely volatile and you can lose your entire stake. Always do your own research.
The current picture
Distance from all-time high, as of late August 2026:
Asset Below all-time high TRON roughly 21% Bitcoin roughly 37% BNB roughly 49% Ethereum roughly 50% XRP roughly 60% Solana roughly 67%
Figures compiled from CoinGecko, which publishes each asset’s distance from its record price on its coin pages. These move daily; check live figures before relying on any of them.
Two things jump out immediately. Bitcoin, the largest and most institutionally held asset, has the smallest drawdown of the major cryptocurrencies apart from TRON. And Solana, one of the most widely held alternatives, needs to triple from here to reach a price it has already achieved once.
The arithmetic almost nobody runs
A drawdown and its recovery are not symmetrical, and the gap between them widens brutally as losses deepen. This is arithmetic rather than opinion.
If an asset falls It must rise this much to break even 20% 25% 37% about 59% 50% 100% 60% 150% 67% about 203% 90% 900% 93% about 1,300%
The reason is simple. A 50% fall takes $100 to $50, and getting from $50 back to $100 requires doubling, not another 50%. Every further percentage point of decline makes the required recovery disproportionately larger.
Applied to the table above: Bitcoin needs roughly 59% to reach its record. Ethereum needs to double. Solana needs to roughly triple. Those are very different propositions, and they are frequently discussed as though they were the same trade.
This site ran the extreme version of this calculation in August 2026 on a token that fell 93% in ten days, and the finding was stark: an investor who bought the top needed the token to multiply by roughly fourteen just to break even. That is the mathematical shape of the hole, and it explains why post-collapse assets so rarely revisit their highs even when the underlying project continues operating normally.
What the number does and does not tell you
It is not a discount. The most common misuse of this metric is treating distance from the high as a measure of value, as though an asset 67% below its record is therefore 67% cheap. The previous high was a price that existed for a moment under specific conditions, not a fair value the asset is entitled to return to. Plenty of assets never see their old highs again, and the ones that do usually take years.
It is not a prediction either way. A small drawdown does not mean an asset is strong, and a large one does not mean it is broken. TRON’s relatively shallow gap partly reflects a lower peak rather than superior performance since.
What it genuinely tells you is how much of the previous cycle’s damage has been repaired, which is useful context when reading almost any bullish headline. A rally that lifts an asset from 70% below its high to 60% below its high is a large percentage move and a modest structural recovery, and both descriptions are true at once.
It also tells you about overhead supply. Everyone who bought between the current price and the previous high is sitting on a loss, and a share of them will sell to break even as price approaches their entry. That is why recoveries tend to stall at the levels where earlier buying was heaviest, and why deep drawdowns produce charts that grind rather than sprint.
The questions worth asking instead
If distance from a high is a weak measure of value, what should sit next to it?
Does the asset produce anything? For tokens with fee revenue, the ratio of market capitalization to annualized revenue is a far more grounded comparison. This site has measured readings ranging from roughly 1 times to 24 times across different assets this month, which is a spread that tells you considerably more than a drawdown percentage.
Is supply still expanding? An asset with most of its tokens still to unlock faces a headwind that has nothing to do with sentiment, which is why the FDV to market cap ratio belongs beside any recovery thesis. A token can be 60% below its high and still be diluting.
Who owns it now versus then? An asset whose holder base has shifted from retail speculation to institutional vehicles has a structurally different recovery path from one that has simply been abandoned.
And is anyone actually trading it? Turnover, meaning daily volume as a share of market capitalization, separates assets that are being accumulated from ones that are merely sitting still. Volume figures deserve their own scrutiny, since raw volume is inflated in ways that routinely mislead.
Bottom Line
Distance from an all-time high is a useful piece of context and a terrible investment thesis. Read it to understand how much repair work a chart still faces and where overhead sellers are waiting, not as a measure of how cheap something is. And run the recovery arithmetic before deciding a deep drawdown looks like an opportunity, because the difference between needing 59% and needing 203% is the difference between a plausible year and a full cycle.
This article is for information only and is not investment advice. Crypto assets are extremely volatile and you can lose your entire stake. Always do your own research.
135
Metaplanet Moves 1,000 Bitcoin to Coinbase Prime, Holds 43,000 BTCJapanese corporate bitcoin holder Metaplanet transferred 1,000 Bitcoin, worth roughly $79.77 million, to Coinbase Prime on Aug. 25, according to on-chain analytics account Lookonchain, crypto.news reported.
What the transfer shows
Lookonchain described the transaction as a deposit into Coinbase Prime, which provides institutional trading, financing and custody services. Moving bitcoin there can precede a sale, but it can equally reflect custody management, collateral arrangements or internal account transfers. Neither Metaplanet nor Coinbase had identified the movement as a sale when checked, and the destination attribution is an on-chain analyst’s assessment rather than confirmation of a disposal. A confirmed reduction in the company’s holdings would require an official treasury update or evidence of a subsequent sale.
Metaplanet’s 43,000 BTC treasury
Metaplanet reports holding 43,000 Bitcoin, valued near $3.4 billion at current market prices, with a disclosed average acquisition cost of about 15.3 million yen per coin, which Lookonchain converts to roughly $96,191. At that average, the position’s estimated acquisition cost would be about $4.14 billion. The company has addressed similar speculation before: on Aug. 12, CEO Simon Gerovich said Metaplanet moved 5,014 BTC between custodial addresses without selling any coins, and its reported holdings stayed at 43,000 BTC. The company has been among the most aggressive corporate accumulators of bitcoin this year, using equity and convertible-debt issuance to expand its position while signaling that it treats the asset as a long-term treasury reserve.
The Super League tie-up
The transfer comes a week after Metaplanet agreed to contribute 2,100 BTC and $2.5 million to Nasdaq-listed Super League Enterprise, which would become a U.S. bitcoin treasury platform renamed Superplanet under the proposed transaction, with the Nasdaq ticker SUPA and Metaplanet expected to own about 95.7 percent of the resulting company. There is no official evidence connecting Tuesday’s 1,000 BTC movement to that deal, which still requires shareholder approval and is targeted to close in the fourth quarter. Separately, Super League reported selling 475,598 shares for approximately $2.23 million in gross proceeds through its at-the-market program, and the companies valued the initial investment at about $134.6 million.
The movement is the latest marker in the corporate bitcoin treasury thesis that Metaplanet has ridden aggressively.
Metaplanet Moves 1,000 Bitcoin to Coinbase Prime, Holds 43,000 BTC
Japanese corporate bitcoin holder Metaplanet transferred 1,000 Bitcoin, worth roughly $79.77 million, to Coinbase Prime on Aug. 25, according to on-chain analytics account Lookonchain, crypto.news reported.
What the transfer shows
Lookonchain described the transaction as a deposit into Coinbase Prime, which provides institutional trading, financing and custody services. Moving bitcoin there can precede a sale, but it can equally reflect custody management, collateral arrangements or internal account transfers. Neither Metaplanet nor Coinbase had identified the movement as a sale when checked, and the destination attribution is an on-chain analyst’s assessment rather than confirmation of a disposal. A confirmed reduction in the company’s holdings would require an official treasury update or evidence of a subsequent sale.
Metaplanet’s 43,000 BTC treasury
Metaplanet reports holding 43,000 Bitcoin, valued near $3.4 billion at current market prices, with a disclosed average acquisition cost of about 15.3 million yen per coin, which Lookonchain converts to roughly $96,191. At that average, the position’s estimated acquisition cost would be about $4.14 billion. The company has addressed similar speculation before: on Aug. 12, CEO Simon Gerovich said Metaplanet moved 5,014 BTC between custodial addresses without selling any coins, and its reported holdings stayed at 43,000 BTC. The company has been among the most aggressive corporate accumulators of bitcoin this year, using equity and convertible-debt issuance to expand its position while signaling that it treats the asset as a long-term treasury reserve.
The Super League tie-up
The transfer comes a week after Metaplanet agreed to contribute 2,100 BTC and $2.5 million to Nasdaq-listed Super League Enterprise, which would become a U.S. bitcoin treasury platform renamed Superplanet under the proposed transaction, with the Nasdaq ticker SUPA and Metaplanet expected to own about 95.7 percent of the resulting company. There is no official evidence connecting Tuesday’s 1,000 BTC movement to that deal, which still requires shareholder approval and is targeted to close in the fourth quarter. Separately, Super League reported selling 475,598 shares for approximately $2.23 million in gross proceeds through its at-the-market program, and the companies valued the initial investment at about $134.6 million.
The movement is the latest marker in the corporate bitcoin treasury thesis that Metaplanet has ridden aggressively.
What the transfer shows
Lookonchain described the transaction as a deposit into Coinbase Prime, which provides institutional trading, financing and custody services. Moving bitcoin there can precede a sale, but it can equally reflect custody management, collateral arrangements or internal account transfers. Neither Metaplanet nor Coinbase had identified the movement as a sale when checked, and the destination attribution is an on-chain analyst’s assessment rather than confirmation of a disposal. A confirmed reduction in the company’s holdings would require an official treasury update or evidence of a subsequent sale.
Metaplanet’s 43,000 BTC treasury
Metaplanet reports holding 43,000 Bitcoin, valued near $3.4 billion at current market prices, with a disclosed average acquisition cost of about 15.3 million yen per coin, which Lookonchain converts to roughly $96,191. At that average, the position’s estimated acquisition cost would be about $4.14 billion. The company has addressed similar speculation before: on Aug. 12, CEO Simon Gerovich said Metaplanet moved 5,014 BTC between custodial addresses without selling any coins, and its reported holdings stayed at 43,000 BTC. The company has been among the most aggressive corporate accumulators of bitcoin this year, using equity and convertible-debt issuance to expand its position while signaling that it treats the asset as a long-term treasury reserve.
The Super League tie-up
The transfer comes a week after Metaplanet agreed to contribute 2,100 BTC and $2.5 million to Nasdaq-listed Super League Enterprise, which would become a U.S. bitcoin treasury platform renamed Superplanet under the proposed transaction, with the Nasdaq ticker SUPA and Metaplanet expected to own about 95.7 percent of the resulting company. There is no official evidence connecting Tuesday’s 1,000 BTC movement to that deal, which still requires shareholder approval and is targeted to close in the fourth quarter. Separately, Super League reported selling 475,598 shares for approximately $2.23 million in gross proceeds through its at-the-market program, and the companies valued the initial investment at about $134.6 million.
The movement is the latest marker in the corporate bitcoin treasury thesis that Metaplanet has ridden aggressively.
35
Cosmos Labs Urges EVM Chains to Halt After KiiChain’s $148 Million ExploitCosmos Labs urged affected Cosmos EVM chains to request validator halts on Aug. 25 as its security and engineering teams responded to an incident that had already reached multiple networks, crypto.news reported.
A shared software stack
Cosmos EVM is a software module that lets Cosmos SDK chains execute Ethereum-compatible smart contracts, so a vulnerability in a common component can expose independent networks running affected versions. Cosmos Labs did not identify the underlying vulnerability, the affected chains or total losses in its initial statement, and said it would publish an incident report after the situation was resolved. It did not publish a software version, mitigation instructions or a restart schedule, likely to avoid revealing exploitable details before chains are protected, and directed other teams with questions to its security email.
What the affected chains disclosed
KiiChain said an attacker drained 148,326,583.15 KII from wallets on Aug. 22, repeating the technique 18 times before validators stopped the network at block 9,355,723. The team linked the attack to a Cosmos EVM vulnerability involving vesting accounts, staking operations and balance handling, and said part of the assets was bridged to BNB Smart Chain through Hyperlane. TAC separately said an attacker exploited a weakness in the Cosmos EVM precompile layer on Aug. 22 and drained one account before validators halted the network at block 24,671.
MANTRA and the bigger picture
MANTRA stopped its network on Aug. 20 after detecting activity in two project-managed wallets and resumed block production after a roughly 30-hour halt, saying user balances were unchanged. A halt prevents new transactions from settling while developers investigate, temporarily blocking transfers, applications and withdrawals that depend on the chain. The incidents follow an earlier Cosmos EVM flaw in the ICS20 precompile, where incorrect state handling during nested execution allowed the same balance to be used repeatedly, causing an estimated $7 million loss on SagaEVM in January. Whether the August attacks used that exact flaw or a separate vulnerability remains unconfirmed, and Cosmos Labs has not yet published an aggregate loss figure or confirmed whether the same attacker controlled every address involved.
The episode recalls MANTRA’s earlier halt after its own exploit.
Cosmos Labs Urges EVM Chains to Halt After KiiChain’s $148 Million Exploit
Cosmos Labs urged affected Cosmos EVM chains to request validator halts on Aug. 25 as its security and engineering teams responded to an incident that had already reached multiple networks, crypto.news reported.
A shared software stack
Cosmos EVM is a software module that lets Cosmos SDK chains execute Ethereum-compatible smart contracts, so a vulnerability in a common component can expose independent networks running affected versions. Cosmos Labs did not identify the underlying vulnerability, the affected chains or total losses in its initial statement, and said it would publish an incident report after the situation was resolved. It did not publish a software version, mitigation instructions or a restart schedule, likely to avoid revealing exploitable details before chains are protected, and directed other teams with questions to its security email.
What the affected chains disclosed
KiiChain said an attacker drained 148,326,583.15 KII from wallets on Aug. 22, repeating the technique 18 times before validators stopped the network at block 9,355,723. The team linked the attack to a Cosmos EVM vulnerability involving vesting accounts, staking operations and balance handling, and said part of the assets was bridged to BNB Smart Chain through Hyperlane. TAC separately said an attacker exploited a weakness in the Cosmos EVM precompile layer on Aug. 22 and drained one account before validators halted the network at block 24,671.
MANTRA and the bigger picture
MANTRA stopped its network on Aug. 20 after detecting activity in two project-managed wallets and resumed block production after a roughly 30-hour halt, saying user balances were unchanged. A halt prevents new transactions from settling while developers investigate, temporarily blocking transfers, applications and withdrawals that depend on the chain. The incidents follow an earlier Cosmos EVM flaw in the ICS20 precompile, where incorrect state handling during nested execution allowed the same balance to be used repeatedly, causing an estimated $7 million loss on SagaEVM in January. Whether the August attacks used that exact flaw or a separate vulnerability remains unconfirmed, and Cosmos Labs has not yet published an aggregate loss figure or confirmed whether the same attacker controlled every address involved.
The episode recalls MANTRA’s earlier halt after its own exploit.
A shared software stack
Cosmos EVM is a software module that lets Cosmos SDK chains execute Ethereum-compatible smart contracts, so a vulnerability in a common component can expose independent networks running affected versions. Cosmos Labs did not identify the underlying vulnerability, the affected chains or total losses in its initial statement, and said it would publish an incident report after the situation was resolved. It did not publish a software version, mitigation instructions or a restart schedule, likely to avoid revealing exploitable details before chains are protected, and directed other teams with questions to its security email.
What the affected chains disclosed
KiiChain said an attacker drained 148,326,583.15 KII from wallets on Aug. 22, repeating the technique 18 times before validators stopped the network at block 9,355,723. The team linked the attack to a Cosmos EVM vulnerability involving vesting accounts, staking operations and balance handling, and said part of the assets was bridged to BNB Smart Chain through Hyperlane. TAC separately said an attacker exploited a weakness in the Cosmos EVM precompile layer on Aug. 22 and drained one account before validators halted the network at block 24,671.
MANTRA and the bigger picture
MANTRA stopped its network on Aug. 20 after detecting activity in two project-managed wallets and resumed block production after a roughly 30-hour halt, saying user balances were unchanged. A halt prevents new transactions from settling while developers investigate, temporarily blocking transfers, applications and withdrawals that depend on the chain. The incidents follow an earlier Cosmos EVM flaw in the ICS20 precompile, where incorrect state handling during nested execution allowed the same balance to be used repeatedly, causing an estimated $7 million loss on SagaEVM in January. Whether the August attacks used that exact flaw or a separate vulnerability remains unconfirmed, and Cosmos Labs has not yet published an aggregate loss figure or confirmed whether the same attacker controlled every address involved.
The episode recalls MANTRA’s earlier halt after its own exploit.
120
Why Is Zcash Going Up? the ETF, the $800 Barrier, and the Ratio Nobody Is QuotingOn July 8, when this site published its first structural assessment of Zcash, ZEC traded at $469.57 and the two markers were $440 as support and $500 as the resistance that would probably need several attempts. Both resolved. On August 19 it was $544 and we wrote that the framework had been fully satisfied and the next assessment needed new markers. It now trades at $821.79, having cleared $800 for the first time since January 2018. That is roughly 75% above where this coverage started, and the reasons are specific rather than mystical.
Live price per CoinGecko, with ZEC sitting in CoinGecko’s most viewed list alongside Bitcoin at $79,056.
One: an actual ETF, with a date
Grayscale filed to convert its Zcash Trust into a spot exchange-traded product listed on NYSE Arca under the ticker ZCSH, with an August 21 filing indicating shares were anticipated to begin trading on or around August 25, subject to regulatory approvals, alongside a name change to The Zcash ETF. The fund is described as holding up to 393,000 ZEC, worth over $260 million at current prices. Earlier filings also disclosed that DCG International Investments held non-binding discussions involving roughly 200,000 ZEC through the trust.
Every document in that process is public and searchable through SEC EDGAR, which is where anyone should verify the status rather than relying on commentary, including this article.
Why it matters more here than it would for most assets: privacy coins have spent a decade being removed from regulated venues, not added to them. This site’s comparison of Zcash and Monero scored Zcash ahead specifically on access and regulatory exposure, arguing that the sector’s dividing line is permission rather than cryptography. A US-listed spot vehicle is that argument arriving in physical form.
Two: the Bitcoin comparison finally got traction
Zcash inherited Bitcoin’s architecture directly: a 21 million supply cap, proof-of-work mining and a halving schedule, with shielded transactions layered on top. This site made the same comparison in July, noting that the entire bull argument compresses into a single claim, that an asset with Bitcoin’s emission discipline plus privacy should not trade at a tiny fraction of Bitcoin’s price.
That ratio has moved substantially in the bulls’ favour since. In July it stood near 132 to 1. With ZEC at $821.79 and Bitcoin at $79,056, it is now closer to 96 to 1.
Network development supported the narrative: an Ironwood upgrade activated in late July introducing a new shielded pool with quantum-recoverable notes and a supply-verification turnstile, with a further NU7 upgrade snapshot dated August 24.
Three, and this is the part to read twice
Futures volume has been running at roughly $9.5 billion against just over $1 billion in spot trading.
That ratio, close to nine to one, is the most important number in this rally and the one most coverage skips. It means the price is being set overwhelmingly in leveraged derivatives markets rather than by people buying and holding the actual asset. Reported moves included the token trading between roughly $589 and $851 within a single 24-hour window, which is what a leverage-driven market looks like from the inside.
There is a second detail that sharpens it. Social volume on August 21 reached only 138 mentions, roughly 88% below the 1,116 recorded before the June bottom. So trading participation expanded dramatically while public discussion did not. A rally driven by derivatives desks rather than by a retail crowd.
Both readings deserve space. The constructive one: rallies without retail euphoria have not yet burned their most obvious fuel, and there is a crowd that has not arrived. The cautionary one: leverage cuts both ways with equal enthusiasm, and a nine-to-one futures ratio is the configuration that produces the fastest reversals in this market. This site’s explanation of how liquidation cascades work applies directly here, in both directions.
The seven-day relative strength index has been reported as high as 88, which is about as overbought as this indicator gets.
What has not changed
The risk this site has flagged in every Zcash piece since July has not moved. The European Union’s anti-money-laundering framework is set to restrict anonymity-enhancing tokens at regulated providers from July 1, 2027. No technical level accounts for a regulatory date, a 75% gain does not reduce that exposure, and an ETF listing in the United States does not bind European regulators.
The levels that matter now
The $800 line is the structural one, because it was Zcash’s January 2018 peak and stood as long-term resistance for eight years. Reclaimed levels of that age tend to become meaningful support if they hold. Analysts have identified the $780 to $800 zone as the near-term support to watch, with $880 as the next upside test and a break lower risking a move toward the $716 area. Above the current price, $1,000 is the round number the market is now openly discussing.
So should anyone chase this?
That is not a question this site answers, but the framework is straightforward. The ETF is a genuine structural development that changes who can buy Zcash. The Bitcoin-architecture argument is real and has been repriced, not resolved. And the mechanism carrying the price right now is leverage, which is fast, finite and reverses hard.
The honest summary of a rally this size is that the strongest part of the story, regulated access, arrives on a specific date that has now passed or is passing, and the market has already priced a great deal of anticipation into it. What happens after a long-awaited launch actually lists is one of the more reliable disappointments in this industry, and it is worth watching the ETF’s initial flows rather than its headlines.
This article is for information only and is not investment advice. Crypto assets are extremely volatile and you can lose your entire stake. Always do your own research.
Why Is Zcash Going Up? the ETF, the $800 Barrier, and the Ratio Nobody Is Quoting
On July 8, when this site published its first structural assessment of Zcash, ZEC traded at $469.57 and the two markers were $440 as support and $500 as the resistance that would probably need several attempts. Both resolved. On August 19 it was $544 and we wrote that the framework had been fully satisfied and the next assessment needed new markers. It now trades at $821.79, having cleared $800 for the first time since January 2018. That is roughly 75% above where this coverage started, and the reasons are specific rather than mystical.
Live price per CoinGecko, with ZEC sitting in CoinGecko’s most viewed list alongside Bitcoin at $79,056.
One: an actual ETF, with a date
Grayscale filed to convert its Zcash Trust into a spot exchange-traded product listed on NYSE Arca under the ticker ZCSH, with an August 21 filing indicating shares were anticipated to begin trading on or around August 25, subject to regulatory approvals, alongside a name change to The Zcash ETF. The fund is described as holding up to 393,000 ZEC, worth over $260 million at current prices. Earlier filings also disclosed that DCG International Investments held non-binding discussions involving roughly 200,000 ZEC through the trust.
Every document in that process is public and searchable through SEC EDGAR, which is where anyone should verify the status rather than relying on commentary, including this article.
Why it matters more here than it would for most assets: privacy coins have spent a decade being removed from regulated venues, not added to them. This site’s comparison of Zcash and Monero scored Zcash ahead specifically on access and regulatory exposure, arguing that the sector’s dividing line is permission rather than cryptography. A US-listed spot vehicle is that argument arriving in physical form.
Two: the Bitcoin comparison finally got traction
Zcash inherited Bitcoin’s architecture directly: a 21 million supply cap, proof-of-work mining and a halving schedule, with shielded transactions layered on top. This site made the same comparison in July, noting that the entire bull argument compresses into a single claim, that an asset with Bitcoin’s emission discipline plus privacy should not trade at a tiny fraction of Bitcoin’s price.
That ratio has moved substantially in the bulls’ favour since. In July it stood near 132 to 1. With ZEC at $821.79 and Bitcoin at $79,056, it is now closer to 96 to 1.
Network development supported the narrative: an Ironwood upgrade activated in late July introducing a new shielded pool with quantum-recoverable notes and a supply-verification turnstile, with a further NU7 upgrade snapshot dated August 24.
Three, and this is the part to read twice
Futures volume has been running at roughly $9.5 billion against just over $1 billion in spot trading.
That ratio, close to nine to one, is the most important number in this rally and the one most coverage skips. It means the price is being set overwhelmingly in leveraged derivatives markets rather than by people buying and holding the actual asset. Reported moves included the token trading between roughly $589 and $851 within a single 24-hour window, which is what a leverage-driven market looks like from the inside.
There is a second detail that sharpens it. Social volume on August 21 reached only 138 mentions, roughly 88% below the 1,116 recorded before the June bottom. So trading participation expanded dramatically while public discussion did not. A rally driven by derivatives desks rather than by a retail crowd.
Both readings deserve space. The constructive one: rallies without retail euphoria have not yet burned their most obvious fuel, and there is a crowd that has not arrived. The cautionary one: leverage cuts both ways with equal enthusiasm, and a nine-to-one futures ratio is the configuration that produces the fastest reversals in this market. This site’s explanation of how liquidation cascades work applies directly here, in both directions.
The seven-day relative strength index has been reported as high as 88, which is about as overbought as this indicator gets.
What has not changed
The risk this site has flagged in every Zcash piece since July has not moved. The European Union’s anti-money-laundering framework is set to restrict anonymity-enhancing tokens at regulated providers from July 1, 2027. No technical level accounts for a regulatory date, a 75% gain does not reduce that exposure, and an ETF listing in the United States does not bind European regulators.
The levels that matter now
The $800 line is the structural one, because it was Zcash’s January 2018 peak and stood as long-term resistance for eight years. Reclaimed levels of that age tend to become meaningful support if they hold. Analysts have identified the $780 to $800 zone as the near-term support to watch, with $880 as the next upside test and a break lower risking a move toward the $716 area. Above the current price, $1,000 is the round number the market is now openly discussing.
So should anyone chase this?
That is not a question this site answers, but the framework is straightforward. The ETF is a genuine structural development that changes who can buy Zcash. The Bitcoin-architecture argument is real and has been repriced, not resolved. And the mechanism carrying the price right now is leverage, which is fast, finite and reverses hard.
The honest summary of a rally this size is that the strongest part of the story, regulated access, arrives on a specific date that has now passed or is passing, and the market has already priced a great deal of anticipation into it. What happens after a long-awaited launch actually lists is one of the more reliable disappointments in this industry, and it is worth watching the ETF’s initial flows rather than its headlines.
This article is for information only and is not investment advice. Crypto assets are extremely volatile and you can lose your entire stake. Always do your own research.
Live price per CoinGecko, with ZEC sitting in CoinGecko’s most viewed list alongside Bitcoin at $79,056.
One: an actual ETF, with a date
Grayscale filed to convert its Zcash Trust into a spot exchange-traded product listed on NYSE Arca under the ticker ZCSH, with an August 21 filing indicating shares were anticipated to begin trading on or around August 25, subject to regulatory approvals, alongside a name change to The Zcash ETF. The fund is described as holding up to 393,000 ZEC, worth over $260 million at current prices. Earlier filings also disclosed that DCG International Investments held non-binding discussions involving roughly 200,000 ZEC through the trust.
Every document in that process is public and searchable through SEC EDGAR, which is where anyone should verify the status rather than relying on commentary, including this article.
Why it matters more here than it would for most assets: privacy coins have spent a decade being removed from regulated venues, not added to them. This site’s comparison of Zcash and Monero scored Zcash ahead specifically on access and regulatory exposure, arguing that the sector’s dividing line is permission rather than cryptography. A US-listed spot vehicle is that argument arriving in physical form.
Two: the Bitcoin comparison finally got traction
Zcash inherited Bitcoin’s architecture directly: a 21 million supply cap, proof-of-work mining and a halving schedule, with shielded transactions layered on top. This site made the same comparison in July, noting that the entire bull argument compresses into a single claim, that an asset with Bitcoin’s emission discipline plus privacy should not trade at a tiny fraction of Bitcoin’s price.
That ratio has moved substantially in the bulls’ favour since. In July it stood near 132 to 1. With ZEC at $821.79 and Bitcoin at $79,056, it is now closer to 96 to 1.
Network development supported the narrative: an Ironwood upgrade activated in late July introducing a new shielded pool with quantum-recoverable notes and a supply-verification turnstile, with a further NU7 upgrade snapshot dated August 24.
Three, and this is the part to read twice
Futures volume has been running at roughly $9.5 billion against just over $1 billion in spot trading.
That ratio, close to nine to one, is the most important number in this rally and the one most coverage skips. It means the price is being set overwhelmingly in leveraged derivatives markets rather than by people buying and holding the actual asset. Reported moves included the token trading between roughly $589 and $851 within a single 24-hour window, which is what a leverage-driven market looks like from the inside.
There is a second detail that sharpens it. Social volume on August 21 reached only 138 mentions, roughly 88% below the 1,116 recorded before the June bottom. So trading participation expanded dramatically while public discussion did not. A rally driven by derivatives desks rather than by a retail crowd.
Both readings deserve space. The constructive one: rallies without retail euphoria have not yet burned their most obvious fuel, and there is a crowd that has not arrived. The cautionary one: leverage cuts both ways with equal enthusiasm, and a nine-to-one futures ratio is the configuration that produces the fastest reversals in this market. This site’s explanation of how liquidation cascades work applies directly here, in both directions.
The seven-day relative strength index has been reported as high as 88, which is about as overbought as this indicator gets.
What has not changed
The risk this site has flagged in every Zcash piece since July has not moved. The European Union’s anti-money-laundering framework is set to restrict anonymity-enhancing tokens at regulated providers from July 1, 2027. No technical level accounts for a regulatory date, a 75% gain does not reduce that exposure, and an ETF listing in the United States does not bind European regulators.
The levels that matter now
The $800 line is the structural one, because it was Zcash’s January 2018 peak and stood as long-term resistance for eight years. Reclaimed levels of that age tend to become meaningful support if they hold. Analysts have identified the $780 to $800 zone as the near-term support to watch, with $880 as the next upside test and a break lower risking a move toward the $716 area. Above the current price, $1,000 is the round number the market is now openly discussing.
So should anyone chase this?
That is not a question this site answers, but the framework is straightforward. The ETF is a genuine structural development that changes who can buy Zcash. The Bitcoin-architecture argument is real and has been repriced, not resolved. And the mechanism carrying the price right now is leverage, which is fast, finite and reverses hard.
The honest summary of a rally this size is that the strongest part of the story, regulated access, arrives on a specific date that has now passed or is passing, and the market has already priced a great deal of anticipation into it. What happens after a long-awaited launch actually lists is one of the more reliable disappointments in this industry, and it is worth watching the ETF’s initial flows rather than its headlines.
This article is for information only and is not investment advice. Crypto assets are extremely volatile and you can lose your entire stake. Always do your own research.
342
BNB Chain Activates Pasteur Hard Fork to Harden Bridge SecurityBNB Chain activated the Pasteur hard fork on BNB Smart Chain mainnet at 02:30 UTC on Aug. 25, introducing three changes focused on bridge security, validator authorization and block capacity, crypto.news reported.
The fork proceeded without major disruption, with BSC continuing to produce blocks at its existing 450-millisecond interval.
What Pasteur changes
Pasteur combines BEP-682, BEP-695 and BEP-675 under the broader BEP-673 upgrade plan, and the changes had run on BSC’s Chapel testnet since July 21 before reaching mainnet. BEP-682 changes how the network verifies light blocks submitted through cross-chain infrastructure: it now rejects duplicate validator entries before calculating whether a voting threshold has been reached, closing a gap that could have made a bridge approval appear to carry more independent support than it actually did.
Validator and governance fixes
BEP-695 closes gaps around validator key rotation, penalties and governance. When a validator replaces its operator key, the previous key now loses its management rights, and validators cannot escape pending penalties by rotating keys. The updated contracts also check the original signer before counting a delegated vote, blocking restricted addresses from using offchain signatures to participate in governance. Node operators were required to run client v1.7.7 for the upgrade.
More room for transactions
BEP-675 introduces an optional route for specialist builders to submit blocks they have already executed, letting validators sign without re-running full execution. Builders can keep using the previous process, and the new route must be enabled through the network’s remote procedure call interface. In controlled QANet testing, throughput rose from 1,237 to 2,324 transactions per second while average gas consumption per block rose from 46.35 million to 84.15 million and the 450-millisecond block time and 100-million gas limit stayed unchanged. BNB Chain noted the performance figures came from controlled testing rather than mainnet activity, and it did not report that the bridge flaw had been exploited, describing the change as preventive. Cross-chain bridges have been responsible for billions of dollars in cumulative losses through compromised keys, contract flaws and weak message verification, making the Pasteur checks a timely hardening step.
The upgrade follows the recent bridge-security episode on BNB Chain, underscoring how cross-chain infrastructure remains a top target.
BNB Chain Activates Pasteur Hard Fork to Harden Bridge Security
BNB Chain activated the Pasteur hard fork on BNB Smart Chain mainnet at 02:30 UTC on Aug. 25, introducing three changes focused on bridge security, validator authorization and block capacity, crypto.news reported.
The fork proceeded without major disruption, with BSC continuing to produce blocks at its existing 450-millisecond interval.
What Pasteur changes
Pasteur combines BEP-682, BEP-695 and BEP-675 under the broader BEP-673 upgrade plan, and the changes had run on BSC’s Chapel testnet since July 21 before reaching mainnet. BEP-682 changes how the network verifies light blocks submitted through cross-chain infrastructure: it now rejects duplicate validator entries before calculating whether a voting threshold has been reached, closing a gap that could have made a bridge approval appear to carry more independent support than it actually did.
Validator and governance fixes
BEP-695 closes gaps around validator key rotation, penalties and governance. When a validator replaces its operator key, the previous key now loses its management rights, and validators cannot escape pending penalties by rotating keys. The updated contracts also check the original signer before counting a delegated vote, blocking restricted addresses from using offchain signatures to participate in governance. Node operators were required to run client v1.7.7 for the upgrade.
More room for transactions
BEP-675 introduces an optional route for specialist builders to submit blocks they have already executed, letting validators sign without re-running full execution. Builders can keep using the previous process, and the new route must be enabled through the network’s remote procedure call interface. In controlled QANet testing, throughput rose from 1,237 to 2,324 transactions per second while average gas consumption per block rose from 46.35 million to 84.15 million and the 450-millisecond block time and 100-million gas limit stayed unchanged. BNB Chain noted the performance figures came from controlled testing rather than mainnet activity, and it did not report that the bridge flaw had been exploited, describing the change as preventive. Cross-chain bridges have been responsible for billions of dollars in cumulative losses through compromised keys, contract flaws and weak message verification, making the Pasteur checks a timely hardening step.
The upgrade follows the recent bridge-security episode on BNB Chain, underscoring how cross-chain infrastructure remains a top target.
The fork proceeded without major disruption, with BSC continuing to produce blocks at its existing 450-millisecond interval.
What Pasteur changes
Pasteur combines BEP-682, BEP-695 and BEP-675 under the broader BEP-673 upgrade plan, and the changes had run on BSC’s Chapel testnet since July 21 before reaching mainnet. BEP-682 changes how the network verifies light blocks submitted through cross-chain infrastructure: it now rejects duplicate validator entries before calculating whether a voting threshold has been reached, closing a gap that could have made a bridge approval appear to carry more independent support than it actually did.
Validator and governance fixes
BEP-695 closes gaps around validator key rotation, penalties and governance. When a validator replaces its operator key, the previous key now loses its management rights, and validators cannot escape pending penalties by rotating keys. The updated contracts also check the original signer before counting a delegated vote, blocking restricted addresses from using offchain signatures to participate in governance. Node operators were required to run client v1.7.7 for the upgrade.
More room for transactions
BEP-675 introduces an optional route for specialist builders to submit blocks they have already executed, letting validators sign without re-running full execution. Builders can keep using the previous process, and the new route must be enabled through the network’s remote procedure call interface. In controlled QANet testing, throughput rose from 1,237 to 2,324 transactions per second while average gas consumption per block rose from 46.35 million to 84.15 million and the 450-millisecond block time and 100-million gas limit stayed unchanged. BNB Chain noted the performance figures came from controlled testing rather than mainnet activity, and it did not report that the bridge flaw had been exploited, describing the change as preventive. Cross-chain bridges have been responsible for billions of dollars in cumulative losses through compromised keys, contract flaws and weak message verification, making the Pasteur checks a timely hardening step.
The upgrade follows the recent bridge-security episode on BNB Chain, underscoring how cross-chain infrastructure remains a top target.
47
Article
Bitcoin Taps 15-Week Peak Above $81K, but the Rally Now Hinges on Holding $80,000Quick Take
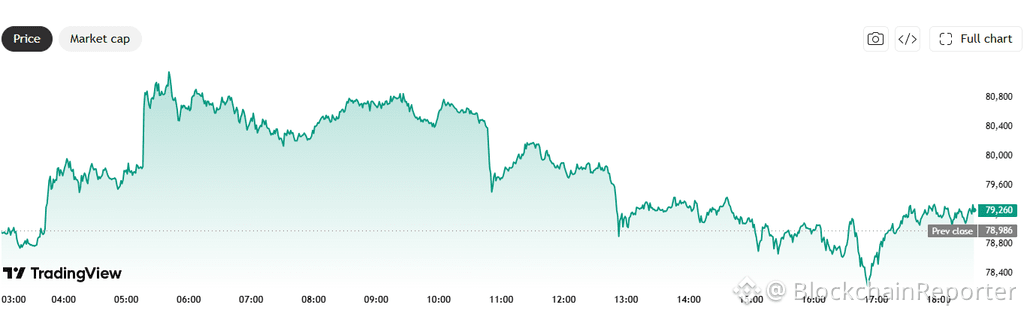
1. Bitcoin touched $81,257 on August 25, its highest price since mid-May, before easing back toward $79,000, extending a seven-day gain of roughly 25%.
2. US spot Bitcoin ETFs took in about $1.92 billion in the week to August 21, their strongest weekly intake since October 2025, across five consecutive sessions of inflows.
3. The move began as a short squeeze, daily RSI has run above 84, and 84 of the QC 100 constituents are already declining, so the rally needs acceptance above $80,000 rather than a single spike through it.
Bitcoin reached $81,257 in Tuesday trading before reversing, its first move above $80,000 since mid-May and a 15-week peak. The token has since settled back toward $79,000, leaving the round number directly overhead as the level that decides whether this is a breakout or an overshoot.
Live price data via CoinGecko. Total crypto market capitalization stands at $2.69 trillion on $171.56 billion of daily volume, with Bitcoin dominance at 59.25% and Ethereum at 11.13%, per QuantifyCrypto. The breadth reading is the detail worth holding: of the QC 100 index, 84 constituents are declining against 16 advancing.
How did Bitcoin get from $64,000 to $81,000?
In eight sessions, through a breakout, a weekend pullback and a fresh push. The route matters more than the destination here, because each leg had a different driver.
The advance began last week from around $64,000, when the US Treasury announced it would double its long-dated buyback ceiling from $2 billion to at least $4 billion per operation, running from September 9. Long yields fell, risk assets rallied together, and roughly $2.7 billion of bearish crypto positions were liquidated. Bitcoin cleared $70,000 within hours, then $75,000. The weekend brought the correction the pace demanded, with price slipping to $75,500. Buyers returned at the start of the business week and pushed through $81,000 on Tuesday morning, where the move stalled.
Measured from the late-June low beneath $58,000, Bitcoin is up roughly 38%. Measured over eight days, roughly 28%, an advance that has added around $350 billion to its market capitalization and lifted it to about $1.6 trillion.
BTCUSD daily from TradingView Is the Bitcoin rally backed by real buying?
Partly, and that is the honest answer rather than a hedge. Two different flows are at work and only one of them can repeat.
The forced part came first. A short squeeze drove the initial move, with traders positioned for Bitcoin to stay below $67,000 unwound rapidly, and CoinGlass recorded roughly $452 million of short liquidations in the most recent 24-hour window alone. A short squeeze is forced buying from traders whose bearish positions are automatically closed by an exchange when price moves against them, which makes it real buying with a finite fuel supply.
The voluntary part is the reason this looks different from a simple squeeze. US spot Bitcoin ETFs recorded approximately $1.92 billion in net inflows in the week ending August 21, their strongest week since October 2025, with capital arriving across five consecutive sessions. Daily flow tables are published openly at Farside Investors and SoSoValue, which means the continuation of this can be checked rather than assumed.
The boundary on that figure is worth stating: one strong week establishes that spot demand returned during a rally. It does not establish that the same buyers return once the price is 25% higher, and a single week is not a trend.
What are the warning signs?
Momentum readings are stretched and the level has not been accepted yet. Daily RSI has printed above 84 and the Money Flow Index near 77.22, both deep into territory that usually precedes consolidation rather than continuation.
Positioning tells a similar story from another angle. Glassnode noted that Bitcoin’s options skew has fallen to its lowest level of the year across the curve, with front-end skew turning negative, meaning traders are paying more for upside calls than for downside protection. That is a measure of enthusiasm, and enthusiasm at a 15-week high is the configuration that produces sharp pullbacks.
Fundstrat’s Tom Lee has framed a near-term range of $74,000 to $81,000, which places the current price at the top of an expected consolidation band rather than at the start of a new leg.
What levels matter now?
$80,000 above, $75,500 below. Everything else is noise until one of them resolves.
Acceptance above $80,000, meaning daily closes rather than an intraday spike, would open the $82,000 to $87,000 area where there is limited recent trading history. Failure there, especially if ETF inflows slow, points back toward $75,500, the weekend low that buyers already defended once.
This site tracked the $60,000 to $64,000 range through July and set two conditions for treating its break as real: acceptance above the old ceiling, and volume persistence. Both held, and Bitcoin has since travelled roughly 25% higher. The same two conditions apply at $80,000, with the same logic. For context on how far the recovery still has to run, Bitcoin remains around 36% below its all-time high near $126,000 set in October 2025.
Which altcoins moved with it?
Almost none of them today, and that is the story. Every one of the ten tracked sectors is red, with memes worst at minus 2.93%, platforms at minus 2.30% and DeFi at minus 2.18%.
Monero is the exception among large caps, up 5.11% to $446.88 on a day when nearly everything else fell. Hyperliquid held a 0.97% gain at $80.96, and Solana added 0.86% to $97.99, just under the $100 it cleared earlier in the session.
The rest gave ground. Ether fell 1.84% to $2,474.96, XRP dropped 3.57% to $1.4706, Dogecoin lost 4.34%, Cardano 4.85%, Stellar 4.86%, and Zcash gave back 5.96% to $807.73.
Weekly figures tell the opposite story and belong beside the daily ones. Over seven days Zcash is up 62.38%, XRP 46.93%, Hyperliquid 36.78%, Bitcoin Cash 31.51%, Ethereum 29.67%, Solana 27.45% and Bitcoin 22.50%. Today is a pause inside a week that repriced the entire market, not a reversal of it.
Among smaller caps the dispersion is extreme in both directions: AGI gained 66.22% and ONG 39.31%, while DENT fell 29.06% and VELVET 22.29%.
Cryptocurrency Market Overview August 25. Source: QuantifyCrypto Bottom line
Bitcoin’s move to a 15-week peak at $81,257 was driven by a short squeeze and the strongest week of ETF inflows since October 2025, and its continuation now depends on whether the market accepts $80,000 as support rather than treating it as a ceiling.
The squeeze cannot repeat, the ETF flows can. Which of those two the next week resembles is the whole question, and it will be visible in the flow tables long before it is obvious on the chart. Today’s breadth reading, with 84 of 100 assets falling while Bitcoin dominance climbs to 59.25%, suggests the market has already started choosing.
This article is for information only and is not investment advice. Crypto assets are extremely volatile and you can lose your entire stake. Always do your own research.
Bitcoin Taps 15-Week Peak Above $81K, but the Rally Now Hinges on Holding $80,000
Quick Take
1. Bitcoin touched $81,257 on August 25, its highest price since mid-May, before easing back toward $79,000, extending a seven-day gain of roughly 25%.
2. US spot Bitcoin ETFs took in about $1.92 billion in the week to August 21, their strongest weekly intake since October 2025, across five consecutive sessions of inflows.
3. The move began as a short squeeze, daily RSI has run above 84, and 84 of the QC 100 constituents are already declining, so the rally needs acceptance above $80,000 rather than a single spike through it.
Bitcoin reached $81,257 in Tuesday trading before reversing, its first move above $80,000 since mid-May and a 15-week peak. The token has since settled back toward $79,000, leaving the round number directly overhead as the level that decides whether this is a breakout or an overshoot.
Live price data via CoinGecko. Total crypto market capitalization stands at $2.69 trillion on $171.56 billion of daily volume, with Bitcoin dominance at 59.25% and Ethereum at 11.13%, per QuantifyCrypto. The breadth reading is the detail worth holding: of the QC 100 index, 84 constituents are declining against 16 advancing.
How did Bitcoin get from $64,000 to $81,000?
In eight sessions, through a breakout, a weekend pullback and a fresh push. The route matters more than the destination here, because each leg had a different driver.
The advance began last week from around $64,000, when the US Treasury announced it would double its long-dated buyback ceiling from $2 billion to at least $4 billion per operation, running from September 9. Long yields fell, risk assets rallied together, and roughly $2.7 billion of bearish crypto positions were liquidated. Bitcoin cleared $70,000 within hours, then $75,000. The weekend brought the correction the pace demanded, with price slipping to $75,500. Buyers returned at the start of the business week and pushed through $81,000 on Tuesday morning, where the move stalled.
Measured from the late-June low beneath $58,000, Bitcoin is up roughly 38%. Measured over eight days, roughly 28%, an advance that has added around $350 billion to its market capitalization and lifted it to about $1.6 trillion.
BTCUSD daily from TradingView Is the Bitcoin rally backed by real buying?
Partly, and that is the honest answer rather than a hedge. Two different flows are at work and only one of them can repeat.
The forced part came first. A short squeeze drove the initial move, with traders positioned for Bitcoin to stay below $67,000 unwound rapidly, and CoinGlass recorded roughly $452 million of short liquidations in the most recent 24-hour window alone. A short squeeze is forced buying from traders whose bearish positions are automatically closed by an exchange when price moves against them, which makes it real buying with a finite fuel supply.
The voluntary part is the reason this looks different from a simple squeeze. US spot Bitcoin ETFs recorded approximately $1.92 billion in net inflows in the week ending August 21, their strongest week since October 2025, with capital arriving across five consecutive sessions. Daily flow tables are published openly at Farside Investors and SoSoValue, which means the continuation of this can be checked rather than assumed.
The boundary on that figure is worth stating: one strong week establishes that spot demand returned during a rally. It does not establish that the same buyers return once the price is 25% higher, and a single week is not a trend.
What are the warning signs?
Momentum readings are stretched and the level has not been accepted yet. Daily RSI has printed above 84 and the Money Flow Index near 77.22, both deep into territory that usually precedes consolidation rather than continuation.
Positioning tells a similar story from another angle. Glassnode noted that Bitcoin’s options skew has fallen to its lowest level of the year across the curve, with front-end skew turning negative, meaning traders are paying more for upside calls than for downside protection. That is a measure of enthusiasm, and enthusiasm at a 15-week high is the configuration that produces sharp pullbacks.
Fundstrat’s Tom Lee has framed a near-term range of $74,000 to $81,000, which places the current price at the top of an expected consolidation band rather than at the start of a new leg.
What levels matter now?
$80,000 above, $75,500 below. Everything else is noise until one of them resolves.
Acceptance above $80,000, meaning daily closes rather than an intraday spike, would open the $82,000 to $87,000 area where there is limited recent trading history. Failure there, especially if ETF inflows slow, points back toward $75,500, the weekend low that buyers already defended once.
This site tracked the $60,000 to $64,000 range through July and set two conditions for treating its break as real: acceptance above the old ceiling, and volume persistence. Both held, and Bitcoin has since travelled roughly 25% higher. The same two conditions apply at $80,000, with the same logic. For context on how far the recovery still has to run, Bitcoin remains around 36% below its all-time high near $126,000 set in October 2025.
Which altcoins moved with it?
Almost none of them today, and that is the story. Every one of the ten tracked sectors is red, with memes worst at minus 2.93%, platforms at minus 2.30% and DeFi at minus 2.18%.
Monero is the exception among large caps, up 5.11% to $446.88 on a day when nearly everything else fell. Hyperliquid held a 0.97% gain at $80.96, and Solana added 0.86% to $97.99, just under the $100 it cleared earlier in the session.
The rest gave ground. Ether fell 1.84% to $2,474.96, XRP dropped 3.57% to $1.4706, Dogecoin lost 4.34%, Cardano 4.85%, Stellar 4.86%, and Zcash gave back 5.96% to $807.73.
Weekly figures tell the opposite story and belong beside the daily ones. Over seven days Zcash is up 62.38%, XRP 46.93%, Hyperliquid 36.78%, Bitcoin Cash 31.51%, Ethereum 29.67%, Solana 27.45% and Bitcoin 22.50%. Today is a pause inside a week that repriced the entire market, not a reversal of it.
Among smaller caps the dispersion is extreme in both directions: AGI gained 66.22% and ONG 39.31%, while DENT fell 29.06% and VELVET 22.29%.
Cryptocurrency Market Overview August 25. Source: QuantifyCrypto Bottom line
Bitcoin’s move to a 15-week peak at $81,257 was driven by a short squeeze and the strongest week of ETF inflows since October 2025, and its continuation now depends on whether the market accepts $80,000 as support rather than treating it as a ceiling.
The squeeze cannot repeat, the ETF flows can. Which of those two the next week resembles is the whole question, and it will be visible in the flow tables long before it is obvious on the chart. Today’s breadth reading, with 84 of 100 assets falling while Bitcoin dominance climbs to 59.25%, suggests the market has already started choosing.
This article is for information only and is not investment advice. Crypto assets are extremely volatile and you can lose your entire stake. Always do your own research.
1. Bitcoin touched $81,257 on August 25, its highest price since mid-May, before easing back toward $79,000, extending a seven-day gain of roughly 25%.
2. US spot Bitcoin ETFs took in about $1.92 billion in the week to August 21, their strongest weekly intake since October 2025, across five consecutive sessions of inflows.
3. The move began as a short squeeze, daily RSI has run above 84, and 84 of the QC 100 constituents are already declining, so the rally needs acceptance above $80,000 rather than a single spike through it.
Bitcoin reached $81,257 in Tuesday trading before reversing, its first move above $80,000 since mid-May and a 15-week peak. The token has since settled back toward $79,000, leaving the round number directly overhead as the level that decides whether this is a breakout or an overshoot.
Live price data via CoinGecko. Total crypto market capitalization stands at $2.69 trillion on $171.56 billion of daily volume, with Bitcoin dominance at 59.25% and Ethereum at 11.13%, per QuantifyCrypto. The breadth reading is the detail worth holding: of the QC 100 index, 84 constituents are declining against 16 advancing.
How did Bitcoin get from $64,000 to $81,000?
In eight sessions, through a breakout, a weekend pullback and a fresh push. The route matters more than the destination here, because each leg had a different driver.
The advance began last week from around $64,000, when the US Treasury announced it would double its long-dated buyback ceiling from $2 billion to at least $4 billion per operation, running from September 9. Long yields fell, risk assets rallied together, and roughly $2.7 billion of bearish crypto positions were liquidated. Bitcoin cleared $70,000 within hours, then $75,000. The weekend brought the correction the pace demanded, with price slipping to $75,500. Buyers returned at the start of the business week and pushed through $81,000 on Tuesday morning, where the move stalled.
Measured from the late-June low beneath $58,000, Bitcoin is up roughly 38%. Measured over eight days, roughly 28%, an advance that has added around $350 billion to its market capitalization and lifted it to about $1.6 trillion.
BTCUSD daily from TradingView Is the Bitcoin rally backed by real buying?
Partly, and that is the honest answer rather than a hedge. Two different flows are at work and only one of them can repeat.
The forced part came first. A short squeeze drove the initial move, with traders positioned for Bitcoin to stay below $67,000 unwound rapidly, and CoinGlass recorded roughly $452 million of short liquidations in the most recent 24-hour window alone. A short squeeze is forced buying from traders whose bearish positions are automatically closed by an exchange when price moves against them, which makes it real buying with a finite fuel supply.
The voluntary part is the reason this looks different from a simple squeeze. US spot Bitcoin ETFs recorded approximately $1.92 billion in net inflows in the week ending August 21, their strongest week since October 2025, with capital arriving across five consecutive sessions. Daily flow tables are published openly at Farside Investors and SoSoValue, which means the continuation of this can be checked rather than assumed.
The boundary on that figure is worth stating: one strong week establishes that spot demand returned during a rally. It does not establish that the same buyers return once the price is 25% higher, and a single week is not a trend.
What are the warning signs?
Momentum readings are stretched and the level has not been accepted yet. Daily RSI has printed above 84 and the Money Flow Index near 77.22, both deep into territory that usually precedes consolidation rather than continuation.
Positioning tells a similar story from another angle. Glassnode noted that Bitcoin’s options skew has fallen to its lowest level of the year across the curve, with front-end skew turning negative, meaning traders are paying more for upside calls than for downside protection. That is a measure of enthusiasm, and enthusiasm at a 15-week high is the configuration that produces sharp pullbacks.
Fundstrat’s Tom Lee has framed a near-term range of $74,000 to $81,000, which places the current price at the top of an expected consolidation band rather than at the start of a new leg.
What levels matter now?
$80,000 above, $75,500 below. Everything else is noise until one of them resolves.
Acceptance above $80,000, meaning daily closes rather than an intraday spike, would open the $82,000 to $87,000 area where there is limited recent trading history. Failure there, especially if ETF inflows slow, points back toward $75,500, the weekend low that buyers already defended once.
This site tracked the $60,000 to $64,000 range through July and set two conditions for treating its break as real: acceptance above the old ceiling, and volume persistence. Both held, and Bitcoin has since travelled roughly 25% higher. The same two conditions apply at $80,000, with the same logic. For context on how far the recovery still has to run, Bitcoin remains around 36% below its all-time high near $126,000 set in October 2025.
Which altcoins moved with it?
Almost none of them today, and that is the story. Every one of the ten tracked sectors is red, with memes worst at minus 2.93%, platforms at minus 2.30% and DeFi at minus 2.18%.
Monero is the exception among large caps, up 5.11% to $446.88 on a day when nearly everything else fell. Hyperliquid held a 0.97% gain at $80.96, and Solana added 0.86% to $97.99, just under the $100 it cleared earlier in the session.
The rest gave ground. Ether fell 1.84% to $2,474.96, XRP dropped 3.57% to $1.4706, Dogecoin lost 4.34%, Cardano 4.85%, Stellar 4.86%, and Zcash gave back 5.96% to $807.73.
Weekly figures tell the opposite story and belong beside the daily ones. Over seven days Zcash is up 62.38%, XRP 46.93%, Hyperliquid 36.78%, Bitcoin Cash 31.51%, Ethereum 29.67%, Solana 27.45% and Bitcoin 22.50%. Today is a pause inside a week that repriced the entire market, not a reversal of it.
Among smaller caps the dispersion is extreme in both directions: AGI gained 66.22% and ONG 39.31%, while DENT fell 29.06% and VELVET 22.29%.
Cryptocurrency Market Overview August 25. Source: QuantifyCrypto Bottom line
Bitcoin’s move to a 15-week peak at $81,257 was driven by a short squeeze and the strongest week of ETF inflows since October 2025, and its continuation now depends on whether the market accepts $80,000 as support rather than treating it as a ceiling.
The squeeze cannot repeat, the ETF flows can. Which of those two the next week resembles is the whole question, and it will be visible in the flow tables long before it is obvious on the chart. Today’s breadth reading, with 84 of 100 assets falling while Bitcoin dominance climbs to 59.25%, suggests the market has already started choosing.
This article is for information only and is not investment advice. Crypto assets are extremely volatile and you can lose your entire stake. Always do your own research.
184
Why Stablecoins Are Emerging As 24/7 FX InfrastructureCross-border payments have become increasingly digital, but much of the financial infrastructure underpinning them still operates around traditional banking and settlement hours.
Stablecoins offer a different model. Dollar-backed tokens such as USDT and USDC can move and settle across blockchain networks around the clock, creating access to dollar-denominated liquidity even when conventional banking infrastructure is offline.
That difference is increasingly visible in the data. Coinbase Institutional found that weekend activity has consistently accounted for roughly 20% of weekly adjusted stablecoin volume over several years. In other words, a meaningful share of stablecoin activity is taking place precisely when many traditional financial rails are unavailable for settlement.
Stablecoin payments themselves are also growing. Research firm Artemis tracked $136 billion in stablecoin payment settlements between January 2023 and February 2025. By August 2025, the annualized pace of those payments had reached approximately $122 billion, with monthly volume reaching roughly $10.2 billion.
The Philippines as a test case
The Philippines offers a particularly relevant example. Overseas Filipino workers sent $35.63 billion in cash remittances through banks and regulated financial institutions in 2025, up 3.3% from the previous year, according to the Bangko Sentral ng Pilipinas.
That creates a large market where the ability to continuously convert dollars into Philippine pesos has practical value.
Coins.ph, a Philippine crypto exchange and e-wallet licensed by the country’s central bank, has been building USDT and USDC-to-peso liquidity around that demand. The company says its peso order book currently handles around $100 million a day in USDT and USDC trading.
“The bigger difference is the FX layer,” Coins.ph CEO Wei Zhou said in a recent interview. “Outside the US, nothing converts one to one. The price changes constantly, and with that comes uncertainty: is this the right price, and how much can I actually execute at it?”
The distinction becomes particularly visible outside normal banking hours.
“On the weekends we see higher stablecoin trading volume than on weekdays, because the banks are closed,” Zhou said. “There are no rates on the weekend.”
For remittance companies, the problem is practical. A provider processing a transfer from the United States to the Philippines on a Saturday still needs to determine how many pesos the recipient should receive. Without an executable FX price, the provider may need to account for potential currency movements before conventional markets reopen.
A continuously traded USDT or USDC-to-peso market offers another route, allowing payment providers to potentially access executable local-currency liquidity outside conventional FX hours.
This is already moving beyond theory. Remitly and Coins.ph launched a remittance solution in early 2026 that converts U.S. or Canadian fiat into stablecoins for the transfer leg before delivering Philippine pesos to a Coins.ph wallet or connected bank account. The companies say the structure enables near-real-time settlement.
The composition of stablecoin liquidity is changing as well. Zhou says USDC now represents roughly 40% of stablecoin volume on Coins.ph, compared with a market that was almost entirely USDT two years ago. He attributes part of that shift to U.S. businesses and financial institutions using USDC for overseas payouts.
An always-on layer for cross-border payments
The dynamic is not limited to the Philippines.
In Nigeria, the International Monetary Fund has identified constraints on access to foreign exchange as one factor increasing the relative attractiveness of stablecoins for cross-border transactions. The IMF noted that stablecoins can reduce reliance on correspondent banking networks and intermediaries, potentially enabling faster and cheaper international transfers.
The cost gap in some corridors remains substantial. The same IMF report, citing World Bank data, puts the global average cost of sending $200 internationally at 6.49%, rising to 8.78% in Sub-Saharan Africa. The IMF cautions, however, that the final cost of a stablecoin transaction still depends on network fees as well as the cost of converting between fiat and digital assets.
None of this suggests stablecoins are about to replace the global foreign-exchange market. Traditional banks continue to provide deep liquidity, large transaction capacity and regulated financial infrastructure that stablecoin markets do not consistently match.
Instead, a more immediate role is emerging alongside that system: an always-on layer for moving dollar liquidity across borders and, increasingly, converting it into local currencies.
The roughly 20% of stablecoin activity occurring on weekends illustrates where that difference becomes most tangible. Cross-border payments do not stop when banks close, and the infrastructure supporting them is beginning to reflect that.
Why Stablecoins Are Emerging As 24/7 FX Infrastructure
Cross-border payments have become increasingly digital, but much of the financial infrastructure underpinning them still operates around traditional banking and settlement hours.
Stablecoins offer a different model. Dollar-backed tokens such as USDT and USDC can move and settle across blockchain networks around the clock, creating access to dollar-denominated liquidity even when conventional banking infrastructure is offline.
That difference is increasingly visible in the data. Coinbase Institutional found that weekend activity has consistently accounted for roughly 20% of weekly adjusted stablecoin volume over several years. In other words, a meaningful share of stablecoin activity is taking place precisely when many traditional financial rails are unavailable for settlement.
Stablecoin payments themselves are also growing. Research firm Artemis tracked $136 billion in stablecoin payment settlements between January 2023 and February 2025. By August 2025, the annualized pace of those payments had reached approximately $122 billion, with monthly volume reaching roughly $10.2 billion.
The Philippines as a test case
The Philippines offers a particularly relevant example. Overseas Filipino workers sent $35.63 billion in cash remittances through banks and regulated financial institutions in 2025, up 3.3% from the previous year, according to the Bangko Sentral ng Pilipinas.
That creates a large market where the ability to continuously convert dollars into Philippine pesos has practical value.
Coins.ph, a Philippine crypto exchange and e-wallet licensed by the country’s central bank, has been building USDT and USDC-to-peso liquidity around that demand. The company says its peso order book currently handles around $100 million a day in USDT and USDC trading.
“The bigger difference is the FX layer,” Coins.ph CEO Wei Zhou said in a recent interview. “Outside the US, nothing converts one to one. The price changes constantly, and with that comes uncertainty: is this the right price, and how much can I actually execute at it?”
The distinction becomes particularly visible outside normal banking hours.
“On the weekends we see higher stablecoin trading volume than on weekdays, because the banks are closed,” Zhou said. “There are no rates on the weekend.”
For remittance companies, the problem is practical. A provider processing a transfer from the United States to the Philippines on a Saturday still needs to determine how many pesos the recipient should receive. Without an executable FX price, the provider may need to account for potential currency movements before conventional markets reopen.
A continuously traded USDT or USDC-to-peso market offers another route, allowing payment providers to potentially access executable local-currency liquidity outside conventional FX hours.
This is already moving beyond theory. Remitly and Coins.ph launched a remittance solution in early 2026 that converts U.S. or Canadian fiat into stablecoins for the transfer leg before delivering Philippine pesos to a Coins.ph wallet or connected bank account. The companies say the structure enables near-real-time settlement.
The composition of stablecoin liquidity is changing as well. Zhou says USDC now represents roughly 40% of stablecoin volume on Coins.ph, compared with a market that was almost entirely USDT two years ago. He attributes part of that shift to U.S. businesses and financial institutions using USDC for overseas payouts.
An always-on layer for cross-border payments
The dynamic is not limited to the Philippines.
In Nigeria, the International Monetary Fund has identified constraints on access to foreign exchange as one factor increasing the relative attractiveness of stablecoins for cross-border transactions. The IMF noted that stablecoins can reduce reliance on correspondent banking networks and intermediaries, potentially enabling faster and cheaper international transfers.
The cost gap in some corridors remains substantial. The same IMF report, citing World Bank data, puts the global average cost of sending $200 internationally at 6.49%, rising to 8.78% in Sub-Saharan Africa. The IMF cautions, however, that the final cost of a stablecoin transaction still depends on network fees as well as the cost of converting between fiat and digital assets.
None of this suggests stablecoins are about to replace the global foreign-exchange market. Traditional banks continue to provide deep liquidity, large transaction capacity and regulated financial infrastructure that stablecoin markets do not consistently match.
Instead, a more immediate role is emerging alongside that system: an always-on layer for moving dollar liquidity across borders and, increasingly, converting it into local currencies.
The roughly 20% of stablecoin activity occurring on weekends illustrates where that difference becomes most tangible. Cross-border payments do not stop when banks close, and the infrastructure supporting them is beginning to reflect that.
Stablecoins offer a different model. Dollar-backed tokens such as USDT and USDC can move and settle across blockchain networks around the clock, creating access to dollar-denominated liquidity even when conventional banking infrastructure is offline.
That difference is increasingly visible in the data. Coinbase Institutional found that weekend activity has consistently accounted for roughly 20% of weekly adjusted stablecoin volume over several years. In other words, a meaningful share of stablecoin activity is taking place precisely when many traditional financial rails are unavailable for settlement.
Stablecoin payments themselves are also growing. Research firm Artemis tracked $136 billion in stablecoin payment settlements between January 2023 and February 2025. By August 2025, the annualized pace of those payments had reached approximately $122 billion, with monthly volume reaching roughly $10.2 billion.
The Philippines as a test case
The Philippines offers a particularly relevant example. Overseas Filipino workers sent $35.63 billion in cash remittances through banks and regulated financial institutions in 2025, up 3.3% from the previous year, according to the Bangko Sentral ng Pilipinas.
That creates a large market where the ability to continuously convert dollars into Philippine pesos has practical value.
Coins.ph, a Philippine crypto exchange and e-wallet licensed by the country’s central bank, has been building USDT and USDC-to-peso liquidity around that demand. The company says its peso order book currently handles around $100 million a day in USDT and USDC trading.
“The bigger difference is the FX layer,” Coins.ph CEO Wei Zhou said in a recent interview. “Outside the US, nothing converts one to one. The price changes constantly, and with that comes uncertainty: is this the right price, and how much can I actually execute at it?”
The distinction becomes particularly visible outside normal banking hours.
“On the weekends we see higher stablecoin trading volume than on weekdays, because the banks are closed,” Zhou said. “There are no rates on the weekend.”
For remittance companies, the problem is practical. A provider processing a transfer from the United States to the Philippines on a Saturday still needs to determine how many pesos the recipient should receive. Without an executable FX price, the provider may need to account for potential currency movements before conventional markets reopen.
A continuously traded USDT or USDC-to-peso market offers another route, allowing payment providers to potentially access executable local-currency liquidity outside conventional FX hours.
This is already moving beyond theory. Remitly and Coins.ph launched a remittance solution in early 2026 that converts U.S. or Canadian fiat into stablecoins for the transfer leg before delivering Philippine pesos to a Coins.ph wallet or connected bank account. The companies say the structure enables near-real-time settlement.
The composition of stablecoin liquidity is changing as well. Zhou says USDC now represents roughly 40% of stablecoin volume on Coins.ph, compared with a market that was almost entirely USDT two years ago. He attributes part of that shift to U.S. businesses and financial institutions using USDC for overseas payouts.
An always-on layer for cross-border payments
The dynamic is not limited to the Philippines.
In Nigeria, the International Monetary Fund has identified constraints on access to foreign exchange as one factor increasing the relative attractiveness of stablecoins for cross-border transactions. The IMF noted that stablecoins can reduce reliance on correspondent banking networks and intermediaries, potentially enabling faster and cheaper international transfers.
The cost gap in some corridors remains substantial. The same IMF report, citing World Bank data, puts the global average cost of sending $200 internationally at 6.49%, rising to 8.78% in Sub-Saharan Africa. The IMF cautions, however, that the final cost of a stablecoin transaction still depends on network fees as well as the cost of converting between fiat and digital assets.
None of this suggests stablecoins are about to replace the global foreign-exchange market. Traditional banks continue to provide deep liquidity, large transaction capacity and regulated financial infrastructure that stablecoin markets do not consistently match.
Instead, a more immediate role is emerging alongside that system: an always-on layer for moving dollar liquidity across borders and, increasingly, converting it into local currencies.
The roughly 20% of stablecoin activity occurring on weekends illustrates where that difference becomes most tangible. Cross-border payments do not stop when banks close, and the infrastructure supporting them is beginning to reflect that.
31
CME Group Adds Ethena (ENA) Reference Rates Across Three RegionsCME Group has added three regional U.S. dollar reference rates and real-time indices for Ethena’s ENA token, with daily publication beginning Aug. 24, crypto.news reported.
The new benchmarks
The suite uses the CME CF Ethena-Dollar Reference Rate for the London close under the ENAUSD RR identifier, while ENAUSD NY provides a New York closing rate and ENAUSD AP covers the end of the APAC trading day. Each rate is published at 4 p.m. in its respective region, letting firms select a valuation point that matches their working day. Publication continues seven days a week, including weekends and public holidays, reflecting the fact that ENA trades continuously even when traditional markets are closed.
Who calculates the rates
CF Benchmarks, the administrator that manages CME’s cryptocurrency indices, will calculate and publish the products. Rather than taking ENA’s price from a single platform, it draws on transactions from eligible spot exchanges that meet its constituent venue rules, reducing reliance on any one order book. Reference rates produce a fixed price for portfolio valuation and net asset value calculations, while real-time indices follow the token through the trading day for collateral monitoring and risk controls.
What it does not do
The announcement adds pricing tools, not a tradable contract. CME did not launch ENA futures, options or an exchange-traded fund, and any listed product would require its own terms and regulatory treatment. The addition places Ethena’s governance token beside a benchmark lineup that already spans Bitcoin, Ether, Solana, XRP, Cardano, Chainlink, Stellar, Avalanche and Sui, and follows CME’s June launch of Nasdaq CME Crypto Index futures and its May standard and micro futures for Avalanche and Sui.
For U.S. firms, the New York variant supplies an ENA price at 4 p.m. local time, aligning the benchmark with the close of the American equity trading day, and CF Benchmarks has long administered rates for CME’s crypto products, adding Crypto.com as a constituent exchange for Bitcoin and Ether indices in March 2025.
The move follows a sharp run in ENA this year; see our earlier look at Ethena’s recent market performance.
CME Group Adds Ethena (ENA) Reference Rates Across Three Regions
CME Group has added three regional U.S. dollar reference rates and real-time indices for Ethena’s ENA token, with daily publication beginning Aug. 24, crypto.news reported.
The new benchmarks
The suite uses the CME CF Ethena-Dollar Reference Rate for the London close under the ENAUSD RR identifier, while ENAUSD NY provides a New York closing rate and ENAUSD AP covers the end of the APAC trading day. Each rate is published at 4 p.m. in its respective region, letting firms select a valuation point that matches their working day. Publication continues seven days a week, including weekends and public holidays, reflecting the fact that ENA trades continuously even when traditional markets are closed.
Who calculates the rates
CF Benchmarks, the administrator that manages CME’s cryptocurrency indices, will calculate and publish the products. Rather than taking ENA’s price from a single platform, it draws on transactions from eligible spot exchanges that meet its constituent venue rules, reducing reliance on any one order book. Reference rates produce a fixed price for portfolio valuation and net asset value calculations, while real-time indices follow the token through the trading day for collateral monitoring and risk controls.
What it does not do
The announcement adds pricing tools, not a tradable contract. CME did not launch ENA futures, options or an exchange-traded fund, and any listed product would require its own terms and regulatory treatment. The addition places Ethena’s governance token beside a benchmark lineup that already spans Bitcoin, Ether, Solana, XRP, Cardano, Chainlink, Stellar, Avalanche and Sui, and follows CME’s June launch of Nasdaq CME Crypto Index futures and its May standard and micro futures for Avalanche and Sui.
For U.S. firms, the New York variant supplies an ENA price at 4 p.m. local time, aligning the benchmark with the close of the American equity trading day, and CF Benchmarks has long administered rates for CME’s crypto products, adding Crypto.com as a constituent exchange for Bitcoin and Ether indices in March 2025.
The move follows a sharp run in ENA this year; see our earlier look at Ethena’s recent market performance.
The new benchmarks
The suite uses the CME CF Ethena-Dollar Reference Rate for the London close under the ENAUSD RR identifier, while ENAUSD NY provides a New York closing rate and ENAUSD AP covers the end of the APAC trading day. Each rate is published at 4 p.m. in its respective region, letting firms select a valuation point that matches their working day. Publication continues seven days a week, including weekends and public holidays, reflecting the fact that ENA trades continuously even when traditional markets are closed.
Who calculates the rates
CF Benchmarks, the administrator that manages CME’s cryptocurrency indices, will calculate and publish the products. Rather than taking ENA’s price from a single platform, it draws on transactions from eligible spot exchanges that meet its constituent venue rules, reducing reliance on any one order book. Reference rates produce a fixed price for portfolio valuation and net asset value calculations, while real-time indices follow the token through the trading day for collateral monitoring and risk controls.
What it does not do
The announcement adds pricing tools, not a tradable contract. CME did not launch ENA futures, options or an exchange-traded fund, and any listed product would require its own terms and regulatory treatment. The addition places Ethena’s governance token beside a benchmark lineup that already spans Bitcoin, Ether, Solana, XRP, Cardano, Chainlink, Stellar, Avalanche and Sui, and follows CME’s June launch of Nasdaq CME Crypto Index futures and its May standard and micro futures for Avalanche and Sui.
For U.S. firms, the New York variant supplies an ENA price at 4 p.m. local time, aligning the benchmark with the close of the American equity trading day, and CF Benchmarks has long administered rates for CME’s crypto products, adding Crypto.com as a constituent exchange for Bitcoin and Ether indices in March 2025.
The move follows a sharp run in ENA this year; see our earlier look at Ethena’s recent market performance.
55
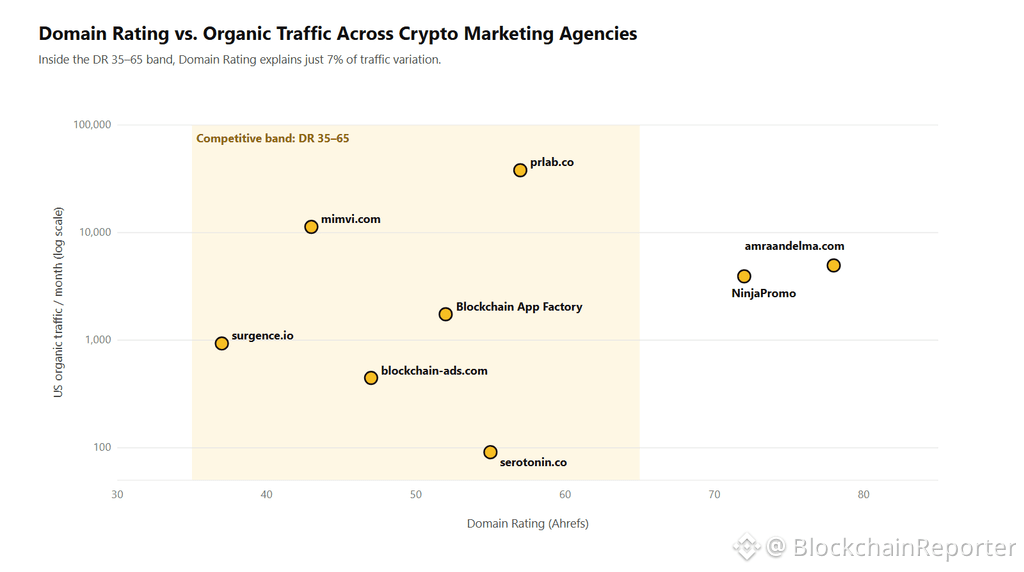
Article
Domain Authority Stopped Protecting Crypto Marketing Agencies in Search. Here’s What Replaced It.NinjaPromo’s Domain Rating climbed from 44 to 72 in three years. In that same window, its US organic search traffic fell 96%, from a peak of 107,633 monthly visits to 3,933. The pattern isn’t limited to one agency: across the crypto marketing agencies we tracked, higher DR now predicts losing search traffic more often than keeping it.
This is ICODA’s own research, not a client complaint or a competitor’s press release. We’re a crypto marketing agency ourselves, and we pulled fresh Ahrefs data across 45 crypto marketing agency domains, 51 search result slots across six commercial keywords, and 41 crypto sites tracked year-over-year. The story those numbers tell isn’t “Domain Rating stopped helping.” It’s worse than that.
Why Crypto Marketing Agencies Built Their Pitch Around Domain Rating
Domain Rating became the default KPI because it was easy to show a client and easy to inflate, not because Google ever used it to rank a page. Ahrefs’ own help docs say DR is not a Google ranking factor; it’s a relative measure of a domain’s backlink profile, nothing more. Google’s John Mueller has said the same about the idea of a sitewide “authority score” for years.
That didn’t stop the sales pitch. A rising DR chart is a clean deliverable: one number, going up, month over month. For a decade, DR also correlated loosely with traffic, so nobody had much reason to question it. That correlation is the part that broke.
Does a Higher Domain Rating Still Predict More Traffic?
No. Among crypto marketing agencies, higher DR now correlates with losing search traffic, not gaining it. We tracked 41 crypto domains from August 2025 to August 2026 and found:
The correlation between DR and year-over-year traffic change came out negative (Spearman -0.27)
Domains at DR 60 or higher lost traffic 67% of the time
Domains under DR 60 lost traffic 52% of the time
The median site in the sample shed 68.5% of its ranking pages in twelve months
To be fair to the old belief: across a wider 45-domain sample that includes dead and abandoned sites, DR and traffic still correlate strongly (0.71). But that number is doing something different: it’s separating “live business” from “parked domain,” not “winner” from “loser.” Narrow the sample to the DR 35-65 band, where actual competing agencies sit, and the correlation collapses to 0.27. Inside the real competitive set, DR stopped telling you anything useful.
Agency DR then → now Traffic then → now Change NinjaPromo 44 → 72 4,639 → 3,933 (peaked 107,633) -96% from peak blockchain-ads.com 61 → 47 (flat since Nov ’25) 98 → 447 (peaked 7,625) -94% from peak Blockchain App Factory n/a → 52 5,125 → 1,745 -66% The NinjaPromo Chart That Ends the Argument
Zoom into the last 15 months and the same story holds. DR climbed 7 points, from 65 to 72, while referring domains grew 51%, from 2,514 to 3,791, and traffic fell 96% from that same peak. The DR line never dropped once across the whole period.
The links reveal the mechanism: of NinjaPromo’s 3,791 referring domains, 1,688 (nearly half) point at the homepage. The pages that needed to rank for commercial crypto marketing terms carry a URL Rating of just 4.5 to 5.0 each, with single digits of referring domains apiece. NinjaPromo built its link magnet at the root of the domain, not at the pages doing the selling.
Why the Old DR-Protects-You Model Broke
Search engines stopped scoring domains and started scoring individual pages, which is why crypto SEO now works at the page level, not the domain level. Google’s Helpful Content System evaluates content quality, topical relevance, and user satisfaction URL by URL, not as a single sitewide trust score inherited from the domain’s link history. A page can now rank, or fall out of the index, independent of what the rest of the domain is doing.
You can see the mechanism running in reverse at surgence.io. Its traffic went from zero to 935 monthly visits between December 2025 and August 2026, while its DR moved from 12 to 37 over the same stretch. Rankings arrived first; links followed. One of its ranking pages has a URL Rating of 0.0 and exactly one referring domain, and it still ranks #6 for “web3 marketing agency.” Domain Rating didn’t cause that ranking. It’s a lagging measurement of a page that was already working.
What Ranks for “Top Crypto Marketing Agency” Now
63% of top-10 slots for crypto marketing agency keywords belong to Reddit, LinkedIn Pulse, and third-party listicles, not agency websites. Across 51 ranking slots we tracked for six commercial keywords:
Page-level URL Rating correlates with position at just 0.04, functionally nothing
Domain-level DR fares only slightly better at -0.24
A page with two referring domains from a small opinion blog holds a top-five slot on four separate keywords
A DR-5 domain outranks Clutch.co, sitting at DR 91, for “crypto PR agency”
The same fragmentation shows up in AI search. NinjaPromo kept a meaningful share of citations across ChatGPT, Perplexity, and Google AI Overviews even as its blue-link traffic fell 96%, proof that classic search rankings and AI-answer visibility have become two separate surfaces an agency has to win independently. A high DR buys neither.
How to Vet a Crypto Marketing Agency Without Asking for Its DR
Ask for page-level, verifiable metrics instead of a single sitewide score. Domain Rating tells you how many sites link to a domain. It tells you nothing about whether the pages that matter to you are ranking, staying ranked, or getting cited where your buyers look.
Retire Replace with Domain Rating / DA Ranking-page survival rate month over month Total backlinks Share of top-10 slots you directly influence (owned pages, listicle placements, named mentions) Total referring domains Page-query format fit (does a comparison page exist for a comparison query) n/a Citations in AI Overviews, ChatGPT, and Perplexity for your money keywords n/a Branded search volume growth
A crypto marketing agency that can show you which of its own pages still rank a year after publishing, and which of yours will still rank a year from now, is telling you something DR never could.
The Takeaway
Domain Rating didn’t fail quietly. It kept climbing at NinjaPromo, at blockchain-ads.com, at nearly every agency in this data, while the traffic it was supposed to protect fell 60% to 96%. The old metric stopped telling clients the truth long before agencies admitted it. ICODA built this dataset to replace it with numbers that still mean something: ranking-page survival, share of slots you directly influence, and citations where your buyers are already looking.
If your agency’s monthly report still leads with a DR chart, ask to see the ranking-page survival rate instead. Get a free SEO audit from ICODA and find out what your current metrics are protecting.
This article is not intended as financial advice. Educational purposes only.
Domain Authority Stopped Protecting Crypto Marketing Agencies in Search. Here’s What Replaced It.
NinjaPromo’s Domain Rating climbed from 44 to 72 in three years. In that same window, its US organic search traffic fell 96%, from a peak of 107,633 monthly visits to 3,933. The pattern isn’t limited to one agency: across the crypto marketing agencies we tracked, higher DR now predicts losing search traffic more often than keeping it.
This is ICODA’s own research, not a client complaint or a competitor’s press release. We’re a crypto marketing agency ourselves, and we pulled fresh Ahrefs data across 45 crypto marketing agency domains, 51 search result slots across six commercial keywords, and 41 crypto sites tracked year-over-year. The story those numbers tell isn’t “Domain Rating stopped helping.” It’s worse than that.
Why Crypto Marketing Agencies Built Their Pitch Around Domain Rating
Domain Rating became the default KPI because it was easy to show a client and easy to inflate, not because Google ever used it to rank a page. Ahrefs’ own help docs say DR is not a Google ranking factor; it’s a relative measure of a domain’s backlink profile, nothing more. Google’s John Mueller has said the same about the idea of a sitewide “authority score” for years.
That didn’t stop the sales pitch. A rising DR chart is a clean deliverable: one number, going up, month over month. For a decade, DR also correlated loosely with traffic, so nobody had much reason to question it. That correlation is the part that broke.
Does a Higher Domain Rating Still Predict More Traffic?
No. Among crypto marketing agencies, higher DR now correlates with losing search traffic, not gaining it. We tracked 41 crypto domains from August 2025 to August 2026 and found:
The correlation between DR and year-over-year traffic change came out negative (Spearman -0.27)
Domains at DR 60 or higher lost traffic 67% of the time
Domains under DR 60 lost traffic 52% of the time
The median site in the sample shed 68.5% of its ranking pages in twelve months
To be fair to the old belief: across a wider 45-domain sample that includes dead and abandoned sites, DR and traffic still correlate strongly (0.71). But that number is doing something different: it’s separating “live business” from “parked domain,” not “winner” from “loser.” Narrow the sample to the DR 35-65 band, where actual competing agencies sit, and the correlation collapses to 0.27. Inside the real competitive set, DR stopped telling you anything useful.
Agency DR then → now Traffic then → now Change NinjaPromo 44 → 72 4,639 → 3,933 (peaked 107,633) -96% from peak blockchain-ads.com 61 → 47 (flat since Nov ’25) 98 → 447 (peaked 7,625) -94% from peak Blockchain App Factory n/a → 52 5,125 → 1,745 -66% The NinjaPromo Chart That Ends the Argument
Zoom into the last 15 months and the same story holds. DR climbed 7 points, from 65 to 72, while referring domains grew 51%, from 2,514 to 3,791, and traffic fell 96% from that same peak. The DR line never dropped once across the whole period.
The links reveal the mechanism: of NinjaPromo’s 3,791 referring domains, 1,688 (nearly half) point at the homepage. The pages that needed to rank for commercial crypto marketing terms carry a URL Rating of just 4.5 to 5.0 each, with single digits of referring domains apiece. NinjaPromo built its link magnet at the root of the domain, not at the pages doing the selling.
Why the Old DR-Protects-You Model Broke
Search engines stopped scoring domains and started scoring individual pages, which is why crypto SEO now works at the page level, not the domain level. Google’s Helpful Content System evaluates content quality, topical relevance, and user satisfaction URL by URL, not as a single sitewide trust score inherited from the domain’s link history. A page can now rank, or fall out of the index, independent of what the rest of the domain is doing.
You can see the mechanism running in reverse at surgence.io. Its traffic went from zero to 935 monthly visits between December 2025 and August 2026, while its DR moved from 12 to 37 over the same stretch. Rankings arrived first; links followed. One of its ranking pages has a URL Rating of 0.0 and exactly one referring domain, and it still ranks #6 for “web3 marketing agency.” Domain Rating didn’t cause that ranking. It’s a lagging measurement of a page that was already working.
What Ranks for “Top Crypto Marketing Agency” Now
63% of top-10 slots for crypto marketing agency keywords belong to Reddit, LinkedIn Pulse, and third-party listicles, not agency websites. Across 51 ranking slots we tracked for six commercial keywords:
Page-level URL Rating correlates with position at just 0.04, functionally nothing
Domain-level DR fares only slightly better at -0.24
A page with two referring domains from a small opinion blog holds a top-five slot on four separate keywords
A DR-5 domain outranks Clutch.co, sitting at DR 91, for “crypto PR agency”
The same fragmentation shows up in AI search. NinjaPromo kept a meaningful share of citations across ChatGPT, Perplexity, and Google AI Overviews even as its blue-link traffic fell 96%, proof that classic search rankings and AI-answer visibility have become two separate surfaces an agency has to win independently. A high DR buys neither.
How to Vet a Crypto Marketing Agency Without Asking for Its DR
Ask for page-level, verifiable metrics instead of a single sitewide score. Domain Rating tells you how many sites link to a domain. It tells you nothing about whether the pages that matter to you are ranking, staying ranked, or getting cited where your buyers look.
Retire Replace with Domain Rating / DA Ranking-page survival rate month over month Total backlinks Share of top-10 slots you directly influence (owned pages, listicle placements, named mentions) Total referring domains Page-query format fit (does a comparison page exist for a comparison query) n/a Citations in AI Overviews, ChatGPT, and Perplexity for your money keywords n/a Branded search volume growth
A crypto marketing agency that can show you which of its own pages still rank a year after publishing, and which of yours will still rank a year from now, is telling you something DR never could.
The Takeaway
Domain Rating didn’t fail quietly. It kept climbing at NinjaPromo, at blockchain-ads.com, at nearly every agency in this data, while the traffic it was supposed to protect fell 60% to 96%. The old metric stopped telling clients the truth long before agencies admitted it. ICODA built this dataset to replace it with numbers that still mean something: ranking-page survival, share of slots you directly influence, and citations where your buyers are already looking.
If your agency’s monthly report still leads with a DR chart, ask to see the ranking-page survival rate instead. Get a free SEO audit from ICODA and find out what your current metrics are protecting.
This article is not intended as financial advice. Educational purposes only.
This is ICODA’s own research, not a client complaint or a competitor’s press release. We’re a crypto marketing agency ourselves, and we pulled fresh Ahrefs data across 45 crypto marketing agency domains, 51 search result slots across six commercial keywords, and 41 crypto sites tracked year-over-year. The story those numbers tell isn’t “Domain Rating stopped helping.” It’s worse than that.
Why Crypto Marketing Agencies Built Their Pitch Around Domain Rating
Domain Rating became the default KPI because it was easy to show a client and easy to inflate, not because Google ever used it to rank a page. Ahrefs’ own help docs say DR is not a Google ranking factor; it’s a relative measure of a domain’s backlink profile, nothing more. Google’s John Mueller has said the same about the idea of a sitewide “authority score” for years.
That didn’t stop the sales pitch. A rising DR chart is a clean deliverable: one number, going up, month over month. For a decade, DR also correlated loosely with traffic, so nobody had much reason to question it. That correlation is the part that broke.
Does a Higher Domain Rating Still Predict More Traffic?
No. Among crypto marketing agencies, higher DR now correlates with losing search traffic, not gaining it. We tracked 41 crypto domains from August 2025 to August 2026 and found:
The correlation between DR and year-over-year traffic change came out negative (Spearman -0.27)
Domains at DR 60 or higher lost traffic 67% of the time
Domains under DR 60 lost traffic 52% of the time
The median site in the sample shed 68.5% of its ranking pages in twelve months
To be fair to the old belief: across a wider 45-domain sample that includes dead and abandoned sites, DR and traffic still correlate strongly (0.71). But that number is doing something different: it’s separating “live business” from “parked domain,” not “winner” from “loser.” Narrow the sample to the DR 35-65 band, where actual competing agencies sit, and the correlation collapses to 0.27. Inside the real competitive set, DR stopped telling you anything useful.
Agency DR then → now Traffic then → now Change NinjaPromo 44 → 72 4,639 → 3,933 (peaked 107,633) -96% from peak blockchain-ads.com 61 → 47 (flat since Nov ’25) 98 → 447 (peaked 7,625) -94% from peak Blockchain App Factory n/a → 52 5,125 → 1,745 -66% The NinjaPromo Chart That Ends the Argument
Zoom into the last 15 months and the same story holds. DR climbed 7 points, from 65 to 72, while referring domains grew 51%, from 2,514 to 3,791, and traffic fell 96% from that same peak. The DR line never dropped once across the whole period.
The links reveal the mechanism: of NinjaPromo’s 3,791 referring domains, 1,688 (nearly half) point at the homepage. The pages that needed to rank for commercial crypto marketing terms carry a URL Rating of just 4.5 to 5.0 each, with single digits of referring domains apiece. NinjaPromo built its link magnet at the root of the domain, not at the pages doing the selling.
Why the Old DR-Protects-You Model Broke
Search engines stopped scoring domains and started scoring individual pages, which is why crypto SEO now works at the page level, not the domain level. Google’s Helpful Content System evaluates content quality, topical relevance, and user satisfaction URL by URL, not as a single sitewide trust score inherited from the domain’s link history. A page can now rank, or fall out of the index, independent of what the rest of the domain is doing.
You can see the mechanism running in reverse at surgence.io. Its traffic went from zero to 935 monthly visits between December 2025 and August 2026, while its DR moved from 12 to 37 over the same stretch. Rankings arrived first; links followed. One of its ranking pages has a URL Rating of 0.0 and exactly one referring domain, and it still ranks #6 for “web3 marketing agency.” Domain Rating didn’t cause that ranking. It’s a lagging measurement of a page that was already working.
What Ranks for “Top Crypto Marketing Agency” Now
63% of top-10 slots for crypto marketing agency keywords belong to Reddit, LinkedIn Pulse, and third-party listicles, not agency websites. Across 51 ranking slots we tracked for six commercial keywords:
Page-level URL Rating correlates with position at just 0.04, functionally nothing
Domain-level DR fares only slightly better at -0.24
A page with two referring domains from a small opinion blog holds a top-five slot on four separate keywords
A DR-5 domain outranks Clutch.co, sitting at DR 91, for “crypto PR agency”
The same fragmentation shows up in AI search. NinjaPromo kept a meaningful share of citations across ChatGPT, Perplexity, and Google AI Overviews even as its blue-link traffic fell 96%, proof that classic search rankings and AI-answer visibility have become two separate surfaces an agency has to win independently. A high DR buys neither.
How to Vet a Crypto Marketing Agency Without Asking for Its DR
Ask for page-level, verifiable metrics instead of a single sitewide score. Domain Rating tells you how many sites link to a domain. It tells you nothing about whether the pages that matter to you are ranking, staying ranked, or getting cited where your buyers look.
Retire Replace with Domain Rating / DA Ranking-page survival rate month over month Total backlinks Share of top-10 slots you directly influence (owned pages, listicle placements, named mentions) Total referring domains Page-query format fit (does a comparison page exist for a comparison query) n/a Citations in AI Overviews, ChatGPT, and Perplexity for your money keywords n/a Branded search volume growth
A crypto marketing agency that can show you which of its own pages still rank a year after publishing, and which of yours will still rank a year from now, is telling you something DR never could.
The Takeaway
Domain Rating didn’t fail quietly. It kept climbing at NinjaPromo, at blockchain-ads.com, at nearly every agency in this data, while the traffic it was supposed to protect fell 60% to 96%. The old metric stopped telling clients the truth long before agencies admitted it. ICODA built this dataset to replace it with numbers that still mean something: ranking-page survival, share of slots you directly influence, and citations where your buyers are already looking.
If your agency’s monthly report still leads with a DR chart, ask to see the ranking-page survival rate instead. Get a free SEO audit from ICODA and find out what your current metrics are protecting.
This article is not intended as financial advice. Educational purposes only.
32
Ethereum’s Deposit Contract Could Get a Post-Quantum RewriteThe deposit contract has never attracted much attention from traders, but it sits at the entry point for every Ethereum validator. A new developer proposal aims to redesign that entry point around post-quantum cryptography, and the implications extend well beyond a routine upgrade. According to the original report, the proposed contract would support variable-length public keys and credential metadata.
Instead of assuming that every deposit uses the same BLS signature scheme, the design introduces scheme identifiers. Scheme 0 would remain reserved for existing BLS deposits, preserving backward compatibility while leaving room for new cryptographic systems. That is a meaningful shift for a network where the deposit contract has been a fixed assumption.
The proposal also removes the legacy Merkle-tree mechanism. Deposits would flow through execution-layer requests based on EIP-7685, a change that ties the deposit process more directly into Ethereum’s existing transaction and request handling. For staking services and solo validators, that could eventually simplify the pipeline for moving funds into the beacon chain.
Ethereum’s developer base has kept protocol work moving while price action and macro conditions dominate short-term market talk. The network continues to rank high in developer activity rankings, and infrastructure proposals like this one explain why. The work is less visible than a fee change or an upgrade to blob capacity, but it touches the core staking flow.
An Irreversible Switch for a Post-Quantum Path
The most aggressive part of the design is an irreversible migration switch. Developers could first enable new post-quantum deposit types, then later disable new BLS deposits permanently. The sequence matters. It avoids a messy period in which multiple deposit formats coexist without a clear end, but it also means the network cannot simply reverse course once the switch is thrown.
Existing BLS deposits would not necessarily be invalidated. The report describes a path that reserves Scheme 0 for legacy deposits while new deposit types use other identifiers. That distinction allows current validators to continue operating while the protocol builds a bridge to post-quantum signatures. Still, the final step would close the door on new BLS-based entries.
That has practical consequences for staking infrastructure. Exchanges, liquid staking protocols, and node operators would need to adapt their deposit generation logic. The shift from a fixed BLS expectation to variable-length keys and metadata means more flexible parsing, broader key management, and new failure modes if operators do not update their tooling.
Why This Arrives Now
Post-quantum cryptography has moved from theoretical concern to an engineering topic across the blockchain sector. Standard-setting bodies have published post-quantum algorithms, and several layer-1 teams have begun mapping how those algorithms would fit into their consensus and staking layers. Ethereum’s proposal fits that trend, but it is notable for targeting the deposit contract specifically. That component has been stable for years and is not something developers change lightly.
The timing also reflects the ongoing maturity of execution-layer requests. EIP-7685 provides a standard way to move certain operations into the execution layer, and the deposit redesign leans on it. That matters because it could reduce dependence on specialized off-chain Merkle proofs. For validators, the deposit process may start to look more like other on-chain interactions.
What remains uncertain is which post-quantum signature scheme will eventually be chosen. The proposal creates the container for multiple schemes, but it does not announce a specific winner. That decision will likely involve cryptographic review, performance analysis, and ecosystem coordination. The irreversible switch also raises questions about migration timing and whether operators will have enough lead time to test the new flow before BLS deposits are disabled.
The Staking Layer Is Watching
For market participants, this is not a price catalyst. It is an infrastructure signal. Ethereum’s staking economy holds substantial value, and any change to the deposit path has to be assessed against staking pools, institutional validators, and hardware wallets that generate deposit files. The proposal does not force an immediate change, but it tells the staking industry where the protocol is headed.
The path from proposal to mainnet will take time. Developer discussion, specification work, client implementations, and testnet behavior will all shape the final design. The irreversible switch is likely to attract the most scrutiny because it creates a one-way door. If the chosen post-quantum scheme proves difficult to implement or incompatible with certain hardware, the inability to reopen BLS deposits could become a source of friction.
Even so, the direction is clear. Ethereum is preparing for a future in which BLS signatures are just one of several supported schemes, and eventually not the default for new validators. The deposit contract, once an afterthought, is becoming part of the network’s cryptographic transition.
Ethereum’s Deposit Contract Could Get a Post-Quantum Rewrite
The deposit contract has never attracted much attention from traders, but it sits at the entry point for every Ethereum validator. A new developer proposal aims to redesign that entry point around post-quantum cryptography, and the implications extend well beyond a routine upgrade. According to the original report, the proposed contract would support variable-length public keys and credential metadata.
Instead of assuming that every deposit uses the same BLS signature scheme, the design introduces scheme identifiers. Scheme 0 would remain reserved for existing BLS deposits, preserving backward compatibility while leaving room for new cryptographic systems. That is a meaningful shift for a network where the deposit contract has been a fixed assumption.
The proposal also removes the legacy Merkle-tree mechanism. Deposits would flow through execution-layer requests based on EIP-7685, a change that ties the deposit process more directly into Ethereum’s existing transaction and request handling. For staking services and solo validators, that could eventually simplify the pipeline for moving funds into the beacon chain.
Ethereum’s developer base has kept protocol work moving while price action and macro conditions dominate short-term market talk. The network continues to rank high in developer activity rankings, and infrastructure proposals like this one explain why. The work is less visible than a fee change or an upgrade to blob capacity, but it touches the core staking flow.
An Irreversible Switch for a Post-Quantum Path
The most aggressive part of the design is an irreversible migration switch. Developers could first enable new post-quantum deposit types, then later disable new BLS deposits permanently. The sequence matters. It avoids a messy period in which multiple deposit formats coexist without a clear end, but it also means the network cannot simply reverse course once the switch is thrown.
Existing BLS deposits would not necessarily be invalidated. The report describes a path that reserves Scheme 0 for legacy deposits while new deposit types use other identifiers. That distinction allows current validators to continue operating while the protocol builds a bridge to post-quantum signatures. Still, the final step would close the door on new BLS-based entries.
That has practical consequences for staking infrastructure. Exchanges, liquid staking protocols, and node operators would need to adapt their deposit generation logic. The shift from a fixed BLS expectation to variable-length keys and metadata means more flexible parsing, broader key management, and new failure modes if operators do not update their tooling.
Why This Arrives Now
Post-quantum cryptography has moved from theoretical concern to an engineering topic across the blockchain sector. Standard-setting bodies have published post-quantum algorithms, and several layer-1 teams have begun mapping how those algorithms would fit into their consensus and staking layers. Ethereum’s proposal fits that trend, but it is notable for targeting the deposit contract specifically. That component has been stable for years and is not something developers change lightly.
The timing also reflects the ongoing maturity of execution-layer requests. EIP-7685 provides a standard way to move certain operations into the execution layer, and the deposit redesign leans on it. That matters because it could reduce dependence on specialized off-chain Merkle proofs. For validators, the deposit process may start to look more like other on-chain interactions.
What remains uncertain is which post-quantum signature scheme will eventually be chosen. The proposal creates the container for multiple schemes, but it does not announce a specific winner. That decision will likely involve cryptographic review, performance analysis, and ecosystem coordination. The irreversible switch also raises questions about migration timing and whether operators will have enough lead time to test the new flow before BLS deposits are disabled.
The Staking Layer Is Watching
For market participants, this is not a price catalyst. It is an infrastructure signal. Ethereum’s staking economy holds substantial value, and any change to the deposit path has to be assessed against staking pools, institutional validators, and hardware wallets that generate deposit files. The proposal does not force an immediate change, but it tells the staking industry where the protocol is headed.
The path from proposal to mainnet will take time. Developer discussion, specification work, client implementations, and testnet behavior will all shape the final design. The irreversible switch is likely to attract the most scrutiny because it creates a one-way door. If the chosen post-quantum scheme proves difficult to implement or incompatible with certain hardware, the inability to reopen BLS deposits could become a source of friction.
Even so, the direction is clear. Ethereum is preparing for a future in which BLS signatures are just one of several supported schemes, and eventually not the default for new validators. The deposit contract, once an afterthought, is becoming part of the network’s cryptographic transition.
Instead of assuming that every deposit uses the same BLS signature scheme, the design introduces scheme identifiers. Scheme 0 would remain reserved for existing BLS deposits, preserving backward compatibility while leaving room for new cryptographic systems. That is a meaningful shift for a network where the deposit contract has been a fixed assumption.
The proposal also removes the legacy Merkle-tree mechanism. Deposits would flow through execution-layer requests based on EIP-7685, a change that ties the deposit process more directly into Ethereum’s existing transaction and request handling. For staking services and solo validators, that could eventually simplify the pipeline for moving funds into the beacon chain.
Ethereum’s developer base has kept protocol work moving while price action and macro conditions dominate short-term market talk. The network continues to rank high in developer activity rankings, and infrastructure proposals like this one explain why. The work is less visible than a fee change or an upgrade to blob capacity, but it touches the core staking flow.
An Irreversible Switch for a Post-Quantum Path
The most aggressive part of the design is an irreversible migration switch. Developers could first enable new post-quantum deposit types, then later disable new BLS deposits permanently. The sequence matters. It avoids a messy period in which multiple deposit formats coexist without a clear end, but it also means the network cannot simply reverse course once the switch is thrown.
Existing BLS deposits would not necessarily be invalidated. The report describes a path that reserves Scheme 0 for legacy deposits while new deposit types use other identifiers. That distinction allows current validators to continue operating while the protocol builds a bridge to post-quantum signatures. Still, the final step would close the door on new BLS-based entries.
That has practical consequences for staking infrastructure. Exchanges, liquid staking protocols, and node operators would need to adapt their deposit generation logic. The shift from a fixed BLS expectation to variable-length keys and metadata means more flexible parsing, broader key management, and new failure modes if operators do not update their tooling.
Why This Arrives Now
Post-quantum cryptography has moved from theoretical concern to an engineering topic across the blockchain sector. Standard-setting bodies have published post-quantum algorithms, and several layer-1 teams have begun mapping how those algorithms would fit into their consensus and staking layers. Ethereum’s proposal fits that trend, but it is notable for targeting the deposit contract specifically. That component has been stable for years and is not something developers change lightly.
The timing also reflects the ongoing maturity of execution-layer requests. EIP-7685 provides a standard way to move certain operations into the execution layer, and the deposit redesign leans on it. That matters because it could reduce dependence on specialized off-chain Merkle proofs. For validators, the deposit process may start to look more like other on-chain interactions.
What remains uncertain is which post-quantum signature scheme will eventually be chosen. The proposal creates the container for multiple schemes, but it does not announce a specific winner. That decision will likely involve cryptographic review, performance analysis, and ecosystem coordination. The irreversible switch also raises questions about migration timing and whether operators will have enough lead time to test the new flow before BLS deposits are disabled.
The Staking Layer Is Watching
For market participants, this is not a price catalyst. It is an infrastructure signal. Ethereum’s staking economy holds substantial value, and any change to the deposit path has to be assessed against staking pools, institutional validators, and hardware wallets that generate deposit files. The proposal does not force an immediate change, but it tells the staking industry where the protocol is headed.
The path from proposal to mainnet will take time. Developer discussion, specification work, client implementations, and testnet behavior will all shape the final design. The irreversible switch is likely to attract the most scrutiny because it creates a one-way door. If the chosen post-quantum scheme proves difficult to implement or incompatible with certain hardware, the inability to reopen BLS deposits could become a source of friction.
Even so, the direction is clear. Ethereum is preparing for a future in which BLS signatures are just one of several supported schemes, and eventually not the default for new validators. The deposit contract, once an afterthought, is becoming part of the network’s cryptographic transition.
101
Stand With Crypto Backs 32 House Incumbents in More Targeted 2026 PushCrypto’s political operation is becoming more deliberate. Stand With Crypto, the membership group that rates lawmakers on their digital asset records, is backing 32 U.S. House incumbents in its opening endorsement push of the cycle, with additional names still to come, according to the original report.
The early focus on incumbents is a departure from the scattershot approach that defined some earlier crypto spending. In a House where a small number of districts may decide control, protecting members with existing policy records can be more efficient than trying to unseat opponents or win crowded primaries. It also gives the group a clearer scorecard to hold those members accountable after the election.
The group has not yet released the full list or committed a specific spending figure. That matters less than the sequence: Stand With Crypto is prioritizing candidates whose positions are already on the record, then leaving room to expand the map as the cycle develops. The endorsements are not merely symbolic. They function as a signal to the group’s member network about where volunteer time, donations, and voter attention should be directed.
A sharper political instrument
Stand With Crypto’s influence has grown because it grades politicians instead of only funding them. The ratings draw on votes, public comments, and policy positions, which means an endorsement can be tied to specific actions rather than general sentiment. For incumbents in swing districts, that kind of distinction can be useful in a primary and a general election.
It also raises the bar. Once a member is endorsed, their future committee votes and floor statements become easier to audit against the group’s scorecard. That turns the endorsement from a one-time event into an ongoing political relationship, one that could shape how crypto legislation moves through the House even before any new members are sworn in.
The legislative backdrop
The endorsements arrive while the Senate is still fighting over a sweeping market-structure bill. Banking groups have pressed for last-minute changes, a fight covered in BlockchainReporter’s report on the biggest crypto bill in U.S. history four days before a Senate vote. If the Senate passes a weakened version, House allies may have to explain why they still support the underlying framework.
The stakes are no longer abstract. Real-world asset tokenization has crossed $20 billion on-chain, and institutional settlement has moved from pilot programs to live transactions. BlockchainReporter’s weekly tokenization roundup documented the moment when those markets became too large for lawmakers to ignore. That broader shift gives the endorsement campaign a concrete policy anchor: elected officials are now voting on rules for markets that already exist.
What the next wave will reveal
More endorsements are expected, but the first tranche alone does not tell the full story. The key variable is whether the 32 incumbents face competitive races. A friendly member in a safe seat is a lower-cost endorsement; the same member in a contested district will test how much political capital the group is willing to spend.
There is also uncertainty about the final text of the Senate bill. If legacy finance succeeds in diluting key provisions, the House map could become a referendum on a compromise that pleases almost no one. Incumbents who accepted early backing would then have to decide whether to defend the bill, distance themselves from it, or wait for a future Congress to try again.
That is why the group’s decision to start with incumbents is more than a tactical choice. It is a hedge against the possibility that the industry’s biggest legislative opportunity becomes a defensive battle rather than a clean win.
Stand With Crypto Backs 32 House Incumbents in More Targeted 2026 Push
Crypto’s political operation is becoming more deliberate. Stand With Crypto, the membership group that rates lawmakers on their digital asset records, is backing 32 U.S. House incumbents in its opening endorsement push of the cycle, with additional names still to come, according to the original report.
The early focus on incumbents is a departure from the scattershot approach that defined some earlier crypto spending. In a House where a small number of districts may decide control, protecting members with existing policy records can be more efficient than trying to unseat opponents or win crowded primaries. It also gives the group a clearer scorecard to hold those members accountable after the election.
The group has not yet released the full list or committed a specific spending figure. That matters less than the sequence: Stand With Crypto is prioritizing candidates whose positions are already on the record, then leaving room to expand the map as the cycle develops. The endorsements are not merely symbolic. They function as a signal to the group’s member network about where volunteer time, donations, and voter attention should be directed.
A sharper political instrument
Stand With Crypto’s influence has grown because it grades politicians instead of only funding them. The ratings draw on votes, public comments, and policy positions, which means an endorsement can be tied to specific actions rather than general sentiment. For incumbents in swing districts, that kind of distinction can be useful in a primary and a general election.
It also raises the bar. Once a member is endorsed, their future committee votes and floor statements become easier to audit against the group’s scorecard. That turns the endorsement from a one-time event into an ongoing political relationship, one that could shape how crypto legislation moves through the House even before any new members are sworn in.
The legislative backdrop
The endorsements arrive while the Senate is still fighting over a sweeping market-structure bill. Banking groups have pressed for last-minute changes, a fight covered in BlockchainReporter’s report on the biggest crypto bill in U.S. history four days before a Senate vote. If the Senate passes a weakened version, House allies may have to explain why they still support the underlying framework.
The stakes are no longer abstract. Real-world asset tokenization has crossed $20 billion on-chain, and institutional settlement has moved from pilot programs to live transactions. BlockchainReporter’s weekly tokenization roundup documented the moment when those markets became too large for lawmakers to ignore. That broader shift gives the endorsement campaign a concrete policy anchor: elected officials are now voting on rules for markets that already exist.
What the next wave will reveal
More endorsements are expected, but the first tranche alone does not tell the full story. The key variable is whether the 32 incumbents face competitive races. A friendly member in a safe seat is a lower-cost endorsement; the same member in a contested district will test how much political capital the group is willing to spend.
There is also uncertainty about the final text of the Senate bill. If legacy finance succeeds in diluting key provisions, the House map could become a referendum on a compromise that pleases almost no one. Incumbents who accepted early backing would then have to decide whether to defend the bill, distance themselves from it, or wait for a future Congress to try again.
That is why the group’s decision to start with incumbents is more than a tactical choice. It is a hedge against the possibility that the industry’s biggest legislative opportunity becomes a defensive battle rather than a clean win.
The early focus on incumbents is a departure from the scattershot approach that defined some earlier crypto spending. In a House where a small number of districts may decide control, protecting members with existing policy records can be more efficient than trying to unseat opponents or win crowded primaries. It also gives the group a clearer scorecard to hold those members accountable after the election.
The group has not yet released the full list or committed a specific spending figure. That matters less than the sequence: Stand With Crypto is prioritizing candidates whose positions are already on the record, then leaving room to expand the map as the cycle develops. The endorsements are not merely symbolic. They function as a signal to the group’s member network about where volunteer time, donations, and voter attention should be directed.
A sharper political instrument
Stand With Crypto’s influence has grown because it grades politicians instead of only funding them. The ratings draw on votes, public comments, and policy positions, which means an endorsement can be tied to specific actions rather than general sentiment. For incumbents in swing districts, that kind of distinction can be useful in a primary and a general election.
It also raises the bar. Once a member is endorsed, their future committee votes and floor statements become easier to audit against the group’s scorecard. That turns the endorsement from a one-time event into an ongoing political relationship, one that could shape how crypto legislation moves through the House even before any new members are sworn in.
The legislative backdrop
The endorsements arrive while the Senate is still fighting over a sweeping market-structure bill. Banking groups have pressed for last-minute changes, a fight covered in BlockchainReporter’s report on the biggest crypto bill in U.S. history four days before a Senate vote. If the Senate passes a weakened version, House allies may have to explain why they still support the underlying framework.
The stakes are no longer abstract. Real-world asset tokenization has crossed $20 billion on-chain, and institutional settlement has moved from pilot programs to live transactions. BlockchainReporter’s weekly tokenization roundup documented the moment when those markets became too large for lawmakers to ignore. That broader shift gives the endorsement campaign a concrete policy anchor: elected officials are now voting on rules for markets that already exist.
What the next wave will reveal
More endorsements are expected, but the first tranche alone does not tell the full story. The key variable is whether the 32 incumbents face competitive races. A friendly member in a safe seat is a lower-cost endorsement; the same member in a contested district will test how much political capital the group is willing to spend.
There is also uncertainty about the final text of the Senate bill. If legacy finance succeeds in diluting key provisions, the House map could become a referendum on a compromise that pleases almost no one. Incumbents who accepted early backing would then have to decide whether to defend the bill, distance themselves from it, or wait for a future Congress to try again.
That is why the group’s decision to start with incumbents is more than a tactical choice. It is a hedge against the possibility that the industry’s biggest legislative opportunity becomes a defensive battle rather than a clean win.
19
HyperEVM Daily Revenue Tops $500K As Meme Trading Floods Hyperliquid’s L1Meme trading is doing what many infrastructure launches cannot: producing fees fast enough to show up in daily revenue. On August 23, HyperEVM, the Ethereum Virtual Machine layer tied to Hyperliquid, recorded more than $500,000 in single-day revenue, according to Wu Blockchain Data Center. That is a record for the chain and a sharp departure from the quieter activity that has defined much of its early life.
Details from the original report show the move came with broad participation. Trading addresses on the HyperEVM DEX hit 25,500, the most since September last year, while trading volume and transaction counts also posted clear gains.
Where the surge fits in Hyperliquid’s structure
Hyperliquid runs a purpose-built L1 for order book trading, and HyperEVM is the compatibility layer that lets Ethereum-style applications and wallets plug into that environment. The revenue jump matters because it indicates that usage is not confined to Hyperliquid’s flagship perps market. Meme trading has gravitated toward the DEX side, where lower friction and familiar EVM tooling can attract speculative flow quickly.
That pattern is consistent with what the broader altcoin market has shown throughout the current cycle. Fast-moving L1 tokens and lower-cap memecoins have repeatedly captured trader attention when majors stagnate, sometimes producing large single-day repricing events. SUI’s 18% move in a single session earlier this year was driven by a different mix of institutional staking and fintech integration, but it showed how quickly alt-L1 flows can reappear when incentives align.
For HyperEVM, the fee spike is a reminder that DEX metrics can turn from slow-building adoption to reflexive speculation in a matter of days. Meme-oriented trading tends to be velocity-heavy: smaller average trade sizes, more transactions per address, and greater willingness to rotate into newly listed tokens without long-term conviction. That is precisely the kind of flow that can lift daily revenue without necessarily signaling durable user retention.
Meme-driven DEX activity is not neutral for the chain
Rising revenue is straightforwardly positive for a protocol’s treasury and for validators if fees are routed that way. But the composition of the volume matters. When a large share of revenue arrives from meme speculation, the risk is that the metric becomes cyclical rather than structural. The same users who push daily revenue to a record can vanish when the meme market cools or when another low-friction venue offers easier access.
The address count offers some grounding. A jump to 25,500 daily trading addresses suggests the spike was not the work of a handful of large wallets. That breadth is harder to dismiss as wash trading or a single algorithm, although it is still well short of the activity seen on the largest EVM chains. It places HyperEVM in a cohort of venues that can absorb bursts of retail volume but still need to prove they can hold developers and liquidity providers after the meme phase fades.
That does not mean HyperEVM is suddenly in the same league as the large L1s that consistently lead developer activity rankings. Developer momentum and trading velocity often diverge, especially when a chain’s daily revenue is being driven by a specific meme rotation rather than a broad application buildout.
The recent weekly gainers list reinforced how meme and low-float tokens dominate attention in these windows. That rotation helps venues with cheap execution and fast token listing pipelines, which is exactly where HyperEVM appears to be benefiting.
What remains uncertain
One day at a revenue high does not establish a trend, but August 23 may be a useful test of whether HyperEVM can convert meme-driven traffic into stickier relationships. The chain’s developers will be watching whether trading addresses remain elevated over the following weeks or if the spike collapses as soon as the most active meme tokens lose momentum.
The other open question is whether the revenue surge changes how the Hyperliquid ecosystem manages risk. If meme trading continues to push transactions and volume higher, the pressure on finality, oracle pricing, and liquidation infrastructure increases. Chains that want speculative flow need to absorb it without degrading the experience for existing perps traders, who are largely there for deeper liquidity and predictable execution rather than low-cap meme exposure.
That tension between different user bases is not unique to HyperEVM. It has appeared across Ethereum L2s, alternative L1s, and DEX platforms as meme trading migrated from one venue to another in search of lower fees and fresh token launches. The difference here is that HyperEVM sits inside an ecosystem that already had a specialized trading product. The revenue record suggests the compatibility layer is now capturing a different kind of market participant, one that moves faster and leaves less obvious signal about how long it will stay.
HyperEVM Daily Revenue Tops $500K As Meme Trading Floods Hyperliquid’s L1
Meme trading is doing what many infrastructure launches cannot: producing fees fast enough to show up in daily revenue. On August 23, HyperEVM, the Ethereum Virtual Machine layer tied to Hyperliquid, recorded more than $500,000 in single-day revenue, according to Wu Blockchain Data Center. That is a record for the chain and a sharp departure from the quieter activity that has defined much of its early life.
Details from the original report show the move came with broad participation. Trading addresses on the HyperEVM DEX hit 25,500, the most since September last year, while trading volume and transaction counts also posted clear gains.
Where the surge fits in Hyperliquid’s structure
Hyperliquid runs a purpose-built L1 for order book trading, and HyperEVM is the compatibility layer that lets Ethereum-style applications and wallets plug into that environment. The revenue jump matters because it indicates that usage is not confined to Hyperliquid’s flagship perps market. Meme trading has gravitated toward the DEX side, where lower friction and familiar EVM tooling can attract speculative flow quickly.
That pattern is consistent with what the broader altcoin market has shown throughout the current cycle. Fast-moving L1 tokens and lower-cap memecoins have repeatedly captured trader attention when majors stagnate, sometimes producing large single-day repricing events. SUI’s 18% move in a single session earlier this year was driven by a different mix of institutional staking and fintech integration, but it showed how quickly alt-L1 flows can reappear when incentives align.
For HyperEVM, the fee spike is a reminder that DEX metrics can turn from slow-building adoption to reflexive speculation in a matter of days. Meme-oriented trading tends to be velocity-heavy: smaller average trade sizes, more transactions per address, and greater willingness to rotate into newly listed tokens without long-term conviction. That is precisely the kind of flow that can lift daily revenue without necessarily signaling durable user retention.
Meme-driven DEX activity is not neutral for the chain
Rising revenue is straightforwardly positive for a protocol’s treasury and for validators if fees are routed that way. But the composition of the volume matters. When a large share of revenue arrives from meme speculation, the risk is that the metric becomes cyclical rather than structural. The same users who push daily revenue to a record can vanish when the meme market cools or when another low-friction venue offers easier access.
The address count offers some grounding. A jump to 25,500 daily trading addresses suggests the spike was not the work of a handful of large wallets. That breadth is harder to dismiss as wash trading or a single algorithm, although it is still well short of the activity seen on the largest EVM chains. It places HyperEVM in a cohort of venues that can absorb bursts of retail volume but still need to prove they can hold developers and liquidity providers after the meme phase fades.
That does not mean HyperEVM is suddenly in the same league as the large L1s that consistently lead developer activity rankings. Developer momentum and trading velocity often diverge, especially when a chain’s daily revenue is being driven by a specific meme rotation rather than a broad application buildout.
The recent weekly gainers list reinforced how meme and low-float tokens dominate attention in these windows. That rotation helps venues with cheap execution and fast token listing pipelines, which is exactly where HyperEVM appears to be benefiting.
What remains uncertain
One day at a revenue high does not establish a trend, but August 23 may be a useful test of whether HyperEVM can convert meme-driven traffic into stickier relationships. The chain’s developers will be watching whether trading addresses remain elevated over the following weeks or if the spike collapses as soon as the most active meme tokens lose momentum.
The other open question is whether the revenue surge changes how the Hyperliquid ecosystem manages risk. If meme trading continues to push transactions and volume higher, the pressure on finality, oracle pricing, and liquidation infrastructure increases. Chains that want speculative flow need to absorb it without degrading the experience for existing perps traders, who are largely there for deeper liquidity and predictable execution rather than low-cap meme exposure.
That tension between different user bases is not unique to HyperEVM. It has appeared across Ethereum L2s, alternative L1s, and DEX platforms as meme trading migrated from one venue to another in search of lower fees and fresh token launches. The difference here is that HyperEVM sits inside an ecosystem that already had a specialized trading product. The revenue record suggests the compatibility layer is now capturing a different kind of market participant, one that moves faster and leaves less obvious signal about how long it will stay.
Details from the original report show the move came with broad participation. Trading addresses on the HyperEVM DEX hit 25,500, the most since September last year, while trading volume and transaction counts also posted clear gains.
Where the surge fits in Hyperliquid’s structure
Hyperliquid runs a purpose-built L1 for order book trading, and HyperEVM is the compatibility layer that lets Ethereum-style applications and wallets plug into that environment. The revenue jump matters because it indicates that usage is not confined to Hyperliquid’s flagship perps market. Meme trading has gravitated toward the DEX side, where lower friction and familiar EVM tooling can attract speculative flow quickly.
That pattern is consistent with what the broader altcoin market has shown throughout the current cycle. Fast-moving L1 tokens and lower-cap memecoins have repeatedly captured trader attention when majors stagnate, sometimes producing large single-day repricing events. SUI’s 18% move in a single session earlier this year was driven by a different mix of institutional staking and fintech integration, but it showed how quickly alt-L1 flows can reappear when incentives align.
For HyperEVM, the fee spike is a reminder that DEX metrics can turn from slow-building adoption to reflexive speculation in a matter of days. Meme-oriented trading tends to be velocity-heavy: smaller average trade sizes, more transactions per address, and greater willingness to rotate into newly listed tokens without long-term conviction. That is precisely the kind of flow that can lift daily revenue without necessarily signaling durable user retention.
Meme-driven DEX activity is not neutral for the chain
Rising revenue is straightforwardly positive for a protocol’s treasury and for validators if fees are routed that way. But the composition of the volume matters. When a large share of revenue arrives from meme speculation, the risk is that the metric becomes cyclical rather than structural. The same users who push daily revenue to a record can vanish when the meme market cools or when another low-friction venue offers easier access.
The address count offers some grounding. A jump to 25,500 daily trading addresses suggests the spike was not the work of a handful of large wallets. That breadth is harder to dismiss as wash trading or a single algorithm, although it is still well short of the activity seen on the largest EVM chains. It places HyperEVM in a cohort of venues that can absorb bursts of retail volume but still need to prove they can hold developers and liquidity providers after the meme phase fades.
That does not mean HyperEVM is suddenly in the same league as the large L1s that consistently lead developer activity rankings. Developer momentum and trading velocity often diverge, especially when a chain’s daily revenue is being driven by a specific meme rotation rather than a broad application buildout.
The recent weekly gainers list reinforced how meme and low-float tokens dominate attention in these windows. That rotation helps venues with cheap execution and fast token listing pipelines, which is exactly where HyperEVM appears to be benefiting.
What remains uncertain
One day at a revenue high does not establish a trend, but August 23 may be a useful test of whether HyperEVM can convert meme-driven traffic into stickier relationships. The chain’s developers will be watching whether trading addresses remain elevated over the following weeks or if the spike collapses as soon as the most active meme tokens lose momentum.
The other open question is whether the revenue surge changes how the Hyperliquid ecosystem manages risk. If meme trading continues to push transactions and volume higher, the pressure on finality, oracle pricing, and liquidation infrastructure increases. Chains that want speculative flow need to absorb it without degrading the experience for existing perps traders, who are largely there for deeper liquidity and predictable execution rather than low-cap meme exposure.
That tension between different user bases is not unique to HyperEVM. It has appeared across Ethereum L2s, alternative L1s, and DEX platforms as meme trading migrated from one venue to another in search of lower fees and fresh token launches. The difference here is that HyperEVM sits inside an ecosystem that already had a specialized trading product. The revenue record suggests the compatibility layer is now capturing a different kind of market participant, one that moves faster and leaves less obvious signal about how long it will stay.
12
Binance’s TradFi Perpetuals Show Early Traction As Multi-Asset Strategy ExpandsThe boundary between crypto-native trading venues and traditional brokerage desks is becoming harder to locate. Binance has spent months layering traditional finance assets onto a platform built for digital asset derivatives, and the latest read suggests the strategy is producing more than a product announcement cycle.
According to the original report, Binance’s effort to bring TradFi assets onto its crypto-native platform is showing clear signs of traction. The framing points to a multi-asset strategy, but the update does not provide granular volume figures or a detailed asset-by-asset breakdown. That leaves market participants reading the move through product structure rather than hard data.
What a TradFi Perpetual Changes for Traders
Perpetual contracts tied to traditional assets are not a new concept, but the way a major crypto exchange packages them matters. For a trader already using Binance’s perpetual infrastructure, the structural appeal is straightforward: a familiar order book, an established liquidation engine, and the ability to manage exposure without leaving the venue. That is different from opening a separate account with a broker or navigating fragmented TradFi execution.
The product design question is whether those contracts become genuine alternatives to traditional futures or function as synthetic exposure for crypto-native capital. Binance’s signal suggests it believes the demand is broad enough to support both. If that holds, the venue starts to look less like an exchange for digital assets and more like a cross-asset derivatives destination.
Liquidity, Collateral, and the Multi-Asset Push
Multi-asset strategy in derivatives usually means one collateral pool doing more work. That has benefits and complications. On the benefit side, capital efficiency improves when traders can post one type of margin against different exposures. On the risk side, the venue has to prove that its risk systems can handle the interaction between crypto volatility and more conventional asset prices.
The current push also lands at a moment when real-world asset tokenization is becoming a measurable flow rather than a narrative. As BlockchainReporter covered in its Weekly Tokenization Roundup, on-chain RWA activity has passed $20 billion, and live settlement arrangements are moving from test cases to operational infrastructure. Binance’s TradFi perpetuals are part of the same convergence, even if the contract structure is different from tokenized ownership.
Institutional demand for alternative exposure is not confined to tokenized Treasuries. Sui’s recent run-up on institutional staking demand showed how quickly product narratives can harden into capital flows, as noted in this Sui institutional staking update. The parallel matters because it indicates that allocators are willing to test non-native yield and exposure when the venue architecture is credible.
Why the Timing Matters
Exchange expansion into TradFi products is not happening in a regulatory vacuum. The US legislative picture remains unsettled, and major industry fights are still playing out in Washington. Banks were pressing for last-minute changes to a significant crypto bill just days before a Senate vote, a dynamic covered in this crypto bill update. That uncertainty makes offshore and global product rollouts more sensitive, because the same venue can face very different rules across jurisdictions.
What remains uncertain is whether the traction Binance reports translates into durable market share in TradFi-facing derivatives or simply reflects early experimentation by crypto-native traders. Without disclosed volumes, open interest, or product-level liquidity, the market cannot separate genuine adoption from promotional momentum. The next data points to watch are whether more traditional counterparties participate, whether margin efficiency improves, and whether the product attracts traders who were not already active in crypto perpetuals.
For now, the report offers a directional signal: Binance is treating TradFi perpetuals as core infrastructure, not as a side project. Whether that bet reshapes how traditional asset exposure is traded depends on execution details the market has not yet seen.
Binance’s TradFi Perpetuals Show Early Traction As Multi-Asset Strategy Expands
The boundary between crypto-native trading venues and traditional brokerage desks is becoming harder to locate. Binance has spent months layering traditional finance assets onto a platform built for digital asset derivatives, and the latest read suggests the strategy is producing more than a product announcement cycle.
According to the original report, Binance’s effort to bring TradFi assets onto its crypto-native platform is showing clear signs of traction. The framing points to a multi-asset strategy, but the update does not provide granular volume figures or a detailed asset-by-asset breakdown. That leaves market participants reading the move through product structure rather than hard data.
What a TradFi Perpetual Changes for Traders
Perpetual contracts tied to traditional assets are not a new concept, but the way a major crypto exchange packages them matters. For a trader already using Binance’s perpetual infrastructure, the structural appeal is straightforward: a familiar order book, an established liquidation engine, and the ability to manage exposure without leaving the venue. That is different from opening a separate account with a broker or navigating fragmented TradFi execution.
The product design question is whether those contracts become genuine alternatives to traditional futures or function as synthetic exposure for crypto-native capital. Binance’s signal suggests it believes the demand is broad enough to support both. If that holds, the venue starts to look less like an exchange for digital assets and more like a cross-asset derivatives destination.
Liquidity, Collateral, and the Multi-Asset Push
Multi-asset strategy in derivatives usually means one collateral pool doing more work. That has benefits and complications. On the benefit side, capital efficiency improves when traders can post one type of margin against different exposures. On the risk side, the venue has to prove that its risk systems can handle the interaction between crypto volatility and more conventional asset prices.
The current push also lands at a moment when real-world asset tokenization is becoming a measurable flow rather than a narrative. As BlockchainReporter covered in its Weekly Tokenization Roundup, on-chain RWA activity has passed $20 billion, and live settlement arrangements are moving from test cases to operational infrastructure. Binance’s TradFi perpetuals are part of the same convergence, even if the contract structure is different from tokenized ownership.
Institutional demand for alternative exposure is not confined to tokenized Treasuries. Sui’s recent run-up on institutional staking demand showed how quickly product narratives can harden into capital flows, as noted in this Sui institutional staking update. The parallel matters because it indicates that allocators are willing to test non-native yield and exposure when the venue architecture is credible.
Why the Timing Matters
Exchange expansion into TradFi products is not happening in a regulatory vacuum. The US legislative picture remains unsettled, and major industry fights are still playing out in Washington. Banks were pressing for last-minute changes to a significant crypto bill just days before a Senate vote, a dynamic covered in this crypto bill update. That uncertainty makes offshore and global product rollouts more sensitive, because the same venue can face very different rules across jurisdictions.
What remains uncertain is whether the traction Binance reports translates into durable market share in TradFi-facing derivatives or simply reflects early experimentation by crypto-native traders. Without disclosed volumes, open interest, or product-level liquidity, the market cannot separate genuine adoption from promotional momentum. The next data points to watch are whether more traditional counterparties participate, whether margin efficiency improves, and whether the product attracts traders who were not already active in crypto perpetuals.
For now, the report offers a directional signal: Binance is treating TradFi perpetuals as core infrastructure, not as a side project. Whether that bet reshapes how traditional asset exposure is traded depends on execution details the market has not yet seen.
According to the original report, Binance’s effort to bring TradFi assets onto its crypto-native platform is showing clear signs of traction. The framing points to a multi-asset strategy, but the update does not provide granular volume figures or a detailed asset-by-asset breakdown. That leaves market participants reading the move through product structure rather than hard data.
What a TradFi Perpetual Changes for Traders
Perpetual contracts tied to traditional assets are not a new concept, but the way a major crypto exchange packages them matters. For a trader already using Binance’s perpetual infrastructure, the structural appeal is straightforward: a familiar order book, an established liquidation engine, and the ability to manage exposure without leaving the venue. That is different from opening a separate account with a broker or navigating fragmented TradFi execution.
The product design question is whether those contracts become genuine alternatives to traditional futures or function as synthetic exposure for crypto-native capital. Binance’s signal suggests it believes the demand is broad enough to support both. If that holds, the venue starts to look less like an exchange for digital assets and more like a cross-asset derivatives destination.
Liquidity, Collateral, and the Multi-Asset Push
Multi-asset strategy in derivatives usually means one collateral pool doing more work. That has benefits and complications. On the benefit side, capital efficiency improves when traders can post one type of margin against different exposures. On the risk side, the venue has to prove that its risk systems can handle the interaction between crypto volatility and more conventional asset prices.
The current push also lands at a moment when real-world asset tokenization is becoming a measurable flow rather than a narrative. As BlockchainReporter covered in its Weekly Tokenization Roundup, on-chain RWA activity has passed $20 billion, and live settlement arrangements are moving from test cases to operational infrastructure. Binance’s TradFi perpetuals are part of the same convergence, even if the contract structure is different from tokenized ownership.
Institutional demand for alternative exposure is not confined to tokenized Treasuries. Sui’s recent run-up on institutional staking demand showed how quickly product narratives can harden into capital flows, as noted in this Sui institutional staking update. The parallel matters because it indicates that allocators are willing to test non-native yield and exposure when the venue architecture is credible.
Why the Timing Matters
Exchange expansion into TradFi products is not happening in a regulatory vacuum. The US legislative picture remains unsettled, and major industry fights are still playing out in Washington. Banks were pressing for last-minute changes to a significant crypto bill just days before a Senate vote, a dynamic covered in this crypto bill update. That uncertainty makes offshore and global product rollouts more sensitive, because the same venue can face very different rules across jurisdictions.
What remains uncertain is whether the traction Binance reports translates into durable market share in TradFi-facing derivatives or simply reflects early experimentation by crypto-native traders. Without disclosed volumes, open interest, or product-level liquidity, the market cannot separate genuine adoption from promotional momentum. The next data points to watch are whether more traditional counterparties participate, whether margin efficiency improves, and whether the product attracts traders who were not already active in crypto perpetuals.
For now, the report offers a directional signal: Binance is treating TradFi perpetuals as core infrastructure, not as a side project. Whether that bet reshapes how traditional asset exposure is traded depends on execution details the market has not yet seen.
15
KuMining Advances Its Multi-Asset Mining Ecosystem With KAS Cloud MiningPROVIDENCIALES, Turks and Caicos Islands, Aug. 25, 2026. KuMining, the cloud mining platform powered by global cryptocurrency exchange KuCoin, has launched KAS Cloud Mining, adding Kaspa’s native asset to its growing range of Proof-of-Work mining products.
The new offering gives eligible users access to professional KAS mining infrastructure without purchasing or operating physical mining equipment. Users can select contracts ranging from 7 to 360 days, with variable daily KAS output determined by purchased hashrate and applicable product rules.
Kaspa is a Proof-of-Work blockDAG network, with KAS entering circulation through mining. By purchasing hashrate, users can participate in the network’s block production and security process, providing another way to gain exposure to KAS beyond buying the asset on the secondary market.
Mining KAS increasingly relies on specialized ASIC hardware. Running an independent operation typically requires users to source and transport equipment, arrange electricity and hosting, configure mining pools, and handle ongoing maintenance. KuMining manages these infrastructure and operational requirements through its cloud-based model.
Rather than relying on the probability of finding blocks through solo mining, KuMining uses a pool-based structure designed to provide more continuous and observable mining output. Users do not need to own, configure, or maintain the underlying hardware.
The KAS product also follows KuMining’s “mine first, pay electricity later” model. Users pay the applicable hashrate fee upfront, while electricity charges are settled over time. The structure reduces the amount of capital required at the start of a contract and provides additional cash-flow flexibility, without reducing the overall cost of mining.
“Mining should be accessible to anyone who wants to participate, not limited to those with the resources to purchase and operate specialized equipment,” said Jolie Du, Chief Operating Officer of KuMining. “By introducing KAS Cloud Mining, we are giving more users a simpler path into professional Proof-of-Work mining while taking another step in the expansion of KuMining’s multi-asset ecosystem. Our goal is to connect professional infrastructure with everyday users through a transparent and integrated experience.”
KuMining is integrated with KuCoin, allowing users to receive and manage their mining output within the broader KuCoin ecosystem rather than separately managing mining pools, wallets, and exchanges.
The addition of KAS expands KuMining’s multi-asset mining offering and extends KuCoin’s Trade → Earn → Mine user journey by adding another Proof-of-Work asset to its cloud mining infrastructure.
KAS Cloud Mining is now available to eligible users here.
KuMining Advances Its Multi-Asset Mining Ecosystem With KAS Cloud Mining
PROVIDENCIALES, Turks and Caicos Islands, Aug. 25, 2026. KuMining, the cloud mining platform powered by global cryptocurrency exchange KuCoin, has launched KAS Cloud Mining, adding Kaspa’s native asset to its growing range of Proof-of-Work mining products.
The new offering gives eligible users access to professional KAS mining infrastructure without purchasing or operating physical mining equipment. Users can select contracts ranging from 7 to 360 days, with variable daily KAS output determined by purchased hashrate and applicable product rules.
Kaspa is a Proof-of-Work blockDAG network, with KAS entering circulation through mining. By purchasing hashrate, users can participate in the network’s block production and security process, providing another way to gain exposure to KAS beyond buying the asset on the secondary market.
Mining KAS increasingly relies on specialized ASIC hardware. Running an independent operation typically requires users to source and transport equipment, arrange electricity and hosting, configure mining pools, and handle ongoing maintenance. KuMining manages these infrastructure and operational requirements through its cloud-based model.
Rather than relying on the probability of finding blocks through solo mining, KuMining uses a pool-based structure designed to provide more continuous and observable mining output. Users do not need to own, configure, or maintain the underlying hardware.
The KAS product also follows KuMining’s “mine first, pay electricity later” model. Users pay the applicable hashrate fee upfront, while electricity charges are settled over time. The structure reduces the amount of capital required at the start of a contract and provides additional cash-flow flexibility, without reducing the overall cost of mining.
“Mining should be accessible to anyone who wants to participate, not limited to those with the resources to purchase and operate specialized equipment,” said Jolie Du, Chief Operating Officer of KuMining. “By introducing KAS Cloud Mining, we are giving more users a simpler path into professional Proof-of-Work mining while taking another step in the expansion of KuMining’s multi-asset ecosystem. Our goal is to connect professional infrastructure with everyday users through a transparent and integrated experience.”
KuMining is integrated with KuCoin, allowing users to receive and manage their mining output within the broader KuCoin ecosystem rather than separately managing mining pools, wallets, and exchanges.
The addition of KAS expands KuMining’s multi-asset mining offering and extends KuCoin’s Trade → Earn → Mine user journey by adding another Proof-of-Work asset to its cloud mining infrastructure.
KAS Cloud Mining is now available to eligible users here.
The new offering gives eligible users access to professional KAS mining infrastructure without purchasing or operating physical mining equipment. Users can select contracts ranging from 7 to 360 days, with variable daily KAS output determined by purchased hashrate and applicable product rules.
Kaspa is a Proof-of-Work blockDAG network, with KAS entering circulation through mining. By purchasing hashrate, users can participate in the network’s block production and security process, providing another way to gain exposure to KAS beyond buying the asset on the secondary market.
Mining KAS increasingly relies on specialized ASIC hardware. Running an independent operation typically requires users to source and transport equipment, arrange electricity and hosting, configure mining pools, and handle ongoing maintenance. KuMining manages these infrastructure and operational requirements through its cloud-based model.
Rather than relying on the probability of finding blocks through solo mining, KuMining uses a pool-based structure designed to provide more continuous and observable mining output. Users do not need to own, configure, or maintain the underlying hardware.
The KAS product also follows KuMining’s “mine first, pay electricity later” model. Users pay the applicable hashrate fee upfront, while electricity charges are settled over time. The structure reduces the amount of capital required at the start of a contract and provides additional cash-flow flexibility, without reducing the overall cost of mining.
“Mining should be accessible to anyone who wants to participate, not limited to those with the resources to purchase and operate specialized equipment,” said Jolie Du, Chief Operating Officer of KuMining. “By introducing KAS Cloud Mining, we are giving more users a simpler path into professional Proof-of-Work mining while taking another step in the expansion of KuMining’s multi-asset ecosystem. Our goal is to connect professional infrastructure with everyday users through a transparent and integrated experience.”
KuMining is integrated with KuCoin, allowing users to receive and manage their mining output within the broader KuCoin ecosystem rather than separately managing mining pools, wallets, and exchanges.
The addition of KAS expands KuMining’s multi-asset mining offering and extends KuCoin’s Trade → Earn → Mine user journey by adding another Proof-of-Work asset to its cloud mining infrastructure.
KAS Cloud Mining is now available to eligible users here.
20
How Stablecoins Are Becoming the Payments Layer for Digital EntertainmentDigital entertainment platforms are experiencing a fundamental transformation in how payments are handled, with stablecoins, crypto wallets, and blockchain payment rails leading the way. These technologies are driving faster transactions, global access, and reduced payment friction across gaming, streaming, and other entertainment services. As seamless payments become a key focus, platforms now compete not just on content, but on convenience and reliability.
As the digital entertainment sector evolves, the need for dependable and versatile payment solutions has never been greater. Consumers expect to transact easily, with minimal delays and no hidden hurdles. Stablecoins now offer low-volatility, borderless value transfers, while mobile-first crypto wallets give users the tools to manage payments from anywhere. In this environment, payment reliability and speed are as important as the content itself, causing platforms to reconsider how they connect with audiences. This shift is evident across many digital entertainment offerings, including gaming platforms and crypto-friendly casino apps, where seamless, secure payments have become a central expectation.
Stablecoins and the rise of frictionless payments
Stablecoins are digital assets designed to maintain a steady value, and their adoption has reduced much of the volatility historically associated with crypto payments. For online entertainment platforms, this brings a new layer of predictability to transactions, both for providers and users. Cross-border payments can now be completed in seconds, eliminating long settlement periods or excessive fees.
With stablecoins widely available in mobile wallets, entertainment platforms are able to offer on-demand access to games, subscriptions, and rewards. Blockchain payment rails ensure that these transactions are quick and transparent, setting a new standard for low-friction user experiences. Global users can participate seamlessly, no matter their location.
The integration of stablecoins into payment infrastructure has also enabled microtransactions at scale, something traditional payment processors struggle to handle efficiently due to high fixed costs per transaction. Digital entertainment platforms can now monetize smaller purchases, such as in-game items, premium features, or pay-per-view content, without being burdened by disproportionate processing fees. This granular monetization model opens new revenue streams while giving users more flexible spending options. Additionally, stablecoins eliminate chargeback fraud, a persistent issue in digital entertainment, providing platforms with greater financial certainty and reducing operational overhead associated with dispute resolution.
Blockchain payment rails and global accessibility
Blockchain-based payment systems facilitate real-time tracking and verifiable records, dramatically improving the auditing process for both users and platforms. This transparency removes guesswork from the payment experience and strengthens user trust in digital entertainment services.
Platforms adopting these rails can serve international audiences without relying on traditional payment systems that may be limited or costly in certain regions. As a result, digital entertainment has become more accessible to users worldwide, and competition increasingly focuses on providing smooth, borderless payment experiences rather than solely on exclusive content.
The shift to mobile-first wallets and user convenience
Mobile-first crypto wallets have emerged as the bridge between stablecoins and mainstream digital entertainment. They simplify the process of managing payments, providing clear insights into payment status, transaction fees, and transfer details directly within the user interface. These wallets help reduce mistakes, such as incorrect network selections or missing information, making payments more reliable for everyday users.
This focus on convenience is helping to redefine user expectations. Payment solutions that combine privacy, speed, and transparency are now considered essential for any successful digital entertainment platform. As more platforms, such as online gaming sites, streaming services, and even crypto-friendly casino apps, adopt these technologies, the competitive landscape will favor those who can offer the smoothest, most trustworthy payments alongside compelling content.
Competing on payment experience in digital entertainment
Today, the ability to deliver rapid, secure, and user-centered payments is reshaping the digital entertainment industry. Stablecoins and blockchain-enabled wallets are enabling platforms to stand out by removing payment obstacles and reducing delays that once frustrated users.
As digital entertainment options grow, platforms that can integrate stable, frictionless, and globally accessible payment solutions will capture user loyalty and engagement. In this new era, payment convenience is as crucial to a platform’s success as its entertainment offerings, setting the course for ongoing innovation and competition in the sector.
This article is not intended as financial advice. Educational purposes only.
How Stablecoins Are Becoming the Payments Layer for Digital Entertainment
Digital entertainment platforms are experiencing a fundamental transformation in how payments are handled, with stablecoins, crypto wallets, and blockchain payment rails leading the way. These technologies are driving faster transactions, global access, and reduced payment friction across gaming, streaming, and other entertainment services. As seamless payments become a key focus, platforms now compete not just on content, but on convenience and reliability.
As the digital entertainment sector evolves, the need for dependable and versatile payment solutions has never been greater. Consumers expect to transact easily, with minimal delays and no hidden hurdles. Stablecoins now offer low-volatility, borderless value transfers, while mobile-first crypto wallets give users the tools to manage payments from anywhere. In this environment, payment reliability and speed are as important as the content itself, causing platforms to reconsider how they connect with audiences. This shift is evident across many digital entertainment offerings, including gaming platforms and crypto-friendly casino apps, where seamless, secure payments have become a central expectation.
Stablecoins and the rise of frictionless payments
Stablecoins are digital assets designed to maintain a steady value, and their adoption has reduced much of the volatility historically associated with crypto payments. For online entertainment platforms, this brings a new layer of predictability to transactions, both for providers and users. Cross-border payments can now be completed in seconds, eliminating long settlement periods or excessive fees.
With stablecoins widely available in mobile wallets, entertainment platforms are able to offer on-demand access to games, subscriptions, and rewards. Blockchain payment rails ensure that these transactions are quick and transparent, setting a new standard for low-friction user experiences. Global users can participate seamlessly, no matter their location.
The integration of stablecoins into payment infrastructure has also enabled microtransactions at scale, something traditional payment processors struggle to handle efficiently due to high fixed costs per transaction. Digital entertainment platforms can now monetize smaller purchases, such as in-game items, premium features, or pay-per-view content, without being burdened by disproportionate processing fees. This granular monetization model opens new revenue streams while giving users more flexible spending options. Additionally, stablecoins eliminate chargeback fraud, a persistent issue in digital entertainment, providing platforms with greater financial certainty and reducing operational overhead associated with dispute resolution.
Blockchain payment rails and global accessibility
Blockchain-based payment systems facilitate real-time tracking and verifiable records, dramatically improving the auditing process for both users and platforms. This transparency removes guesswork from the payment experience and strengthens user trust in digital entertainment services.
Platforms adopting these rails can serve international audiences without relying on traditional payment systems that may be limited or costly in certain regions. As a result, digital entertainment has become more accessible to users worldwide, and competition increasingly focuses on providing smooth, borderless payment experiences rather than solely on exclusive content.
The shift to mobile-first wallets and user convenience
Mobile-first crypto wallets have emerged as the bridge between stablecoins and mainstream digital entertainment. They simplify the process of managing payments, providing clear insights into payment status, transaction fees, and transfer details directly within the user interface. These wallets help reduce mistakes, such as incorrect network selections or missing information, making payments more reliable for everyday users.
This focus on convenience is helping to redefine user expectations. Payment solutions that combine privacy, speed, and transparency are now considered essential for any successful digital entertainment platform. As more platforms, such as online gaming sites, streaming services, and even crypto-friendly casino apps, adopt these technologies, the competitive landscape will favor those who can offer the smoothest, most trustworthy payments alongside compelling content.
Competing on payment experience in digital entertainment
Today, the ability to deliver rapid, secure, and user-centered payments is reshaping the digital entertainment industry. Stablecoins and blockchain-enabled wallets are enabling platforms to stand out by removing payment obstacles and reducing delays that once frustrated users.
As digital entertainment options grow, platforms that can integrate stable, frictionless, and globally accessible payment solutions will capture user loyalty and engagement. In this new era, payment convenience is as crucial to a platform’s success as its entertainment offerings, setting the course for ongoing innovation and competition in the sector.
This article is not intended as financial advice. Educational purposes only.
As the digital entertainment sector evolves, the need for dependable and versatile payment solutions has never been greater. Consumers expect to transact easily, with minimal delays and no hidden hurdles. Stablecoins now offer low-volatility, borderless value transfers, while mobile-first crypto wallets give users the tools to manage payments from anywhere. In this environment, payment reliability and speed are as important as the content itself, causing platforms to reconsider how they connect with audiences. This shift is evident across many digital entertainment offerings, including gaming platforms and crypto-friendly casino apps, where seamless, secure payments have become a central expectation.
Stablecoins and the rise of frictionless payments
Stablecoins are digital assets designed to maintain a steady value, and their adoption has reduced much of the volatility historically associated with crypto payments. For online entertainment platforms, this brings a new layer of predictability to transactions, both for providers and users. Cross-border payments can now be completed in seconds, eliminating long settlement periods or excessive fees.
With stablecoins widely available in mobile wallets, entertainment platforms are able to offer on-demand access to games, subscriptions, and rewards. Blockchain payment rails ensure that these transactions are quick and transparent, setting a new standard for low-friction user experiences. Global users can participate seamlessly, no matter their location.
The integration of stablecoins into payment infrastructure has also enabled microtransactions at scale, something traditional payment processors struggle to handle efficiently due to high fixed costs per transaction. Digital entertainment platforms can now monetize smaller purchases, such as in-game items, premium features, or pay-per-view content, without being burdened by disproportionate processing fees. This granular monetization model opens new revenue streams while giving users more flexible spending options. Additionally, stablecoins eliminate chargeback fraud, a persistent issue in digital entertainment, providing platforms with greater financial certainty and reducing operational overhead associated with dispute resolution.
Blockchain payment rails and global accessibility
Blockchain-based payment systems facilitate real-time tracking and verifiable records, dramatically improving the auditing process for both users and platforms. This transparency removes guesswork from the payment experience and strengthens user trust in digital entertainment services.
Platforms adopting these rails can serve international audiences without relying on traditional payment systems that may be limited or costly in certain regions. As a result, digital entertainment has become more accessible to users worldwide, and competition increasingly focuses on providing smooth, borderless payment experiences rather than solely on exclusive content.
The shift to mobile-first wallets and user convenience
Mobile-first crypto wallets have emerged as the bridge between stablecoins and mainstream digital entertainment. They simplify the process of managing payments, providing clear insights into payment status, transaction fees, and transfer details directly within the user interface. These wallets help reduce mistakes, such as incorrect network selections or missing information, making payments more reliable for everyday users.
This focus on convenience is helping to redefine user expectations. Payment solutions that combine privacy, speed, and transparency are now considered essential for any successful digital entertainment platform. As more platforms, such as online gaming sites, streaming services, and even crypto-friendly casino apps, adopt these technologies, the competitive landscape will favor those who can offer the smoothest, most trustworthy payments alongside compelling content.
Competing on payment experience in digital entertainment
Today, the ability to deliver rapid, secure, and user-centered payments is reshaping the digital entertainment industry. Stablecoins and blockchain-enabled wallets are enabling platforms to stand out by removing payment obstacles and reducing delays that once frustrated users.
As digital entertainment options grow, platforms that can integrate stable, frictionless, and globally accessible payment solutions will capture user loyalty and engagement. In this new era, payment convenience is as crucial to a platform’s success as its entertainment offerings, setting the course for ongoing innovation and competition in the sector.
This article is not intended as financial advice. Educational purposes only.
15
Bitcoin Crosses $80,000 As Treasury Policy Shift Revives ETF DemandBitcoin pushed back above $80,000 for the first time since May, a level that looked far away after the June flush carried the market toward $58,000. The 38% rebound from that low has been driven less by a single catalyst and more by a shift in U.S. Treasury policy that brought ETF buyers back into spot markets, according to the original report.
That dynamic is different from earlier rallies. For much of the cycle, bitcoin’s price was explained through halving supply math, ETF approval momentum, or speculative altcoin rotation. This move is tied to the rates complex. When U.S. Treasury conditions ease, the opportunity cost of holding a non-yielding asset drops. Traders who exited in June because the macro setup looked hostile are being forced to reconsider the same trade at higher prices.
The June flush was not a slow drift. It compressed positioning quickly and left many spot buyers underwater, which made the recovery harder to accept when Treasury signals turned. That is one reason the rally has felt under-owned even as price action improved. Under-owned rallies can extend further than they look, but they also produce sharp reversals when the macro catalyst pauses.
Treasury Policy Reaccelerates the Recovery
The Treasury shift matters because bitcoin has become increasingly sensitive to dollar liquidity and short-term rate expectations. A more favorable issuance mix or a dovish repricing in yields lowers the hurdle for risk exposure. It also changes the behavior of institutional desks that were content to sit in cash or short-duration paper during the summer.
Spot ETF flows show the result. Buying that dried up in the June slide has returned, not as a trickle but as a visible bid that absorbs spot supply around key technical levels. That is the structural difference between this recovery and a short squeeze. The market is not only reacting to forced liquidations; it is rebuilding a more durable base of demand.
ETF Demand Provides a Floor
The return of ETF demand does more than push price. It changes how drawdowns behave. When inflows are expanding, ordinary profit-taking gets absorbed quickly. That keeps pullbacks shallow and reduces the volatility that tends to shake out newer holders. The same mechanism has supported other institutional segments, including tokenized real-world asset markets now moving through live settlements and consolidation, as covered in the latest tokenization roundup.
Altcoin markets are also feeding off the better macro tone, though with their own catalysts. SUI’s recent 18% run, for example, came on a mix of institutional staking and a fintech integration rather than pure bitcoin beta, as shown in its market update. That dispersion is normal for a recovery driven by rates: the macro tide lifts the broad market, while individual names reprice according to their own news flow.
What Remains Uncertain
The open question is whether ETF demand persists if Treasury signals reverse even slightly. A policy-driven rally can unwind just as quickly as it formed, especially if the market has front-run expectations too aggressively. Traders will be watching whether $80,000 turns into a support level or becomes another level where fast money sells into strength.
Washington adds a second layer of uncertainty. Even as Treasury conditions work in crypto’s favor, the legislative picture remains contested. Banks are still pushing to alter the biggest crypto bill in U.S. history days before a Senate vote, a reminder that policy tailwinds are not uniform across the system, as reported in the Senate bill coverage.
For now, the price action is sending a clear signal. The June breakdown did not mark the start of a longer bear market. Instead, it functioned as a sharp policy-driven de-risking that reversed once Treasury conditions shifted. Whether that reversal turns into a sustained uptrend depends on ETF inflows holding through the next macro test, not on a single break of a round number.
Bitcoin Crosses $80,000 As Treasury Policy Shift Revives ETF Demand
Bitcoin pushed back above $80,000 for the first time since May, a level that looked far away after the June flush carried the market toward $58,000. The 38% rebound from that low has been driven less by a single catalyst and more by a shift in U.S. Treasury policy that brought ETF buyers back into spot markets, according to the original report.
That dynamic is different from earlier rallies. For much of the cycle, bitcoin’s price was explained through halving supply math, ETF approval momentum, or speculative altcoin rotation. This move is tied to the rates complex. When U.S. Treasury conditions ease, the opportunity cost of holding a non-yielding asset drops. Traders who exited in June because the macro setup looked hostile are being forced to reconsider the same trade at higher prices.
The June flush was not a slow drift. It compressed positioning quickly and left many spot buyers underwater, which made the recovery harder to accept when Treasury signals turned. That is one reason the rally has felt under-owned even as price action improved. Under-owned rallies can extend further than they look, but they also produce sharp reversals when the macro catalyst pauses.
Treasury Policy Reaccelerates the Recovery
The Treasury shift matters because bitcoin has become increasingly sensitive to dollar liquidity and short-term rate expectations. A more favorable issuance mix or a dovish repricing in yields lowers the hurdle for risk exposure. It also changes the behavior of institutional desks that were content to sit in cash or short-duration paper during the summer.
Spot ETF flows show the result. Buying that dried up in the June slide has returned, not as a trickle but as a visible bid that absorbs spot supply around key technical levels. That is the structural difference between this recovery and a short squeeze. The market is not only reacting to forced liquidations; it is rebuilding a more durable base of demand.
ETF Demand Provides a Floor
The return of ETF demand does more than push price. It changes how drawdowns behave. When inflows are expanding, ordinary profit-taking gets absorbed quickly. That keeps pullbacks shallow and reduces the volatility that tends to shake out newer holders. The same mechanism has supported other institutional segments, including tokenized real-world asset markets now moving through live settlements and consolidation, as covered in the latest tokenization roundup.
Altcoin markets are also feeding off the better macro tone, though with their own catalysts. SUI’s recent 18% run, for example, came on a mix of institutional staking and a fintech integration rather than pure bitcoin beta, as shown in its market update. That dispersion is normal for a recovery driven by rates: the macro tide lifts the broad market, while individual names reprice according to their own news flow.
What Remains Uncertain
The open question is whether ETF demand persists if Treasury signals reverse even slightly. A policy-driven rally can unwind just as quickly as it formed, especially if the market has front-run expectations too aggressively. Traders will be watching whether $80,000 turns into a support level or becomes another level where fast money sells into strength.
Washington adds a second layer of uncertainty. Even as Treasury conditions work in crypto’s favor, the legislative picture remains contested. Banks are still pushing to alter the biggest crypto bill in U.S. history days before a Senate vote, a reminder that policy tailwinds are not uniform across the system, as reported in the Senate bill coverage.
For now, the price action is sending a clear signal. The June breakdown did not mark the start of a longer bear market. Instead, it functioned as a sharp policy-driven de-risking that reversed once Treasury conditions shifted. Whether that reversal turns into a sustained uptrend depends on ETF inflows holding through the next macro test, not on a single break of a round number.
That dynamic is different from earlier rallies. For much of the cycle, bitcoin’s price was explained through halving supply math, ETF approval momentum, or speculative altcoin rotation. This move is tied to the rates complex. When U.S. Treasury conditions ease, the opportunity cost of holding a non-yielding asset drops. Traders who exited in June because the macro setup looked hostile are being forced to reconsider the same trade at higher prices.
The June flush was not a slow drift. It compressed positioning quickly and left many spot buyers underwater, which made the recovery harder to accept when Treasury signals turned. That is one reason the rally has felt under-owned even as price action improved. Under-owned rallies can extend further than they look, but they also produce sharp reversals when the macro catalyst pauses.
Treasury Policy Reaccelerates the Recovery
The Treasury shift matters because bitcoin has become increasingly sensitive to dollar liquidity and short-term rate expectations. A more favorable issuance mix or a dovish repricing in yields lowers the hurdle for risk exposure. It also changes the behavior of institutional desks that were content to sit in cash or short-duration paper during the summer.
Spot ETF flows show the result. Buying that dried up in the June slide has returned, not as a trickle but as a visible bid that absorbs spot supply around key technical levels. That is the structural difference between this recovery and a short squeeze. The market is not only reacting to forced liquidations; it is rebuilding a more durable base of demand.
ETF Demand Provides a Floor
The return of ETF demand does more than push price. It changes how drawdowns behave. When inflows are expanding, ordinary profit-taking gets absorbed quickly. That keeps pullbacks shallow and reduces the volatility that tends to shake out newer holders. The same mechanism has supported other institutional segments, including tokenized real-world asset markets now moving through live settlements and consolidation, as covered in the latest tokenization roundup.
Altcoin markets are also feeding off the better macro tone, though with their own catalysts. SUI’s recent 18% run, for example, came on a mix of institutional staking and a fintech integration rather than pure bitcoin beta, as shown in its market update. That dispersion is normal for a recovery driven by rates: the macro tide lifts the broad market, while individual names reprice according to their own news flow.
What Remains Uncertain
The open question is whether ETF demand persists if Treasury signals reverse even slightly. A policy-driven rally can unwind just as quickly as it formed, especially if the market has front-run expectations too aggressively. Traders will be watching whether $80,000 turns into a support level or becomes another level where fast money sells into strength.
Washington adds a second layer of uncertainty. Even as Treasury conditions work in crypto’s favor, the legislative picture remains contested. Banks are still pushing to alter the biggest crypto bill in U.S. history days before a Senate vote, a reminder that policy tailwinds are not uniform across the system, as reported in the Senate bill coverage.
For now, the price action is sending a clear signal. The June breakdown did not mark the start of a longer bear market. Instead, it functioned as a sharp policy-driven de-risking that reversed once Treasury conditions shifted. Whether that reversal turns into a sustained uptrend depends on ETF inflows holding through the next macro test, not on a single break of a round number.
194
Tom Lee’s Bitmine Steps Up Ether Buying After a 30% Weekly RallyThe $81 million Ethereum purchase landed after the asset had already climbed 30% in a week. Buying after a move that sharp is usually the kind of behavior associated with momentum traders, not corporate treasuries. Tom Lee’s Bitmine did it anyway, recording its largest weekly ETH allocation since early July.
According to the original report, Lee said the weekly rally could signal a larger move ahead. That is a meaningful distinction. A desk that viewed the bounce as noise would more likely wait for consolidation. Bitmine increased exposure into strength instead.
A bigger Ethereum trade
The buy is notable less for its dollar size than for the signal it sends about how treasury operators are treating ETH. An $81 million weekly addition is not going to move the global ether market on its own. But the pace of buying matters, especially after a period when activity had slowed since early July.
Bitmine’s position shows that some buyers are treating Ethereum as a balance-sheet asset rather than a pure trading vehicle. The network remains the dominant environment for developers and settlement volume, even as competitors have made inroads. BlockchainReporter’s Top 10 Blockchains by Developer Activity This Week puts Ethereum at the center of ongoing contract and tooling work, which tends to anchor longer-duration capital.
Institutional flows and the Ethereum bid
The timing also lines up with a broader push of on-chain capital into assets that can produce or settle value without traditional intermediaries. Tokenized treasury products and real-world asset experiments have absorbed institutional attention, as covered in BlockchainReporter’s Weekly Tokenization Roundup. Ether occupies a different role from those instruments, but the demand logic is related: institutions are looking for native crypto exposure that has a network effect behind it.
That does not make the case risk-free. US policy remains a wildcard for any firm holding crypto on balance sheet. The Senate fight over a major crypto bill has shown how quickly the regulatory consensus can fray, as detailed in BlockchainReporter’s coverage of the banking opposition to the legislation. Bitmine has moved before those rules are settled.
For traders, the more important question is not whether Bitmine has spot demand but whether other corporate buyers will follow. Ether’s liquidity is deep enough that a single treasury purchase rarely dictates direction, but repeated institutional bids can tighten available float around psychologically important levels. That was the pattern in previous cycles when treasury announcements attracted more attention than the actual flow.
What remains unresolved
Lee’s comment about a larger move is an expectation, not a guarantee. A 30% weekly rally can compress the risk-reward for new buyers even if the longer-term view is intact. Bitmine may be indicating conviction, or it may be adding exposure as part of a predetermined dollar-cost program that happened to align with the price move. The source material does not specify whether the firm will continue adding at this pace.
What the market will watch next is whether the buying continues after the weekly candle closes. Treasury operators tend to reveal their time horizon through follow-through. If Bitmine returns with another large weekly allocation, the trade becomes more than a one-off signal. If the pace drops, the $81 million buy may end up looking like a reaction to short-term momentum rather than a structural shift.
Tom Lee’s Bitmine Steps Up Ether Buying After a 30% Weekly Rally
The $81 million Ethereum purchase landed after the asset had already climbed 30% in a week. Buying after a move that sharp is usually the kind of behavior associated with momentum traders, not corporate treasuries. Tom Lee’s Bitmine did it anyway, recording its largest weekly ETH allocation since early July.
According to the original report, Lee said the weekly rally could signal a larger move ahead. That is a meaningful distinction. A desk that viewed the bounce as noise would more likely wait for consolidation. Bitmine increased exposure into strength instead.
A bigger Ethereum trade
The buy is notable less for its dollar size than for the signal it sends about how treasury operators are treating ETH. An $81 million weekly addition is not going to move the global ether market on its own. But the pace of buying matters, especially after a period when activity had slowed since early July.
Bitmine’s position shows that some buyers are treating Ethereum as a balance-sheet asset rather than a pure trading vehicle. The network remains the dominant environment for developers and settlement volume, even as competitors have made inroads. BlockchainReporter’s Top 10 Blockchains by Developer Activity This Week puts Ethereum at the center of ongoing contract and tooling work, which tends to anchor longer-duration capital.
Institutional flows and the Ethereum bid
The timing also lines up with a broader push of on-chain capital into assets that can produce or settle value without traditional intermediaries. Tokenized treasury products and real-world asset experiments have absorbed institutional attention, as covered in BlockchainReporter’s Weekly Tokenization Roundup. Ether occupies a different role from those instruments, but the demand logic is related: institutions are looking for native crypto exposure that has a network effect behind it.
That does not make the case risk-free. US policy remains a wildcard for any firm holding crypto on balance sheet. The Senate fight over a major crypto bill has shown how quickly the regulatory consensus can fray, as detailed in BlockchainReporter’s coverage of the banking opposition to the legislation. Bitmine has moved before those rules are settled.
For traders, the more important question is not whether Bitmine has spot demand but whether other corporate buyers will follow. Ether’s liquidity is deep enough that a single treasury purchase rarely dictates direction, but repeated institutional bids can tighten available float around psychologically important levels. That was the pattern in previous cycles when treasury announcements attracted more attention than the actual flow.
What remains unresolved
Lee’s comment about a larger move is an expectation, not a guarantee. A 30% weekly rally can compress the risk-reward for new buyers even if the longer-term view is intact. Bitmine may be indicating conviction, or it may be adding exposure as part of a predetermined dollar-cost program that happened to align with the price move. The source material does not specify whether the firm will continue adding at this pace.
What the market will watch next is whether the buying continues after the weekly candle closes. Treasury operators tend to reveal their time horizon through follow-through. If Bitmine returns with another large weekly allocation, the trade becomes more than a one-off signal. If the pace drops, the $81 million buy may end up looking like a reaction to short-term momentum rather than a structural shift.
According to the original report, Lee said the weekly rally could signal a larger move ahead. That is a meaningful distinction. A desk that viewed the bounce as noise would more likely wait for consolidation. Bitmine increased exposure into strength instead.
A bigger Ethereum trade
The buy is notable less for its dollar size than for the signal it sends about how treasury operators are treating ETH. An $81 million weekly addition is not going to move the global ether market on its own. But the pace of buying matters, especially after a period when activity had slowed since early July.
Bitmine’s position shows that some buyers are treating Ethereum as a balance-sheet asset rather than a pure trading vehicle. The network remains the dominant environment for developers and settlement volume, even as competitors have made inroads. BlockchainReporter’s Top 10 Blockchains by Developer Activity This Week puts Ethereum at the center of ongoing contract and tooling work, which tends to anchor longer-duration capital.
Institutional flows and the Ethereum bid
The timing also lines up with a broader push of on-chain capital into assets that can produce or settle value without traditional intermediaries. Tokenized treasury products and real-world asset experiments have absorbed institutional attention, as covered in BlockchainReporter’s Weekly Tokenization Roundup. Ether occupies a different role from those instruments, but the demand logic is related: institutions are looking for native crypto exposure that has a network effect behind it.
That does not make the case risk-free. US policy remains a wildcard for any firm holding crypto on balance sheet. The Senate fight over a major crypto bill has shown how quickly the regulatory consensus can fray, as detailed in BlockchainReporter’s coverage of the banking opposition to the legislation. Bitmine has moved before those rules are settled.
For traders, the more important question is not whether Bitmine has spot demand but whether other corporate buyers will follow. Ether’s liquidity is deep enough that a single treasury purchase rarely dictates direction, but repeated institutional bids can tighten available float around psychologically important levels. That was the pattern in previous cycles when treasury announcements attracted more attention than the actual flow.
What remains unresolved
Lee’s comment about a larger move is an expectation, not a guarantee. A 30% weekly rally can compress the risk-reward for new buyers even if the longer-term view is intact. Bitmine may be indicating conviction, or it may be adding exposure as part of a predetermined dollar-cost program that happened to align with the price move. The source material does not specify whether the firm will continue adding at this pace.
What the market will watch next is whether the buying continues after the weekly candle closes. Treasury operators tend to reveal their time horizon through follow-through. If Bitmine returns with another large weekly allocation, the trade becomes more than a one-off signal. If the pace drops, the $81 million buy may end up looking like a reaction to short-term momentum rather than a structural shift.
54

Article
BlockchainFX $15M Milestone: Why It’s Ranked the Best Crypto Presale August The BlockchainFX presale has officially ended after successfully reaching its $15 million milestone, making it the best crypto presale August. Over the course of the campaign, participation surged as global users engaged with the platform’s vision for decentralized trading infrastructure. Reaching this target validates the community demand for advanced financial tools and sets a solid foundation for upcoming infrastructure deployment.
With fundraising successfully concluded, the project has transitioned from the presale stage into the pre-launch phase. This shift confirms that the official launch is moving forward as scheduled, with core development teams finalizing backend integrations, security audits, and liquidity preparations ahead of the public trading debut.
When Is the Official BlockchainFX Launch Date and Price Reveal?
Timing is everything in digital asset deployment, and market participants are eagerly awaiting the formal rollout schedule. The official BFX token launch is locked in for Monday, August 31, at 3:00 PM UTC, establishing the definitive timeline for public exchange listings and platform activation.
With the pre-launch price currently set at $0.04 moving toward a confirmed launch price of $0.05, establishing a concrete launch date allows both retail users and strategic partners to align their preparations. As the countdown to August 31 continues, anticipation is building across digital asset communities, turning this event into a defining moment for the ecosystem this quarter.
Why Is This the Final Buying Opportunity for BFX Crypto Presale 2026?
Timing windows close rapidly in fast-moving sectors, and the current BFX crypto presale 2026 pre-launch phase represents the final opportunity to buy BFX before the token officially launches on public markets. Once this pre-launch window closes, the asset will no longer be available under the current allocation structure, shifting entirely into open-market dynamics.
Furthermore, existing buyers have a final opportunity to upgrade their membership tiers during this window. With the pre-launch price firmly positioned at $0.04 ahead of the confirmed $0.05 public debut, participants are reviewing their allocations as final operational preparations take shape.
To maximize participation during this closing window, the project has introduced the LAUNCH80 bonus code, positioning it as the largest and final incentive available before the official launch. This code provides buyers with an 80% additional token allocation. For example, a participant who would normally receive 100,000 BFX will receive an additional 80,000 BFX, bringing the total allocation to 180,000 BFX, subject to campaign terms.
What Comes Next After the BlockchainFX Presale Concludes?
Moving beyond early-stage fundraising requires robust execution, and BlockchainFX is fully prepared for its next operational phase. The successful completion of the fundraising round ensures that development capital is secured for platform scaling, liquidity provisioning, and global marketing outreach.
Thank you to everyone who supported BlockchainFX throughout the presale. The next chapter begins now as the project prepares for the official launch of $BFX on August 31.
Secure Your Allocation Now: This is your absolute final chance to acquire tokens under the pre-launch structure before public trading begins. Visit the official platform today, apply code LAUNCH80 to claim your 80% bonus allocation, and position yourself ahead of the August 31 rollout.
This article is not intended as financial advice. Educational purposes only.
BlockchainFX $15M Milestone: Why It’s Ranked the Best Crypto Presale August
The BlockchainFX presale has officially ended after successfully reaching its $15 million milestone, making it the best crypto presale August. Over the course of the campaign, participation surged as global users engaged with the platform’s vision for decentralized trading infrastructure. Reaching this target validates the community demand for advanced financial tools and sets a solid foundation for upcoming infrastructure deployment.
With fundraising successfully concluded, the project has transitioned from the presale stage into the pre-launch phase. This shift confirms that the official launch is moving forward as scheduled, with core development teams finalizing backend integrations, security audits, and liquidity preparations ahead of the public trading debut.
When Is the Official BlockchainFX Launch Date and Price Reveal?
Timing is everything in digital asset deployment, and market participants are eagerly awaiting the formal rollout schedule. The official BFX token launch is locked in for Monday, August 31, at 3:00 PM UTC, establishing the definitive timeline for public exchange listings and platform activation.
With the pre-launch price currently set at $0.04 moving toward a confirmed launch price of $0.05, establishing a concrete launch date allows both retail users and strategic partners to align their preparations. As the countdown to August 31 continues, anticipation is building across digital asset communities, turning this event into a defining moment for the ecosystem this quarter.
Why Is This the Final Buying Opportunity for BFX Crypto Presale 2026?
Timing windows close rapidly in fast-moving sectors, and the current BFX crypto presale 2026 pre-launch phase represents the final opportunity to buy BFX before the token officially launches on public markets. Once this pre-launch window closes, the asset will no longer be available under the current allocation structure, shifting entirely into open-market dynamics.
Furthermore, existing buyers have a final opportunity to upgrade their membership tiers during this window. With the pre-launch price firmly positioned at $0.04 ahead of the confirmed $0.05 public debut, participants are reviewing their allocations as final operational preparations take shape.
To maximize participation during this closing window, the project has introduced the LAUNCH80 bonus code, positioning it as the largest and final incentive available before the official launch. This code provides buyers with an 80% additional token allocation. For example, a participant who would normally receive 100,000 BFX will receive an additional 80,000 BFX, bringing the total allocation to 180,000 BFX, subject to campaign terms.
What Comes Next After the BlockchainFX Presale Concludes?
Moving beyond early-stage fundraising requires robust execution, and BlockchainFX is fully prepared for its next operational phase. The successful completion of the fundraising round ensures that development capital is secured for platform scaling, liquidity provisioning, and global marketing outreach.
Thank you to everyone who supported BlockchainFX throughout the presale. The next chapter begins now as the project prepares for the official launch of $BFX on August 31.
Secure Your Allocation Now: This is your absolute final chance to acquire tokens under the pre-launch structure before public trading begins. Visit the official platform today, apply code LAUNCH80 to claim your 80% bonus allocation, and position yourself ahead of the August 31 rollout.
This article is not intended as financial advice. Educational purposes only.
With fundraising successfully concluded, the project has transitioned from the presale stage into the pre-launch phase. This shift confirms that the official launch is moving forward as scheduled, with core development teams finalizing backend integrations, security audits, and liquidity preparations ahead of the public trading debut.
When Is the Official BlockchainFX Launch Date and Price Reveal?
Timing is everything in digital asset deployment, and market participants are eagerly awaiting the formal rollout schedule. The official BFX token launch is locked in for Monday, August 31, at 3:00 PM UTC, establishing the definitive timeline for public exchange listings and platform activation.
With the pre-launch price currently set at $0.04 moving toward a confirmed launch price of $0.05, establishing a concrete launch date allows both retail users and strategic partners to align their preparations. As the countdown to August 31 continues, anticipation is building across digital asset communities, turning this event into a defining moment for the ecosystem this quarter.
Why Is This the Final Buying Opportunity for BFX Crypto Presale 2026?
Timing windows close rapidly in fast-moving sectors, and the current BFX crypto presale 2026 pre-launch phase represents the final opportunity to buy BFX before the token officially launches on public markets. Once this pre-launch window closes, the asset will no longer be available under the current allocation structure, shifting entirely into open-market dynamics.
Furthermore, existing buyers have a final opportunity to upgrade their membership tiers during this window. With the pre-launch price firmly positioned at $0.04 ahead of the confirmed $0.05 public debut, participants are reviewing their allocations as final operational preparations take shape.
To maximize participation during this closing window, the project has introduced the LAUNCH80 bonus code, positioning it as the largest and final incentive available before the official launch. This code provides buyers with an 80% additional token allocation. For example, a participant who would normally receive 100,000 BFX will receive an additional 80,000 BFX, bringing the total allocation to 180,000 BFX, subject to campaign terms.
What Comes Next After the BlockchainFX Presale Concludes?
Moving beyond early-stage fundraising requires robust execution, and BlockchainFX is fully prepared for its next operational phase. The successful completion of the fundraising round ensures that development capital is secured for platform scaling, liquidity provisioning, and global marketing outreach.
Thank you to everyone who supported BlockchainFX throughout the presale. The next chapter begins now as the project prepares for the official launch of $BFX on August 31.
Secure Your Allocation Now: This is your absolute final chance to acquire tokens under the pre-launch structure before public trading begins. Visit the official platform today, apply code LAUNCH80 to claim your 80% bonus allocation, and position yourself ahead of the August 31 rollout.
This article is not intended as financial advice. Educational purposes only.
25
Vérifié
CleanCore Exits Dogecoin Treasury With $33.4M Sale to Fund AICorporate treasuries rarely exit a meme asset all at once. CleanCore did exactly that. According to the SEC filing summary, the company sold substantially all of its 463 million DOGE on July 20 for about $33.4 million and redirected the proceeds into its AI infrastructure business.
The stated numbers imply an average sale price of roughly $0.072 per DOGE. More important than the price is the decision to exit in full rather than trim over time. A complete unwind limits downside if meme coin liquidity dries up, but it also removes any upside exposure if DOGE catches another speculative bid.
Where the DOGE went
CleanCore’s filing frames the sale as a capital reallocation, not a crypto unwind for cash preservation. The company is directing funds toward AI infrastructure, an area that has drawn a wave of small-cap pivots this cycle. Public companies with legacy operations or weakening balance sheets have increasingly used AI as a cleaner narrative for equity investors, even when the underlying business still needs funding.
That AI push is visible across adjacent crypto infrastructure markets. Filecoin, for example, has leaned on AI storage demand as a core argument for network revenue. CleanCore’s move sits on the same broad trade: compute and data infrastructure are absorbing capital that previously might have held crypto assets on a balance sheet.
Project-level activity tells a similar story. Teams building integrations for AI-driven Web3 applications are competing for the same infrastructure budgets and developer attention that corporate issuers are now chasing through equity raises.
The equity cost of the pivot
The AI strategy is not free for existing shareholders. CleanCore also completed a $100 million stock offering, increasing shares outstanding by about 122% to 502.1 million. That is a substantial dilution event for a small-cap issuer, and the filing notes additional warrants could create further dilution.
Investors may be financing the AI pivot twice: first by watching the DOGE treasury get liquidated, then by absorbing new share supply. The warrant overhang makes the fully diluted picture less clear. For equity holders, the question is whether the AI infrastructure segment can produce enough operating value to offset the expanded share count.
The dual capital events create an unusual setup: a clean exit from a liquid crypto asset combined with an expansion of equity supply. Retail shareholders are effectively being asked to fund a business transformation that the company has already begun financing with the DOGE proceeds.
Across the broader blockchain sector, developer attention has been shifting quickly among networks, including Ethereum, Solana, and BNB Chain, according to Top 10 Blockchains by Developer Activity This Week. That kind of shifting capital is also visible in small-cap companies deciding which balance-sheet assets to keep and which to sell.
The corporate crypto treasury question
This is not the first time a public company has shifted away from a crypto treasury position. Corporate holders of bitcoin have generally treated the asset as a long-term reserve, but meme coins carry a different risk profile.
CleanCore Exits Dogecoin Treasury With $33.4M Sale to Fund AI
Corporate treasuries rarely exit a meme asset all at once. CleanCore did exactly that. According to the SEC filing summary, the company sold substantially all of its 463 million DOGE on July 20 for about $33.4 million and redirected the proceeds into its AI infrastructure business.
The stated numbers imply an average sale price of roughly $0.072 per DOGE. More important than the price is the decision to exit in full rather than trim over time. A complete unwind limits downside if meme coin liquidity dries up, but it also removes any upside exposure if DOGE catches another speculative bid.
Where the DOGE went
CleanCore’s filing frames the sale as a capital reallocation, not a crypto unwind for cash preservation. The company is directing funds toward AI infrastructure, an area that has drawn a wave of small-cap pivots this cycle. Public companies with legacy operations or weakening balance sheets have increasingly used AI as a cleaner narrative for equity investors, even when the underlying business still needs funding.
That AI push is visible across adjacent crypto infrastructure markets. Filecoin, for example, has leaned on AI storage demand as a core argument for network revenue. CleanCore’s move sits on the same broad trade: compute and data infrastructure are absorbing capital that previously might have held crypto assets on a balance sheet.
Project-level activity tells a similar story. Teams building integrations for AI-driven Web3 applications are competing for the same infrastructure budgets and developer attention that corporate issuers are now chasing through equity raises.
The equity cost of the pivot
The AI strategy is not free for existing shareholders. CleanCore also completed a $100 million stock offering, increasing shares outstanding by about 122% to 502.1 million. That is a substantial dilution event for a small-cap issuer, and the filing notes additional warrants could create further dilution.
Investors may be financing the AI pivot twice: first by watching the DOGE treasury get liquidated, then by absorbing new share supply. The warrant overhang makes the fully diluted picture less clear. For equity holders, the question is whether the AI infrastructure segment can produce enough operating value to offset the expanded share count.
The dual capital events create an unusual setup: a clean exit from a liquid crypto asset combined with an expansion of equity supply. Retail shareholders are effectively being asked to fund a business transformation that the company has already begun financing with the DOGE proceeds.
Across the broader blockchain sector, developer attention has been shifting quickly among networks, including Ethereum, Solana, and BNB Chain, according to Top 10 Blockchains by Developer Activity This Week. That kind of shifting capital is also visible in small-cap companies deciding which balance-sheet assets to keep and which to sell.
The corporate crypto treasury question
This is not the first time a public company has shifted away from a crypto treasury position. Corporate holders of bitcoin have generally treated the asset as a long-term reserve, but meme coins carry a different risk profile.
The stated numbers imply an average sale price of roughly $0.072 per DOGE. More important than the price is the decision to exit in full rather than trim over time. A complete unwind limits downside if meme coin liquidity dries up, but it also removes any upside exposure if DOGE catches another speculative bid.
Where the DOGE went
CleanCore’s filing frames the sale as a capital reallocation, not a crypto unwind for cash preservation. The company is directing funds toward AI infrastructure, an area that has drawn a wave of small-cap pivots this cycle. Public companies with legacy operations or weakening balance sheets have increasingly used AI as a cleaner narrative for equity investors, even when the underlying business still needs funding.
That AI push is visible across adjacent crypto infrastructure markets. Filecoin, for example, has leaned on AI storage demand as a core argument for network revenue. CleanCore’s move sits on the same broad trade: compute and data infrastructure are absorbing capital that previously might have held crypto assets on a balance sheet.
Project-level activity tells a similar story. Teams building integrations for AI-driven Web3 applications are competing for the same infrastructure budgets and developer attention that corporate issuers are now chasing through equity raises.
The equity cost of the pivot
The AI strategy is not free for existing shareholders. CleanCore also completed a $100 million stock offering, increasing shares outstanding by about 122% to 502.1 million. That is a substantial dilution event for a small-cap issuer, and the filing notes additional warrants could create further dilution.
Investors may be financing the AI pivot twice: first by watching the DOGE treasury get liquidated, then by absorbing new share supply. The warrant overhang makes the fully diluted picture less clear. For equity holders, the question is whether the AI infrastructure segment can produce enough operating value to offset the expanded share count.
The dual capital events create an unusual setup: a clean exit from a liquid crypto asset combined with an expansion of equity supply. Retail shareholders are effectively being asked to fund a business transformation that the company has already begun financing with the DOGE proceeds.
Across the broader blockchain sector, developer attention has been shifting quickly among networks, including Ethereum, Solana, and BNB Chain, according to Top 10 Blockchains by Developer Activity This Week. That kind of shifting capital is also visible in small-cap companies deciding which balance-sheet assets to keep and which to sell.
The corporate crypto treasury question
This is not the first time a public company has shifted away from a crypto treasury position. Corporate holders of bitcoin have generally treated the asset as a long-term reserve, but meme coins carry a different risk profile.
1
227
Connectez-vous pour découvrir plus de contenu
Rejoignez la communauté mondiale des adeptes de cryptomonnaies sur Binance Square
⚡️ Suviez les dernières informations importantes sur les cryptomonnaies.
💬 Jugé digne de confiance par la plus grande plateforme d’échange de cryptomonnaies au monde.
👍 Découvrez les connaissances que partagent les créateurs vérifiés.
Adresse e-mail/Nº de téléphone