

R3N 1
597 Publications

R3N 1
Signaler
Bloquer l’utilisateur
Web3 & crypto Analyst || Breaking down market moves || token updates daily ➪NFA!!!
0 Suivis
3 Abonnés
4 J’aime
Publications
·
--
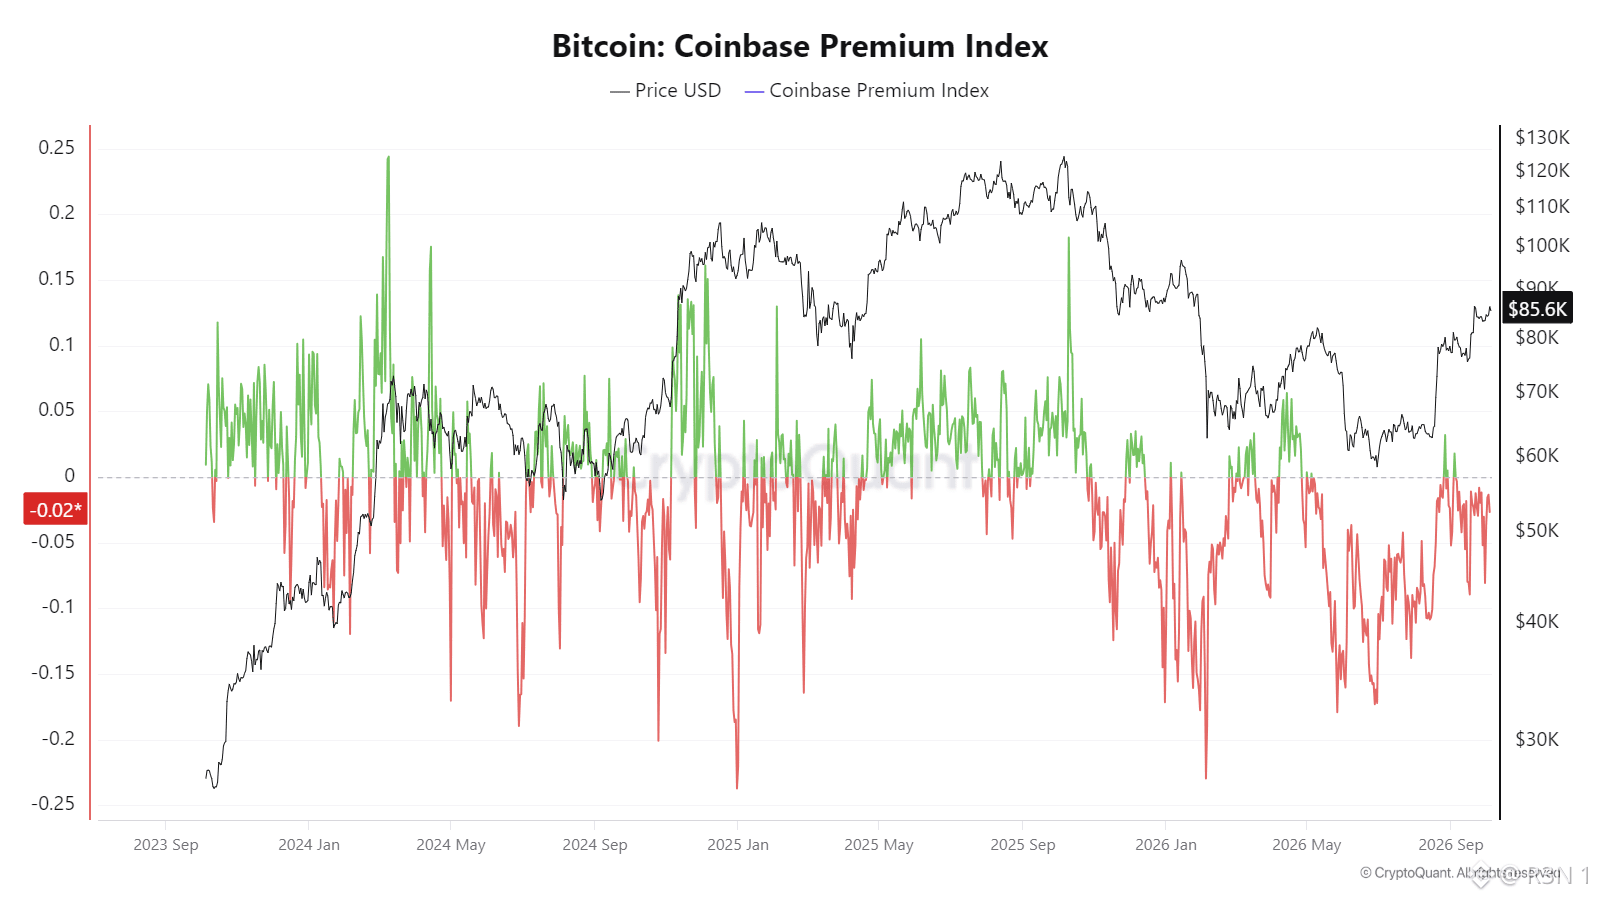
$BTC 's back near $85.6K, close to this year's highs, but the Coinbase Premium sitting at -0.02 right now is the detail that doesn't match the price action, and that mismatch is worth more attention than the price level itself. The premium measures whether BTC trades at a premium or discount on Coinbase specifically versus other major exchanges, a proxy for US-based spot demand relative to the rest of the global market. Positive readings mean US buyers are paying up, negative means they're not leading the move. Right now it's negative, meaning this push toward $85.6K isn't being driven by elevated US spot demand the way some of the prior rallies on this chart were. Look at how this metric behaved around the two major price peaks visible here. Heading into the run toward $120K+ in late 2025, the premium spent extended stretches solidly green, often running above 0.05-0.1, real sustained positive readings alongside the climb. The current approach back toward similar price levels is happening with the premium sitting negative, a structurally different setup than the rally that produced the prior high. What stands out to me is this isn't a new pattern specific to this bounce either. The premium's spent most of 2026 oscillating between red and green without sustained positive stretches, even during the recovery from this year's lows. That's a longer-running theme than just this week's print. Worth being careful about over-reading one data point though, this index can run negative for reasons beyond weak demand, including structural factors tied to trading costs or temporary liquidity differences between venues, so a single negative reading isn't proof of anything on its own. Whether this move eventually gets confirmed by sustained positive Coinbase Premium the way the 2025 run was, or whether this rally keeps climbing without that specific signal ever showing up, which would mark a genuinely different character of move than the one that set the prior high.
$BTC 's back near $85.6K, close to this year's highs, but the Coinbase Premium sitting at -0.02 right now is the detail that doesn't match the price action, and that mismatch is worth more attention than the price level itself. The premium measures whether BTC trades at a premium or discount on Coinbase specifically versus other major exchanges, a proxy for US-based spot demand relative to the rest of the global market. Positive readings mean US buyers are paying up, negative means they're not leading the move. Right now it's negative, meaning this push toward $85.6K isn't being driven by elevated US spot demand the way some of the prior rallies on this chart were. Look at how this metric behaved around the two major price peaks visible here. Heading into the run toward $120K+ in late 2025, the premium spent extended stretches solidly green, often running above 0.05-0.1, real sustained positive readings alongside the climb. The current approach back toward similar price levels is happening with the premium sitting negative, a structurally different setup than the rally that produced the prior high. What stands out to me is this isn't a new pattern specific to this bounce either. The premium's spent most of 2026 oscillating between red and green without sustained positive stretches, even during the recovery from this year's lows. That's a longer-running theme than just this week's print. Worth being careful about over-reading one data point though, this index can run negative for reasons beyond weak demand, including structural factors tied to trading costs or temporary liquidity differences between venues, so a single negative reading isn't proof of anything on its own. Whether this move eventually gets confirmed by sustained positive Coinbase Premium the way the 2025 run was, or whether this rally keeps climbing without that specific signal ever showing up, which would mark a genuinely different character of move than the one that set the prior high.
4
·
--
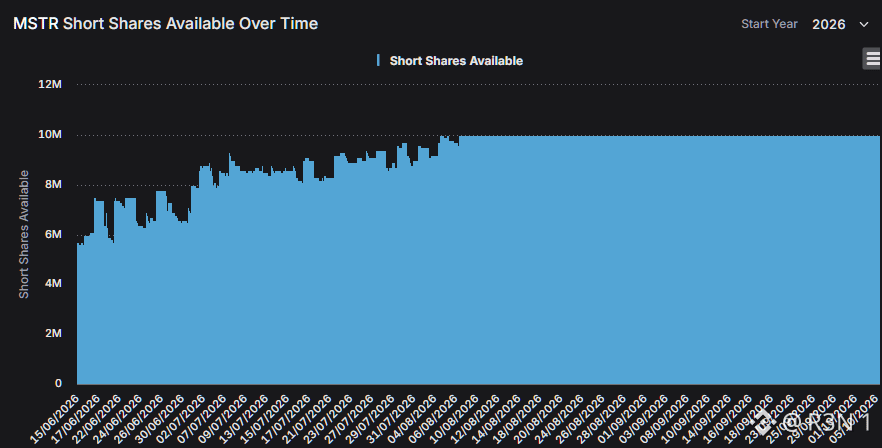
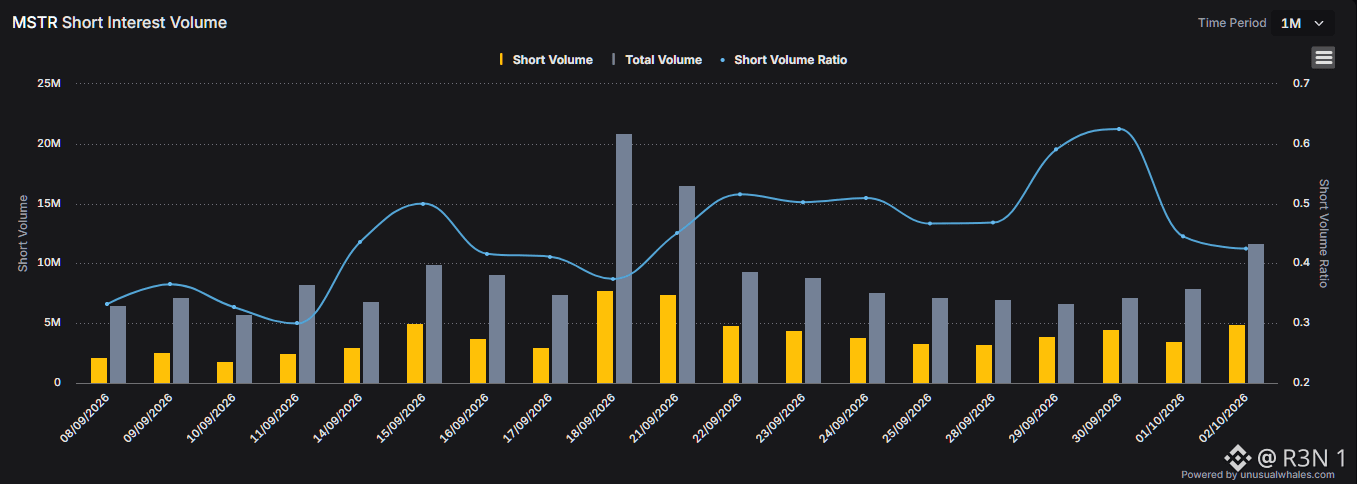
MSTR's short shares available has been pinned at its ceiling, essentially 10 million, since early August, while the actual short volume ratio has swung from 0.3 up to 0.6 and back within the past month alone. That combination is worth separating out, because it tells two different stories about shorting pressure here. The shares available chart climbed steadily from around 6 million in mid June to nearly 10 million by early August, then flatlined at that level through early October. A ceiling like that usually means the lending pool for borrowing shares to short has hit its practical capacity, brokers aren't making meaningfully more supply available, the number's just sitting at its cap rather than continuing to grow. The short volume ratio tells a more dynamic story within that fixed supply. It oscillated in the 0.3 to 0.5 range through most of September, spiked to roughly 0.6, the highest point in this window, around September 29 to 30, then eased back toward 0.4 by October 2. Worth noting the single largest volume day, September 18, total volume spiking to roughly 21 million shares, actually came with a relatively modest short ratio near 0.38 to 0.4, meaning that volume surge wasn't predominantly short driven, more like broad two sided trading. My honest read: a capped lending pool combined with a short ratio that swings this much week to week suggests active positioning changes within a fixed amount of available short capacity, not a steadily building short thesis. The late September ratio spike toward 0.6 is the one point worth flagging specifically, that's genuinely elevated short activity relative to the rest of this chart, even if it's already eased back since. What I'm watching: whether short shares available actually breaks above that roughly 10 million ceiling, which would signal brokers extending more lending capacity, or whether it stays capped while the ratio keeps doing the moving instead. #BTC Price Analysis# #Altcoin Season# $BTC $XAUt
MSTR's short shares available has been pinned at its ceiling, essentially 10 million, since early August, while the actual short volume ratio has swung from 0.3 up to 0.6 and back within the past month alone. That combination is worth separating out, because it tells two different stories about shorting pressure here. The shares available chart climbed steadily from around 6 million in mid June to nearly 10 million by early August, then flatlined at that level through early October. A ceiling like that usually means the lending pool for borrowing shares to short has hit its practical capacity, brokers aren't making meaningfully more supply available, the number's just sitting at its cap rather than continuing to grow. The short volume ratio tells a more dynamic story within that fixed supply. It oscillated in the 0.3 to 0.5 range through most of September, spiked to roughly 0.6, the highest point in this window, around September 29 to 30, then eased back toward 0.4 by October 2. Worth noting the single largest volume day, September 18, total volume spiking to roughly 21 million shares, actually came with a relatively modest short ratio near 0.38 to 0.4, meaning that volume surge wasn't predominantly short driven, more like broad two sided trading. My honest read: a capped lending pool combined with a short ratio that swings this much week to week suggests active positioning changes within a fixed amount of available short capacity, not a steadily building short thesis. The late September ratio spike toward 0.6 is the one point worth flagging specifically, that's genuinely elevated short activity relative to the rest of this chart, even if it's already eased back since. What I'm watching: whether short shares available actually breaks above that roughly 10 million ceiling, which would signal brokers extending more lending capacity, or whether it stays capped while the ratio keeps doing the moving instead. #BTC Price Analysis# #Altcoin Season# $BTC $XAUt
4
·
--
Aster markets this as a "198% buyback and burn." Independent trackers describe the same mechanism differently, 99% of fees genuinely going to stakers, plus a separate promise to burn an equal amount from reserves. That distinction matters more than the headline percentage. The buyback half checks out cleanly. Since September 21, 99% of daily platform fees have funded 3.11 million ASTER in purchases, distributed to veASTER stakers as loyalty rewards, executed via an on chain TWAP that settles automatically. That mechanism is verifiable and has run consistently since the June 17 upgrade. The burn half is where I'd apply real caution. Tokenomist, an independent analytics platform, flagged that Aster's burn leg has largely stalled, citing roughly 100 million ASTER burned against a stated target reduction closer to 5 billion, and cautioned that cumulative buyback figures are likely inflated by early treasury activity. The official model says every buyback triggers a matched burn from team allocation, bi-weekly, continuing until total supply hits 3 billion, but independent verification hasn't kept pace with the marketing framing. Context worth having, total supply sits at roughly 7.92 billion post burn, with 77.86 million burned per the most recent independently cited figure, against total buybacks north of 194 million. The gap between tokens bought back and tokens actually confirmed burned is worth tracking, not the buyback number alone. My honest read: the fee funded buyback mechanism is real and running as described, that part isn't in dispute. The burn side, the part that would actually shrink circulating supply rather than just redistributing it to stakers, deserves more scrutiny than this specific announcement framing gives it. What I'm watching: whether an independent, verifiable burn transaction actually matches this latest 3.11 million figure, rather than taking the "burned from team allocation" claim at face value. #BTC Price Analysis# $ASTER
Aster markets this as a "198% buyback and burn." Independent trackers describe the same mechanism differently, 99% of fees genuinely going to stakers, plus a separate promise to burn an equal amount from reserves. That distinction matters more than the headline percentage. The buyback half checks out cleanly. Since September 21, 99% of daily platform fees have funded 3.11 million ASTER in purchases, distributed to veASTER stakers as loyalty rewards, executed via an on chain TWAP that settles automatically. That mechanism is verifiable and has run consistently since the June 17 upgrade. The burn half is where I'd apply real caution. Tokenomist, an independent analytics platform, flagged that Aster's burn leg has largely stalled, citing roughly 100 million ASTER burned against a stated target reduction closer to 5 billion, and cautioned that cumulative buyback figures are likely inflated by early treasury activity. The official model says every buyback triggers a matched burn from team allocation, bi-weekly, continuing until total supply hits 3 billion, but independent verification hasn't kept pace with the marketing framing. Context worth having, total supply sits at roughly 7.92 billion post burn, with 77.86 million burned per the most recent independently cited figure, against total buybacks north of 194 million. The gap between tokens bought back and tokens actually confirmed burned is worth tracking, not the buyback number alone. My honest read: the fee funded buyback mechanism is real and running as described, that part isn't in dispute. The burn side, the part that would actually shrink circulating supply rather than just redistributing it to stakers, deserves more scrutiny than this specific announcement framing gives it. What I'm watching: whether an independent, verifiable burn transaction actually matches this latest 3.11 million figure, rather than taking the "burned from team allocation" claim at face value. #BTC Price Analysis# $ASTER

·
--
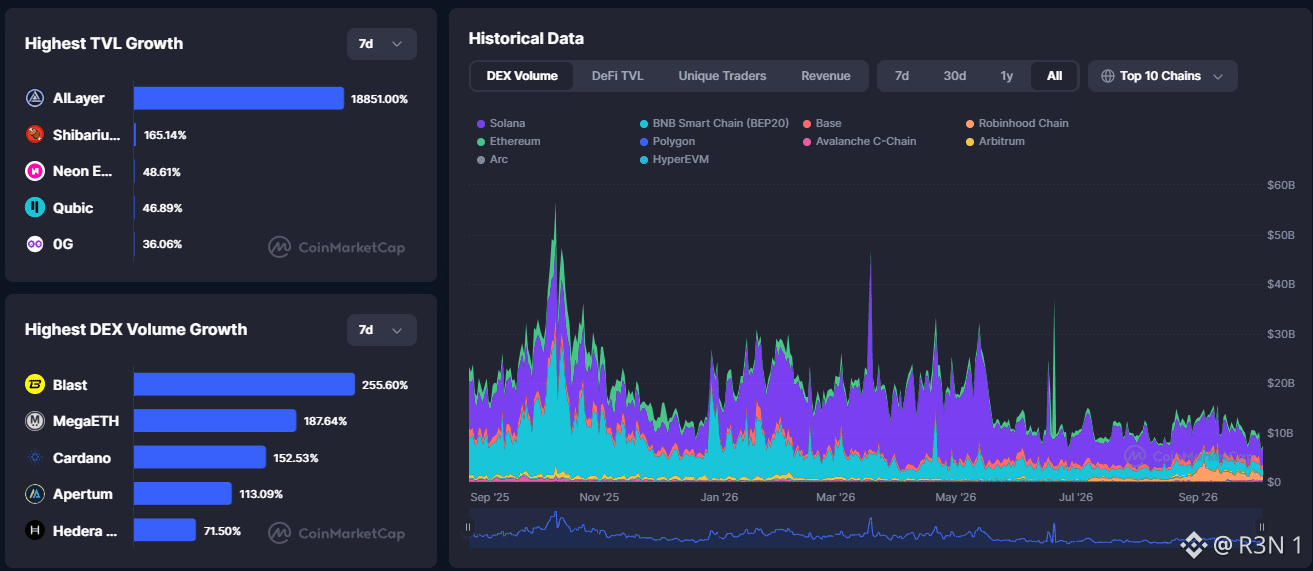
AllLayer's TVL grew 18,851% in seven days. That number is the first thing worth questioning, not celebrating, since growth that extreme almost always means a tiny starting base, not a genuine inflection point worth treating the same as Shibarium's comparatively modest 165%. The DEX volume growth leaders tell a more balanced story. Blast leads at 255.60%, followed by MegaETH at 187.64%, Cardano at 152.53%, Apertum at 113.09%, and Hedera around 71.50%. These are still large percentage moves, but within a range where the underlying activity is more plausibly real rather than an artifact of starting from near zero. The historical DEX volume chart is the more informative piece here though, a full year across the ten largest chains by volume. Solana's purple band sits as the dominant layer nearly throughout, consistently the largest single contributor to stacked volume from September 2025 through now. The chart shows several sharp individual spikes, the largest cresting near $55 to $60B around October to November 2025, a second large spike near March 2026, and a narrower green spike, likely an Ethereum specific event, around July 2026. Outside those spikes, baseline combined volume across all ten chains has generally compressed through 2026 relative to the late 2025 peak. My honest read: the TVL growth leaderboard is mostly noise at the top end, AllLayer's number needs the actual dollar figures behind it before it means anything, while the DEX volume growth list is more credible as a real activity signal. The historical chart's real value is showing Solana's sustained dominance in stacked volume share rather than any single week's percentage mover. #BTC Price Analysis# #Altcoin Season# $BTC $ZEC
AllLayer's TVL grew 18,851% in seven days. That number is the first thing worth questioning, not celebrating, since growth that extreme almost always means a tiny starting base, not a genuine inflection point worth treating the same as Shibarium's comparatively modest 165%. The DEX volume growth leaders tell a more balanced story. Blast leads at 255.60%, followed by MegaETH at 187.64%, Cardano at 152.53%, Apertum at 113.09%, and Hedera around 71.50%. These are still large percentage moves, but within a range where the underlying activity is more plausibly real rather than an artifact of starting from near zero. The historical DEX volume chart is the more informative piece here though, a full year across the ten largest chains by volume. Solana's purple band sits as the dominant layer nearly throughout, consistently the largest single contributor to stacked volume from September 2025 through now. The chart shows several sharp individual spikes, the largest cresting near $55 to $60B around October to November 2025, a second large spike near March 2026, and a narrower green spike, likely an Ethereum specific event, around July 2026. Outside those spikes, baseline combined volume across all ten chains has generally compressed through 2026 relative to the late 2025 peak. My honest read: the TVL growth leaderboard is mostly noise at the top end, AllLayer's number needs the actual dollar figures behind it before it means anything, while the DEX volume growth list is more credible as a real activity signal. The historical chart's real value is showing Solana's sustained dominance in stacked volume share rather than any single week's percentage mover. #BTC Price Analysis# #Altcoin Season# $BTC $ZEC
32
·
--
14.58 million arrived, but as of the most recent reporting, only $2 of it had actually reached the Assistance Fund, the rest still sitting in transit. That gap between "received" and "deployed" is the actual detail worth tracking here.
The mechanism itself is genuinely new for Hyperliquid. Under AQAv2, when users bridge USDC onto the platform, Circle mints corresponding assets on HyperEVM and the treasury earns yield on that reserve, settled every 30 days. This first payment covered August 26 to September 24, an average rate of roughly 3.14%, implying about $193 million annualized at current scale. About 90% of that net yield routes to the Assistance Fund specifically to buy and burn HYPE.
What stands out to me is what this actually changes structurally. Hyperliquid's buyback engine previously ran almost entirely on trading fees, with roughly 99% of fee revenue already flowing to the Assistance Fund, an estimated $771 million annualized capacity. AQAv2 adds a second, independent stream tied to deposits sitting idle, not trading volume. That decouples part of the buyback mechanism from how active the platform's traders are in any given month, a real diversification of the revenue base.
Combined, estimated total annual buyback capacity now exceeds $900 million. The Assistance Fund has already accumulated roughly 45 million HYPE for about $1.1 billion at lower price levels.
The open question isn't whether this revenue stream is real, multiple independent sources confirm the mechanism and the payment. It's whether the remaining balance actually completes its transfer and converts into real purchases, since until that happens, this is a confirmed payment to the protocol, not yet a confirmed token buy.
$HYPE #Altcoin Season# #Altcoin Season# $USDC
14.58 million arrived, but as of the most recent reporting, only $2 of it had actually reached the Assistance Fund, the rest still sitting in transit. That gap between "received" and "deployed" is the actual detail worth tracking here.
The mechanism itself is genuinely new for Hyperliquid. Under AQAv2, when users bridge USDC onto the platform, Circle mints corresponding assets on HyperEVM and the treasury earns yield on that reserve, settled every 30 days. This first payment covered August 26 to September 24, an average rate of roughly 3.14%, implying about $193 million annualized at current scale. About 90% of that net yield routes to the Assistance Fund specifically to buy and burn HYPE.
What stands out to me is what this actually changes structurally. Hyperliquid's buyback engine previously ran almost entirely on trading fees, with roughly 99% of fee revenue already flowing to the Assistance Fund, an estimated $771 million annualized capacity. AQAv2 adds a second, independent stream tied to deposits sitting idle, not trading volume. That decouples part of the buyback mechanism from how active the platform's traders are in any given month, a real diversification of the revenue base.
Combined, estimated total annual buyback capacity now exceeds $900 million. The Assistance Fund has already accumulated roughly 45 million HYPE for about $1.1 billion at lower price levels.
The open question isn't whether this revenue stream is real, multiple independent sources confirm the mechanism and the payment. It's whether the remaining balance actually completes its transfer and converts into real purchases, since until that happens, this is a confirmed payment to the protocol, not yet a confirmed token buy.
$HYPE #Altcoin Season# #Altcoin Season# $USDC
The mechanism itself is genuinely new for Hyperliquid. Under AQAv2, when users bridge USDC onto the platform, Circle mints corresponding assets on HyperEVM and the treasury earns yield on that reserve, settled every 30 days. This first payment covered August 26 to September 24, an average rate of roughly 3.14%, implying about $193 million annualized at current scale. About 90% of that net yield routes to the Assistance Fund specifically to buy and burn HYPE.
What stands out to me is what this actually changes structurally. Hyperliquid's buyback engine previously ran almost entirely on trading fees, with roughly 99% of fee revenue already flowing to the Assistance Fund, an estimated $771 million annualized capacity. AQAv2 adds a second, independent stream tied to deposits sitting idle, not trading volume. That decouples part of the buyback mechanism from how active the platform's traders are in any given month, a real diversification of the revenue base.
Combined, estimated total annual buyback capacity now exceeds $900 million. The Assistance Fund has already accumulated roughly 45 million HYPE for about $1.1 billion at lower price levels.
The open question isn't whether this revenue stream is real, multiple independent sources confirm the mechanism and the payment. It's whether the remaining balance actually completes its transfer and converts into real purchases, since until that happens, this is a confirmed payment to the protocol, not yet a confirmed token buy.
$HYPE #Altcoin Season# #Altcoin Season# $USDC


30
·
--
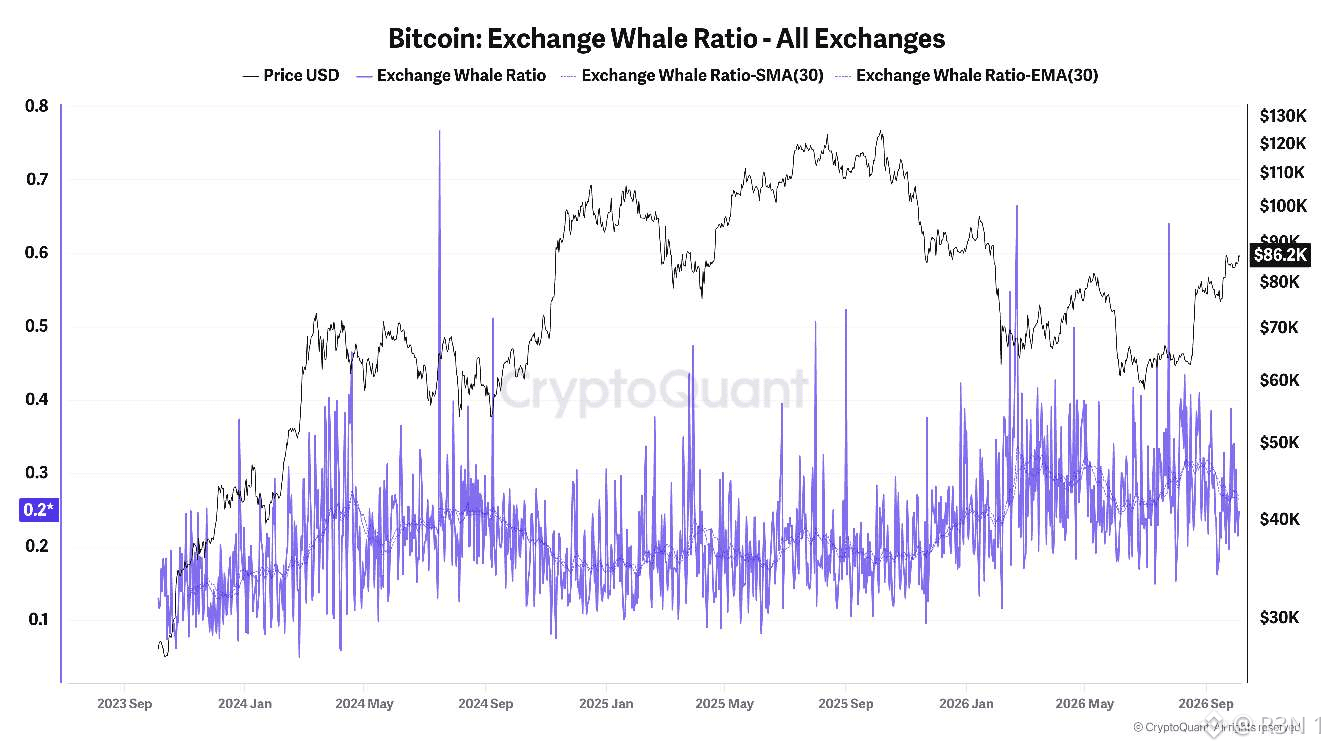
The 30-day smoothed average of the Exchange Whale Ratio is sitting near its highest levels on this entire three-year chart, right as price pushes back toward $86K, and that pairing is worth more attention than the raw daily spikes.
The ratio measures what share of total exchange inflow is coming from the largest wallets, so a rising smoothed average means whale-sized deposits are making up a growing portion of what's landing on exchanges, not just retail-sized flow.
Looking at the SMA/EMA lines rather than the raw spikes, which are naturally noisy and spike on any single large transfer, the smoothed trend has climbed from roughly 0.2 back in 2024-2025 up toward 0.3-0.35 recently, among the highest sustained readings on this whole chart.
What stands out to me is the historical pattern this chart shows around prior price peaks. Looking back at the 2024 run toward $73K and the 2025 run toward $126K, elevated whale ratio readings showed up before and around those tops, large holders moving coins to exchanges tends to precede distribution, since that's typically what deposits are for. The current climb happening while price is also climbing, rather than after a top's already formed, is the detail worth sitting with.
Worth being careful about the causality here though, a deposit to an exchange isn't automatically a sell order, whales also move coins to exchanges for custody changes, OTC settlement, or to post collateral, and this ratio can't distinguish between those on its own. Elevated readings are a necessary condition for distribution-driven selling, not sufficient proof it's happening.
The open question is whether whale-sized flow has this rising ratio resolves the way it has at prior tops on this same chart, into a period of price weakness following elevated whale deposits.
$BTC #BTC Price Analysis# $ETH #Altcoin Season#
The 30-day smoothed average of the Exchange Whale Ratio is sitting near its highest levels on this entire three-year chart, right as price pushes back toward $86K, and that pairing is worth more attention than the raw daily spikes.
The ratio measures what share of total exchange inflow is coming from the largest wallets, so a rising smoothed average means whale-sized deposits are making up a growing portion of what's landing on exchanges, not just retail-sized flow.
Looking at the SMA/EMA lines rather than the raw spikes, which are naturally noisy and spike on any single large transfer, the smoothed trend has climbed from roughly 0.2 back in 2024-2025 up toward 0.3-0.35 recently, among the highest sustained readings on this whole chart.
What stands out to me is the historical pattern this chart shows around prior price peaks. Looking back at the 2024 run toward $73K and the 2025 run toward $126K, elevated whale ratio readings showed up before and around those tops, large holders moving coins to exchanges tends to precede distribution, since that's typically what deposits are for. The current climb happening while price is also climbing, rather than after a top's already formed, is the detail worth sitting with.
Worth being careful about the causality here though, a deposit to an exchange isn't automatically a sell order, whales also move coins to exchanges for custody changes, OTC settlement, or to post collateral, and this ratio can't distinguish between those on its own. Elevated readings are a necessary condition for distribution-driven selling, not sufficient proof it's happening.
The open question is whether whale-sized flow has this rising ratio resolves the way it has at prior tops on this same chart, into a period of price weakness following elevated whale deposits.
$BTC #BTC Price Analysis# $ETH #Altcoin Season#
The ratio measures what share of total exchange inflow is coming from the largest wallets, so a rising smoothed average means whale-sized deposits are making up a growing portion of what's landing on exchanges, not just retail-sized flow.
Looking at the SMA/EMA lines rather than the raw spikes, which are naturally noisy and spike on any single large transfer, the smoothed trend has climbed from roughly 0.2 back in 2024-2025 up toward 0.3-0.35 recently, among the highest sustained readings on this whole chart.
What stands out to me is the historical pattern this chart shows around prior price peaks. Looking back at the 2024 run toward $73K and the 2025 run toward $126K, elevated whale ratio readings showed up before and around those tops, large holders moving coins to exchanges tends to precede distribution, since that's typically what deposits are for. The current climb happening while price is also climbing, rather than after a top's already formed, is the detail worth sitting with.
Worth being careful about the causality here though, a deposit to an exchange isn't automatically a sell order, whales also move coins to exchanges for custody changes, OTC settlement, or to post collateral, and this ratio can't distinguish between those on its own. Elevated readings are a necessary condition for distribution-driven selling, not sufficient proof it's happening.
The open question is whether whale-sized flow has this rising ratio resolves the way it has at prior tops on this same chart, into a period of price weakness following elevated whale deposits.
$BTC #BTC Price Analysis# $ETH #Altcoin Season#
1
579
·
--
BTC pulling in $241 million while ETH bled $138 million in the same week is the more interesting split here than the SOL and XRP numbers getting most of the attention.
Four assets, four different directions in magnitude even within the "inflow" camp. BTC's $241.09 million dwarfs SOL's $2.43 million and XRP's $4.74 million combined, nearly 34 times larger between them. Calling this "BTC, SOL and XRP saw inflows" technically groups them together, but the actual demand signal is almost entirely concentrated in Bitcoin, SOL and XRP's numbers are close to rounding error by comparison.
What stands out to me is the ETH divergence specifically. A $138 million outflow in a week where the other three majors, including its closest peer BTC, all moved positive isn't just ETH underperforming, it's ETH moving in the opposite direction from the rest of the category entirely. That's worth separating from "weak altcoin sentiment broadly," since SOL and XRP didn't share that fate.
The pattern worth watching for confirmation, not assumption, is whether this reflects genuine BTC-specific conviction returning after a rough stretch, or simply capital rotating out of ETH into BTC within the same allocator decisions, two outcomes that would look identical in this flow data but mean very different things for how durable BTC's inflow actually is.
The open question isn't whether this week favored BTC, the gap is clear regardless of exact figures. It's whether SOL and XRP's positive-but-tiny inflows represent early positioning building toward something larger, or just noise sitting near zero while the real capital movement this week was BTC versus ETH specifically.
$SOL #BTC Price Analysis# #Ethereum $XRP
BTC pulling in $241 million while ETH bled $138 million in the same week is the more interesting split here than the SOL and XRP numbers getting most of the attention.
Four assets, four different directions in magnitude even within the "inflow" camp. BTC's $241.09 million dwarfs SOL's $2.43 million and XRP's $4.74 million combined, nearly 34 times larger between them. Calling this "BTC, SOL and XRP saw inflows" technically groups them together, but the actual demand signal is almost entirely concentrated in Bitcoin, SOL and XRP's numbers are close to rounding error by comparison.
What stands out to me is the ETH divergence specifically. A $138 million outflow in a week where the other three majors, including its closest peer BTC, all moved positive isn't just ETH underperforming, it's ETH moving in the opposite direction from the rest of the category entirely. That's worth separating from "weak altcoin sentiment broadly," since SOL and XRP didn't share that fate.
The pattern worth watching for confirmation, not assumption, is whether this reflects genuine BTC-specific conviction returning after a rough stretch, or simply capital rotating out of ETH into BTC within the same allocator decisions, two outcomes that would look identical in this flow data but mean very different things for how durable BTC's inflow actually is.
The open question isn't whether this week favored BTC, the gap is clear regardless of exact figures. It's whether SOL and XRP's positive-but-tiny inflows represent early positioning building toward something larger, or just noise sitting near zero while the real capital movement this week was BTC versus ETH specifically.
$SOL #BTC Price Analysis# #Ethereum $XRP
Four assets, four different directions in magnitude even within the "inflow" camp. BTC's $241.09 million dwarfs SOL's $2.43 million and XRP's $4.74 million combined, nearly 34 times larger between them. Calling this "BTC, SOL and XRP saw inflows" technically groups them together, but the actual demand signal is almost entirely concentrated in Bitcoin, SOL and XRP's numbers are close to rounding error by comparison.
What stands out to me is the ETH divergence specifically. A $138 million outflow in a week where the other three majors, including its closest peer BTC, all moved positive isn't just ETH underperforming, it's ETH moving in the opposite direction from the rest of the category entirely. That's worth separating from "weak altcoin sentiment broadly," since SOL and XRP didn't share that fate.
The pattern worth watching for confirmation, not assumption, is whether this reflects genuine BTC-specific conviction returning after a rough stretch, or simply capital rotating out of ETH into BTC within the same allocator decisions, two outcomes that would look identical in this flow data but mean very different things for how durable BTC's inflow actually is.
The open question isn't whether this week favored BTC, the gap is clear regardless of exact figures. It's whether SOL and XRP's positive-but-tiny inflows represent early positioning building toward something larger, or just noise sitting near zero while the real capital movement this week was BTC versus ETH specifically.
$SOL #BTC Price Analysis# #Ethereum $XRP


49
·
--
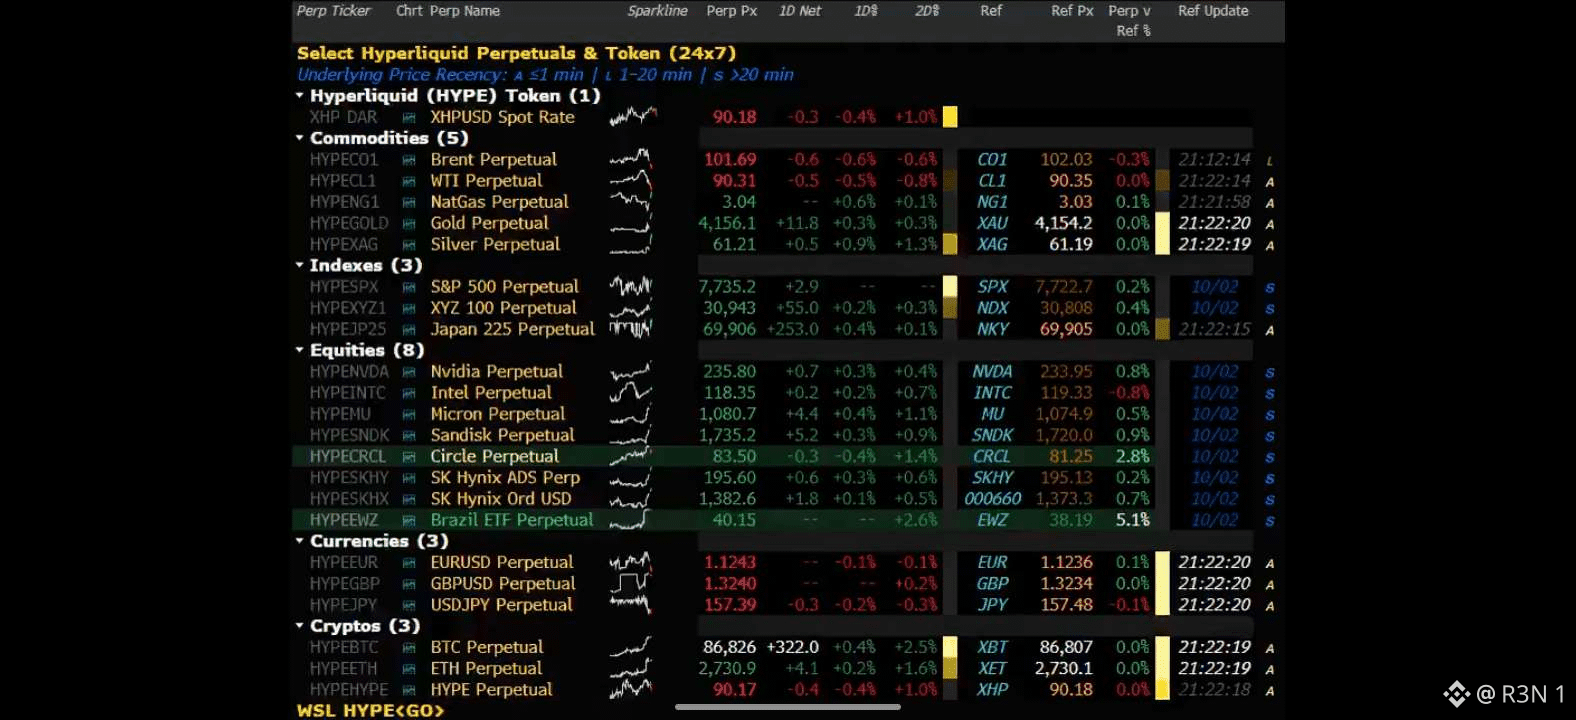
Oil, gold, the S&P 500, and chipmakers, all pricing through a decentralized perpetual exchange, now sitting inside the terminal every trading desk on Wall Street already has open. That's the actual significance here, not just another listing.
Per Coinbureau's reporting today, Hyperliquid's perpetual contracts are now live on the Bloomberg Terminal, confirmed by the screenshot showing commodities, indices, equities, and currency perps all pulling live Hyperliquid pricing alongside traditional reference feeds. This isn't Hyperliquid's first Bloomberg moment either, back in February, Bloomberg cited Hyperliquid's crude oil perpetual as the most relevant live price for the asset during a geopolitical spike, when traditional commodity exchanges were closed. That earlier endorsement makes this integration look like a natural next step rather than a surprise.
Context matters here too. Hyperliquid currently lists 288 tradeable perpetual markets, 178 native crypto perps and 110 HIP-3 builder markets covering equities, commodities, and forex through trade.xyz, and holds roughly 60 to 70% of on chain perpetual derivatives market share depending on the source. This Bloomberg integration lands right after Trump's comment that the CFTC is working to bring Hyperliquid onshore in the US, a regulatory tailwind that's been building alongside this institutional visibility.
My honest read: Bloomberg Terminal access doesn't mean Hyperliquid itself, this genuinely expands who can see its pricing. Traditional finance desks tracking Hyperliquid data as a reference point, even for traditional assets like oil or the S&P, is a real legitimacy signal that goes beyond crypto native adoption.
What I'm watching: whether this Bloomberg visibility translates into actual institutional trading flow through Hyperliquid, or whether it stays limited to data access without deeper capital following.
#BTC Price Analysis# $HYPE #Altcoin Season#
Oil, gold, the S&P 500, and chipmakers, all pricing through a decentralized perpetual exchange, now sitting inside the terminal every trading desk on Wall Street already has open. That's the actual significance here, not just another listing.
Per Coinbureau's reporting today, Hyperliquid's perpetual contracts are now live on the Bloomberg Terminal, confirmed by the screenshot showing commodities, indices, equities, and currency perps all pulling live Hyperliquid pricing alongside traditional reference feeds. This isn't Hyperliquid's first Bloomberg moment either, back in February, Bloomberg cited Hyperliquid's crude oil perpetual as the most relevant live price for the asset during a geopolitical spike, when traditional commodity exchanges were closed. That earlier endorsement makes this integration look like a natural next step rather than a surprise.
Context matters here too. Hyperliquid currently lists 288 tradeable perpetual markets, 178 native crypto perps and 110 HIP-3 builder markets covering equities, commodities, and forex through trade.xyz, and holds roughly 60 to 70% of on chain perpetual derivatives market share depending on the source. This Bloomberg integration lands right after Trump's comment that the CFTC is working to bring Hyperliquid onshore in the US, a regulatory tailwind that's been building alongside this institutional visibility.
My honest read: Bloomberg Terminal access doesn't mean Hyperliquid itself, this genuinely expands who can see its pricing. Traditional finance desks tracking Hyperliquid data as a reference point, even for traditional assets like oil or the S&P, is a real legitimacy signal that goes beyond crypto native adoption.
What I'm watching: whether this Bloomberg visibility translates into actual institutional trading flow through Hyperliquid, or whether it stays limited to data access without deeper capital following.
#BTC Price Analysis# $HYPE #Altcoin Season#
Per Coinbureau's reporting today, Hyperliquid's perpetual contracts are now live on the Bloomberg Terminal, confirmed by the screenshot showing commodities, indices, equities, and currency perps all pulling live Hyperliquid pricing alongside traditional reference feeds. This isn't Hyperliquid's first Bloomberg moment either, back in February, Bloomberg cited Hyperliquid's crude oil perpetual as the most relevant live price for the asset during a geopolitical spike, when traditional commodity exchanges were closed. That earlier endorsement makes this integration look like a natural next step rather than a surprise.
Context matters here too. Hyperliquid currently lists 288 tradeable perpetual markets, 178 native crypto perps and 110 HIP-3 builder markets covering equities, commodities, and forex through trade.xyz, and holds roughly 60 to 70% of on chain perpetual derivatives market share depending on the source. This Bloomberg integration lands right after Trump's comment that the CFTC is working to bring Hyperliquid onshore in the US, a regulatory tailwind that's been building alongside this institutional visibility.
My honest read: Bloomberg Terminal access doesn't mean Hyperliquid itself, this genuinely expands who can see its pricing. Traditional finance desks tracking Hyperliquid data as a reference point, even for traditional assets like oil or the S&P, is a real legitimacy signal that goes beyond crypto native adoption.
What I'm watching: whether this Bloomberg visibility translates into actual institutional trading flow through Hyperliquid, or whether it stays limited to data access without deeper capital following.
#BTC Price Analysis# $HYPE #Altcoin Season#

77
·
--
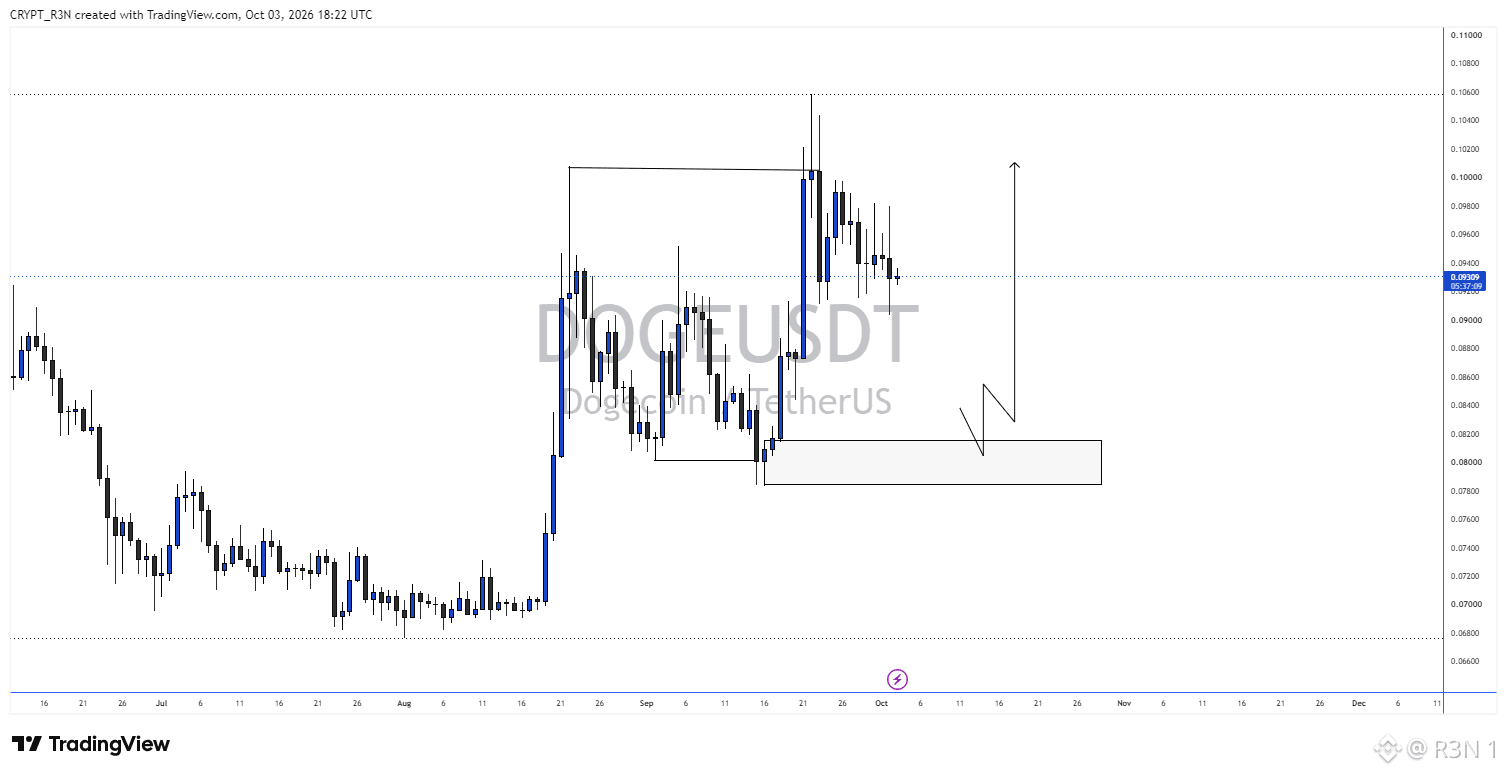
DOGE's pulling back toward $0.093 after tagging above $0.106 last week, and the structure underneath this pullback is what the projected move actually hinges on, not the bounce itself. Zooming out, DOGE bottomed near $0.068 in late July after a steady multi month decline, then broke out hard in late August, rallying to $0.0935 before pulling back to build a base around $0.080 to $0.082, the zone I've marked as support. From there it pushed higher again, spiking above $0.106 in late September before the current pullback brought it to $0.093. The anticipated move I've seen is that $0.080 to $0.082 zone holds as support on any deeper retracement from here, with price eventually turning back up toward the $0.100 to $0.102 area. That's a reasonable read given the zone already acted as support once during the August to September consolidation, prior support holding on a retest is a legitimate pattern, not just a hopeful line on a chart. price hasn't actually tested that $0.080 to $0.082 zone again yet, it's sitting well above it at $0.093 right now. The projection assumes a deeper pullback happens first before the next leg up, and if price instead holds somewhere higher, say in the $0.088 to $0.090 range, or breaks below $0.080 entirely, the setup changes meaningfully from what's drawn here. My honest read: the broader trend since late July is genuinely bullish, higher lows, a confirmed breakout, and a support zone that's already proven itself once. The specific path back down to retest it before continuing higher is the part that's still speculative, not confirmed by price action yet. What I'm watching: whether price actually pulls back into that $0.080 to $0.082 zone and holds, or whether it finds support higher and skips the retest the projection assumes. $DOGE #BTC Price Analysis# #Altcoin Season#
DOGE's pulling back toward $0.093 after tagging above $0.106 last week, and the structure underneath this pullback is what the projected move actually hinges on, not the bounce itself. Zooming out, DOGE bottomed near $0.068 in late July after a steady multi month decline, then broke out hard in late August, rallying to $0.0935 before pulling back to build a base around $0.080 to $0.082, the zone I've marked as support. From there it pushed higher again, spiking above $0.106 in late September before the current pullback brought it to $0.093. The anticipated move I've seen is that $0.080 to $0.082 zone holds as support on any deeper retracement from here, with price eventually turning back up toward the $0.100 to $0.102 area. That's a reasonable read given the zone already acted as support once during the August to September consolidation, prior support holding on a retest is a legitimate pattern, not just a hopeful line on a chart. price hasn't actually tested that $0.080 to $0.082 zone again yet, it's sitting well above it at $0.093 right now. The projection assumes a deeper pullback happens first before the next leg up, and if price instead holds somewhere higher, say in the $0.088 to $0.090 range, or breaks below $0.080 entirely, the setup changes meaningfully from what's drawn here. My honest read: the broader trend since late July is genuinely bullish, higher lows, a confirmed breakout, and a support zone that's already proven itself once. The specific path back down to retest it before continuing higher is the part that's still speculative, not confirmed by price action yet. What I'm watching: whether price actually pulls back into that $0.080 to $0.082 zone and holds, or whether it finds support higher and skips the retest the projection assumes. $DOGE #BTC Price Analysis# #Altcoin Season#
3
·
--
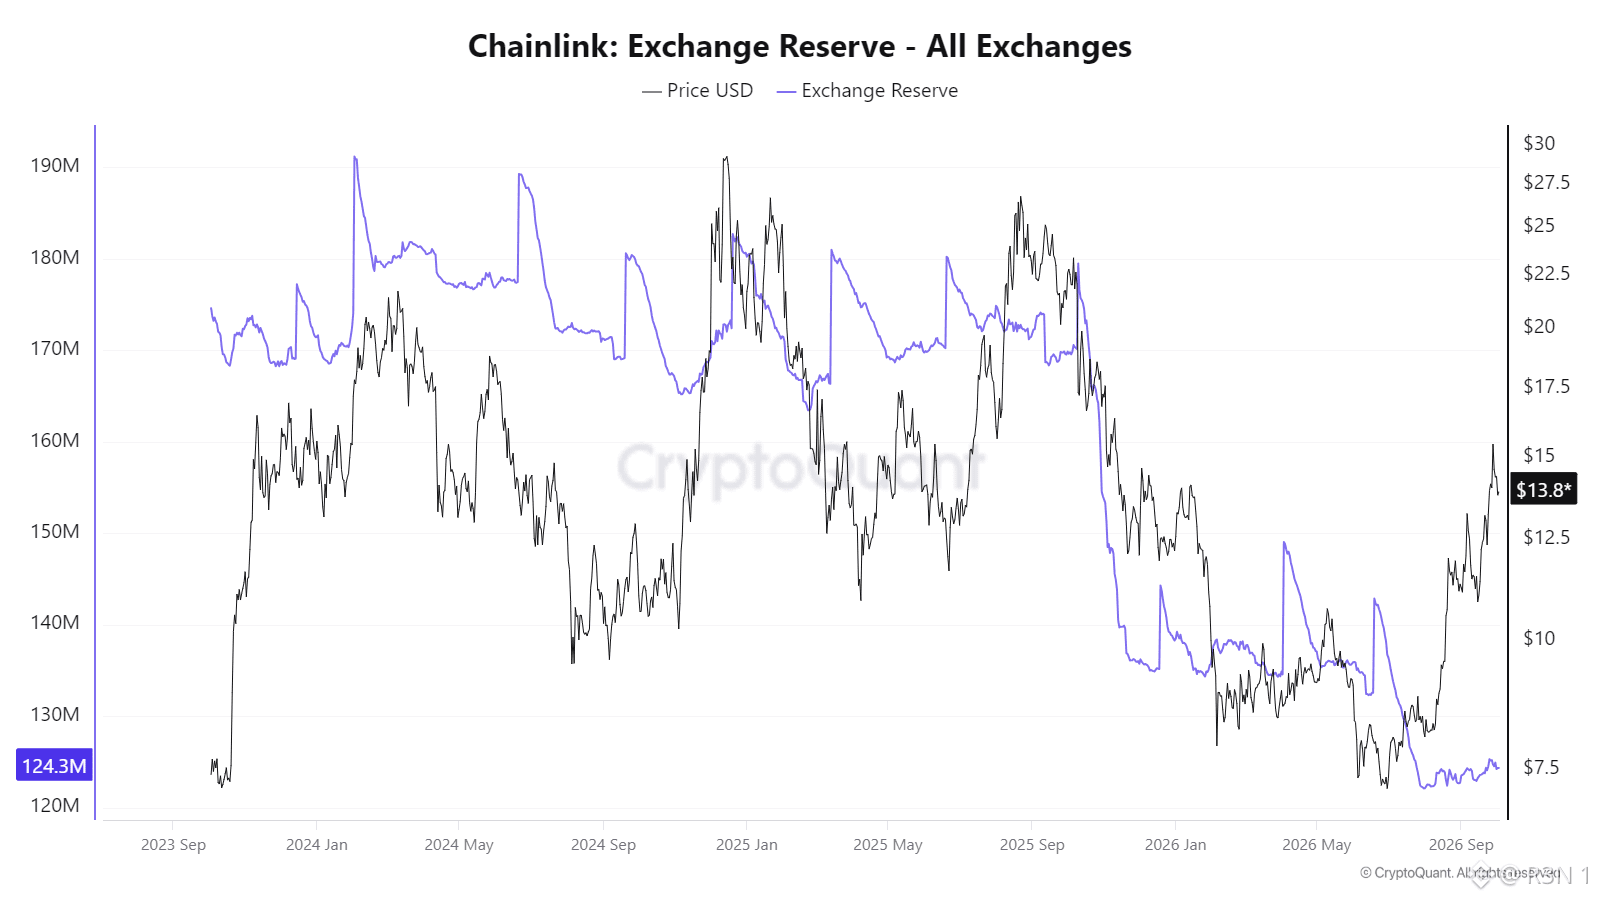
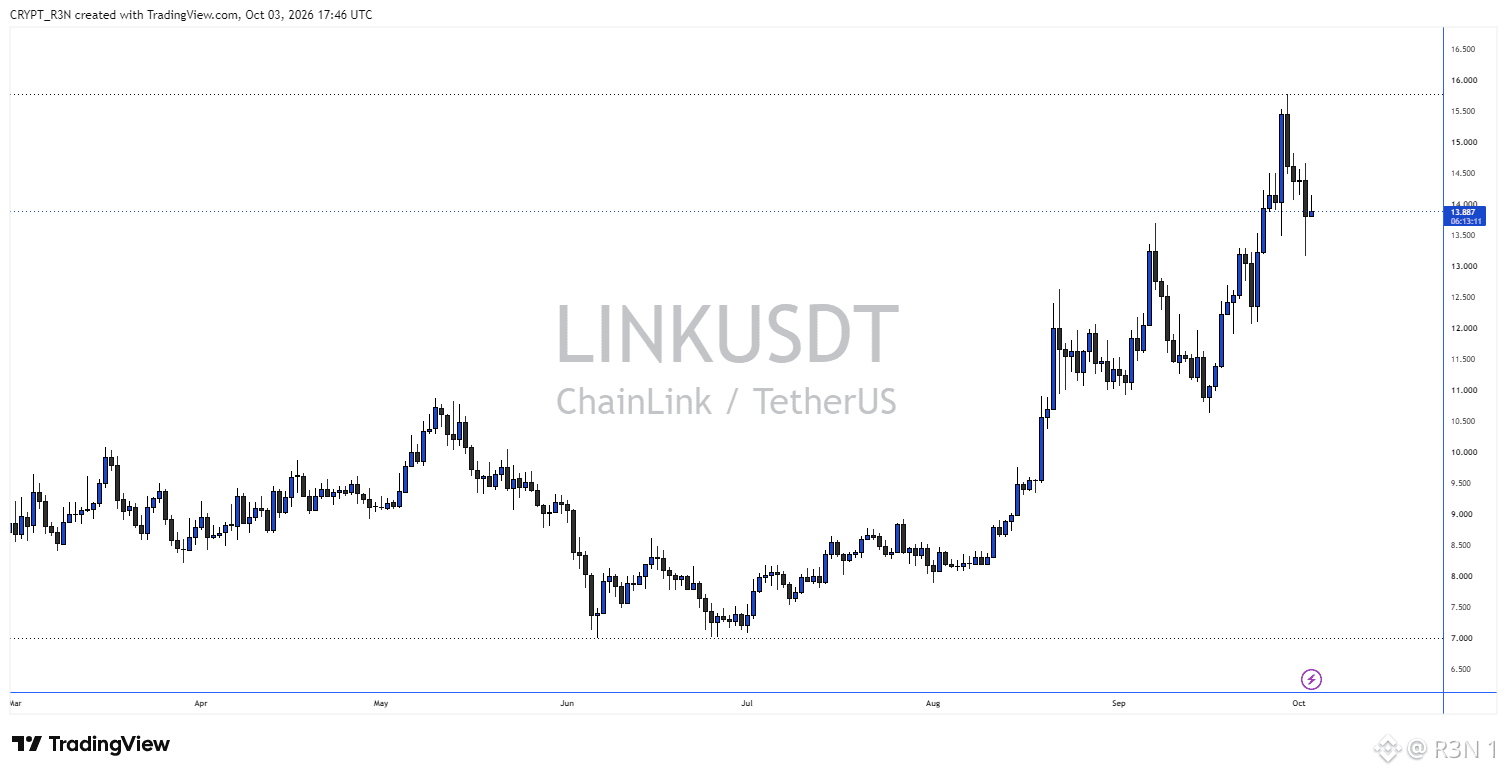
LINK broke out of a seven month range, $7 to $10 roughly, in September, ran up to a peak above $15.50, and has now pulled back to $13.887. What's actually interesting to me isn't the breakout itself, it's what exchange reserves did while it happened, which is basically nothing. Looking at the full reserve chart going back to late 2023, there's a repeating pattern, reserves build gradually, then spike sharply in a single move. That's happened at least six or seven times across this chart, and several of those spikes have landed right around local price tops or preceded real weakness. My read on that pattern historically is sudden reserve increases often mean coins moving toward exchanges ahead of selling. This rally doesn't show that. Reserves have sat flat near 124 to 130M through the entire September to October move, no spike accompanying the breakout the way one showed up before several past rallies. Current reserves at 124.3M are actually near the lowest point on this whole multi-year chart, well below the 190M peak from early 2024. Personally, I think the broader structural decline matters here too, reserves falling from 190M down to current levels through a mix of slow bleeds and those periodic spikes is a real multi-year downtrend in available exchange supply, across multiple price cycles in both directions. My honest read: a rally happening without that characteristic reserve spike is a genuinely different setup than several prior moves on this chart, less fresh supply showing up at exchanges to meet demand this time. I wouldn't call that proof the rally keeps going, but the absence of that specific historical warning sign is worth noting, not brushing off. What I'm watching: whether a reserve spike eventually shows up as this move continues, or if LINK pushes back toward its recent highs without one, since that's historically been the pattern's trigger point. #BTC Price Analysis# #Altcoin Season# $LINK
LINK broke out of a seven month range, $7 to $10 roughly, in September, ran up to a peak above $15.50, and has now pulled back to $13.887. What's actually interesting to me isn't the breakout itself, it's what exchange reserves did while it happened, which is basically nothing. Looking at the full reserve chart going back to late 2023, there's a repeating pattern, reserves build gradually, then spike sharply in a single move. That's happened at least six or seven times across this chart, and several of those spikes have landed right around local price tops or preceded real weakness. My read on that pattern historically is sudden reserve increases often mean coins moving toward exchanges ahead of selling. This rally doesn't show that. Reserves have sat flat near 124 to 130M through the entire September to October move, no spike accompanying the breakout the way one showed up before several past rallies. Current reserves at 124.3M are actually near the lowest point on this whole multi-year chart, well below the 190M peak from early 2024. Personally, I think the broader structural decline matters here too, reserves falling from 190M down to current levels through a mix of slow bleeds and those periodic spikes is a real multi-year downtrend in available exchange supply, across multiple price cycles in both directions. My honest read: a rally happening without that characteristic reserve spike is a genuinely different setup than several prior moves on this chart, less fresh supply showing up at exchanges to meet demand this time. I wouldn't call that proof the rally keeps going, but the absence of that specific historical warning sign is worth noting, not brushing off. What I'm watching: whether a reserve spike eventually shows up as this move continues, or if LINK pushes back toward its recent highs without one, since that's historically been the pattern's trigger point. #BTC Price Analysis# #Altcoin Season# $LINK
30
·
--
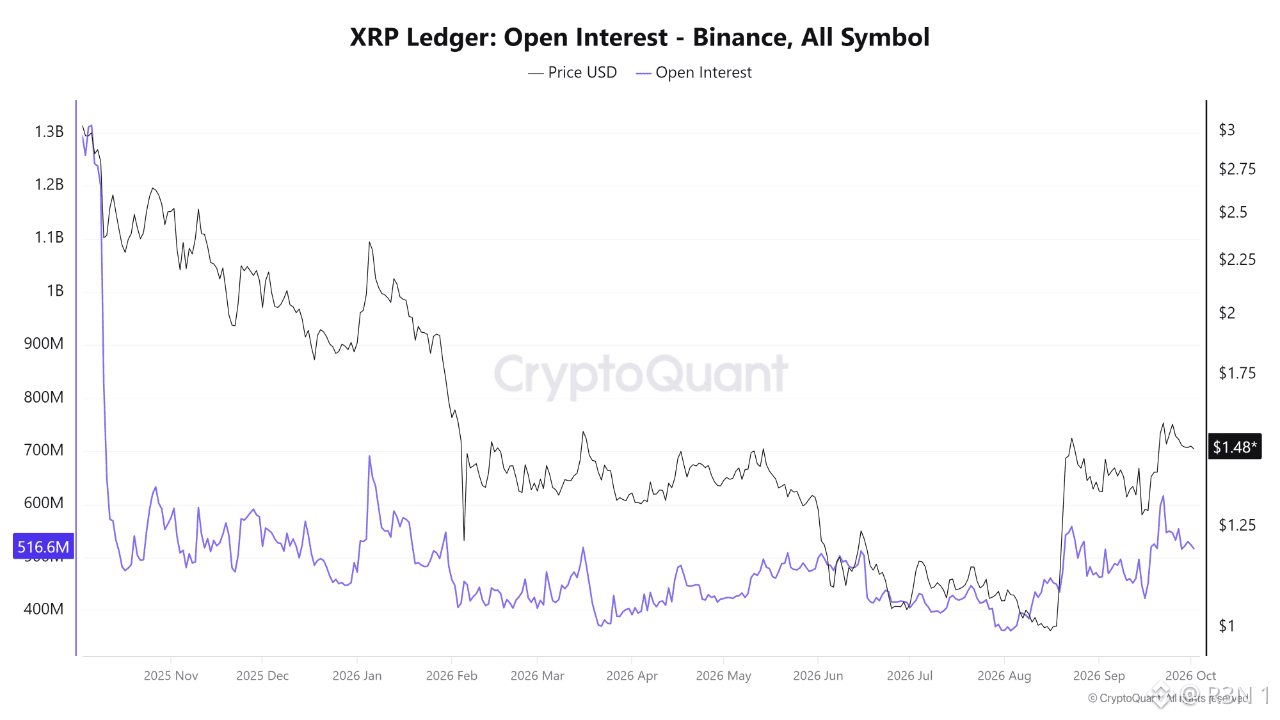
XRP open interest on Binance sits at 516.6M right now, up off its 2026 low near 350 to 400M, but still nowhere close to where it started this chart, above 1.3B back in October 2025. Price has done a lot better by comparison, recovering to $1.48 from a February low near $1. What stands out to me looking at the full chart is how closely these two lines have actually tracked each other. The initial collapse was brutal and immediate, open interest cratering from 1.3B down to the 500 to 600M range within weeks, right alongside price sliding from near $3 toward $2.20. Both kept falling together through a volatile February too, open interest hitting its cycle low near 350 to 400M as price dropped sharply toward $1.50. Then March through July, both basically chopped sideways, no real trend in either direction. Personally, the part I find most interesting is late August into September, where both lines actually spiked together, open interest jumping from around 400M past 700M, price climbing from near $1 to $1.25 to $1.30, before both pulled back to where they sit now. My honest read: that gap between price's recovery and open interest's recovery is the real story here. Price at $1.48 is a genuine rebound, but open interest at 516.6M is still well below both its October starting point and its own September peak. I think that asymmetry points to a market that's less leveraged and more cautious right now than it was a year ago, not necessarily a bad thing, just a different character of market. Where I'd push back on reading too much into either line alone, these two have moved together this entire chart, so the current gap is worth watching, not dismissing as noise. What I'm watching: whether open interest keeps climbing back toward that recent peak, or whether this pullback in both series extends further from here. $XRP #BTC Price Analysis# #Altcoin Season#
XRP open interest on Binance sits at 516.6M right now, up off its 2026 low near 350 to 400M, but still nowhere close to where it started this chart, above 1.3B back in October 2025. Price has done a lot better by comparison, recovering to $1.48 from a February low near $1. What stands out to me looking at the full chart is how closely these two lines have actually tracked each other. The initial collapse was brutal and immediate, open interest cratering from 1.3B down to the 500 to 600M range within weeks, right alongside price sliding from near $3 toward $2.20. Both kept falling together through a volatile February too, open interest hitting its cycle low near 350 to 400M as price dropped sharply toward $1.50. Then March through July, both basically chopped sideways, no real trend in either direction. Personally, the part I find most interesting is late August into September, where both lines actually spiked together, open interest jumping from around 400M past 700M, price climbing from near $1 to $1.25 to $1.30, before both pulled back to where they sit now. My honest read: that gap between price's recovery and open interest's recovery is the real story here. Price at $1.48 is a genuine rebound, but open interest at 516.6M is still well below both its October starting point and its own September peak. I think that asymmetry points to a market that's less leveraged and more cautious right now than it was a year ago, not necessarily a bad thing, just a different character of market. Where I'd push back on reading too much into either line alone, these two have moved together this entire chart, so the current gap is worth watching, not dismissing as noise. What I'm watching: whether open interest keeps climbing back toward that recent peak, or whether this pullback in both series extends further from here. $XRP #BTC Price Analysis# #Altcoin Season#
32
·
--
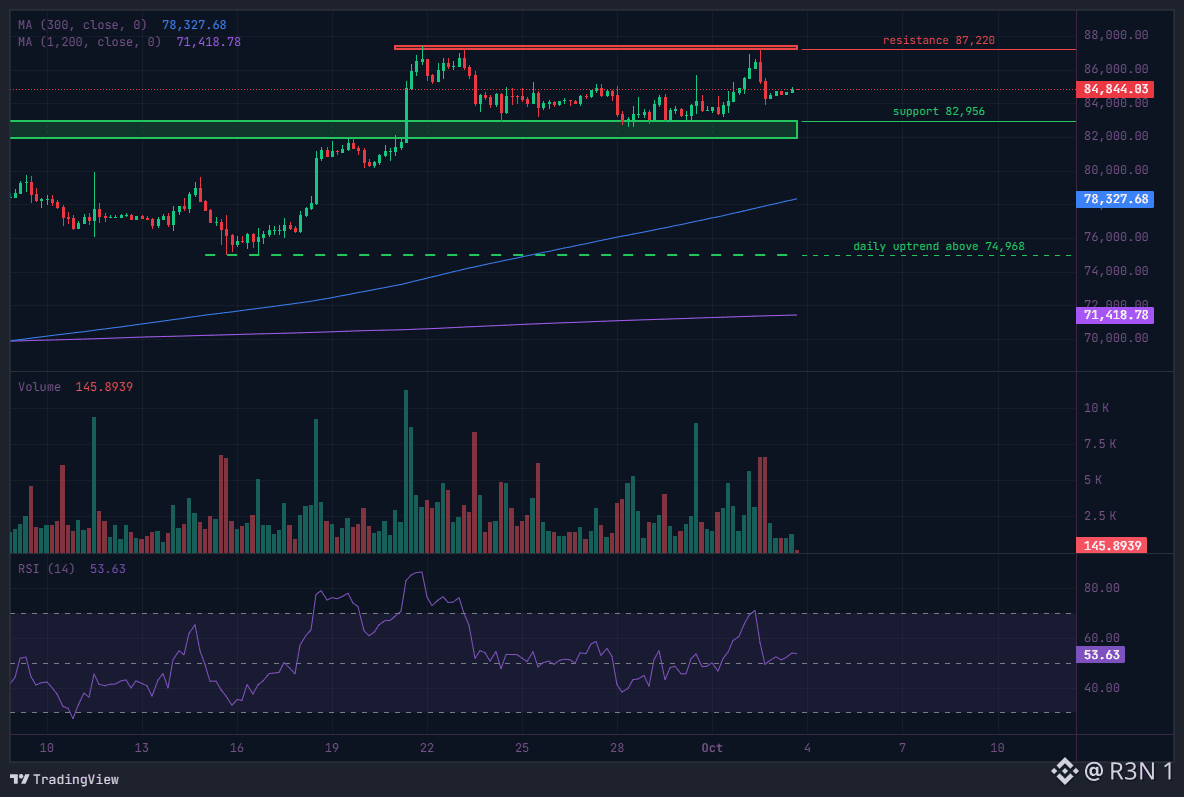
BTC's 18 day move from $74,968 to $87,396 wasn't carried on steadily rising volume, it was carried on bursts, specific candles where real participation showed up, surrounded by quieter stretches in between. That distinction matters more than the headline percentage gain. The 20 candle average volume on the 4 hour chart sits 31.88% above the prior 20 candle average, genuine expansion, but concentrated rather than uniform. The clearest upside burst was 11,227.96 BTC on September 22 as price closed at 84,887, followed by another 8,699 BTC as price extended toward 85,927, a rally with real conviction behind it, not just price drifting up on thin books. Worth noting honestly, volume showed up on the sell side too. 8,305.86 BTC printed September 25 as price pulled back to 83,996, and two separate clusters, 6,577 and 6,586 $BTC , appeared during the rejection from the 87,220 resistance zone on October 2. Genuine two way trading near the highs, not a clean one directional accumulation story. The most recent data points matter most. The last finished 4 hour candle closed at 84,867 on just 1,228 BTC, well below the recent average, participation fading after that resistance rejection. Structurally, price sits above 82,956 support and below 87,220 resistance, daily uptrend still intact above 74,968, while the 4 hour chart has gone flat. My honest read: fading volume right after a rejection from resistance is a reasonable signal to watch, not ignore, it suggests the market's catching its breath rather than mounting an immediate second attempt. The structure still favors higher over lower as long as that daily uptrend holds, but the volume pattern argues for patience over urgency right here. What I'm watching: whether volume reaccelerates on the next approach toward $87,220, or whether this low participation stretch extends and price just grinds sideways instead. #BTC Price Analysis# #BNBChain#
BTC's 18 day move from $74,968 to $87,396 wasn't carried on steadily rising volume, it was carried on bursts, specific candles where real participation showed up, surrounded by quieter stretches in between. That distinction matters more than the headline percentage gain. The 20 candle average volume on the 4 hour chart sits 31.88% above the prior 20 candle average, genuine expansion, but concentrated rather than uniform. The clearest upside burst was 11,227.96 BTC on September 22 as price closed at 84,887, followed by another 8,699 BTC as price extended toward 85,927, a rally with real conviction behind it, not just price drifting up on thin books. Worth noting honestly, volume showed up on the sell side too. 8,305.86 BTC printed September 25 as price pulled back to 83,996, and two separate clusters, 6,577 and 6,586 $BTC , appeared during the rejection from the 87,220 resistance zone on October 2. Genuine two way trading near the highs, not a clean one directional accumulation story. The most recent data points matter most. The last finished 4 hour candle closed at 84,867 on just 1,228 BTC, well below the recent average, participation fading after that resistance rejection. Structurally, price sits above 82,956 support and below 87,220 resistance, daily uptrend still intact above 74,968, while the 4 hour chart has gone flat. My honest read: fading volume right after a rejection from resistance is a reasonable signal to watch, not ignore, it suggests the market's catching its breath rather than mounting an immediate second attempt. The structure still favors higher over lower as long as that daily uptrend holds, but the volume pattern argues for patience over urgency right here. What I'm watching: whether volume reaccelerates on the next approach toward $87,220, or whether this low participation stretch extends and price just grinds sideways instead. #BTC Price Analysis# #BNBChain#
42
·
--
Ethereum's exchange inflow and outflow have basically mirrored each other all month, until the very last reading, where that pattern finally broke. What strikes me looking at both charts together is how synchronized they've been. September 10, 18, 22, and 28 all show matching spikes on both inflow and outflow, roughly 1.58M and 1.55M, 1.45M and 1.3M, 1.3M on both sides, 1.15M on both sides. That kind of twin movement usually reads as churn to me, high volume cycling through exchanges, not one directional trend quietly building underneath. Personally, the detail I'd actually flag is the most recent print. Outflow just hit 129.7K against inflow at 116.7K, a real net outflow day after weeks of near perfect balance. I wouldn't call that a confirmed shift yet, it's one data point, but it's the first genuine divergence in an otherwise matched month. Price climbed from around $2.40K in mid September to $2.67K now, with the sharpest jump, roughly $2.45K to $2.70K, landing right between September 19 and 21, right after that September 18 spike on both sides. I think that timing is worth noting, large two sided flow activity showing up just before a real price move, though I wouldn't claim it caused the breakout outright. My honest read: a month of matched flows mostly tells you the market's been active and repositioning, not accumulating or distributing in any clear direction. Where I'd push back on getting ahead of this, one outflow heavy day doesn't confirm a new trend, it just breaks the pattern that held for weeks. What I'm watching: whether outflow actually keeps leading inflow from here, or whether this snaps back to the matched twin spikes that defined most of September. $ETH #BTC Price Analysis# #Altcoin Season# #Meme Alpha#
Ethereum's exchange inflow and outflow have basically mirrored each other all month, until the very last reading, where that pattern finally broke. What strikes me looking at both charts together is how synchronized they've been. September 10, 18, 22, and 28 all show matching spikes on both inflow and outflow, roughly 1.58M and 1.55M, 1.45M and 1.3M, 1.3M on both sides, 1.15M on both sides. That kind of twin movement usually reads as churn to me, high volume cycling through exchanges, not one directional trend quietly building underneath. Personally, the detail I'd actually flag is the most recent print. Outflow just hit 129.7K against inflow at 116.7K, a real net outflow day after weeks of near perfect balance. I wouldn't call that a confirmed shift yet, it's one data point, but it's the first genuine divergence in an otherwise matched month. Price climbed from around $2.40K in mid September to $2.67K now, with the sharpest jump, roughly $2.45K to $2.70K, landing right between September 19 and 21, right after that September 18 spike on both sides. I think that timing is worth noting, large two sided flow activity showing up just before a real price move, though I wouldn't claim it caused the breakout outright. My honest read: a month of matched flows mostly tells you the market's been active and repositioning, not accumulating or distributing in any clear direction. Where I'd push back on getting ahead of this, one outflow heavy day doesn't confirm a new trend, it just breaks the pattern that held for weeks. What I'm watching: whether outflow actually keeps leading inflow from here, or whether this snaps back to the matched twin spikes that defined most of September. $ETH #BTC Price Analysis# #Altcoin Season# #Meme Alpha#
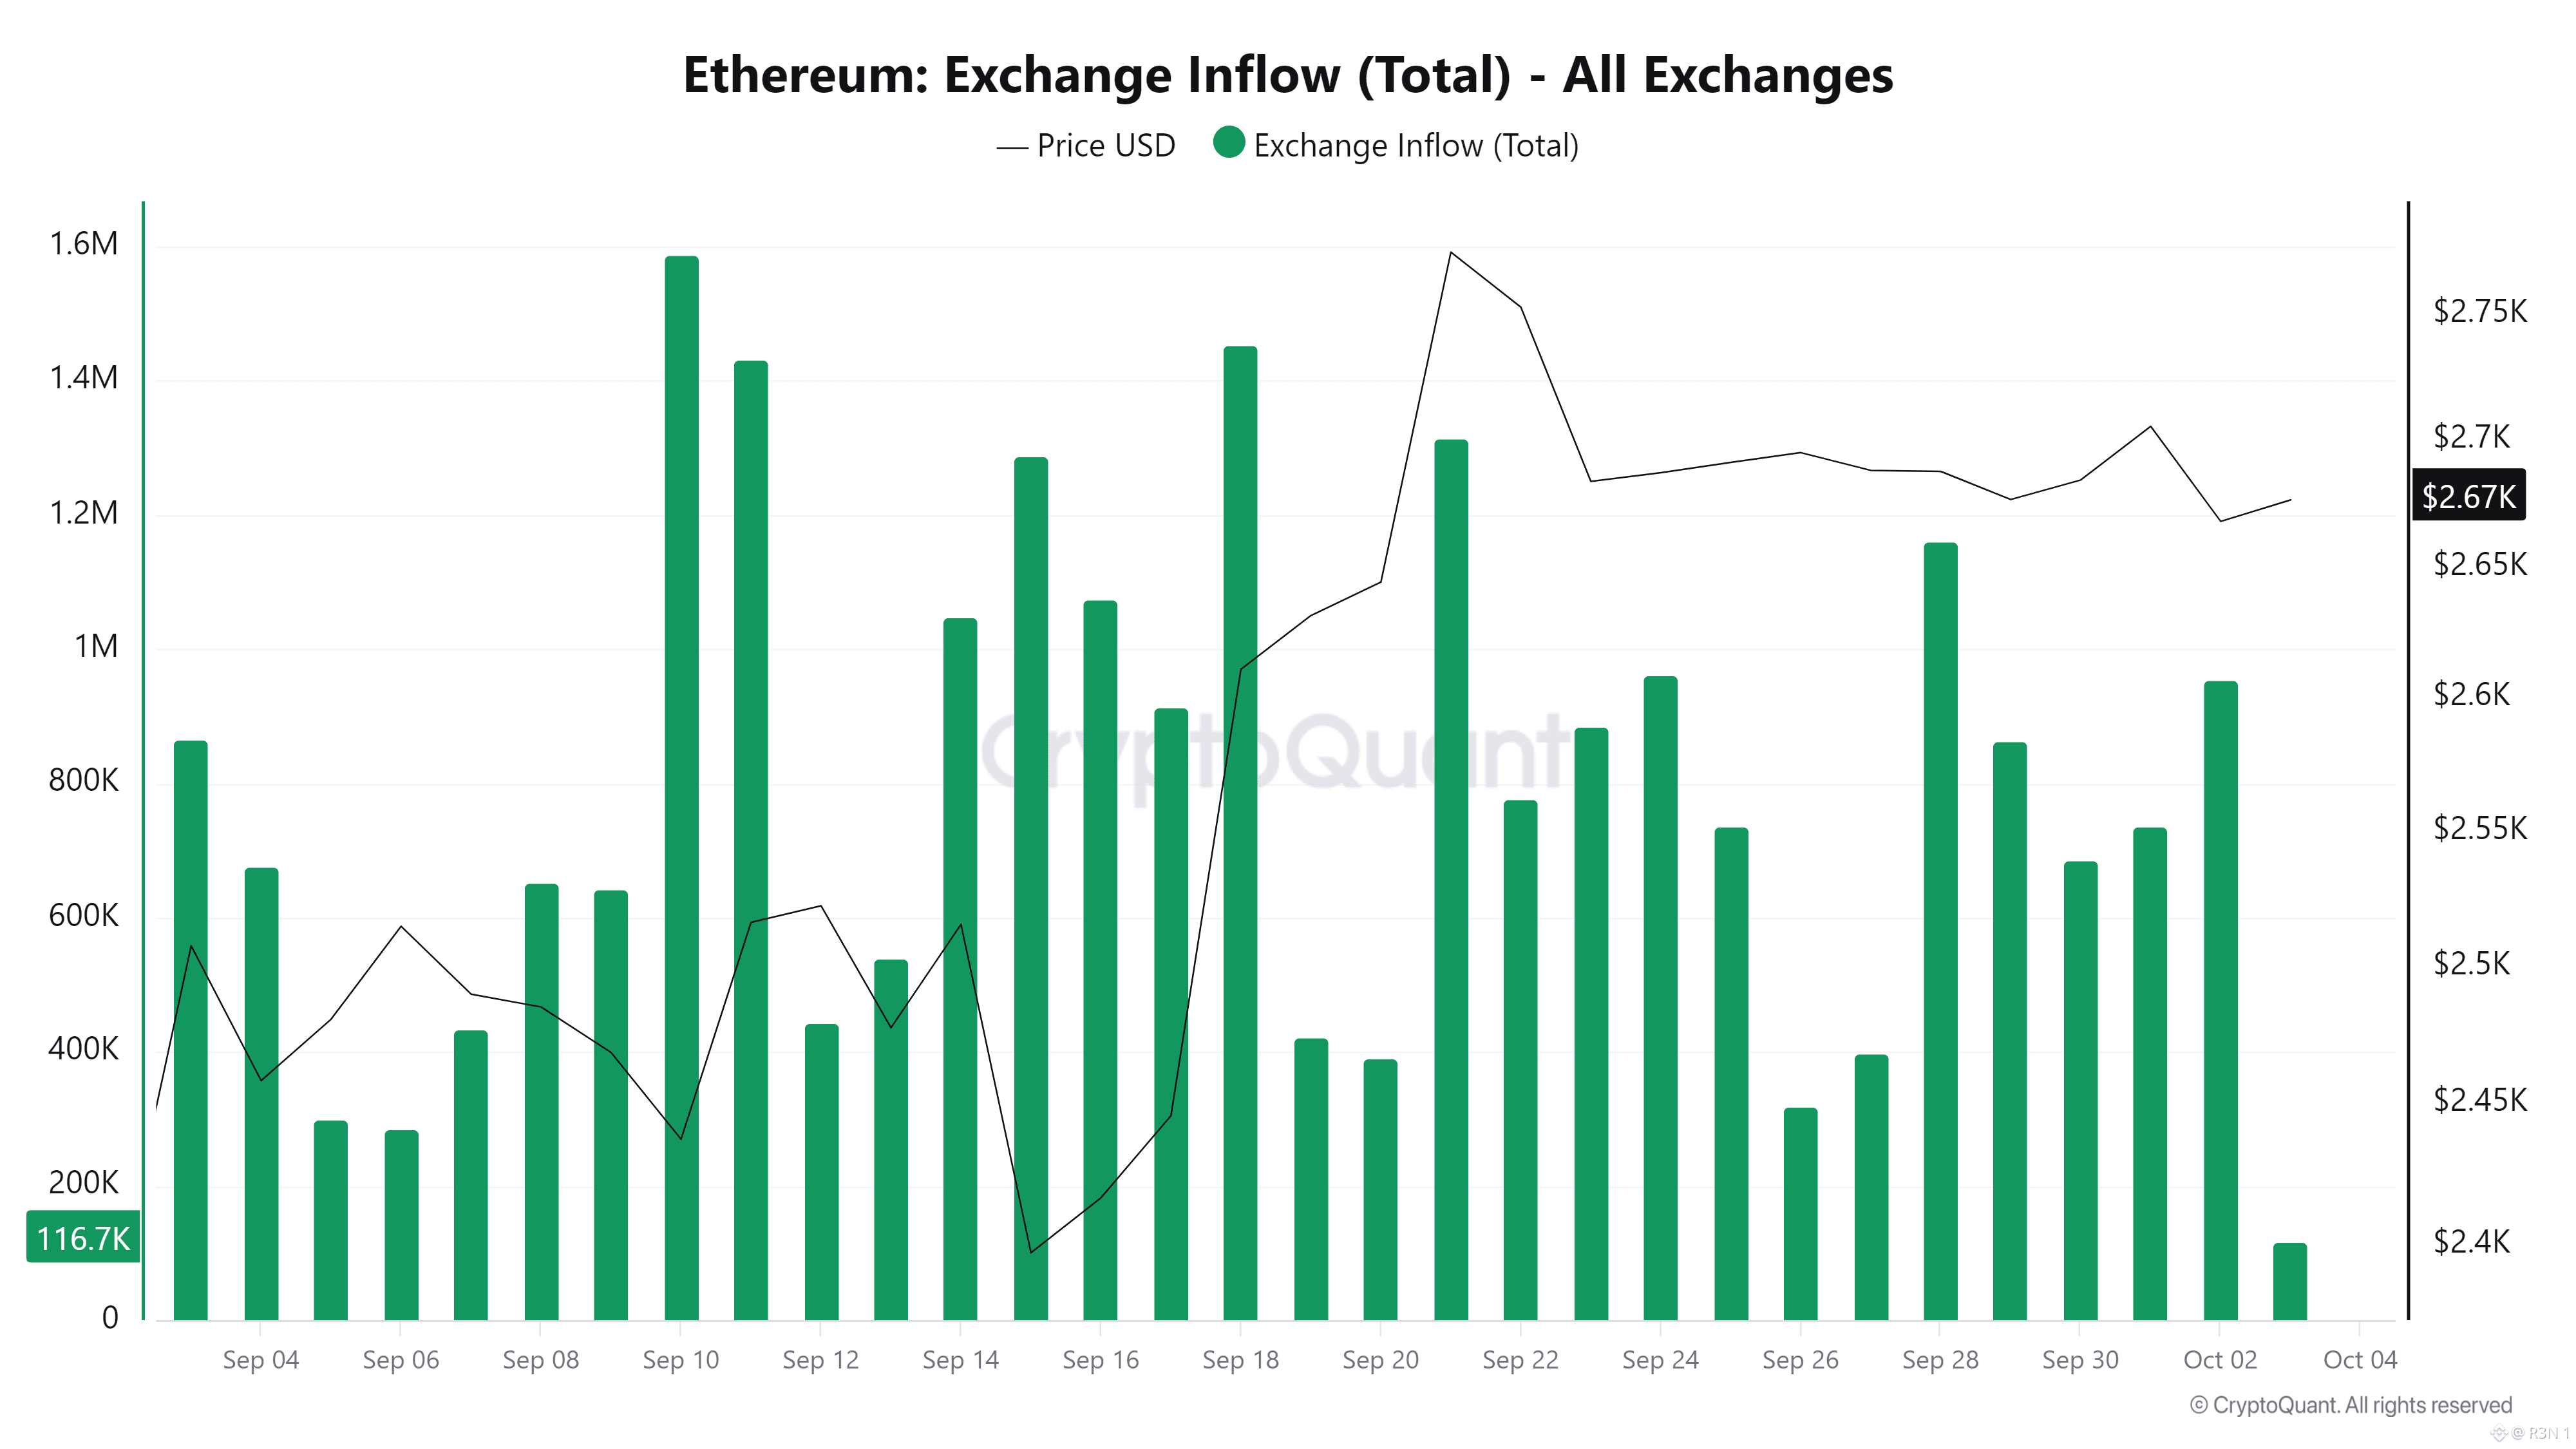
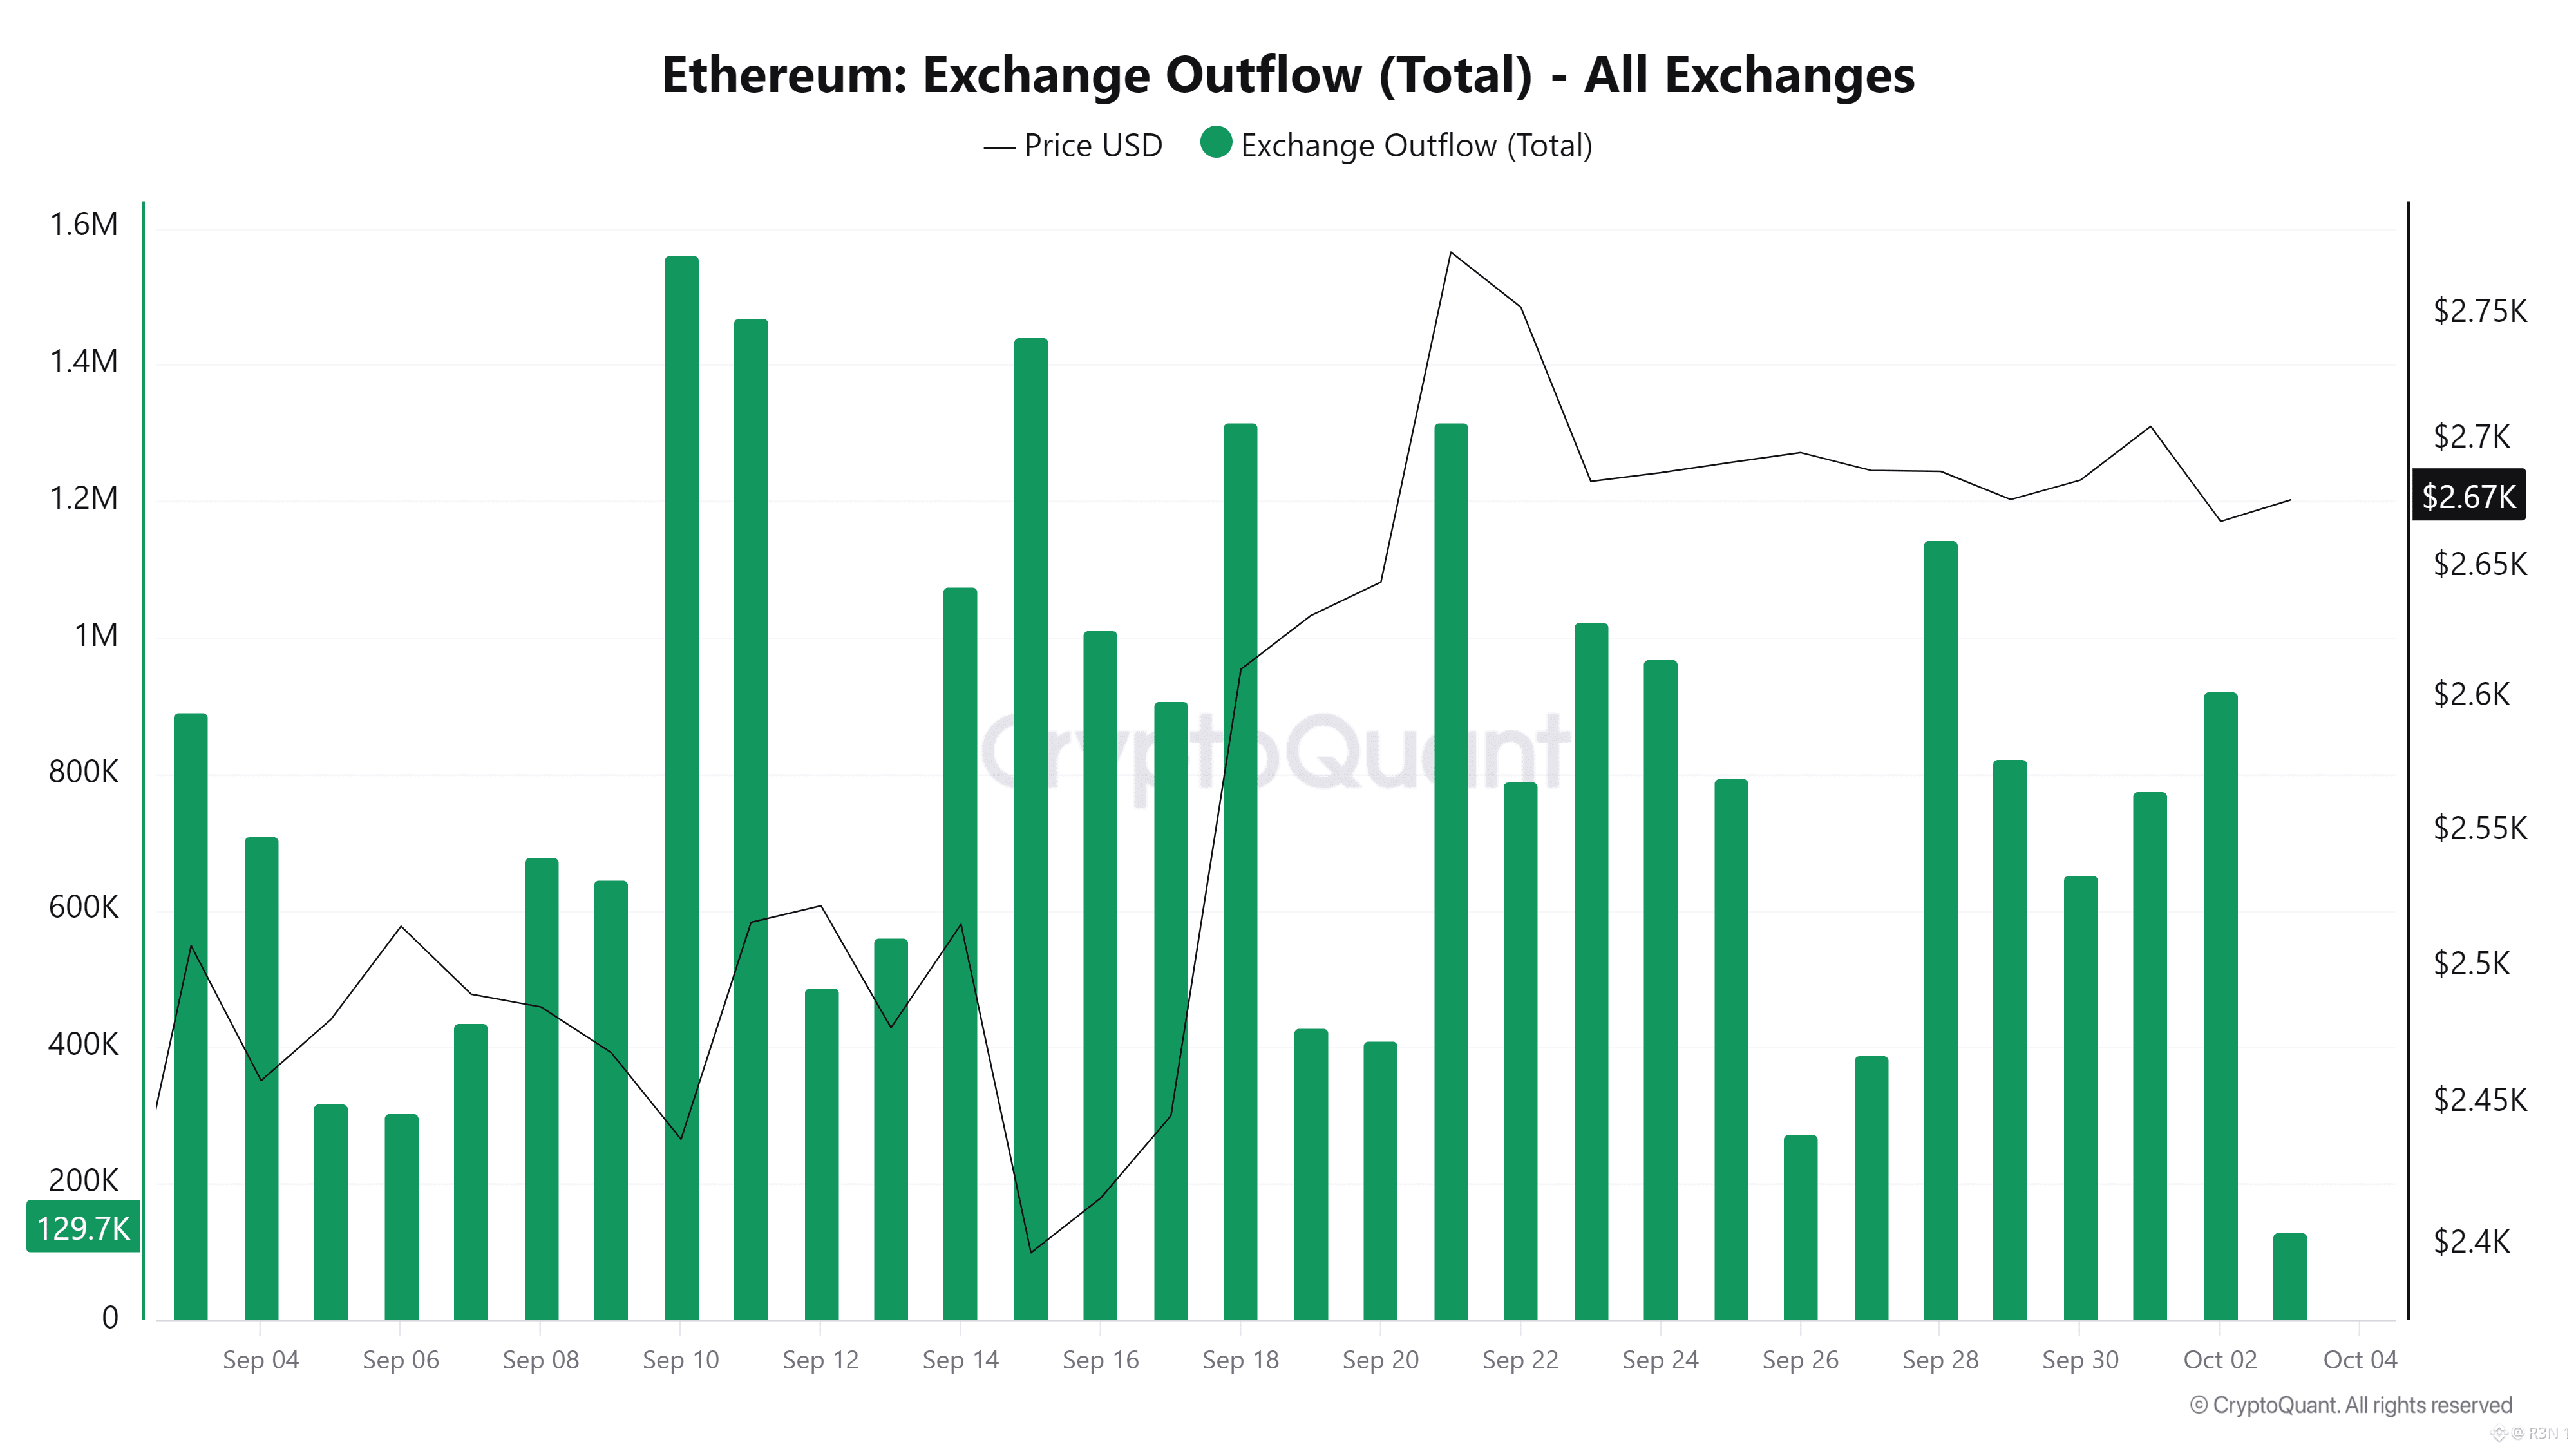
52
·
--
Bitcoin exchange reserves just hit 2.68 million BTC, the lowest point on this chart going back to September 2023, while price has climbed back to $84,600. That's the actual signal worth sitting with, not just today's price. What strikes me zooming out is how consistent this downtrend has been across completely different price regimes. Reserves peaked near 3.2 million BTC back in early 2024 when price sat well below $70K, then kept declining through the 2024 highs near $73K, the 2025 run toward $126K, and the 2026 pullback. Price went up, down, and sideways multiple times, reserves just kept falling through all of it. Personally, the period that stands out most is late 2024 into 2025, reserves dropped sharply from around 3.1 million toward 2.9 million while price was stuck in a wide consolidation range. That's coins leaving exchanges with no single price catalyst behind it, a steady structural outflow, not an event driven spike. My honest read: a reserve decline this consistent across multiple cycles is typically read as accumulation or long term holding intent, coins aren't sitting available for quick sale. I think that's a fair read here. Where I'd push back on reading too much into it though, exchange reserves leaving doesn't tell you where coins actually went, cold storage, OTC desks, and custody shifts all look identical on this chart. What I'm watching: whether this decline keeps going as price pushes higher, or whether a rally toward new highs eventually pulls some supply back onto exchanges the way past cycles have. $BTC #BTC Price Analysis# #Altcoin Season#
Bitcoin exchange reserves just hit 2.68 million BTC, the lowest point on this chart going back to September 2023, while price has climbed back to $84,600. That's the actual signal worth sitting with, not just today's price. What strikes me zooming out is how consistent this downtrend has been across completely different price regimes. Reserves peaked near 3.2 million BTC back in early 2024 when price sat well below $70K, then kept declining through the 2024 highs near $73K, the 2025 run toward $126K, and the 2026 pullback. Price went up, down, and sideways multiple times, reserves just kept falling through all of it. Personally, the period that stands out most is late 2024 into 2025, reserves dropped sharply from around 3.1 million toward 2.9 million while price was stuck in a wide consolidation range. That's coins leaving exchanges with no single price catalyst behind it, a steady structural outflow, not an event driven spike. My honest read: a reserve decline this consistent across multiple cycles is typically read as accumulation or long term holding intent, coins aren't sitting available for quick sale. I think that's a fair read here. Where I'd push back on reading too much into it though, exchange reserves leaving doesn't tell you where coins actually went, cold storage, OTC desks, and custody shifts all look identical on this chart. What I'm watching: whether this decline keeps going as price pushes higher, or whether a rally toward new highs eventually pulls some supply back onto exchanges the way past cycles have. $BTC #BTC Price Analysis# #Altcoin Season#
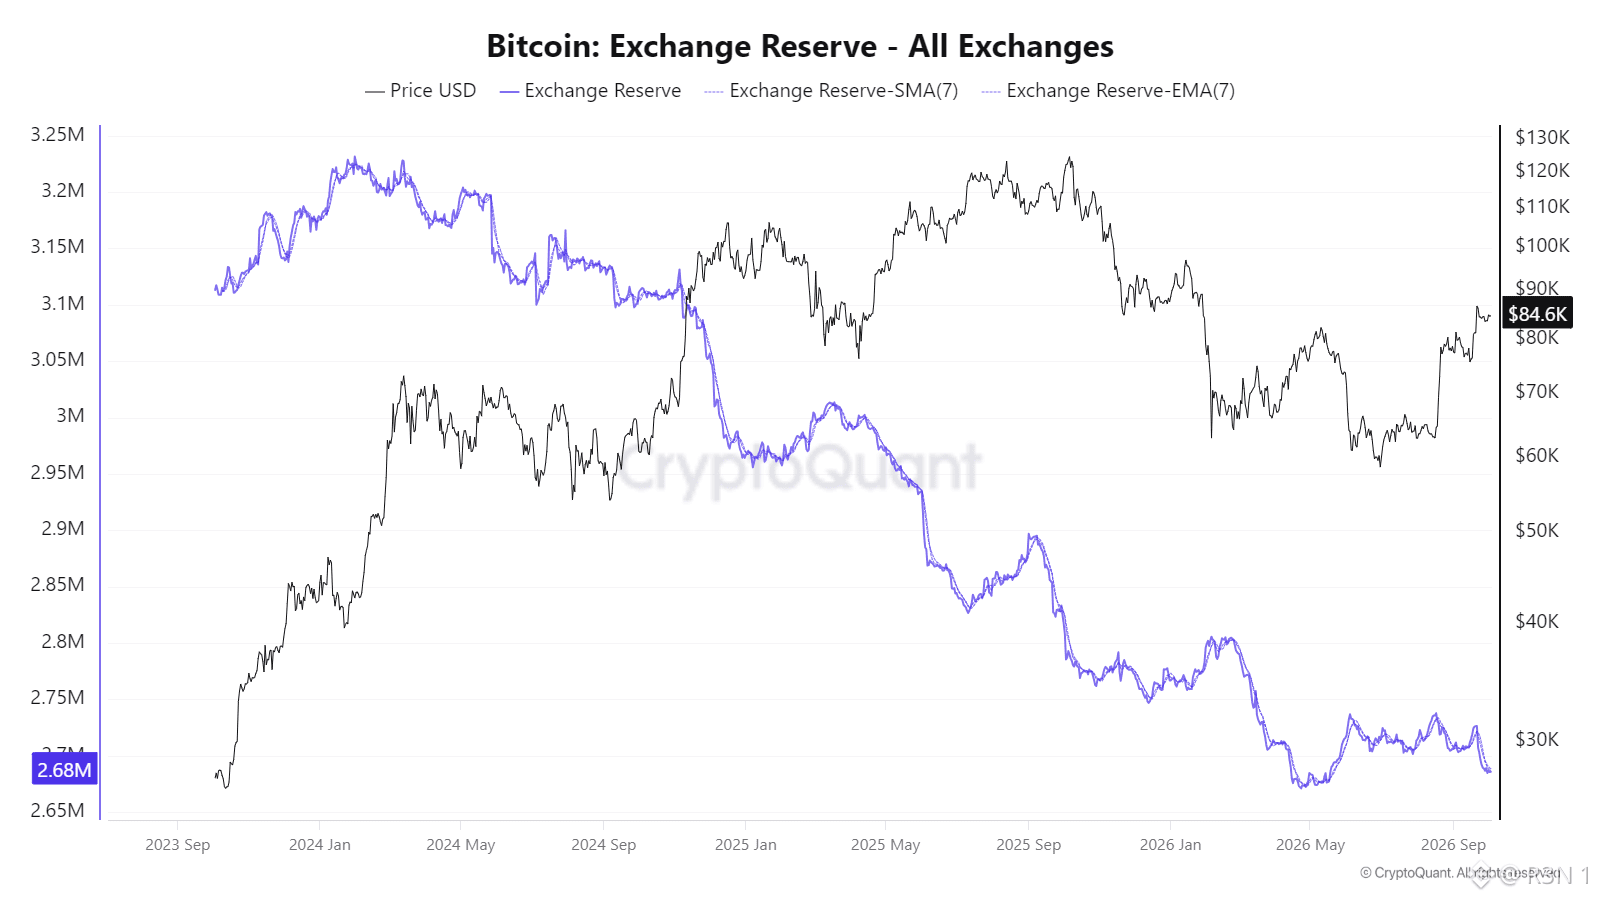
86
·
--
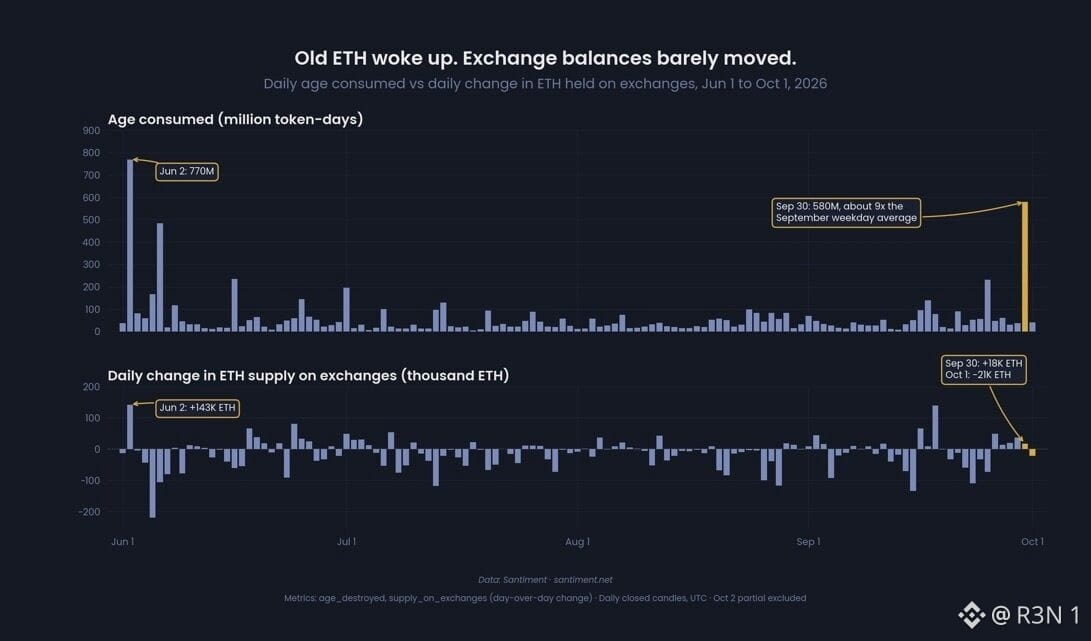
580 million token-days of dormant ETH moved on September 30, roughly 9x the September weekday average, and exchange balances barely budged. That combination is the actual story, old coins waking up without a corresponding dump.
Age consumed measures how long moved coins sat untouched before moving, so a spike this size means a meaningful amount of long-held ETH changed hands in a single day, not routine trading activity. The comparison point matters here, the last similar spike, June 2, saw exchange balances jump more than 140,000 ETH that same day. This time, supply on exchanges rose about 18,000 ETH, then fell roughly 21,000 the next day, essentially flat against the 5.9 million ETH currently sitting on exchanges overall.
What stands out to me is Santiment's own honesty about the limits of this data. They're explicit they can't yet confirm who actually moved these coins, and they note past spikes this size have often turned out to be wallet reshuffling, custodial transfers, consolidation, internal movement, rather than holders actually preparing to sell. That's a meaningfully different interpretation than "dormant whales are about to dump," and the muted exchange balance change actually supports the reshuffling read over the selling read.
This is landing in a specific sentiment backdrop too, Santiment separately flagged ETH's bullish-to-bearish comment ratio at 0.89, its lowest since June 7, so this dormant coin movement is showing up right as broader social sentiment has turned negative, which is worth noting as context, not as evidence the two are causally connected.
The open question isn't whether something happened, 580 million token-days is a real, unusual reading. It's whether the coins that moved actually reach exchanges in the coming days, the same tell Santiment flags in their own framework, because that's what would separate quiet repositioning from the start of real sell pressure.
$ETH #BTC Price Analysis# #Ethereum
580 million token-days of dormant ETH moved on September 30, roughly 9x the September weekday average, and exchange balances barely budged. That combination is the actual story, old coins waking up without a corresponding dump.
Age consumed measures how long moved coins sat untouched before moving, so a spike this size means a meaningful amount of long-held ETH changed hands in a single day, not routine trading activity. The comparison point matters here, the last similar spike, June 2, saw exchange balances jump more than 140,000 ETH that same day. This time, supply on exchanges rose about 18,000 ETH, then fell roughly 21,000 the next day, essentially flat against the 5.9 million ETH currently sitting on exchanges overall.
What stands out to me is Santiment's own honesty about the limits of this data. They're explicit they can't yet confirm who actually moved these coins, and they note past spikes this size have often turned out to be wallet reshuffling, custodial transfers, consolidation, internal movement, rather than holders actually preparing to sell. That's a meaningfully different interpretation than "dormant whales are about to dump," and the muted exchange balance change actually supports the reshuffling read over the selling read.
This is landing in a specific sentiment backdrop too, Santiment separately flagged ETH's bullish-to-bearish comment ratio at 0.89, its lowest since June 7, so this dormant coin movement is showing up right as broader social sentiment has turned negative, which is worth noting as context, not as evidence the two are causally connected.
The open question isn't whether something happened, 580 million token-days is a real, unusual reading. It's whether the coins that moved actually reach exchanges in the coming days, the same tell Santiment flags in their own framework, because that's what would separate quiet repositioning from the start of real sell pressure.
$ETH #BTC Price Analysis# #Ethereum
Age consumed measures how long moved coins sat untouched before moving, so a spike this size means a meaningful amount of long-held ETH changed hands in a single day, not routine trading activity. The comparison point matters here, the last similar spike, June 2, saw exchange balances jump more than 140,000 ETH that same day. This time, supply on exchanges rose about 18,000 ETH, then fell roughly 21,000 the next day, essentially flat against the 5.9 million ETH currently sitting on exchanges overall.
What stands out to me is Santiment's own honesty about the limits of this data. They're explicit they can't yet confirm who actually moved these coins, and they note past spikes this size have often turned out to be wallet reshuffling, custodial transfers, consolidation, internal movement, rather than holders actually preparing to sell. That's a meaningfully different interpretation than "dormant whales are about to dump," and the muted exchange balance change actually supports the reshuffling read over the selling read.
This is landing in a specific sentiment backdrop too, Santiment separately flagged ETH's bullish-to-bearish comment ratio at 0.89, its lowest since June 7, so this dormant coin movement is showing up right as broader social sentiment has turned negative, which is worth noting as context, not as evidence the two are causally connected.
The open question isn't whether something happened, 580 million token-days is a real, unusual reading. It's whether the coins that moved actually reach exchanges in the coming days, the same tell Santiment flags in their own framework, because that's what would separate quiet repositioning from the start of real sell pressure.
$ETH #BTC Price Analysis# #Ethereum
1
·
--
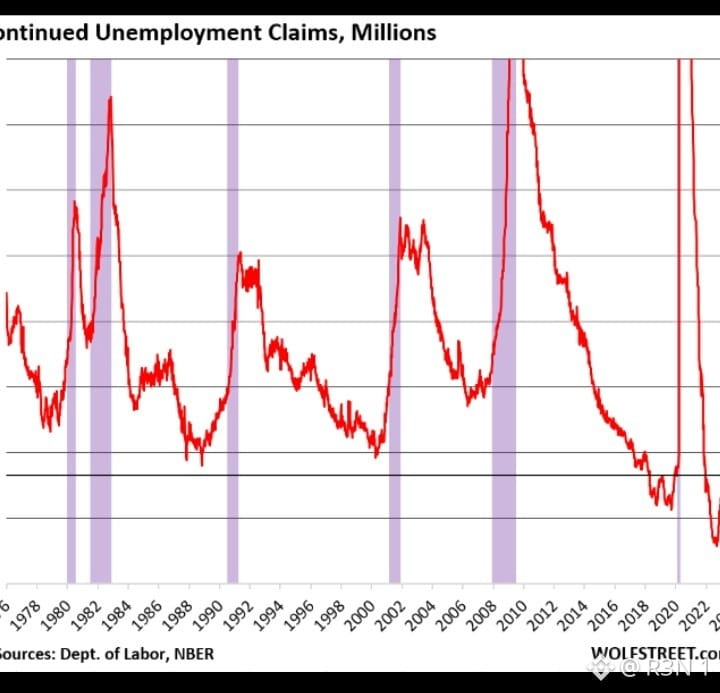
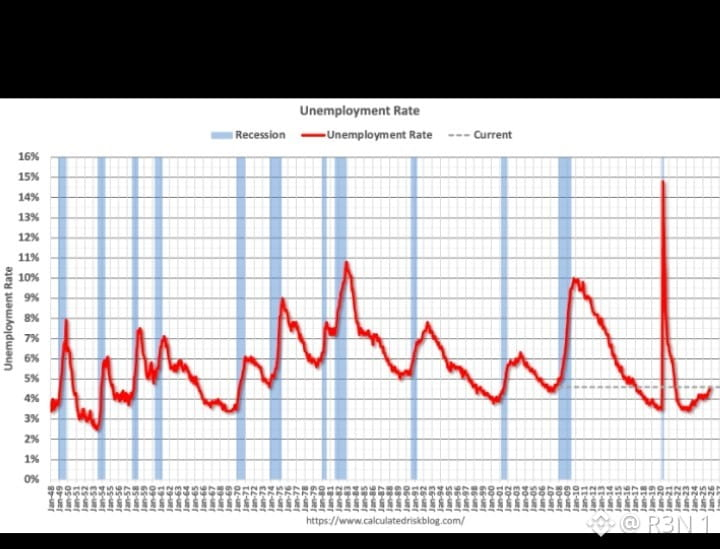
That single miss did more to move Fed hike odds than weeks of commentary, pushing October hike expectations down to roughly 17 to 24% depending on the snapshot, and it landed the same week Citi raised its 12 month BTC target to $113,000.
Worth being precise about what Citi actually did here.
Thiis isn't a fresh bullish call out of nowhere, it's a reversal. Citi started 2026 at $143,000, cut to $112,000 in March after the CLARITY Act stalled, cut again to $82,000 in July, and has now moved back up to $113,000, citing stronger crypto activity, improved macro conditions, and projecting $5 billion in crypto ETF inflows over the next year.
BTC sits around $86,885, up 2.7% on the jobs miss, meaning the target itself requires roughly 30% more upside, and even at $113,000 that's still about 10% below October 2025's record near $126,200.
The mechanism connecting weak jobs data to this is straightforward. Softer labor numbers reduce the odds of another hike, which eases pressure on Treasury yields, the 10 year fell toward 5.17% on the print, and that combination historically supports risk asset positioning. Citi's own framing treats $90,000 as the real first test, a sustained break there puts $100,000 back in play before $113,000 becomes relevant at all.
My honest read: one weak jobs report doesn't lock in a dovish Fed, inflation data and upcoming releases still matter, and Citi's own target has already reversed twice this year. The macro tailwind is real right now, but treating a 12 month bank target as a near term price map skips over how much that target itself has moved already.
What I'm watching: whether $90,000 actually breaks and holds, since that's the level that determines whether $113,000 becomes a realistic 12 month conversation or stays a reversed forecast on paper.
$BTC #BTC Price Analysis# #Macro Insights# $XAUt
That single miss did more to move Fed hike odds than weeks of commentary, pushing October hike expectations down to roughly 17 to 24% depending on the snapshot, and it landed the same week Citi raised its 12 month BTC target to $113,000.
Worth being precise about what Citi actually did here.
Thiis isn't a fresh bullish call out of nowhere, it's a reversal. Citi started 2026 at $143,000, cut to $112,000 in March after the CLARITY Act stalled, cut again to $82,000 in July, and has now moved back up to $113,000, citing stronger crypto activity, improved macro conditions, and projecting $5 billion in crypto ETF inflows over the next year.
BTC sits around $86,885, up 2.7% on the jobs miss, meaning the target itself requires roughly 30% more upside, and even at $113,000 that's still about 10% below October 2025's record near $126,200.
The mechanism connecting weak jobs data to this is straightforward. Softer labor numbers reduce the odds of another hike, which eases pressure on Treasury yields, the 10 year fell toward 5.17% on the print, and that combination historically supports risk asset positioning. Citi's own framing treats $90,000 as the real first test, a sustained break there puts $100,000 back in play before $113,000 becomes relevant at all.
My honest read: one weak jobs report doesn't lock in a dovish Fed, inflation data and upcoming releases still matter, and Citi's own target has already reversed twice this year. The macro tailwind is real right now, but treating a 12 month bank target as a near term price map skips over how much that target itself has moved already.
What I'm watching: whether $90,000 actually breaks and holds, since that's the level that determines whether $113,000 becomes a realistic 12 month conversation or stays a reversed forecast on paper.
$BTC #BTC Price Analysis# #Macro Insights# $XAUt
Worth being precise about what Citi actually did here.
Thiis isn't a fresh bullish call out of nowhere, it's a reversal. Citi started 2026 at $143,000, cut to $112,000 in March after the CLARITY Act stalled, cut again to $82,000 in July, and has now moved back up to $113,000, citing stronger crypto activity, improved macro conditions, and projecting $5 billion in crypto ETF inflows over the next year.
BTC sits around $86,885, up 2.7% on the jobs miss, meaning the target itself requires roughly 30% more upside, and even at $113,000 that's still about 10% below October 2025's record near $126,200.
The mechanism connecting weak jobs data to this is straightforward. Softer labor numbers reduce the odds of another hike, which eases pressure on Treasury yields, the 10 year fell toward 5.17% on the print, and that combination historically supports risk asset positioning. Citi's own framing treats $90,000 as the real first test, a sustained break there puts $100,000 back in play before $113,000 becomes relevant at all.
My honest read: one weak jobs report doesn't lock in a dovish Fed, inflation data and upcoming releases still matter, and Citi's own target has already reversed twice this year. The macro tailwind is real right now, but treating a 12 month bank target as a near term price map skips over how much that target itself has moved already.
What I'm watching: whether $90,000 actually breaks and holds, since that's the level that determines whether $113,000 becomes a realistic 12 month conversation or stays a reversed forecast on paper.
$BTC #BTC Price Analysis# #Macro Insights# $XAUt
27
·
--
Greywick Digital just signed a Litecoin Foundation partnership, and the gap between "MOU" and "launch" is doing most of the work in this announcement. Signed October 1, this is Greywick Digital and the Litecoin Foundation agreeing on intent, not a shipped product, and multiple outlets are explicit that no firm launch date exists beyond the stated "end of 2026" target. What's actually interesting here is the mechanism, not the timeline. cLTC is a reserve-backed representation, real LTC locked up, a token representing it circulating on Canton, the settlement network already used by DTCC, Goldman Sachs, and BNP Paribas. On-chain reserve validation and continuous attestations are the compliance layer meant to make this credible to institutions that wouldn't touch raw LTC custody themselves. Worth being precise about what's actually contingent here. The mainnet launch depends on three unfinished things, completed testnet validations, published reserve disclosures, and a finalized attestation framework. None of those are confirmed yet, they're the actual gating items standing between this MOU and a live product. The Litecoin Foundation's role is notable too, they're not just endorsing this, they've designated cLTC as the official institutional version of Litecoin going forward, a real statement of intent even without a shipped token yet. The open question isn't whether the partnership is real, it clearly is. It's whether institutional demand on Canton actually shows up once cLTC launches, or whether this ends up being infrastructure built for adoption that takes longer to materialize than the "end of 2026" target suggests, which is exactly the risk every tokenized-asset bridge like this carries until real volume proves otherwise. #BTC Price Analysis# $LTC $CC #Macro Insights#
Greywick Digital just signed a Litecoin Foundation partnership, and the gap between "MOU" and "launch" is doing most of the work in this announcement. Signed October 1, this is Greywick Digital and the Litecoin Foundation agreeing on intent, not a shipped product, and multiple outlets are explicit that no firm launch date exists beyond the stated "end of 2026" target. What's actually interesting here is the mechanism, not the timeline. cLTC is a reserve-backed representation, real LTC locked up, a token representing it circulating on Canton, the settlement network already used by DTCC, Goldman Sachs, and BNP Paribas. On-chain reserve validation and continuous attestations are the compliance layer meant to make this credible to institutions that wouldn't touch raw LTC custody themselves. Worth being precise about what's actually contingent here. The mainnet launch depends on three unfinished things, completed testnet validations, published reserve disclosures, and a finalized attestation framework. None of those are confirmed yet, they're the actual gating items standing between this MOU and a live product. The Litecoin Foundation's role is notable too, they're not just endorsing this, they've designated cLTC as the official institutional version of Litecoin going forward, a real statement of intent even without a shipped token yet. The open question isn't whether the partnership is real, it clearly is. It's whether institutional demand on Canton actually shows up once cLTC launches, or whether this ends up being infrastructure built for adoption that takes longer to materialize than the "end of 2026" target suggests, which is exactly the risk every tokenized-asset bridge like this carries until real volume proves otherwise. #BTC Price Analysis# $LTC $CC #Macro Insights#


32
·
--
THORChain's long-planned Zcash integration, alongside Monero, Bittensor, and Dash, has been in development for months. But the timing lands right after THORChain publicly refused Bitget CEO Gracy Chen's request to block addresses linked to the exchange's $387.5 million hack, and separately, hackers from that same breach have already started moving stolen funds into Zcash's shielded pool after NEAR blocked a $50 million swap attempt. A native ZEC route opening on THORChain right now isn't neutral timing, it's opening a new door into the exact privacy tool attackers are already using to go dark. What stands out to me is THORChain's actual defense, because it's more coherent than "we don't care about stolen funds." Their argument is that they're decentralized and permissionless the same way Bitcoin, Ethereum, and BNB Chain are, and they're asking what responsibility those networks carry when stolen funds pass through them too. That's a real question, not just a dodge, though it conveniently ignores that THORChain has selectively halted its own network before, a five-week suspension after a $10.7 million exploit in May. Worth being precise on scale, THORChain's own volume reportedly surged past $1.5 billion as this laundering activity has routed through it, so the ZEC pool is launching onto a network already seeing elevated flow tied to exactly this kind of use case. The open question isn't whether Zcash integration is technically significant for THORChain's roadmap, it clearly is. It's whether "permissionless by design" holds up as a principle once it's demonstrably the mechanism moving stolen funds in real time, or whether node operators eventually vote to intervene the way they did in May. $ZEC #BTC Price Analysis# #Altcoin Season# #Meme Alpha#
THORChain's long-planned Zcash integration, alongside Monero, Bittensor, and Dash, has been in development for months. But the timing lands right after THORChain publicly refused Bitget CEO Gracy Chen's request to block addresses linked to the exchange's $387.5 million hack, and separately, hackers from that same breach have already started moving stolen funds into Zcash's shielded pool after NEAR blocked a $50 million swap attempt. A native ZEC route opening on THORChain right now isn't neutral timing, it's opening a new door into the exact privacy tool attackers are already using to go dark. What stands out to me is THORChain's actual defense, because it's more coherent than "we don't care about stolen funds." Their argument is that they're decentralized and permissionless the same way Bitcoin, Ethereum, and BNB Chain are, and they're asking what responsibility those networks carry when stolen funds pass through them too. That's a real question, not just a dodge, though it conveniently ignores that THORChain has selectively halted its own network before, a five-week suspension after a $10.7 million exploit in May. Worth being precise on scale, THORChain's own volume reportedly surged past $1.5 billion as this laundering activity has routed through it, so the ZEC pool is launching onto a network already seeing elevated flow tied to exactly this kind of use case. The open question isn't whether Zcash integration is technically significant for THORChain's roadmap, it clearly is. It's whether "permissionless by design" holds up as a principle once it's demonstrably the mechanism moving stolen funds in real time, or whether node operators eventually vote to intervene the way they did in May. $ZEC #BTC Price Analysis# #Altcoin Season# #Meme Alpha#


47
·
--
$1.26 billion stolen while Bitcoin posted a 40% quarterly gain. Security losses and asset performance moved in completely opposite directions this quarter. CertiK's numbers are specific. Q3 losses hit $1.26 billion across 247 incidents, up 53.9% from $819.4 million in Q2, itself already a record before this quarter beat it. September alone accounted for $768.5 million, the worst month of 2026, with two incidents, Bitget and Liquid Network, making up 92% of that month's losses alone. What stands out to me is the Bitget number specifically, because it moved. The confirmed total is $387.5 million, up from an initial $351.6 million estimate once investigators traced the full extent of the transfers. Attackers exploited a vulnerability in a third-party security product to obtain internal credentials and forge withdrawal commands, not a smart contract bug, a supply-chain style compromise through trusted tooling. Worth adding the adjusted-loss context most headlines skip. Of September's $768 million, roughly $273 million was frozen or recovered, bringing adjusted losses to $495.3 million for the month. Real money, but less than the gross number once recovery's counted. The detail I find most useful, average losses per incident jumped from roughly $270,000 to $2.4 million, nearly 9x, while reported exposure from one emerging threat type climbed from $10.5 million to $124.2 million. Not more attacks happening, fewer, larger, more sophisticated ones succeeding. The open question isn't whether exchange security needs scrutiny, this quarter settles that. It's whether an industry posting its best prices of the year treats a record loss quarter as a wake-up call, or whether rising prices just mute the urgency again. #BTC Price Analysis# $BTC #Altcoin Season# $XAUt
$1.26 billion stolen while Bitcoin posted a 40% quarterly gain. Security losses and asset performance moved in completely opposite directions this quarter. CertiK's numbers are specific. Q3 losses hit $1.26 billion across 247 incidents, up 53.9% from $819.4 million in Q2, itself already a record before this quarter beat it. September alone accounted for $768.5 million, the worst month of 2026, with two incidents, Bitget and Liquid Network, making up 92% of that month's losses alone. What stands out to me is the Bitget number specifically, because it moved. The confirmed total is $387.5 million, up from an initial $351.6 million estimate once investigators traced the full extent of the transfers. Attackers exploited a vulnerability in a third-party security product to obtain internal credentials and forge withdrawal commands, not a smart contract bug, a supply-chain style compromise through trusted tooling. Worth adding the adjusted-loss context most headlines skip. Of September's $768 million, roughly $273 million was frozen or recovered, bringing adjusted losses to $495.3 million for the month. Real money, but less than the gross number once recovery's counted. The detail I find most useful, average losses per incident jumped from roughly $270,000 to $2.4 million, nearly 9x, while reported exposure from one emerging threat type climbed from $10.5 million to $124.2 million. Not more attacks happening, fewer, larger, more sophisticated ones succeeding. The open question isn't whether exchange security needs scrutiny, this quarter settles that. It's whether an industry posting its best prices of the year treats a record loss quarter as a wake-up call, or whether rising prices just mute the urgency again. #BTC Price Analysis# $BTC #Altcoin Season# $XAUt
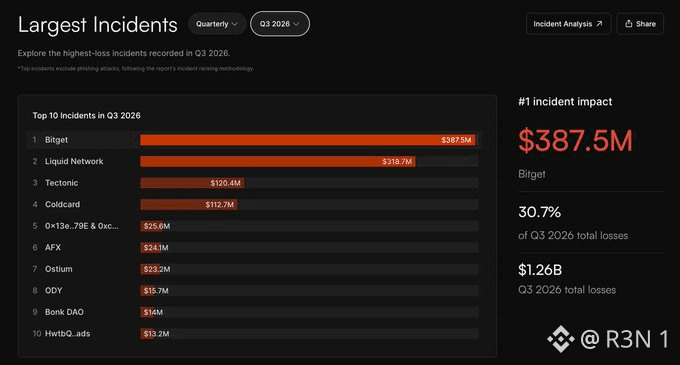
57
·
--
BTC falling 3% from current levels, roughly $84K down to about $81,500, puts price right inside the exact zone Coinglass flags as the trigger point, not near it, inside it. Per Coinglass, a break below $82,125 would set off $2.734 billion in cumulative long liquidations across mainstream exchanges. That's the leveraged long side, the crowd using margin to amplify this rally, and it's a genuinely large number relative to BTC's recent daily liquidation events this month, most of which have run in the hundreds of millions, not billions. Here's the detail that actually answers your question though. ETF buyers aren't in this liquidation conversation at all, structurally can't be. Spot ETF shares represent direct ownership, no leverage, no margin call, no liquidation price. The $999 million that came in on September 24 and the broader $2.4 billion Zhang cited entering ETFs this month sits completely outside this mechanism. A 3% dip doesn't force BlackRock's IBIT to sell anything, it might just mean slower inflows or modest outflows the next day, a demand question, not a forced liquidation event. So the honest answer is leveraged longs get liquidated first, and by a wide margin, ETF holders don't get liquidated in this scenario at all. The real risk for ETF buyers isn't forced selling, it's whether that $2.734 billion long liquidation cascade creates enough downside velocity that it changes sentiment and slows the inflow pace that's been supporting price. Worth noting the asymmetry above current price too, a break above $90,669 would trigger $1.122 billion in short liquidations, meaningfully smaller than the downside number. That imbalance itself is informative, the market's pricing more leveraged long exposure sitting below price than short exposure above it right now, which is exactly what you'd expect after a short-squeeze-driven rally like September's. #BTC Price Analysis# $BTC
BTC falling 3% from current levels, roughly $84K down to about $81,500, puts price right inside the exact zone Coinglass flags as the trigger point, not near it, inside it. Per Coinglass, a break below $82,125 would set off $2.734 billion in cumulative long liquidations across mainstream exchanges. That's the leveraged long side, the crowd using margin to amplify this rally, and it's a genuinely large number relative to BTC's recent daily liquidation events this month, most of which have run in the hundreds of millions, not billions. Here's the detail that actually answers your question though. ETF buyers aren't in this liquidation conversation at all, structurally can't be. Spot ETF shares represent direct ownership, no leverage, no margin call, no liquidation price. The $999 million that came in on September 24 and the broader $2.4 billion Zhang cited entering ETFs this month sits completely outside this mechanism. A 3% dip doesn't force BlackRock's IBIT to sell anything, it might just mean slower inflows or modest outflows the next day, a demand question, not a forced liquidation event. So the honest answer is leveraged longs get liquidated first, and by a wide margin, ETF holders don't get liquidated in this scenario at all. The real risk for ETF buyers isn't forced selling, it's whether that $2.734 billion long liquidation cascade creates enough downside velocity that it changes sentiment and slows the inflow pace that's been supporting price. Worth noting the asymmetry above current price too, a break above $90,669 would trigger $1.122 billion in short liquidations, meaningfully smaller than the downside number. That imbalance itself is informative, the market's pricing more leveraged long exposure sitting below price than short exposure above it right now, which is exactly what you'd expect after a short-squeeze-driven rally like September's. #BTC Price Analysis# $BTC
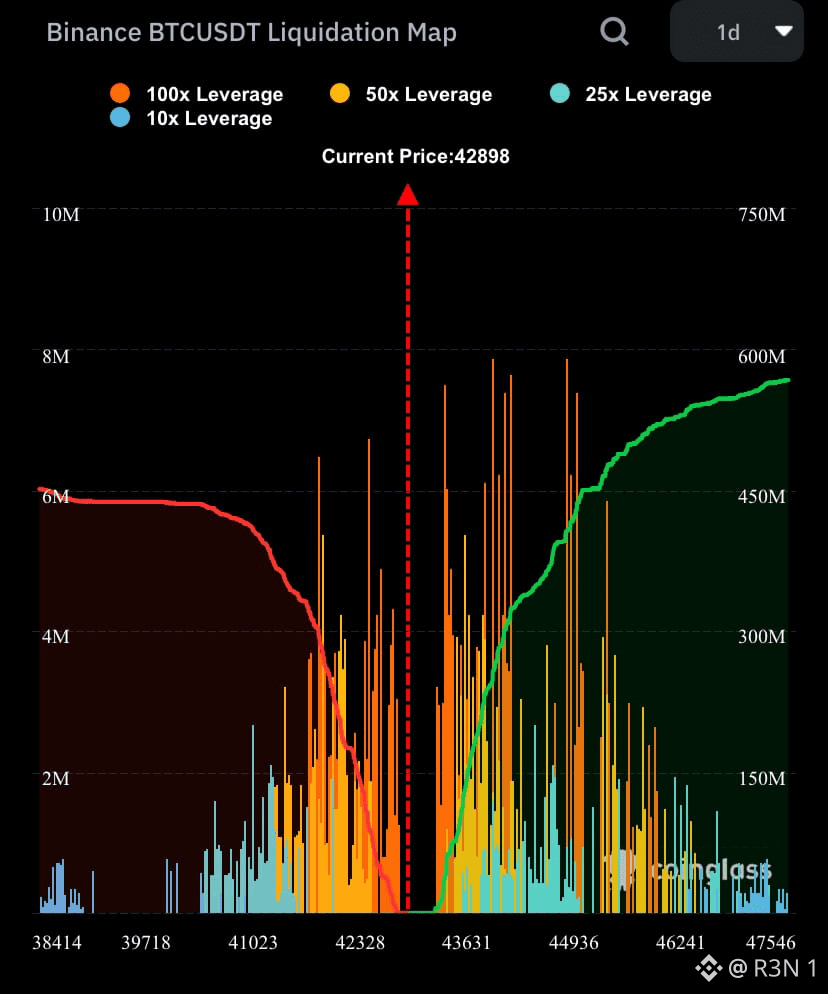
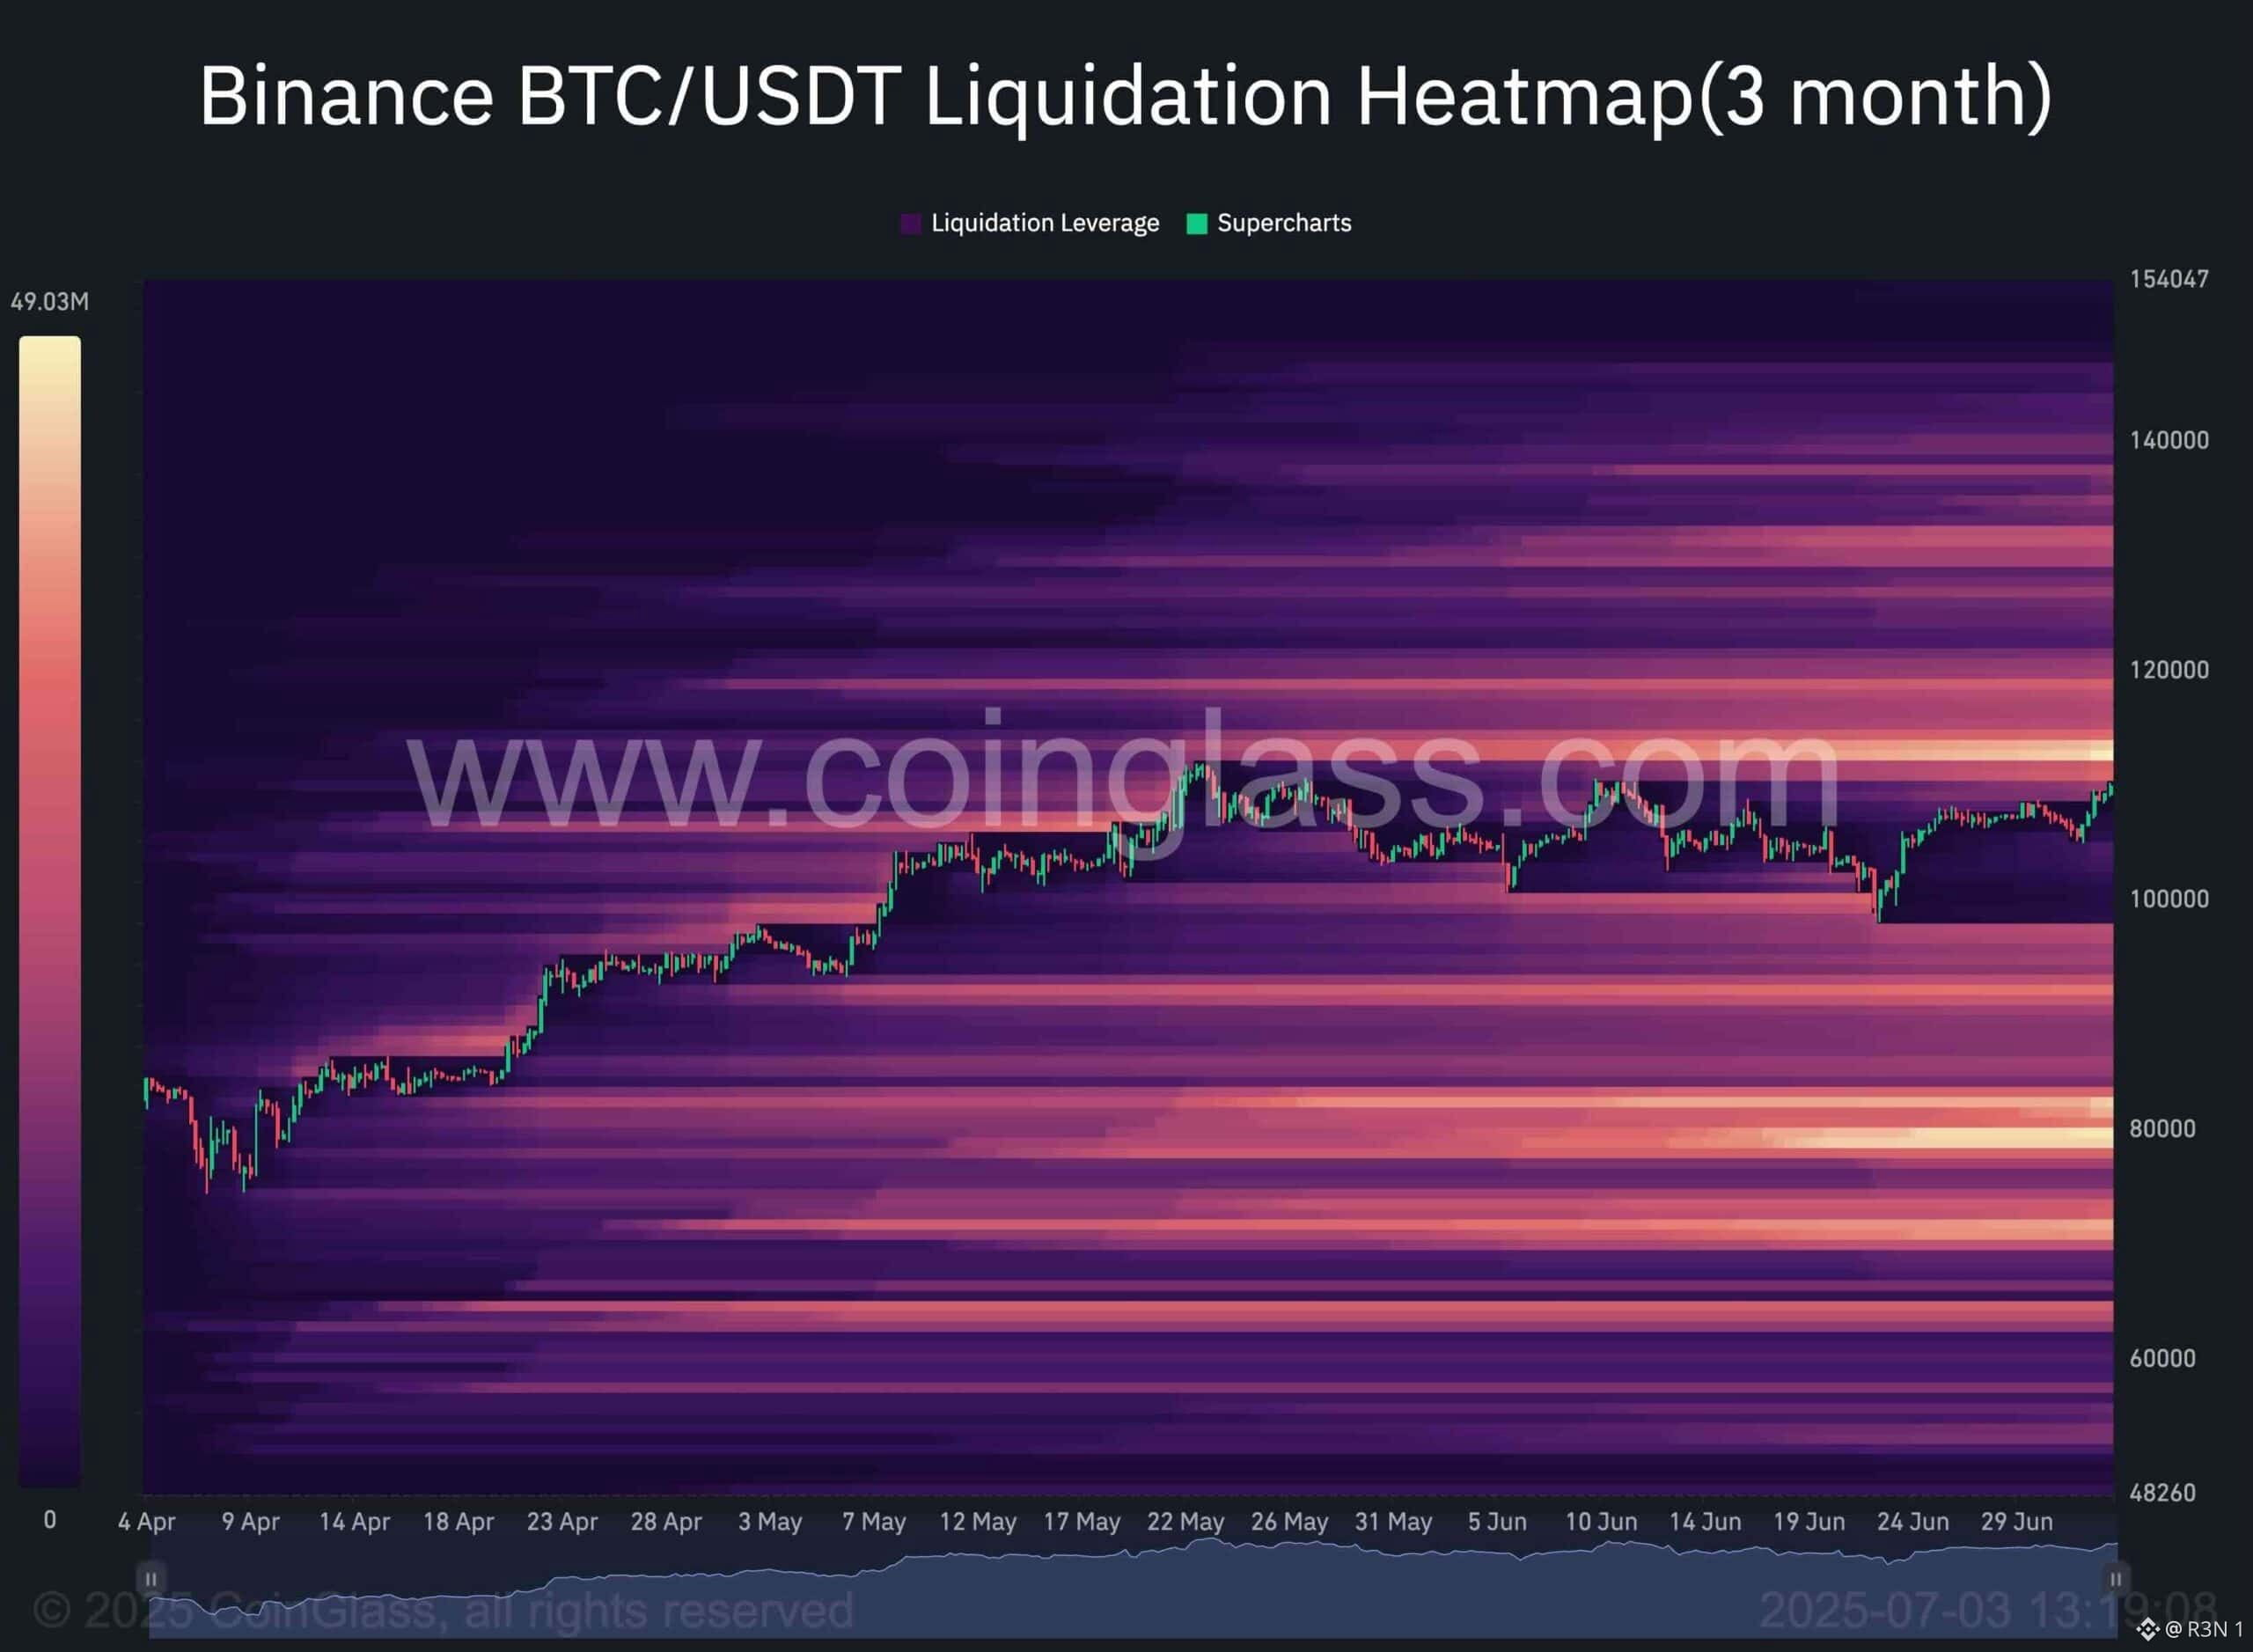
67
Connectez-vous pour découvrir plus de contenu
Rejoignez la communauté mondiale des adeptes de cryptomonnaies sur Binance Square
⚡️ Suviez les dernières informations importantes sur les cryptomonnaies.
💬 Jugé digne de confiance par la plus grande plateforme d’échange de cryptomonnaies au monde.
👍 Découvrez les connaissances que partagent les créateurs vérifiés.
Adresse e-mail/Nº de téléphone
Sujets d’actualité
ADAGains10%Above$0.27
12,337 vues
167 mentions
$ADA is making a strong move today jumping over 10 percent to around 027 and breaking into a new 90 day high
Trading volume has also surged above 1 billion showing strong market activity
The move comes as $ADA continues its recovery from the June lows while its recent technical structure has turned more bullish
The 027 to 028 zone is now the key area to watch A sustained breakout could open the door toward higher resistance levels
But after such a sharp daily move volatility could remain high
#ADAGains10%Above$0.27 #crypto #ADA #Cardano #crypto #Write2Earn
AbdullahAbid_7
·0 mentions J’aime
·344 vues
ETHUp70%InQ3ButLiquidityFalls
137,780 vues
996 mentions
EthStakingExitQueueHits2026High
48,518 vues
722 mentions