

TraderLeumas
62 Publications

TraderLeumas
Signaler
Bloquer l’utilisateur
I use market profile chart to analyse the market || the market turned me BULL indefinitely
Trade régulièrement
4.8 an(s)
12 Suivis
1.3K+ Abonnés
64 J’aime
Publications
Tous
Citations
PINNED
·
--

Article
BITCOIN WEEKLY ANALYSIS.Gm everyone.
This is the last week of the month, and welcome to another episode of my weekly article, where I share my thoughts on $BTC using both conventional charts and TPO charts. For those visiting for the first time, welcome. Without further ado, let’s jump in.
Monthly Timeframe (1M)
The bulls are still very much in control on the monthly timeframe. The market traded close to the 1/01 opening and saw a quick rejection. I referenced the 1/01 price area in last week’s article. The market is currently trading around the 83k range as of the time of writing.
Here is my thesis: if the monthly timeframe closes below the May high, I wouldn’t be surprised if the bears extend price down toward the 79k–80k area.
Intermediate Timeframe (1W)
On the intermediate timeframe, the bulls are still dominant and trying to hold the 82k price range, although the uptrend is still young. Selling may still continue below the 4/05 week high.
The market outperformed my expectations last week, which was very good in setting the tone for upward continuation. Although the market opened very weak, I’m expecting a close above the 4/05 week high.
Daily Timeframe (1D)
After a successful breakout from the 81.8k–82.8k range last week, the market traded close to the 1/01 high, as discussed earlier. Since the 21/09 high was established, sellers have been very active, driving price back down to the 83k area currently.
Short Term Timeframe (30m)
As stated earlier, sellers have been dominant for seven consecutive days in a row.
Weekly Profile Recap
The high established on Monday had excess, which was very significant in starting a new direction. The POC on that day did not migrate with price as price moved higher, which made the rally high questionable. I discussed it here:
Tuesday had a poor high and a poor low, both of which were repaired the next day. Buyers attempted to extend price above the 21/09 range but failed, leaving a poor high at the top. Sellers then extended the price range down to the 4/05 week high, leaving an excess low. The POC migrated with price as price moved lower, marking seller dominance in the market.
From Thursday through Saturday, short term sellers have been dominant in the market, which makes the current activity look weak.
Yesterday, buyers gained a little dominance but failed to extend price upward. The market built value above Saturday’s value area high.
Note: Short term timeframe traders, whether buyers or sellers, can move the market.
Today's Profile
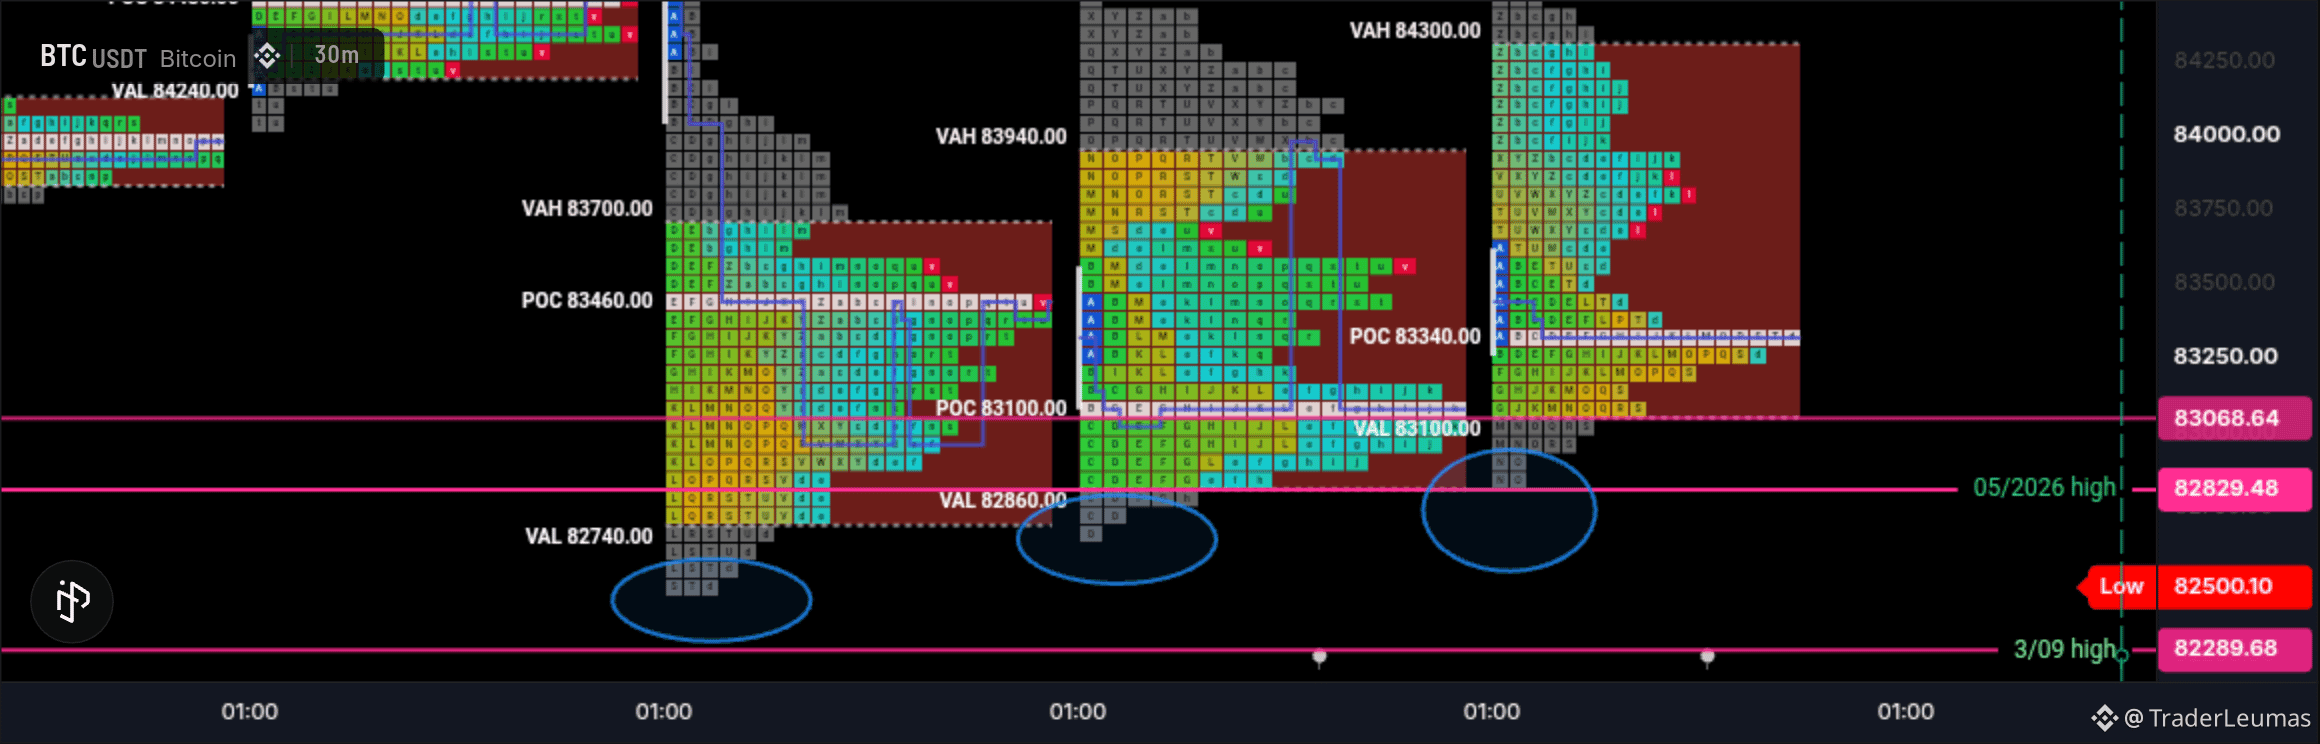
The market opened in the middle of the previous day’s value area. During A and B periods, buyers failed to extend the range past the previous day’s value area high, leaving excess and resulting in a low-confidence day. Sellers stepped in and drove the market lower. As stated earlier, the market has been dominated by sellers since last Wednesday.
I talked about the Wednesday mechanical low and how important it was for the structure of $BTC going forward. Fast forward to today, it has been repaired. This led me to question the 21/09 POC area, which was not revisited. I’m not saying the market must revisit that price area, but I think it is crucial, especially since there has been no clear sign of buyer strength and the market remains weak.
Possible Scenarios This Week
The 21/09 area may likely be revisited.21/09 single prints may be revisited.23/09 poor high may be revisited.
Key Trade Areas
High
27/09 poor high: 87.2k23/09 poor high: 82.2k21/09 single prints: need to be revisited
Low
21/09 POC area: 81.4k20/09 POC area: 80.34k
Thanks for reading.
I would like to know what you think about the market this week.
NFA: This is just my read on the market based on Market Profile structure and price action, not financial advice.
BITCOIN WEEKLY ANALYSIS.
Gm everyone.
This is the last week of the month, and welcome to another episode of my weekly article, where I share my thoughts on $BTC using both conventional charts and TPO charts. For those visiting for the first time, welcome. Without further ado, let’s jump in.
Monthly Timeframe (1M)
The bulls are still very much in control on the monthly timeframe. The market traded close to the 1/01 opening and saw a quick rejection. I referenced the 1/01 price area in last week’s article. The market is currently trading around the 83k range as of the time of writing.
Here is my thesis: if the monthly timeframe closes below the May high, I wouldn’t be surprised if the bears extend price down toward the 79k–80k area.
Intermediate Timeframe (1W)
On the intermediate timeframe, the bulls are still dominant and trying to hold the 82k price range, although the uptrend is still young. Selling may still continue below the 4/05 week high.
The market outperformed my expectations last week, which was very good in setting the tone for upward continuation. Although the market opened very weak, I’m expecting a close above the 4/05 week high.
Daily Timeframe (1D)
After a successful breakout from the 81.8k–82.8k range last week, the market traded close to the 1/01 high, as discussed earlier. Since the 21/09 high was established, sellers have been very active, driving price back down to the 83k area currently.
Short Term Timeframe (30m)
As stated earlier, sellers have been dominant for seven consecutive days in a row.
Weekly Profile Recap
The high established on Monday had excess, which was very significant in starting a new direction. The POC on that day did not migrate with price as price moved higher, which made the rally high questionable. I discussed it here:
Tuesday had a poor high and a poor low, both of which were repaired the next day. Buyers attempted to extend price above the 21/09 range but failed, leaving a poor high at the top. Sellers then extended the price range down to the 4/05 week high, leaving an excess low. The POC migrated with price as price moved lower, marking seller dominance in the market.
From Thursday through Saturday, short term sellers have been dominant in the market, which makes the current activity look weak.
Yesterday, buyers gained a little dominance but failed to extend price upward. The market built value above Saturday’s value area high.
Note: Short term timeframe traders, whether buyers or sellers, can move the market.
Today's Profile
The market opened in the middle of the previous day’s value area. During A and B periods, buyers failed to extend the range past the previous day’s value area high, leaving excess and resulting in a low-confidence day. Sellers stepped in and drove the market lower. As stated earlier, the market has been dominated by sellers since last Wednesday.
I talked about the Wednesday mechanical low and how important it was for the structure of $BTC going forward. Fast forward to today, it has been repaired. This led me to question the 21/09 POC area, which was not revisited. I’m not saying the market must revisit that price area, but I think it is crucial, especially since there has been no clear sign of buyer strength and the market remains weak.
Possible Scenarios This Week
The 21/09 area may likely be revisited.21/09 single prints may be revisited.23/09 poor high may be revisited.
Key Trade Areas
High
27/09 poor high: 87.2k23/09 poor high: 82.2k21/09 single prints: need to be revisited
Low
21/09 POC area: 81.4k20/09 POC area: 80.34k
Thanks for reading.
I would like to know what you think about the market this week.
NFA: This is just my read on the market based on Market Profile structure and price action, not financial advice.
This is the last week of the month, and welcome to another episode of my weekly article, where I share my thoughts on $BTC using both conventional charts and TPO charts. For those visiting for the first time, welcome. Without further ado, let’s jump in.
Monthly Timeframe (1M)
The bulls are still very much in control on the monthly timeframe. The market traded close to the 1/01 opening and saw a quick rejection. I referenced the 1/01 price area in last week’s article. The market is currently trading around the 83k range as of the time of writing.
Here is my thesis: if the monthly timeframe closes below the May high, I wouldn’t be surprised if the bears extend price down toward the 79k–80k area.
Intermediate Timeframe (1W)
On the intermediate timeframe, the bulls are still dominant and trying to hold the 82k price range, although the uptrend is still young. Selling may still continue below the 4/05 week high.
The market outperformed my expectations last week, which was very good in setting the tone for upward continuation. Although the market opened very weak, I’m expecting a close above the 4/05 week high.
Daily Timeframe (1D)
After a successful breakout from the 81.8k–82.8k range last week, the market traded close to the 1/01 high, as discussed earlier. Since the 21/09 high was established, sellers have been very active, driving price back down to the 83k area currently.
Short Term Timeframe (30m)
As stated earlier, sellers have been dominant for seven consecutive days in a row.
Weekly Profile Recap
The high established on Monday had excess, which was very significant in starting a new direction. The POC on that day did not migrate with price as price moved higher, which made the rally high questionable. I discussed it here:
Tuesday had a poor high and a poor low, both of which were repaired the next day. Buyers attempted to extend price above the 21/09 range but failed, leaving a poor high at the top. Sellers then extended the price range down to the 4/05 week high, leaving an excess low. The POC migrated with price as price moved lower, marking seller dominance in the market.
From Thursday through Saturday, short term sellers have been dominant in the market, which makes the current activity look weak.
Yesterday, buyers gained a little dominance but failed to extend price upward. The market built value above Saturday’s value area high.
Note: Short term timeframe traders, whether buyers or sellers, can move the market.
Today's Profile
The market opened in the middle of the previous day’s value area. During A and B periods, buyers failed to extend the range past the previous day’s value area high, leaving excess and resulting in a low-confidence day. Sellers stepped in and drove the market lower. As stated earlier, the market has been dominated by sellers since last Wednesday.
I talked about the Wednesday mechanical low and how important it was for the structure of $BTC going forward. Fast forward to today, it has been repaired. This led me to question the 21/09 POC area, which was not revisited. I’m not saying the market must revisit that price area, but I think it is crucial, especially since there has been no clear sign of buyer strength and the market remains weak.
Possible Scenarios This Week
The 21/09 area may likely be revisited.21/09 single prints may be revisited.23/09 poor high may be revisited.
Key Trade Areas
High
27/09 poor high: 87.2k23/09 poor high: 82.2k21/09 single prints: need to be revisited
Low
21/09 POC area: 81.4k20/09 POC area: 80.34k
Thanks for reading.
I would like to know what you think about the market this week.
NFA: This is just my read on the market based on Market Profile structure and price action, not financial advice.
3
5
706
·
--
1
244
·
--

Article
From Zero to 1.3K Followers on Binance SquareWhen I started creating on Binance Square, I did not know how far the journey would take me. I simply decided to share my thoughts, provide value, and remain consistent.
Reaching 1.3K followers is especially meaningful to me because this is the first time I have reached 1.3K followers on any social media platform. I have created content on other platforms, including X, but Binance Square is the first platform where my audience has grown to this level.
The Encouragement That Started It.
Before I joined Binance Square, @Beca reached out to me through X. She told me that she liked the content I was creating on X and encouraged me to share similar content on Binance Square.
Her message gave me the confidence to try the platform. I also read her article about growing on Binance Square, and it helped me understand the platform better and gave me practical ideas for starting my journey.
I’m grateful for that encouragement because it introduced me to an opportunity I might not have explored on my own. I took the advice, started creating, and began my journey from zero.
Reaching My First 100 Followers.
At the beginning, growth was gradual. It took me one month and two weeks to reach my first 100 followers.
Although it took time, that milestone was important to me. It proved that people were discovering my content, reading my posts, and finding enough value to follow me.
The Growth Started Accelerating
After reaching 100 followers, my growth began to increase quickly. I moved from 100 to 181 followers, then to 245 followers shortly afterward.
The funny thing is that I was posting only once a day. I was not flooding the platform with content or posting several times daily. I focused on making each post meaningful and consistent.
That experience taught me that quality and consistency can matter more than posting volume. Binance encourages creators to publish original, informative, truthful, and meaningful content.
One of the most important parts of my content journey has been my weekly Bitcoin analysis.
So far, I have written six weekly BTC analysis articles. These articles allow me to study the market, organize my thoughts, explain my perspective, and share what I observe with the community.
Writing weekly analysis has also helped me become more disciplined. Instead of simply reacting emotionally to every market movement, I take time to examine the broader picture and present my ideas in a structured way.
My goal is not to tell people exactly what to buy or sell. It is to share my personal analysis, encourage people to think critically, and remind everyone to do their own research.
From 245 to 1K
The momentum continued, and I eventually reached 1,000 followers. Shortly afterward, the number increased to 1.3K followers.
This showed me that growth does not always happen at a steady pace. Sometimes the beginning feels slow, but consistent effort can create momentum. One useful post can reach new people, start conversations, and bring in followers long after it is published.
what i have learned
My journey has taught me several important lessons:You do not need to post many times every day.One valuable post daily can be enough to build momentum.Consistency is more important than trying to be perfect.Sharing mistakes can be as valuable as sharing successes.Content should provide value instead of simply asking people to follow.Engagement matters, so respond to comments and join meaningful discussions.Study what works, but keep your content original.Growth may be slow at first, but patience can lead to surprising results.Support and encouragement from the right person can help you take the first step.
I also learned the importance of proper research, honesty, and responsible communication. Binance’s Community Guidelines encourage creators to do their own research, structure their ideas clearly, share personal views honestly, and contribute positively to the community
The Journey Continues
Reaching 1.3K followers is not the end of the journey. It is a reminder that the process is working and that there is still more to learn and improve.
This is my first 1.3K followers on any platform, so I truly appreciate everyone who followed me, read my weekly BTC analysis, engaged with my posts, and supported my journey.
I am also grateful to @Beca for encouraging me to bring my content from X to Binance Square. Her message opened the door to a platform where I have continued learning, writing, and growing.
If you are just starting on Binance Square, do not be discouraged by slow growth. Start with what you know, post consistently, learn from your results, share your lessons honestly, and keep improving.
You may be closer to a breakthrough than you think.
From Zero to 1.3K Followers on Binance Square
When I started creating on Binance Square, I did not know how far the journey would take me. I simply decided to share my thoughts, provide value, and remain consistent.
Reaching 1.3K followers is especially meaningful to me because this is the first time I have reached 1.3K followers on any social media platform. I have created content on other platforms, including X, but Binance Square is the first platform where my audience has grown to this level.
The Encouragement That Started It.
Before I joined Binance Square, @Beca酱 reached out to me through X. She told me that she liked the content I was creating on X and encouraged me to share similar content on Binance Square.
Her message gave me the confidence to try the platform. I also read her article about growing on Binance Square, and it helped me understand the platform better and gave me practical ideas for starting my journey.
I’m grateful for that encouragement because it introduced me to an opportunity I might not have explored on my own. I took the advice, started creating, and began my journey from zero.
Reaching My First 100 Followers.
At the beginning, growth was gradual. It took me one month and two weeks to reach my first 100 followers.
Although it took time, that milestone was important to me. It proved that people were discovering my content, reading my posts, and finding enough value to follow me.
The Growth Started Accelerating
After reaching 100 followers, my growth began to increase quickly. I moved from 100 to 181 followers, then to 245 followers shortly afterward.
The funny thing is that I was posting only once a day. I was not flooding the platform with content or posting several times daily. I focused on making each post meaningful and consistent.
That experience taught me that quality and consistency can matter more than posting volume. Binance encourages creators to publish original, informative, truthful, and meaningful content.
One of the most important parts of my content journey has been my weekly Bitcoin analysis.
So far, I have written six weekly BTC analysis articles. These articles allow me to study the market, organize my thoughts, explain my perspective, and share what I observe with the community.
Writing weekly analysis has also helped me become more disciplined. Instead of simply reacting emotionally to every market movement, I take time to examine the broader picture and present my ideas in a structured way.
My goal is not to tell people exactly what to buy or sell. It is to share my personal analysis, encourage people to think critically, and remind everyone to do their own research.
From 245 to 1K
The momentum continued, and I eventually reached 1,000 followers. Shortly afterward, the number increased to 1.3K followers.
This showed me that growth does not always happen at a steady pace. Sometimes the beginning feels slow, but consistent effort can create momentum. One useful post can reach new people, start conversations, and bring in followers long after it is published.
what i have learned
My journey has taught me several important lessons:You do not need to post many times every day.One valuable post daily can be enough to build momentum.Consistency is more important than trying to be perfect.Sharing mistakes can be as valuable as sharing successes.Content should provide value instead of simply asking people to follow.Engagement matters, so respond to comments and join meaningful discussions.Study what works, but keep your content original.Growth may be slow at first, but patience can lead to surprising results.Support and encouragement from the right person can help you take the first step.
I also learned the importance of proper research, honesty, and responsible communication. Binance’s Community Guidelines encourage creators to do their own research, structure their ideas clearly, share personal views honestly, and contribute positively to the community
The Journey Continues
Reaching 1.3K followers is not the end of the journey. It is a reminder that the process is working and that there is still more to learn and improve.
This is my first 1.3K followers on any platform, so I truly appreciate everyone who followed me, read my weekly BTC analysis, engaged with my posts, and supported my journey.
I am also grateful to @Beca酱 for encouraging me to bring my content from X to Binance Square. Her message opened the door to a platform where I have continued learning, writing, and growing.
If you are just starting on Binance Square, do not be discouraged by slow growth. Start with what you know, post consistently, learn from your results, share your lessons honestly, and keep improving.
You may be closer to a breakthrough than you think.
Reaching 1.3K followers is especially meaningful to me because this is the first time I have reached 1.3K followers on any social media platform. I have created content on other platforms, including X, but Binance Square is the first platform where my audience has grown to this level.
The Encouragement That Started It.
Before I joined Binance Square, @Beca酱 reached out to me through X. She told me that she liked the content I was creating on X and encouraged me to share similar content on Binance Square.
Her message gave me the confidence to try the platform. I also read her article about growing on Binance Square, and it helped me understand the platform better and gave me practical ideas for starting my journey.
I’m grateful for that encouragement because it introduced me to an opportunity I might not have explored on my own. I took the advice, started creating, and began my journey from zero.
Reaching My First 100 Followers.
At the beginning, growth was gradual. It took me one month and two weeks to reach my first 100 followers.
Although it took time, that milestone was important to me. It proved that people were discovering my content, reading my posts, and finding enough value to follow me.
The Growth Started Accelerating
After reaching 100 followers, my growth began to increase quickly. I moved from 100 to 181 followers, then to 245 followers shortly afterward.
The funny thing is that I was posting only once a day. I was not flooding the platform with content or posting several times daily. I focused on making each post meaningful and consistent.
That experience taught me that quality and consistency can matter more than posting volume. Binance encourages creators to publish original, informative, truthful, and meaningful content.
One of the most important parts of my content journey has been my weekly Bitcoin analysis.
So far, I have written six weekly BTC analysis articles. These articles allow me to study the market, organize my thoughts, explain my perspective, and share what I observe with the community.
Writing weekly analysis has also helped me become more disciplined. Instead of simply reacting emotionally to every market movement, I take time to examine the broader picture and present my ideas in a structured way.
My goal is not to tell people exactly what to buy or sell. It is to share my personal analysis, encourage people to think critically, and remind everyone to do their own research.
From 245 to 1K
The momentum continued, and I eventually reached 1,000 followers. Shortly afterward, the number increased to 1.3K followers.
This showed me that growth does not always happen at a steady pace. Sometimes the beginning feels slow, but consistent effort can create momentum. One useful post can reach new people, start conversations, and bring in followers long after it is published.
what i have learned
My journey has taught me several important lessons:You do not need to post many times every day.One valuable post daily can be enough to build momentum.Consistency is more important than trying to be perfect.Sharing mistakes can be as valuable as sharing successes.Content should provide value instead of simply asking people to follow.Engagement matters, so respond to comments and join meaningful discussions.Study what works, but keep your content original.Growth may be slow at first, but patience can lead to surprising results.Support and encouragement from the right person can help you take the first step.
I also learned the importance of proper research, honesty, and responsible communication. Binance’s Community Guidelines encourage creators to do their own research, structure their ideas clearly, share personal views honestly, and contribute positively to the community
The Journey Continues
Reaching 1.3K followers is not the end of the journey. It is a reminder that the process is working and that there is still more to learn and improve.
This is my first 1.3K followers on any platform, so I truly appreciate everyone who followed me, read my weekly BTC analysis, engaged with my posts, and supported my journey.
I am also grateful to @Beca酱 for encouraging me to bring my content from X to Binance Square. Her message opened the door to a platform where I have continued learning, writing, and growing.
If you are just starting on Binance Square, do not be discouraged by slow growth. Start with what you know, post consistently, learn from your results, share your lessons honestly, and keep improving.
You may be closer to a breakthrough than you think.
125
·
--
$BTC Profile Update
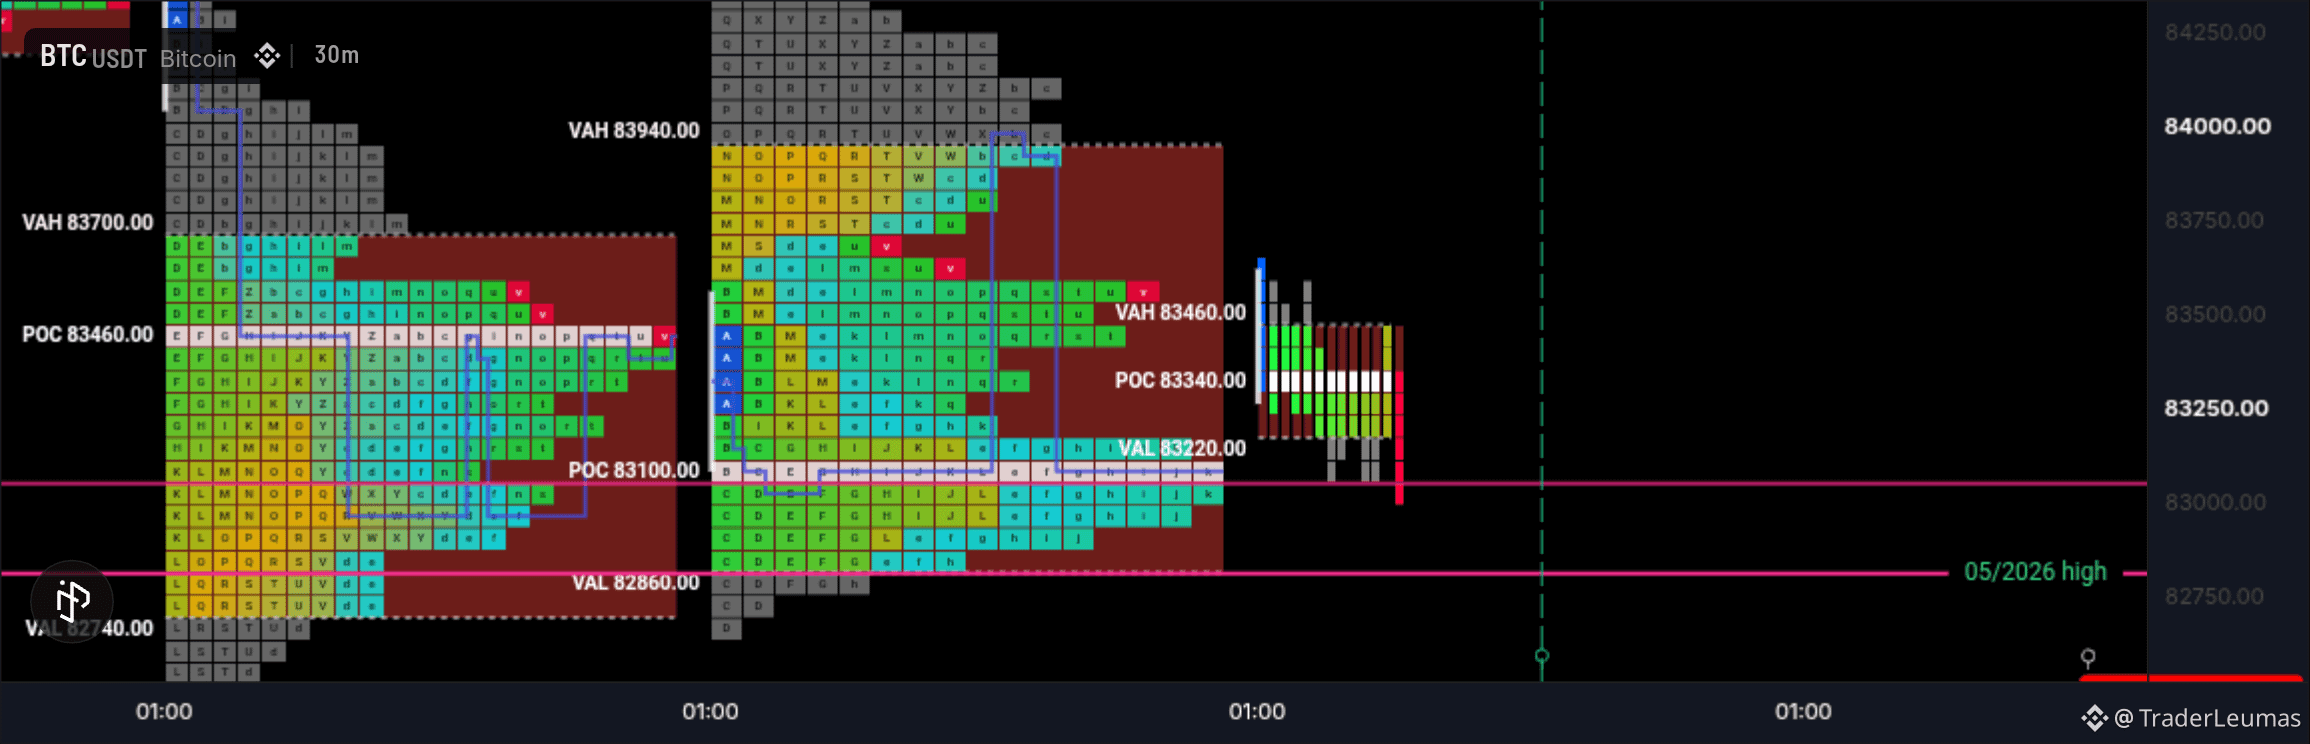
The market opened close to the previous day’s value area high, similar to yesterday’s open. Since the open, the market has been trading back and forth, which suggests low market confidence.
The current low is a mechanical low, even though it has 3 wide, because there is a specific way to treat 3 wide structures.
The lows from the last two days have been poor, and buyers have been weak, so I’m expecting a downside breakout that may repair the lows established over the last two sessions. Today should likely be a rotational day.
$BTC Profile Update
The market opened close to the previous day’s value area high, similar to yesterday’s open. Since the open, the market has been trading back and forth, which suggests low market confidence.
The current low is a mechanical low, even though it has 3 wide, because there is a specific way to treat 3 wide structures.
The lows from the last two days have been poor, and buyers have been weak, so I’m expecting a downside breakout that may repair the lows established over the last two sessions. Today should likely be a rotational day.
The market opened close to the previous day’s value area high, similar to yesterday’s open. Since the open, the market has been trading back and forth, which suggests low market confidence.
The current low is a mechanical low, even though it has 3 wide, because there is a specific way to treat 3 wide structures.
The lows from the last two days have been poor, and buyers have been weak, so I’m expecting a downside breakout that may repair the lows established over the last two sessions. Today should likely be a rotational day.
6
3
1k
·
--
4
686
·
--
$BTC Profile Update
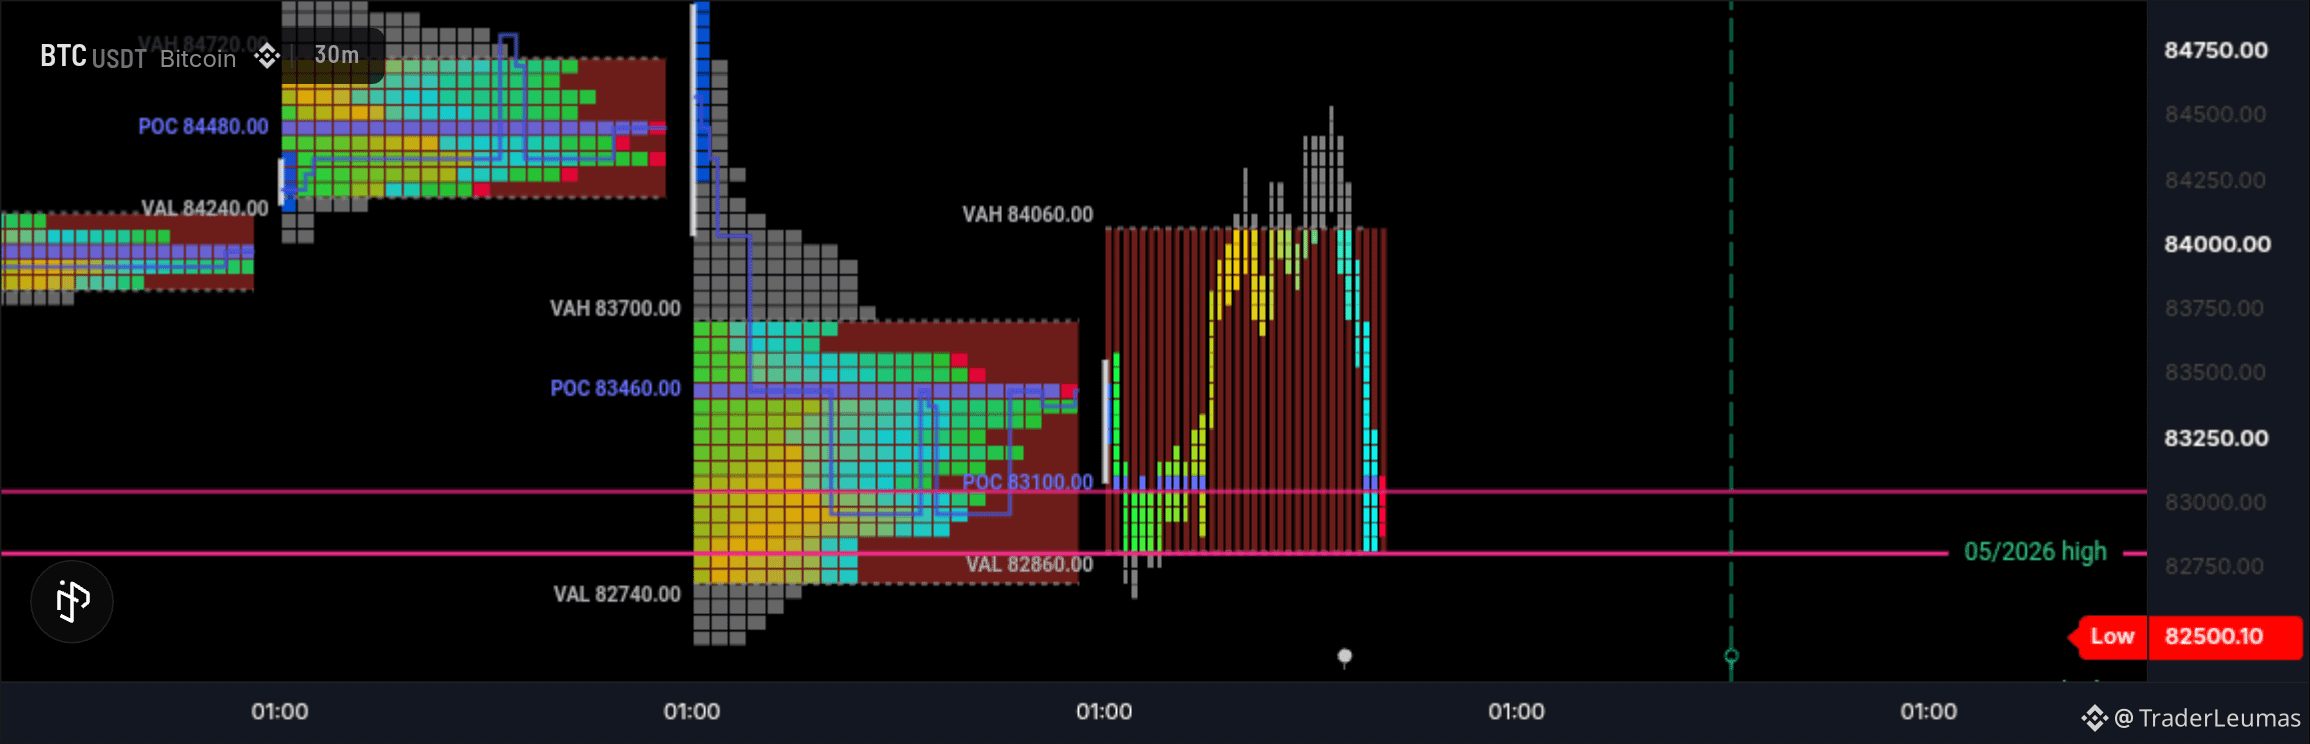
The market opened close to the previous day’s value area high. During the first few periods, it one timeframed lower down to the 4/05 week range high, which is an important reference.
From F period, the market began one timeframing higher and formed a poor low. The current high has excess.
Short term sellers are still very active in the market, so from the open I’m expecting a rotational day that offers good risk-reward if positioned well.
I'm keeping an eyes on the previous day low
$BTC Profile Update
The market opened close to the previous day’s value area high. During the first few periods, it one timeframed lower down to the 4/05 week range high, which is an important reference.
From F period, the market began one timeframing higher and formed a poor low. The current high has excess.
Short term sellers are still very active in the market, so from the open I’m expecting a rotational day that offers good risk-reward if positioned well.
I'm keeping an eyes on the previous day low
The market opened close to the previous day’s value area high. During the first few periods, it one timeframed lower down to the 4/05 week range high, which is an important reference.
From F period, the market began one timeframing higher and formed a poor low. The current high has excess.
Short term sellers are still very active in the market, so from the open I’m expecting a rotational day that offers good risk-reward if positioned well.
I'm keeping an eyes on the previous day low
4
2
1.2k
·
--
Update on yesterday’s $BTC profile
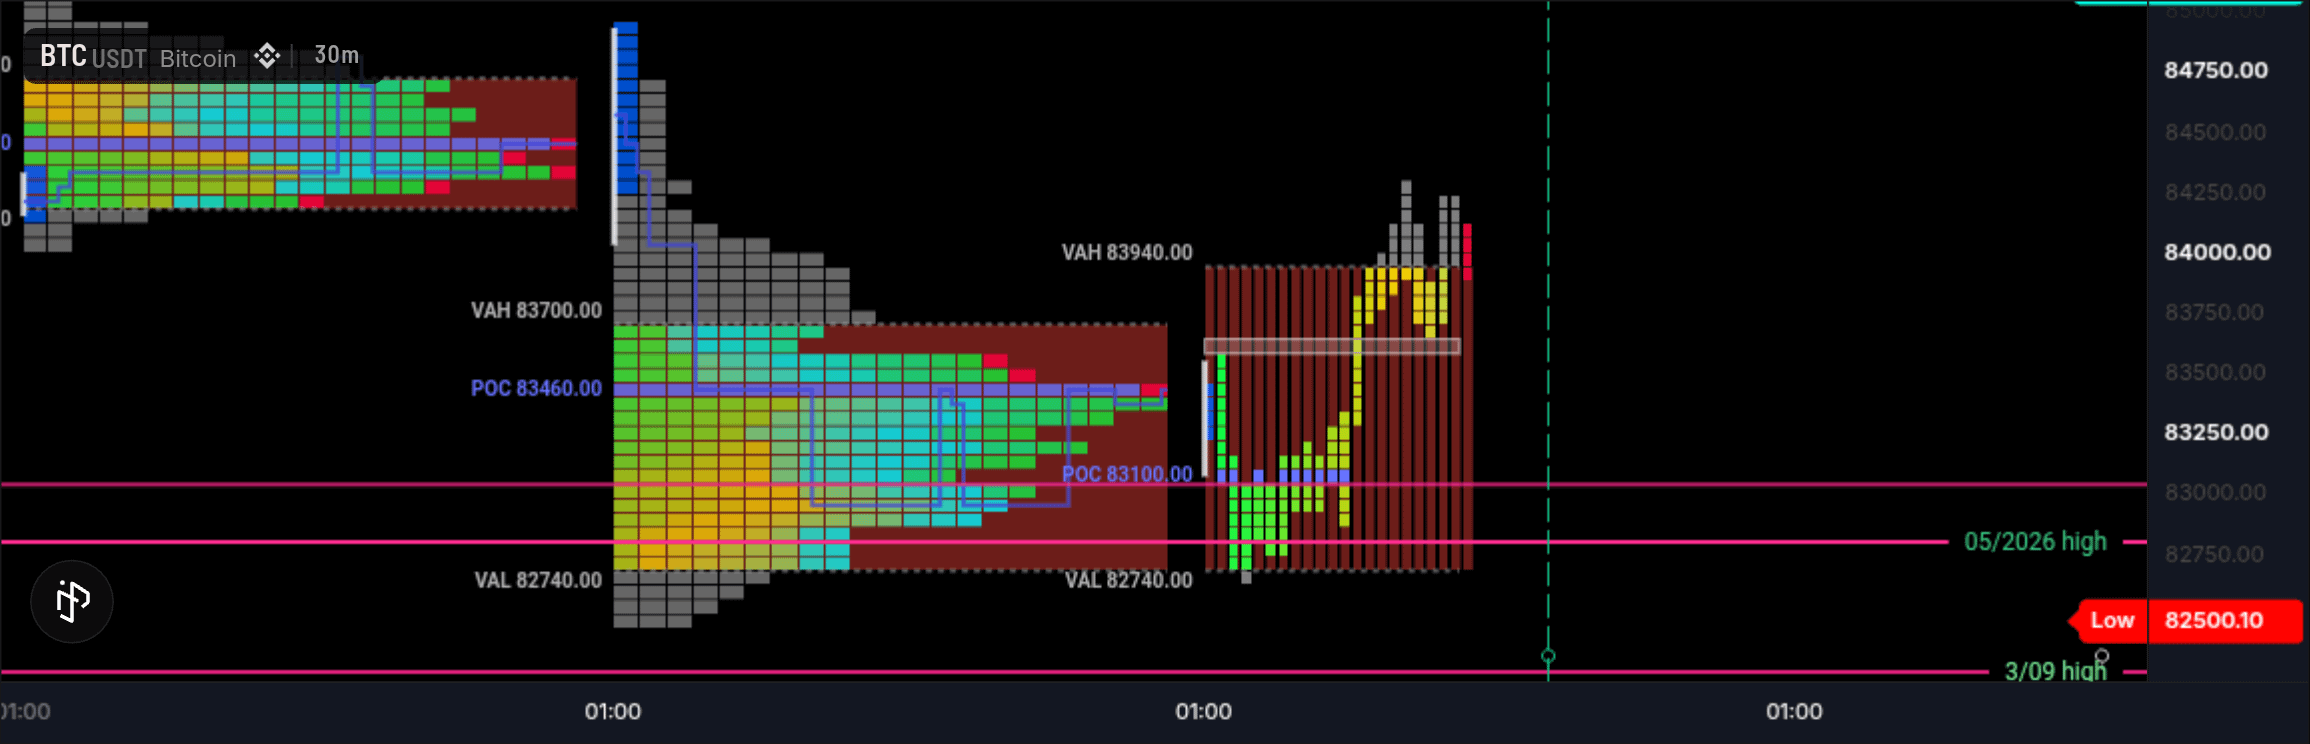
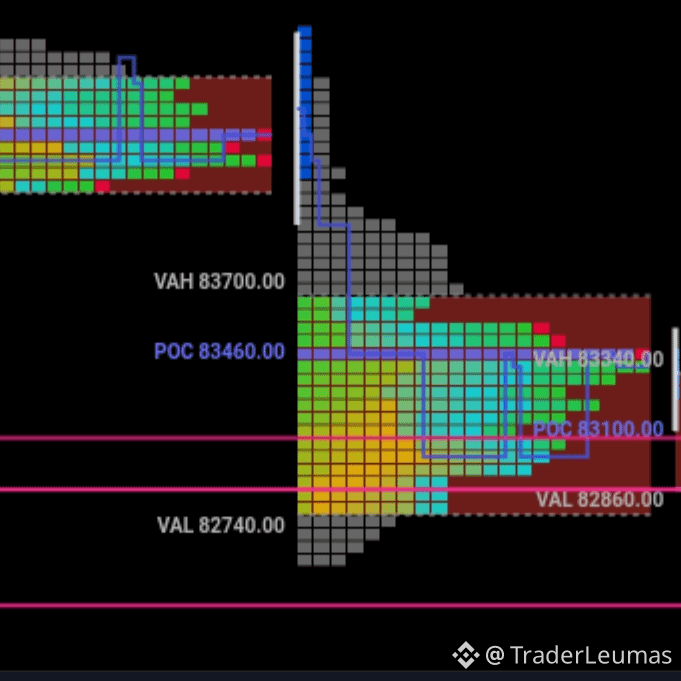
The bulls are clearly holding the 82.5k range, and the previous day’s profile had a 3 wide at the low. The POC migrated from near the low back to the middle of the profile.
The previous day built value below Sunday’s value area low, and yesterday’s profile had a classic b shape, which suggests more longs were being liquidated in the market.
Update on yesterday’s $BTC profile
The bulls are clearly holding the 82.5k range, and the previous day’s profile had a 3 wide at the low. The POC migrated from near the low back to the middle of the profile.
The previous day built value below Sunday’s value area low, and yesterday’s profile had a classic b shape, which suggests more longs were being liquidated in the market.
The bulls are clearly holding the 82.5k range, and the previous day’s profile had a 3 wide at the low. The POC migrated from near the low back to the middle of the profile.
The previous day built value below Sunday’s value area low, and yesterday’s profile had a classic b shape, which suggests more longs were being liquidated in the market.
3
1
684
·
--
$BTC profile update.
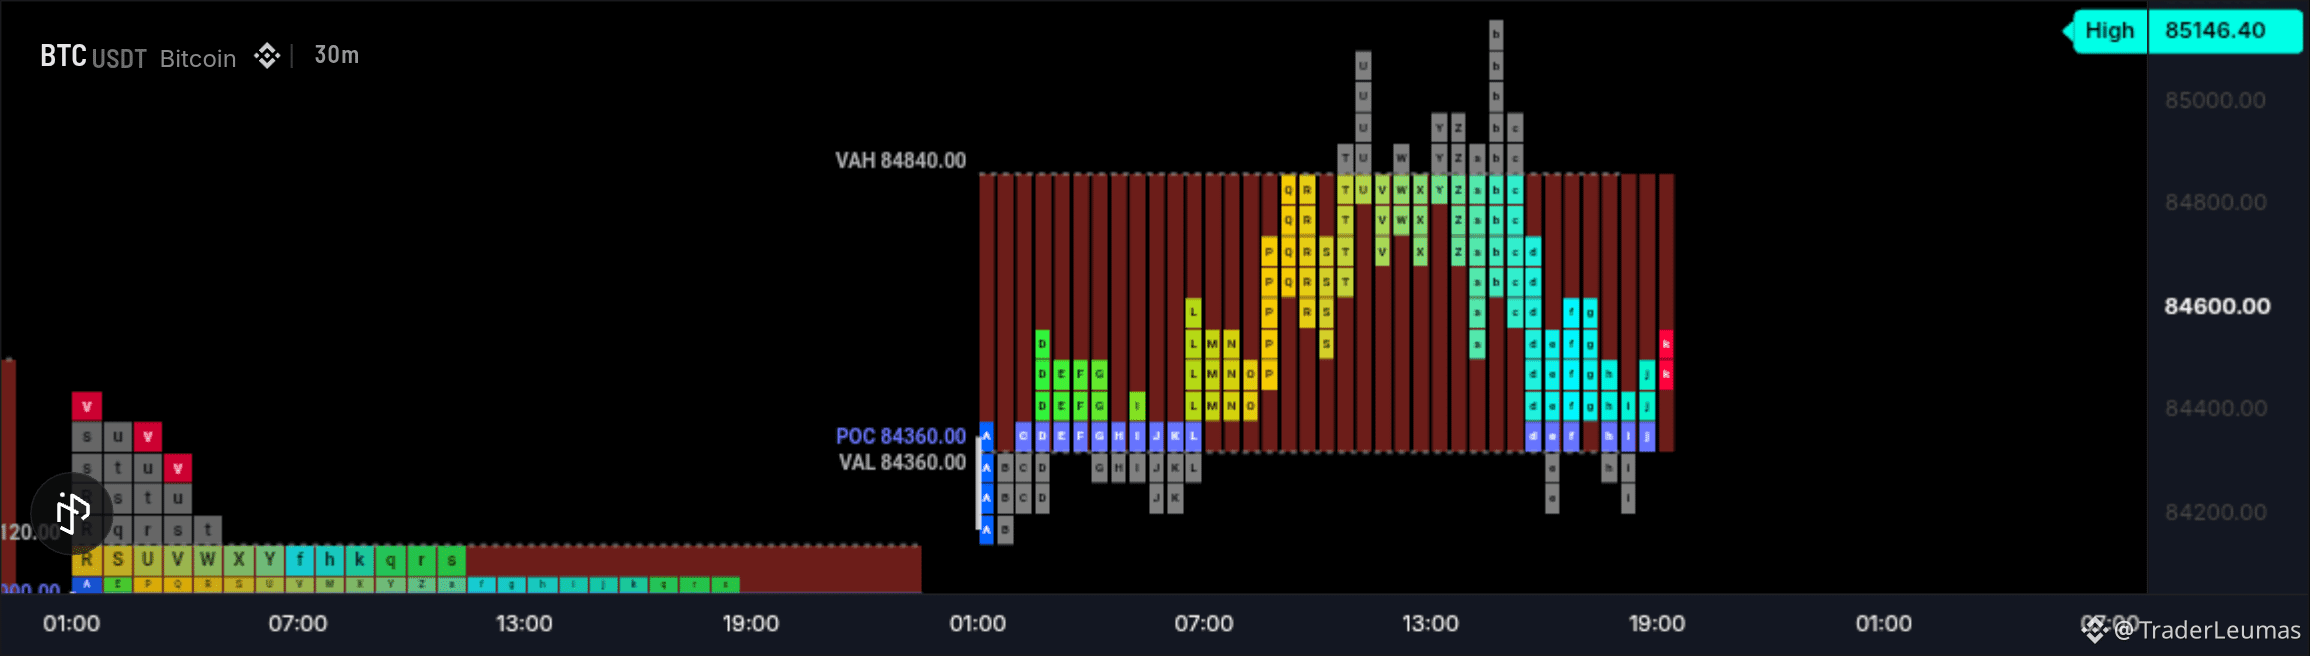
The market opened above the previous day’s value area high and showed low confidence in the first few periods. It later one timeframed higher, taking out the previous day’s poor high.
The POC did not migrate with price as the market moved higher.
Market Observation
The profile printed a 3 wide at the low, along with a poor low, and did not revisit the previous day’s POC area, which was too wide.
The profile structure is truncated, and both buyers and sellers were active in the market.
$BTC profile update.
The market opened above the previous day’s value area high and showed low confidence in the first few periods. It later one timeframed higher, taking out the previous day’s poor high.
The POC did not migrate with price as the market moved higher.
Market Observation
The profile printed a 3 wide at the low, along with a poor low, and did not revisit the previous day’s POC area, which was too wide.
The profile structure is truncated, and both buyers and sellers were active in the market.
The market opened above the previous day’s value area high and showed low confidence in the first few periods. It later one timeframed higher, taking out the previous day’s poor high.
The POC did not migrate with price as the market moved higher.
Market Observation
The profile printed a 3 wide at the low, along with a poor low, and did not revisit the previous day’s POC area, which was too wide.
The profile structure is truncated, and both buyers and sellers were active in the market.
3
3
746
·
--
$BTC profile update..
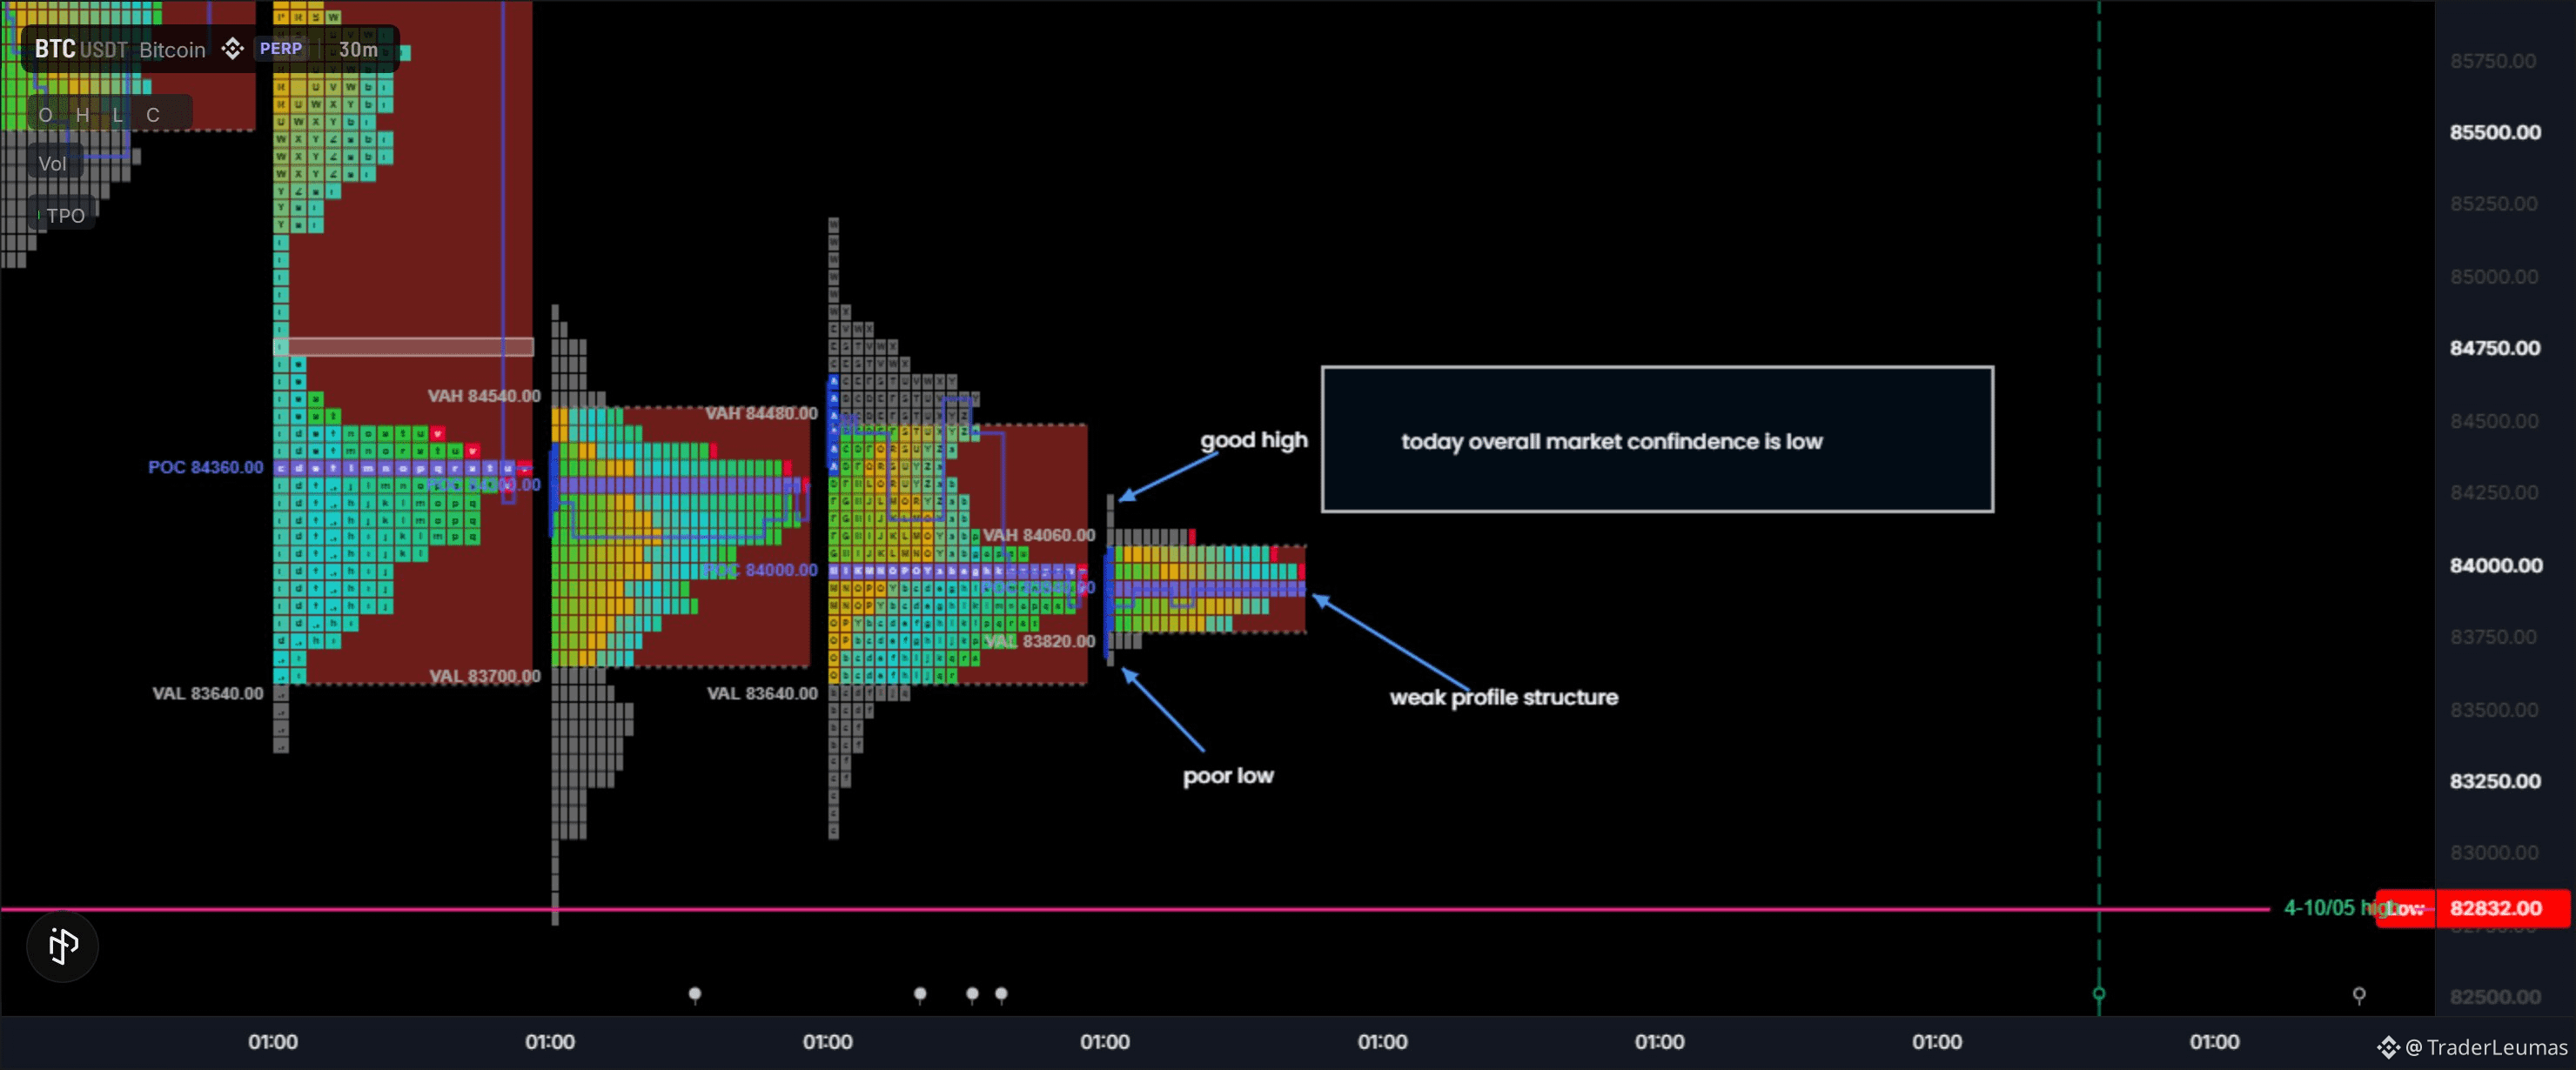
nothing much from today's market, but here is a quick one: the market confidence from the opening has been low, with most trade occurring close to the middle of the previous day value area.
i also expect tomorrow to behave the same.
$BTC profile update..
nothing much from today's market, but here is a quick one: the market confidence from the opening has been low, with most trade occurring close to the middle of the previous day value area.
i also expect tomorrow to behave the same.
nothing much from today's market, but here is a quick one: the market confidence from the opening has been low, with most trade occurring close to the middle of the previous day value area.
i also expect tomorrow to behave the same.
8
1
11
2.1k
·
--
$BTC profile update
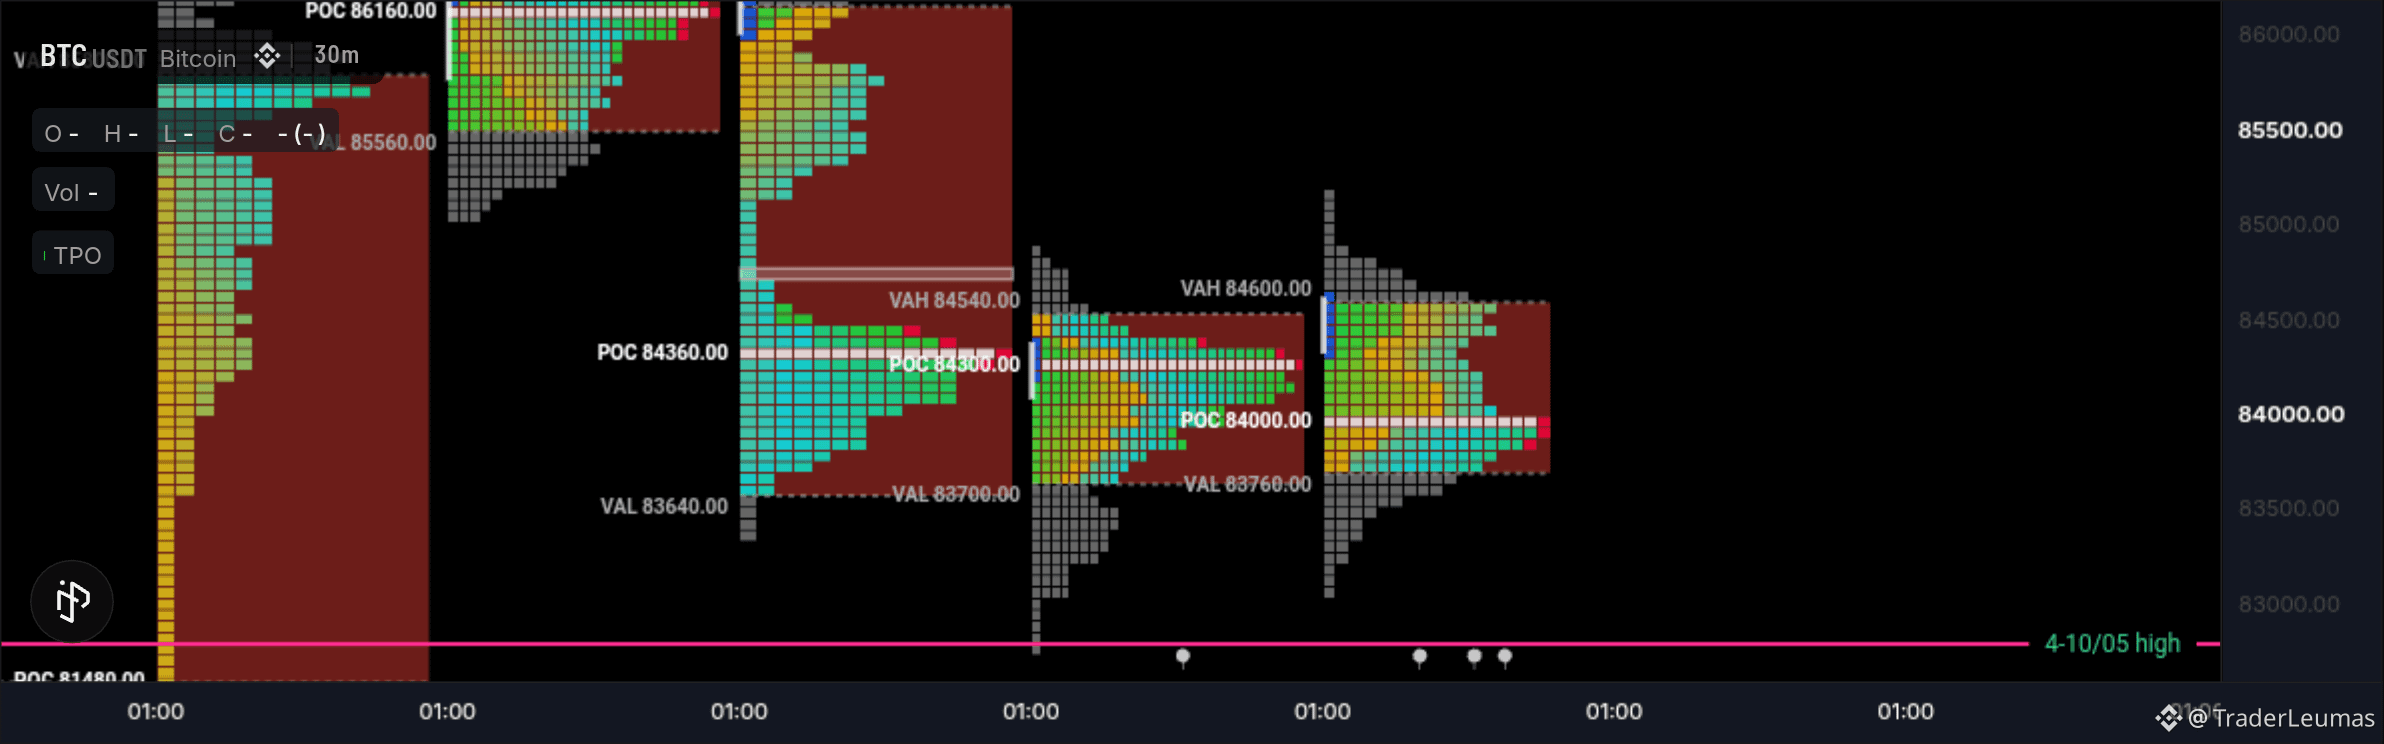
the market isn't doing a good job in repairing the previous day weak low. even though it moved the way I expected.
the current developing profile structure is balanced with most trade occuring at the the middle of the profile.
the high and low are both good due to the excess at the top and bottom.
Market generated information from the past days.
Monday- poc didn't migrate with price as price moved higher.
Tuesday - both poor high anf low has been repaired.
wednesday - poor high hasn't been repaired, single prints has been repaired as well.
Thursday - poor high has been repaired but the weak low hasn't been repaired as well.
Friday - overall friday doesn't have a problem just anomalies due to the emotions of traders.
{spot}(BTCUSDT)
Overall todays market confidence was low.
$BTC profile update
the market isn't doing a good job in repairing the previous day weak low. even though it moved the way I expected.
the current developing profile structure is balanced with most trade occuring at the the middle of the profile.
the high and low are both good due to the excess at the top and bottom.
Market generated information from the past days.
Monday- poc didn't migrate with price as price moved higher.
Tuesday - both poor high anf low has been repaired.
wednesday - poor high hasn't been repaired, single prints has been repaired as well.
Thursday - poor high has been repaired but the weak low hasn't been repaired as well.
Friday - overall friday doesn't have a problem just anomalies due to the emotions of traders.
Overall todays market confidence was low.
the market isn't doing a good job in repairing the previous day weak low. even though it moved the way I expected.
the current developing profile structure is balanced with most trade occuring at the the middle of the profile.
the high and low are both good due to the excess at the top and bottom.
Market generated information from the past days.
Monday- poc didn't migrate with price as price moved higher.
Tuesday - both poor high anf low has been repaired.
wednesday - poor high hasn't been repaired, single prints has been repaired as well.
Thursday - poor high has been repaired but the weak low hasn't been repaired as well.
Friday - overall friday doesn't have a problem just anomalies due to the emotions of traders.
Overall todays market confidence was low.
2
3
901
·
--
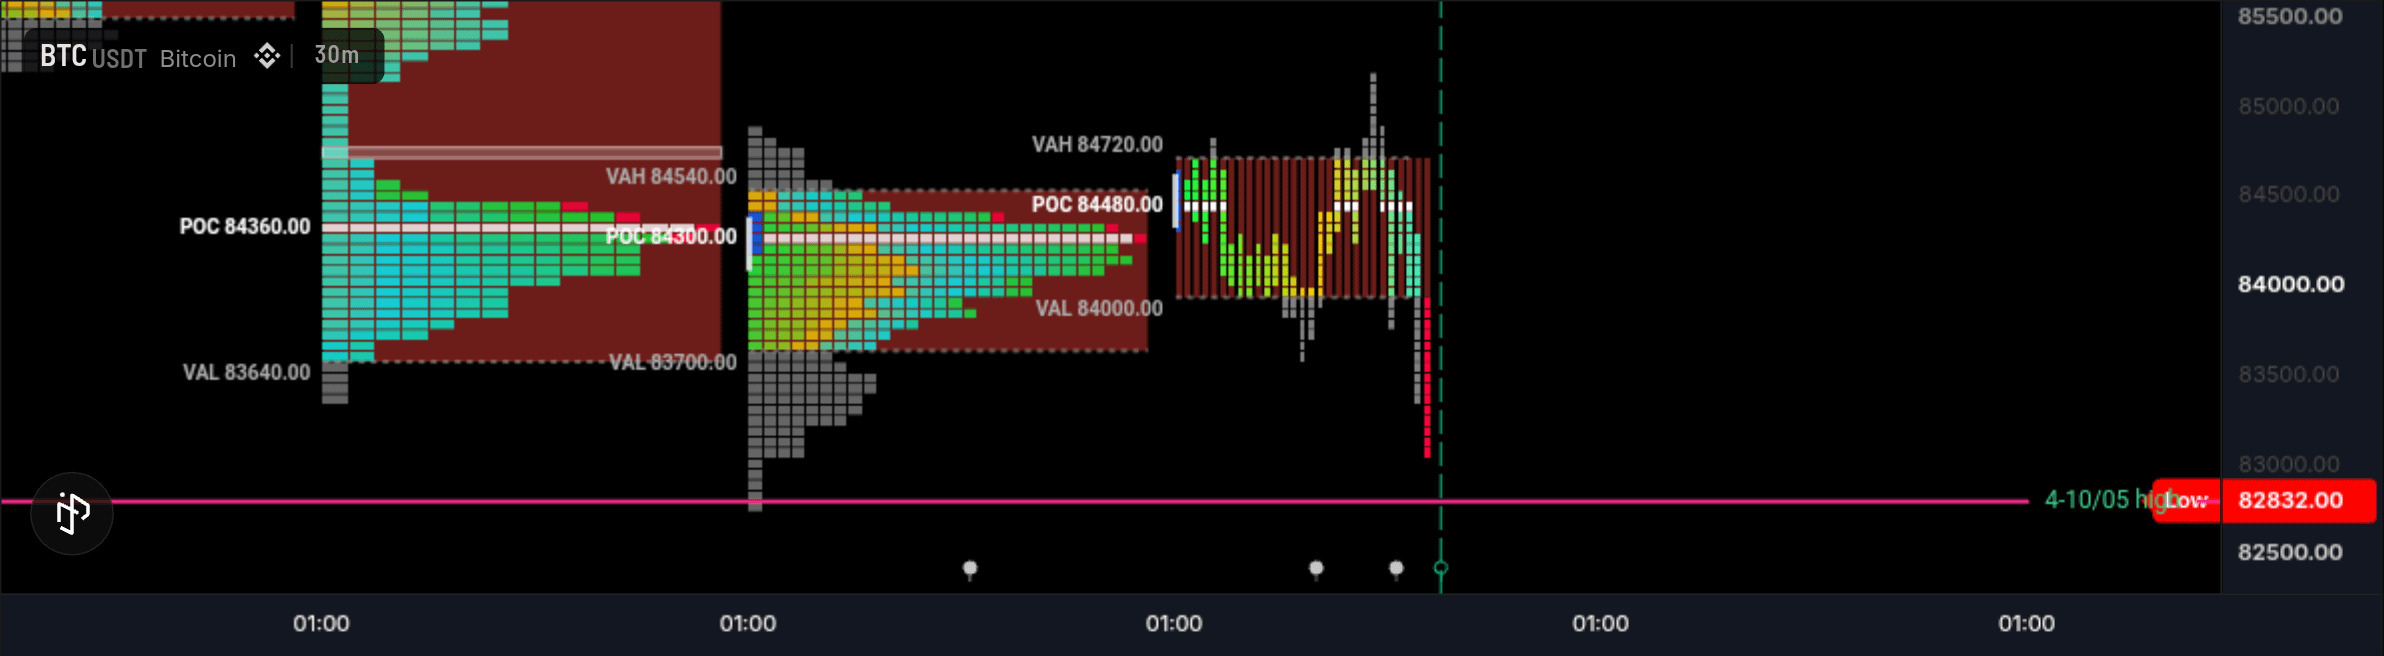
Rotational day as expected, saw this from the opening period. one last push let's clear the previous day Low, then we're good.
I haven't forgotten Monday poc area that didn't migrate with price. The Monday poc area is a prominent poc.
$BTC
{future}(BTCUSDT)
Rotational day as expected, saw this from the opening period. one last push let's clear the previous day Low, then we're good.
I haven't forgotten Monday poc area that didn't migrate with price. The Monday poc area is a prominent poc.
$BTC
I haven't forgotten Monday poc area that didn't migrate with price. The Monday poc area is a prominent poc.
$BTC
TraderLeumas
·
--
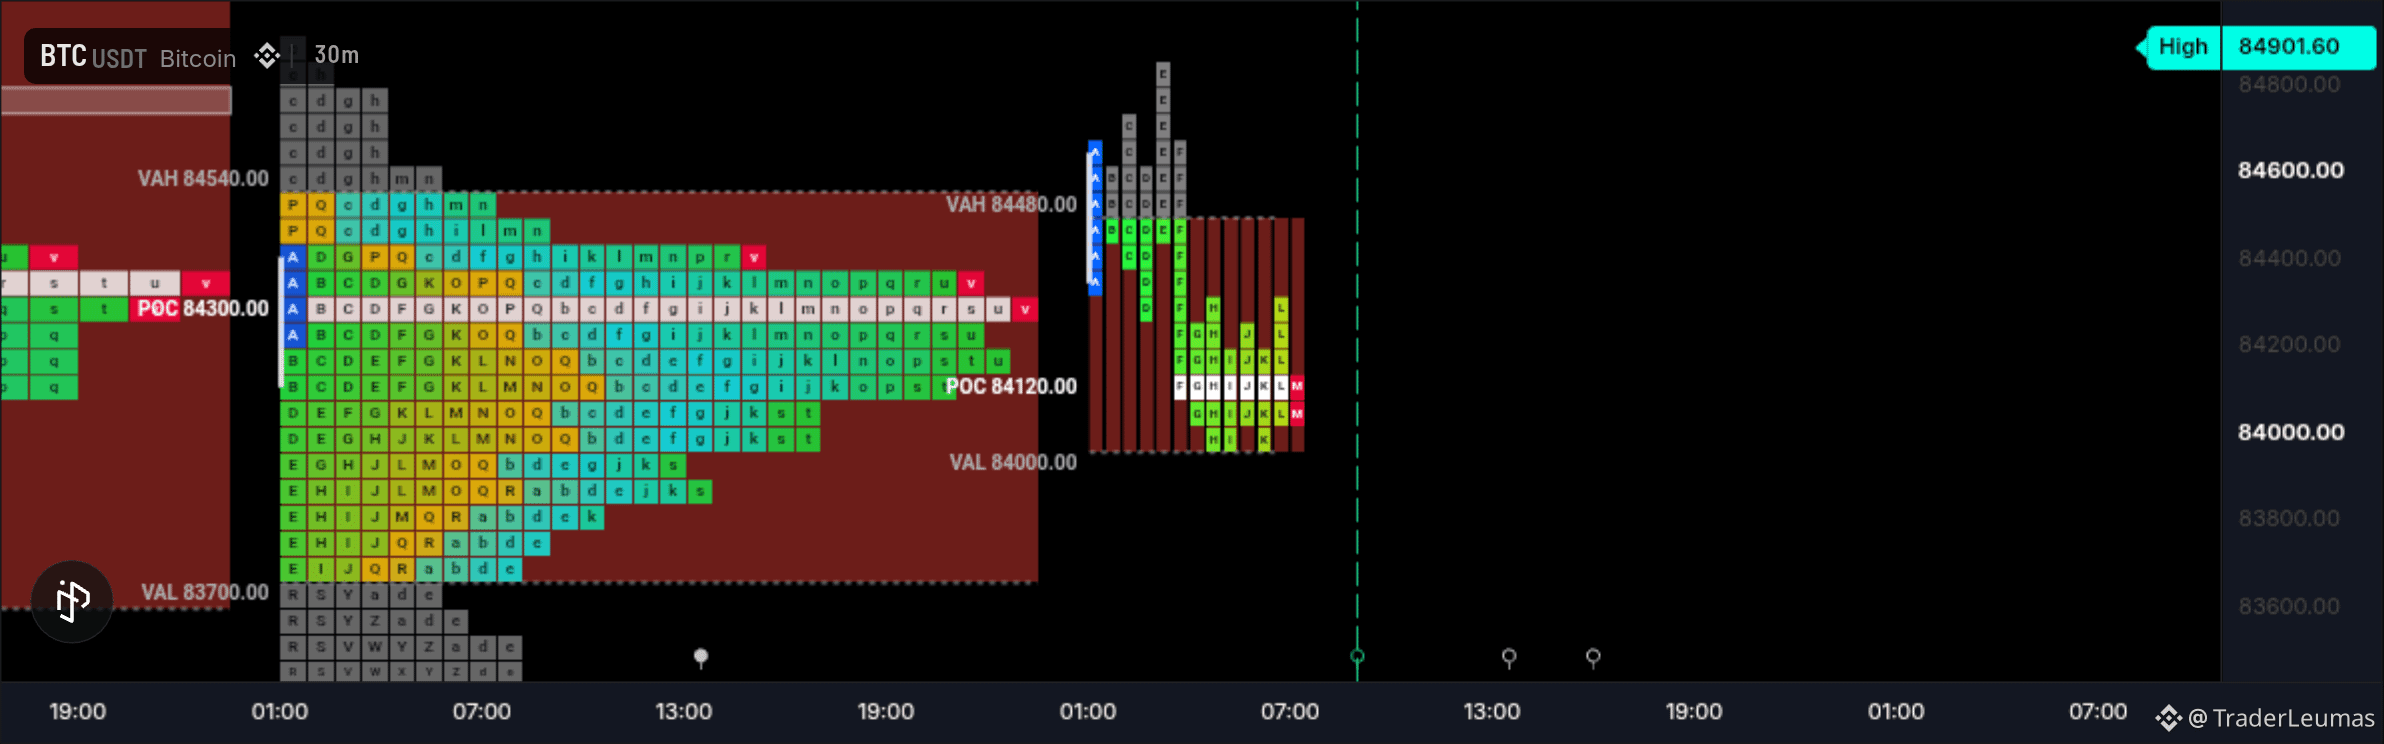
$BTC market profile update
The market opened near the previous day’s value area and traded back and forth through A and B periods, indicating a low-confidence day.
I’m expecting a rotational session with downside continuation, potentially taking out the previous day’s weak low.
I'll update as the profile develop, watch out for the previous day weak low.
The market opened near the previous day’s value area and traded back and forth through A and B periods, indicating a low-confidence day.
I’m expecting a rotational session with downside continuation, potentially taking out the previous day’s weak low.
I'll update as the profile develop, watch out for the previous day weak low.
2
276
·
--
$BTC market profile update
The market opened near the previous day’s value area and traded back and forth through A and B periods, indicating a low-confidence day.
I’m expecting a rotational session with downside continuation, potentially taking out the previous day’s weak low.
I'll update as the profile develop, watch out for the previous day weak low.
$BTC market profile update
The market opened near the previous day’s value area and traded back and forth through A and B periods, indicating a low-confidence day.
I’m expecting a rotational session with downside continuation, potentially taking out the previous day’s weak low.
I'll update as the profile develop, watch out for the previous day weak low.
The market opened near the previous day’s value area and traded back and forth through A and B periods, indicating a low-confidence day.
I’m expecting a rotational session with downside continuation, potentially taking out the previous day’s weak low.
I'll update as the profile develop, watch out for the previous day weak low.
2
1
1
619
·
--
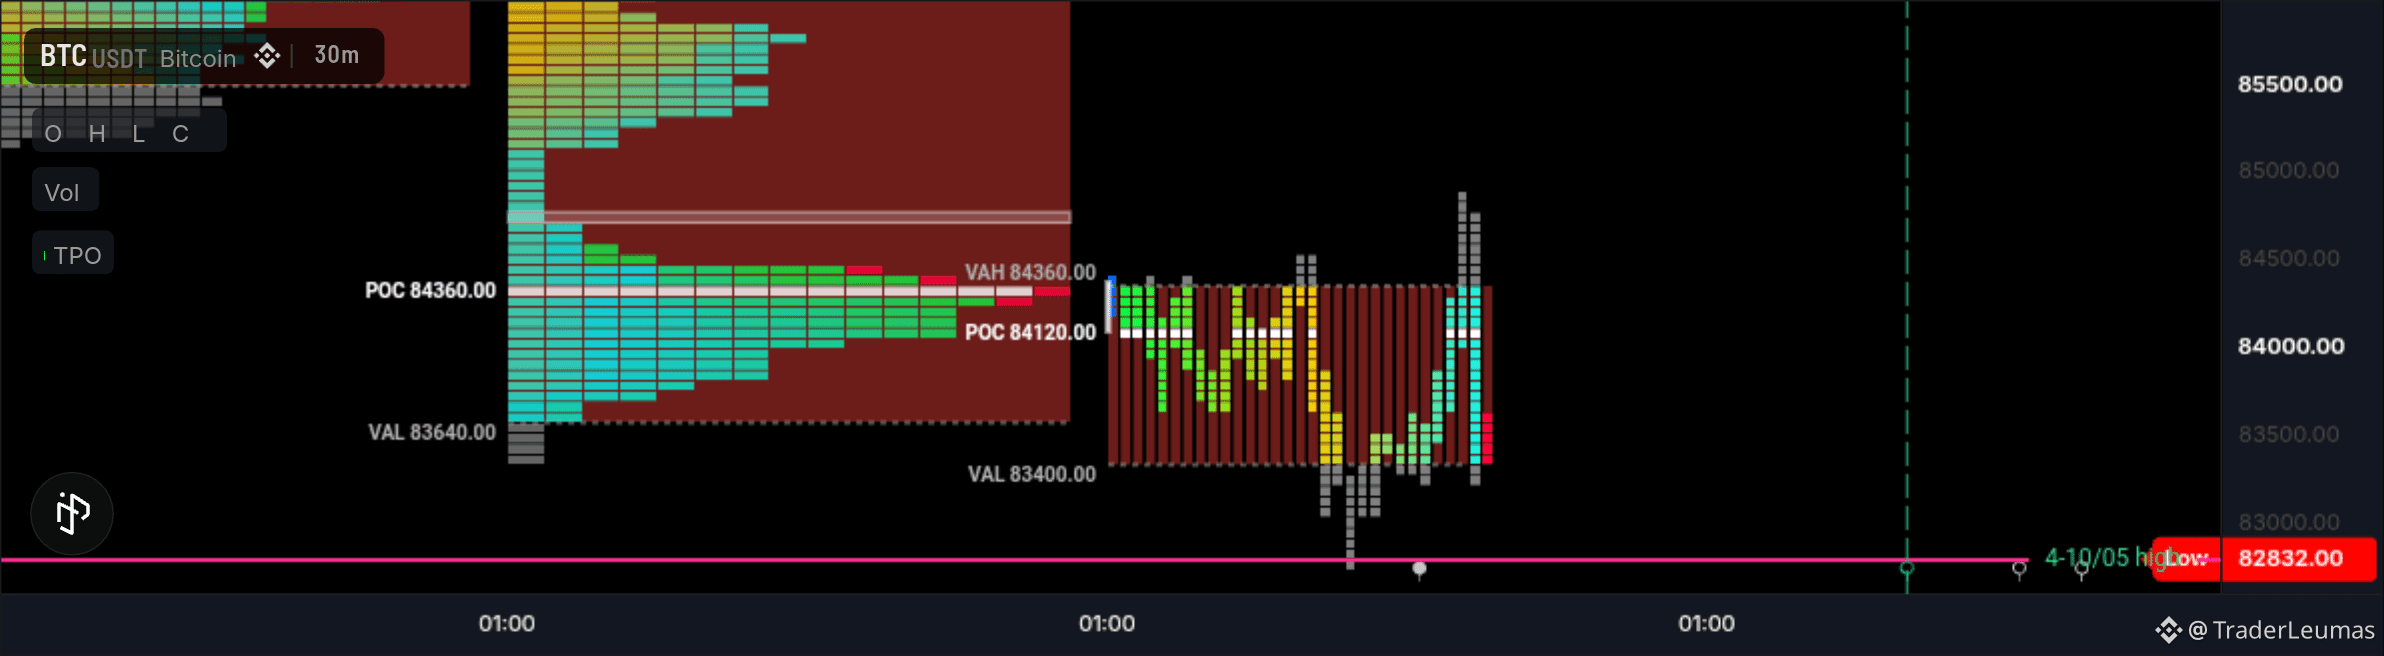
$BTC Profile Update
the market opened near the low of the previous day value area. during the first few hours the market exhibited a low confidence day.
The current profile high is a good high which means the the auction has been completed while the low is very mechanical because it's went one tick below 4/05 high.
the previous day profile poc migrated with price as price moved lower and single prints formed has been partly repaired.
more low is expected.
$BTC Profile Update
the market opened near the low of the previous day value area. during the first few hours the market exhibited a low confidence day.
The current profile high is a good high which means the the auction has been completed while the low is very mechanical because it's went one tick below 4/05 high.
the previous day profile poc migrated with price as price moved lower and single prints formed has been partly repaired.
more low is expected.
the market opened near the low of the previous day value area. during the first few hours the market exhibited a low confidence day.
The current profile high is a good high which means the the auction has been completed while the low is very mechanical because it's went one tick below 4/05 high.
the previous day profile poc migrated with price as price moved lower and single prints formed has been partly repaired.
more low is expected.
2
397
·
--
update 🔥🔥
binance just listed $HYPE on spot
Hyperliquid
{spot}(HYPEUSDT)
update 🔥🔥
binance just listed $HYPE on spot
Hyperliquid
binance just listed $HYPE on spot
Hyperliquid
3
261
·
--
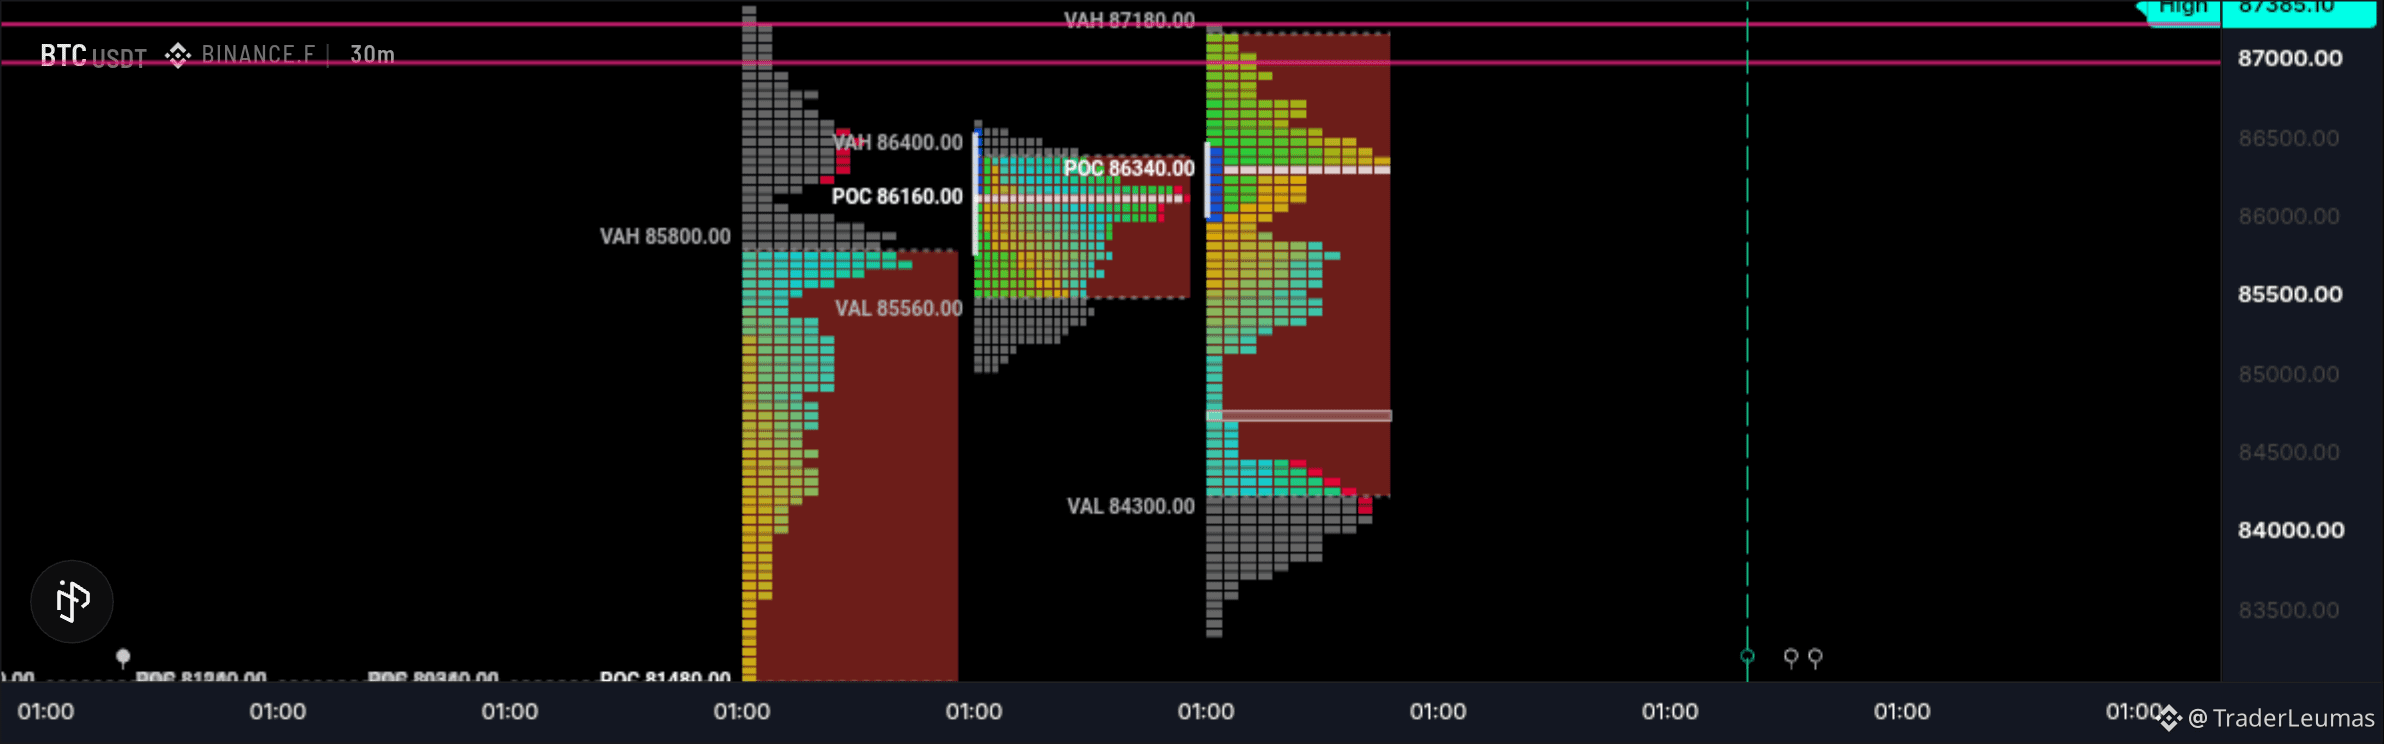
$BTC profile update
I talked about the poc of Monday profile didn't migrate with price as price moved higher. the next the market was too weak, it had poor high and poor low.
today the market open closed to the middle of the previous day profile and one timeframed higher
during the first periods, taking out the previous day poor high.
the current high went 2 tick below the previous Monday high and reversed, then begins to one timeframe lower also repairing the previous day poor low.
The current high is a weak high while the low is a good low. watch for the poc area, because poc didn't move with price as price moved lower.
$BTC profile update
I talked about the poc of Monday profile didn't migrate with price as price moved higher. the next the market was too weak, it had poor high and poor low.
today the market open closed to the middle of the previous day profile and one timeframed higher
during the first periods, taking out the previous day poor high.
the current high went 2 tick below the previous Monday high and reversed, then begins to one timeframe lower also repairing the previous day poor low.
The current high is a weak high while the low is a good low. watch for the poc area, because poc didn't move with price as price moved lower.
I talked about the poc of Monday profile didn't migrate with price as price moved higher. the next the market was too weak, it had poor high and poor low.
today the market open closed to the middle of the previous day profile and one timeframed higher
during the first periods, taking out the previous day poor high.
the current high went 2 tick below the previous Monday high and reversed, then begins to one timeframe lower also repairing the previous day poor low.
The current high is a weak high while the low is a good low. watch for the poc area, because poc didn't move with price as price moved lower.
1
1
447
·
--
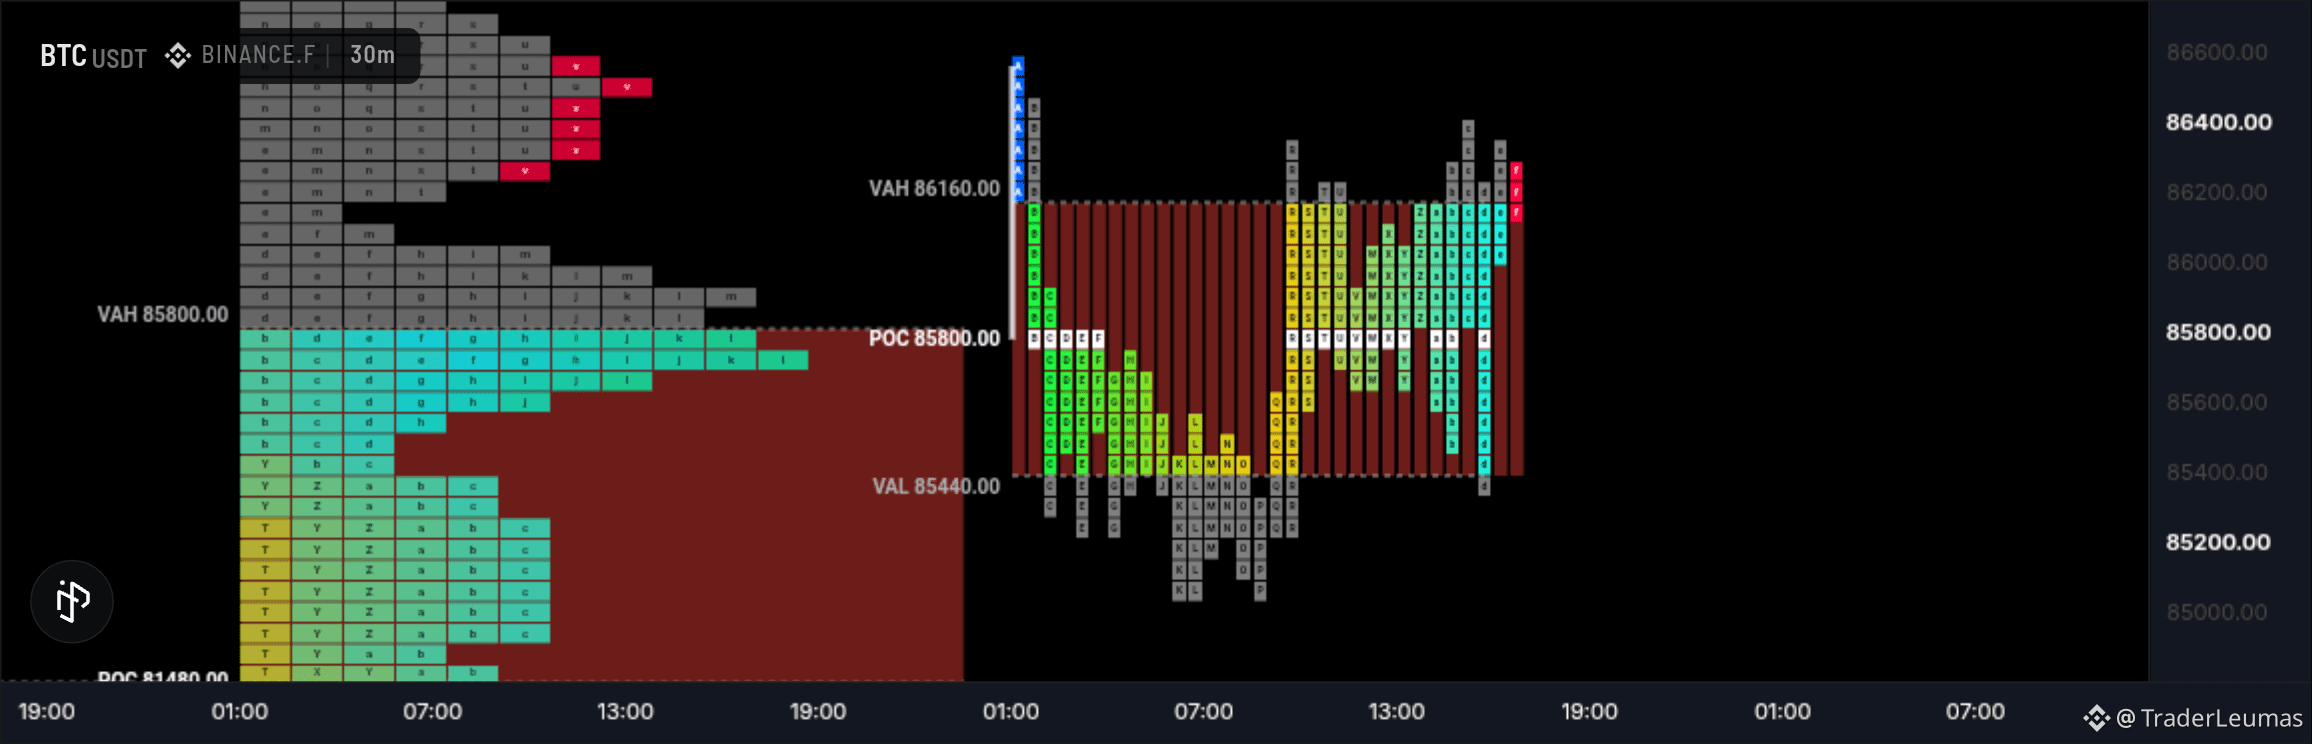
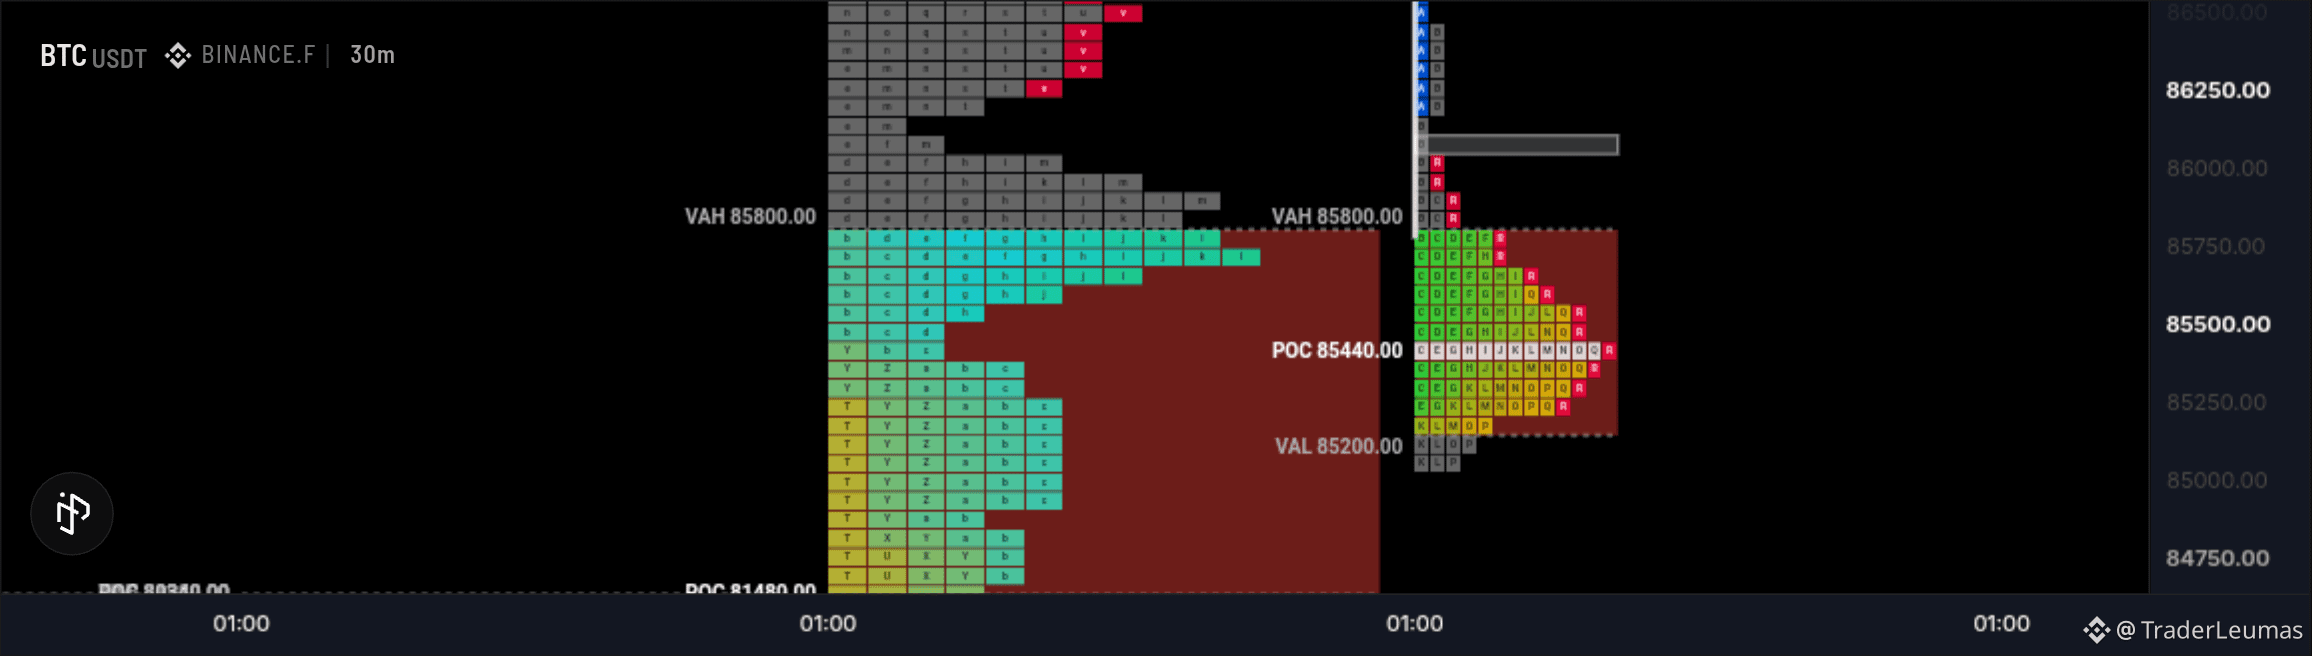
$BTC Daily Profile Update
Today was mostly a rotational day, since the market opened above the previous day’s value area high but failed to continue higher.
From the open, the market one timeframed lower into the previous day’s value area and found acceptance. The current high is a good high because it has excess, while the low is a poor low.
the market initially left single prints while one timeframing lower, but they have since been filled.
The POC migrated from near the low toward the middle, and the current market structure is balanced.
The market is currently trading back and forth within the opening range, indicating low confidence and no clear directional conviction.
{future}(BTCUSDT)
$BTC Daily Profile Update
Today was mostly a rotational day, since the market opened above the previous day’s value area high but failed to continue higher.
From the open, the market one timeframed lower into the previous day’s value area and found acceptance. The current high is a good high because it has excess, while the low is a poor low.
the market initially left single prints while one timeframing lower, but they have since been filled.
The POC migrated from near the low toward the middle, and the current market structure is balanced.
The market is currently trading back and forth within the opening range, indicating low confidence and no clear directional conviction.
Today was mostly a rotational day, since the market opened above the previous day’s value area high but failed to continue higher.
From the open, the market one timeframed lower into the previous day’s value area and found acceptance. The current high is a good high because it has excess, while the low is a poor low.
the market initially left single prints while one timeframing lower, but they have since been filled.
The POC migrated from near the low toward the middle, and the current market structure is balanced.
The market is currently trading back and forth within the opening range, indicating low confidence and no clear directional conviction.
2
2
491
·
--

Article
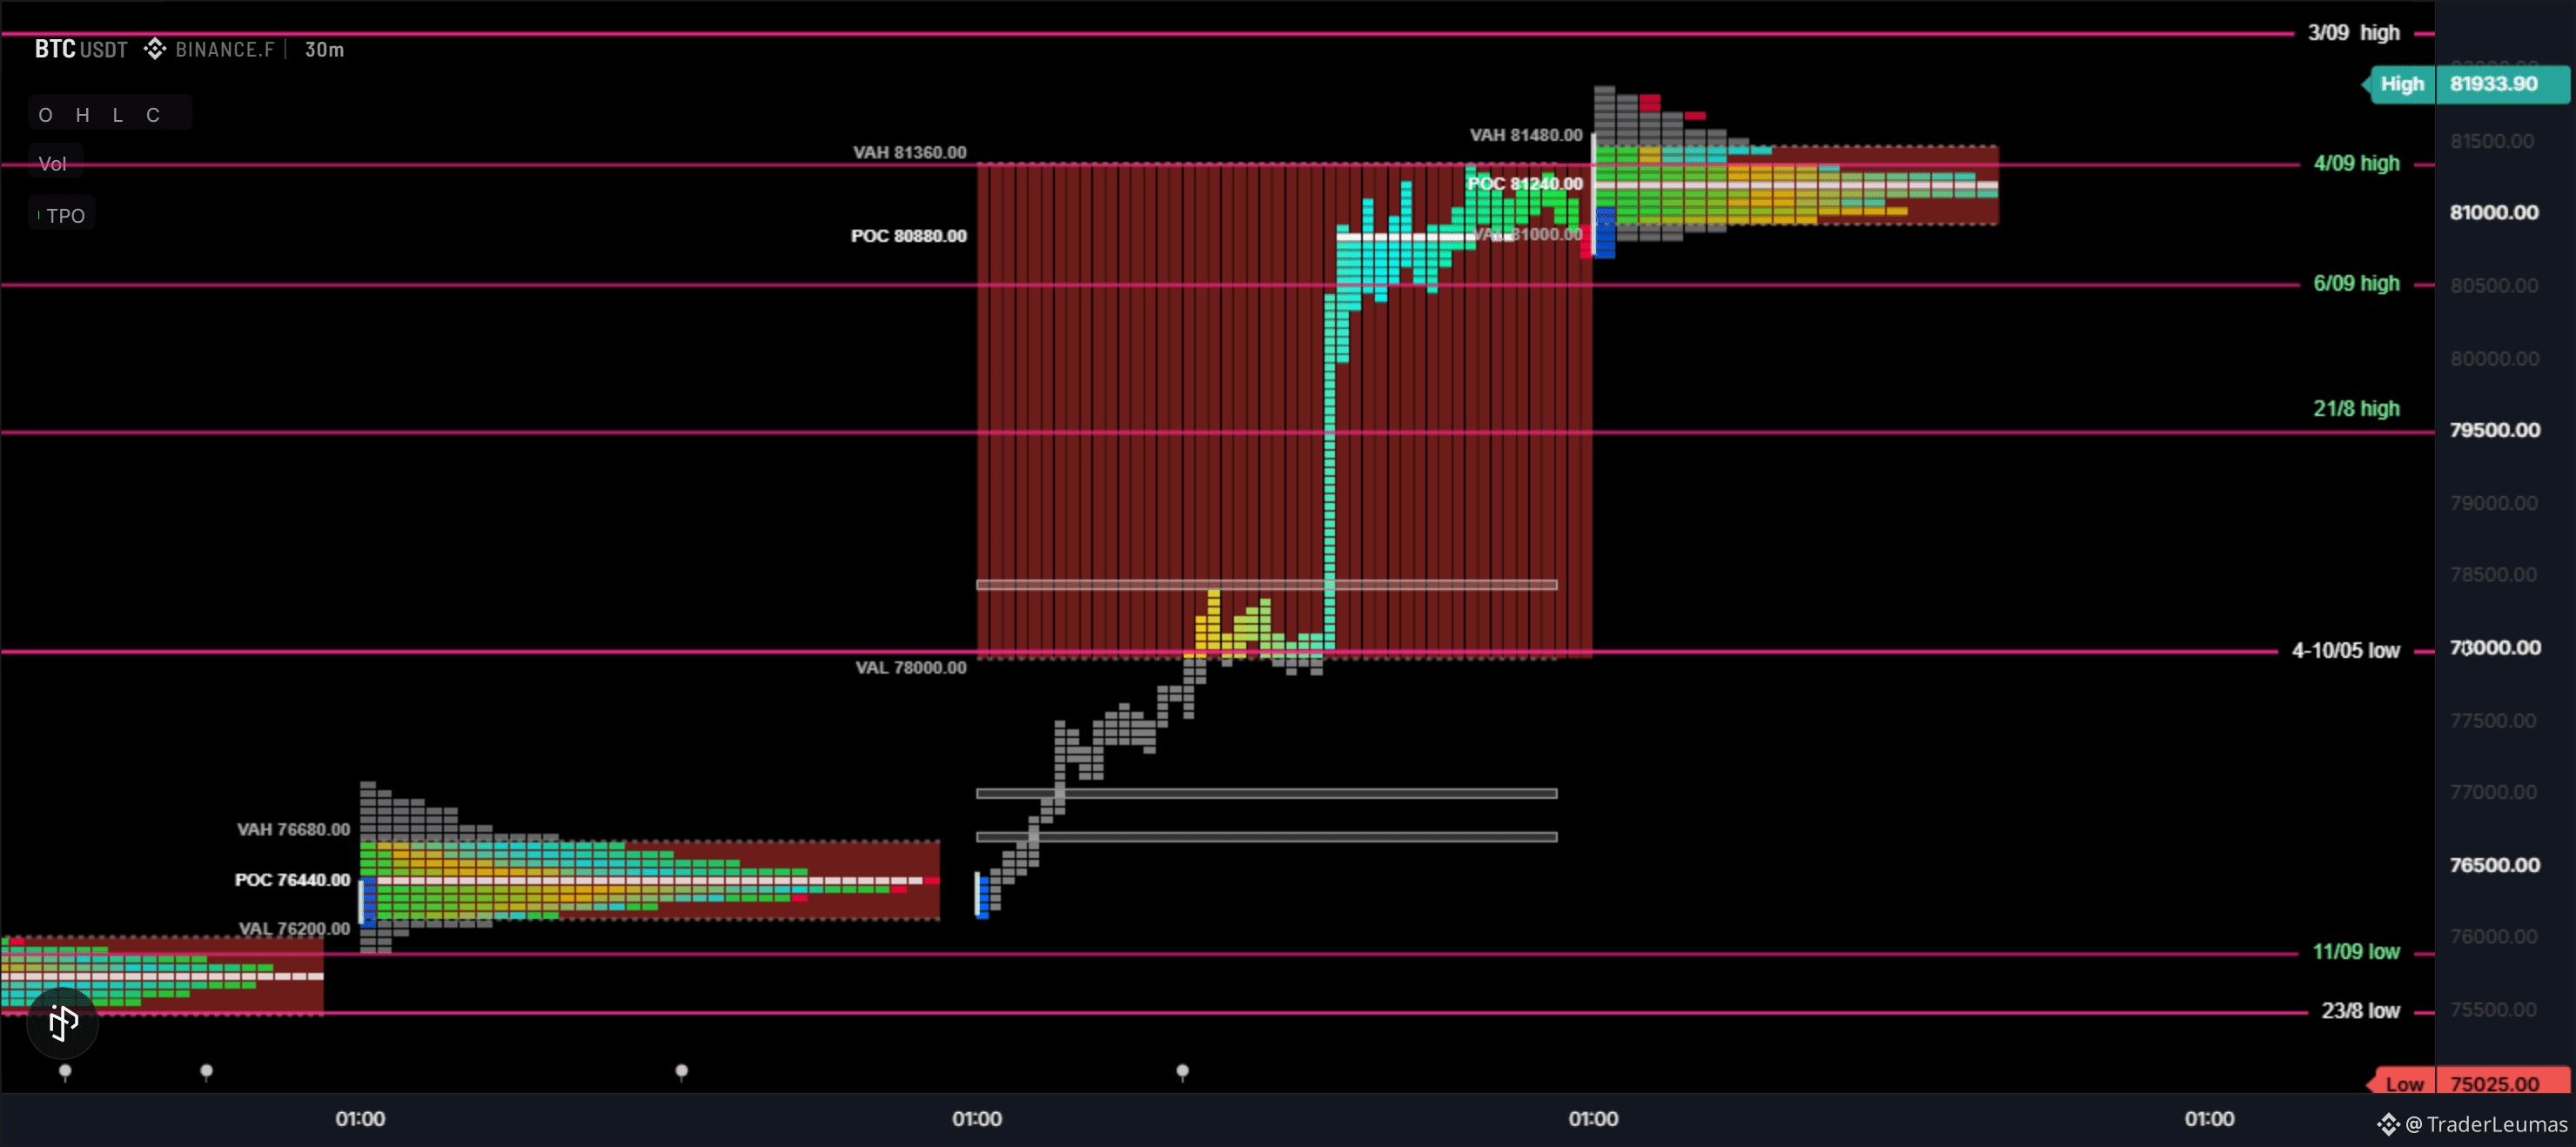
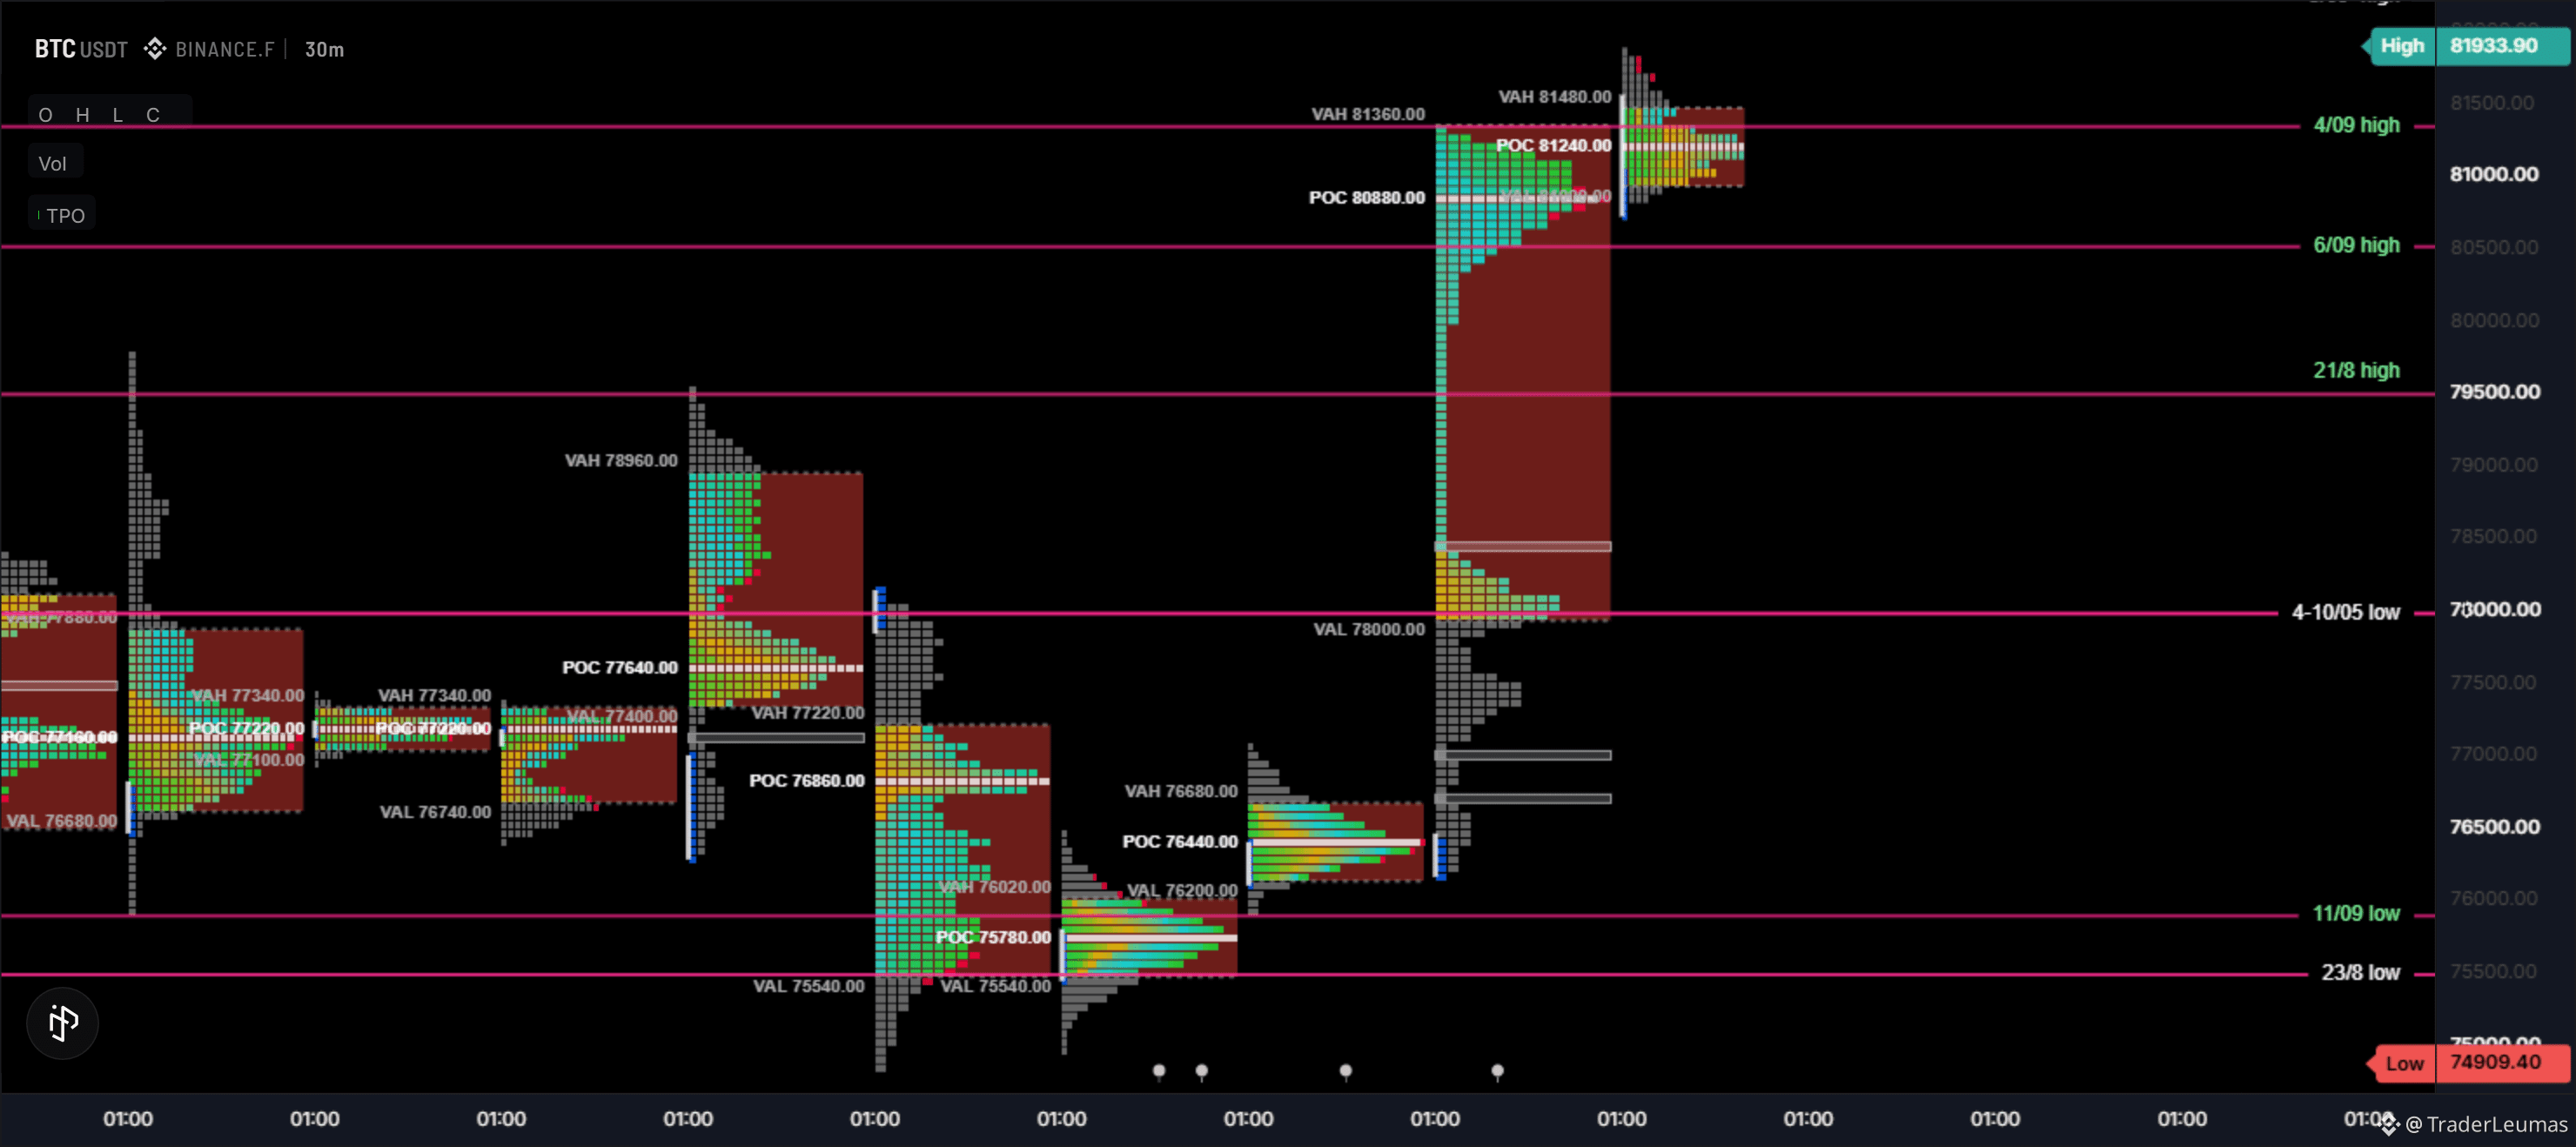
BITCOIN WEEKLY ANALYSISGM everyone, welcome to another episode of my weekly article. While writing this article, $BTC traded from 81.8K to 84K, so we’ll look at two charts: the previous one and the updated one.
For those who are new to my article, I use market profile and candlestick charts for analysis. Without further ado, let’s jump in.
Monthly Timeframe (1M)
After the third week of August’s rally, I wrote in my article that the current uptrend was still young and that the market had moved from a narrow range to a wide range. Fast forward to this month, $BTC is now trading above the 82.8K high for the first time since May.
Intermediate Timeframe (1W)
I really like how the market started off strong. Since the third week of august rally high, the market came into balance and timeframed lower for four straight weeks. Since $BTC is trading within the January range, let’s watch and see if the breakout is genuine and can hold. $BTC reaching 100K might be visible this year.
Daily Timeframe (1D)
In my last article, I talked about the market behavioral pattern: imbalance > balance > test > imbalance. After the test, we are now back at imbalance. Before the market broke out, I wrote in my journal that I really liked the way the market opened, and that we might see a breakout from the May 82.8K high.
Since the breakout, I’ve shifted my support area to the 23/08 high.
Short Term Timeframe (m30)
Let’s start with a recap of the market from Thursday after the FOMC news.
On Thursday, after the FOMC news, the market didn’t react much, so I think that was when the bulls were accumulating more inventory. The profile had a weak high, coupled with a poor low, which suggests unfinished business to the downside.
Friday, the market started strongly and showed a high confidence day. However, during the A and B periods, which make up the initial balance, the market formed a poor, weak low that was not revisited. the profile shape after the Asian session looked like a classical P shape. During NY session, new money extended the market upward, turning the short covering rally into a strong rally. The POC also migrated with price as price moved higher which also validated the move.
Saturday, the market came into balance while Sunday the market one timeframed lower and brought in buyers. The buyers where able to push the price back the opening period.
currently the market is trading within January range.
Today’s Profile Update
The market opened above the previous day’s value area high and traded sideways during the first periods. The open was similar to last Thursday’s, although both opens had different strength. Around mid morning, the market broke above the May 82.8K high, which increased market confidence.
The bulls continue to dominate after Friday’s strong rally. However, the trend is still young, so let’s watch how far price can go as higher levels continue to attract more activity.
Market Generated Information
The previous day’s poor low was not revisited.The previous day’s POC area was too wide and was not revisited.The current POC is not migrating with price as price moves higher.Higher prices continue to attract more activity.There are too many single prints.
Possible trade areas this week
High
1/1 opening
LOW
5/05 high 23/08 high.
Overall, the bulls are still in control, but the trend is still young. I’ll be watching closely to see whether higher prices continue to attract enough activity to extend the move further.
Thanks for reading,
What do you think about the market?
BITCOIN WEEKLY ANALYSIS
GM everyone, welcome to another episode of my weekly article. While writing this article, $BTC traded from 81.8K to 84K, so we’ll look at two charts: the previous one and the updated one.
For those who are new to my article, I use market profile and candlestick charts for analysis. Without further ado, let’s jump in.
Monthly Timeframe (1M)
After the third week of August’s rally, I wrote in my article that the current uptrend was still young and that the market had moved from a narrow range to a wide range. Fast forward to this month, $BTC is now trading above the 82.8K high for the first time since May.
Intermediate Timeframe (1W)
I really like how the market started off strong. Since the third week of august rally high, the market came into balance and timeframed lower for four straight weeks. Since $BTC is trading within the January range, let’s watch and see if the breakout is genuine and can hold. $BTC reaching 100K might be visible this year.
Daily Timeframe (1D)
In my last article, I talked about the market behavioral pattern: imbalance > balance > test > imbalance. After the test, we are now back at imbalance. Before the market broke out, I wrote in my journal that I really liked the way the market opened, and that we might see a breakout from the May 82.8K high.
Since the breakout, I’ve shifted my support area to the 23/08 high.
Short Term Timeframe (m30)
Let’s start with a recap of the market from Thursday after the FOMC news.
On Thursday, after the FOMC news, the market didn’t react much, so I think that was when the bulls were accumulating more inventory. The profile had a weak high, coupled with a poor low, which suggests unfinished business to the downside.
Friday, the market started strongly and showed a high confidence day. However, during the A and B periods, which make up the initial balance, the market formed a poor, weak low that was not revisited. the profile shape after the Asian session looked like a classical P shape. During NY session, new money extended the market upward, turning the short covering rally into a strong rally. The POC also migrated with price as price moved higher which also validated the move.
Saturday, the market came into balance while Sunday the market one timeframed lower and brought in buyers. The buyers where able to push the price back the opening period.
currently the market is trading within January range.
Today’s Profile Update
The market opened above the previous day’s value area high and traded sideways during the first periods. The open was similar to last Thursday’s, although both opens had different strength. Around mid morning, the market broke above the May 82.8K high, which increased market confidence.
The bulls continue to dominate after Friday’s strong rally. However, the trend is still young, so let’s watch how far price can go as higher levels continue to attract more activity.
Market Generated Information
The previous day’s poor low was not revisited.The previous day’s POC area was too wide and was not revisited.The current POC is not migrating with price as price moves higher.Higher prices continue to attract more activity.There are too many single prints.
Possible trade areas this week
High
1/1 opening
LOW
5/05 high 23/08 high.
Overall, the bulls are still in control, but the trend is still young. I’ll be watching closely to see whether higher prices continue to attract enough activity to extend the move further.
Thanks for reading,
What do you think about the market?
For those who are new to my article, I use market profile and candlestick charts for analysis. Without further ado, let’s jump in.
Monthly Timeframe (1M)
After the third week of August’s rally, I wrote in my article that the current uptrend was still young and that the market had moved from a narrow range to a wide range. Fast forward to this month, $BTC is now trading above the 82.8K high for the first time since May.
Intermediate Timeframe (1W)
I really like how the market started off strong. Since the third week of august rally high, the market came into balance and timeframed lower for four straight weeks. Since $BTC is trading within the January range, let’s watch and see if the breakout is genuine and can hold. $BTC reaching 100K might be visible this year.
Daily Timeframe (1D)
In my last article, I talked about the market behavioral pattern: imbalance > balance > test > imbalance. After the test, we are now back at imbalance. Before the market broke out, I wrote in my journal that I really liked the way the market opened, and that we might see a breakout from the May 82.8K high.
Since the breakout, I’ve shifted my support area to the 23/08 high.
Short Term Timeframe (m30)
Let’s start with a recap of the market from Thursday after the FOMC news.
On Thursday, after the FOMC news, the market didn’t react much, so I think that was when the bulls were accumulating more inventory. The profile had a weak high, coupled with a poor low, which suggests unfinished business to the downside.
Friday, the market started strongly and showed a high confidence day. However, during the A and B periods, which make up the initial balance, the market formed a poor, weak low that was not revisited. the profile shape after the Asian session looked like a classical P shape. During NY session, new money extended the market upward, turning the short covering rally into a strong rally. The POC also migrated with price as price moved higher which also validated the move.
Saturday, the market came into balance while Sunday the market one timeframed lower and brought in buyers. The buyers where able to push the price back the opening period.
currently the market is trading within January range.
Today’s Profile Update
The market opened above the previous day’s value area high and traded sideways during the first periods. The open was similar to last Thursday’s, although both opens had different strength. Around mid morning, the market broke above the May 82.8K high, which increased market confidence.
The bulls continue to dominate after Friday’s strong rally. However, the trend is still young, so let’s watch how far price can go as higher levels continue to attract more activity.
Market Generated Information
The previous day’s poor low was not revisited.The previous day’s POC area was too wide and was not revisited.The current POC is not migrating with price as price moves higher.Higher prices continue to attract more activity.There are too many single prints.
Possible trade areas this week
High
1/1 opening
LOW
5/05 high 23/08 high.
Overall, the bulls are still in control, but the trend is still young. I’ll be watching closely to see whether higher prices continue to attract enough activity to extend the move further.
Thanks for reading,
What do you think about the market?
1
2
2.3k
·
--
$BTC market profile update
after yesterday’s strong rally, which was mainly driven by short liquidation, the market opened today near the previous day’s value area high.
In the first four periods, the market showed low confidence.
The current profile is balanced, with value overlapping higher than the previous day. The current low is a good low, and the high is a good high as well.
I see yesterday’s rally as pure short covering, not new-money buying. The reason is simple: the market couldn’t push above a clear visual reference, the 3/09 high.
since short covering weakens the market here, I see two possible scenarios going into Monday:
~ the bulls continue higher and invalidate the short-covering move.
~ the market reverses and continues downtrend.
market generated information since FOMC day:
~ The bulls intentionally trapped the bears on Wednesday and Thursday.
~ Wednesday’s and Thursday’s profiles look very similar.
~ Thursday’s profile did not revisit Wednesday’s POC.
~ Thursday’s value area was higher than Wednesday’s and did not overlap.
~ Friday’s profile was too truncated.
~ Friday’s low was a poor low.
I’m expecting another quiet day tomorrow.
$BTC market profile update
after yesterday’s strong rally, which was mainly driven by short liquidation, the market opened today near the previous day’s value area high.
In the first four periods, the market showed low confidence.
The current profile is balanced, with value overlapping higher than the previous day. The current low is a good low, and the high is a good high as well.
I see yesterday’s rally as pure short covering, not new-money buying. The reason is simple: the market couldn’t push above a clear visual reference, the 3/09 high.
since short covering weakens the market here, I see two possible scenarios going into Monday:
~ the bulls continue higher and invalidate the short-covering move.
~ the market reverses and continues downtrend.
market generated information since FOMC day:
~ The bulls intentionally trapped the bears on Wednesday and Thursday.
~ Wednesday’s and Thursday’s profiles look very similar.
~ Thursday’s profile did not revisit Wednesday’s POC.
~ Thursday’s value area was higher than Wednesday’s and did not overlap.
~ Friday’s profile was too truncated.
~ Friday’s low was a poor low.
I’m expecting another quiet day tomorrow.
after yesterday’s strong rally, which was mainly driven by short liquidation, the market opened today near the previous day’s value area high.
In the first four periods, the market showed low confidence.
The current profile is balanced, with value overlapping higher than the previous day. The current low is a good low, and the high is a good high as well.
I see yesterday’s rally as pure short covering, not new-money buying. The reason is simple: the market couldn’t push above a clear visual reference, the 3/09 high.
since short covering weakens the market here, I see two possible scenarios going into Monday:
~ the bulls continue higher and invalidate the short-covering move.
~ the market reverses and continues downtrend.
market generated information since FOMC day:
~ The bulls intentionally trapped the bears on Wednesday and Thursday.
~ Wednesday’s and Thursday’s profiles look very similar.
~ Thursday’s profile did not revisit Wednesday’s POC.
~ Thursday’s value area was higher than Wednesday’s and did not overlap.
~ Friday’s profile was too truncated.
~ Friday’s low was a poor low.
I’m expecting another quiet day tomorrow.
4
709
·
--
Thanks for the follow, guys. I honestly never expected to gain so many followers overnight.
I didn’t post yesterday for no reason, though, but I’ll be dropping an update today on how I see the market.
I’ll also be adding more updates to my weekly article.
.
Trader_leumas
Thanks for the follow, guys. I honestly never expected to gain so many followers overnight.
I didn’t post yesterday for no reason, though, but I’ll be dropping an update today on how I see the market.
I’ll also be adding more updates to my weekly article.
.
Trader_leumas
I didn’t post yesterday for no reason, though, but I’ll be dropping an update today on how I see the market.
I’ll also be adding more updates to my weekly article.
.
Trader_leumas
4
575
·
--
Don’t get fazed by the current $BTC price, the market is structurally weak going forward.
gm traders.
{future}(BTCUSDT)
Don’t get fazed by the current $BTC price, the market is structurally weak going forward.
gm traders.
gm traders.
2
345
Connectez-vous pour découvrir plus de contenu
Rejoignez la communauté mondiale des adeptes de cryptomonnaies sur Binance Square
⚡️ Suviez les dernières informations importantes sur les cryptomonnaies.
💬 Jugé digne de confiance par la plus grande plateforme d’échange de cryptomonnaies au monde.
👍 Découvrez les connaissances que partagent les créateurs vérifiés.
Adresse e-mail/Nº de téléphone
Sujets d’actualité
BitcoinClears$85200
19,097 vues
250 mentions
We got the move, and $BTC is standing exactly where we were before the data. That’s what actual patience for a trade looks like.
The data came in mixed but with some important numbers. ADP Non-Farm Employment Change came at 90K vs 73K forecast, while Core PCE came in at 0.2% vs 0.3% expected. Final GDP was also stronger at 2.2% vs 1.5% forecast, while Personal Spending came in at 0.9% vs 0.8% expected. At the same time, Personal Income missed at 0.2% vs 0.5% forecast.
BTC initially surged to $85,600 and is now back where it needs to be. I’m still looking toward the lower ranges at $82,759 and the $80,000 liquidity, because the overhead liquidity is done and dusted.
We had a live session during the data, and during that session we saw the market at $83,800, then $85,600, and then back toward $83,000 and we still didn’t enter a trade.
That’s what patience is.
We can’t force an entry when the market has no clear direction. The same range is still in focus, and we’ll wait for the market to give us the setup.
Let me know, guys, how was the session? And should we have more regular sessions with our respected members so we can have proper discussions regarding the market?
#BitcoinClears$85200 #AltcoinSeasonIndexHoldsAbove60For5Days #USADPAdds90000JobsInSeptember #BitcoinSlipsBelow$84000 #SECToClarifyOnChainFundraisingRules
Crypto_LUX
·29 mentions J’aime
·27.4k vues
AltcoinSeasonIndexHoldsAbove60For5Days
97,390 vues
1,416 mentions
USADPAdds90000JobsInSeptember
42,528 vues
769 mentions