

Bilverse
1.1k Publications

Bilverse
Signaler
Bloquer l’utilisateur
Crypto Trader & Market Analyst | BTC • ETH • Altcoins | Setups, Market Structure & Risk | No Hype. Just the Thesis.
Ouvert au trading

Détenteur pour NVDAB
Trade fréquemment
1.8 an(s)
90 Suivis
26.5K+ Abonnés
18.6K J’aime
Publications
Portefeuille
Tous
Citations
Vidéos
Direct
PINNED
·
--
🚨 BILVERSEARMY — THE RED PACKET HAS LANDED! 🔴🧧
⚡️ $ETH GIVEAWAY IS LIVE! ⚡️
The red packets are ready. The mission starts NOW. 👀🔥
Want to join the BilverseArmy? Here’s how:
1️⃣ Follow @khann_bilal_
2️⃣ Like this post ❤️
3️⃣ Comment “YES” below 👇
4️⃣ Share it with your crypto squad 🚀
💎 More ETH. More excitement. More good vibes.
🧧 RED PACKET: ACTIVATED
⚡ ETH: LOADING…
Tag your crew and let’s see how loud the #BilverseArmy can get! 🔥
#ETH #Bilverse #RedPacketMission
🚨 BILVERSEARMY — THE RED PACKET HAS LANDED! 🔴🧧
⚡️ $ETH GIVEAWAY IS LIVE! ⚡️
The red packets are ready. The mission starts NOW. 👀🔥
Want to join the BilverseArmy? Here’s how:
1️⃣ Follow @Bilverse
2️⃣ Like this post ❤️
3️⃣ Comment “YES” below 👇
4️⃣ Share it with your crypto squad 🚀
💎 More ETH. More excitement. More good vibes.
🧧 RED PACKET: ACTIVATED
⚡ ETH: LOADING…
Tag your crew and let’s see how loud the #BilverseArmy can get! 🔥
#ETH #Bilverse #RedPacketMission
⚡️ $ETH GIVEAWAY IS LIVE! ⚡️
The red packets are ready. The mission starts NOW. 👀🔥
Want to join the BilverseArmy? Here’s how:
1️⃣ Follow @Bilverse
2️⃣ Like this post ❤️
3️⃣ Comment “YES” below 👇
4️⃣ Share it with your crypto squad 🚀
💎 More ETH. More excitement. More good vibes.
🧧 RED PACKET: ACTIVATED
⚡ ETH: LOADING…
Tag your crew and let’s see how loud the #BilverseArmy can get! 🔥
#ETH #Bilverse #RedPacketMission

42
1
2
158
PINNED
·
--

Article
🚨 Crypto Market Today: Bitcoin Rebounds, but the Market Is Far From CalmOctober 2, 2026 — The crypto market is opening October with a complicated picture. Bitcoin and several major altcoins are trading higher, but underneath the green numbers, traders are still dealing with elevated macroeconomic pressure, volatile bond markets and uncertainty over the next move from the U.S. Federal Reserve.
In the market snapshot provided, Bitcoin is at $86,458, up 2.58% over 24 hours, while Ethereum is up 0.64% at $2,730.62. Solana is showing stronger momentum, gaining 3.14% to $122.97, while BNB and XRP are also in positive territory.
But the biggest moves are happening outside the largest cryptocurrencies.
PEPE has gained 5.05%, while SCR is up a striking 40.01%. On the other side, NEAR has fallen 8.50%.
That divergence is perhaps the most important feature of today's market: crypto is green overall, but the market is anything but uniform.
₿ Bitcoin enters October with momentum — and questions
Bitcoin's recovery has been supported by renewed institutional interest. Recent reporting shows that U.S. spot Bitcoin ETFs recorded approximately $2.4 billion in weekly inflows during the week ending September 25, while broader crypto-fund inflows have also strengthened. Bitcoin Foundation+1
Citigroup also raised its 12-month Bitcoin forecast to $113,000 from $82,000, citing stronger crypto activity, ETF inflows and a supportive macroeconomic backdrop. That is a bank forecast, not a guaranteed price target. Reuters
Still, the path higher isn't straightforward.
Bitcoin has been trading around the mid-$80,000 area, while elevated Treasury yields and softer spot demand remain potential headwinds. Economic data coming from the United States is also likely to keep crypto traders focused on interest-rate expectations. The Economic Times
🌍 Macro markets are adding another layer of uncertainty
The broader financial market is experiencing significant volatility.
On October 2, Reuters reported that the U.S. 10-year Treasury yield had briefly reached 5.34%, its highest level since 2002, before retreating toward 5.25%. Investors were also awaiting U.S. employment data, while elevated oil prices and geopolitical tensions were adding to market uncertainty. Reuters
For crypto, this matters because Bitcoin and other digital assets remain sensitive to changes in liquidity, interest-rate expectations and broader risk appetite.
In other words, today's green candles don't mean the macroeconomic pressure has disappeared.
🔥 Solana is outperforming the majors
Among the major coins in the supplied snapshot, Solana is one of the strongest performers, rising 3.14%.
Ethereum, meanwhile, is advancing at a slower pace, up 0.64%. BNB has gained 1.16% and XRP 1.11%.
Recent market data also shows that the major cryptocurrencies have delivered substantial gains over the third quarter, although their performance has varied considerably. Yahoo Finance
🐸 Meme coins are moving again
PEPE's 5.05% gain is another sign that risk appetite has returned to parts of the altcoin market.
But the contrast with Dogecoin is notable: DOGE is up only 0.38% in the supplied snapshot.
That difference illustrates an important characteristic of crypto markets: capital doesn't necessarily flow evenly across the altcoin sector. Individual tokens can move dramatically based on liquidity, positioning, news and short-term trading activity.
⚠️ NEAR tells a different story
While most of the watchlist is green, NEAR has dropped 8.50%.
That is a significant move compared with BTC, ETH and the other large-cap assets and highlights the risk of looking at the overall market alone.
A rising Bitcoin does not automatically mean every altcoin is participating.
🚀 And then there's SCR...
The most dramatic number in the snapshot is undoubtedly SCR: +40.01%.
A move of that magnitude immediately attracts attention, but it also deserves caution. Smaller cryptocurrencies can experience much larger percentage swings than Bitcoin because of differences in liquidity and market depth.
The same principle applies in reverse: a spectacular daily gain doesn't necessarily establish a lasting trend.
🔎 The real story: Bitcoin is recovering, but October could be volatile
The current setup is a tug-of-war.
On one side, institutional flows and Bitcoin's strong third-quarter performance are providing support. Recent ETF inflows have been particularly notable. Bitcoin Foundation
On the other side, high Treasury yields, upcoming U.S. economic data, oil prices and geopolitical uncertainty are keeping pressure on global risk assets. Reuters
That leaves crypto traders watching more than just the price chart.
They will be watching ETF flows, U.S. employment data, Treasury yields, Federal Reserve expectations and liquidity — while also keeping an eye on whether altcoin participation broadens beyond a handful of tokens.
📌 Today's crypto picture in one sentence
Bitcoin is pushing higher, Solana and several altcoins are showing strength, PEPE is heating up and SCR is exploding — but NEAR's decline and the unsettled macro backdrop show that October's crypto rally is far from a simple straight-line move.
And that's what makes this market interesting right now. 👀
The green numbers are back. The real question is whether the strength can hold.
#BTC #ETH #CryptoMarket #Bilverse #MarketUpdate
{future}(BTCUSDT)
{future}(SOLUSDT)
{future}(SCRUSDT)
🚨 Crypto Market Today: Bitcoin Rebounds, but the Market Is Far From Calm
October 2, 2026 — The crypto market is opening October with a complicated picture. Bitcoin and several major altcoins are trading higher, but underneath the green numbers, traders are still dealing with elevated macroeconomic pressure, volatile bond markets and uncertainty over the next move from the U.S. Federal Reserve.
In the market snapshot provided, Bitcoin is at $86,458, up 2.58% over 24 hours, while Ethereum is up 0.64% at $2,730.62. Solana is showing stronger momentum, gaining 3.14% to $122.97, while BNB and XRP are also in positive territory.
But the biggest moves are happening outside the largest cryptocurrencies.
PEPE has gained 5.05%, while SCR is up a striking 40.01%. On the other side, NEAR has fallen 8.50%.
That divergence is perhaps the most important feature of today's market: crypto is green overall, but the market is anything but uniform.
₿ Bitcoin enters October with momentum — and questions
Bitcoin's recovery has been supported by renewed institutional interest. Recent reporting shows that U.S. spot Bitcoin ETFs recorded approximately $2.4 billion in weekly inflows during the week ending September 25, while broader crypto-fund inflows have also strengthened. Bitcoin Foundation+1
Citigroup also raised its 12-month Bitcoin forecast to $113,000 from $82,000, citing stronger crypto activity, ETF inflows and a supportive macroeconomic backdrop. That is a bank forecast, not a guaranteed price target. Reuters
Still, the path higher isn't straightforward.
Bitcoin has been trading around the mid-$80,000 area, while elevated Treasury yields and softer spot demand remain potential headwinds. Economic data coming from the United States is also likely to keep crypto traders focused on interest-rate expectations. The Economic Times
🌍 Macro markets are adding another layer of uncertainty
The broader financial market is experiencing significant volatility.
On October 2, Reuters reported that the U.S. 10-year Treasury yield had briefly reached 5.34%, its highest level since 2002, before retreating toward 5.25%. Investors were also awaiting U.S. employment data, while elevated oil prices and geopolitical tensions were adding to market uncertainty. Reuters
For crypto, this matters because Bitcoin and other digital assets remain sensitive to changes in liquidity, interest-rate expectations and broader risk appetite.
In other words, today's green candles don't mean the macroeconomic pressure has disappeared.
🔥 Solana is outperforming the majors
Among the major coins in the supplied snapshot, Solana is one of the strongest performers, rising 3.14%.
Ethereum, meanwhile, is advancing at a slower pace, up 0.64%. BNB has gained 1.16% and XRP 1.11%.
Recent market data also shows that the major cryptocurrencies have delivered substantial gains over the third quarter, although their performance has varied considerably. Yahoo Finance
🐸 Meme coins are moving again
PEPE's 5.05% gain is another sign that risk appetite has returned to parts of the altcoin market.
But the contrast with Dogecoin is notable: DOGE is up only 0.38% in the supplied snapshot.
That difference illustrates an important characteristic of crypto markets: capital doesn't necessarily flow evenly across the altcoin sector. Individual tokens can move dramatically based on liquidity, positioning, news and short-term trading activity.
⚠️ NEAR tells a different story
While most of the watchlist is green, NEAR has dropped 8.50%.
That is a significant move compared with BTC, ETH and the other large-cap assets and highlights the risk of looking at the overall market alone.
A rising Bitcoin does not automatically mean every altcoin is participating.
🚀 And then there's SCR...
The most dramatic number in the snapshot is undoubtedly SCR: +40.01%.
A move of that magnitude immediately attracts attention, but it also deserves caution. Smaller cryptocurrencies can experience much larger percentage swings than Bitcoin because of differences in liquidity and market depth.
The same principle applies in reverse: a spectacular daily gain doesn't necessarily establish a lasting trend.
🔎 The real story: Bitcoin is recovering, but October could be volatile
The current setup is a tug-of-war.
On one side, institutional flows and Bitcoin's strong third-quarter performance are providing support. Recent ETF inflows have been particularly notable. Bitcoin Foundation
On the other side, high Treasury yields, upcoming U.S. economic data, oil prices and geopolitical uncertainty are keeping pressure on global risk assets. Reuters
That leaves crypto traders watching more than just the price chart.
They will be watching ETF flows, U.S. employment data, Treasury yields, Federal Reserve expectations and liquidity — while also keeping an eye on whether altcoin participation broadens beyond a handful of tokens.
📌 Today's crypto picture in one sentence
Bitcoin is pushing higher, Solana and several altcoins are showing strength, PEPE is heating up and SCR is exploding — but NEAR's decline and the unsettled macro backdrop show that October's crypto rally is far from a simple straight-line move.
And that's what makes this market interesting right now. 👀
The green numbers are back. The real question is whether the strength can hold.
#BTC #ETH #CryptoMarket #Bilverse #MarketUpdate
In the market snapshot provided, Bitcoin is at $86,458, up 2.58% over 24 hours, while Ethereum is up 0.64% at $2,730.62. Solana is showing stronger momentum, gaining 3.14% to $122.97, while BNB and XRP are also in positive territory.
But the biggest moves are happening outside the largest cryptocurrencies.
PEPE has gained 5.05%, while SCR is up a striking 40.01%. On the other side, NEAR has fallen 8.50%.
That divergence is perhaps the most important feature of today's market: crypto is green overall, but the market is anything but uniform.
₿ Bitcoin enters October with momentum — and questions
Bitcoin's recovery has been supported by renewed institutional interest. Recent reporting shows that U.S. spot Bitcoin ETFs recorded approximately $2.4 billion in weekly inflows during the week ending September 25, while broader crypto-fund inflows have also strengthened. Bitcoin Foundation+1
Citigroup also raised its 12-month Bitcoin forecast to $113,000 from $82,000, citing stronger crypto activity, ETF inflows and a supportive macroeconomic backdrop. That is a bank forecast, not a guaranteed price target. Reuters
Still, the path higher isn't straightforward.
Bitcoin has been trading around the mid-$80,000 area, while elevated Treasury yields and softer spot demand remain potential headwinds. Economic data coming from the United States is also likely to keep crypto traders focused on interest-rate expectations. The Economic Times
🌍 Macro markets are adding another layer of uncertainty
The broader financial market is experiencing significant volatility.
On October 2, Reuters reported that the U.S. 10-year Treasury yield had briefly reached 5.34%, its highest level since 2002, before retreating toward 5.25%. Investors were also awaiting U.S. employment data, while elevated oil prices and geopolitical tensions were adding to market uncertainty. Reuters
For crypto, this matters because Bitcoin and other digital assets remain sensitive to changes in liquidity, interest-rate expectations and broader risk appetite.
In other words, today's green candles don't mean the macroeconomic pressure has disappeared.
🔥 Solana is outperforming the majors
Among the major coins in the supplied snapshot, Solana is one of the strongest performers, rising 3.14%.
Ethereum, meanwhile, is advancing at a slower pace, up 0.64%. BNB has gained 1.16% and XRP 1.11%.
Recent market data also shows that the major cryptocurrencies have delivered substantial gains over the third quarter, although their performance has varied considerably. Yahoo Finance
🐸 Meme coins are moving again
PEPE's 5.05% gain is another sign that risk appetite has returned to parts of the altcoin market.
But the contrast with Dogecoin is notable: DOGE is up only 0.38% in the supplied snapshot.
That difference illustrates an important characteristic of crypto markets: capital doesn't necessarily flow evenly across the altcoin sector. Individual tokens can move dramatically based on liquidity, positioning, news and short-term trading activity.
⚠️ NEAR tells a different story
While most of the watchlist is green, NEAR has dropped 8.50%.
That is a significant move compared with BTC, ETH and the other large-cap assets and highlights the risk of looking at the overall market alone.
A rising Bitcoin does not automatically mean every altcoin is participating.
🚀 And then there's SCR...
The most dramatic number in the snapshot is undoubtedly SCR: +40.01%.
A move of that magnitude immediately attracts attention, but it also deserves caution. Smaller cryptocurrencies can experience much larger percentage swings than Bitcoin because of differences in liquidity and market depth.
The same principle applies in reverse: a spectacular daily gain doesn't necessarily establish a lasting trend.
🔎 The real story: Bitcoin is recovering, but October could be volatile
The current setup is a tug-of-war.
On one side, institutional flows and Bitcoin's strong third-quarter performance are providing support. Recent ETF inflows have been particularly notable. Bitcoin Foundation
On the other side, high Treasury yields, upcoming U.S. economic data, oil prices and geopolitical uncertainty are keeping pressure on global risk assets. Reuters
That leaves crypto traders watching more than just the price chart.
They will be watching ETF flows, U.S. employment data, Treasury yields, Federal Reserve expectations and liquidity — while also keeping an eye on whether altcoin participation broadens beyond a handful of tokens.
📌 Today's crypto picture in one sentence
Bitcoin is pushing higher, Solana and several altcoins are showing strength, PEPE is heating up and SCR is exploding — but NEAR's decline and the unsettled macro backdrop show that October's crypto rally is far from a simple straight-line move.
And that's what makes this market interesting right now. 👀
The green numbers are back. The real question is whether the strength can hold.
#BTC #ETH #CryptoMarket #Bilverse #MarketUpdate
6
3
390
·
--
Vérifié
Article
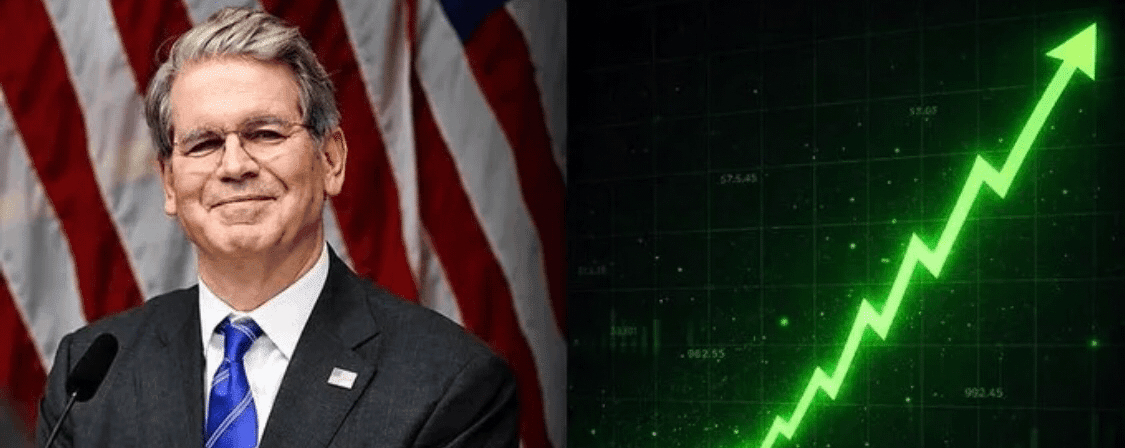
🚨 BREAKING: The U.S. Treasury Just Bought Back $6 BILLION of Its Own DebtSomething unusual just happened in the U.S. bond market. 👀
On October 1, the U.S. Treasury conducted a $6 billion buyback operation involving long-term Treasury securities.
But there’s an important catch:
This does NOT mean the U.S. just erased $6 billion from its national debt.
Treasury bought existing bonds back from investors before their scheduled maturity. And because these securities were trading below their face value, the amount of cash actually paid was lower than the $6 billion face value.
So why do this?
The Treasury says its buyback program is primarily designed to improve liquidity and market functioning, particularly for older Treasury securities that may trade less actively.
And the timing is what makes this interesting. 👀
Long-term U.S. Treasury yields have been under pressure as investors demand more compensation for holding longer-dated government debt.
That matters because Treasury yields influence borrowing costs across the financial system.
Think mortgages.
Corporate bonds.
Government borrowing.
Global financial markets.
So while $6 billion sounds massive, it's relatively small compared with the enormous size of the U.S. Treasury market and the federal government's overall debt.
The bigger story is this:
🇺🇸 The Treasury is becoming an increasingly active participant in its own bond market.
It's issuing debt.
It's managing existing debt.
And now it's buying some outstanding securities back.
That doesn't solve America's broader debt problem.
But it does show how actively Treasury officials are trying to manage liquidity and market conditions in the world's most important government bond market.
The $6 billion headline is eye-catching.
The real story is what's happening underneath the bond market.
And that's something investors around the world will be watching closely. 📊
#USDebt #FederalReserve #Economy #Bilverse #CryptoNews
🚨 BREAKING: The U.S. Treasury Just Bought Back $6 BILLION of Its Own Debt
Something unusual just happened in the U.S. bond market. 👀
On October 1, the U.S. Treasury conducted a $6 billion buyback operation involving long-term Treasury securities.
But there’s an important catch:
This does NOT mean the U.S. just erased $6 billion from its national debt.
Treasury bought existing bonds back from investors before their scheduled maturity. And because these securities were trading below their face value, the amount of cash actually paid was lower than the $6 billion face value.
So why do this?
The Treasury says its buyback program is primarily designed to improve liquidity and market functioning, particularly for older Treasury securities that may trade less actively.
And the timing is what makes this interesting. 👀
Long-term U.S. Treasury yields have been under pressure as investors demand more compensation for holding longer-dated government debt.
That matters because Treasury yields influence borrowing costs across the financial system.
Think mortgages.
Corporate bonds.
Government borrowing.
Global financial markets.
So while $6 billion sounds massive, it's relatively small compared with the enormous size of the U.S. Treasury market and the federal government's overall debt.
The bigger story is this:
🇺🇸 The Treasury is becoming an increasingly active participant in its own bond market.
It's issuing debt.
It's managing existing debt.
And now it's buying some outstanding securities back.
That doesn't solve America's broader debt problem.
But it does show how actively Treasury officials are trying to manage liquidity and market conditions in the world's most important government bond market.
The $6 billion headline is eye-catching.
The real story is what's happening underneath the bond market.
And that's something investors around the world will be watching closely. 📊
#USDebt #FederalReserve #Economy #Bilverse #CryptoNews
On October 1, the U.S. Treasury conducted a $6 billion buyback operation involving long-term Treasury securities.
But there’s an important catch:
This does NOT mean the U.S. just erased $6 billion from its national debt.
Treasury bought existing bonds back from investors before their scheduled maturity. And because these securities were trading below their face value, the amount of cash actually paid was lower than the $6 billion face value.
So why do this?
The Treasury says its buyback program is primarily designed to improve liquidity and market functioning, particularly for older Treasury securities that may trade less actively.
And the timing is what makes this interesting. 👀
Long-term U.S. Treasury yields have been under pressure as investors demand more compensation for holding longer-dated government debt.
That matters because Treasury yields influence borrowing costs across the financial system.
Think mortgages.
Corporate bonds.
Government borrowing.
Global financial markets.
So while $6 billion sounds massive, it's relatively small compared with the enormous size of the U.S. Treasury market and the federal government's overall debt.
The bigger story is this:
🇺🇸 The Treasury is becoming an increasingly active participant in its own bond market.
It's issuing debt.
It's managing existing debt.
And now it's buying some outstanding securities back.
That doesn't solve America's broader debt problem.
But it does show how actively Treasury officials are trying to manage liquidity and market conditions in the world's most important government bond market.
The $6 billion headline is eye-catching.
The real story is what's happening underneath the bond market.
And that's something investors around the world will be watching closely. 📊
#USDebt #FederalReserve #Economy #Bilverse #CryptoNews
TLTETF+0,10%
IEFETF+0,07%
1
614
·
--
Red charts don’t scare everyone. They expose everyone. 🔴
$MOVR | $ARK | $QNT
The question isn’t “How low can it go?”
The question is: “What survives when the hype disappears?”
👀 Watch.
🧠 Research.
⏳ Wait.
#MOVR #QNT #BilverseArmy #CryptoTrading
{future}(MOVRUSDT)
{future}(ARKUSDT)
{future}(QNTUSDT)
Red charts don’t scare everyone. They expose everyone. 🔴
$MOVR | $ARK | $QNT
The question isn’t “How low can it go?”
The question is: “What survives when the hype disappears?”
👀 Watch.
🧠 Research.
⏳ Wait.
#MOVR #QNT #BilverseArmy #CryptoTrading
$MOVR | $ARK | $QNT
The question isn’t “How low can it go?”
The question is: “What survives when the hype disappears?”
👀 Watch.
🧠 Research.
⏳ Wait.
#MOVR #QNT #BilverseArmy #CryptoTrading
3
1.4k
·
--
Haussier
🚨 $KOMA REVERSAL ALERT — THIS COULD GET VIOLENT! 🐕🦺🔥
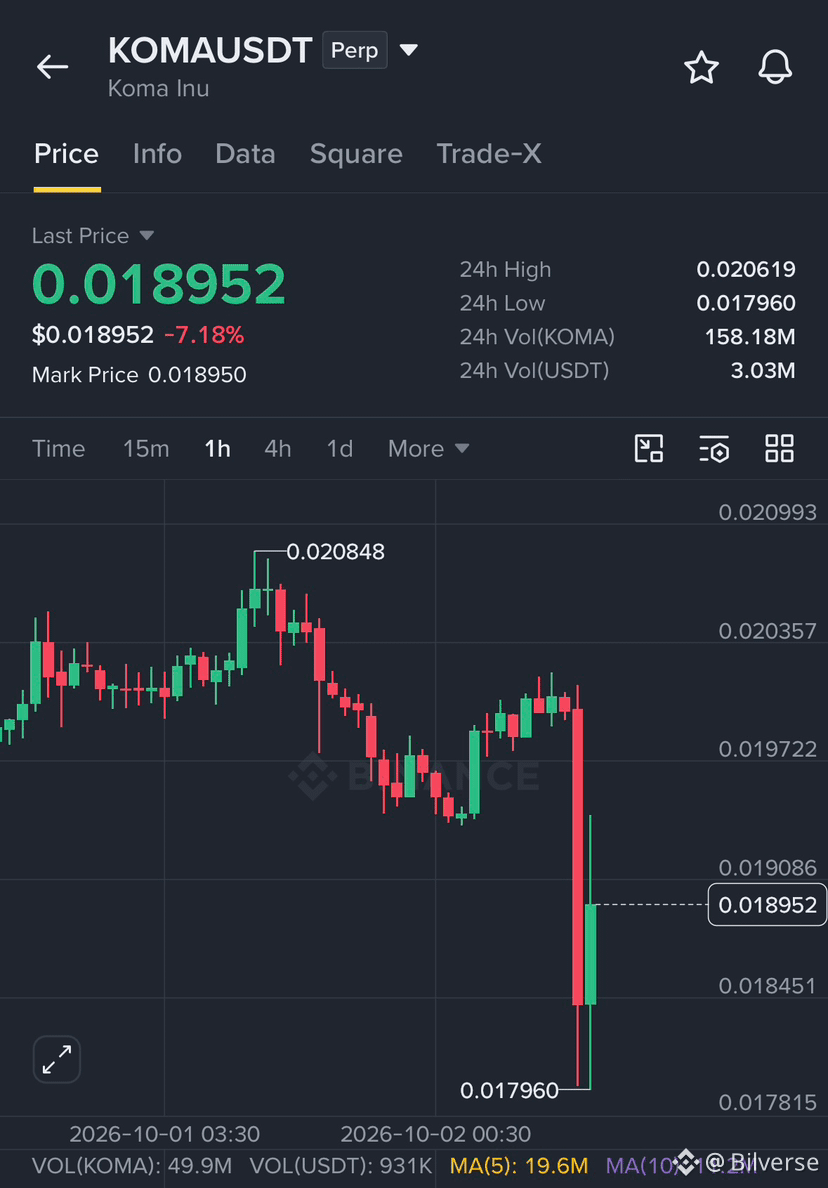
$KOMA just got SLAMMED from the highs, printing a brutal -7.18% drop and hitting a $0.017960 low before buyers stepped in aggressively. 👀
Now price is fighting back around $0.018952 — and the reversal zone is LIVE.
💎 $KOMA REVERSAL TRADE
📈 Entry: $0.018487 – $0.018673
🛑 Stop Loss: $0.017901
🎯 Targets:
TP1 → $0.019403
TP2 → $0.020182
TP3 → $0.020988
🔥 KEY LEVELS:
• Support: $0.017960
• Current price: $0.018952
• Resistance: $0.019086
If buyers defend the reversal zone and reclaim $0.019086, momentum could accelerate toward the higher targets.
⚠️ Lose $0.017901 → setup invalidated.
The dump came fast. The reversal could be even faster. 👀🚀
Who's watching #KOMA with me? 🐕🔥
#CryptoTrading #Bilverse #TradingSetup
{future}(KOMAUSDT)
🚨 $KOMA REVERSAL ALERT — THIS COULD GET VIOLENT! 🐕🦺🔥
$KOMA just got SLAMMED from the highs, printing a brutal -7.18% drop and hitting a $0.017960 low before buyers stepped in aggressively. 👀
Now price is fighting back around $0.018952 — and the reversal zone is LIVE.
💎 $KOMA REVERSAL TRADE
📈 Entry: $0.018487 – $0.018673
🛑 Stop Loss: $0.017901
🎯 Targets:
TP1 → $0.019403
TP2 → $0.020182
TP3 → $0.020988
🔥 KEY LEVELS:
• Support: $0.017960
• Current price: $0.018952
• Resistance: $0.019086
If buyers defend the reversal zone and reclaim $0.019086, momentum could accelerate toward the higher targets.
⚠️ Lose $0.017901 → setup invalidated.
The dump came fast. The reversal could be even faster. 👀🚀
Who's watching #KOMA with me? 🐕🔥
#CryptoTrading #Bilverse #TradingSetup
$KOMA just got SLAMMED from the highs, printing a brutal -7.18% drop and hitting a $0.017960 low before buyers stepped in aggressively. 👀
Now price is fighting back around $0.018952 — and the reversal zone is LIVE.
💎 $KOMA REVERSAL TRADE
📈 Entry: $0.018487 – $0.018673
🛑 Stop Loss: $0.017901
🎯 Targets:
TP1 → $0.019403
TP2 → $0.020182
TP3 → $0.020988
🔥 KEY LEVELS:
• Support: $0.017960
• Current price: $0.018952
• Resistance: $0.019086
If buyers defend the reversal zone and reclaim $0.019086, momentum could accelerate toward the higher targets.
⚠️ Lose $0.017901 → setup invalidated.
The dump came fast. The reversal could be even faster. 👀🚀
Who's watching #KOMA with me? 🐕🔥
#CryptoTrading #Bilverse #TradingSetup
826

·
--
🚨 $BTC LONG SETUP — BULLS ARE BACK IN ACTION! 🟢🔥
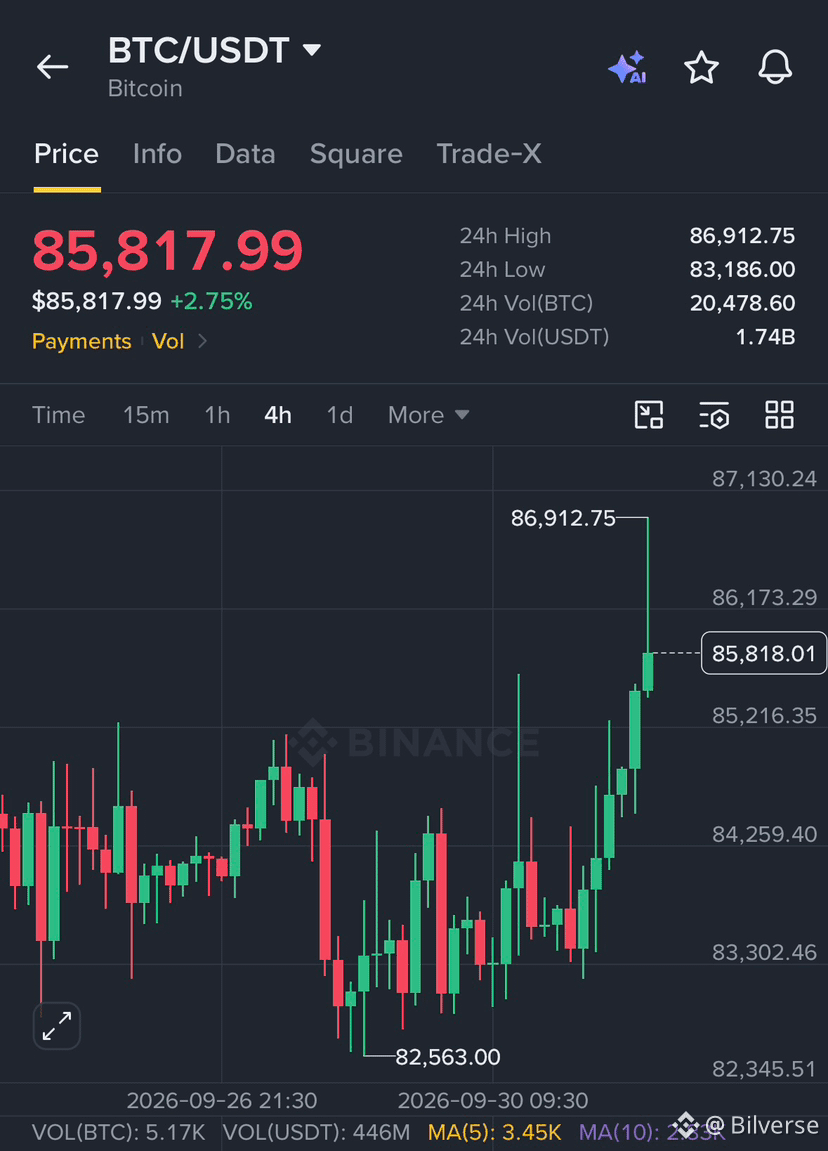
Bitcoin is showing strong momentum on the 4H chart, pushing toward the $86.9K resistance zone after bouncing from the $82,563 low.
The trend structure is setting up for another potential upside move. 👀
📈 $BTC LONG PLAN
🎯 Entry: $85,785.5 – $85,880.5
🛑 Stop Loss: $84,741.6
💰 Targets:
TP1 → $86,888
TP2 → $87,642.5
TP3 → $88,019.8
📊 Scale Out: 20% → 30% → 50%
🔥 Key level to watch: $86,912.75 — the recent high.
If BTC breaks and holds above the recent high, momentum could accelerate. If the entry zone fails and price loses the structure, the setup is invalidated.
Patience. Confirmation. Execution. 🎯
#BTC #CryptoTrading #Bullish #Bilverse #FuturesTrading
{future}(BTCUSDT)
🚨 $BTC LONG SETUP — BULLS ARE BACK IN ACTION! 🟢🔥
Bitcoin is showing strong momentum on the 4H chart, pushing toward the $86.9K resistance zone after bouncing from the $82,563 low.
The trend structure is setting up for another potential upside move. 👀
📈 $BTC LONG PLAN
🎯 Entry: $85,785.5 – $85,880.5
🛑 Stop Loss: $84,741.6
💰 Targets:
TP1 → $86,888
TP2 → $87,642.5
TP3 → $88,019.8
📊 Scale Out: 20% → 30% → 50%
🔥 Key level to watch: $86,912.75 — the recent high.
If BTC breaks and holds above the recent high, momentum could accelerate. If the entry zone fails and price loses the structure, the setup is invalidated.
Patience. Confirmation. Execution. 🎯
#BTC #CryptoTrading #Bullish #Bilverse #FuturesTrading
Bitcoin is showing strong momentum on the 4H chart, pushing toward the $86.9K resistance zone after bouncing from the $82,563 low.
The trend structure is setting up for another potential upside move. 👀
📈 $BTC LONG PLAN
🎯 Entry: $85,785.5 – $85,880.5
🛑 Stop Loss: $84,741.6
💰 Targets:
TP1 → $86,888
TP2 → $87,642.5
TP3 → $88,019.8
📊 Scale Out: 20% → 30% → 50%
🔥 Key level to watch: $86,912.75 — the recent high.
If BTC breaks and holds above the recent high, momentum could accelerate. If the entry zone fails and price loses the structure, the setup is invalidated.
Patience. Confirmation. Execution. 🎯
#BTC #CryptoTrading #Bullish #Bilverse #FuturesTrading
1
123
·
--
🚨 $QNT /USDT — BEARS ARE IN CONTROL? 🔻
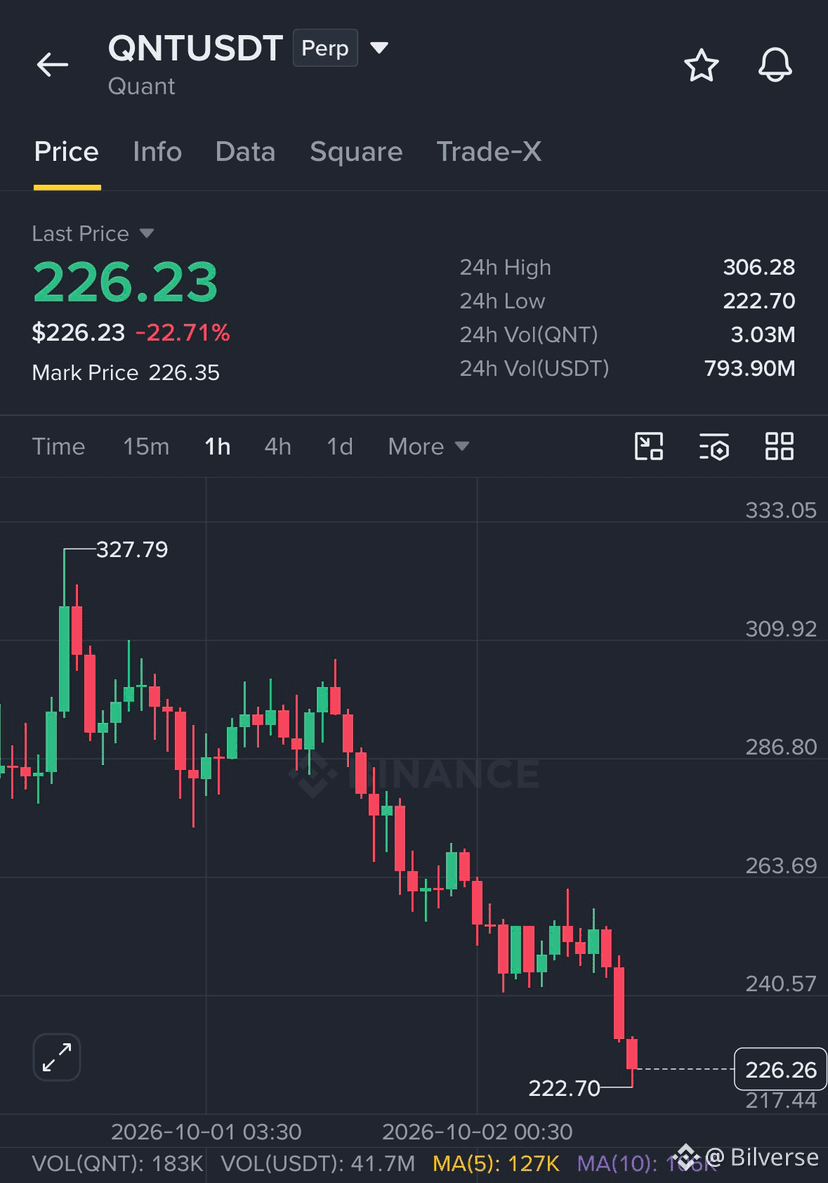
$QNT just got hit with a -22.71% dump, falling from the $306.28 resistance zone toward the $222.70 low.
Now sitting around $226.23, price is testing a critical support area. 👀
📉 SHORT SETUP
• Entry: $226–$230
• TP1: $222.70
• TP2: $217.44
• TP3: $205
• SL: $240.57
⚠️ Key levels:
🔴 Resistance: $240.57
🟢 Support: $222.70
⬇️ A clean break below $222.70 could open the door to further downside.
⬆️ Reclaiming $240.57 would weaken this bearish setup.
The trend is clearly under pressure — watch the confirmation, don't chase the candle. 🎯
#QNT #CryptoTrading #Bilverse #TradingSetup
{future}(QNTUSDT)
🚨 $QNT /USDT — BEARS ARE IN CONTROL? 🔻
$QNT just got hit with a -22.71% dump, falling from the $306.28 resistance zone toward the $222.70 low.
Now sitting around $226.23, price is testing a critical support area. 👀
📉 SHORT SETUP
• Entry: $226–$230
• TP1: $222.70
• TP2: $217.44
• TP3: $205
• SL: $240.57
⚠️ Key levels:
🔴 Resistance: $240.57
🟢 Support: $222.70
⬇️ A clean break below $222.70 could open the door to further downside.
⬆️ Reclaiming $240.57 would weaken this bearish setup.
The trend is clearly under pressure — watch the confirmation, don't chase the candle. 🎯
#QNT #CryptoTrading #Bilverse #TradingSetup
$QNT just got hit with a -22.71% dump, falling from the $306.28 resistance zone toward the $222.70 low.
Now sitting around $226.23, price is testing a critical support area. 👀
📉 SHORT SETUP
• Entry: $226–$230
• TP1: $222.70
• TP2: $217.44
• TP3: $205
• SL: $240.57
⚠️ Key levels:
🔴 Resistance: $240.57
🟢 Support: $222.70
⬇️ A clean break below $222.70 could open the door to further downside.
⬆️ Reclaiming $240.57 would weaken this bearish setup.
The trend is clearly under pressure — watch the confirmation, don't chase the candle. 🎯
#QNT #CryptoTrading #Bilverse #TradingSetup
1
734
·
--
🚨 THE EXPLOIT WASN’T THE END. THE RECOVERY WAS THE REAL STORY. 👀
Two exploits.
Two brutal drawdowns.
Two completely different recovery stories. 📈
🟠 $ZEC
A counterfeit-coin bug went undetected for years.
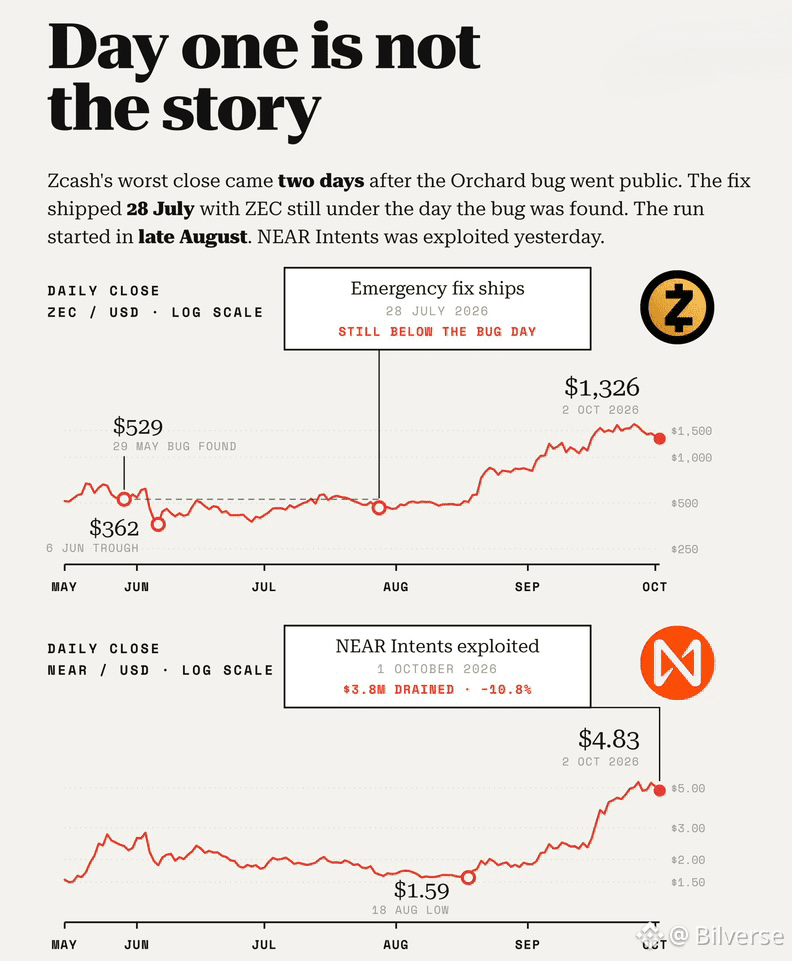
📉 ~41.7% drop over 3 sessions
🛠️ Emergency fix shipped July 28
🔐 Supply-integrity issue required a new pool
🚀 Now trading around $1,326
🟢 $NEAR
$3.8M was drained through a single USDT-on-BSC deposit path.
⚡ Patched within ~1 hour of detection
💰 Compensation promised to affected users
📈 Now trading around $4.83
And here’s the interesting part:
The exploit was only Day One.
Zcash faced a supply-integrity issue that required a protocol-level response.
NEAR Intents isolated and patched an affected deposit path.
Different vulnerabilities.
Different responses.
Different recovery paths.
Yet both markets eventually recovered — with $ZEC going on to reach a new ATH. 🚀
A vulnerability doesn’t automatically write a project’s future.
Sometimes, the bigger story is what happens after the hack. 👀
Day one is the headline.
The recovery is the story. 🔥
#ZEC #Near #CryptoMarket #Bilverse #MarketUpdate
{future}(ZECUSDT)
{future}(NEARUSDT)
🚨 THE EXPLOIT WASN’T THE END. THE RECOVERY WAS THE REAL STORY. 👀
Two exploits.
Two brutal drawdowns.
Two completely different recovery stories. 📈
🟠 $ZEC
A counterfeit-coin bug went undetected for years.
📉 ~41.7% drop over 3 sessions
🛠️ Emergency fix shipped July 28
🔐 Supply-integrity issue required a new pool
🚀 Now trading around $1,326
🟢 $NEAR
$3.8M was drained through a single USDT-on-BSC deposit path.
⚡ Patched within ~1 hour of detection
💰 Compensation promised to affected users
📈 Now trading around $4.83
And here’s the interesting part:
The exploit was only Day One.
Zcash faced a supply-integrity issue that required a protocol-level response.
NEAR Intents isolated and patched an affected deposit path.
Different vulnerabilities.
Different responses.
Different recovery paths.
Yet both markets eventually recovered — with $ZEC going on to reach a new ATH. 🚀
A vulnerability doesn’t automatically write a project’s future.
Sometimes, the bigger story is what happens after the hack. 👀
Day one is the headline.
The recovery is the story. 🔥
#ZEC #Near #CryptoMarket #Bilverse #MarketUpdate
Two exploits.
Two brutal drawdowns.
Two completely different recovery stories. 📈
🟠 $ZEC
A counterfeit-coin bug went undetected for years.
📉 ~41.7% drop over 3 sessions
🛠️ Emergency fix shipped July 28
🔐 Supply-integrity issue required a new pool
🚀 Now trading around $1,326
🟢 $NEAR
$3.8M was drained through a single USDT-on-BSC deposit path.
⚡ Patched within ~1 hour of detection
💰 Compensation promised to affected users
📈 Now trading around $4.83
And here’s the interesting part:
The exploit was only Day One.
Zcash faced a supply-integrity issue that required a protocol-level response.
NEAR Intents isolated and patched an affected deposit path.
Different vulnerabilities.
Different responses.
Different recovery paths.
Yet both markets eventually recovered — with $ZEC going on to reach a new ATH. 🚀
A vulnerability doesn’t automatically write a project’s future.
Sometimes, the bigger story is what happens after the hack. 👀
Day one is the headline.
The recovery is the story. 🔥
#ZEC #Near #CryptoMarket #Bilverse #MarketUpdate
435
·
--
790
·
--
🚨 BILVERSEARMY — THE RED PACKET IS LIVE! 🔴🧧
We’re dropping a MASSIVE ETH GIVEAWAY for all the followers ⚡️💎
Claiming is simple:
1️⃣ Follow me
2️⃣ Like this post ❤️
3️⃣ Comment “ETH” below 👇
That’s it. You’re in! 🫡🔥
Let’s make some noise and show the world what #BilverseArmy is all about. 🚀
RED PACKET ACTIVATED. 🧧🔴 ETH LOADING…
#ETH #RedPacketMission #Bilverse #Giveaway
🚨 BILVERSEARMY — THE RED PACKET IS LIVE! 🔴🧧
We’re dropping a MASSIVE ETH GIVEAWAY for all the followers ⚡️💎
Claiming is simple:
1️⃣ Follow me
2️⃣ Like this post ❤️
3️⃣ Comment “ETH” below 👇
That’s it. You’re in! 🫡🔥
Let’s make some noise and show the world what #BilverseArmy is all about. 🚀
RED PACKET ACTIVATED. 🧧🔴 ETH LOADING…
#ETH #RedPacketMission #Bilverse #Giveaway
We’re dropping a MASSIVE ETH GIVEAWAY for all the followers ⚡️💎
Claiming is simple:
1️⃣ Follow me
2️⃣ Like this post ❤️
3️⃣ Comment “ETH” below 👇
That’s it. You’re in! 🫡🔥
Let’s make some noise and show the world what #BilverseArmy is all about. 🚀
RED PACKET ACTIVATED. 🧧🔴 ETH LOADING…
#ETH #RedPacketMission #Bilverse #Giveaway

3.4k
64
245
3.4k
·
--
Another month. Another chapter closed. 📈🔥
September = DONE. ✅
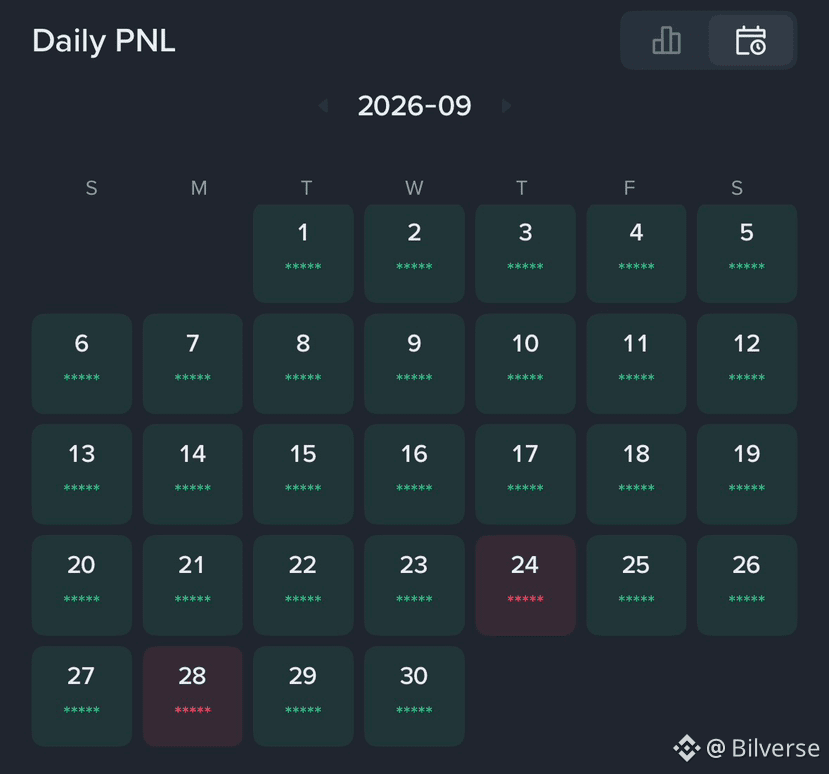
Not every day was green — and that’s exactly the point.
A few red days don’t define the journey when discipline stays consistent.
📊 28 green days
🔴 2 red days
🧠 Zero excuses
💪 One more month of execution
No chasing. No emotional decisions. Just showing up, managing risk, and letting the process compound.
Another successful month in the books. 🏆
October… we go again. 🚀
#Bilverse #TradingJourney #BilverseArmy #PnL #TradingMindset
Another month. Another chapter closed. 📈🔥
September = DONE. ✅
Not every day was green — and that’s exactly the point.
A few red days don’t define the journey when discipline stays consistent.
📊 28 green days
🔴 2 red days
🧠 Zero excuses
💪 One more month of execution
No chasing. No emotional decisions. Just showing up, managing risk, and letting the process compound.
Another successful month in the books. 🏆
October… we go again. 🚀
#Bilverse #TradingJourney #BilverseArmy #PnL #TradingMindset
September = DONE. ✅
Not every day was green — and that’s exactly the point.
A few red days don’t define the journey when discipline stays consistent.
📊 28 green days
🔴 2 red days
🧠 Zero excuses
💪 One more month of execution
No chasing. No emotional decisions. Just showing up, managing risk, and letting the process compound.
Another successful month in the books. 🏆
October… we go again. 🚀
#Bilverse #TradingJourney #BilverseArmy #PnL #TradingMindset
1
2
472
·
--
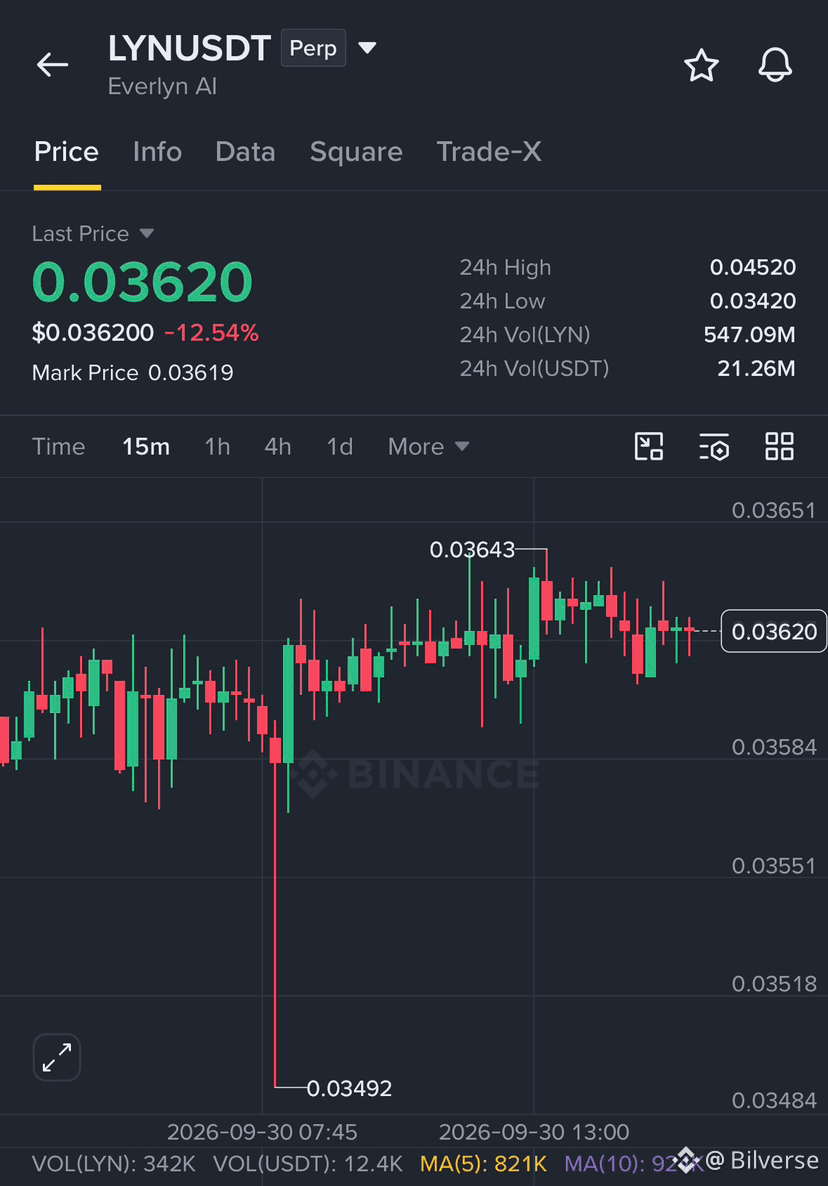
🔥 $LYN ISN’T DONE YET.
New highs. Buyers still stepping in. Momentum refusing to fade.
I’m not forcing a sell here — letting price action do the talking. 📈
$LYN /USDT — CONTINUATION LONG
🎯 Entry: $0.03603–$0.03640
🚀 TP1: $0.03978
🚀 TP2: $0.03990
🚀 TP3: $0.04112
🛑 Stop: $0.03494
The key: buyers are still defending the move.
No panic. No chasing. Just respecting the structure and letting the trade play out.
If $LYN keeps holding above the breakout area, the next leg could get interesting. 👀
Follow the trend. Respect the risk. Let the market decide.
#LYN #CryptoTrading #BilverseArmy #TradingSetup
{future}(LYNUSDT)
🔥 $LYN ISN’T DONE YET.
New highs. Buyers still stepping in. Momentum refusing to fade.
I’m not forcing a sell here — letting price action do the talking. 📈
$LYN /USDT — CONTINUATION LONG
🎯 Entry: $0.03603–$0.03640
🚀 TP1: $0.03978
🚀 TP2: $0.03990
🚀 TP3: $0.04112
🛑 Stop: $0.03494
The key: buyers are still defending the move.
No panic. No chasing. Just respecting the structure and letting the trade play out.
If $LYN keeps holding above the breakout area, the next leg could get interesting. 👀
Follow the trend. Respect the risk. Let the market decide.
#LYN #CryptoTrading #BilverseArmy #TradingSetup
New highs. Buyers still stepping in. Momentum refusing to fade.
I’m not forcing a sell here — letting price action do the talking. 📈
$LYN /USDT — CONTINUATION LONG
🎯 Entry: $0.03603–$0.03640
🚀 TP1: $0.03978
🚀 TP2: $0.03990
🚀 TP3: $0.04112
🛑 Stop: $0.03494
The key: buyers are still defending the move.
No panic. No chasing. Just respecting the structure and letting the trade play out.
If $LYN keeps holding above the breakout area, the next leg could get interesting. 👀
Follow the trend. Respect the risk. Let the market decide.
#LYN #CryptoTrading #BilverseArmy #TradingSetup
1
1.4k
·
--
Haussier
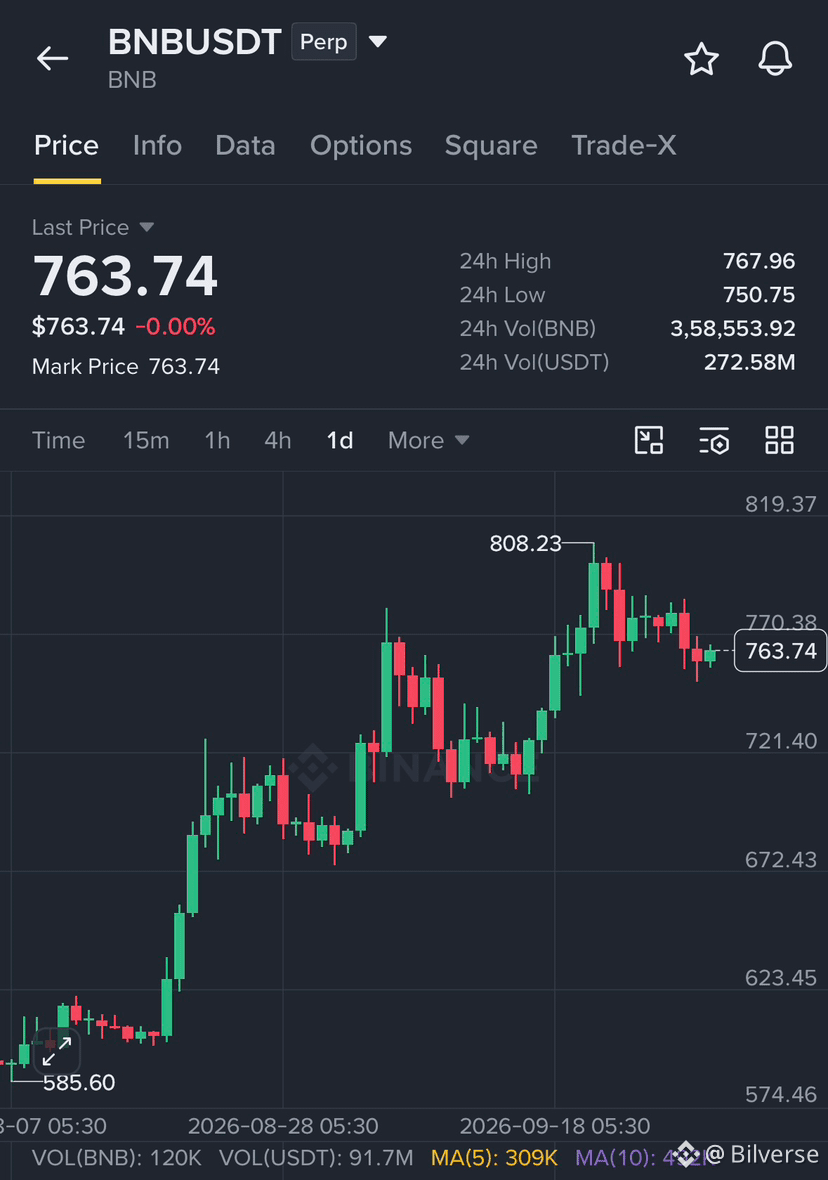
$BNB isn’t done yet. 👀🔥
Long-term bullish on $BNB — this chart looks like it’s setting up for another leg higher. 📈
The noise is for traders. The bigger picture is for believers.
Holding $BNB and watching the next move closely. 🚀💎
#BNB #BNBChain #Bullish #Bilverse #CryptoTrading
{future}(BNBUSDT)
$BNB isn’t done yet. 👀🔥
Long-term bullish on $BNB — this chart looks like it’s setting up for another leg higher. 📈
The noise is for traders. The bigger picture is for believers.
Holding $BNB and watching the next move closely. 🚀💎
#BNB #BNBChain #Bullish #Bilverse #CryptoTrading
Long-term bullish on $BNB — this chart looks like it’s setting up for another leg higher. 📈
The noise is for traders. The bigger picture is for believers.
Holding $BNB and watching the next move closely. 🚀💎
#BNB #BNBChain #Bullish #Bilverse #CryptoTrading
245
·
--
🚨 The biggest trap in crypto isn’t buying the wrong coin.
It’s thinking a cheaper coin has more upside.
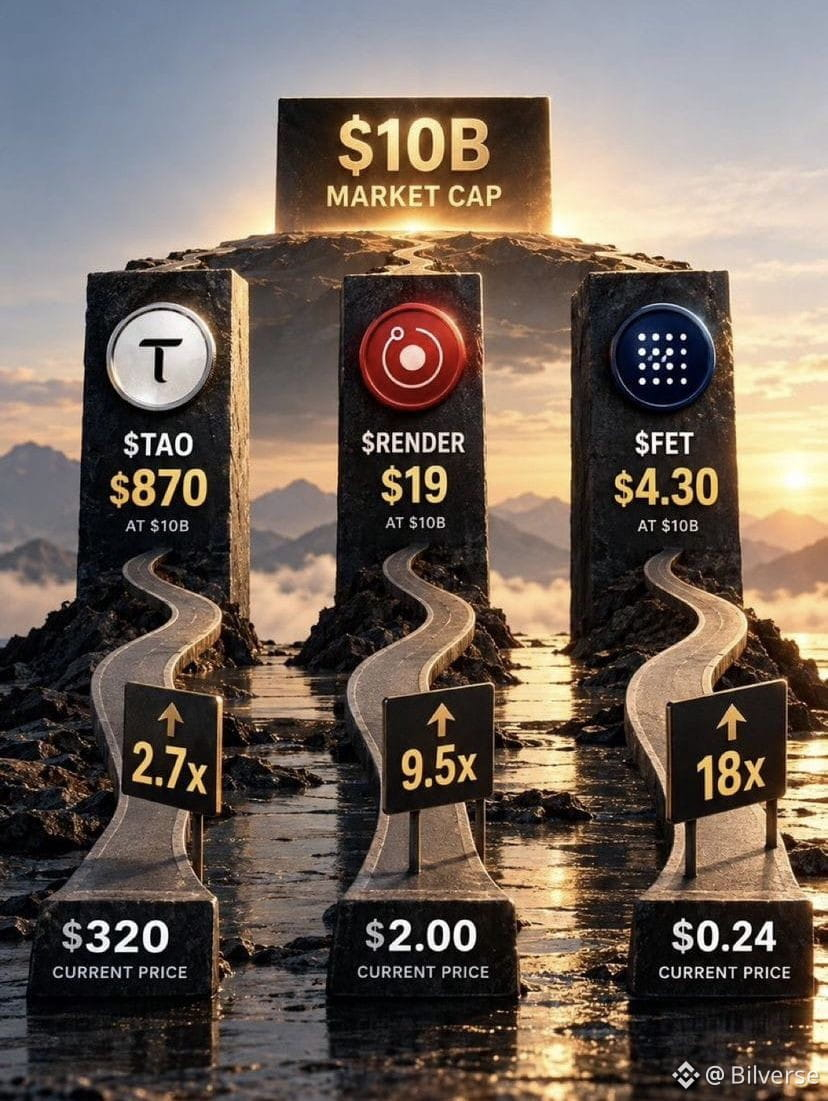
Put these 3 tokens on the same destination:
$TAO → $10B market cap
≈ $870/token
$RENDER → $10B market cap
≈ $19/token
$FET → $10B market cap
≈ $4.30/token
Now compare that with the prices shown in the graphic:
$TAO: $320 → 2.7x
$RENDER: $2 → 9.5x
$FET: $0.24 → 18x
Same $10B destination.
Completely different distance.
And this is where crypto investors get fooled:
A $0.20 coin is not automatically “cheaper” than a $200 coin.
The number printed next to the ticker tells you almost nothing by itself.
Market cap tells you the scale.
A token at $0.20 can already be enormous if the supply is huge.
A token at $300 can have a much smaller market cap if the supply is limited.
And there’s another variable people forget:
Supply keeps changing.
If new tokens enter circulation, the market cap required to reach a specific price also changes.
So stop asking:
❌ “Which coin has the lowest price?”
Start asking:
✅ “What market cap does my target price require?”
Then ask the harder question:
“What would have to happen for this project to deserve that valuation?”
Because the cheapest-looking coin can require the biggest move.
Price is the sticker.
Market cap is the scoreboard.
DYOR. The math comes before the narrative.
#TAO #FET #RENDER #BilverseArmy #CryptoMath
{future}(TAOUSDT)
{future}(RENDERUSDT)
{future}(FETUSDT)
🚨 The biggest trap in crypto isn’t buying the wrong coin.
It’s thinking a cheaper coin has more upside.
Put these 3 tokens on the same destination:
$TAO → $10B market cap
≈ $870/token
$RENDER → $10B market cap
≈ $19/token
$FET → $10B market cap
≈ $4.30/token
Now compare that with the prices shown in the graphic:
$TAO : $320 → 2.7x
$RENDER : $2 → 9.5x
$FET : $0.24 → 18x
Same $10B destination.
Completely different distance.
And this is where crypto investors get fooled:
A $0.20 coin is not automatically “cheaper” than a $200 coin.
The number printed next to the ticker tells you almost nothing by itself.
Market cap tells you the scale.
A token at $0.20 can already be enormous if the supply is huge.
A token at $300 can have a much smaller market cap if the supply is limited.
And there’s another variable people forget:
Supply keeps changing.
If new tokens enter circulation, the market cap required to reach a specific price also changes.
So stop asking:
❌ “Which coin has the lowest price?”
Start asking:
✅ “What market cap does my target price require?”
Then ask the harder question:
“What would have to happen for this project to deserve that valuation?”
Because the cheapest-looking coin can require the biggest move.
Price is the sticker.
Market cap is the scoreboard.
DYOR. The math comes before the narrative.
#TAO #FET #RENDER #BilverseArmy #CryptoMath
It’s thinking a cheaper coin has more upside.
Put these 3 tokens on the same destination:
$TAO → $10B market cap
≈ $870/token
$RENDER → $10B market cap
≈ $19/token
$FET → $10B market cap
≈ $4.30/token
Now compare that with the prices shown in the graphic:
$TAO : $320 → 2.7x
$RENDER : $2 → 9.5x
$FET : $0.24 → 18x
Same $10B destination.
Completely different distance.
And this is where crypto investors get fooled:
A $0.20 coin is not automatically “cheaper” than a $200 coin.
The number printed next to the ticker tells you almost nothing by itself.
Market cap tells you the scale.
A token at $0.20 can already be enormous if the supply is huge.
A token at $300 can have a much smaller market cap if the supply is limited.
And there’s another variable people forget:
Supply keeps changing.
If new tokens enter circulation, the market cap required to reach a specific price also changes.
So stop asking:
❌ “Which coin has the lowest price?”
Start asking:
✅ “What market cap does my target price require?”
Then ask the harder question:
“What would have to happen for this project to deserve that valuation?”
Because the cheapest-looking coin can require the biggest move.
Price is the sticker.
Market cap is the scoreboard.
DYOR. The math comes before the narrative.
#TAO #FET #RENDER #BilverseArmy #CryptoMath
979
·
--
Everyone waiting for $BTC to hit $50K 😂
Meanwhile, $BTC: “That was the bottom, bro.” 🚀
50K WAITERS: 🧍🧍🧍
#BTC #CryptoTrading #Bilverse #Meme
Everyone waiting for $BTC to hit $50K 😂
Meanwhile, $BTC : “That was the bottom, bro.” 🚀
50K WAITERS: 🧍🧍🧍
#BTC #CryptoTrading #Bilverse #Meme
Meanwhile, $BTC : “That was the bottom, bro.” 🚀
50K WAITERS: 🧍🧍🧍
#BTC #CryptoTrading #Bilverse #Meme

341
·
--
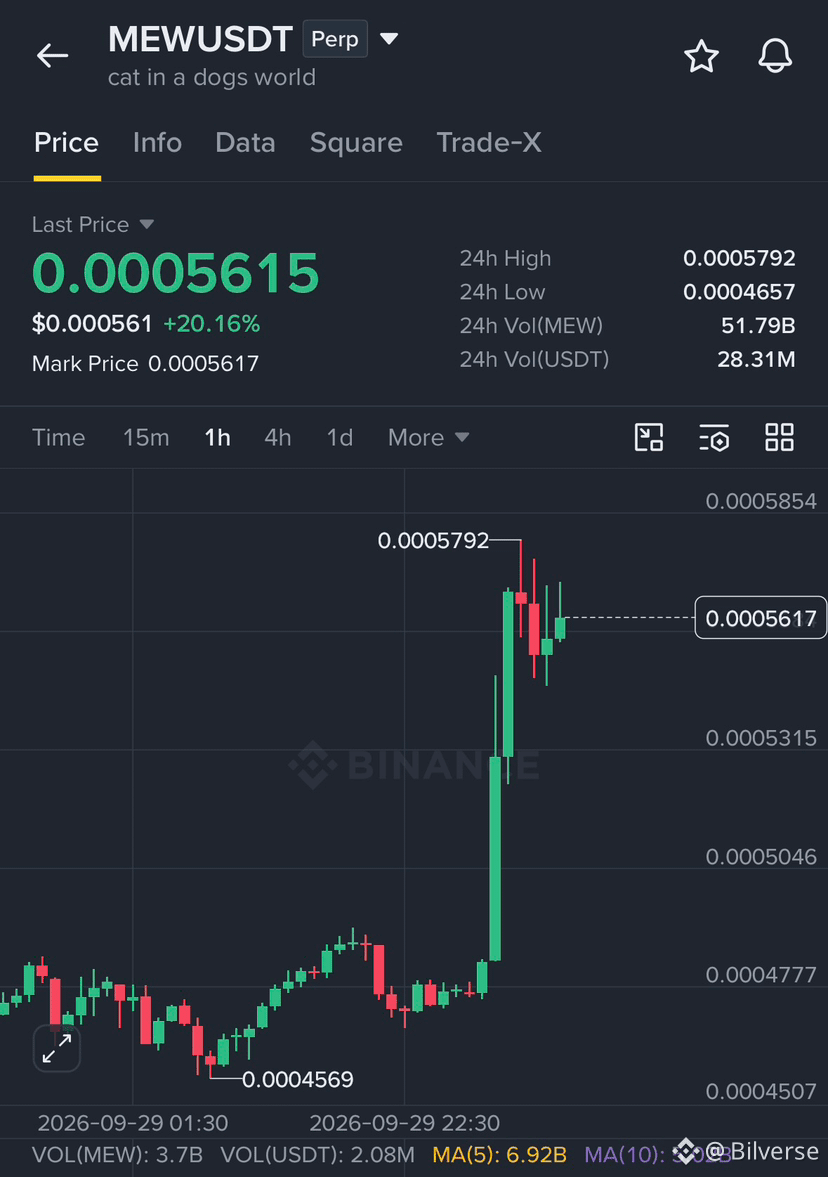
🚨 $MEW LONG SETUP — 1H WATCHLIST 🐱🔥
$MEW just ripped +20% and momentum is heating up.
But chasing the candle here? ❌
The setup is all about the retest.
🎯 Entry: $0.0005458–$0.0005504
🛑 Stop Loss: $0.0005124
📈 Targets:
TP1 — $0.0005792
TP2 — $0.0006021
TP3 — $0.0006250
💰 Scale out: 20% / 30% / 50%
⚠️ Price has already moved away from the planned entry, so patience matters. Current estimated EV is -0.21R → WATCHLIST ONLY until confirmation/retest.
No FOMO. No chasing.
Let $MEW come to the level. 🐱⚡
NFA. Manage risk.
#MEW #CryptoTrading #Memecoins #Bilverse #Watchlist
{future}(MEWUSDT)
🚨 $MEW LONG SETUP — 1H WATCHLIST 🐱🔥
$MEW just ripped +20% and momentum is heating up.
But chasing the candle here? ❌
The setup is all about the retest.
🎯 Entry: $0.0005458–$0.0005504
🛑 Stop Loss: $0.0005124
📈 Targets:
TP1 — $0.0005792
TP2 — $0.0006021
TP3 — $0.0006250
💰 Scale out: 20% / 30% / 50%
⚠️ Price has already moved away from the planned entry, so patience matters. Current estimated EV is -0.21R → WATCHLIST ONLY until confirmation/retest.
No FOMO. No chasing.
Let $MEW come to the level. 🐱⚡
NFA. Manage risk.
#MEW #CryptoTrading #Memecoins #Bilverse #Watchlist
$MEW just ripped +20% and momentum is heating up.
But chasing the candle here? ❌
The setup is all about the retest.
🎯 Entry: $0.0005458–$0.0005504
🛑 Stop Loss: $0.0005124
📈 Targets:
TP1 — $0.0005792
TP2 — $0.0006021
TP3 — $0.0006250
💰 Scale out: 20% / 30% / 50%
⚠️ Price has already moved away from the planned entry, so patience matters. Current estimated EV is -0.21R → WATCHLIST ONLY until confirmation/retest.
No FOMO. No chasing.
Let $MEW come to the level. 🐱⚡
NFA. Manage risk.
#MEW #CryptoTrading #Memecoins #Bilverse #Watchlist
348
·
--

Article
Markets Are Sending Mixed Signals Today: Bitcoin Holds, Tech Stocks Split & One Crypto Crashes 14%September 30, 2026 | Markets Update
Wall Street and crypto are telling two very different stories today.
Bitcoin is holding relatively steady. Ethereum is edging higher. Some major technology stocks are climbing—but others are sliding sharply.
And in crypto, the gap between winners and losers is getting even wider.
Here’s what is happening across the markets today. 👇
📈 The Big Movers Everyone Is Watching
From the market data shown today:
🟢 Stocks moving higher
Meta (META): +3.32%
Meta is one of the strongest names on the screen, gaining more than 3%.
Micron (MU): +1.08%
The semiconductor stock is also trading higher.
SpaceX (SPCX): +2.79%
The stock is showing another notable move, according to the displayed market data.
SanDisk (SNDK): +0.98%
🔴 Stocks under pressure
Apple (AAPL): -2.67%
Apple is among the biggest decliners shown.
Tesla (TSLA): -1.22%
Nvidia (NVDA): -0.77%
AMD and Intel are essentially flat in comparison, with moves of around 0%.
₿ Bitcoin Is Staying Surprisingly Calm
Bitcoin is trading around $83,597 up approximately 0.25% over 24 hours.
Ethereum is also slightly positive:
ETH: $2,690 | +0.58%
Meanwhile:
XRP: +0.35%Solana: +0.35%Dogecoin: +0.34%Cardano: -0.29%Litecoin: -2.26%Chainlink: -2.96%
At first glance, this looks relatively calm.
But then you look at the altcoin market.
⚠️ The Crypto Market Has a Wild Split
Two numbers immediately stand out:
🚀 NEAR: +5.35%
NEAR is the strongest gainer among the cryptocurrencies shown.
💥 HBAR: -14.27%
HBAR is experiencing a dramatically different session, falling more than 14%.
That is an important reminder: Bitcoin's stability doesn't necessarily mean the entire crypto market is stable.
Large-cap cryptocurrencies can remain relatively calm while individual altcoins experience double-digit moves.
🧠 Why Are Markets So Uneven?
One major factor investors are watching is interest rates and Treasury yields.
Higher yields can put pressure on growth and technology stocks because investors can obtain relatively attractive returns from bonds while future corporate earnings become less valuable in present-value terms.
At the same time, artificial intelligence remains a major force behind technology investment and investor interest.
That creates an unusual environment:
AI optimism + high valuations + elevated yields = a market where individual stocks can move very differently.
Crypto is facing its own version of the same tension, with macroeconomic conditions competing with crypto-specific catalysts.
👀 The Real Story Isn't "Stocks Up" or "Crypto Down"
Look at the numbers.
META +3.32%
AAPL -2.67%
NEAR +5.35%
HBAR -14.27%
BTC +0.25%
ETH +0.58%
This isn't a market moving in one direction.
It's a stock-picker's and asset-picker's market, where the performance of individual assets can differ dramatically.
And that's arguably the most interesting part of today's session.
🔥 What Investors Should Watch Next
The biggest question isn't whether today's screen is green or red.
It's whether this divergence continues.
Investors will be watching:
🇺🇸 U.S. inflation data
📊 Treasury yields
🤖 AI and semiconductor stocks
₿ Bitcoin's next major move
⚡ Altcoin volatility
🛢️ Oil prices and their impact on inflation
If yields continue rising, growth-oriented assets could remain sensitive.
If inflation pressures ease, expectations around monetary policy could change—and markets could react quickly.
Bottom Line
Today's market isn't giving investors one clear signal.
Technology stocks are split.
Bitcoin and Ethereum are relatively stable.
And altcoins are showing significantly larger moves in both directions.
The standout numbers tell the story:
META +3.32%
NEAR +5.35%
AAPL -2.67%
LINK -2.96%
HBAR -14.27%
One market. Very different stories.
And with investors watching interest rates, inflation and AI spending closely, the next major market catalyst could quickly change the picture.
📲 Share-worthy social caption
🚨 MARKET UPDATE: Stocks and crypto are moving in completely different directions today.
📈 META +3.32%
🚀 NEAR +5.35%
₿ BTC +0.25%
📉 AAPL -2.67%
💥 HBAR -14.27%
The biggest story isn't whether markets are up or down—it's the huge gap between individual winners and losers.
What are you watching today: stocks or crypto? 👀
#BTC #ETH #NVIDIA #Bilverse #MarketUpdate
{future}(BTCUSDT)
{future}(LINKUSDT)
{future}(NVDAUSDT)
Markets Are Sending Mixed Signals Today: Bitcoin Holds, Tech Stocks Split & One Crypto Crashes 14%
September 30, 2026 | Markets Update
Wall Street and crypto are telling two very different stories today.
Bitcoin is holding relatively steady. Ethereum is edging higher. Some major technology stocks are climbing—but others are sliding sharply.
And in crypto, the gap between winners and losers is getting even wider.
Here’s what is happening across the markets today. 👇
📈 The Big Movers Everyone Is Watching
From the market data shown today:
🟢 Stocks moving higher
Meta (META): +3.32%
Meta is one of the strongest names on the screen, gaining more than 3%.
Micron (MU): +1.08%
The semiconductor stock is also trading higher.
SpaceX (SPCX): +2.79%
The stock is showing another notable move, according to the displayed market data.
SanDisk (SNDK): +0.98%
🔴 Stocks under pressure
Apple (AAPL): -2.67%
Apple is among the biggest decliners shown.
Tesla (TSLA): -1.22%
Nvidia (NVDA): -0.77%
AMD and Intel are essentially flat in comparison, with moves of around 0%.
₿ Bitcoin Is Staying Surprisingly Calm
Bitcoin is trading around $83,597 up approximately 0.25% over 24 hours.
Ethereum is also slightly positive:
ETH: $2,690 | +0.58%
Meanwhile:
XRP: +0.35%Solana: +0.35%Dogecoin: +0.34%Cardano: -0.29%Litecoin: -2.26%Chainlink: -2.96%
At first glance, this looks relatively calm.
But then you look at the altcoin market.
⚠️ The Crypto Market Has a Wild Split
Two numbers immediately stand out:
🚀 NEAR: +5.35%
NEAR is the strongest gainer among the cryptocurrencies shown.
💥 HBAR: -14.27%
HBAR is experiencing a dramatically different session, falling more than 14%.
That is an important reminder: Bitcoin's stability doesn't necessarily mean the entire crypto market is stable.
Large-cap cryptocurrencies can remain relatively calm while individual altcoins experience double-digit moves.
🧠 Why Are Markets So Uneven?
One major factor investors are watching is interest rates and Treasury yields.
Higher yields can put pressure on growth and technology stocks because investors can obtain relatively attractive returns from bonds while future corporate earnings become less valuable in present-value terms.
At the same time, artificial intelligence remains a major force behind technology investment and investor interest.
That creates an unusual environment:
AI optimism + high valuations + elevated yields = a market where individual stocks can move very differently.
Crypto is facing its own version of the same tension, with macroeconomic conditions competing with crypto-specific catalysts.
👀 The Real Story Isn't "Stocks Up" or "Crypto Down"
Look at the numbers.
META +3.32%
AAPL -2.67%
NEAR +5.35%
HBAR -14.27%
BTC +0.25%
ETH +0.58%
This isn't a market moving in one direction.
It's a stock-picker's and asset-picker's market, where the performance of individual assets can differ dramatically.
And that's arguably the most interesting part of today's session.
🔥 What Investors Should Watch Next
The biggest question isn't whether today's screen is green or red.
It's whether this divergence continues.
Investors will be watching:
🇺🇸 U.S. inflation data
📊 Treasury yields
🤖 AI and semiconductor stocks
₿ Bitcoin's next major move
⚡ Altcoin volatility
🛢️ Oil prices and their impact on inflation
If yields continue rising, growth-oriented assets could remain sensitive.
If inflation pressures ease, expectations around monetary policy could change—and markets could react quickly.
Bottom Line
Today's market isn't giving investors one clear signal.
Technology stocks are split.
Bitcoin and Ethereum are relatively stable.
And altcoins are showing significantly larger moves in both directions.
The standout numbers tell the story:
META +3.32%
NEAR +5.35%
AAPL -2.67%
LINK -2.96%
HBAR -14.27%
One market. Very different stories.
And with investors watching interest rates, inflation and AI spending closely, the next major market catalyst could quickly change the picture.
📲 Share-worthy social caption
🚨 MARKET UPDATE: Stocks and crypto are moving in completely different directions today.
📈 META +3.32%
🚀 NEAR +5.35%
₿ BTC +0.25%
📉 AAPL -2.67%
💥 HBAR -14.27%
The biggest story isn't whether markets are up or down—it's the huge gap between individual winners and losers.
What are you watching today: stocks or crypto? 👀
#BTC #ETH #NVIDIA #Bilverse #MarketUpdate
Wall Street and crypto are telling two very different stories today.
Bitcoin is holding relatively steady. Ethereum is edging higher. Some major technology stocks are climbing—but others are sliding sharply.
And in crypto, the gap between winners and losers is getting even wider.
Here’s what is happening across the markets today. 👇
📈 The Big Movers Everyone Is Watching
From the market data shown today:
🟢 Stocks moving higher
Meta (META): +3.32%
Meta is one of the strongest names on the screen, gaining more than 3%.
Micron (MU): +1.08%
The semiconductor stock is also trading higher.
SpaceX (SPCX): +2.79%
The stock is showing another notable move, according to the displayed market data.
SanDisk (SNDK): +0.98%
🔴 Stocks under pressure
Apple (AAPL): -2.67%
Apple is among the biggest decliners shown.
Tesla (TSLA): -1.22%
Nvidia (NVDA): -0.77%
AMD and Intel are essentially flat in comparison, with moves of around 0%.
₿ Bitcoin Is Staying Surprisingly Calm
Bitcoin is trading around $83,597 up approximately 0.25% over 24 hours.
Ethereum is also slightly positive:
ETH: $2,690 | +0.58%
Meanwhile:
XRP: +0.35%Solana: +0.35%Dogecoin: +0.34%Cardano: -0.29%Litecoin: -2.26%Chainlink: -2.96%
At first glance, this looks relatively calm.
But then you look at the altcoin market.
⚠️ The Crypto Market Has a Wild Split
Two numbers immediately stand out:
🚀 NEAR: +5.35%
NEAR is the strongest gainer among the cryptocurrencies shown.
💥 HBAR: -14.27%
HBAR is experiencing a dramatically different session, falling more than 14%.
That is an important reminder: Bitcoin's stability doesn't necessarily mean the entire crypto market is stable.
Large-cap cryptocurrencies can remain relatively calm while individual altcoins experience double-digit moves.
🧠 Why Are Markets So Uneven?
One major factor investors are watching is interest rates and Treasury yields.
Higher yields can put pressure on growth and technology stocks because investors can obtain relatively attractive returns from bonds while future corporate earnings become less valuable in present-value terms.
At the same time, artificial intelligence remains a major force behind technology investment and investor interest.
That creates an unusual environment:
AI optimism + high valuations + elevated yields = a market where individual stocks can move very differently.
Crypto is facing its own version of the same tension, with macroeconomic conditions competing with crypto-specific catalysts.
👀 The Real Story Isn't "Stocks Up" or "Crypto Down"
Look at the numbers.
META +3.32%
AAPL -2.67%
NEAR +5.35%
HBAR -14.27%
BTC +0.25%
ETH +0.58%
This isn't a market moving in one direction.
It's a stock-picker's and asset-picker's market, where the performance of individual assets can differ dramatically.
And that's arguably the most interesting part of today's session.
🔥 What Investors Should Watch Next
The biggest question isn't whether today's screen is green or red.
It's whether this divergence continues.
Investors will be watching:
🇺🇸 U.S. inflation data
📊 Treasury yields
🤖 AI and semiconductor stocks
₿ Bitcoin's next major move
⚡ Altcoin volatility
🛢️ Oil prices and their impact on inflation
If yields continue rising, growth-oriented assets could remain sensitive.
If inflation pressures ease, expectations around monetary policy could change—and markets could react quickly.
Bottom Line
Today's market isn't giving investors one clear signal.
Technology stocks are split.
Bitcoin and Ethereum are relatively stable.
And altcoins are showing significantly larger moves in both directions.
The standout numbers tell the story:
META +3.32%
NEAR +5.35%
AAPL -2.67%
LINK -2.96%
HBAR -14.27%
One market. Very different stories.
And with investors watching interest rates, inflation and AI spending closely, the next major market catalyst could quickly change the picture.
📲 Share-worthy social caption
🚨 MARKET UPDATE: Stocks and crypto are moving in completely different directions today.
📈 META +3.32%
🚀 NEAR +5.35%
₿ BTC +0.25%
📉 AAPL -2.67%
💥 HBAR -14.27%
The biggest story isn't whether markets are up or down—it's the huge gap between individual winners and losers.
What are you watching today: stocks or crypto? 👀
#BTC #ETH #NVIDIA #Bilverse #MarketUpdate
2
835
·
--
🧧 $ETH Red Packets are here! Who all are getting lucky? 👀🔥
#ETH #Bilverse #BilverseArmy #RedPacketMission
🧧 $ETH Red Packets are here! Who all are getting lucky? 👀🔥
#ETH #Bilverse #BilverseArmy #RedPacketMission
#ETH #Bilverse #BilverseArmy #RedPacketMission
Bilverse
·
--
🔥🧧 THE ETH RED PACKET DROP IS HERE! 🧧🔥
Think your crypto luck is about to change? 👀
The #Bilverse ETH Giveaway is bringing the community together—and your entry takes just a few seconds. 🚀
🎯 HOW TO JOIN:
1️⃣ FOLLOW @Bilverse
2️⃣ COMMENT “4000” 👇
3️⃣ TAG a friend who loves crypto 🫂
💰 Why miss the action?
✨ Simple entry
🔥 Community-powered energy
💎 ETH giveaway opportunity
🌎 Bring your crypto squad
🚨 Drop “4000” below + tag your crypto buddy!
Let’s see how loud the #BilverseArmy can get. 🦾🔥
#ETH #RedPacketMission #CryptoCommunity
Think your crypto luck is about to change? 👀
The #Bilverse ETH Giveaway is bringing the community together—and your entry takes just a few seconds. 🚀
🎯 HOW TO JOIN:
1️⃣ FOLLOW @Bilverse
2️⃣ COMMENT “4000” 👇
3️⃣ TAG a friend who loves crypto 🫂
💰 Why miss the action?
✨ Simple entry
🔥 Community-powered energy
💎 ETH giveaway opportunity
🌎 Bring your crypto squad
🚨 Drop “4000” below + tag your crypto buddy!
Let’s see how loud the #BilverseArmy can get. 🦾🔥
#ETH #RedPacketMission #CryptoCommunity

1
3
1.3k
·
--
Haussier
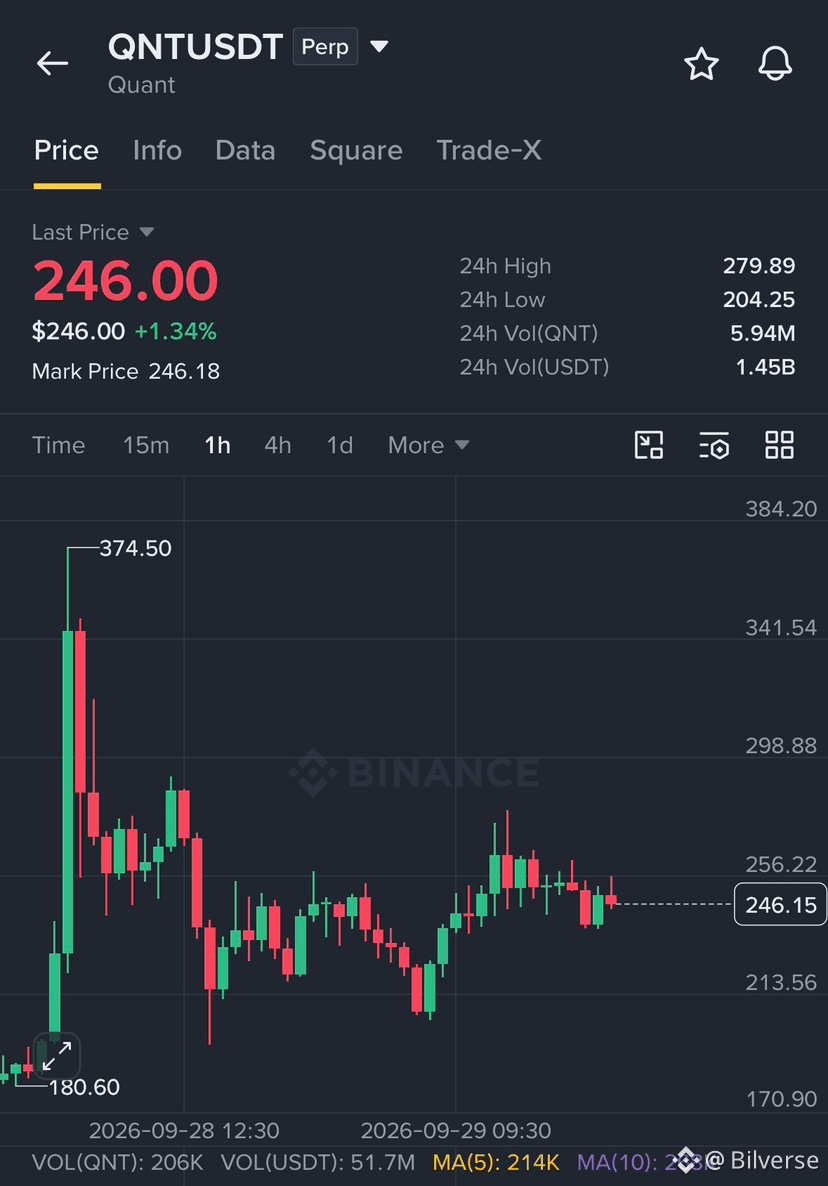
🚨 $QNT /USDT BULLISH RECOVERY SETUP IS LIVE! 🚀
$QNT is holding the $240–$249 recovery zone as buyers continue defending the recent move. 👀
📍 ENTRY: $240–$249
🎯 TP1: $260
🎯 TP2: $275
🎯 TP3: $295
🛑 SL: $228
🔥 KEY LEVEL: $240
If $QNT continues holding above this zone, the next resistance areas to watch are $260 → $275 → $295.
📊 Current price: ~$246
📈 24H change: +1.34%
💰 24H volume: ~$1.45B
⚠️ Trade with a plan and manage risk. Levels can fail, especially in volatile markets.
#QNT #CryptoTrading #Bilverse #TradeSetup
{future}(QNTUSDT)
🚨 $QNT /USDT BULLISH RECOVERY SETUP IS LIVE! 🚀
$QNT is holding the $240–$249 recovery zone as buyers continue defending the recent move. 👀
📍 ENTRY: $240–$249
🎯 TP1: $260
🎯 TP2: $275
🎯 TP3: $295
🛑 SL: $228
🔥 KEY LEVEL: $240
If $QNT continues holding above this zone, the next resistance areas to watch are $260 → $275 → $295.
📊 Current price: ~$246
📈 24H change: +1.34%
💰 24H volume: ~$1.45B
⚠️ Trade with a plan and manage risk. Levels can fail, especially in volatile markets.
#QNT #CryptoTrading #Bilverse #TradeSetup
$QNT is holding the $240–$249 recovery zone as buyers continue defending the recent move. 👀
📍 ENTRY: $240–$249
🎯 TP1: $260
🎯 TP2: $275
🎯 TP3: $295
🛑 SL: $228
🔥 KEY LEVEL: $240
If $QNT continues holding above this zone, the next resistance areas to watch are $260 → $275 → $295.
📊 Current price: ~$246
📈 24H change: +1.34%
💰 24H volume: ~$1.45B
⚠️ Trade with a plan and manage risk. Levels can fail, especially in volatile markets.
#QNT #CryptoTrading #Bilverse #TradeSetup
1
2
696
Connectez-vous pour découvrir plus de contenu
Rejoignez la communauté mondiale des adeptes de cryptomonnaies sur Binance Square
⚡️ Suviez les dernières informations importantes sur les cryptomonnaies.
💬 Jugé digne de confiance par la plus grande plateforme d’échange de cryptomonnaies au monde.
👍 Découvrez les connaissances que partagent les créateurs vérifiés.
Adresse e-mail/Nº de téléphone