

#gold_update
gold_update
2.2M vues
5,321 mentions
Populaire
Récents

Article
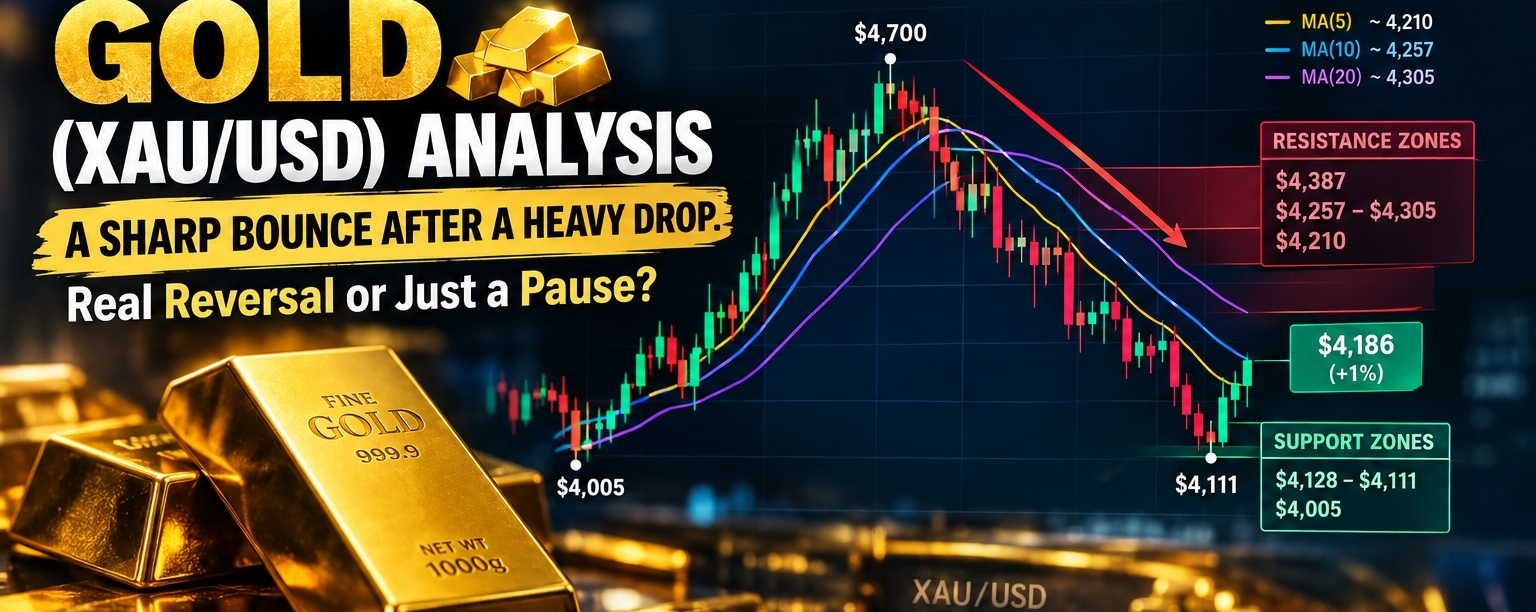
GOLD (XAU/USD) ANALYSIS: A Sharp Bounce After a Heavy Drop. Real Reversal or Just a Pause?◆━━━━━━━━━━━━━━━━━━◆
Gold just gave traders a wild ride.
After a sudden two-day selloff that pushed price down to the $4,111 area, XAU/USD is now trading near $4,186, up about 1% on the day. That's a nice green candle. But here's the question every trader is asking:
Is this the start of something bigger, or just a relief bounce inside a downtrend?
Let's break it down step by step.
◆━━━━━━━━━━━━━━━━━━◆
① THE BIG PICTURE (DAILY CHART)
◆━━━━━━━━━━━━━━━━━━◆
➤ Gold rallied strongly from around $4,005 in late July/August to a swing high near $4,700
➤ Since then, price has been making lower highs and lower lows
➤ The latest drop was a large red candle, followed by a small recovery candle
➤ Gold's 52-week range is huge, with a peak around $5,600 back in January 2026, so today's price is still far below that cycle high
✔︎ Translation: The long-term story is still strong, but the short-term structure has cooled off. Both things can be true at once.
◆━━━━━━━━━━━━━━━━━━◆
② MOVING AVERAGES: THE REALITY CHECK
◆━━━━━━━━━━━━━━━━━━◆
Here's what the daily chart is showing right now:
➜ MA(5): around 4,210
➜ MA(10): around 4,257
➜ MA(20): around 4,305
Price is trading BELOW all three, and they are stacked in a downward order (fast under slow).
What does that mean in plain English?
Sellers have still had the upper hand recently, and the bounce has not yet reclaimed these averages. Many traders watch a daily close back above them as a sign that momentum may be shifting.
Until then, the bounce needs confirmation.
◆━━━━━━━━━━━━━━━━━━◆
③ KEY LEVELS TO WATCH
◆━━━━━━━━━━━━━━━━━━◆
Support Zones (where buyers stepped in before):
➤ $4,128 – $4,111 → Recent day low and the area of the latest reaction
➤ $4,005 → Major swing low on the chart
Resistance Zones (where price may struggle):
➤ $4,210 → MA(5) area
➤ $4,257 – $4,305 → MA(10) and MA(20) cluster
➤ $4,387 → Previous consolidation zone
✔︎ The tighter these levels are respected, the cleaner the story becomes.
Watch how price behaves when it reaches them. That reaction tells you more than any prediction.
◆━━━━━━━━━━━━━━━━━━◆
④ WHAT'S MOVING GOLD RIGHT NOW?
◆━━━━━━━━━━━━━━━━━━◆
Gold doesn't move in a vacuum. Here are the forces in play:
① US Dollar & Yields → Gold is priced in dollars, so a stronger dollar or higher yields usually add pressure.
② Fed Policy → A hawkish Fed move recently weighed on gold, while a pullback in Treasury yields helped it recover.
③ Geopolitics → Geopolitical conflict, debt concerns, and hawkish rhetoric are keeping markets on edge.
④ Data Week → Consumer confidence, JOLTS, ADP employment, and US GDP are all due, so volatility can spike.
Big data days = big candles. Expect fast moves and wider spreads.
◆━━━━━━━━━━━━━━━━━━◆
⑤ TWO SCENARIOS TO KEEP IN MIND
◆━━━━━━━━━━━━━━━━━━◆
These are not predictions. They're simply the two paths traders are watching:
➜ Scenario A: Bounce Continues
Price reclaims the short-term average zone and holds above it. That would suggest buyers are regaining control.
➜ Scenario B: Bounce Fades
Price stalls near resistance and rolls back toward recent support. That would suggest the downtrend is still in charge.
The market decides, not us. Your job is to be prepared for both.
◆━━━━━━━━━━━━━━━━━━◆
⑥ SMART TRADER CHECKLIST
◆━━━━━━━━━━━━━━━━━━◆
✔︎ Don't chase a single green candle
✔︎ Wait for confirmation, not excitement
✔︎ Size your position so one bad trade can't hurt you
✔︎ Always know where you're wrong BEFORE you enter
✔︎ Be extra careful around major news releases
✔︎ Gold can be volatile, and leveraged products can amplify losses fast
◆━━━━━━━━━━━━━━━━━━◆
FINAL THOUGHTS
◆━━━━━━━━━━━━━━━━━━◆
Gold is at a crossroads. The long-term picture remains impressive, but the daily chart still needs proof that this bounce has real strength behind it.
The best traders I know don't try to guess the next move.
They read the levels.
They respect the risk.
And they let price show its hand.
So what's your read on gold right now?
Do you see this as a bounce or a real reversal? Drop your view in the comments!
Share this with a trader friend who's watching XAU.
Follow for more clean, no-hype market breakdowns.
#xau #XAUUSD #GOLD_UPDATE $XAU
{future}(XAUUSDT)
$XAUT
{future}(XAUTUSDT)
GOLD (XAU/USD) ANALYSIS: A Sharp Bounce After a Heavy Drop. Real Reversal or Just a Pause?
◆━━━━━━━━━━━━━━━━━━◆
Gold just gave traders a wild ride.
After a sudden two-day selloff that pushed price down to the $4,111 area, XAU/USD is now trading near $4,186, up about 1% on the day. That's a nice green candle. But here's the question every trader is asking:
Is this the start of something bigger, or just a relief bounce inside a downtrend?
Let's break it down step by step.
◆━━━━━━━━━━━━━━━━━━◆
① THE BIG PICTURE (DAILY CHART)
◆━━━━━━━━━━━━━━━━━━◆
➤ Gold rallied strongly from around $4,005 in late July/August to a swing high near $4,700
➤ Since then, price has been making lower highs and lower lows
➤ The latest drop was a large red candle, followed by a small recovery candle
➤ Gold's 52-week range is huge, with a peak around $5,600 back in January 2026, so today's price is still far below that cycle high
✔︎ Translation: The long-term story is still strong, but the short-term structure has cooled off. Both things can be true at once.
◆━━━━━━━━━━━━━━━━━━◆
② MOVING AVERAGES: THE REALITY CHECK
◆━━━━━━━━━━━━━━━━━━◆
Here's what the daily chart is showing right now:
➜ MA(5): around 4,210
➜ MA(10): around 4,257
➜ MA(20): around 4,305
Price is trading BELOW all three, and they are stacked in a downward order (fast under slow).
What does that mean in plain English?
Sellers have still had the upper hand recently, and the bounce has not yet reclaimed these averages. Many traders watch a daily close back above them as a sign that momentum may be shifting.
Until then, the bounce needs confirmation.
◆━━━━━━━━━━━━━━━━━━◆
③ KEY LEVELS TO WATCH
◆━━━━━━━━━━━━━━━━━━◆
Support Zones (where buyers stepped in before):
➤ $4,128 – $4,111 → Recent day low and the area of the latest reaction
➤ $4,005 → Major swing low on the chart
Resistance Zones (where price may struggle):
➤ $4,210 → MA(5) area
➤ $4,257 – $4,305 → MA(10) and MA(20) cluster
➤ $4,387 → Previous consolidation zone
✔︎ The tighter these levels are respected, the cleaner the story becomes.
Watch how price behaves when it reaches them. That reaction tells you more than any prediction.
◆━━━━━━━━━━━━━━━━━━◆
④ WHAT'S MOVING GOLD RIGHT NOW?
◆━━━━━━━━━━━━━━━━━━◆
Gold doesn't move in a vacuum. Here are the forces in play:
① US Dollar & Yields → Gold is priced in dollars, so a stronger dollar or higher yields usually add pressure.
② Fed Policy → A hawkish Fed move recently weighed on gold, while a pullback in Treasury yields helped it recover.
③ Geopolitics → Geopolitical conflict, debt concerns, and hawkish rhetoric are keeping markets on edge.
④ Data Week → Consumer confidence, JOLTS, ADP employment, and US GDP are all due, so volatility can spike.
Big data days = big candles. Expect fast moves and wider spreads.
◆━━━━━━━━━━━━━━━━━━◆
⑤ TWO SCENARIOS TO KEEP IN MIND
◆━━━━━━━━━━━━━━━━━━◆
These are not predictions. They're simply the two paths traders are watching:
➜ Scenario A: Bounce Continues
Price reclaims the short-term average zone and holds above it. That would suggest buyers are regaining control.
➜ Scenario B: Bounce Fades
Price stalls near resistance and rolls back toward recent support. That would suggest the downtrend is still in charge.
The market decides, not us. Your job is to be prepared for both.
◆━━━━━━━━━━━━━━━━━━◆
⑥ SMART TRADER CHECKLIST
◆━━━━━━━━━━━━━━━━━━◆
✔︎ Don't chase a single green candle
✔︎ Wait for confirmation, not excitement
✔︎ Size your position so one bad trade can't hurt you
✔︎ Always know where you're wrong BEFORE you enter
✔︎ Be extra careful around major news releases
✔︎ Gold can be volatile, and leveraged products can amplify losses fast
◆━━━━━━━━━━━━━━━━━━◆
FINAL THOUGHTS
◆━━━━━━━━━━━━━━━━━━◆
Gold is at a crossroads. The long-term picture remains impressive, but the daily chart still needs proof that this bounce has real strength behind it.
The best traders I know don't try to guess the next move.
They read the levels.
They respect the risk.
And they let price show its hand.
So what's your read on gold right now?
Do you see this as a bounce or a real reversal? Drop your view in the comments!
Share this with a trader friend who's watching XAU.
Follow for more clean, no-hype market breakdowns.
#xau #XAUUSD #GOLD_UPDATE $XAU
$XAUT
Gold just gave traders a wild ride.
After a sudden two-day selloff that pushed price down to the $4,111 area, XAU/USD is now trading near $4,186, up about 1% on the day. That's a nice green candle. But here's the question every trader is asking:
Is this the start of something bigger, or just a relief bounce inside a downtrend?
Let's break it down step by step.
◆━━━━━━━━━━━━━━━━━━◆
① THE BIG PICTURE (DAILY CHART)
◆━━━━━━━━━━━━━━━━━━◆
➤ Gold rallied strongly from around $4,005 in late July/August to a swing high near $4,700
➤ Since then, price has been making lower highs and lower lows
➤ The latest drop was a large red candle, followed by a small recovery candle
➤ Gold's 52-week range is huge, with a peak around $5,600 back in January 2026, so today's price is still far below that cycle high
✔︎ Translation: The long-term story is still strong, but the short-term structure has cooled off. Both things can be true at once.
◆━━━━━━━━━━━━━━━━━━◆
② MOVING AVERAGES: THE REALITY CHECK
◆━━━━━━━━━━━━━━━━━━◆
Here's what the daily chart is showing right now:
➜ MA(5): around 4,210
➜ MA(10): around 4,257
➜ MA(20): around 4,305
Price is trading BELOW all three, and they are stacked in a downward order (fast under slow).
What does that mean in plain English?
Sellers have still had the upper hand recently, and the bounce has not yet reclaimed these averages. Many traders watch a daily close back above them as a sign that momentum may be shifting.
Until then, the bounce needs confirmation.
◆━━━━━━━━━━━━━━━━━━◆
③ KEY LEVELS TO WATCH
◆━━━━━━━━━━━━━━━━━━◆
Support Zones (where buyers stepped in before):
➤ $4,128 – $4,111 → Recent day low and the area of the latest reaction
➤ $4,005 → Major swing low on the chart
Resistance Zones (where price may struggle):
➤ $4,210 → MA(5) area
➤ $4,257 – $4,305 → MA(10) and MA(20) cluster
➤ $4,387 → Previous consolidation zone
✔︎ The tighter these levels are respected, the cleaner the story becomes.
Watch how price behaves when it reaches them. That reaction tells you more than any prediction.
◆━━━━━━━━━━━━━━━━━━◆
④ WHAT'S MOVING GOLD RIGHT NOW?
◆━━━━━━━━━━━━━━━━━━◆
Gold doesn't move in a vacuum. Here are the forces in play:
① US Dollar & Yields → Gold is priced in dollars, so a stronger dollar or higher yields usually add pressure.
② Fed Policy → A hawkish Fed move recently weighed on gold, while a pullback in Treasury yields helped it recover.
③ Geopolitics → Geopolitical conflict, debt concerns, and hawkish rhetoric are keeping markets on edge.
④ Data Week → Consumer confidence, JOLTS, ADP employment, and US GDP are all due, so volatility can spike.
Big data days = big candles. Expect fast moves and wider spreads.
◆━━━━━━━━━━━━━━━━━━◆
⑤ TWO SCENARIOS TO KEEP IN MIND
◆━━━━━━━━━━━━━━━━━━◆
These are not predictions. They're simply the two paths traders are watching:
➜ Scenario A: Bounce Continues
Price reclaims the short-term average zone and holds above it. That would suggest buyers are regaining control.
➜ Scenario B: Bounce Fades
Price stalls near resistance and rolls back toward recent support. That would suggest the downtrend is still in charge.
The market decides, not us. Your job is to be prepared for both.
◆━━━━━━━━━━━━━━━━━━◆
⑥ SMART TRADER CHECKLIST
◆━━━━━━━━━━━━━━━━━━◆
✔︎ Don't chase a single green candle
✔︎ Wait for confirmation, not excitement
✔︎ Size your position so one bad trade can't hurt you
✔︎ Always know where you're wrong BEFORE you enter
✔︎ Be extra careful around major news releases
✔︎ Gold can be volatile, and leveraged products can amplify losses fast
◆━━━━━━━━━━━━━━━━━━◆
FINAL THOUGHTS
◆━━━━━━━━━━━━━━━━━━◆
Gold is at a crossroads. The long-term picture remains impressive, but the daily chart still needs proof that this bounce has real strength behind it.
The best traders I know don't try to guess the next move.
They read the levels.
They respect the risk.
And they let price show its hand.
So what's your read on gold right now?
Do you see this as a bounce or a real reversal? Drop your view in the comments!
Share this with a trader friend who's watching XAU.
Follow for more clean, no-hype market breakdowns.
#xau #XAUUSD #GOLD_UPDATE $XAU
$XAUT
90

·
--
Baissier
AngelOfCrypto_-:
nice
2
2
733

·
--
🥇$GOLF.US GOLD JUST BOUNCED BACK — BUT THE CRYPTO MARKET IS WATCHING 👀
Gold dropped sharply yesterday, then rebounded around 1% today to about $4,155/oz.
Meanwhile, Bitcoin has also been moving higher today, trading around the $84K area in recent market data.
The interesting part?
Gold and Bitcoin are showing an increasingly close relationship.
$NVDAB $AAPLB
And tokenized gold is also attracting crypto traders — PAXG tracks the value of physical gold and is tradable in the crypto market.
👀 Gold or Bitcoin — which one are you watching right now?
#GOLD_UPDATE #bitcoin #BTC $ #PAXG #Crypto #Binance #CryptoNews #GoldPrice #markets
🥇$GOLF.US GOLD JUST BOUNCED BACK — BUT THE CRYPTO MARKET IS WATCHING 👀
Gold dropped sharply yesterday, then rebounded around 1% today to about $4,155/oz.
Meanwhile, Bitcoin has also been moving higher today, trading around the $84K area in recent market data.
The interesting part?
Gold and Bitcoin are showing an increasingly close relationship.
$NVDAB $AAPLB
And tokenized gold is also attracting crypto traders — PAXG tracks the value of physical gold and is tradable in the crypto market.
👀 Gold or Bitcoin — which one are you watching right now?
#GOLD_UPDATE #bitcoin #BTC $ #PAXG #Crypto #Binance #CryptoNews #GoldPrice #markets
Gold dropped sharply yesterday, then rebounded around 1% today to about $4,155/oz.
Meanwhile, Bitcoin has also been moving higher today, trading around the $84K area in recent market data.
The interesting part?
Gold and Bitcoin are showing an increasingly close relationship.
$NVDAB $AAPLB
And tokenized gold is also attracting crypto traders — PAXG tracks the value of physical gold and is tradable in the crypto market.
👀 Gold or Bitcoin — which one are you watching right now?
#GOLD_UPDATE #bitcoin #BTC $ #PAXG #Crypto #Binance #CryptoNews #GoldPrice #markets


304

·
--
Haussier
It looks like Gold Coin could potentially increase by 3–4x in 2027. So, if we buy and hold some now, it might be a good opportunity for the future. 🚀💰
#GOLD_UPDATE #Binance #fypシ #TradingCommunity #viral
$XAUT
{future}(XAUTUSDT)
It looks like Gold Coin could potentially increase by 3–4x in 2027. So, if we buy and hold some now, it might be a good opportunity for the future. 🚀💰
#GOLD_UPDATE #Binance #fypシ #TradingCommunity #viral
$XAUT
#GOLD_UPDATE #Binance #fypシ #TradingCommunity #viral
$XAUT
47

·
--
$XAUT is trading near $4,150, close to its lowest level since early August. It has lost about 6.5% in a month and sits well below its $5,600 peak. Surging oil prices are stoking inflation worries and higher-for-longer rate bets, which hurts a non-yielding asset. Watch $4,135 as support, and be careful catching a falling knife before this week's US data.
#GOLD_UPDATE
{spot}(XAUTUSDT)
$XAUT is trading near $4,150, close to its lowest level since early August. It has lost about 6.5% in a month and sits well below its $5,600 peak. Surging oil prices are stoking inflation worries and higher-for-longer rate bets, which hurts a non-yielding asset. Watch $4,135 as support, and be careful catching a falling knife before this week's US data.
#GOLD_UPDATE
#GOLD_UPDATE

83
#GOLD_UPDATE : Downside risks with key supports in focus – OCBC
NEWS
$GOOGL.US
09/29/2026 08:01:30 GMT
Gold: Downside risks with key supports in focus – OCBC
Gold: Downside risks with key supports in focus – OCBC
Christopher Wong at OCBC notes Gold has extended its decline to a seven-week low, pressured by higher Oil prices, firm US Treasury yields and a stronger Dollar. The break below $4,200 has intensified technical selling, with near-term direction tied to Oil and rates. OCBC sees risks skewed to the downside.
Oil and yields drive bearish bias
"Gold extended its decline, falling to a 7-week low as the recent rise in oil prices reinforced inflation concerns and expectations for further Fed tightening. Higher US Treasury yields and a firm USD added to the pressure, while the break below $4,200 likely exacerbated technical selling
#GOLD_UPDATE : Downside risks with key supports in focus – OCBC
NEWS
$GOOGL.US
09/29/2026 08:01:30 GMT
Gold: Downside risks with key supports in focus – OCBC
Gold: Downside risks with key supports in focus – OCBC
Christopher Wong at OCBC notes Gold has extended its decline to a seven-week low, pressured by higher Oil prices, firm US Treasury yields and a stronger Dollar. The break below $4,200 has intensified technical selling, with near-term direction tied to Oil and rates. OCBC sees risks skewed to the downside.
Oil and yields drive bearish bias
"Gold extended its decline, falling to a 7-week low as the recent rise in oil prices reinforced inflation concerns and expectations for further Fed tightening. Higher US Treasury yields and a firm USD added to the pressure, while the break below $4,200 likely exacerbated technical selling
NEWS
$GOOGL.US
09/29/2026 08:01:30 GMT
Gold: Downside risks with key supports in focus – OCBC
Gold: Downside risks with key supports in focus – OCBC
Christopher Wong at OCBC notes Gold has extended its decline to a seven-week low, pressured by higher Oil prices, firm US Treasury yields and a stronger Dollar. The break below $4,200 has intensified technical selling, with near-term direction tied to Oil and rates. OCBC sees risks skewed to the downside.
Oil and yields drive bearish bias
"Gold extended its decline, falling to a 7-week low as the recent rise in oil prices reinforced inflation concerns and expectations for further Fed tightening. Higher US Treasury yields and a firm USD added to the pressure, while the break below $4,200 likely exacerbated technical selling
1
134

#GOLD_UPDATE #XAU
Gold (XAU/USD) is trading around $4,140–4,150 per ounce. That is down roughly 3% on the day and about 26% below its January 2026 record of about $5,600. Sources differ slightly on exact levels, and I'm quoting spot $XAU /USD rather than a specific XAU/USDT exchange pair, which usually tracks it closely.
Drop: Bloomberg showed gold falling about 3.4% on Sep 28, after it had traded near $4,260–4,300 the day before.
Cause: Higher bond yields and expectations of tighter, "higher for longer" Fed policy are weighing on gold.
Levels: The day's low was near $4,111. A break below that opens more downside, while $4,250–4,300 is the resistance zone gold just lost.
Bias: Short-term bearish while yields stay firm. Wait for price to stabilize before treating this as a bottom.
Not financial advice.
#XAU #Write2Earn #Binance
{spot}(XAUTUSDT)
#GOLD_UPDATE #XAU
Gold (XAU/USD) is trading around $4,140–4,150 per ounce. That is down roughly 3% on the day and about 26% below its January 2026 record of about $5,600. Sources differ slightly on exact levels, and I'm quoting spot $XAU /USD rather than a specific XAU/USDT exchange pair, which usually tracks it closely.
Drop: Bloomberg showed gold falling about 3.4% on Sep 28, after it had traded near $4,260–4,300 the day before.
Cause: Higher bond yields and expectations of tighter, "higher for longer" Fed policy are weighing on gold.
Levels: The day's low was near $4,111. A break below that opens more downside, while $4,250–4,300 is the resistance zone gold just lost.
Bias: Short-term bearish while yields stay firm. Wait for price to stabilize before treating this as a bottom.
Not financial advice.
#XAU #Write2Earn #Binance
Gold (XAU/USD) is trading around $4,140–4,150 per ounce. That is down roughly 3% on the day and about 26% below its January 2026 record of about $5,600. Sources differ slightly on exact levels, and I'm quoting spot $XAU /USD rather than a specific XAU/USDT exchange pair, which usually tracks it closely.
Drop: Bloomberg showed gold falling about 3.4% on Sep 28, after it had traded near $4,260–4,300 the day before.
Cause: Higher bond yields and expectations of tighter, "higher for longer" Fed policy are weighing on gold.
Levels: The day's low was near $4,111. A break below that opens more downside, while $4,250–4,300 is the resistance zone gold just lost.
Bias: Short-term bearish while yields stay firm. Wait for price to stabilize before treating this as a bottom.
Not financial advice.
#XAU #Write2Earn #Binance
41

$GOAT 🪙 Gold market today — UAE, 29 September 2026
Gold is under strong downward pressure today. Reuters reports spot gold around $4,124.57 per troy ounce, near a seven-week low. Higher U.S. rates/yields and inflation concerns are weighing on gold. �
Reuters
UAE indicative rates:
24K: AED 497.25/g
22K: AED 460.50/g
18K: AED 376.80/g �
goodreturns.in +1
Compared with yesterday, the listed 24K rate is down about AED 19.25/g and 22K about AED 17.75/g. �
goodreturns.in
If you're trading gold today, I can also show you the �gold 1-day candle/chart with support and resistance levels.
#GOLD_UPDATE
$GOAT 🪙 Gold market today — UAE, 29 September 2026
Gold is under strong downward pressure today. Reuters reports spot gold around $4,124.57 per troy ounce, near a seven-week low. Higher U.S. rates/yields and inflation concerns are weighing on gold. �
Reuters
UAE indicative rates:
24K: AED 497.25/g
22K: AED 460.50/g
18K: AED 376.80/g �
goodreturns.in +1
Compared with yesterday, the listed 24K rate is down about AED 19.25/g and 22K about AED 17.75/g. �
goodreturns.in
If you're trading gold today, I can also show you the �gold 1-day candle/chart with support and resistance levels.
#GOLD_UPDATE
Gold is under strong downward pressure today. Reuters reports spot gold around $4,124.57 per troy ounce, near a seven-week low. Higher U.S. rates/yields and inflation concerns are weighing on gold. �
Reuters
UAE indicative rates:
24K: AED 497.25/g
22K: AED 460.50/g
18K: AED 376.80/g �
goodreturns.in +1
Compared with yesterday, the listed 24K rate is down about AED 19.25/g and 22K about AED 17.75/g. �
goodreturns.in
If you're trading gold today, I can also show you the �gold 1-day candle/chart with support and resistance levels.
#GOLD_UPDATE
176

·
--
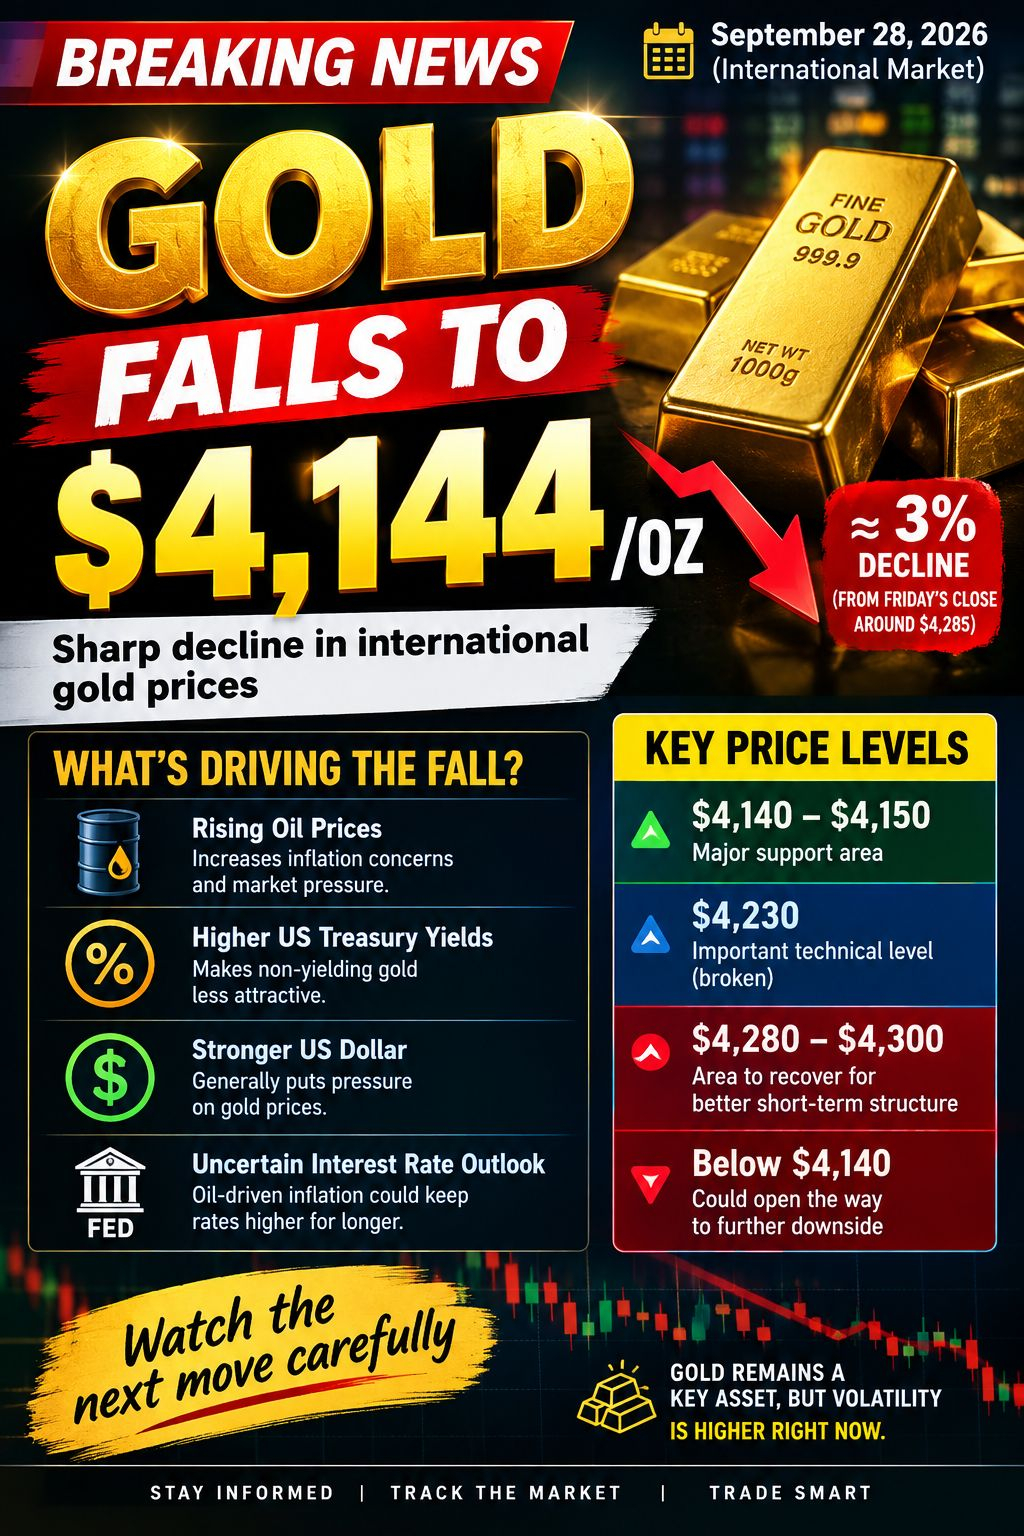
#GoldFallsTo$4144
What Is Driving the Fall?
The recent decline in gold prices is being driven by several key factors:
- Rising oil prices: Higher oil prices are increasing inflation concerns and putting pressure on markets.
- Higher U.S. Treasury yields: Rising yields make non-interest-bearing assets such as gold relatively less attractive.
- A stronger U.S. dollar: A stronger dollar generally puts downward pressure on dollar-denominated gold.
- Changing Fed rate expectations: Markets are reassessing the Federal Reserve’s interest-rate outlook, as persistent inflation could keep rates higher for longer.
Key Gold Levels to Watch
Gold Price| Significance
$4,140–$4,150| Major support zone
$4,230| Important technical level that has been broken
$4,280–$4,300| Recovery zone for improving the short-term structure
Below $4,140| Could increase the risk of further downside
Gold’s decline has been significant. From around $4,285 at Friday’s close, a move toward $4,140 represents roughly a 3% decline.
What Traders Should Watch
The $4,140 level is particularly important. A sustained break below this area would be technically more significant than simply touching the level and bouncing back.
However, one sharp decline does not by itself confirm a long-term bear market. The next direction will depend on how gold reacts around key support levels, along with movements in the dollar, Treasury yields, oil prices, and Federal Reserve rate expectations.
#GOLD_UPDATE #GoldFishCalls $XAU
#GoldFallsTo$4144
What Is Driving the Fall?
The recent decline in gold prices is being driven by several key factors:
- Rising oil prices: Higher oil prices are increasing inflation concerns and putting pressure on markets.
- Higher U.S. Treasury yields: Rising yields make non-interest-bearing assets such as gold relatively less attractive.
- A stronger U.S. dollar: A stronger dollar generally puts downward pressure on dollar-denominated gold.
- Changing Fed rate expectations: Markets are reassessing the Federal Reserve’s interest-rate outlook, as persistent inflation could keep rates higher for longer.
Key Gold Levels to Watch
Gold Price| Significance
$4,140–$4,150| Major support zone
$4,230| Important technical level that has been broken
$4,280–$4,300| Recovery zone for improving the short-term structure
Below $4,140| Could increase the risk of further downside
Gold’s decline has been significant. From around $4,285 at Friday’s close, a move toward $4,140 represents roughly a 3% decline.
What Traders Should Watch
The $4,140 level is particularly important. A sustained break below this area would be technically more significant than simply touching the level and bouncing back.
However, one sharp decline does not by itself confirm a long-term bear market. The next direction will depend on how gold reacts around key support levels, along with movements in the dollar, Treasury yields, oil prices, and Federal Reserve rate expectations.
#GOLD_UPDATE #GoldFishCalls $XAU
What Is Driving the Fall?
The recent decline in gold prices is being driven by several key factors:
- Rising oil prices: Higher oil prices are increasing inflation concerns and putting pressure on markets.
- Higher U.S. Treasury yields: Rising yields make non-interest-bearing assets such as gold relatively less attractive.
- A stronger U.S. dollar: A stronger dollar generally puts downward pressure on dollar-denominated gold.
- Changing Fed rate expectations: Markets are reassessing the Federal Reserve’s interest-rate outlook, as persistent inflation could keep rates higher for longer.
Key Gold Levels to Watch
Gold Price| Significance
$4,140–$4,150| Major support zone
$4,230| Important technical level that has been broken
$4,280–$4,300| Recovery zone for improving the short-term structure
Below $4,140| Could increase the risk of further downside
Gold’s decline has been significant. From around $4,285 at Friday’s close, a move toward $4,140 represents roughly a 3% decline.
What Traders Should Watch
The $4,140 level is particularly important. A sustained break below this area would be technically more significant than simply touching the level and bouncing back.
However, one sharp decline does not by itself confirm a long-term bear market. The next direction will depend on how gold reacts around key support levels, along with movements in the dollar, Treasury yields, oil prices, and Federal Reserve rate expectations.
#GOLD_UPDATE #GoldFishCalls $XAU
180

Partiellement vrai
28 SEP 2026 | MACRO ALERT
GOLD × SILVER × OIL
THREE COMMODITIES. ONE MACRO BATTLE.28 SEP 2026 | MACRO ALERT
GOLD × SILVER × OIL
THREE COMMODITIES. ONE MACRO BATTLE.
INFLATION × YIELDS × DOLLAR × GEOPOLITICS
━━━━━━━━━━━━━━━━━━
🟡 GOLD — XAU/USD
SPOT: ~$4,120–4,160
SELL ZONE: $4,200–4,230
RESISTANCE: $4,230 → $4,300
BREAKOUT: > $4,300
TARGETS: $4,400 → $4,500
BREAKDOWN: < $4,140
BEAR TARGETS: $4,000 → $3,940
DESK VIEW:
$4,230 has failed as support.
Above $4,230 = stabilization.
Below $4,140 = sellers retain control.
Oil inflation + higher Treasury yields + firmer USD remain the immediate macro headwinds.
━━━━━━━━━━━━━━━━━━
⚪ SILVER — XAG/USD
SPOT: ~$61–62
SELL ZONE: $63–65
RESISTANCE: $63.90 → $65.15
BREAKOUT: > $67.55
TARGETS: $70 → $72
BREAKDOWN: < $60.84
BEAR TARGETS: $58 → $55
DESK VIEW:
Silver has lost the $62.30 area and is testing the critical $60.84 retracement zone.
<$60.84 = downside acceleration.
$65.15 = selling pressure begins to ease.
$67.55 = trend structure materially improves.
━━━━━━━━━━━━━━━━━━
🛢️ OIL — BRENT / WTI
BRENT: ~$107–108
WTI: ~$95–96
BRENT RESISTANCE: $108 → $110
BREAKOUT: > $110
TARGETS: $115 → $120
BRENT SUPPORT: $104 → $100
BREAKDOWN: < $100
WTI RESISTANCE: $96 → $100
BREAKOUT: > $100
TARGETS: $105 → $110
WTI SUPPORT: $92 → $90
DESK VIEW:
Oil is now the inflation transmission mechanism.
Higher crude
→ higher inflation expectations
→ higher yields
→ stronger USD
→ pressure on non-yielding metals.
Brent traded above $108 while WTI approached $96 as geopolitical supply risk returned to the premium.
━━━━━━━━━━━━━━━━━━
MACRO POSITIONING
OIL ↑
YIELDS ↑
USD ↑
GOLD ↓
SILVER ↓
That is the current cross-asset signal.
The next major volatility catalysts are U.S. PCE inflation on Wednesday and U.S. payrolls on Friday.
KEY LEVELS.
NOISE FILTERED.
RISK DEFINED.
#GOLD_UPDATE #silvertrader #OilMarket
28 SEP 2026 | MACRO ALERT GOLD × SILVER × OIL THREE COMMODITIES. ONE MACRO BATTLE.
28 SEP 2026 | MACRO ALERT
GOLD × SILVER × OIL
THREE COMMODITIES. ONE MACRO BATTLE.
INFLATION × YIELDS × DOLLAR × GEOPOLITICS
━━━━━━━━━━━━━━━━━━
🟡 GOLD — XAU/USD
SPOT: ~$4,120–4,160
SELL ZONE: $4,200–4,230
RESISTANCE: $4,230 → $4,300
BREAKOUT: > $4,300
TARGETS: $4,400 → $4,500
BREAKDOWN: < $4,140
BEAR TARGETS: $4,000 → $3,940
DESK VIEW:
$4,230 has failed as support.
Above $4,230 = stabilization.
Below $4,140 = sellers retain control.
Oil inflation + higher Treasury yields + firmer USD remain the immediate macro headwinds.
━━━━━━━━━━━━━━━━━━
⚪ SILVER — XAG/USD
SPOT: ~$61–62
SELL ZONE: $63–65
RESISTANCE: $63.90 → $65.15
BREAKOUT: > $67.55
TARGETS: $70 → $72
BREAKDOWN: < $60.84
BEAR TARGETS: $58 → $55
DESK VIEW:
Silver has lost the $62.30 area and is testing the critical $60.84 retracement zone.
<$60.84 = downside acceleration.
$65.15 = selling pressure begins to ease.
$67.55 = trend structure materially improves.
━━━━━━━━━━━━━━━━━━
🛢️ OIL — BRENT / WTI
BRENT: ~$107–108
WTI: ~$95–96
BRENT RESISTANCE: $108 → $110
BREAKOUT: > $110
TARGETS: $115 → $120
BRENT SUPPORT: $104 → $100
BREAKDOWN: < $100
WTI RESISTANCE: $96 → $100
BREAKOUT: > $100
TARGETS: $105 → $110
WTI SUPPORT: $92 → $90
DESK VIEW:
Oil is now the inflation transmission mechanism.
Higher crude
→ higher inflation expectations
→ higher yields
→ stronger USD
→ pressure on non-yielding metals.
Brent traded above $108 while WTI approached $96 as geopolitical supply risk returned to the premium.
━━━━━━━━━━━━━━━━━━
MACRO POSITIONING
OIL ↑
YIELDS ↑
USD ↑
GOLD ↓
SILVER ↓
That is the current cross-asset signal.
The next major volatility catalysts are U.S. PCE inflation on Wednesday and U.S. payrolls on Friday.
KEY LEVELS.
NOISE FILTERED.
RISK DEFINED.
#GOLD_UPDATE #silvertrader #OilMarket
GOLD × SILVER × OIL
THREE COMMODITIES. ONE MACRO BATTLE.
INFLATION × YIELDS × DOLLAR × GEOPOLITICS
━━━━━━━━━━━━━━━━━━
🟡 GOLD — XAU/USD
SPOT: ~$4,120–4,160
SELL ZONE: $4,200–4,230
RESISTANCE: $4,230 → $4,300
BREAKOUT: > $4,300
TARGETS: $4,400 → $4,500
BREAKDOWN: < $4,140
BEAR TARGETS: $4,000 → $3,940
DESK VIEW:
$4,230 has failed as support.
Above $4,230 = stabilization.
Below $4,140 = sellers retain control.
Oil inflation + higher Treasury yields + firmer USD remain the immediate macro headwinds.
━━━━━━━━━━━━━━━━━━
⚪ SILVER — XAG/USD
SPOT: ~$61–62
SELL ZONE: $63–65
RESISTANCE: $63.90 → $65.15
BREAKOUT: > $67.55
TARGETS: $70 → $72
BREAKDOWN: < $60.84
BEAR TARGETS: $58 → $55
DESK VIEW:
Silver has lost the $62.30 area and is testing the critical $60.84 retracement zone.
<$60.84 = downside acceleration.
$65.15 = selling pressure begins to ease.
$67.55 = trend structure materially improves.
━━━━━━━━━━━━━━━━━━
🛢️ OIL — BRENT / WTI
BRENT: ~$107–108
WTI: ~$95–96
BRENT RESISTANCE: $108 → $110
BREAKOUT: > $110
TARGETS: $115 → $120
BRENT SUPPORT: $104 → $100
BREAKDOWN: < $100
WTI RESISTANCE: $96 → $100
BREAKOUT: > $100
TARGETS: $105 → $110
WTI SUPPORT: $92 → $90
DESK VIEW:
Oil is now the inflation transmission mechanism.
Higher crude
→ higher inflation expectations
→ higher yields
→ stronger USD
→ pressure on non-yielding metals.
Brent traded above $108 while WTI approached $96 as geopolitical supply risk returned to the premium.
━━━━━━━━━━━━━━━━━━
MACRO POSITIONING
OIL ↑
YIELDS ↑
USD ↑
GOLD ↓
SILVER ↓
That is the current cross-asset signal.
The next major volatility catalysts are U.S. PCE inflation on Wednesday and U.S. payrolls on Friday.
KEY LEVELS.
NOISE FILTERED.
RISK DEFINED.
#GOLD_UPDATE #silvertrader #OilMarket
1
490

·
--
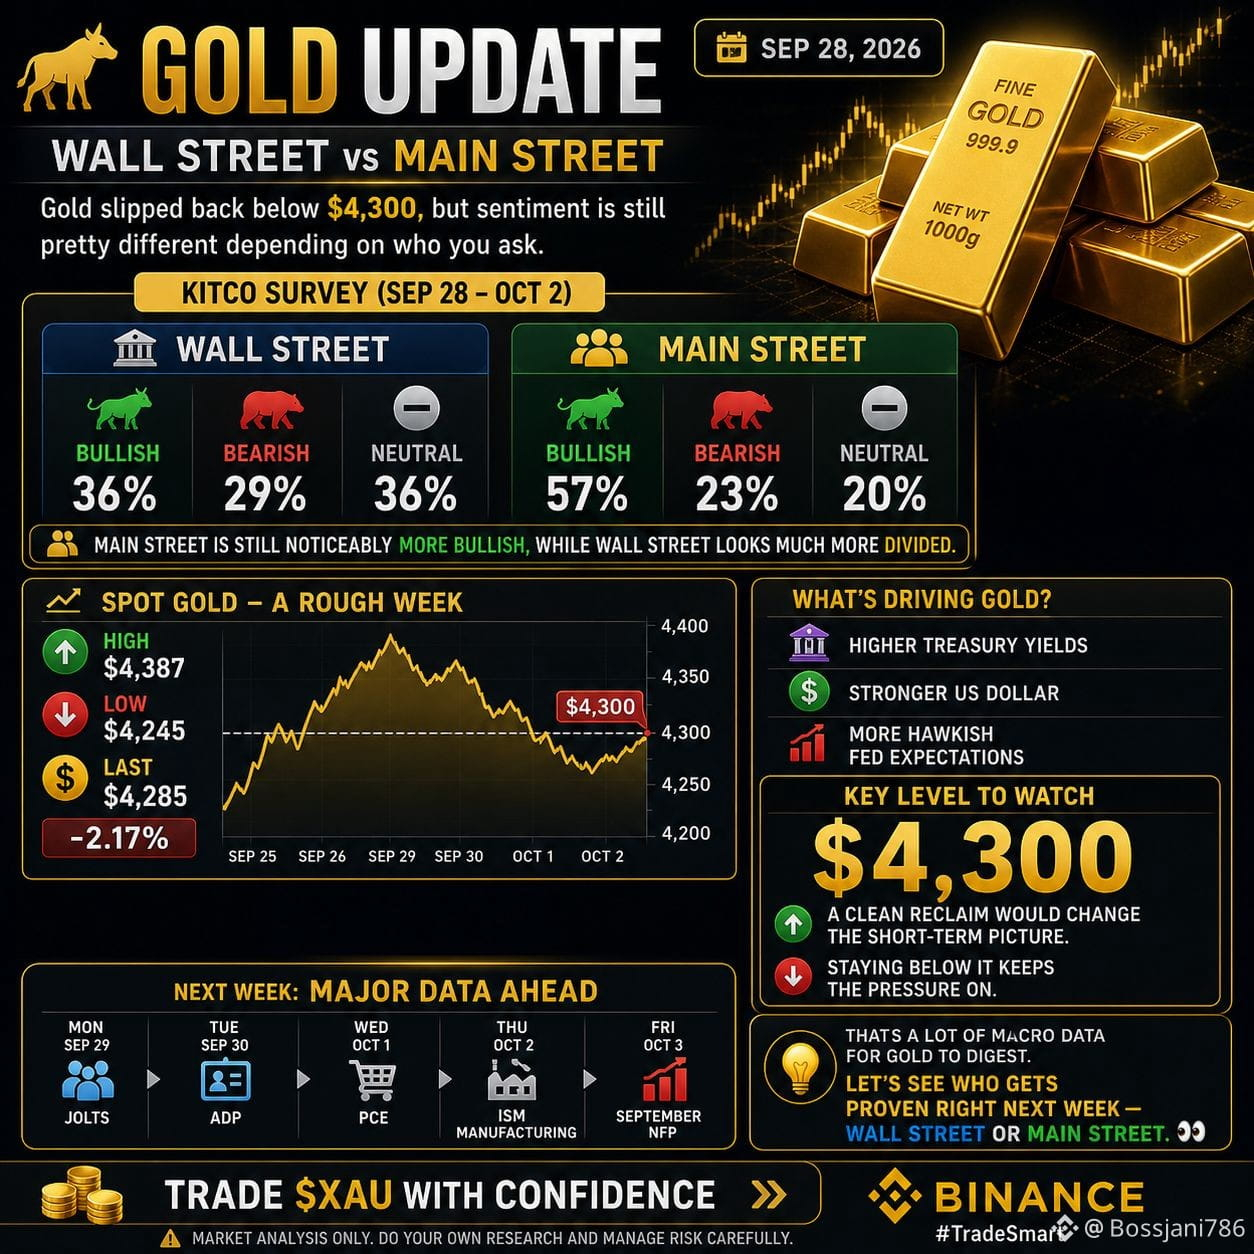
🥇 GOLD UPDATE | SEPT 28
⚠️ $4,300 LEVEL BREAK
Gold ne aaj strong selling pressure dekha aur $4,200 ke neeche bhi trade hua. Latest spot data ~$4,170 ke aas-paas hai.
📉 TODAY
• Current: ~$4,170
• Day Low: ~$4,141
• Key Level: $4,300
🔎 WHY THE PRESSURE?
🇺🇸 Stronger Dollar
📈 Higher Treasury Yields
🏦 Hawkish Fed Expectations
🛢️ Elevated Oil Prices
👀 KEY LEVELS
🔴 $4,300 — Resistance
🟢 $4,160 — Near-term support
🟢 $4,100 — Next zone
📅 THIS WEEK
PCE Inflation → Friday NFP
$BTC Gold is moving fast today. Watch the key levels and manage risk carefully.
⚠️ Market analysis only — not financial advice.
#GOLD_UPDATE
#Golden_Rules_Cryptocurrency
$ETH
{spot}(ETHUSDT)
$USDC
{spot}(USDCUSDT)
🥇 GOLD UPDATE | SEPT 28
⚠️ $4,300 LEVEL BREAK
Gold ne aaj strong selling pressure dekha aur $4,200 ke neeche bhi trade hua. Latest spot data ~$4,170 ke aas-paas hai.
📉 TODAY
• Current: ~$4,170
• Day Low: ~$4,141
• Key Level: $4,300
🔎 WHY THE PRESSURE?
🇺🇸 Stronger Dollar
📈 Higher Treasury Yields
🏦 Hawkish Fed Expectations
🛢️ Elevated Oil Prices
👀 KEY LEVELS
🔴 $4,300 — Resistance
🟢 $4,160 — Near-term support
🟢 $4,100 — Next zone
📅 THIS WEEK
PCE Inflation → Friday NFP
$BTC Gold is moving fast today. Watch the key levels and manage risk carefully.
⚠️ Market analysis only — not financial advice.
#GOLD_UPDATE
#Golden_Rules_Cryptocurrency
$ETH
$USDC
⚠️ $4,300 LEVEL BREAK
Gold ne aaj strong selling pressure dekha aur $4,200 ke neeche bhi trade hua. Latest spot data ~$4,170 ke aas-paas hai.
📉 TODAY
• Current: ~$4,170
• Day Low: ~$4,141
• Key Level: $4,300
🔎 WHY THE PRESSURE?
🇺🇸 Stronger Dollar
📈 Higher Treasury Yields
🏦 Hawkish Fed Expectations
🛢️ Elevated Oil Prices
👀 KEY LEVELS
🔴 $4,300 — Resistance
🟢 $4,160 — Near-term support
🟢 $4,100 — Next zone
📅 THIS WEEK
PCE Inflation → Friday NFP
$BTC Gold is moving fast today. Watch the key levels and manage risk carefully.
⚠️ Market analysis only — not financial advice.
#GOLD_UPDATE
#Golden_Rules_Cryptocurrency
$ETH
$USDC
147

·
--
#GoldFallsTo$4144
Gold has pulled back to around the $4,144/oz level, stirring fresh debate across markets. After a strong run driven by central bank buying and safe-haven flows, this dip leaves traders asking: Is this a healthy consolidation, or the start of a broader correction?
The Debate
The Bulls: View $4,144 as an attractive entry point, citing long-term hedge properties against inflation, geopolitical friction, and sustained central bank demand.
The Bears: Argue that elevated global interest rates and high real yields make holding gold less competitive in the medium term.
#GOLD_UPDATE
#XAUUSD
#FedPolicy
#BinanceSquareFamily
#GoldFallsTo$4144
Gold has pulled back to around the $4,144/oz level, stirring fresh debate across markets. After a strong run driven by central bank buying and safe-haven flows, this dip leaves traders asking: Is this a healthy consolidation, or the start of a broader correction?
The Debate
The Bulls: View $4,144 as an attractive entry point, citing long-term hedge properties against inflation, geopolitical friction, and sustained central bank demand.
The Bears: Argue that elevated global interest rates and high real yields make holding gold less competitive in the medium term.
#GOLD_UPDATE
#XAUUSD
#FedPolicy
#BinanceSquareFamily
Gold has pulled back to around the $4,144/oz level, stirring fresh debate across markets. After a strong run driven by central bank buying and safe-haven flows, this dip leaves traders asking: Is this a healthy consolidation, or the start of a broader correction?
The Debate
The Bulls: View $4,144 as an attractive entry point, citing long-term hedge properties against inflation, geopolitical friction, and sustained central bank demand.
The Bears: Argue that elevated global interest rates and high real yields make holding gold less competitive in the medium term.
#GOLD_UPDATE
#XAUUSD
#FedPolicy
#BinanceSquareFamily
152

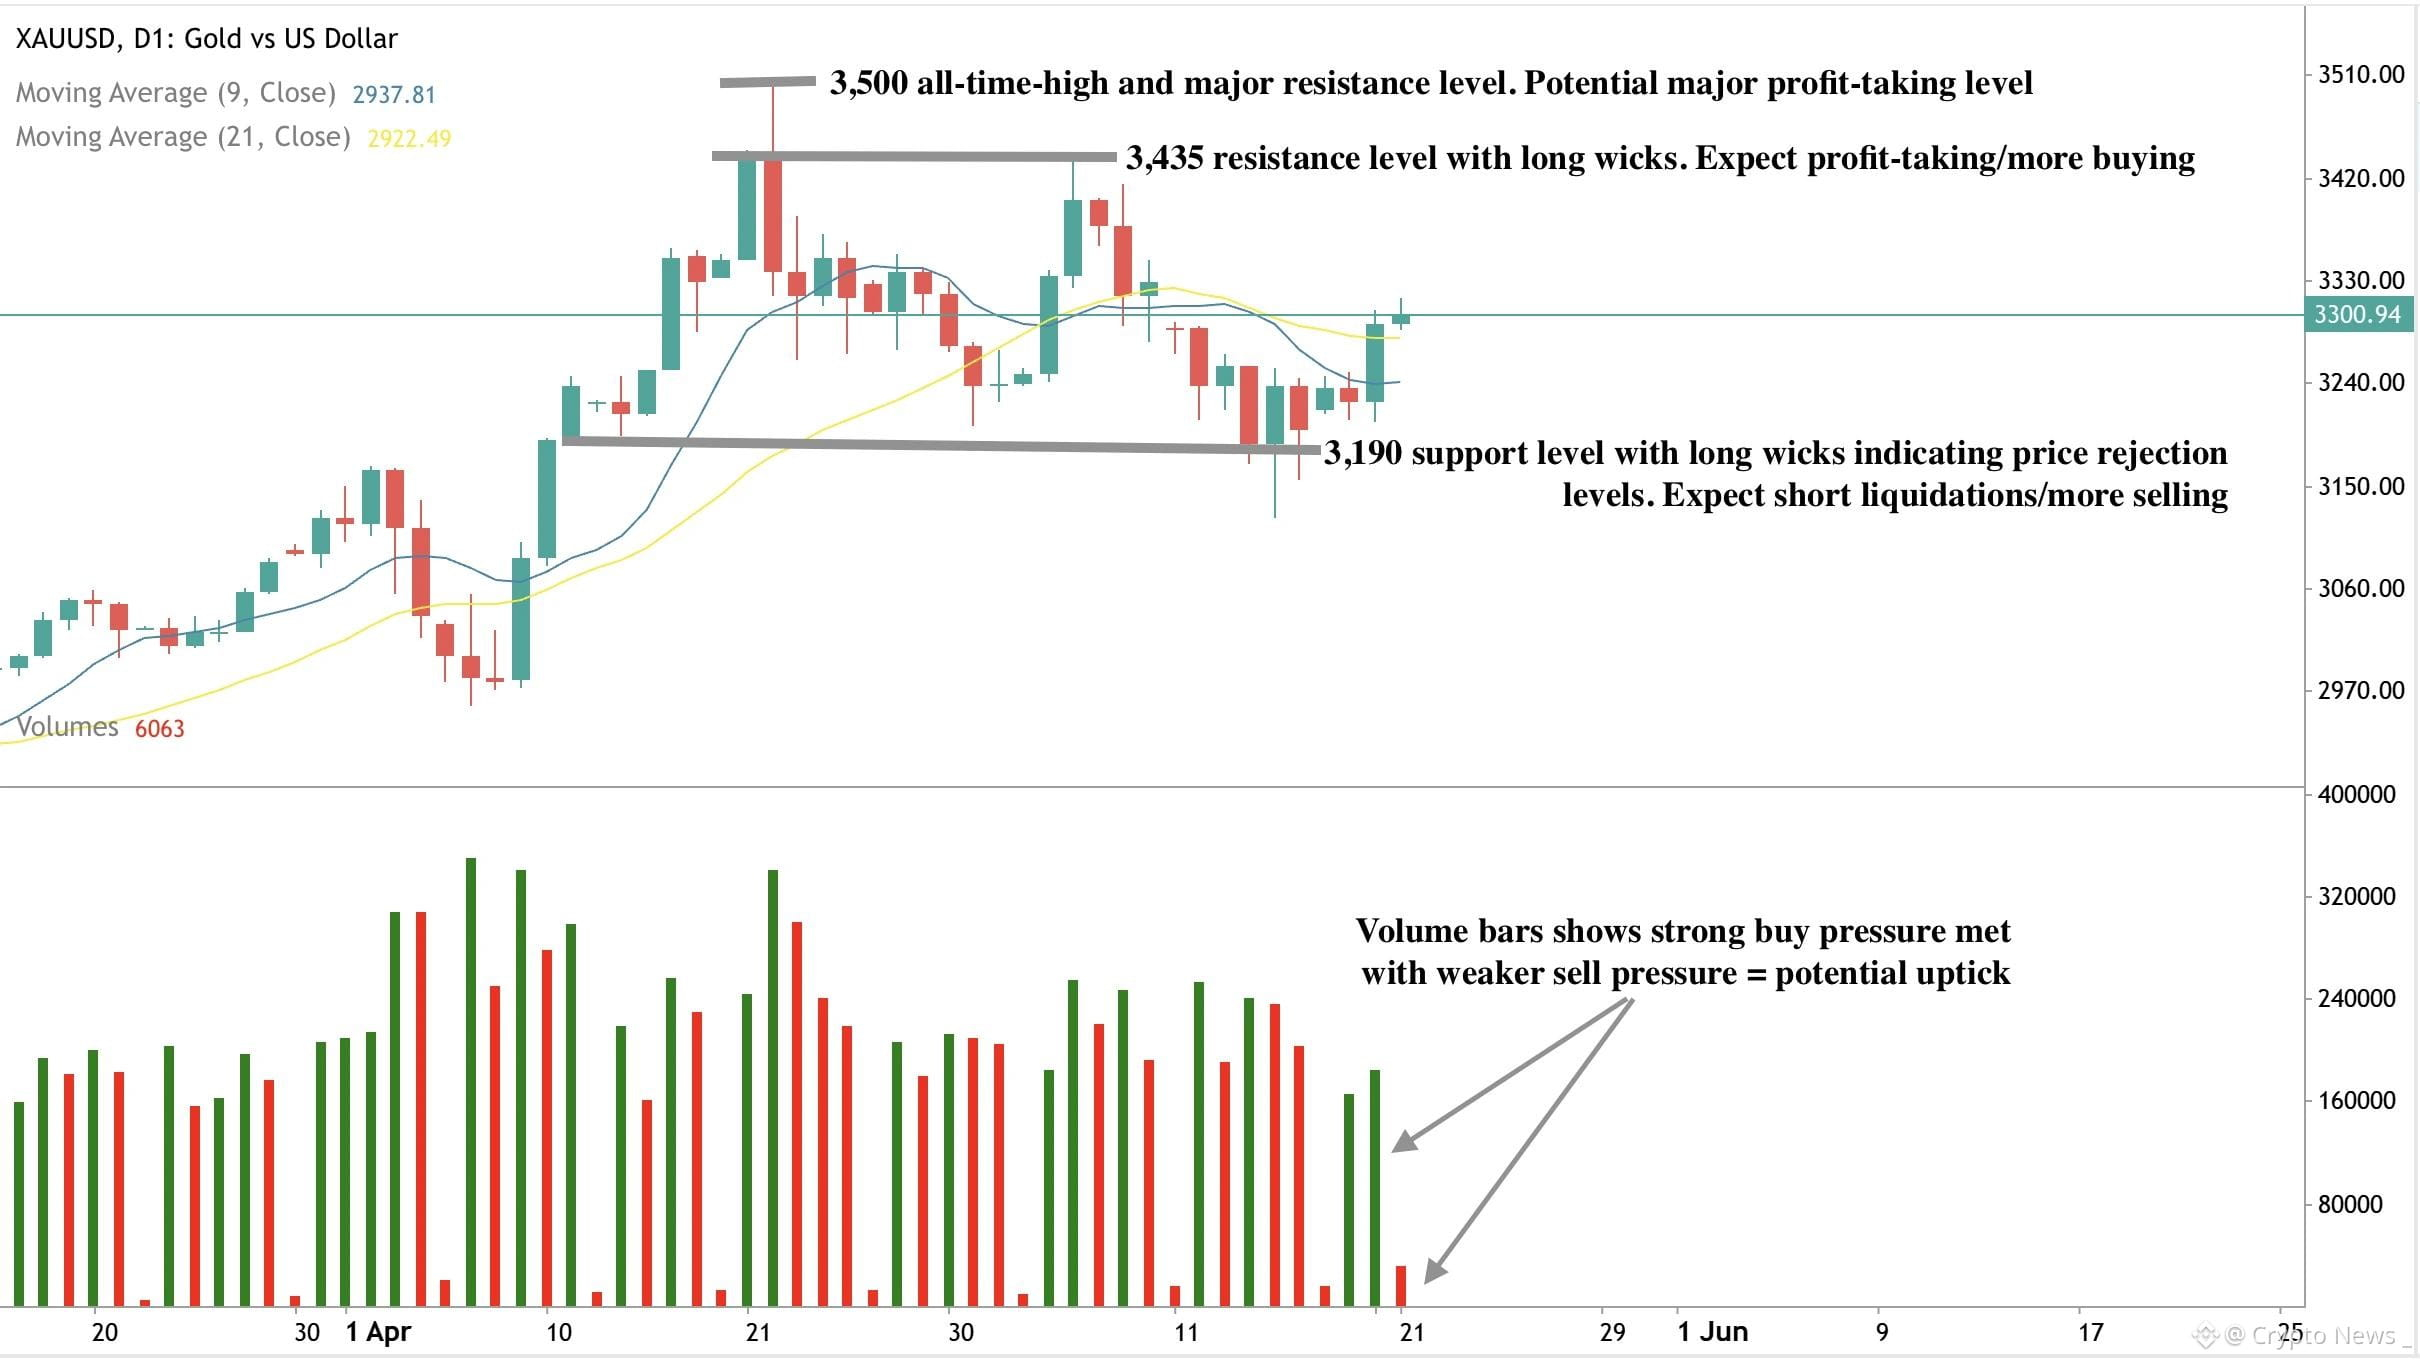
🥇 $XAU Latest Gold Analysis
Gold is trading below $4,200/oz, under strong short-term selling pressure as a stronger USD, higher yields and rising Fed-hike expectations weigh on bullion.
🔹 Support: $4,100 → $3,940 🔹 Resistance: $4,200 → $4,300 📉 Below $4,100 → further downside risk 🚀 Above $4,300 → recovery momentum could improve
Bottom line: Short-term momentum is bearish; $4,100–$4,300 is the key zone to watch.
$XAU
#GOLD #XAU #GOLD_UPDATE #TradeGoldenRules
{future}(XAUUSDT)
🥇 $XAU Latest Gold Analysis
Gold is trading below $4,200/oz, under strong short-term selling pressure as a stronger USD, higher yields and rising Fed-hike expectations weigh on bullion.
🔹 Support: $4,100 → $3,940 🔹 Resistance: $4,200 → $4,300 📉 Below $4,100 → further downside risk 🚀 Above $4,300 → recovery momentum could improve
Bottom line: Short-term momentum is bearish; $4,100–$4,300 is the key zone to watch.
$XAU
#GOLD #XAU #GOLD_UPDATE #TradeGoldenRules
Gold is trading below $4,200/oz, under strong short-term selling pressure as a stronger USD, higher yields and rising Fed-hike expectations weigh on bullion.
🔹 Support: $4,100 → $3,940 🔹 Resistance: $4,200 → $4,300 📉 Below $4,100 → further downside risk 🚀 Above $4,300 → recovery momentum could improve
Bottom line: Short-term momentum is bearish; $4,100–$4,300 is the key zone to watch.
$XAU
#GOLD #XAU #GOLD_UPDATE #TradeGoldenRules
60


·
--
Baissier
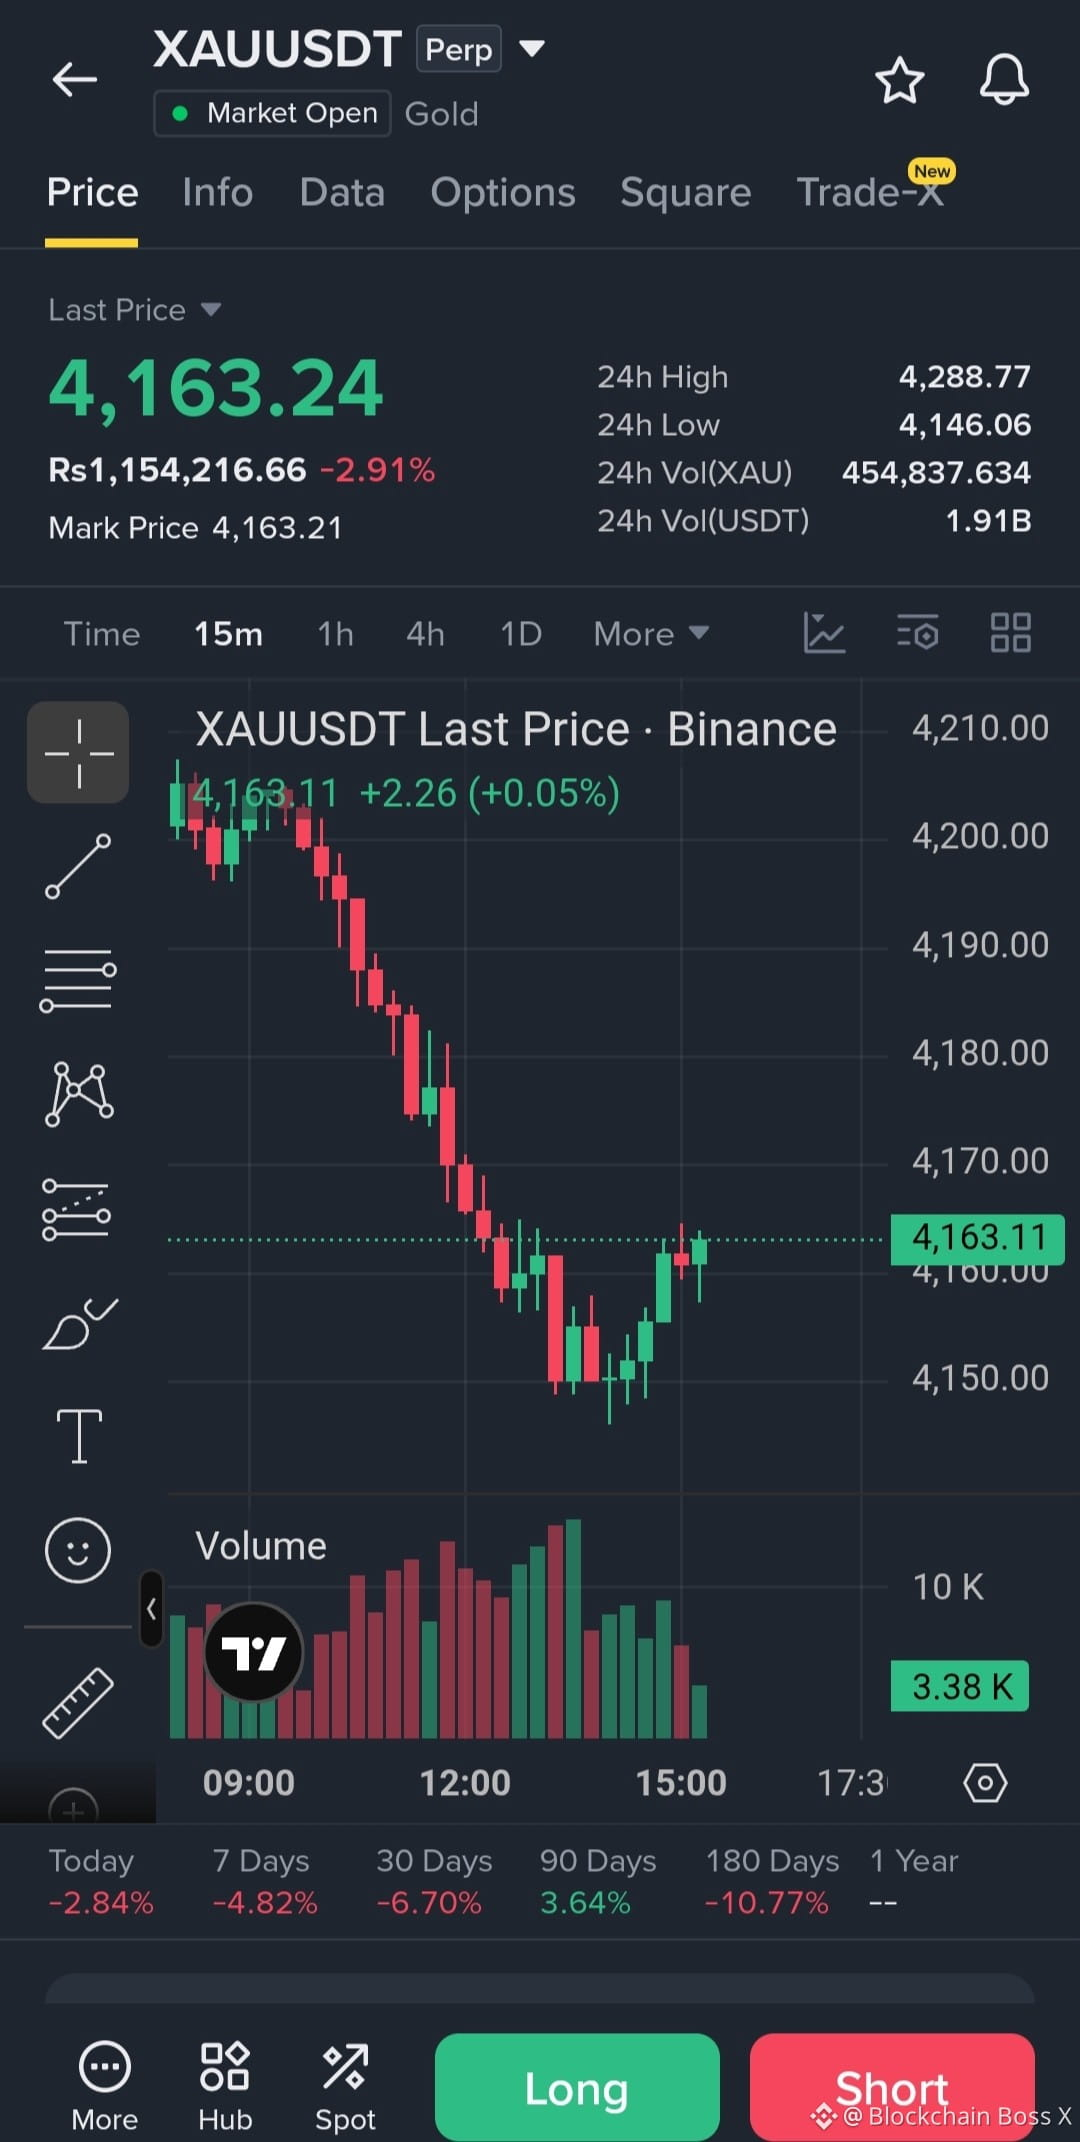
i’m short on $XAUT now 🔻🔻
entry: $4,162 – $4,166
targets: $4,155 / $4,150 / $4,146
sl: $4,172
{future}(XAUUSDT)
#XAU #GOLD_UPDATE
i’m short on $XAUT now 🔻🔻
entry: $4,162 – $4,166
targets: $4,155 / $4,150 / $4,146
sl: $4,172
#XAU #GOLD_UPDATE
entry: $4,162 – $4,166
targets: $4,155 / $4,150 / $4,146
sl: $4,172
#XAU #GOLD_UPDATE
4
202

·
--
Baissier
Members, the Gold market trend is bearish. 📉
Please do not hold any losing trades. Look for sell opportunities on retracements and manage your risk properly.
Never take a trade without a Stop Loss (SL). ⚠️
Always prioritize proper risk management and protect your capital.
#XAUUSD #GOLD_UPDATE
Members, the Gold market trend is bearish. 📉
Please do not hold any losing trades. Look for sell opportunities on retracements and manage your risk properly.
Never take a trade without a Stop Loss (SL). ⚠️
Always prioritize proper risk management and protect your capital.
#XAUUSD #GOLD_UPDATE
Please do not hold any losing trades. Look for sell opportunities on retracements and manage your risk properly.
Never take a trade without a Stop Loss (SL). ⚠️
Always prioritize proper risk management and protect your capital.
#XAUUSD #GOLD_UPDATE
258
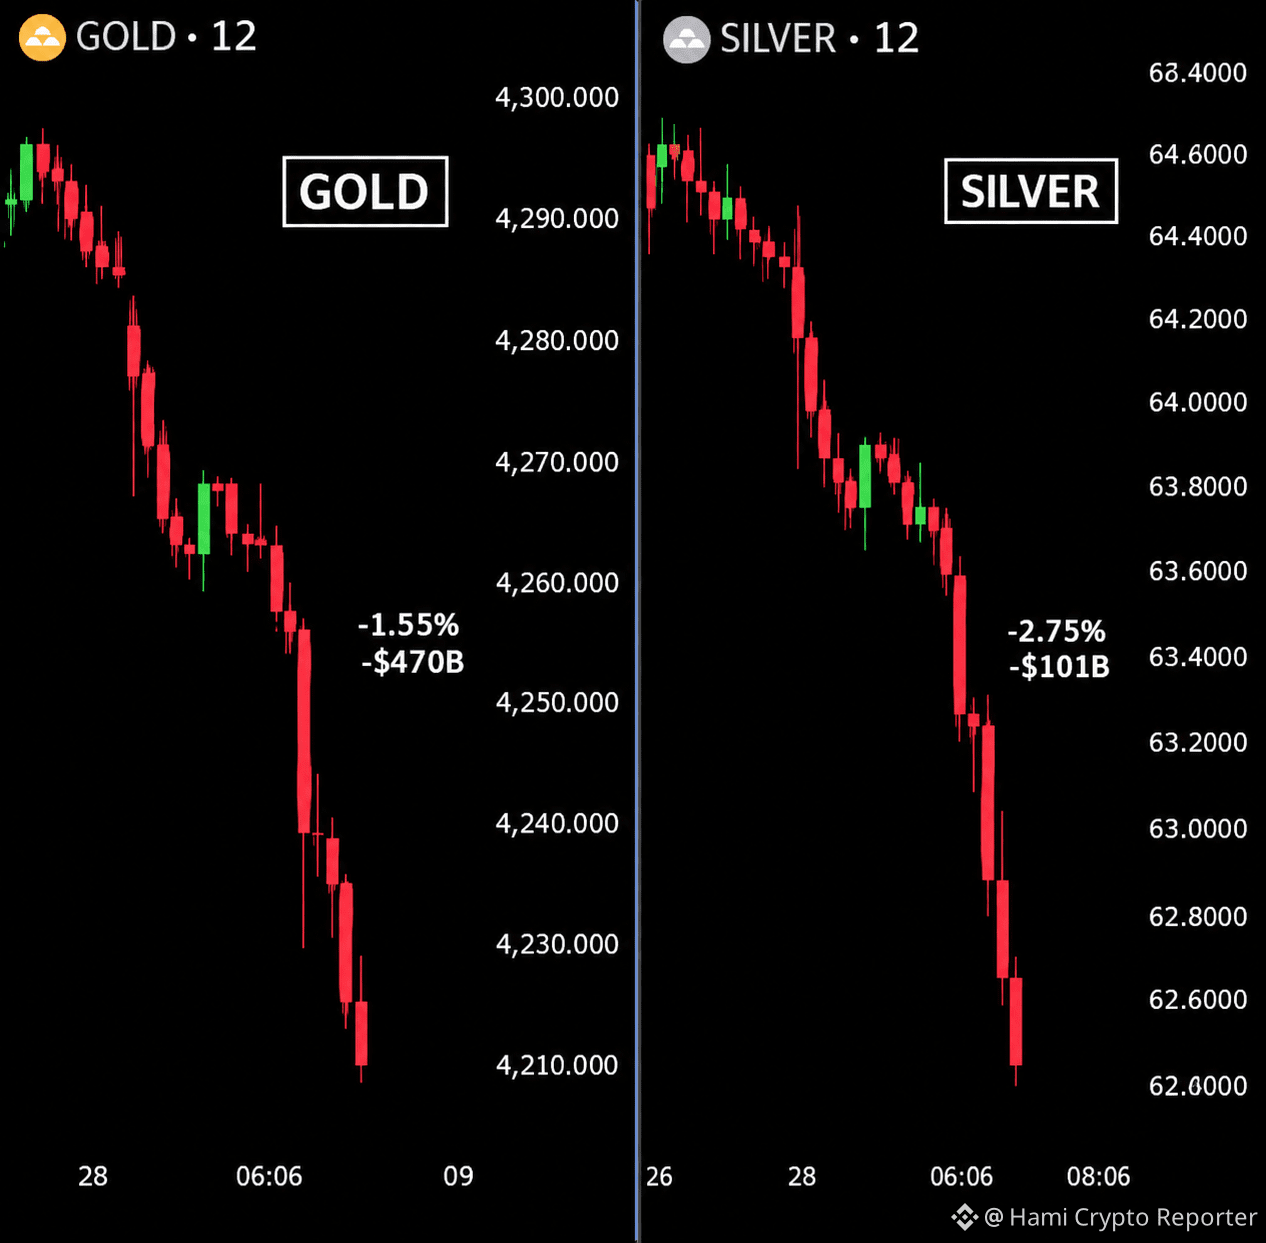
🚨 BREAKING: Over $550 $BILLION has reportedly been wiped out from the combined value of $GOLD.US gold and silver in just the last 3 hours. 📉💥
$GOLD.US
#Silver #GOLD_UPDATE
🚨 BREAKING: Over $550 $BILLION has reportedly been wiped out from the combined value of $GOLD.US gold and silver in just the last 3 hours. 📉💥
$GOLD.US
#Silver #GOLD_UPDATE
$GOLD.US
#Silver #GOLD_UPDATE

1
364

GOLD (XAU/USD) — TODAY'S MARKET UPDATE
Gold is currently showing short-term bearish pressure. 📉
🔴 Bearish Scenario:
If Gold breaks below $4,250, further downside could develop toward $4,200–$4,100.
🟢 Bullish Scenario:
If Gold recovers and breaks above $4,320–$4,350, buying momentum could return toward $4,400+.
📊 Current Bias: Slightly Bearish / Volatile
⚠️ Important: This does not guarantee profit or loss. Gold can move sharply during U.S. economic news and Federal Reserve-related developments.#GOLD_UPDATE
GOLD (XAU/USD) — TODAY'S MARKET UPDATE
Gold is currently showing short-term bearish pressure. 📉
🔴 Bearish Scenario:
If Gold breaks below $4,250, further downside could develop toward $4,200–$4,100.
🟢 Bullish Scenario:
If Gold recovers and breaks above $4,320–$4,350, buying momentum could return toward $4,400+.
📊 Current Bias: Slightly Bearish / Volatile
⚠️ Important: This does not guarantee profit or loss. Gold can move sharply during U.S. economic news and Federal Reserve-related developments.#GOLD_UPDATE
Gold is currently showing short-term bearish pressure. 📉
🔴 Bearish Scenario:
If Gold breaks below $4,250, further downside could develop toward $4,200–$4,100.
🟢 Bullish Scenario:
If Gold recovers and breaks above $4,320–$4,350, buying momentum could return toward $4,400+.
📊 Current Bias: Slightly Bearish / Volatile
⚠️ Important: This does not guarantee profit or loss. Gold can move sharply during U.S. economic news and Federal Reserve-related developments.#GOLD_UPDATE
236

·
--
Haussier
$XAU
{future}(XAUUSDT)
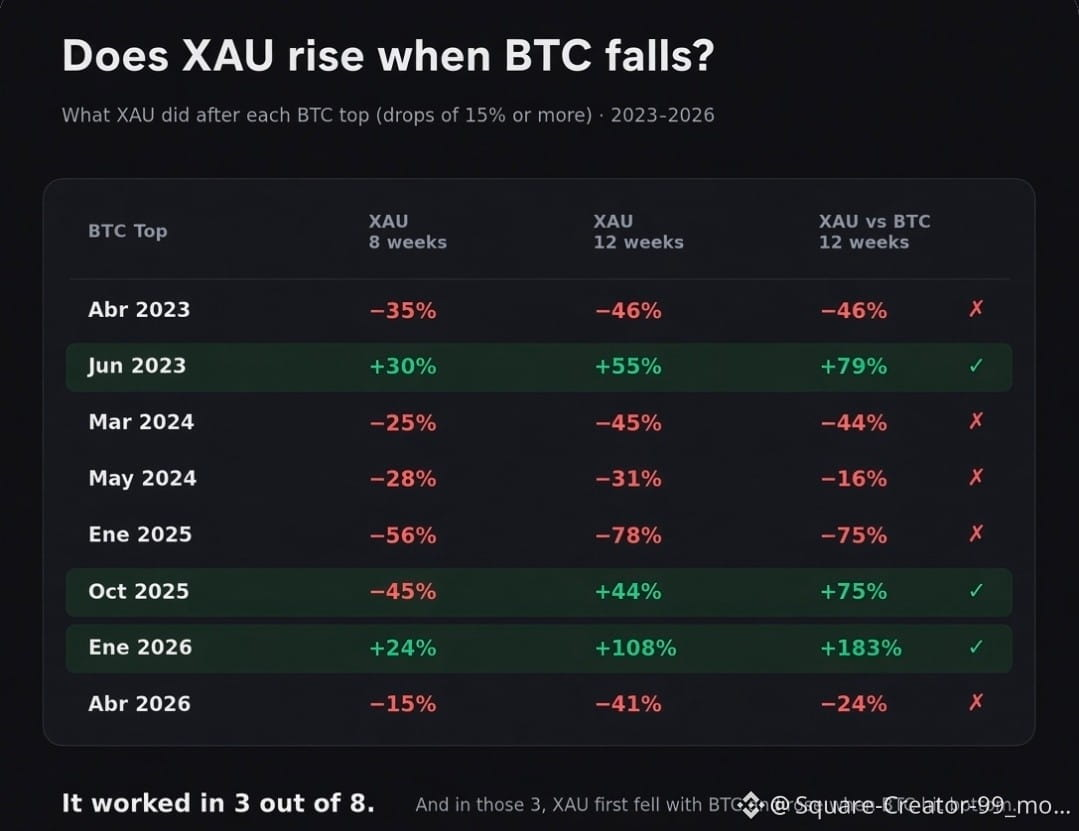
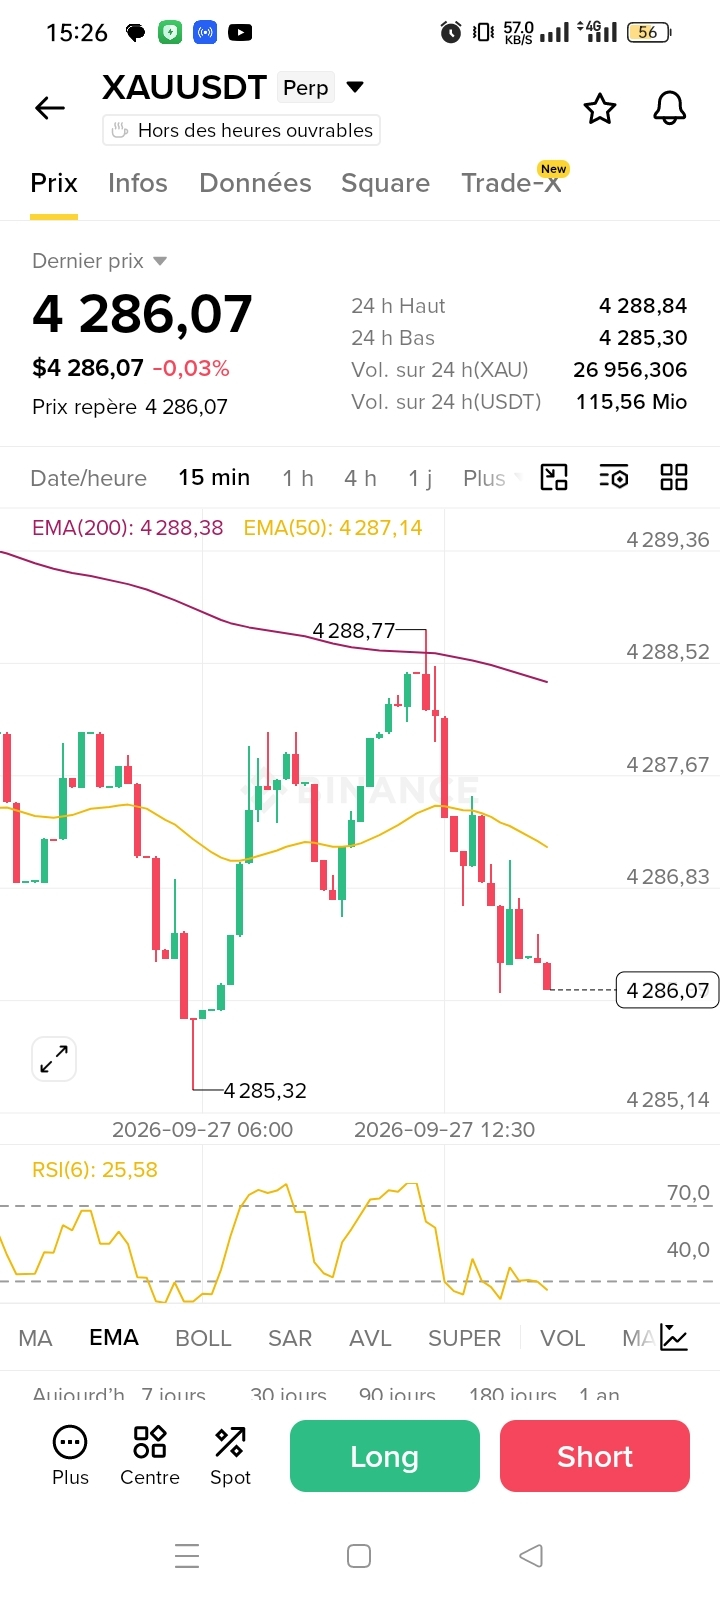
Does gold rally when Bitcoin tumbles? Plenty of people seem to think so
However, having reviewed weekly data over several years alongside Bitcoin’s key peaks since 2023, that premise held true in merely three out of eight instances
In most cases, XAU actually declined alongside BTC initially, only staging a notable move upwards once Bitcoin had formed a bottom
$BTC
{spot}(BTCUSDT)
When Bitcoin drops by 15% or more in a single week, gold advances on only a handful of occasions
Furthermore, sharp spikes in gold’s trading volume frequently coincide with Bitcoin reaching record highs, and gold’s major rallies have sometimes unfolded precisely as Bitcoin hovered at its peaks
The genuine signal is certainly not 'Bitcoin falls → buy gold.' Rather, it is Bitcoin stabilizing following a sell-off, coupled with pressure on gold’s price and a volume surge alongside a green candle
Lastly, following rapid surges, a substantial portion of those gains is often retraced within a few short weeks
$XAUT
{spot}(XAUTUSDT)
This does not constitute financial advice
#GOLD_UPDATE #bitcoin #Market_Update
$XAU
Does gold rally when Bitcoin tumbles? Plenty of people seem to think so
However, having reviewed weekly data over several years alongside Bitcoin’s key peaks since 2023, that premise held true in merely three out of eight instances
In most cases, XAU actually declined alongside BTC initially, only staging a notable move upwards once Bitcoin had formed a bottom
$BTC
When Bitcoin drops by 15% or more in a single week, gold advances on only a handful of occasions
Furthermore, sharp spikes in gold’s trading volume frequently coincide with Bitcoin reaching record highs, and gold’s major rallies have sometimes unfolded precisely as Bitcoin hovered at its peaks
The genuine signal is certainly not 'Bitcoin falls → buy gold.' Rather, it is Bitcoin stabilizing following a sell-off, coupled with pressure on gold’s price and a volume surge alongside a green candle
Lastly, following rapid surges, a substantial portion of those gains is often retraced within a few short weeks
$XAUT
This does not constitute financial advice
#GOLD_UPDATE #bitcoin #Market_Update
Does gold rally when Bitcoin tumbles? Plenty of people seem to think so
However, having reviewed weekly data over several years alongside Bitcoin’s key peaks since 2023, that premise held true in merely three out of eight instances
In most cases, XAU actually declined alongside BTC initially, only staging a notable move upwards once Bitcoin had formed a bottom
$BTC
When Bitcoin drops by 15% or more in a single week, gold advances on only a handful of occasions
Furthermore, sharp spikes in gold’s trading volume frequently coincide with Bitcoin reaching record highs, and gold’s major rallies have sometimes unfolded precisely as Bitcoin hovered at its peaks
The genuine signal is certainly not 'Bitcoin falls → buy gold.' Rather, it is Bitcoin stabilizing following a sell-off, coupled with pressure on gold’s price and a volume surge alongside a green candle
Lastly, following rapid surges, a substantial portion of those gains is often retraced within a few short weeks
$XAUT
This does not constitute financial advice
#GOLD_UPDATE #bitcoin #Market_Update
1
454


·
--
Baissier
#XAUUSD #XAU #GOLD
#GOLD_UPDATE
$XAUT
$XAU
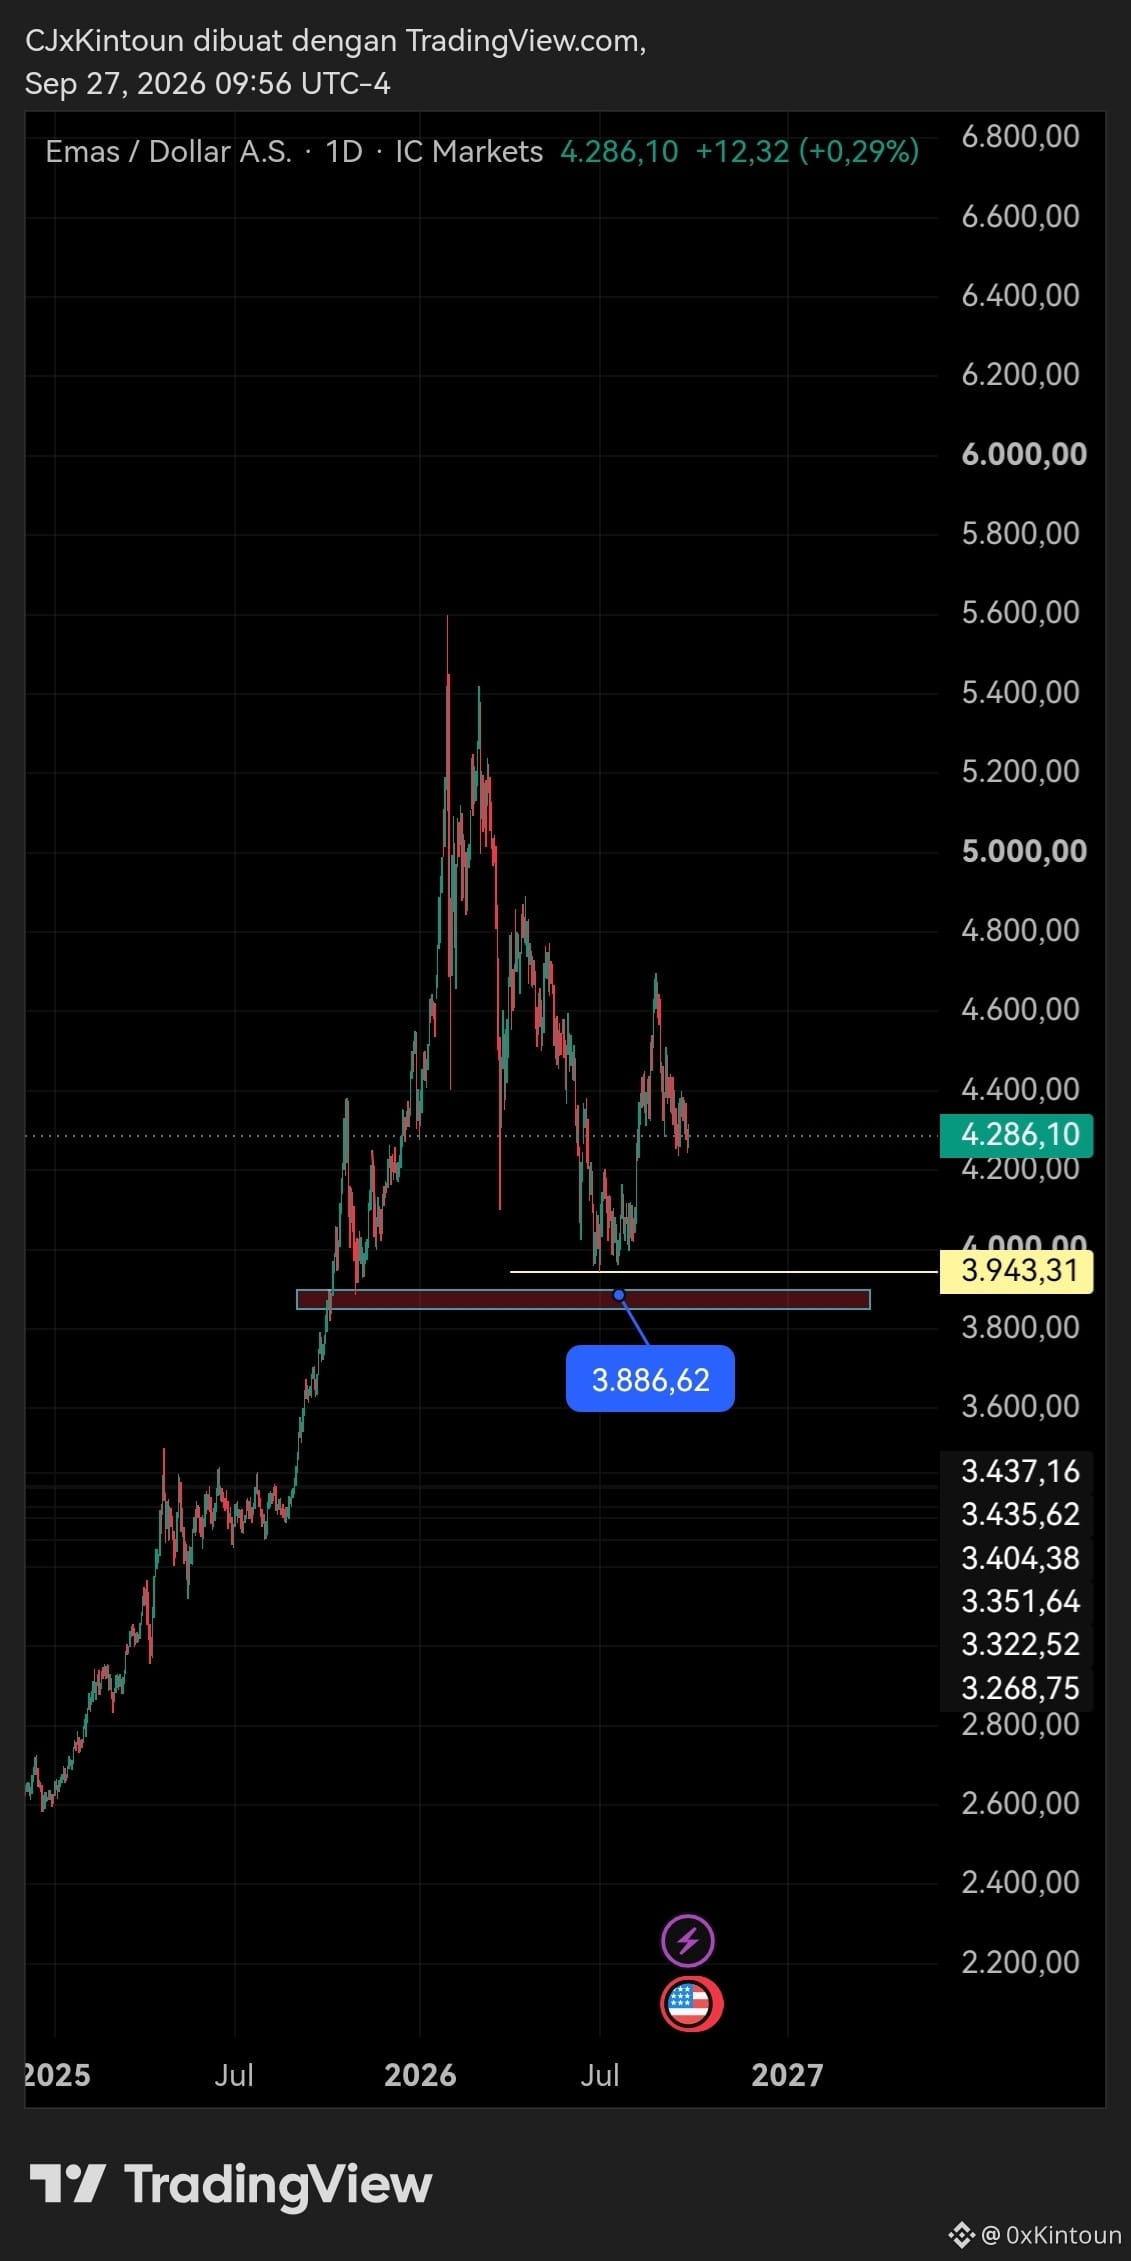
For GOLD, I think there will be a decline first until the key level zone, which is in 3,943.31, or will go deeper into the demand zone at 3,886.62 And if it has touched between 3,886.62 or in the box I have marked, it is likely to be Bullish.
This is my prediction, if you have any analysis then allow me.
{future}(XAUTUSDT)
{future}(XAUUSDT)
#dyor
#XAUUSD #XAU #GOLD
#GOLD_UPDATE
$XAUT
$XAU
For GOLD, I think there will be a decline first until the key level zone, which is in 3,943.31, or will go deeper into the demand zone at 3,886.62 And if it has touched between 3,886.62 or in the box I have marked, it is likely to be Bullish.
This is my prediction, if you have any analysis then allow me.
#dyor
#GOLD_UPDATE
$XAUT
$XAU
For GOLD, I think there will be a decline first until the key level zone, which is in 3,943.31, or will go deeper into the demand zone at 3,886.62 And if it has touched between 3,886.62 or in the box I have marked, it is likely to be Bullish.
This is my prediction, if you have any analysis then allow me.
#dyor
Joellen Schlicht gLOA:
And thanks for remind me 👍…
5
1
2
927
Connectez-vous pour découvrir plus de contenu
Rejoignez la communauté mondiale des adeptes de cryptomonnaies sur Binance Square
⚡️ Suviez les dernières informations importantes sur les cryptomonnaies.
💬 Jugé digne de confiance par la plus grande plateforme d’échange de cryptomonnaies au monde.
👍 Découvrez les connaissances que partagent les créateurs vérifiés.
Adresse e-mail/Nº de téléphone
Sujets d’actualité
1
#SECToClarifyOnChainFundraisingRules
0 vues
20 mentions
2
#UKFCAOpensCryptoFirmAuthorization
600 vues
75 mentions
3
#JapanMOFStudyGroupOnTokenizedGovtBonds
1,061 vues
113 mentions
4
#QNTRises287%
20,062 vues
394 mentions
5
#TrumpRejectsAIRulesForVoluntaryAudits
17,952 vues
482 mentions
6
#BitgetHotWalletBreachTiedToThirdPartySecurityFlaw
9,226 vues
334 mentions
7
#OpenAIUnveilsAlwaysOnAgentDots
8,416 vues
349 mentions
8
#ChainlinkLaunchesBankSWIFTLedgerFramework
9,071 vues
270 mentions
9
#EarningsSeason
525,635 vues
3,779 mentions
10
#ZcashApproves$1.5MBugBounty
107 vues
4 mentions