When you are adding or editing widgets on your Binance app, you will see a variety of widget types displayed in the Widget Library.
Each widget serves a different purpose—such as showing price trends, news, or market stats—and may offer multiple size options to suit your preferences.

Click each topic below to learn more about each widget:
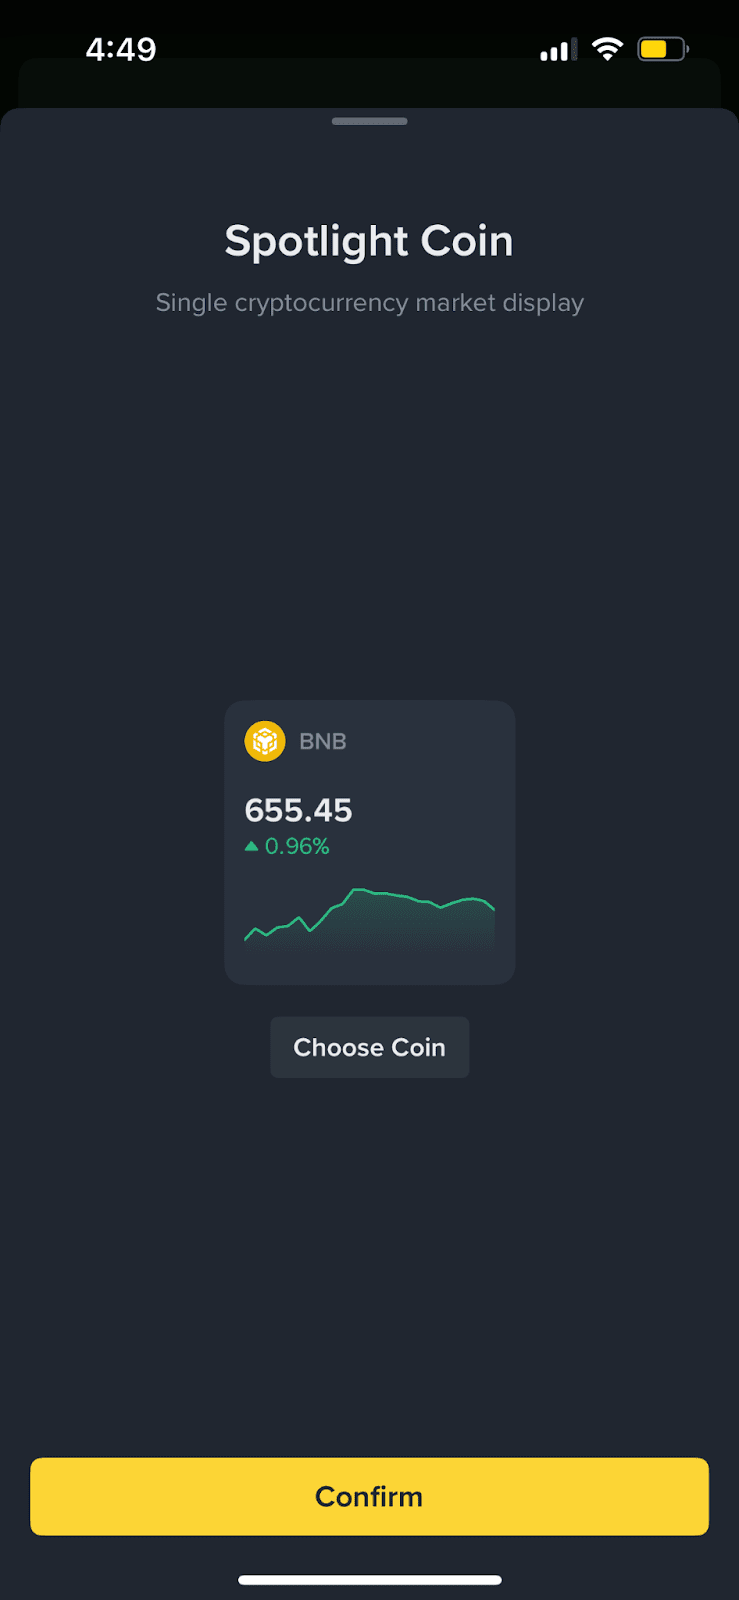
The Spotlight Coin Widget lets you highlight a specific crypto token of your choice directly on your homescreen. It displays key market data—price and 24-hour change—helping you keep a close eye on coins that matter to you.
Note:
There are two methods to change the spotlight coin:

The Coin List is our real-time market overview, where you can browse, compare, and track different assets across various product types.
It is organized into multiple tabs, each highlighting a specific view such as trending coins, top gainers, or new listings.
You can switch sizes based on your preference, showing 5 data rows per coin (e.g., price, change, volume, market cap, funding rate) or 3 data rows (e.g., price, change, volume).
Tapping on any item in the Coin List will take you directly to its detailed market page, where you can view charts, order books, funding rates, and more.
You can add one Coin List widget per app homescreen.
| Main Tab | Available Subtabs |
| Favorites | All, Spot, Futures, Options, Alpha (only shown if you’ve added corresponding collections to favorites) |
| Hot | Crypto, Futures |
| Alpha | Different Alpha Chains (e.g., Base, Blast, etc.) |
| New | Crypto, Futures |
| Gainers | Crypto, Spot, Futures |
| Losers | Crypto, Spot, Futures |
| 24h Vol | Crypto, Spot, Futures |
| Market Cap | Crypto |

Long-press anywhere in the Coin List to open the quick action menu, then select [Edit List] to:
Hidden tabs will be grouped inside the menu icon at the top left.

The Earn Widget recommends principal-protected Earn products based on your existing holdings and trending assets.
It helps you discover yield opportunities with minimal risk, right from your homepage.
Key features:
The widget supports up to 5 tokens, shown in a large-size layout only. You cannot switch to a smaller size for this widget.
Tapping on a token will take you directly to the Earn page, where you can browse all available Earn products for that specific token.
No, you can only add an Earn widget on your homescreen.

The Spot / Futures Copy Trading Widget showcases top-ranked signal providers recommended by the platform. It helps users discover high-performing traders and quickly access copy trading opportunities. Both spot and futures copy trading rankings are supported.
Key features:
Currently, the widget displays platform-recommended traders only. To explore more or customize your selection, visit the Copy Trading landing page.
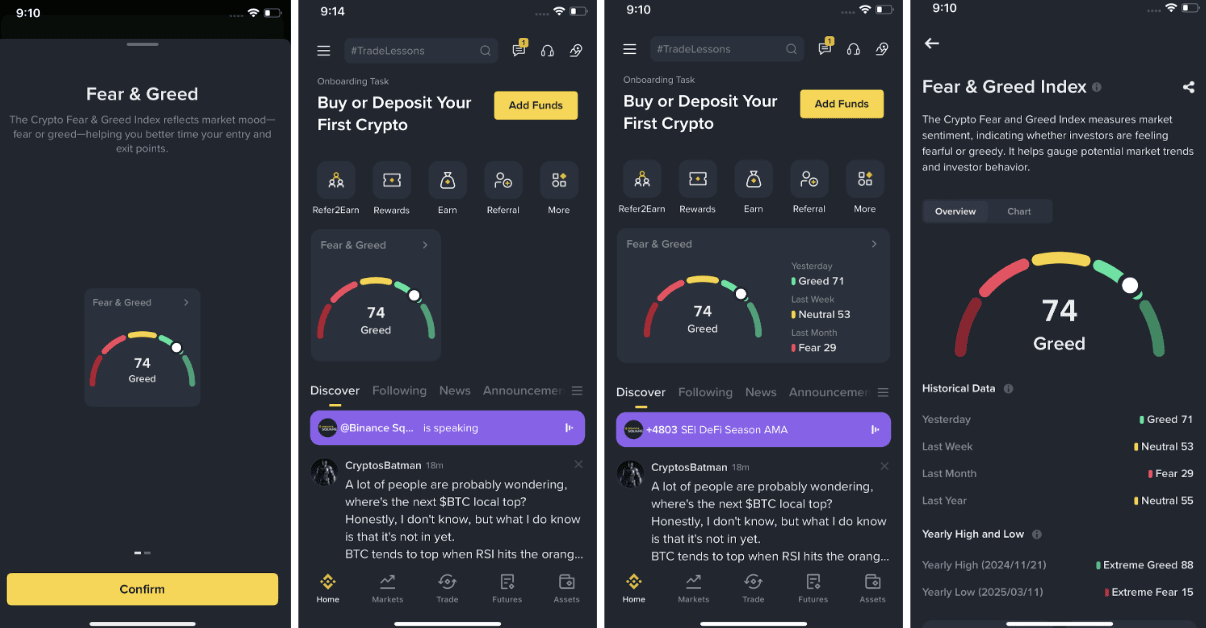
The Fear & Greed Widget simplifies complex market sentiment into a single, easy-to-understand score based on third-party data. It helps you quickly assess whether the market is leaning toward fear or greed—so you can make more informed decisions about when to enter or exit a trade.
Highlights:
There are two display sizes for this widget:
Disclaimer
Data includes third party sources, and is presented “as is” and “as available” for information purposes only without any confirmation or warranty. Views expressed in the data belong to the relevant third party and do not reflect Binance’s views. Binance does not guarantee reliability or accuracy. Not for sole reliance. Not advice nor any other intermediary service. Digital asset prices can be volatile. You are solely responsible for your investment decisions. Binance is not liable for your losses. For more information, see our Terms of Use, and Risk Warning.

The ETF Net-Flow Widget brings institutional flow data straight to your Binance homepage. Sourced from CoinGlass, it shows how much money moved into or out of spot ETFs for Bitcoin and Ethereum, turning a hard-to-find metric into an easy sentiment check.
Highlights:
There are two display sizes:
Once per trading day. We fetch yesterday’s numbers as soon as CoinGlass publishes them. If ETFs were closed (weekend / holiday), no new data is generated—the widget keeps the last trading-day reading and updates again when fresh figures appear.
You’ll jump to a landing page that breaks flows down by ETF ticker, shows historical charts, prices and 24-hour price-change percentages for each fund.
Disclaimer
Data includes third party sources, and is presented “as is” and “as available” for information purposes only without any confirmation or warranty. Views expressed in the data belong to the relevant third party and do not reflect Binance’s views. Binance does not guarantee reliability or accuracy. Not for sole reliance. Not advice nor any other intermediary service. Digital asset prices can be volatile. You are solely responsible for your investment decisions. Binance is not liable for your losses. For more information, see our Terms of Use, and Risk Warning.

The Hot Categories Widget tracks which crypto “sectors” are heating up right now. Every 30 minutes it pulls CoinMarketCap’s category data, keeps only the coins that trade on Binance Spot, Futures, or Binance Alpha, then ranks each category by its 24-hour market-cap change. You’ll see a real-time scoreboard of the day’s hottest categories, so you can spot where capital is pouring in and act quickly.
Highlights:
There are two display sizes:
The widget shows the crypto sectors with the biggest 24-hour market-cap swings. Each sector (category) comes from CoinMarketCap, but we first remove any coins that aren’t tradable on Binance Spot, Futures, or Alpha. What you see is the final, Binance-ready ranking.
Every 30 minutes. Open the landing page and check the timestamp under the title for the exact update time. If a category disappears after the latest refresh, its 24-hour change dropped out of the top-movers list and was replaced by a category with a larger swing.
CoinMarketCap’s list includes every coin in a category. We filter out coins you can’t trade on Binance. That means the market-cap totals and rankings may differ—but everything shown here is available for you to trade.
You’ll jump to a detail page that lists every coin in that category, along with each coin’s price and 24-hour price-change percentage.
We always display the top three or five categories with the largest absolute moves. Depending on market conditions, the biggest moves might be up or down.
Disclaimer
Data includes third party sources, and is presented “as is” and “as available” for information purposes only without any confirmation or warranty. Views expressed in the data belong to the relevant third party and do not reflect Binance’s views. Binance does not guarantee reliability or accuracy. Not for sole reliance. Not advice nor any other intermediary service. Digital asset prices can be volatile. You are solely responsible for your investment decisions. Binance is not liable for your losses. For more information, see our Terms of Use, and Risk Warning.

The AI Trending Widget is your social-sentiment radar. It scans posts from X (formerly Twitter) and Binance Square, runs them through an in-house AI model, and:
When you tap on a coin, you’ll land on the AI Trending details page with:
Treat it as a real-time pulse check: a sudden bullish swing may hint at momentum trades, while a sharp bearish turn can flag growing doubt.
Our AI model classifies each post as bullish, bearish, or neutral, then aggregates the results into a single scale shown on the widget.
Only coins with a recent surge in discussion—after filtering spam and low-quality posts—make the top list. If chatter cools off, the coin will disappear until interest returns.
Disclaimer
Content generated by Binance AI using third party data, and may include errors, biases or outdated information. For information purposes on an “as is” and “as available” basis without any warranty or confirmations. Binance does not guarantee reliability or accuracy. Views expressed are not endorsed and not to be relied on. Not advice nor any other intermediary service. Digital asset prices can be volatile. You are solely responsible for your investment decisions. Binance is not liable for your losses. For more information, see our Terms of Use, Risk Warning, and AI Terms.
