

Mike Aston villa
319 Posts

Mike Aston villa
Report
Block User
2 Following
0 Followers
2 Liked
Posts
All
Quotes
See translation
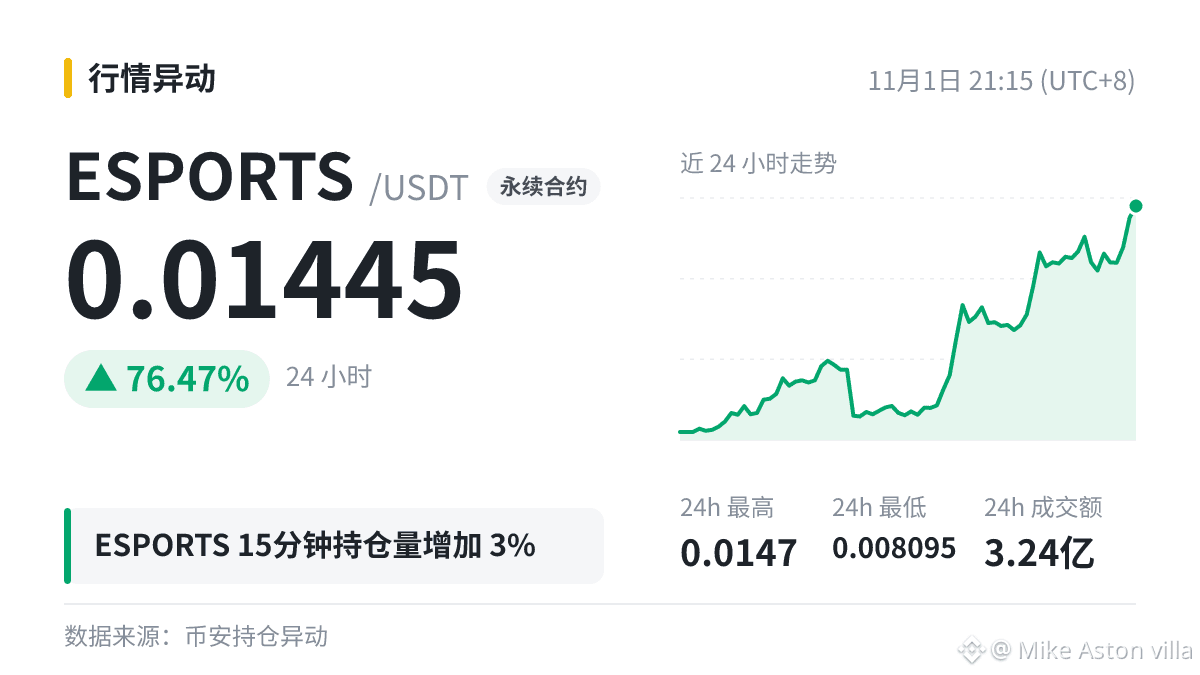
盘面笔记|$ESPORTS |15分钟持仓 +3.03%|价格 +4.32%
定义:持仓量反映的是合约仓位的规模:持仓越高,当价格大幅变动,会被强平的单子就越可观。
常见读法:价涨仓增常被解读为新多单积极进场,价跌仓增往往被看作空头积极进场。
别因为一个数字就改变原来的节奏,也别用借来的钱来验证某个读数。
盘面笔记|$ESPORTS |15分钟持仓 +3.03%|价格 +4.32%
定义:持仓量反映的是合约仓位的规模:持仓越高,当价格大幅变动,会被强平的单子就越可观。
常见读法:价涨仓增常被解读为新多单积极进场,价跌仓增往往被看作空头积极进场。
别因为一个数字就改变原来的节奏,也别用借来的钱来验证某个读数。
定义:持仓量反映的是合约仓位的规模:持仓越高,当价格大幅变动,会被强平的单子就越可观。
常见读法:价涨仓增常被解读为新多单积极进场,价跌仓增往往被看作空头积极进场。
别因为一个数字就改变原来的节奏,也别用借来的钱来验证某个读数。
Price Level Notes | $JCT loses the 0.005 level
After falling below this level, bears may gain confidence, but beware of a rebound after an excessive drop.
Price Level Notes | $JCT loses the 0.005 level
After falling below this level, bears may gain confidence, but beware of a rebound after an excessive drop.
After falling below this level, bears may gain confidence, but beware of a rebound after an excessive drop.
5
Today's most discussed topic in the square: “Binance resumes withdrawals on the DOGE and OP networks”
$DOGE is currently trading at 0.07588. Peak popularity often coincides with the greatest disagreement. Which do you value more: technical analysis or sentiment?
#币安恢复DOGE及OP网络提现服务
Today's most discussed topic in the square: “Binance resumes withdrawals on the DOGE and OP networks”
$DOGE is currently trading at 0.07588. Peak popularity often coincides with the greatest disagreement. Which do you value more: technical analysis or sentiment?
#币安恢复DOGE及OP网络提现服务
$DOGE is currently trading at 0.07588. Peak popularity often coincides with the greatest disagreement. Which do you value more: technical analysis or sentiment?
#币安恢复DOGE及OP网络提现服务
3
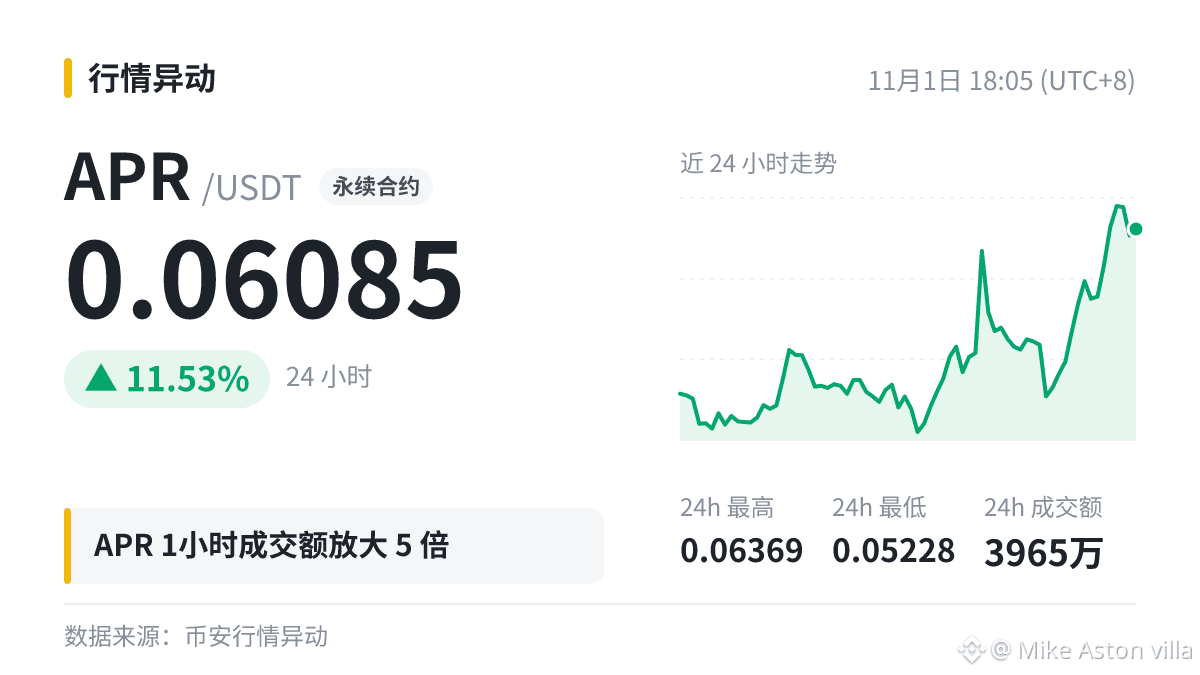
$APR Volume surged 5x over the past hour, while the price remained almost unchanged at 0.06085.
Changes in trading volume often appear before price movements, serving as an early signal. The direction still needs confirmation from the price.
Looking at the chart, the previous high and key moving averages matter more than this short-term fluctuation.
$APR Volume surged 5x over the past hour, while the price remained almost unchanged at 0.06085.
Changes in trading volume often appear before price movements, serving as an early signal. The direction still needs confirmation from the price.
Looking at the chart, the previous high and key moving averages matter more than this short-term fluctuation.
Changes in trading volume often appear before price movements, serving as an early signal. The direction still needs confirmation from the price.
Looking at the chart, the previous high and key moving averages matter more than this short-term fluctuation.
8
A $BNB 24-hour new high has been established.
24h: +1.99%, current price: 714.5, previous high: 709.67.
Structurally, a new high means there is less selling pressure overhead, so short-term resistance is relatively low. But if the price quickly falls back below the previous high, beware of a false breakout. What do you think will happen next?
A $BNB 24-hour new high has been established.
24h: +1.99%, current price: 714.5, previous high: 709.67.
Structurally, a new high means there is less selling pressure overhead, so short-term resistance is relatively low. But if the price quickly falls back below the previous high, beware of a false breakout. What do you think will happen next?
24h: +1.99%, current price: 714.5, previous high: 709.67.
Structurally, a new high means there is less selling pressure overhead, so short-term resistance is relatively low. But if the price quickly falls back below the previous high, beware of a false breakout. What do you think will happen next?
1
$BTC Plaza Activity Watch: #FBI确认朝鲜应对币安被盗事件负责 , 127,000 views. Buzz comes before market movements, but doesn't determine their direction.
$BTC Plaza Activity Watch: #FBI确认朝鲜应对币安被盗事件负责 , 127,000 views. Buzz comes before market movements, but doesn't determine their direction.
1
$Q breached the 0.03 level.
Let's use this data to break down whole-number price levels.
Support and resistance are more like price ranges than prices precise to the decimal point. It's perfectly normal for prices to fluctuate back and forth around these levels.
When a price returns to a level after several days, people who entered around that level before may break even and exit or add to their positions, so trading activity often picks up.
Learning to read indicators is easy; the hard part is still following the rules when emotions are running high.
#Q
$Q breached the 0.03 level.
Let's use this data to break down whole-number price levels.
Support and resistance are more like price ranges than prices precise to the decimal point. It's perfectly normal for prices to fluctuate back and forth around these levels.
When a price returns to a level after several days, people who entered around that level before may break even and exit or add to their positions, so trading activity often picks up.
Learning to read indicators is easy; the hard part is still following the rules when emotions are running high.
#Q
Let's use this data to break down whole-number price levels.
Support and resistance are more like price ranges than prices precise to the decimal point. It's perfectly normal for prices to fluctuate back and forth around these levels.
When a price returns to a level after several days, people who entered around that level before may break even and exit or add to their positions, so trading activity often picks up.
Learning to read indicators is easy; the hard part is still following the rules when emotions are running high.
#Q
4
Indicator Notes | $ESPORTS | Daily close above MA50 | MA50 0.009663
First, the definition: A moving average is the average closing price of the past N candlesticks. Each time a new candlestick forms, the window moves forward by one, and connecting the values creates a moving-average line.
Now, how to read it: The relationship between short- and long-term moving averages is also often used to assess trends. When the short-term average is above the long-term average, the outlook tends to be bullish; when it is below, the outlook tends to be bearish. However, both reflect price movements that have already occurred.
Extreme readings are usually accompanied by more volatile swings. At such times, it is better to reduce your position size rather than make a large bet.
Indicator Notes | $ESPORTS | Daily close above MA50 | MA50 0.009663
First, the definition: A moving average is the average closing price of the past N candlesticks. Each time a new candlestick forms, the window moves forward by one, and connecting the values creates a moving-average line.
Now, how to read it: The relationship between short- and long-term moving averages is also often used to assess trends. When the short-term average is above the long-term average, the outlook tends to be bullish; when it is below, the outlook tends to be bearish. However, both reflect price movements that have already occurred.
Extreme readings are usually accompanied by more volatile swings. At such times, it is better to reduce your position size rather than make a large bet.
First, the definition: A moving average is the average closing price of the past N candlesticks. Each time a new candlestick forms, the window moves forward by one, and connecting the values creates a moving-average line.
Now, how to read it: The relationship between short- and long-term moving averages is also often used to assess trends. When the short-term average is above the long-term average, the outlook tends to be bullish; when it is below, the outlook tends to be bearish. However, both reflect price movements that have already occurred.
Extreme readings are usually accompanied by more volatile swings. At such times, it is better to reduce your position size rather than make a large bet.
27
$AIN 4 hours: RSI is at 78, entering overbought territory.
While we’re on the subject, let’s talk about RSI.
“Overbought” means prices have risen a lot and quickly in recent days. It doesn’t mean too many people are buying, nor does it mean prices are about to fall.
When RSI enters the overbought or oversold zone, a more prudent response is to first consider the broader trend, recent price levels, and whether your position can withstand further volatility.
The same data can mean completely different things in different market conditions, so don’t blindly apply a rule of thumb.
#AIN
$AIN 4 hours: RSI is at 78, entering overbought territory.
While we’re on the subject, let’s talk about RSI.
“Overbought” means prices have risen a lot and quickly in recent days. It doesn’t mean too many people are buying, nor does it mean prices are about to fall.
When RSI enters the overbought or oversold zone, a more prudent response is to first consider the broader trend, recent price levels, and whether your position can withstand further volatility.
The same data can mean completely different things in different market conditions, so don’t blindly apply a rule of thumb.
#AIN
While we’re on the subject, let’s talk about RSI.
“Overbought” means prices have risen a lot and quickly in recent days. It doesn’t mean too many people are buying, nor does it mean prices are about to fall.
When RSI enters the overbought or oversold zone, a more prudent response is to first consider the broader trend, recent price levels, and whether your position can withstand further volatility.
The same data can mean completely different things in different market conditions, so don’t blindly apply a rule of thumb.
#AIN
26
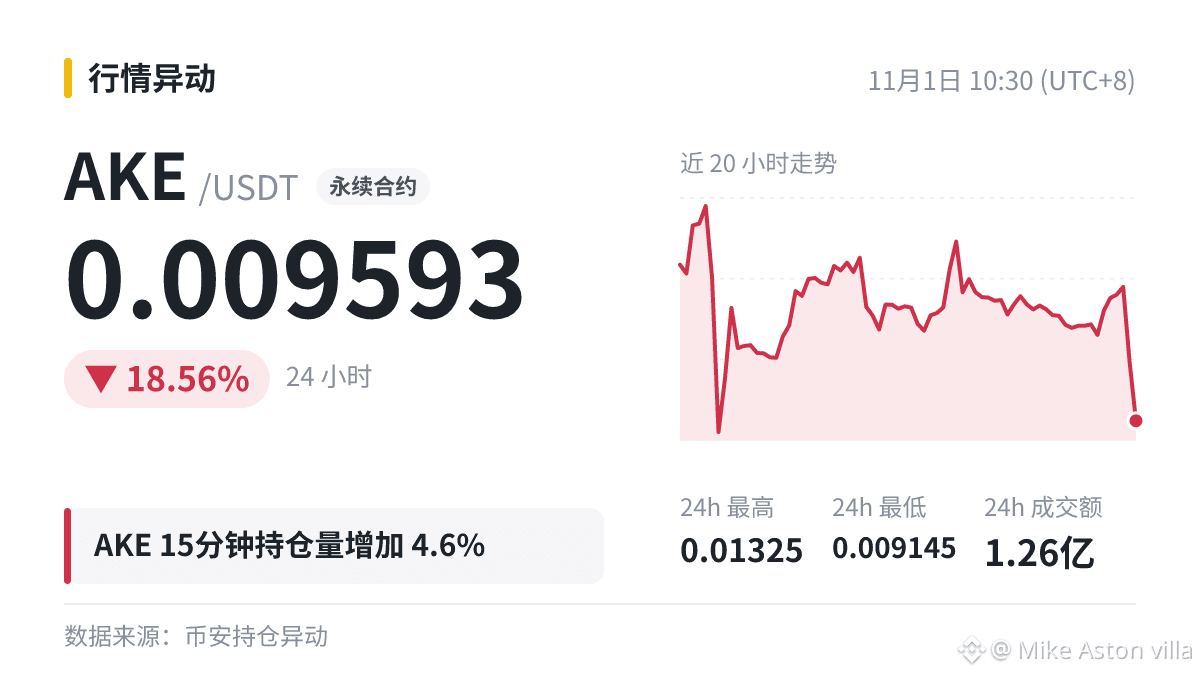
Looking only at price means missing half the picture. $AKE 15-minute open interest: +4.6%; price: -8.73%. Compare the two:
Rising open interest, falling price: new shorts are entering.
As open interest keeps climbing, watch whether the funding rate is rising too. Which side do you choose—long or short?
Looking only at price means missing half the picture. $AKE 15-minute open interest: +4.6%; price: -8.73%. Compare the two:
Rising open interest, falling price: new shorts are entering.
As open interest keeps climbing, watch whether the funding rate is rising too. Which side do you choose—long or short?
Rising open interest, falling price: new shorts are entering.
As open interest keeps climbing, watch whether the funding rate is rising too. Which side do you choose—long or short?
32
📢 Buzz on the Square: #美国现货ETHETF连续23日净流出
$BTC Add it to your watchlist first. Trending topics bring traffic, but attention isn’t buying pressure. Have you come across this hot topic?
📢 Buzz on the Square: #美国现货ETHETF连续23日净流出
$BTC Add it to your watchlist first. Trending topics bring traffic, but attention isn’t buying pressure. Have you come across this hot topic?
$BTC Add it to your watchlist first. Trending topics bring traffic, but attention isn’t buying pressure. Have you come across this hot topic?
52
Everyone, the market's moving!
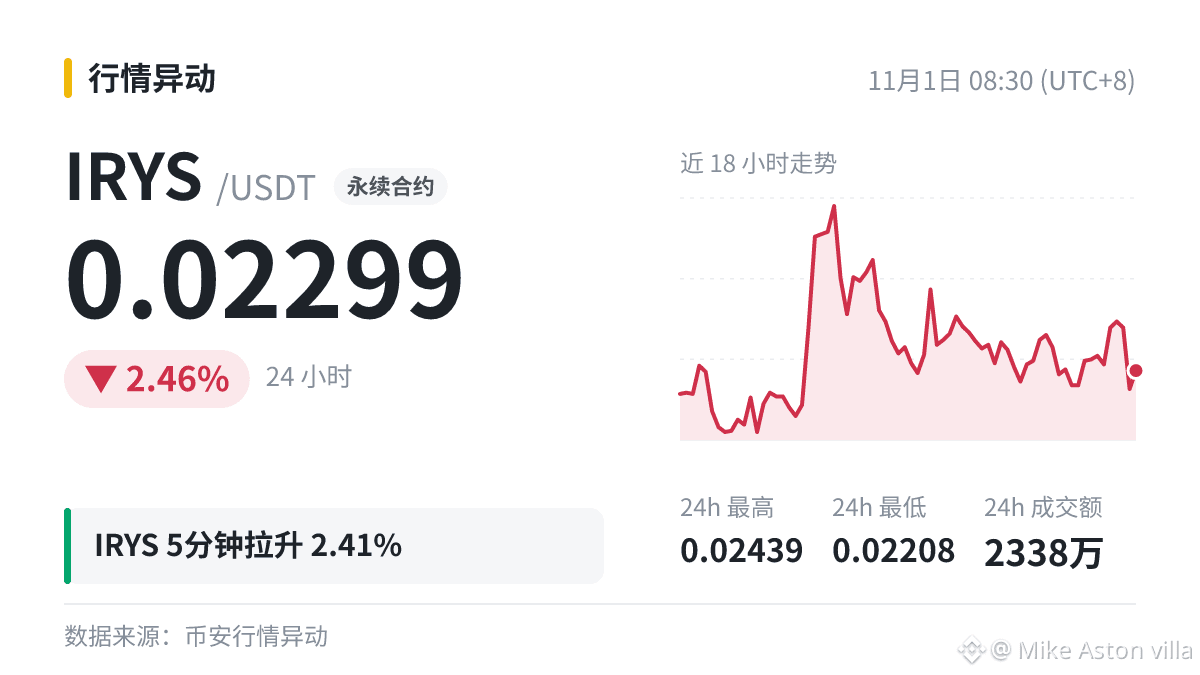
📈 $IRYS 5-minute surge of +2.41%, current price 0.02299 (24h -2.46%).
The short-term gains are substantial, so don't take on too much exposure. Do you think there'll be a second wave?
Everyone, the market's moving!
📈 $IRYS 5-minute surge of +2.41%, current price 0.02299 (24h -2.46%).
The short-term gains are substantial, so don't take on too much exposure. Do you think there'll be a second wave?
📈 $IRYS 5-minute surge of +2.41%, current price 0.02299 (24h -2.46%).
The short-term gains are substantial, so don't take on too much exposure. Do you think there'll be a second wave?
55
Disconnect occasionally.
Step away from the market for a few days now and then; when you come back, you'll see things more clearly.
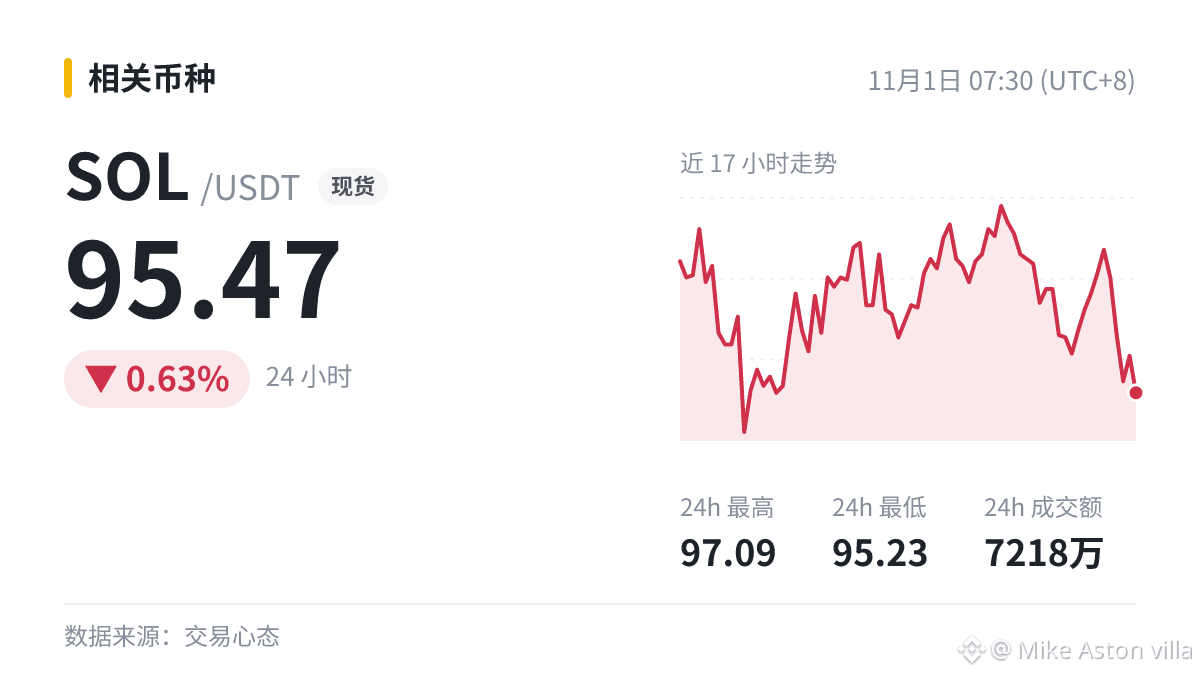
Also, take a quick look at $SOL , currently at 95.47 (24h -0.63%). Do you agree with this idea?
#SOL
Disconnect occasionally.
Step away from the market for a few days now and then; when you come back, you'll see things more clearly.
Also, take a quick look at $SOL , currently at 95.47 (24h -0.63%). Do you agree with this idea?
#SOL
Step away from the market for a few days now and then; when you come back, you'll see things more clearly.
Also, take a quick look at $SOL , currently at 95.47 (24h -0.63%). Do you agree with this idea?
#SOL
Everyone on the forum is discussing this topic: #何一表示储备证明10种代币全额背书
Trading volume is the most honest indicator; whether news carries weight is clear from the trades.
$BTC 24h +0.1%
Everyone on the forum is discussing this topic: #何一表示储备证明10种代币全额背书
Trading volume is the most honest indicator; whether news carries weight is clear from the trades.
$BTC 24h +0.1%
Trading volume is the most honest indicator; whether news carries weight is clear from the trades.
$BTC 24h +0.1%
4
$WLD has broken through the 0.4 level and is currently at 0.4037.
When assessing key price levels, I generally look at three things:
① Close: An intraday move above the level doesn’t count; it’s only a confirmed breakout if the closing price is above 0.4.
② Retest: Can the price hold near 0.4 during a pullback? If it does, resistance has turned into support.
③ Volume: Did trading volume pick up during the breakout? Breakouts on declining volume are more likely to be reversed.
#WLD
$WLD has broken through the 0.4 level and is currently at 0.4037.
When assessing key price levels, I generally look at three things:
① Close: An intraday move above the level doesn’t count; it’s only a confirmed breakout if the closing price is above 0.4.
② Retest: Can the price hold near 0.4 during a pullback? If it does, resistance has turned into support.
③ Volume: Did trading volume pick up during the breakout? Breakouts on declining volume are more likely to be reversed.
#WLD
When assessing key price levels, I generally look at three things:
① Close: An intraday move above the level doesn’t count; it’s only a confirmed breakout if the closing price is above 0.4.
② Retest: Can the price hold near 0.4 during a pullback? If it does, resistance has turned into support.
③ Volume: Did trading volume pick up during the breakout? Breakouts on declining volume are more likely to be reversed.
#WLD
3
Stop when it's time to stop.
When you're not in a good state, the best thing to do is stop.
Right now, $DOGE is showing 0.07538 (24h +0.31%). What tips can you share?
Stop when it's time to stop.
When you're not in a good state, the best thing to do is stop.
Right now, $DOGE is showing 0.07538 (24h +0.31%). What tips can you share?
When you're not in a good state, the best thing to do is stop.
Right now, $DOGE is showing 0.07538 (24h +0.31%). What tips can you share?
5
$SUI 4-hour MACD forms a bullish crossover below the zero line.
Using this figure, let's break down MACD.
MACD values depend on the price of the asset, so directly comparing values across different coins is meaningless. What matters is the direction and how they relate to the zero line.
Many people also watch for bearish and bullish divergences: when the price makes a new high but MACD doesn't, or the price makes a new low but MACD doesn't keep up, this is often seen as a sign that momentum is fading.
Cross-checking multiple data points is more reliable than looking at just one, but even more signals can't provide a definitive answer.
#SUI
$SUI 4-hour MACD forms a bullish crossover below the zero line.
Using this figure, let's break down MACD.
MACD values depend on the price of the asset, so directly comparing values across different coins is meaningless. What matters is the direction and how they relate to the zero line.
Many people also watch for bearish and bullish divergences: when the price makes a new high but MACD doesn't, or the price makes a new low but MACD doesn't keep up, this is often seen as a sign that momentum is fading.
Cross-checking multiple data points is more reliable than looking at just one, but even more signals can't provide a definitive answer.
#SUI
Using this figure, let's break down MACD.
MACD values depend on the price of the asset, so directly comparing values across different coins is meaningless. What matters is the direction and how they relate to the zero line.
Many people also watch for bearish and bullish divergences: when the price makes a new high but MACD doesn't, or the price makes a new low but MACD doesn't keep up, this is often seen as a sign that momentum is fading.
Cross-checking multiple data points is more reliable than looking at just one, but even more signals can't provide a definitive answer.
#SUI
Trading Notes | Emotions
Other people’s posted gains are just a screenshot—you don’t see them when they’re losing.
A practical approach: compare yourself only with who you were last month.
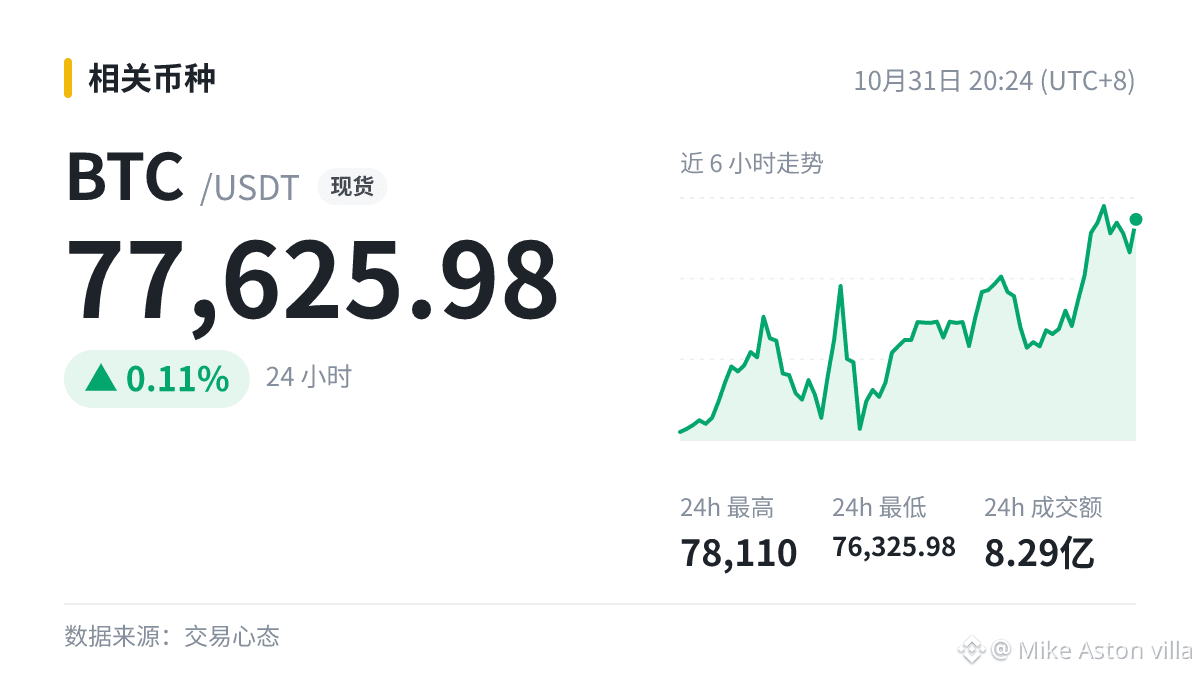
Right now, $BTC is priced at 77625.98 (24h +0.11%).
#BTC
Trading Notes | Emotions
Other people’s posted gains are just a screenshot—you don’t see them when they’re losing.
A practical approach: compare yourself only with who you were last month.
Right now, $BTC is priced at 77625.98 (24h +0.11%).
#BTC
Other people’s posted gains are just a screenshot—you don’t see them when they’re losing.
A practical approach: compare yourself only with who you were last month.
Right now, $BTC is priced at 77625.98 (24h +0.11%).
#BTC
1
$AIN has fallen below the 0.26 level, with the current price at 0.2428.
Round-number levels don't have any special significance in themselves, but orders, stop-losses, and psychological expectations tend to cluster around them, so the tug-of-war between bulls and bears often gets pretty intense.
The key is whether a rebound can reclaim 0.26. If it can't, that level will turn from support into resistance. How do you think things will play out from here?
$AIN has fallen below the 0.26 level, with the current price at 0.2428.
Round-number levels don't have any special significance in themselves, but orders, stop-losses, and psychological expectations tend to cluster around them, so the tug-of-war between bulls and bears often gets pretty intense.
The key is whether a rebound can reclaim 0.26. If it can't, that level will turn from support into resistance. How do you think things will play out from here?
Round-number levels don't have any special significance in themselves, but orders, stop-losses, and psychological expectations tend to cluster around them, so the tug-of-war between bulls and bears often gets pretty intense.
The key is whether a rebound can reclaim 0.26. If it can't, that level will turn from support into resistance. How do you think things will play out from here?
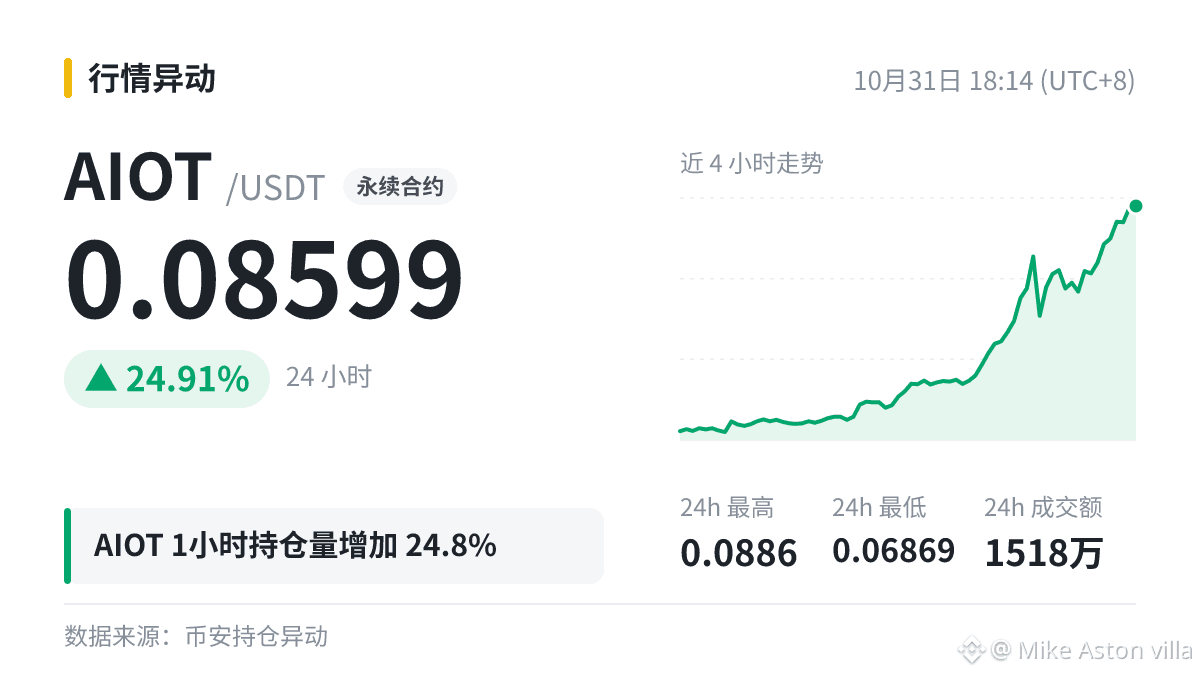
$AIOT 1-hour contract open interest increased by 24.82%, with an open interest value of about $4.54 million; the price rose 8.49% over the same period.
Let’s use this figure to talk about open interest.
When both buyers and sellers open new positions, open interest increases; when both sides close positions, it decreases. If one side opens positions while the other closes, open interest remains unchanged.
If the price stays roughly flat while open interest rises sharply, it suggests both bulls and bears are adding to their positions. This often increases the likelihood of a larger move later, though the direction is uncertain.
Extreme readings often come with greater volatility. At times like these, it’s better to reduce leverage rather than make a big bet.
$AIOT 1-hour contract open interest increased by 24.82%, with an open interest value of about $4.54 million; the price rose 8.49% over the same period.
Let’s use this figure to talk about open interest.
When both buyers and sellers open new positions, open interest increases; when both sides close positions, it decreases. If one side opens positions while the other closes, open interest remains unchanged.
If the price stays roughly flat while open interest rises sharply, it suggests both bulls and bears are adding to their positions. This often increases the likelihood of a larger move later, though the direction is uncertain.
Extreme readings often come with greater volatility. At times like these, it’s better to reduce leverage rather than make a big bet.
Let’s use this figure to talk about open interest.
When both buyers and sellers open new positions, open interest increases; when both sides close positions, it decreases. If one side opens positions while the other closes, open interest remains unchanged.
If the price stays roughly flat while open interest rises sharply, it suggests both bulls and bears are adding to their positions. This often increases the likelihood of a larger move later, though the direction is uncertain.
Extreme readings often come with greater volatility. At times like these, it’s better to reduce leverage rather than make a big bet.
Log in to explore more content
Join global crypto users on Binance Square
⚡️ Get latest and useful information about crypto.
💬 Trusted by the world’s largest crypto exchange.
👍 Discover real insights from verified creators.
Email / Phone number
Trending Topics
WithdrawalsBack: 15 networks live
126 views
12 Discussing
Binance News Update | Binance Reopens Withdrawals for BTC, ETH, USDT and More Across 15 Networks, Meeting Its Sunday Target
Binance News
·17 Likes
·7.6k views
BinanceUpdatesProofofReservesAddresses
29,176 views
682 Discussing
BinanceToResumePhaseOneOfWithdrawals
60,885 views
957 Discussing