
Scan Market Signals
3.5k Posts

Scan Market Signals
Report
Block User
Scanner Pro | Real-Time Binance Signals & Data-Driven TA 📊 Zero FOMO, Pure Execution
6 Following
68 Followers
78 Liked
Posts
All
Quotes
Videos
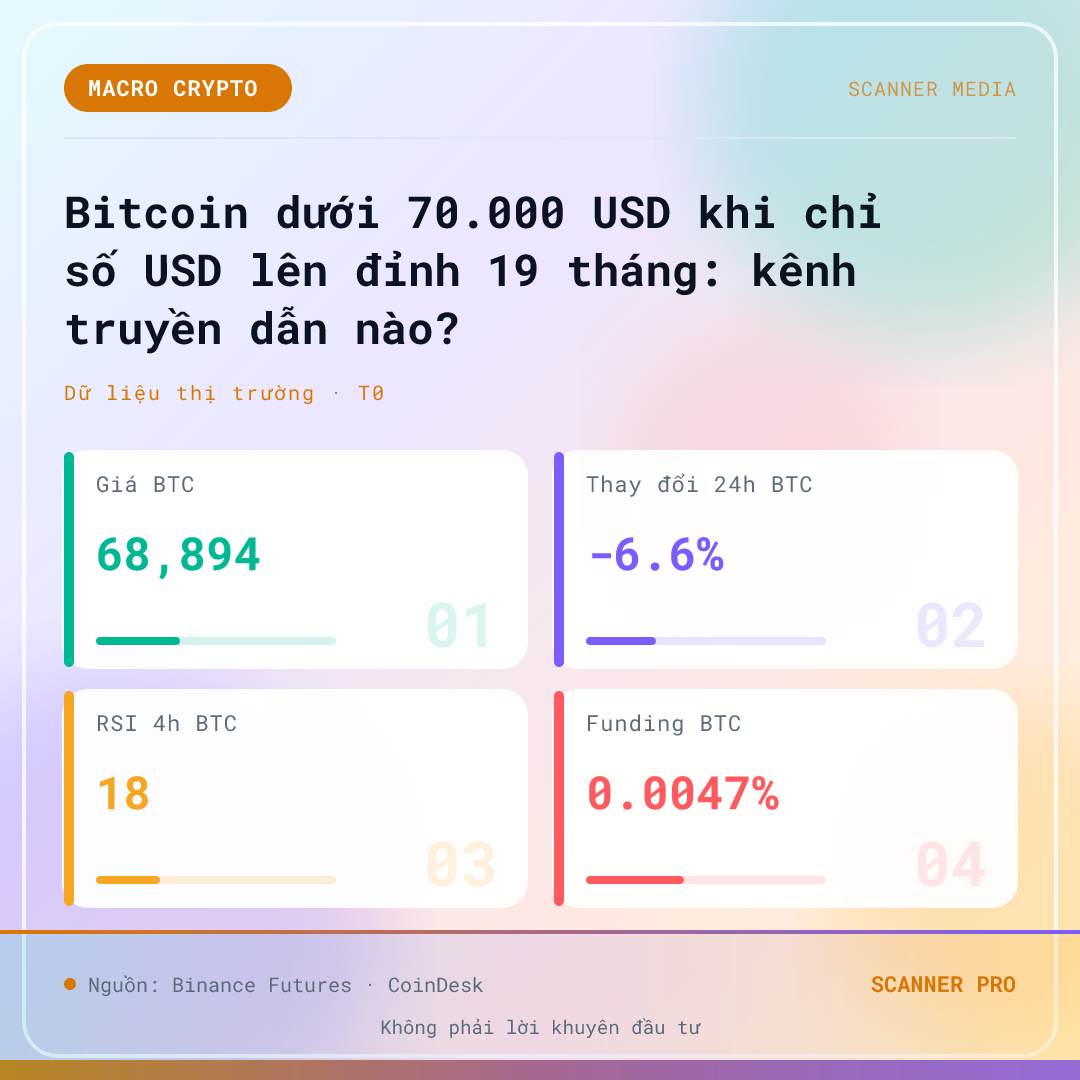
Bitcoin below $70,000 as the US Dollar Index hits a 19-month high: What are the transmission channels?
CoinDesk reported on 13/11/2026 that Bitcoin fell below the $70,000 mark as the Dollar Index reached a 19-month high. This article outlines possible transmission channels from macroeconomic conditions to crypto, alongside supporting market data and the limits of the inference.
Confirmed event and data
CoinDesk reported on 13/11/2026 (03:37 UTC) that Bitcoin fell below $70,000 as the Dollar Index reached a 19-month high. A Binance Futures snapshot at 04:30 the same day recorded BTC at $68894, a 24-hour change of -6.6, and 24-hour volume of 16.03 billion USDT. ETH was at $1930 (-6.0), and SOL at $78.33 (-5.8). BTC's 1-hour RSI was 11, its 4-hour RSI was 18, and funding was 0.0047. The group…
Three possible transmission channels
First, the liquidity channel: a stronger USD often coincides with tighter financial conditions, reducing global capital's appetite for risk—high-volatility asset classes such as crypto often face selling pressure first. Second, the opportunity-cost channel: more attractive nominal yields when the USD is strong make holding non-yielding assets relatively less appealing. Third, the sentiment and…
Counter-scenario: If capital flows do not spill over into crypto or the news was already priced in, the transmission channel no longer applies.
Sources: CoinDesk (10:37 13-11) · Binance Futures (11:30 13-11)
This is educational technical analysis, not investment advice. Cryptocurrency trading involves high risk, and you could lose all your capital. Do your own research and take responsibility for your decisions.
#Binance #Crypto #Futures
Bitcoin below $70,000 as the US Dollar Index hits a 19-month high: What are the transmission channels?
CoinDesk reported on 13/11/2026 that Bitcoin fell below the $70,000 mark as the Dollar Index reached a 19-month high. This article outlines possible transmission channels from macroeconomic conditions to crypto, alongside supporting market data and the limits of the inference.
Confirmed event and data
CoinDesk reported on 13/11/2026 (03:37 UTC) that Bitcoin fell below $70,000 as the Dollar Index reached a 19-month high. A Binance Futures snapshot at 04:30 the same day recorded BTC at $68894, a 24-hour change of -6.6, and 24-hour volume of 16.03 billion USDT. ETH was at $1930 (-6.0), and SOL at $78.33 (-5.8). BTC's 1-hour RSI was 11, its 4-hour RSI was 18, and funding was 0.0047. The group…
Three possible transmission channels
First, the liquidity channel: a stronger USD often coincides with tighter financial conditions, reducing global capital's appetite for risk—high-volatility asset classes such as crypto often face selling pressure first. Second, the opportunity-cost channel: more attractive nominal yields when the USD is strong make holding non-yielding assets relatively less appealing. Third, the sentiment and…
Counter-scenario: If capital flows do not spill over into crypto or the news was already priced in, the transmission channel no longer applies.
Sources: CoinDesk (10:37 13-11) · Binance Futures (11:30 13-11)
This is educational technical analysis, not investment advice. Cryptocurrency trading involves high risk, and you could lose all your capital. Do your own research and take responsibility for your decisions.
#Binance #Crypto #Futures
CoinDesk reported on 13/11/2026 that Bitcoin fell below the $70,000 mark as the Dollar Index reached a 19-month high. This article outlines possible transmission channels from macroeconomic conditions to crypto, alongside supporting market data and the limits of the inference.
Confirmed event and data
CoinDesk reported on 13/11/2026 (03:37 UTC) that Bitcoin fell below $70,000 as the Dollar Index reached a 19-month high. A Binance Futures snapshot at 04:30 the same day recorded BTC at $68894, a 24-hour change of -6.6, and 24-hour volume of 16.03 billion USDT. ETH was at $1930 (-6.0), and SOL at $78.33 (-5.8). BTC's 1-hour RSI was 11, its 4-hour RSI was 18, and funding was 0.0047. The group…
Three possible transmission channels
First, the liquidity channel: a stronger USD often coincides with tighter financial conditions, reducing global capital's appetite for risk—high-volatility asset classes such as crypto often face selling pressure first. Second, the opportunity-cost channel: more attractive nominal yields when the USD is strong make holding non-yielding assets relatively less appealing. Third, the sentiment and…
Counter-scenario: If capital flows do not spill over into crypto or the news was already priced in, the transmission channel no longer applies.
Sources: CoinDesk (10:37 13-11) · Binance Futures (11:30 13-11)
This is educational technical analysis, not investment advice. Cryptocurrency trading involves high risk, and you could lose all your capital. Do your own research and take responsibility for your decisions.
#Binance #Crypto #Futures
4
SHORT $IMX | Volume spike 0.89x — signal or trap?
🚨 AI TRADE ALERT — $IMX
🔴 SHORT
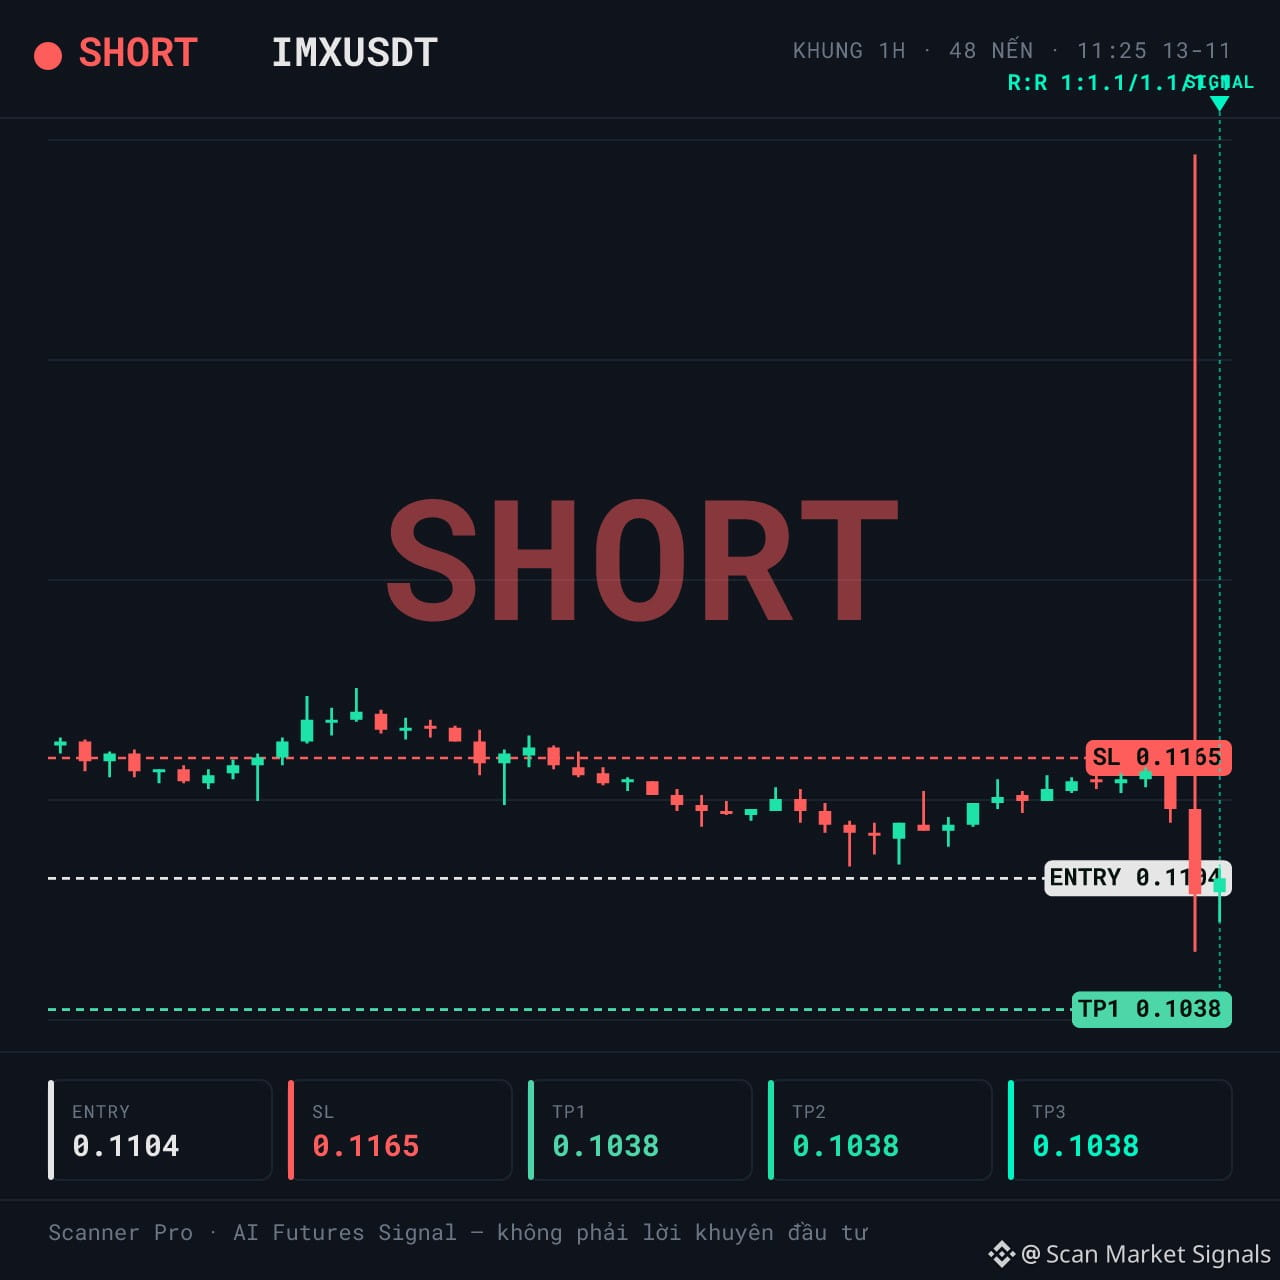
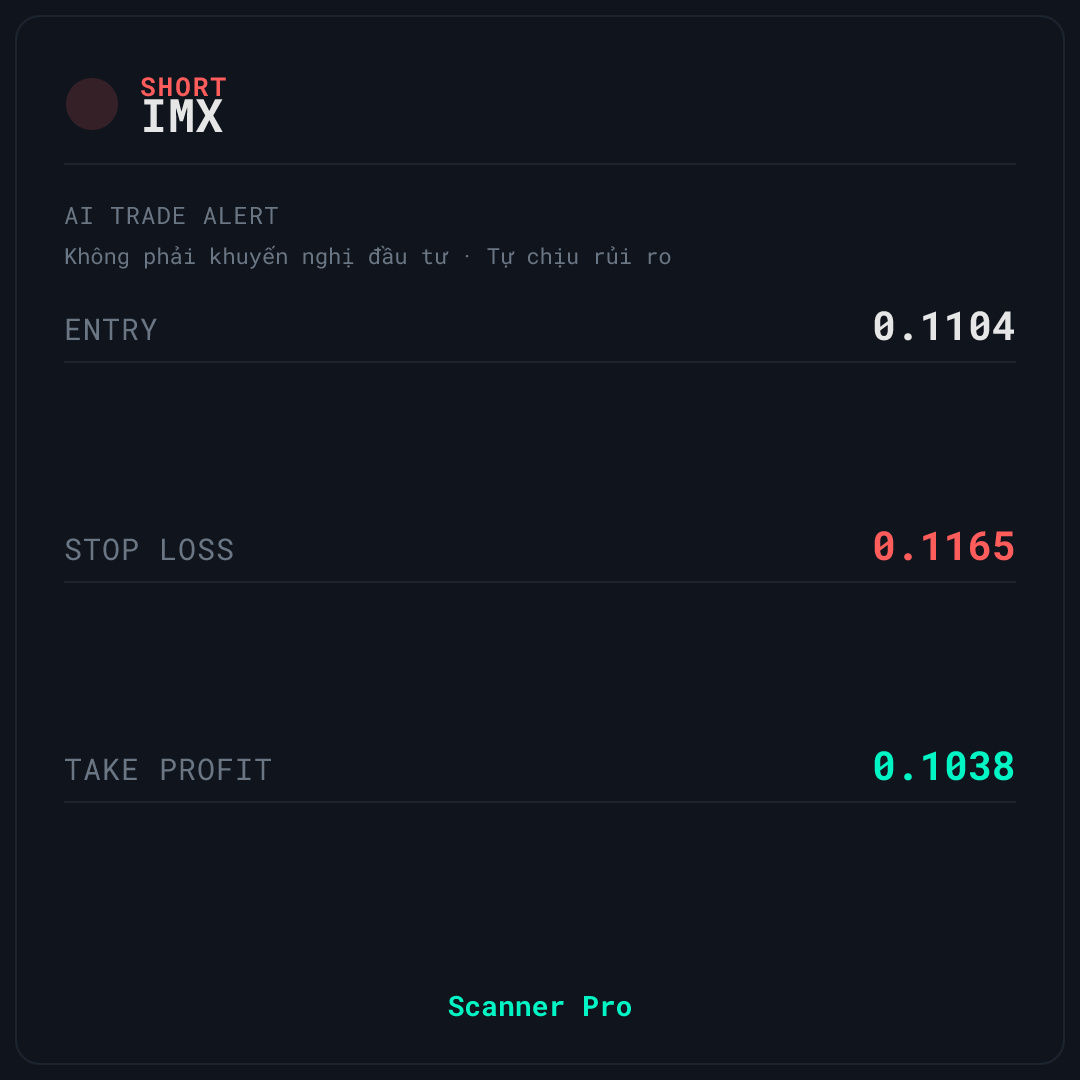
📌 Entry: 0.1102 – 0.1106
🛑 Stop Loss: 0.1165
🎯 Take Profit: 0.1038
⏰ Valid for: 6 hours (11:25 – 17:25 VN) - Date: 13/11
📉 DOWNTREND — SHORT with the downward trend
$IMX is being monitored by Scanner Pro for a SHORT scenario as the price reacts to the resistance zone above. The market context is classified as a downtrend (trend_down) with 70 confidence; the 0.89x volume spike indicates that liquidity has not surged.
📊 CONTEXT & DATA
24h volume is approximately 23.582.386 in quote asset, with a 0.89x volume spike — meaning liquidity has not surged and money has not really entered the market. Funding is -0.0213%: SHORT traders are paying LONG traders, meaning the market is tilted toward short positions. This is a disadvantage because the crowd is on the same side as the signal and is paying fees. The price is currently at 9% of the 24h range, near the low — a sign that the downtrend is still present.
🚫 INVALIDATION & RISK MANAGEMENT — $IMX
🚫 Biggest risk: 1h momentum at 33.1 (below 40) shows that the market is already weak, but the fact that SHORT traders are crowded and paying funding is a disadvantage to watch. If the price closes above the stop-loss level on the signal card, the current SHORT scenario is no longer valid. 💡 In your view, is this a sign that the downtrend will continue, or just a technical bounce before a reversal?
This technical analysis is for educational purposes only and is not investment advice. Cryptocurrency trading carries high risk, and you could lose all your capital. Do your own research and take responsibility for your decisions.
#Binance #Crypto #Futures
SHORT $IMX | Volume spike 0.89x — signal or trap?
🚨 AI TRADE ALERT — $IMX
🔴 SHORT
📌 Entry: 0.1102 – 0.1106
🛑 Stop Loss: 0.1165
🎯 Take Profit: 0.1038
⏰ Valid for: 6 hours (11:25 – 17:25 VN) - Date: 13/11
📉 DOWNTREND — SHORT with the downward trend
$IMX is being monitored by Scanner Pro for a SHORT scenario as the price reacts to the resistance zone above. The market context is classified as a downtrend (trend_down) with 70 confidence; the 0.89x volume spike indicates that liquidity has not surged.
📊 CONTEXT & DATA
24h volume is approximately 23.582.386 in quote asset, with a 0.89x volume spike — meaning liquidity has not surged and money has not really entered the market. Funding is -0.0213%: SHORT traders are paying LONG traders, meaning the market is tilted toward short positions. This is a disadvantage because the crowd is on the same side as the signal and is paying fees. The price is currently at 9% of the 24h range, near the low — a sign that the downtrend is still present.
🚫 INVALIDATION & RISK MANAGEMENT — $IMX
🚫 Biggest risk: 1h momentum at 33.1 (below 40) shows that the market is already weak, but the fact that SHORT traders are crowded and paying funding is a disadvantage to watch. If the price closes above the stop-loss level on the signal card, the current SHORT scenario is no longer valid. 💡 In your view, is this a sign that the downtrend will continue, or just a technical bounce before a reversal?
This technical analysis is for educational purposes only and is not investment advice. Cryptocurrency trading carries high risk, and you could lose all your capital. Do your own research and take responsibility for your decisions.
#Binance #Crypto #Futures
🚨 AI TRADE ALERT — $IMX
🔴 SHORT
📌 Entry: 0.1102 – 0.1106
🛑 Stop Loss: 0.1165
🎯 Take Profit: 0.1038
⏰ Valid for: 6 hours (11:25 – 17:25 VN) - Date: 13/11
📉 DOWNTREND — SHORT with the downward trend
$IMX is being monitored by Scanner Pro for a SHORT scenario as the price reacts to the resistance zone above. The market context is classified as a downtrend (trend_down) with 70 confidence; the 0.89x volume spike indicates that liquidity has not surged.
📊 CONTEXT & DATA
24h volume is approximately 23.582.386 in quote asset, with a 0.89x volume spike — meaning liquidity has not surged and money has not really entered the market. Funding is -0.0213%: SHORT traders are paying LONG traders, meaning the market is tilted toward short positions. This is a disadvantage because the crowd is on the same side as the signal and is paying fees. The price is currently at 9% of the 24h range, near the low — a sign that the downtrend is still present.
🚫 INVALIDATION & RISK MANAGEMENT — $IMX
🚫 Biggest risk: 1h momentum at 33.1 (below 40) shows that the market is already weak, but the fact that SHORT traders are crowded and paying funding is a disadvantage to watch. If the price closes above the stop-loss level on the signal card, the current SHORT scenario is no longer valid. 💡 In your view, is this a sign that the downtrend will continue, or just a technical bounce before a reversal?
This technical analysis is for educational purposes only and is not investment advice. Cryptocurrency trading carries high risk, and you could lose all your capital. Do your own research and take responsibility for your decisions.
#Binance #Crypto #Futures
1
SHORT $HUMA | Price is mid-range within the 24h range; this setup is unclear
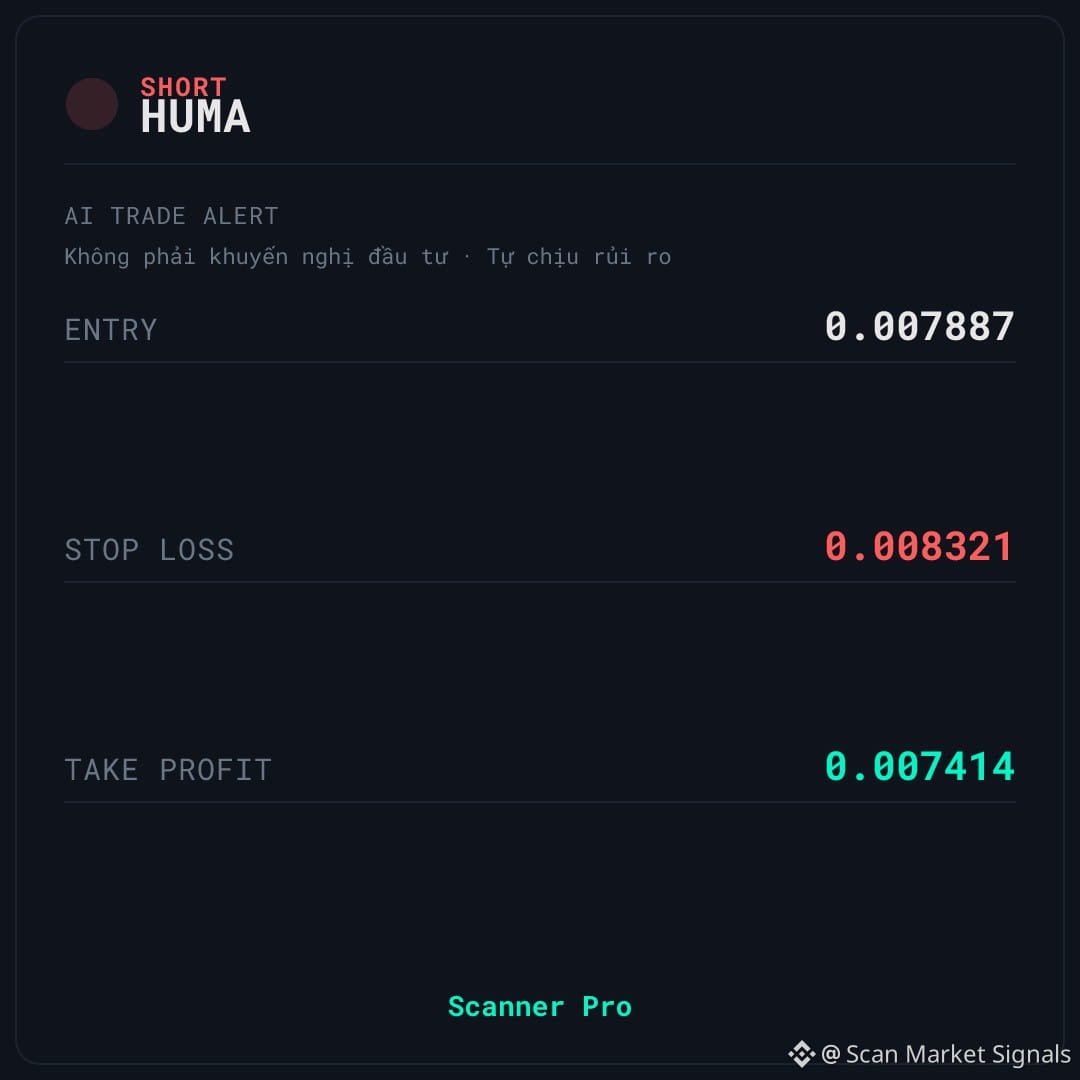
🚨 AI TRADE ALERT — $HUMA
🔴 SHORT
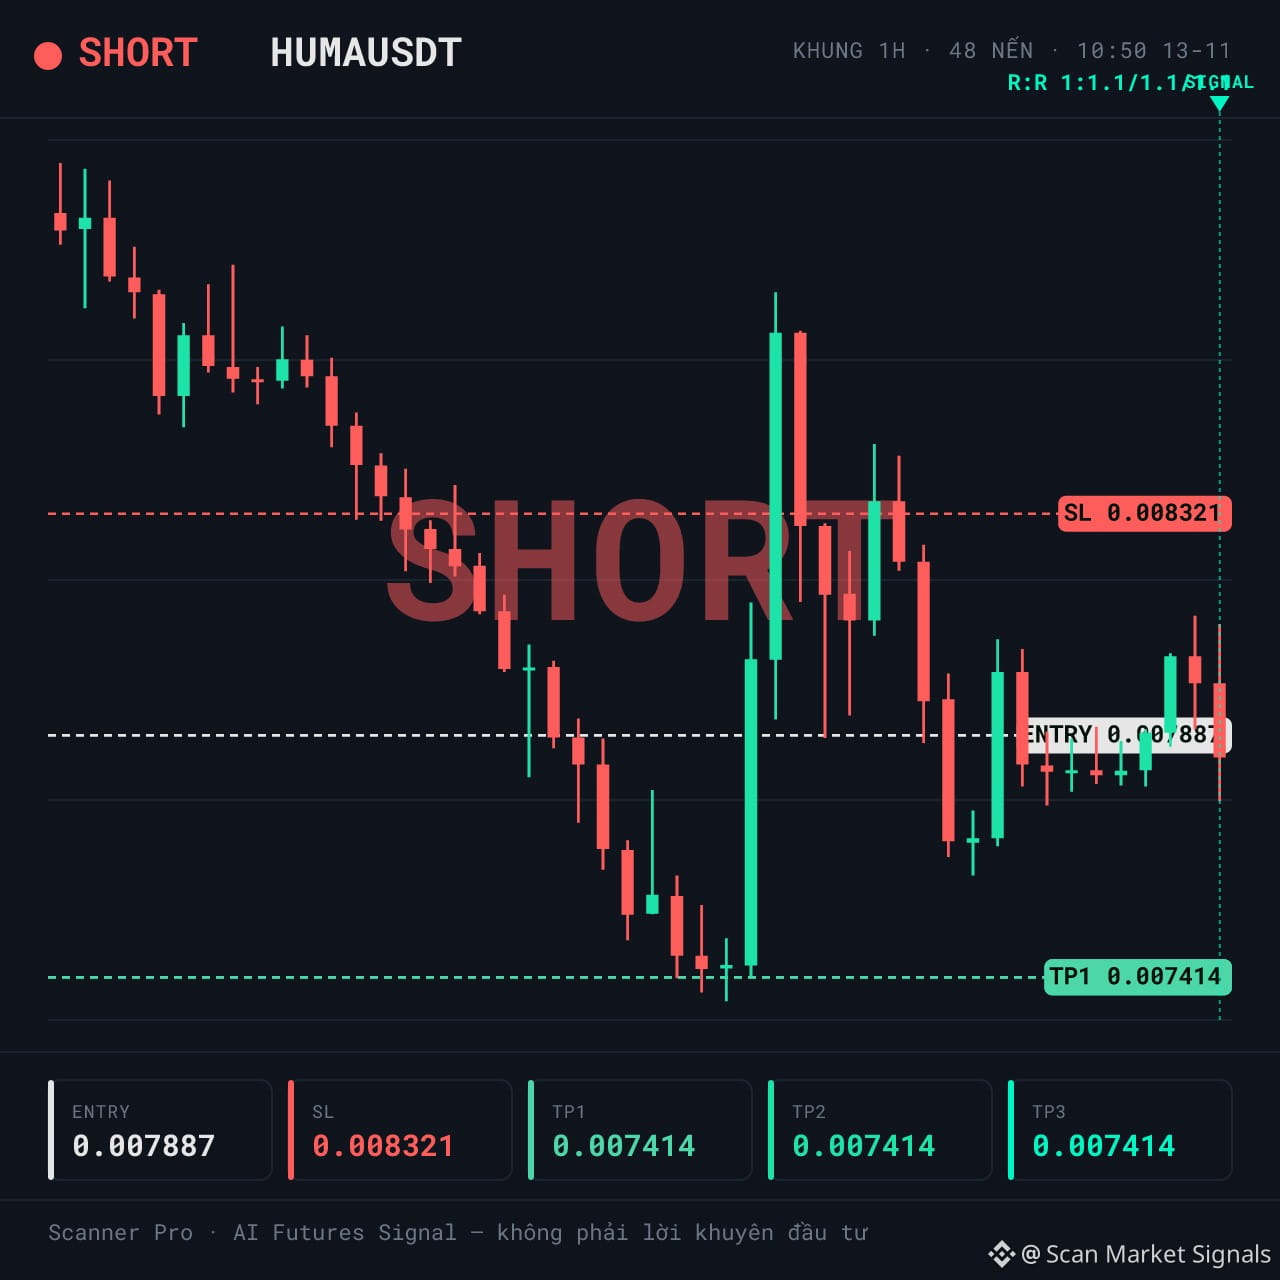
📌 Entry: 0.007875 – 0.007899
🛑 Stop Loss: 0.008321
🎯 Take Profit: 0.007414
⏰ Valid for: 6 hours (10:50 – 16:50 VN) - Date: 13/11
↔️ SIDEWAYS — range-bound market, fade (mean-reversion) signal
$HUMA is being monitored by Scanner Pro for a SHORT scenario if the price pulls back to the middle of the session range. The market is sideways, classification confidence is only 55, and 24h volume is around 28.47 million.
📊 WHY IT’S WORTH NOTING
The price is currently at 37% of the 24h range — neither near the low nor near the high. This is the main reason this signal isn’t particularly clean. 24h volume is around 28,469,181 in the quote asset, with a 1.06x volume spike — nothing unusual. The market is sideways, with a classification confidence of 55, which isn’t enough to call it a clear trend. Clear selling pressure is the only factor tilting the setup toward SHORT.
⚠️ SETUP & RISKS — $HUMA
🚫 The SHORT side is paying the LONG side, meaning the crowd is leaning in the same direction as the signal and paying funding — this is a disadvantage, not a plus. Also, the price being mid-range within the 24h range means either direction could get swept. The 1h momentum reading of 46.5 isn’t weak enough to confirm that the downtrend will continue. If the price closes above the stop-loss level on the signal card, the current SHORT scenario is no longer valid. Do you think this mid-range area is a level that will hold for a reversal, or just a temporary pause?
This technical analysis is for educational purposes only and is not investment advice. Cryptocurrency trading involves high risk, and you could lose all your capital. Do your own research and take responsibility for your decisions.
#Binance #Crypto #Futures
SHORT $HUMA | Price is mid-range within the 24h range; this setup is unclear
🚨 AI TRADE ALERT — $HUMA
🔴 SHORT
📌 Entry: 0.007875 – 0.007899
🛑 Stop Loss: 0.008321
🎯 Take Profit: 0.007414
⏰ Valid for: 6 hours (10:50 – 16:50 VN) - Date: 13/11
↔️ SIDEWAYS — range-bound market, fade (mean-reversion) signal
$HUMA is being monitored by Scanner Pro for a SHORT scenario if the price pulls back to the middle of the session range. The market is sideways, classification confidence is only 55, and 24h volume is around 28.47 million.
📊 WHY IT’S WORTH NOTING
The price is currently at 37% of the 24h range — neither near the low nor near the high. This is the main reason this signal isn’t particularly clean. 24h volume is around 28,469,181 in the quote asset, with a 1.06x volume spike — nothing unusual. The market is sideways, with a classification confidence of 55, which isn’t enough to call it a clear trend. Clear selling pressure is the only factor tilting the setup toward SHORT.
⚠️ SETUP & RISKS — $HUMA
🚫 The SHORT side is paying the LONG side, meaning the crowd is leaning in the same direction as the signal and paying funding — this is a disadvantage, not a plus. Also, the price being mid-range within the 24h range means either direction could get swept. The 1h momentum reading of 46.5 isn’t weak enough to confirm that the downtrend will continue. If the price closes above the stop-loss level on the signal card, the current SHORT scenario is no longer valid. Do you think this mid-range area is a level that will hold for a reversal, or just a temporary pause?
This technical analysis is for educational purposes only and is not investment advice. Cryptocurrency trading involves high risk, and you could lose all your capital. Do your own research and take responsibility for your decisions.
#Binance #Crypto #Futures
🚨 AI TRADE ALERT — $HUMA
🔴 SHORT
📌 Entry: 0.007875 – 0.007899
🛑 Stop Loss: 0.008321
🎯 Take Profit: 0.007414
⏰ Valid for: 6 hours (10:50 – 16:50 VN) - Date: 13/11
↔️ SIDEWAYS — range-bound market, fade (mean-reversion) signal
$HUMA is being monitored by Scanner Pro for a SHORT scenario if the price pulls back to the middle of the session range. The market is sideways, classification confidence is only 55, and 24h volume is around 28.47 million.
📊 WHY IT’S WORTH NOTING
The price is currently at 37% of the 24h range — neither near the low nor near the high. This is the main reason this signal isn’t particularly clean. 24h volume is around 28,469,181 in the quote asset, with a 1.06x volume spike — nothing unusual. The market is sideways, with a classification confidence of 55, which isn’t enough to call it a clear trend. Clear selling pressure is the only factor tilting the setup toward SHORT.
⚠️ SETUP & RISKS — $HUMA
🚫 The SHORT side is paying the LONG side, meaning the crowd is leaning in the same direction as the signal and paying funding — this is a disadvantage, not a plus. Also, the price being mid-range within the 24h range means either direction could get swept. The 1h momentum reading of 46.5 isn’t weak enough to confirm that the downtrend will continue. If the price closes above the stop-loss level on the signal card, the current SHORT scenario is no longer valid. Do you think this mid-range area is a level that will hold for a reversal, or just a temporary pause?
This technical analysis is for educational purposes only and is not investment advice. Cryptocurrency trading involves high risk, and you could lose all your capital. Do your own research and take responsibility for your decisions.
#Binance #Crypto #Futures
Strategy falls 5% after removal from MSCI as BTC declines
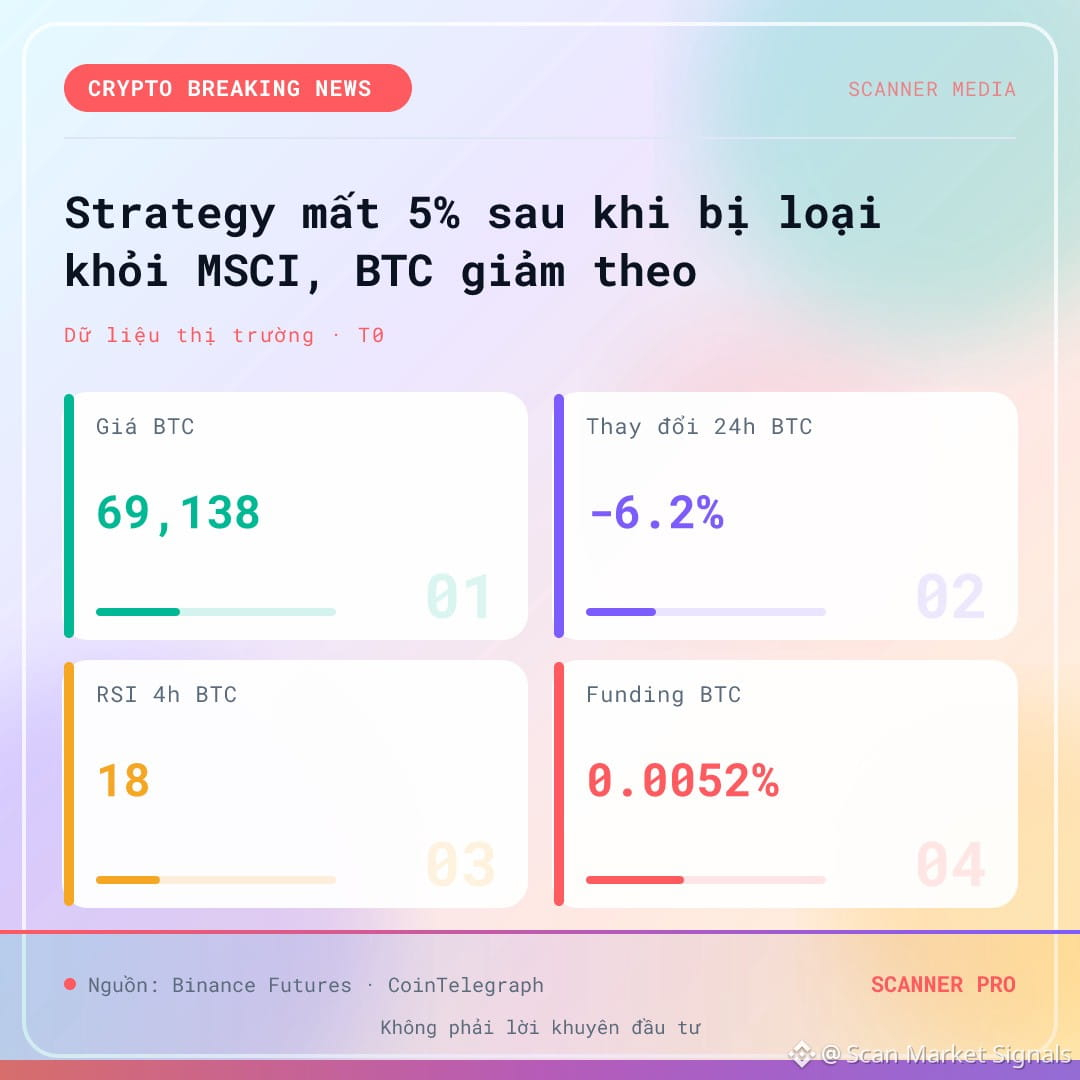
CoinTelegraph reports that Strategy shares fell 5% amid the company’s removal from an MSCI index and a Bitcoin sell-off. Market data from the same period shows BTC, ETH, and SOL all declined over 24 hours, but that is not enough to attribute the entire reaction solely to the index news.
What happened
CoinTelegraph reported at 21:52 on 12/11/2026 (UTC) that Strategy shares fell 5% amid the company’s removal from an MSCI index, while Bitcoin was in the midst of a sell-off. This is the full extent of the event confirmed by the source; the article provides no further details about the index composition or the timing of the rebalancing.
What the flows and prices are telling us
BTC’s 1-hour RSI is 12 and its 4-hour RSI is 18, with funding at 0.0052. These indicators show selling pressure across all three assets, meaning the price action confirms a broad correction, not just a decline in Strategy shares. However, the data does not distinguish the contribution of the MSCI news from other factors.
Counter-scenario: If prices reverse after the news has been priced in, the initial-impact scenario no longer holds.
Sources: CoinTelegraph (04:52 13-11) · Binance Futures (10:40 13-11)
This technical analysis is for educational purposes only and is not investment advice. Cryptocurrency trading involves significant risk, and you could lose all your capital. Do your own research and take responsibility for your decisions.
#Binance #Crypto #Futures
Strategy falls 5% after removal from MSCI as BTC declines
CoinTelegraph reports that Strategy shares fell 5% amid the company’s removal from an MSCI index and a Bitcoin sell-off. Market data from the same period shows BTC, ETH, and SOL all declined over 24 hours, but that is not enough to attribute the entire reaction solely to the index news.
What happened
CoinTelegraph reported at 21:52 on 12/11/2026 (UTC) that Strategy shares fell 5% amid the company’s removal from an MSCI index, while Bitcoin was in the midst of a sell-off. This is the full extent of the event confirmed by the source; the article provides no further details about the index composition or the timing of the rebalancing.
What the flows and prices are telling us
BTC’s 1-hour RSI is 12 and its 4-hour RSI is 18, with funding at 0.0052. These indicators show selling pressure across all three assets, meaning the price action confirms a broad correction, not just a decline in Strategy shares. However, the data does not distinguish the contribution of the MSCI news from other factors.
Counter-scenario: If prices reverse after the news has been priced in, the initial-impact scenario no longer holds.
Sources: CoinTelegraph (04:52 13-11) · Binance Futures (10:40 13-11)
This technical analysis is for educational purposes only and is not investment advice. Cryptocurrency trading involves significant risk, and you could lose all your capital. Do your own research and take responsibility for your decisions.
#Binance #Crypto #Futures
CoinTelegraph reports that Strategy shares fell 5% amid the company’s removal from an MSCI index and a Bitcoin sell-off. Market data from the same period shows BTC, ETH, and SOL all declined over 24 hours, but that is not enough to attribute the entire reaction solely to the index news.
What happened
CoinTelegraph reported at 21:52 on 12/11/2026 (UTC) that Strategy shares fell 5% amid the company’s removal from an MSCI index, while Bitcoin was in the midst of a sell-off. This is the full extent of the event confirmed by the source; the article provides no further details about the index composition or the timing of the rebalancing.
What the flows and prices are telling us
BTC’s 1-hour RSI is 12 and its 4-hour RSI is 18, with funding at 0.0052. These indicators show selling pressure across all three assets, meaning the price action confirms a broad correction, not just a decline in Strategy shares. However, the data does not distinguish the contribution of the MSCI news from other factors.
Counter-scenario: If prices reverse after the news has been priced in, the initial-impact scenario no longer holds.
Sources: CoinTelegraph (04:52 13-11) · Binance Futures (10:40 13-11)
This technical analysis is for educational purposes only and is not investment advice. Cryptocurrency trading involves significant risk, and you could lose all your capital. Do your own research and take responsibility for your decisions.
#Binance #Crypto #Futures
11
$BNB Around 640 USD: what are the 24-hour range and funding telling us?
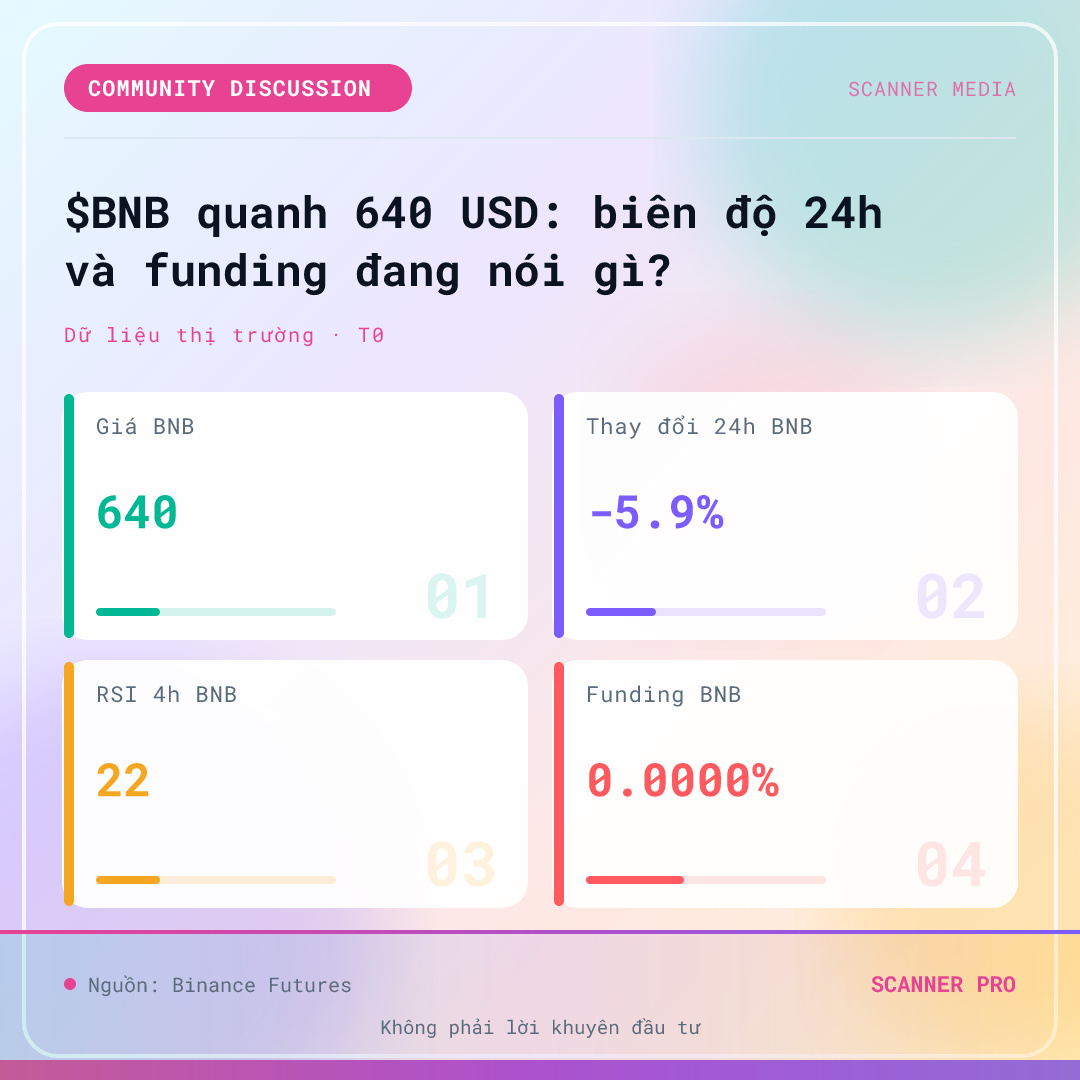
Notably, BNB funding is at 0.0000, while other major coins remain slightly positive—a data point worth discussing.
A data point to kick things off
Futures contract liquidity is around 0.42 billion USDT. The 1-hour RSI is at 18 and the 4-hour RSI is at 22—both deep in oversold territory by conventional measures. Most noteworthy: BNB funding is recorded at 0.0000, while BTC and ETH still have slightly positive funding.
What does zero funding tell us?
Funding at 0.0000 means demand for paying fees is relatively balanced between longs and shorts, with neither side having to pay much to the other. During a broad market decline, BNB funding hovering near zero instead of turning deeply negative suggests that short pressure is not overwhelmingly dominant in BNB contracts. However, this needs to be read in context: a low RSI may reflect strong downward momentum, rather than automatically signaling…
The opposing scenario: If BNB’s 24-hour range changes significantly, this question needs to be reassessed.
Source: Binance Futures (10:30 13-11)
This technical analysis is for educational purposes only and is not investment advice. Cryptocurrency trading carries high risk, and you could lose all your capital. Do your own research and take responsibility for your decisions.
#Binance #Crypto #Futures
$BNB Around 640 USD: what are the 24-hour range and funding telling us?
Notably, BNB funding is at 0.0000, while other major coins remain slightly positive—a data point worth discussing.
A data point to kick things off
Futures contract liquidity is around 0.42 billion USDT. The 1-hour RSI is at 18 and the 4-hour RSI is at 22—both deep in oversold territory by conventional measures. Most noteworthy: BNB funding is recorded at 0.0000, while BTC and ETH still have slightly positive funding.
What does zero funding tell us?
Funding at 0.0000 means demand for paying fees is relatively balanced between longs and shorts, with neither side having to pay much to the other. During a broad market decline, BNB funding hovering near zero instead of turning deeply negative suggests that short pressure is not overwhelmingly dominant in BNB contracts. However, this needs to be read in context: a low RSI may reflect strong downward momentum, rather than automatically signaling…
The opposing scenario: If BNB’s 24-hour range changes significantly, this question needs to be reassessed.
Source: Binance Futures (10:30 13-11)
This technical analysis is for educational purposes only and is not investment advice. Cryptocurrency trading carries high risk, and you could lose all your capital. Do your own research and take responsibility for your decisions.
#Binance #Crypto #Futures
Notably, BNB funding is at 0.0000, while other major coins remain slightly positive—a data point worth discussing.
A data point to kick things off
Futures contract liquidity is around 0.42 billion USDT. The 1-hour RSI is at 18 and the 4-hour RSI is at 22—both deep in oversold territory by conventional measures. Most noteworthy: BNB funding is recorded at 0.0000, while BTC and ETH still have slightly positive funding.
What does zero funding tell us?
Funding at 0.0000 means demand for paying fees is relatively balanced between longs and shorts, with neither side having to pay much to the other. During a broad market decline, BNB funding hovering near zero instead of turning deeply negative suggests that short pressure is not overwhelmingly dominant in BNB contracts. However, this needs to be read in context: a low RSI may reflect strong downward momentum, rather than automatically signaling…
The opposing scenario: If BNB’s 24-hour range changes significantly, this question needs to be reassessed.
Source: Binance Futures (10:30 13-11)
This technical analysis is for educational purposes only and is not investment advice. Cryptocurrency trading carries high risk, and you could lose all your capital. Do your own research and take responsibility for your decisions.
#Binance #Crypto #Futures
3
$XRP around 1.02 USD: 0.0100% funding and RSI 4h 29 — confirmation or warning?
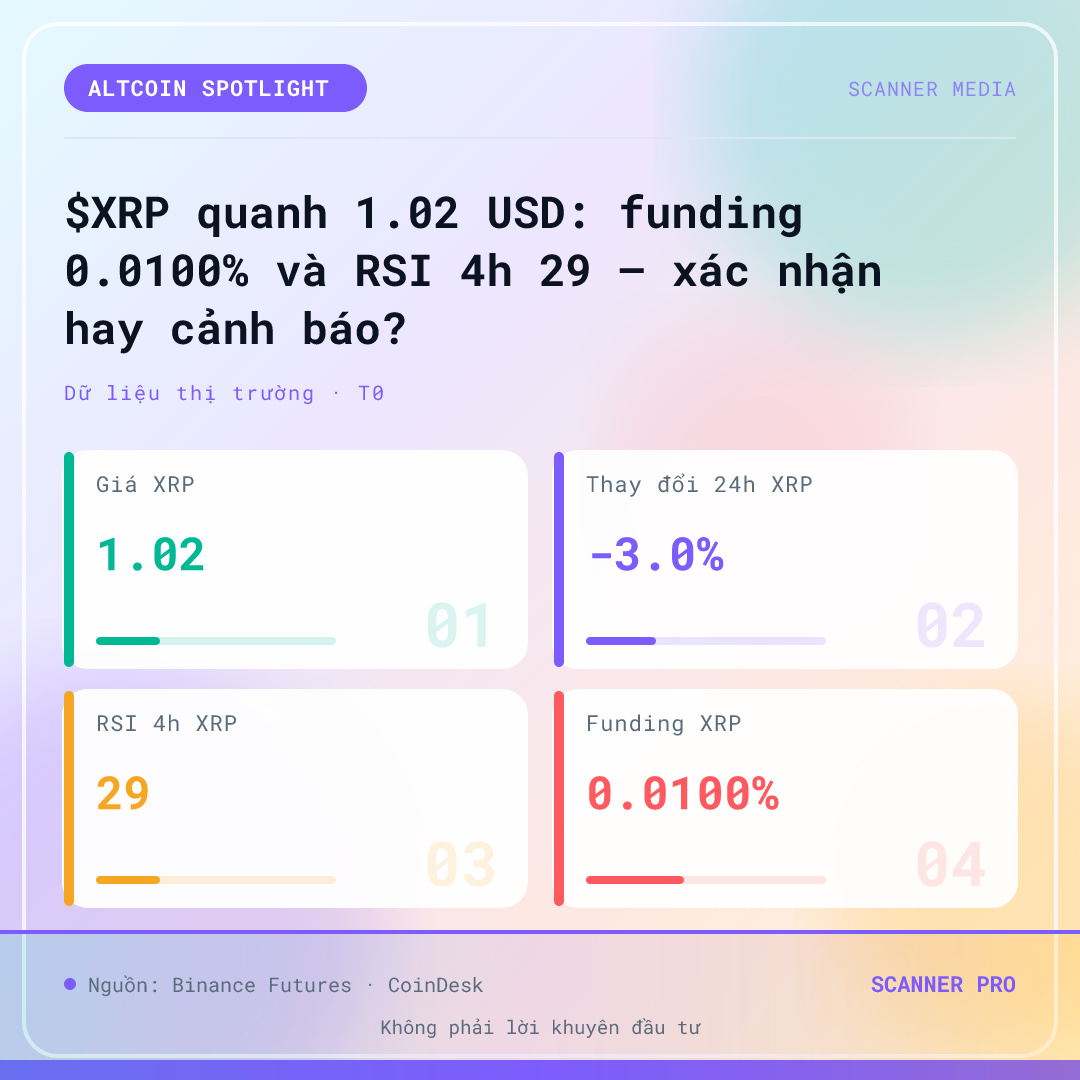
$XRP is trading around 1.02 USD, down 3.0% over 24 hours, while the 4h RSI is at 29 and funding is positive at 0.0100%. Slightly positive funding suggests longs are still willing to pay fees, but the low RSI and weakening broader market raise questions about the structure’s durability.
What the data says
According to the Binance Futures snapshot at 03:10 on 13/11/2026, $XRP is trading around 1.02 USD, down 3.0% over 24 hours. 24-hour volume is approximately 0.69 billion USDT. The 4h RSI is at 29 and the 1h RSI is at 31 — both are in low territory, reflecting downward momentum that has persisted across multiple short timeframes. Funding is at 0.0100%, meaning longs are still paying shorts.
Positive funding while the price falls
What stands out is that funding remains slightly positive despite the price decline. This suggests there are still traders holding long positions, with no clear signs of an outright rush to exit. However, positive funding does not mean the structure is healthy: when the price falls and funding does not move close to 0, longs could be under pressure if the decline continues. Conversely, this funding level is not yet high enough to create momentum for a…
Contrary scenario: If XRP liquidity thins and the price loses its short-term support zone, the current structure is no longer valid.
Sources: Binance Futures (10:10 13-11) · CoinDesk (12:18 12-11)
This technical analysis is for educational purposes only and is not investment advice. Cryptocurrency trading involves high risk, and you could lose all your capital. Do your own research and take responsibility for your decisions.
#Binance #Crypto #Futures
$XRP around 1.02 USD: 0.0100% funding and RSI 4h 29 — confirmation or warning?
$XRP is trading around 1.02 USD, down 3.0% over 24 hours, while the 4h RSI is at 29 and funding is positive at 0.0100%. Slightly positive funding suggests longs are still willing to pay fees, but the low RSI and weakening broader market raise questions about the structure’s durability.
What the data says
According to the Binance Futures snapshot at 03:10 on 13/11/2026, $XRP is trading around 1.02 USD, down 3.0% over 24 hours. 24-hour volume is approximately 0.69 billion USDT. The 4h RSI is at 29 and the 1h RSI is at 31 — both are in low territory, reflecting downward momentum that has persisted across multiple short timeframes. Funding is at 0.0100%, meaning longs are still paying shorts.
Positive funding while the price falls
What stands out is that funding remains slightly positive despite the price decline. This suggests there are still traders holding long positions, with no clear signs of an outright rush to exit. However, positive funding does not mean the structure is healthy: when the price falls and funding does not move close to 0, longs could be under pressure if the decline continues. Conversely, this funding level is not yet high enough to create momentum for a…
Contrary scenario: If XRP liquidity thins and the price loses its short-term support zone, the current structure is no longer valid.
Sources: Binance Futures (10:10 13-11) · CoinDesk (12:18 12-11)
This technical analysis is for educational purposes only and is not investment advice. Cryptocurrency trading involves high risk, and you could lose all your capital. Do your own research and take responsibility for your decisions.
#Binance #Crypto #Futures
$XRP is trading around 1.02 USD, down 3.0% over 24 hours, while the 4h RSI is at 29 and funding is positive at 0.0100%. Slightly positive funding suggests longs are still willing to pay fees, but the low RSI and weakening broader market raise questions about the structure’s durability.
What the data says
According to the Binance Futures snapshot at 03:10 on 13/11/2026, $XRP is trading around 1.02 USD, down 3.0% over 24 hours. 24-hour volume is approximately 0.69 billion USDT. The 4h RSI is at 29 and the 1h RSI is at 31 — both are in low territory, reflecting downward momentum that has persisted across multiple short timeframes. Funding is at 0.0100%, meaning longs are still paying shorts.
Positive funding while the price falls
What stands out is that funding remains slightly positive despite the price decline. This suggests there are still traders holding long positions, with no clear signs of an outright rush to exit. However, positive funding does not mean the structure is healthy: when the price falls and funding does not move close to 0, longs could be under pressure if the decline continues. Conversely, this funding level is not yet high enough to create momentum for a…
Contrary scenario: If XRP liquidity thins and the price loses its short-term support zone, the current structure is no longer valid.
Sources: Binance Futures (10:10 13-11) · CoinDesk (12:18 12-11)
This technical analysis is for educational purposes only and is not investment advice. Cryptocurrency trading involves high risk, and you could lose all your capital. Do your own research and take responsibility for your decisions.
#Binance #Crypto #Futures
4
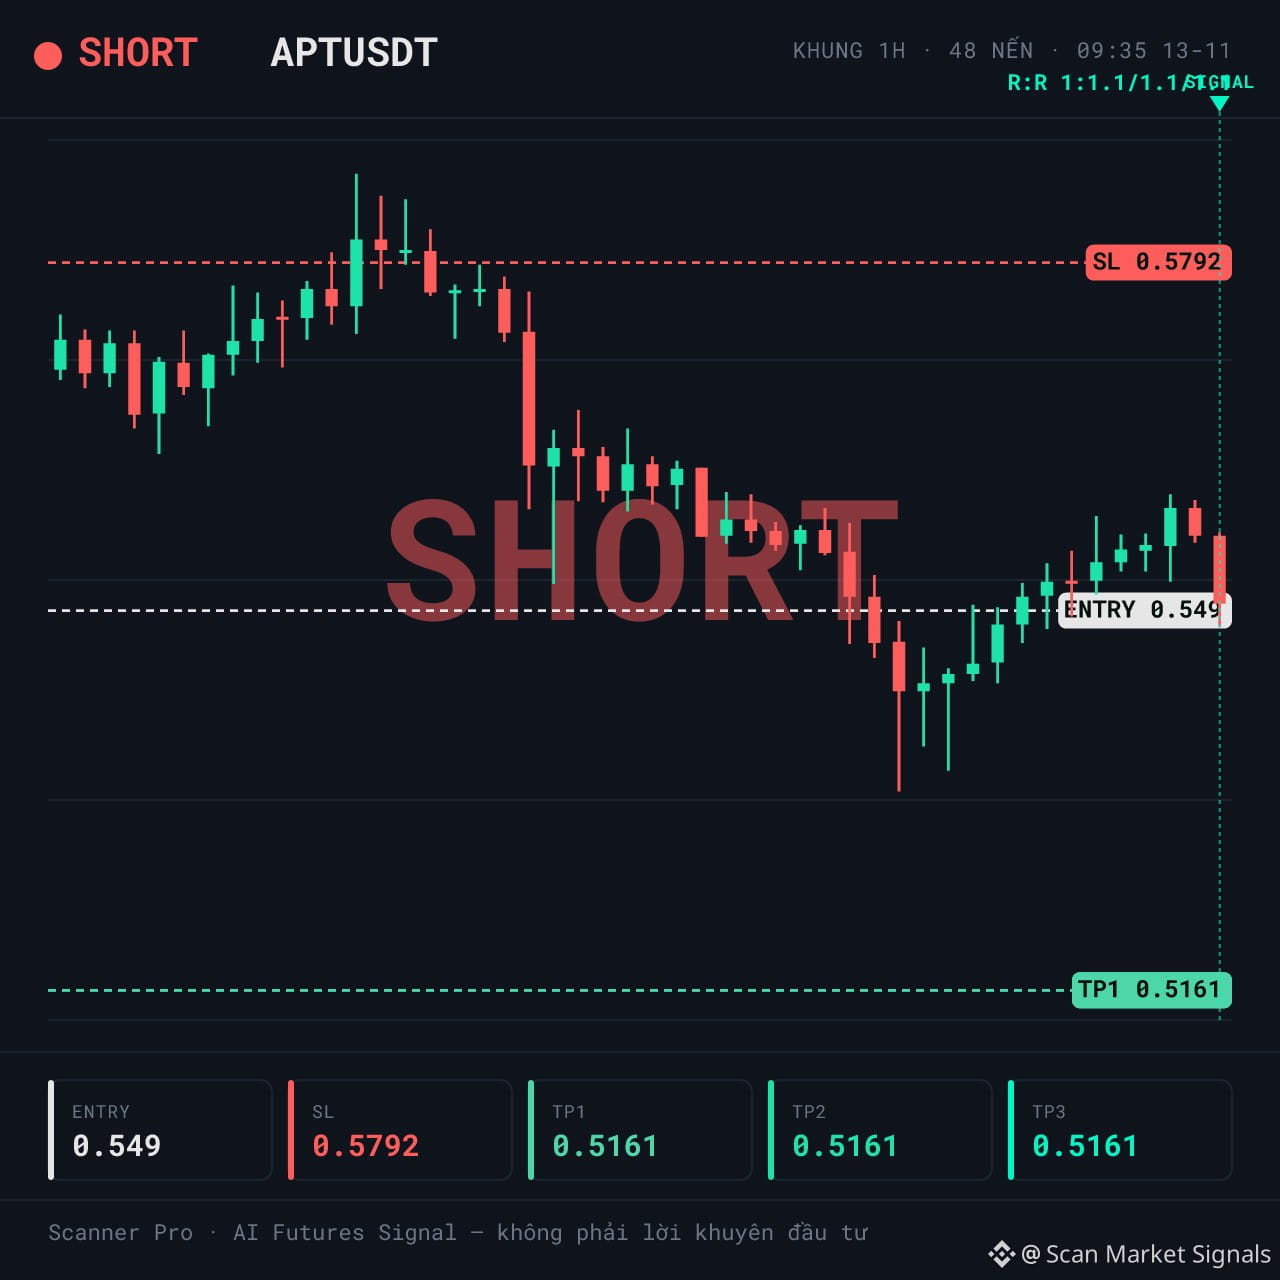
SHORT $APT | Deep liquidity, but don’t forget about slippage
🚨 AI TRADE ALERT — $APT
🔴 SHORT
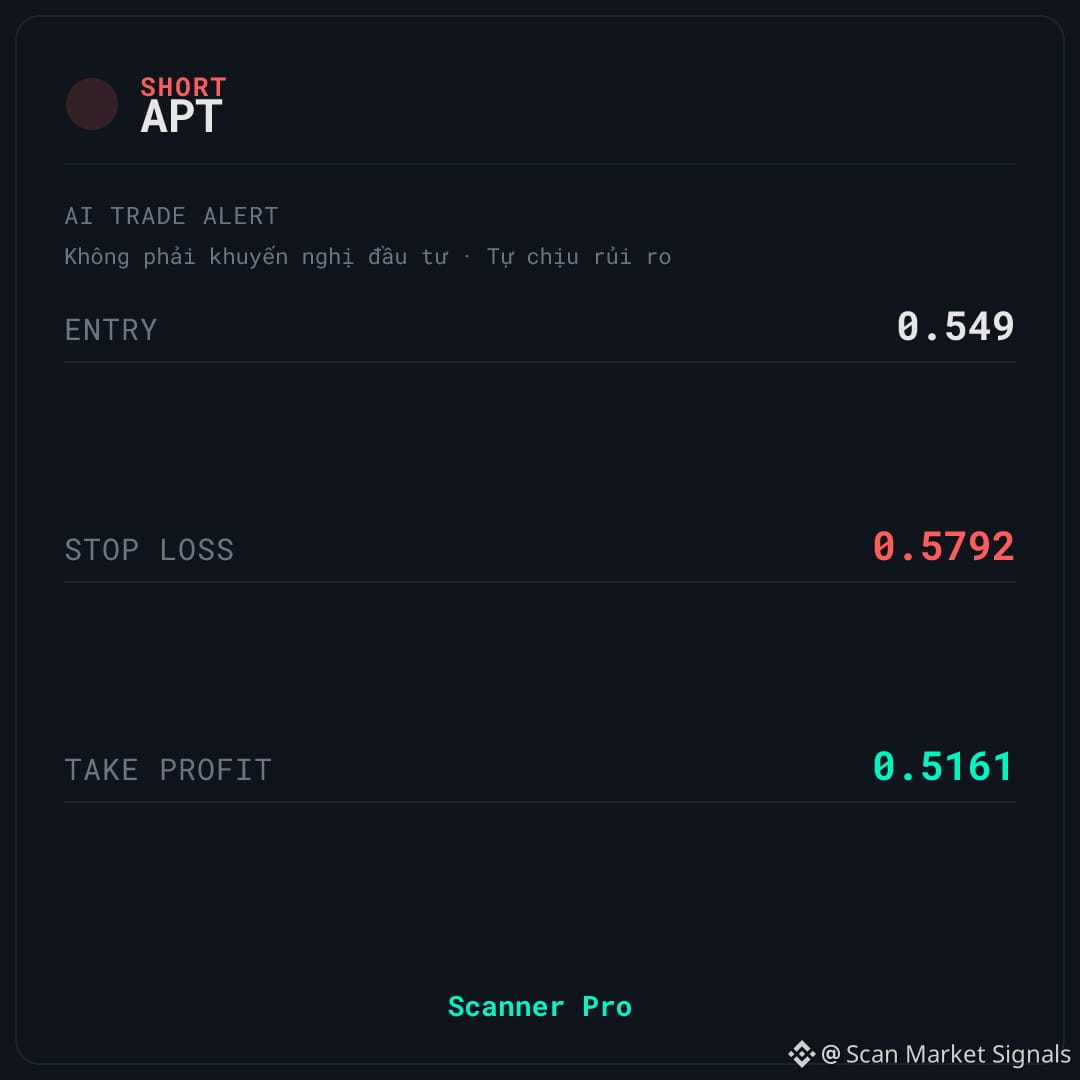
📌 Entry: 0.5482 – 0.5498
🛑 Stop Loss: 0.5792
🎯 Take Profit: 0.5161
⏰ Valid for: 6 hours (09:35 – 15:35 VN) - Date: 13/11
↔️ SIDEWAYS — market moving sideways, fade (mean-reversion) signal
$APT is being monitored by Scanner Pro for a SHORT scenario, as price shows a weak reaction below the short-term EMA levels. Market liquidity is high, with 24h volume of around 26,727,207 in quote asset and a volume spike of 0.84x.
📊 WHY IT’S WORTH WATCHING
High liquidity is a plus when entering a trade, but it’s also a reason to be cautious about slippage if money flows suddenly shift. 24h volume is around 26.7 million in quote asset, while the volume spike is only 0.84x — there’s no sign of a breakout in volume, so don’t expect a sharp sell-off.
Funding at 0.0100% shows that LONGs are paying SHORTs, meaning the crowd is leaning against this signal. Structurally, that supports the SHORT direction, but it doesn’t mean price will drop immediately.
⚠️ SETUP & RISKS — $APT
🚫 Biggest downside: 1h momentum is at 40.8 — the market is already weak, but this does not provide additional support for the SHORT scenario. It only confirms that sellers are in control. The context is classified as sideways with 55 confidence, which is not strong enough to confirm a clear trend.
If price closes above the stop-loss level on the signal card, the current SHORT scenario is no longer valid.
Do you think this is a liquidity sweep before price recovers, or a genuine reversal signal?
This is educational technical analysis, not investment advice. Cryptocurrency trading involves high risk, and you could lose all your capital. Do your own research and take responsibility for your decisions.
#Binance #Crypto #Futures
SHORT $APT | Deep liquidity, but don’t forget about slippage
🚨 AI TRADE ALERT — $APT
🔴 SHORT
📌 Entry: 0.5482 – 0.5498
🛑 Stop Loss: 0.5792
🎯 Take Profit: 0.5161
⏰ Valid for: 6 hours (09:35 – 15:35 VN) - Date: 13/11
↔️ SIDEWAYS — market moving sideways, fade (mean-reversion) signal
$APT is being monitored by Scanner Pro for a SHORT scenario, as price shows a weak reaction below the short-term EMA levels. Market liquidity is high, with 24h volume of around 26,727,207 in quote asset and a volume spike of 0.84x.
📊 WHY IT’S WORTH WATCHING
High liquidity is a plus when entering a trade, but it’s also a reason to be cautious about slippage if money flows suddenly shift. 24h volume is around 26.7 million in quote asset, while the volume spike is only 0.84x — there’s no sign of a breakout in volume, so don’t expect a sharp sell-off.
Funding at 0.0100% shows that LONGs are paying SHORTs, meaning the crowd is leaning against this signal. Structurally, that supports the SHORT direction, but it doesn’t mean price will drop immediately.
⚠️ SETUP & RISKS — $APT
🚫 Biggest downside: 1h momentum is at 40.8 — the market is already weak, but this does not provide additional support for the SHORT scenario. It only confirms that sellers are in control. The context is classified as sideways with 55 confidence, which is not strong enough to confirm a clear trend.
If price closes above the stop-loss level on the signal card, the current SHORT scenario is no longer valid.
Do you think this is a liquidity sweep before price recovers, or a genuine reversal signal?
This is educational technical analysis, not investment advice. Cryptocurrency trading involves high risk, and you could lose all your capital. Do your own research and take responsibility for your decisions.
#Binance #Crypto #Futures
🚨 AI TRADE ALERT — $APT
🔴 SHORT
📌 Entry: 0.5482 – 0.5498
🛑 Stop Loss: 0.5792
🎯 Take Profit: 0.5161
⏰ Valid for: 6 hours (09:35 – 15:35 VN) - Date: 13/11
↔️ SIDEWAYS — market moving sideways, fade (mean-reversion) signal
$APT is being monitored by Scanner Pro for a SHORT scenario, as price shows a weak reaction below the short-term EMA levels. Market liquidity is high, with 24h volume of around 26,727,207 in quote asset and a volume spike of 0.84x.
📊 WHY IT’S WORTH WATCHING
High liquidity is a plus when entering a trade, but it’s also a reason to be cautious about slippage if money flows suddenly shift. 24h volume is around 26.7 million in quote asset, while the volume spike is only 0.84x — there’s no sign of a breakout in volume, so don’t expect a sharp sell-off.
Funding at 0.0100% shows that LONGs are paying SHORTs, meaning the crowd is leaning against this signal. Structurally, that supports the SHORT direction, but it doesn’t mean price will drop immediately.
⚠️ SETUP & RISKS — $APT
🚫 Biggest downside: 1h momentum is at 40.8 — the market is already weak, but this does not provide additional support for the SHORT scenario. It only confirms that sellers are in control. The context is classified as sideways with 55 confidence, which is not strong enough to confirm a clear trend.
If price closes above the stop-loss level on the signal card, the current SHORT scenario is no longer valid.
Do you think this is a liquidity sweep before price recovers, or a genuine reversal signal?
This is educational technical analysis, not investment advice. Cryptocurrency trading involves high risk, and you could lose all your capital. Do your own research and take responsibility for your decisions.
#Binance #Crypto #Futures
28
CFTC, SEC get new nominees: Which transmission channel connects macro news to crypto?
CoinDesk reports that the U.S. president nominated candidates for the CFTC and SEC for the first time in a year (12/11). For traders, the question isn’t whether the news is good or bad, but which channel carries policy expectations through to crypto flows—and whether that channel is working.
Event and source
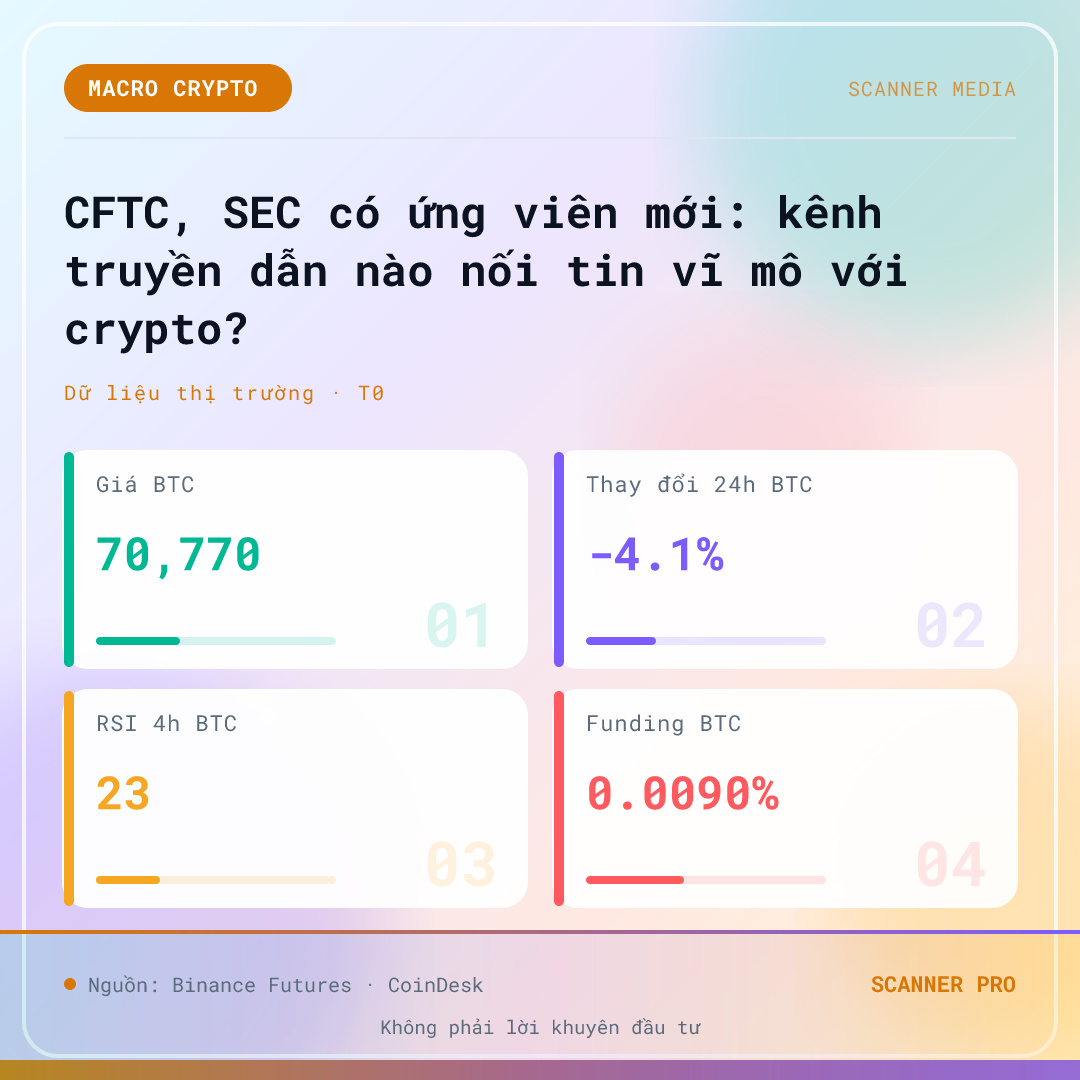
CoinDesk reported on 12/11 (UTC) that the U.S. president nominated candidates for the CFTC and SEC, for the first time in a year. This is the full extent of the event confirmed by the input data; this article does not speculate further about the nominees’ names, positions, or confirmation process. Market context at the same time: BTC around 70770, down 4.1 in 24 hours, with the 4h RSI at 23 and the 1h RSI at 19,…
Transmission channels: from regulatory appointments to capital flows
The first channel is regulatory expectations. New leadership appointments at the two market regulators could change the pace of application reviews, the clarity of the regulatory framework, and how digital assets are classified—all of which directly affect whether institutions can participate. The second channel is risk appetite: policy news often affects risk assets broadly first, including crypto…
Contrary scenario: If capital flows do not extend to crypto, or the news was already priced in, the transmission channel is no longer effective.
Sources: CoinDesk (05:47 13-11) · Binance Futures (09:10 13-11)
This is educational technical analysis, not investment advice. Cryptocurrency trading involves high risk, and you could lose all your capital. Do your own research and take responsibility for your decisions.
#Binance #Crypto #Futures
CFTC, SEC get new nominees: Which transmission channel connects macro news to crypto?
CoinDesk reports that the U.S. president nominated candidates for the CFTC and SEC for the first time in a year (12/11). For traders, the question isn’t whether the news is good or bad, but which channel carries policy expectations through to crypto flows—and whether that channel is working.
Event and source
CoinDesk reported on 12/11 (UTC) that the U.S. president nominated candidates for the CFTC and SEC, for the first time in a year. This is the full extent of the event confirmed by the input data; this article does not speculate further about the nominees’ names, positions, or confirmation process. Market context at the same time: BTC around 70770, down 4.1 in 24 hours, with the 4h RSI at 23 and the 1h RSI at 19,…
Transmission channels: from regulatory appointments to capital flows
The first channel is regulatory expectations. New leadership appointments at the two market regulators could change the pace of application reviews, the clarity of the regulatory framework, and how digital assets are classified—all of which directly affect whether institutions can participate. The second channel is risk appetite: policy news often affects risk assets broadly first, including crypto…
Contrary scenario: If capital flows do not extend to crypto, or the news was already priced in, the transmission channel is no longer effective.
Sources: CoinDesk (05:47 13-11) · Binance Futures (09:10 13-11)
This is educational technical analysis, not investment advice. Cryptocurrency trading involves high risk, and you could lose all your capital. Do your own research and take responsibility for your decisions.
#Binance #Crypto #Futures
CoinDesk reports that the U.S. president nominated candidates for the CFTC and SEC for the first time in a year (12/11). For traders, the question isn’t whether the news is good or bad, but which channel carries policy expectations through to crypto flows—and whether that channel is working.
Event and source
CoinDesk reported on 12/11 (UTC) that the U.S. president nominated candidates for the CFTC and SEC, for the first time in a year. This is the full extent of the event confirmed by the input data; this article does not speculate further about the nominees’ names, positions, or confirmation process. Market context at the same time: BTC around 70770, down 4.1 in 24 hours, with the 4h RSI at 23 and the 1h RSI at 19,…
Transmission channels: from regulatory appointments to capital flows
The first channel is regulatory expectations. New leadership appointments at the two market regulators could change the pace of application reviews, the clarity of the regulatory framework, and how digital assets are classified—all of which directly affect whether institutions can participate. The second channel is risk appetite: policy news often affects risk assets broadly first, including crypto…
Contrary scenario: If capital flows do not extend to crypto, or the news was already priced in, the transmission channel is no longer effective.
Sources: CoinDesk (05:47 13-11) · Binance Futures (09:10 13-11)
This is educational technical analysis, not investment advice. Cryptocurrency trading involves high risk, and you could lose all your capital. Do your own research and take responsibility for your decisions.
#Binance #Crypto #Futures
37
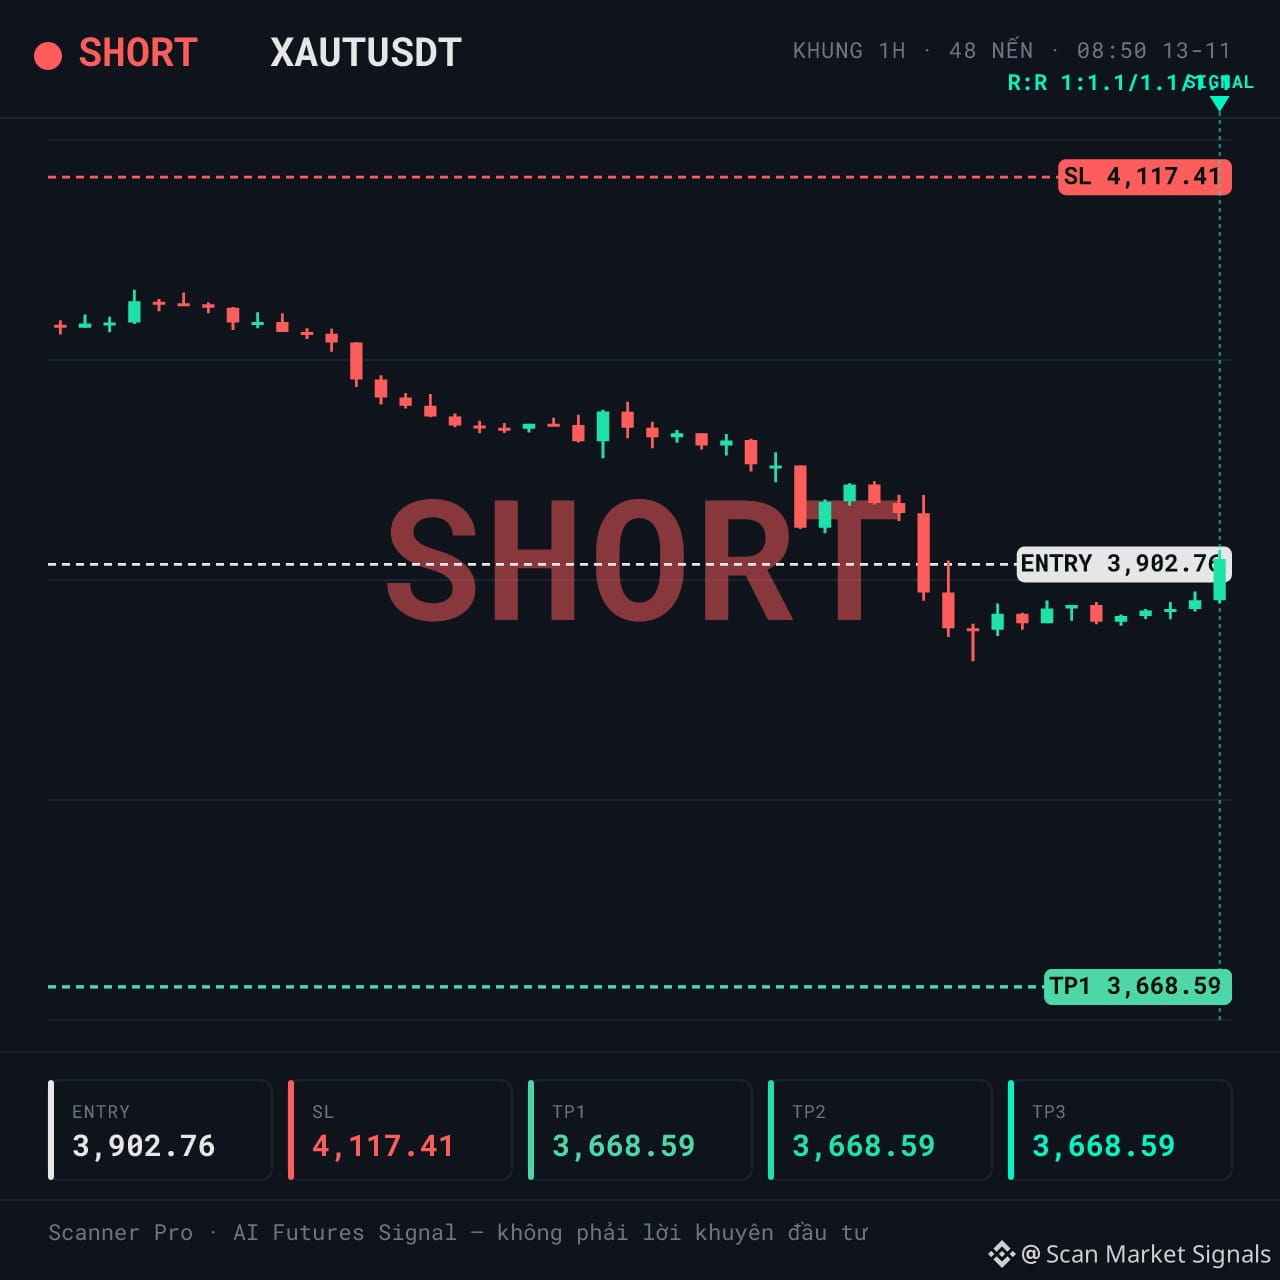
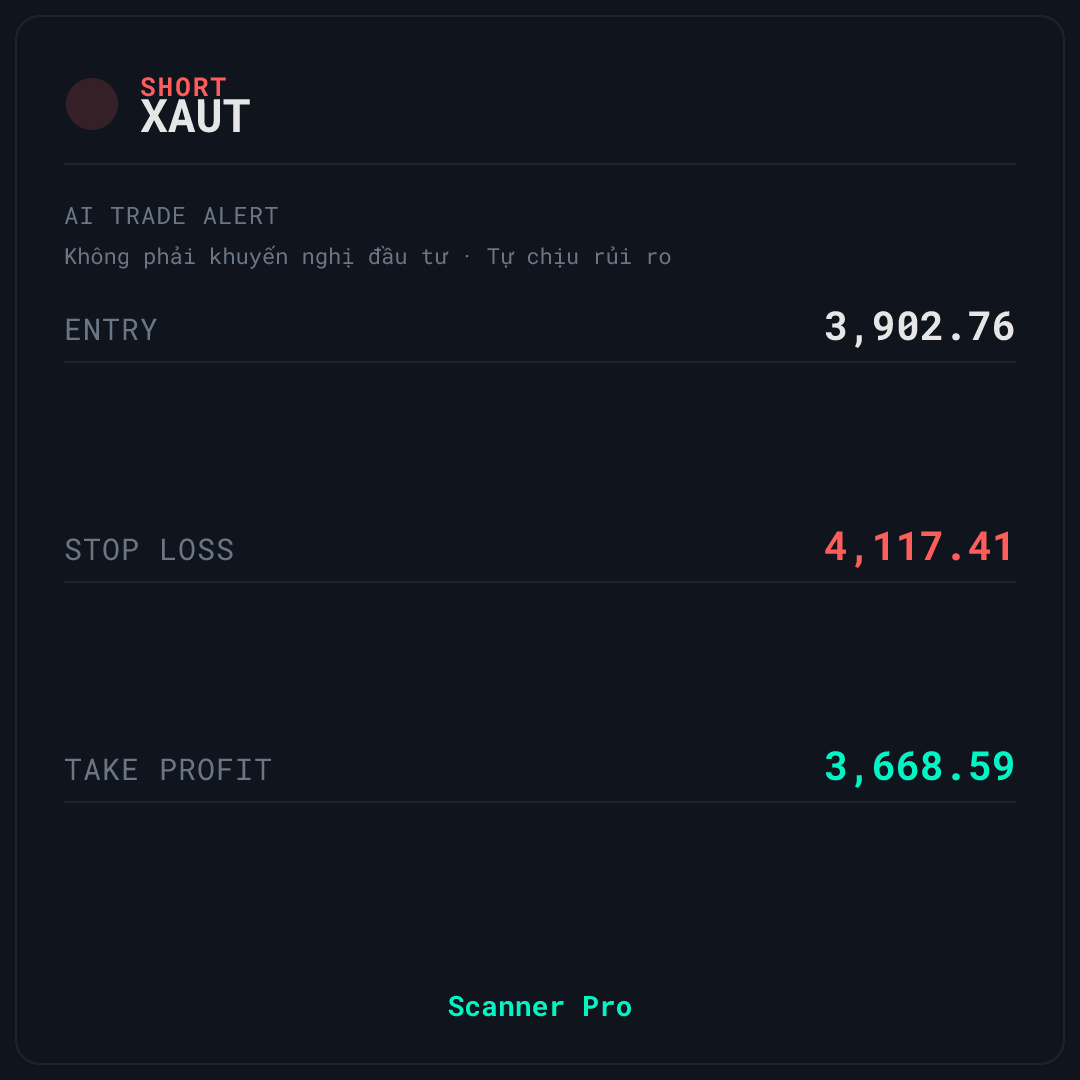
SHORT $XAUT | Price in the middle of the 24h range, sellers still in control
🚨 AI TRADE ALERT — $XAUT
🔴 SHORT
📌 Entry: 3,896.91 – 3,908.61
🛑 Stop Loss: 4,117.41
🎯 Take Profit: 3,668.59
⏰ Valid for: 6 hours (08:50 – 14:50 VN) - Date: 13/11
📉 DOWNTREND — SHORT in line with the downward trend
$XAUT is being monitored by Scanner Pro for a SHORT scenario as the price gradually retreats in a downtrend. The context is trend_down, 4h momentum is 32.1, and the price is at 40% of the 24h range.
📊 WHY IT'S WORTH WATCHING
Selling pressure remains clear, with the price at 40% of the 24h range — neither at the bottom nor at the top. The 1h momentum of 44.3 and 4h momentum of 32.1 are both below neutral, consistent with a bearish scenario. Funding is 0.0047%: LONG traders are paying SHORT traders, meaning the crowd is leaning against the signal — a point in favor of the SHORT direction. Liquidity is high, with 24h volume of about 52,354,382 in quote asset and a volume spike of 1.00x — there are no signs of supply drying up.
⚠️ SETUP & RISKS — $XAUT
🚫 Biggest risk: the price is in the lower part of the 24h range, so if selling pressure weakens, a technical bounce could sweep through the entry zone before the trend resumes. Confidence in the trend_down classification is only 70 — not strong enough to consider it certain. If the price closes above the stop-loss level on the signal card, the current SHORT scenario is no longer valid. Do you think this is a technical bounce within a downtrend or a sign of a genuine reversal?
This technical analysis is for educational purposes and is not investment advice. Cryptocurrency trading carries high risk; you could lose all your capital. Do your own research and take responsibility for your decisions.
#Binance #Crypto #Futures
SHORT $XAUT | Price in the middle of the 24h range, sellers still in control
🚨 AI TRADE ALERT — $XAUT
🔴 SHORT
📌 Entry: 3,896.91 – 3,908.61
🛑 Stop Loss: 4,117.41
🎯 Take Profit: 3,668.59
⏰ Valid for: 6 hours (08:50 – 14:50 VN) - Date: 13/11
📉 DOWNTREND — SHORT in line with the downward trend
$XAUT is being monitored by Scanner Pro for a SHORT scenario as the price gradually retreats in a downtrend. The context is trend_down, 4h momentum is 32.1, and the price is at 40% of the 24h range.
📊 WHY IT'S WORTH WATCHING
Selling pressure remains clear, with the price at 40% of the 24h range — neither at the bottom nor at the top. The 1h momentum of 44.3 and 4h momentum of 32.1 are both below neutral, consistent with a bearish scenario. Funding is 0.0047%: LONG traders are paying SHORT traders, meaning the crowd is leaning against the signal — a point in favor of the SHORT direction. Liquidity is high, with 24h volume of about 52,354,382 in quote asset and a volume spike of 1.00x — there are no signs of supply drying up.
⚠️ SETUP & RISKS — $XAUT
🚫 Biggest risk: the price is in the lower part of the 24h range, so if selling pressure weakens, a technical bounce could sweep through the entry zone before the trend resumes. Confidence in the trend_down classification is only 70 — not strong enough to consider it certain. If the price closes above the stop-loss level on the signal card, the current SHORT scenario is no longer valid. Do you think this is a technical bounce within a downtrend or a sign of a genuine reversal?
This technical analysis is for educational purposes and is not investment advice. Cryptocurrency trading carries high risk; you could lose all your capital. Do your own research and take responsibility for your decisions.
#Binance #Crypto #Futures
🚨 AI TRADE ALERT — $XAUT
🔴 SHORT
📌 Entry: 3,896.91 – 3,908.61
🛑 Stop Loss: 4,117.41
🎯 Take Profit: 3,668.59
⏰ Valid for: 6 hours (08:50 – 14:50 VN) - Date: 13/11
📉 DOWNTREND — SHORT in line with the downward trend
$XAUT is being monitored by Scanner Pro for a SHORT scenario as the price gradually retreats in a downtrend. The context is trend_down, 4h momentum is 32.1, and the price is at 40% of the 24h range.
📊 WHY IT'S WORTH WATCHING
Selling pressure remains clear, with the price at 40% of the 24h range — neither at the bottom nor at the top. The 1h momentum of 44.3 and 4h momentum of 32.1 are both below neutral, consistent with a bearish scenario. Funding is 0.0047%: LONG traders are paying SHORT traders, meaning the crowd is leaning against the signal — a point in favor of the SHORT direction. Liquidity is high, with 24h volume of about 52,354,382 in quote asset and a volume spike of 1.00x — there are no signs of supply drying up.
⚠️ SETUP & RISKS — $XAUT
🚫 Biggest risk: the price is in the lower part of the 24h range, so if selling pressure weakens, a technical bounce could sweep through the entry zone before the trend resumes. Confidence in the trend_down classification is only 70 — not strong enough to consider it certain. If the price closes above the stop-loss level on the signal card, the current SHORT scenario is no longer valid. Do you think this is a technical bounce within a downtrend or a sign of a genuine reversal?
This technical analysis is for educational purposes and is not investment advice. Cryptocurrency trading carries high risk; you could lose all your capital. Do your own research and take responsibility for your decisions.
#Binance #Crypto #Futures
50
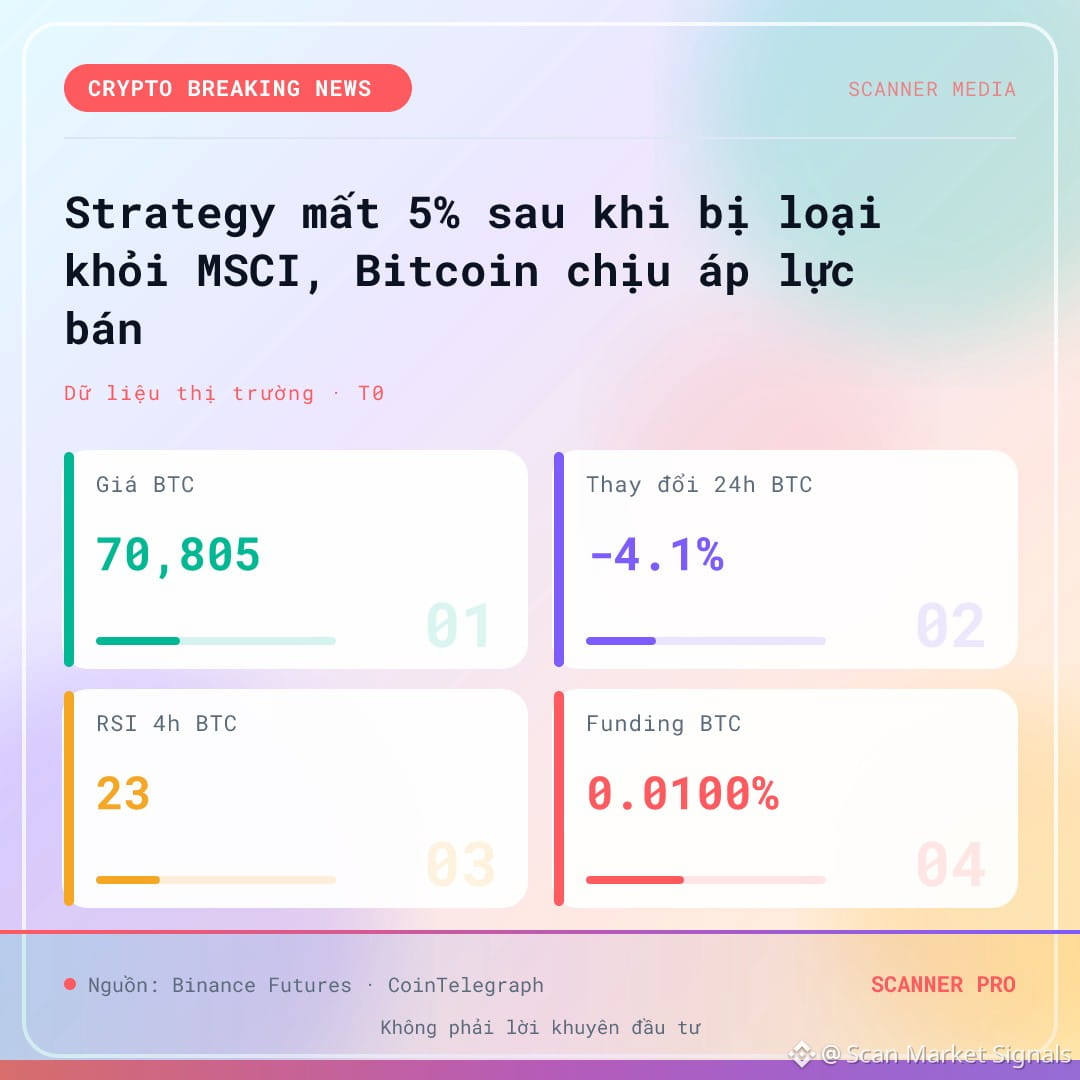
Strategy falls 5% after MSCI exclusion as Bitcoin faces selling pressure
CoinTelegraph reported on 12/11/2026 that Strategy shares fell 5% amid their removal from an MSCI index, coinciding with a sell-off in the Bitcoin market. The event changes how index funds hold shares linked to BTC, while cryptocurrency prices remain under downward pressure.
What changed
According to CoinTelegraph (published 12/11/2026, 21:52 UTC), Strategy shares fell 5% after being removed from an MSCI index. Leaving the index means the shares are no longer part of the basket that index-tracking funds are required to hold, changing the structure of capital flows associated with them. The event took place alongside a Bitcoin sell-off, according to the article’s headline.
Who is affected
Those directly affected are index funds and investors holding Strategy shares through MSCI-tracking products. ETH stood at 2006, down 2.4%; SOL stood at 81.34, down 2.4%. BTC funding was recorded at 0.0100. These figures reflect market conditions at the same time, not direct causes of the MSCI event.
Opposing scenario: If prices reverse after the news has been priced in, the initial impact scenario no longer applies.
Sources: CoinTelegraph (04:52 13-11) · Binance Futures (08:10 13-11)
This technical analysis content is for educational purposes and is not investment advice. Cryptocurrency trading involves high risk, and you could lose all your capital. Do your own research and take responsibility for your decisions.
#Binance #Crypto #Futures
Strategy falls 5% after MSCI exclusion as Bitcoin faces selling pressure
CoinTelegraph reported on 12/11/2026 that Strategy shares fell 5% amid their removal from an MSCI index, coinciding with a sell-off in the Bitcoin market. The event changes how index funds hold shares linked to BTC, while cryptocurrency prices remain under downward pressure.
What changed
According to CoinTelegraph (published 12/11/2026, 21:52 UTC), Strategy shares fell 5% after being removed from an MSCI index. Leaving the index means the shares are no longer part of the basket that index-tracking funds are required to hold, changing the structure of capital flows associated with them. The event took place alongside a Bitcoin sell-off, according to the article’s headline.
Who is affected
Those directly affected are index funds and investors holding Strategy shares through MSCI-tracking products. ETH stood at 2006, down 2.4%; SOL stood at 81.34, down 2.4%. BTC funding was recorded at 0.0100. These figures reflect market conditions at the same time, not direct causes of the MSCI event.
Opposing scenario: If prices reverse after the news has been priced in, the initial impact scenario no longer applies.
Sources: CoinTelegraph (04:52 13-11) · Binance Futures (08:10 13-11)
This technical analysis content is for educational purposes and is not investment advice. Cryptocurrency trading involves high risk, and you could lose all your capital. Do your own research and take responsibility for your decisions.
#Binance #Crypto #Futures
CoinTelegraph reported on 12/11/2026 that Strategy shares fell 5% amid their removal from an MSCI index, coinciding with a sell-off in the Bitcoin market. The event changes how index funds hold shares linked to BTC, while cryptocurrency prices remain under downward pressure.
What changed
According to CoinTelegraph (published 12/11/2026, 21:52 UTC), Strategy shares fell 5% after being removed from an MSCI index. Leaving the index means the shares are no longer part of the basket that index-tracking funds are required to hold, changing the structure of capital flows associated with them. The event took place alongside a Bitcoin sell-off, according to the article’s headline.
Who is affected
Those directly affected are index funds and investors holding Strategy shares through MSCI-tracking products. ETH stood at 2006, down 2.4%; SOL stood at 81.34, down 2.4%. BTC funding was recorded at 0.0100. These figures reflect market conditions at the same time, not direct causes of the MSCI event.
Opposing scenario: If prices reverse after the news has been priced in, the initial impact scenario no longer applies.
Sources: CoinTelegraph (04:52 13-11) · Binance Futures (08:10 13-11)
This technical analysis content is for educational purposes and is not investment advice. Cryptocurrency trading involves high risk, and you could lose all your capital. Do your own research and take responsibility for your decisions.
#Binance #Crypto #Futures
72
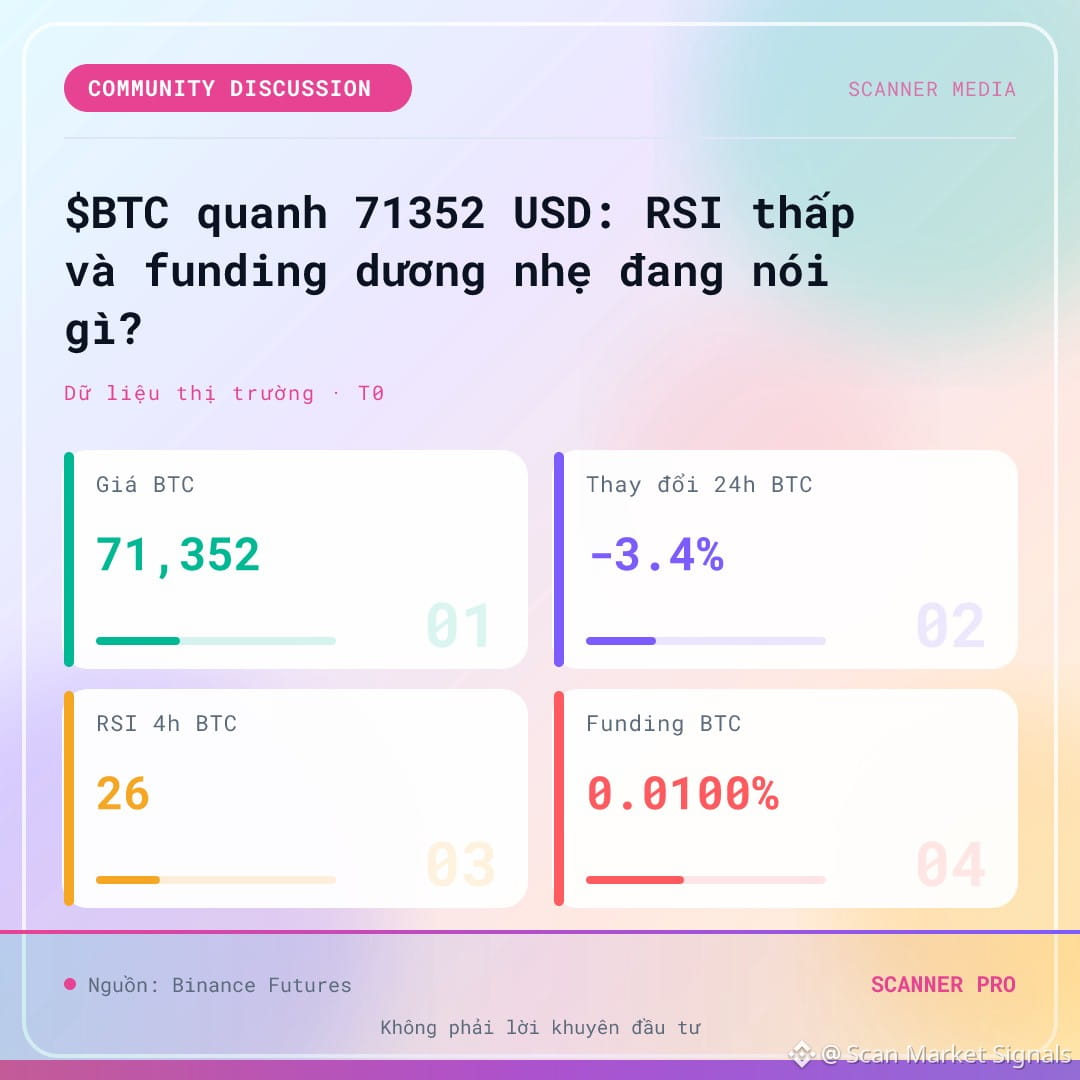
$BTC Around 71352 USD: What do low RSI and slightly positive funding tell us?
Funding remains slightly positive at 0.0100%. This is a data point worth questioning when assessing the market’s positioning.
A data point to watch
The 1h RSI is at 24 and the 4h RSI is at 26 — both deep in oversold territory by conventional measures. 24h volume is approximately 11.26 billion USDT. Meanwhile, BTC funding remains positive at 0.0100%, meaning longs are still paying shorts.
Why this is worth questioning
A low RSI is often associated with strong selling pressure, but slightly positive funding suggests there is no clear sign of a reversal in positioning structure. These two signals are not necessarily contradictory — they may reflect a price decline while some long positions remain open.
Counter-scenario: If BTC’s 24h range changes significantly, this question should be reassessed.
Source: Binance Futures (07:10 13-11)
This is educational technical analysis, not investment advice. Cryptocurrency trading carries high risk, and you could lose all your capital. Do your own research and take responsibility for your decisions.
#Binance #Crypto #Futures
$BTC Around 71352 USD: What do low RSI and slightly positive funding tell us?
Funding remains slightly positive at 0.0100%. This is a data point worth questioning when assessing the market’s positioning.
A data point to watch
The 1h RSI is at 24 and the 4h RSI is at 26 — both deep in oversold territory by conventional measures. 24h volume is approximately 11.26 billion USDT. Meanwhile, BTC funding remains positive at 0.0100%, meaning longs are still paying shorts.
Why this is worth questioning
A low RSI is often associated with strong selling pressure, but slightly positive funding suggests there is no clear sign of a reversal in positioning structure. These two signals are not necessarily contradictory — they may reflect a price decline while some long positions remain open.
Counter-scenario: If BTC’s 24h range changes significantly, this question should be reassessed.
Source: Binance Futures (07:10 13-11)
This is educational technical analysis, not investment advice. Cryptocurrency trading carries high risk, and you could lose all your capital. Do your own research and take responsibility for your decisions.
#Binance #Crypto #Futures
Funding remains slightly positive at 0.0100%. This is a data point worth questioning when assessing the market’s positioning.
A data point to watch
The 1h RSI is at 24 and the 4h RSI is at 26 — both deep in oversold territory by conventional measures. 24h volume is approximately 11.26 billion USDT. Meanwhile, BTC funding remains positive at 0.0100%, meaning longs are still paying shorts.
Why this is worth questioning
A low RSI is often associated with strong selling pressure, but slightly positive funding suggests there is no clear sign of a reversal in positioning structure. These two signals are not necessarily contradictory — they may reflect a price decline while some long positions remain open.
Counter-scenario: If BTC’s 24h range changes significantly, this question should be reassessed.
Source: Binance Futures (07:10 13-11)
This is educational technical analysis, not investment advice. Cryptocurrency trading carries high risk, and you could lose all your capital. Do your own research and take responsibility for your decisions.
#Binance #Crypto #Futures
72
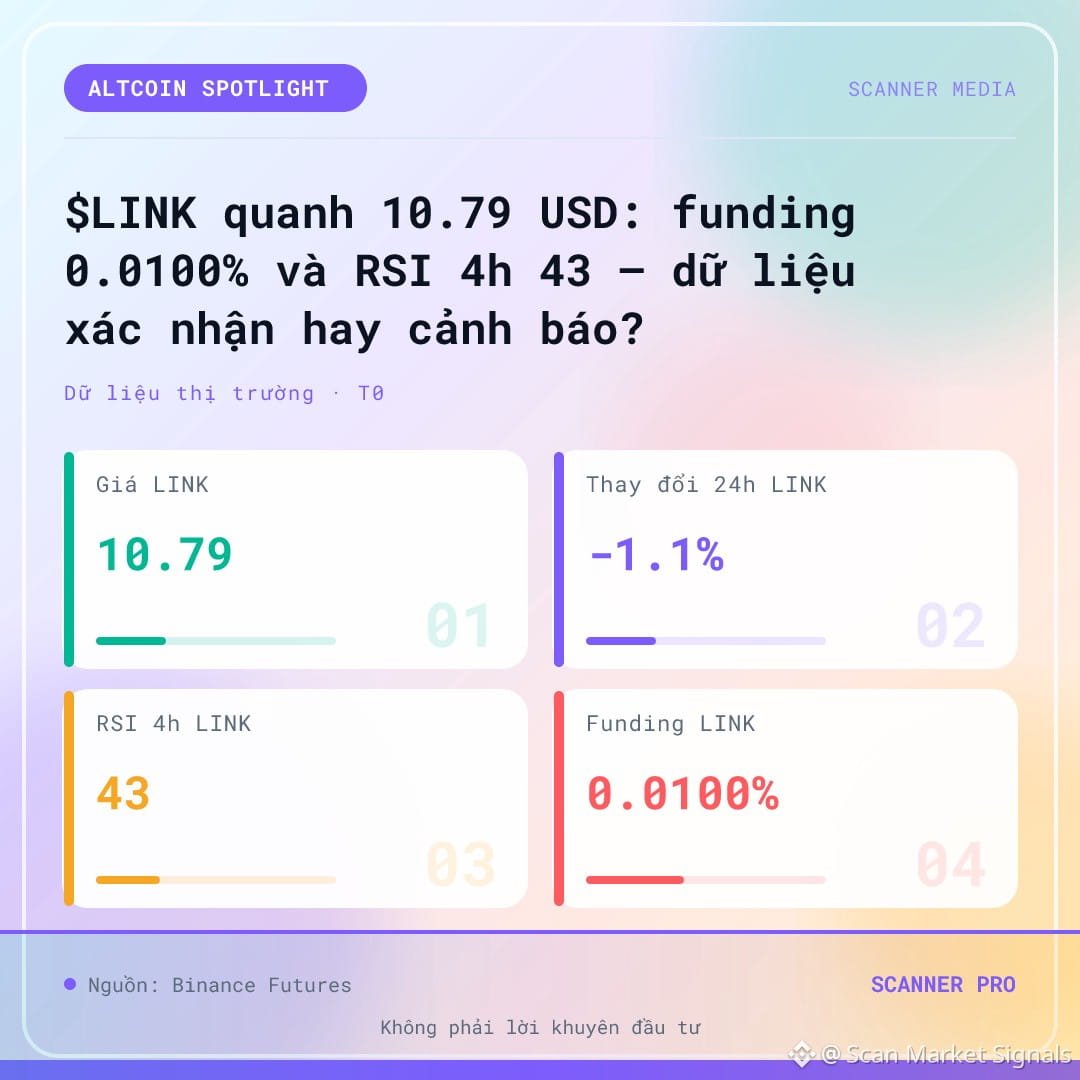
$LINK around 10.79 USD: 0.0100% funding and 4h RSI at 43 — confirmation or warning?
$LINK is trading around 10.79 USD, down slightly over the past 24 hours, with the 4h RSI at 43 and funding at 0.0100%. Thin liquidity and a weakening BTC backdrop make the current structure more vulnerable to testing than to confirmation.
The current data picture
According to the Binance Futures snapshot at 22:40 on 07/11/2026, $LINK is trading around 10.79 USD, with a 24-hour change of -1.1. 24-hour volume was approximately 0.06 billion USDT. The 4h RSI is 43 and the 1h RSI is 44 — both below the neutral zone, indicating that momentum is not yet tilted toward buyers. Funding is at 0.0100%, meaning longs are still paying shorts, but this level does not reflect a significant imbalance…
What do funding and volume indicate?
Funding at 0.0100% is slightly positive, not a sign of strong long or short positioning pressure. It suggests the derivatives market is not showing signs of being overheated in either direction. The notable point is liquidity: 24-hour volume is only around 0.06 billion USDT, much thinner than that of major pairs. With thin liquidity, large orders can amplify price movements, and funding can quickly reverse if position flows…
Opposing scenario: If LINK liquidity thins and the price loses its short-term support zone, the current structure is no longer valid.
Source: Binance Futures (05:40 08-11)
This is technical analysis for educational purposes only, not investment advice. Cryptocurrency trading carries high risk, and you could lose all your capital. Do your own research and take responsibility for your decisions.
#Binance #Crypto #Futures
$LINK around 10.79 USD: 0.0100% funding and 4h RSI at 43 — confirmation or warning?
$LINK is trading around 10.79 USD, down slightly over the past 24 hours, with the 4h RSI at 43 and funding at 0.0100%. Thin liquidity and a weakening BTC backdrop make the current structure more vulnerable to testing than to confirmation.
The current data picture
According to the Binance Futures snapshot at 22:40 on 07/11/2026, $LINK is trading around 10.79 USD, with a 24-hour change of -1.1. 24-hour volume was approximately 0.06 billion USDT. The 4h RSI is 43 and the 1h RSI is 44 — both below the neutral zone, indicating that momentum is not yet tilted toward buyers. Funding is at 0.0100%, meaning longs are still paying shorts, but this level does not reflect a significant imbalance…
What do funding and volume indicate?
Funding at 0.0100% is slightly positive, not a sign of strong long or short positioning pressure. It suggests the derivatives market is not showing signs of being overheated in either direction. The notable point is liquidity: 24-hour volume is only around 0.06 billion USDT, much thinner than that of major pairs. With thin liquidity, large orders can amplify price movements, and funding can quickly reverse if position flows…
Opposing scenario: If LINK liquidity thins and the price loses its short-term support zone, the current structure is no longer valid.
Source: Binance Futures (05:40 08-11)
This is technical analysis for educational purposes only, not investment advice. Cryptocurrency trading carries high risk, and you could lose all your capital. Do your own research and take responsibility for your decisions.
#Binance #Crypto #Futures
$LINK is trading around 10.79 USD, down slightly over the past 24 hours, with the 4h RSI at 43 and funding at 0.0100%. Thin liquidity and a weakening BTC backdrop make the current structure more vulnerable to testing than to confirmation.
The current data picture
According to the Binance Futures snapshot at 22:40 on 07/11/2026, $LINK is trading around 10.79 USD, with a 24-hour change of -1.1. 24-hour volume was approximately 0.06 billion USDT. The 4h RSI is 43 and the 1h RSI is 44 — both below the neutral zone, indicating that momentum is not yet tilted toward buyers. Funding is at 0.0100%, meaning longs are still paying shorts, but this level does not reflect a significant imbalance…
What do funding and volume indicate?
Funding at 0.0100% is slightly positive, not a sign of strong long or short positioning pressure. It suggests the derivatives market is not showing signs of being overheated in either direction. The notable point is liquidity: 24-hour volume is only around 0.06 billion USDT, much thinner than that of major pairs. With thin liquidity, large orders can amplify price movements, and funding can quickly reverse if position flows…
Opposing scenario: If LINK liquidity thins and the price loses its short-term support zone, the current structure is no longer valid.
Source: Binance Futures (05:40 08-11)
This is technical analysis for educational purposes only, not investment advice. Cryptocurrency trading carries high risk, and you could lose all your capital. Do your own research and take responsibility for your decisions.
#Binance #Crypto #Futures
18
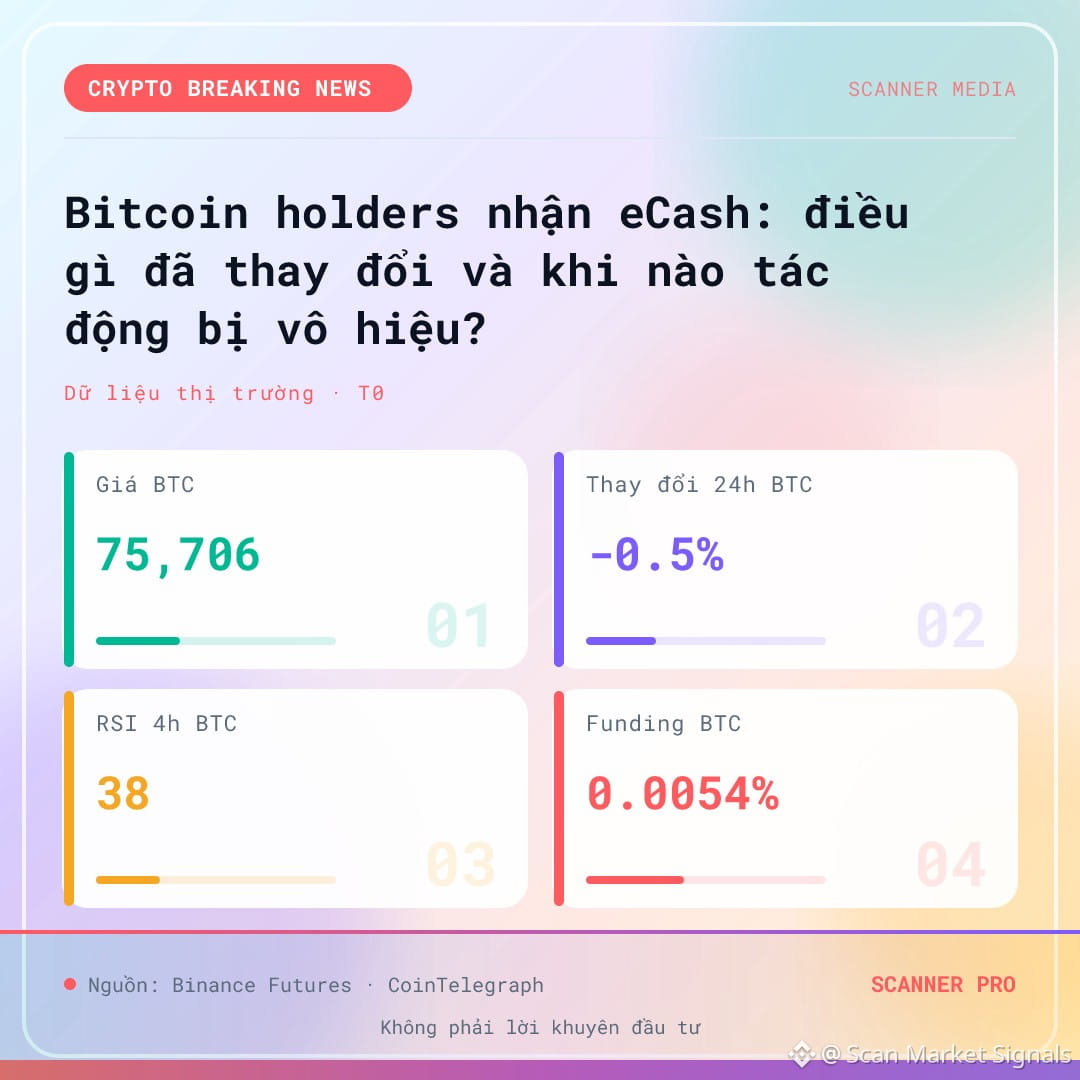
Bitcoin holders receive eCash: What has changed, and when could the impact be invalidated?
CoinTelegraph reported on 07/11/2026 that Bitcoin holders had received eCash. The article reviews the event, the parties involved, and the conditions that could invalidate the impact of this news, based on market data from the same day.
Event and source
CoinTelegraph published the article "Bitcoin holders have received eCash — What can you do with it?" at 13:30 on 07/11/2026 (UTC), according to the verified source record. It focuses on Bitcoin holders having received eCash and the options for using it. The article does not detail the distribution mechanism or conversion rate, so the discussion below is limited to what the headline…
Market context at the time of publication
BTC futures liquidity was at a funding rate of 0.0054. The trend status was recorded by the system as trend_down with a confidence level of 60, based on BTC's 4-hour Supertrend.
Contrary scenario: If the price reverses after the news has already been priced in, the initial impact scenario is no longer valid. Specifically, if BTC fails to sustain its momentum after publication and funding and RSI do not confirm new inflows, attributing the move to the eCash news will…
Sources: CoinTelegraph (20:30 07-11) · Binance Futures (05:10 08-11)
This technical analysis is for educational purposes only and is not investment advice. Cryptocurrency trading carries high risk, and you could lose all your capital. Do your own research and take responsibility for your decisions.
#Binance #Crypto #Futures
Bitcoin holders receive eCash: What has changed, and when could the impact be invalidated?
CoinTelegraph reported on 07/11/2026 that Bitcoin holders had received eCash. The article reviews the event, the parties involved, and the conditions that could invalidate the impact of this news, based on market data from the same day.
Event and source
CoinTelegraph published the article "Bitcoin holders have received eCash — What can you do with it?" at 13:30 on 07/11/2026 (UTC), according to the verified source record. It focuses on Bitcoin holders having received eCash and the options for using it. The article does not detail the distribution mechanism or conversion rate, so the discussion below is limited to what the headline…
Market context at the time of publication
BTC futures liquidity was at a funding rate of 0.0054. The trend status was recorded by the system as trend_down with a confidence level of 60, based on BTC's 4-hour Supertrend.
Contrary scenario: If the price reverses after the news has already been priced in, the initial impact scenario is no longer valid. Specifically, if BTC fails to sustain its momentum after publication and funding and RSI do not confirm new inflows, attributing the move to the eCash news will…
Sources: CoinTelegraph (20:30 07-11) · Binance Futures (05:10 08-11)
This technical analysis is for educational purposes only and is not investment advice. Cryptocurrency trading carries high risk, and you could lose all your capital. Do your own research and take responsibility for your decisions.
#Binance #Crypto #Futures
CoinTelegraph reported on 07/11/2026 that Bitcoin holders had received eCash. The article reviews the event, the parties involved, and the conditions that could invalidate the impact of this news, based on market data from the same day.
Event and source
CoinTelegraph published the article "Bitcoin holders have received eCash — What can you do with it?" at 13:30 on 07/11/2026 (UTC), according to the verified source record. It focuses on Bitcoin holders having received eCash and the options for using it. The article does not detail the distribution mechanism or conversion rate, so the discussion below is limited to what the headline…
Market context at the time of publication
BTC futures liquidity was at a funding rate of 0.0054. The trend status was recorded by the system as trend_down with a confidence level of 60, based on BTC's 4-hour Supertrend.
Contrary scenario: If the price reverses after the news has already been priced in, the initial impact scenario is no longer valid. Specifically, if BTC fails to sustain its momentum after publication and funding and RSI do not confirm new inflows, attributing the move to the eCash news will…
Sources: CoinTelegraph (20:30 07-11) · Binance Futures (05:10 08-11)
This technical analysis is for educational purposes only and is not investment advice. Cryptocurrency trading carries high risk, and you could lose all your capital. Do your own research and take responsibility for your decisions.
#Binance #Crypto #Futures
1
$SOL around 89.20 USD: what do the narrow range and low funding indicate?$SOL around 89.20 USD: what do the narrow range and low funding indicate?
This price range and funding level raise questions about the degree of market consensus, not about an entry signal.
Teaser data point
According to the Binance Futures snapshot published at 22:00 on 07/11/2026, $SOL is hovering around 89.20 USD, down 1.2% over 24 hours. 24-hour trading volume reached approximately 0.49 billion USDT. The 1-hour RSI is at 38 and the 4-hour RSI is at 37 — both below the neutral zone, reflecting weak momentum but not yet deep oversold conditions.
$SOL around 89.20 USD: what do the narrow range and low funding indicate?
$SOL around 89.20 USD: what do the narrow range and low funding indicate?
This price range and funding level raise questions about the degree of market consensus, not about an entry signal.
Teaser data point
According to the Binance Futures snapshot published at 22:00 on 07/11/2026, $SOL is hovering around 89.20 USD, down 1.2% over 24 hours. 24-hour trading volume reached approximately 0.49 billion USDT. The 1-hour RSI is at 38 and the 4-hour RSI is at 37 — both below the neutral zone, reflecting weak momentum but not yet deep oversold conditions.
This price range and funding level raise questions about the degree of market consensus, not about an entry signal.
Teaser data point
According to the Binance Futures snapshot published at 22:00 on 07/11/2026, $SOL is hovering around 89.20 USD, down 1.2% over 24 hours. 24-hour trading volume reached approximately 0.49 billion USDT. The 1-hour RSI is at 38 and the 4-hour RSI is at 37 — both below the neutral zone, reflecting weak momentum but not yet deep oversold conditions.
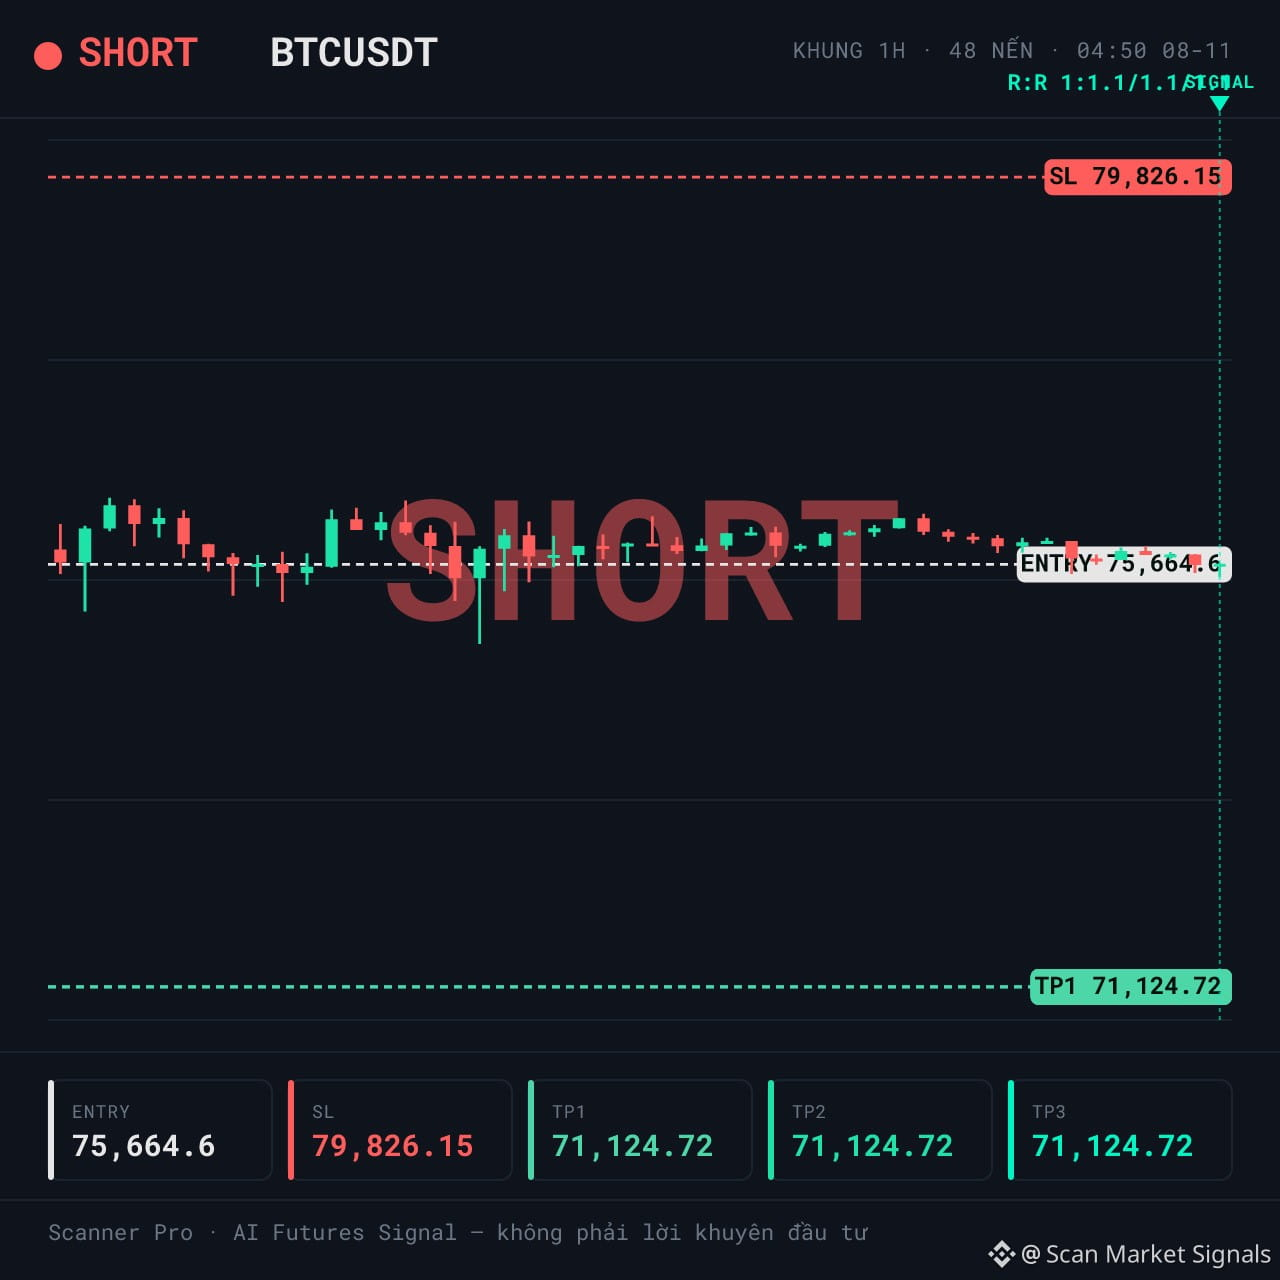
SHORT $BTC | Deep liquidity, but is selling pressure strong enough?
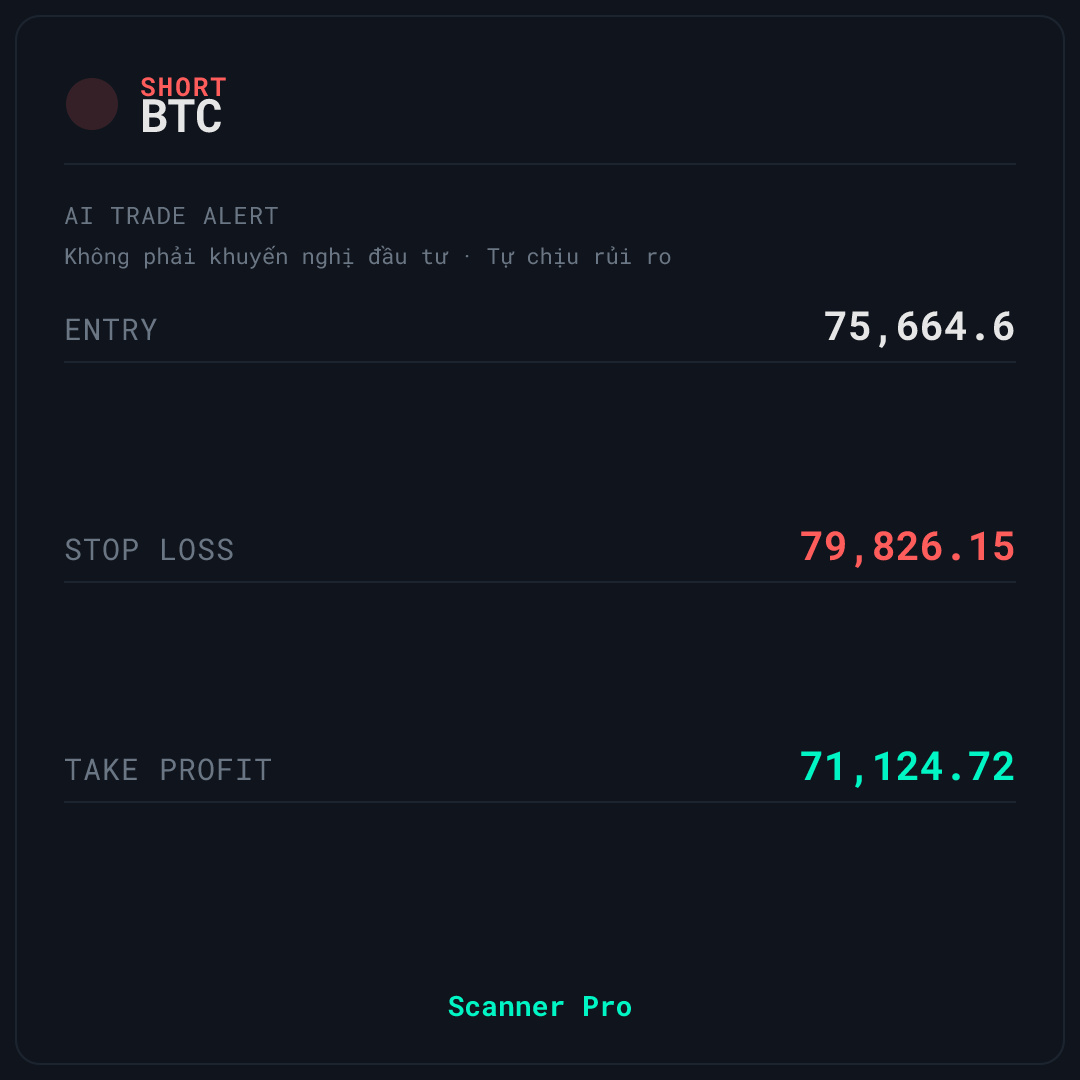
🚨 AI TRADE ALERT — $BTC
🔴 SHORT
📌 Entry: 75,551.1 – 75,778.1
🛑 Stop Loss: 79,826.15
🎯 Take Profit: 71,124.72
⏰ Valid for: 6 hours (04:50 – 10:50 VN) - Date: 08/11
📉 DOWNTREND — SHORT in line with the downtrend
$BTC is being monitored by Scanner Pro for a SHORT scenario as price reacts weakly below a short-term resistance zone. The trend_down context has a classification confidence of 70, 24h volume of approximately 2.724.725.630 in quote asset, and funding of 0.0053%.
📊 WHY IT’S WORTH WATCHING
Market liquidity is rated high, with 24h volume of approximately 2.724.725.630 in quote asset and a volume spike of 1.00x — money flow shows no signs of surging, but remains steady. Funding of 0.0053% indicates that LONG traders are paying fees to SHORT traders, meaning the crowd is leaning against the SHORT signal and lending support to the bearish scenario. The trend_down context, with a classification confidence of 70, reinforces the direction, though it is not an exceptionally high level.
⚠️ SETUP & RISKS — $BTC
🚫 The biggest drawback is that 1h momentum is already at 38.4, meaning the market is already weak — this is no longer a new supporting factor for the SHORT scenario. Price is also in the lower region (20%) of the 24h range, where a technical rebound could easily occur. If price closes above the stop-loss level shown on the signal card, the current SHORT scenario is no longer valid. Do you think this is a liquidity sweep or a genuine reversal signal?
This technical analysis is for educational purposes only and is not investment advice. Cryptocurrency trading involves high risk, and you could lose all your capital. Do your own research and take responsibility for your decisions.
#Binance #Crypto #Futures
SHORT $BTC | Deep liquidity, but is selling pressure strong enough?
🚨 AI TRADE ALERT — $BTC
🔴 SHORT
📌 Entry: 75,551.1 – 75,778.1
🛑 Stop Loss: 79,826.15
🎯 Take Profit: 71,124.72
⏰ Valid for: 6 hours (04:50 – 10:50 VN) - Date: 08/11
📉 DOWNTREND — SHORT in line with the downtrend
$BTC is being monitored by Scanner Pro for a SHORT scenario as price reacts weakly below a short-term resistance zone. The trend_down context has a classification confidence of 70, 24h volume of approximately 2.724.725.630 in quote asset, and funding of 0.0053%.
📊 WHY IT’S WORTH WATCHING
Market liquidity is rated high, with 24h volume of approximately 2.724.725.630 in quote asset and a volume spike of 1.00x — money flow shows no signs of surging, but remains steady. Funding of 0.0053% indicates that LONG traders are paying fees to SHORT traders, meaning the crowd is leaning against the SHORT signal and lending support to the bearish scenario. The trend_down context, with a classification confidence of 70, reinforces the direction, though it is not an exceptionally high level.
⚠️ SETUP & RISKS — $BTC
🚫 The biggest drawback is that 1h momentum is already at 38.4, meaning the market is already weak — this is no longer a new supporting factor for the SHORT scenario. Price is also in the lower region (20%) of the 24h range, where a technical rebound could easily occur. If price closes above the stop-loss level shown on the signal card, the current SHORT scenario is no longer valid. Do you think this is a liquidity sweep or a genuine reversal signal?
This technical analysis is for educational purposes only and is not investment advice. Cryptocurrency trading involves high risk, and you could lose all your capital. Do your own research and take responsibility for your decisions.
#Binance #Crypto #Futures
🚨 AI TRADE ALERT — $BTC
🔴 SHORT
📌 Entry: 75,551.1 – 75,778.1
🛑 Stop Loss: 79,826.15
🎯 Take Profit: 71,124.72
⏰ Valid for: 6 hours (04:50 – 10:50 VN) - Date: 08/11
📉 DOWNTREND — SHORT in line with the downtrend
$BTC is being monitored by Scanner Pro for a SHORT scenario as price reacts weakly below a short-term resistance zone. The trend_down context has a classification confidence of 70, 24h volume of approximately 2.724.725.630 in quote asset, and funding of 0.0053%.
📊 WHY IT’S WORTH WATCHING
Market liquidity is rated high, with 24h volume of approximately 2.724.725.630 in quote asset and a volume spike of 1.00x — money flow shows no signs of surging, but remains steady. Funding of 0.0053% indicates that LONG traders are paying fees to SHORT traders, meaning the crowd is leaning against the SHORT signal and lending support to the bearish scenario. The trend_down context, with a classification confidence of 70, reinforces the direction, though it is not an exceptionally high level.
⚠️ SETUP & RISKS — $BTC
🚫 The biggest drawback is that 1h momentum is already at 38.4, meaning the market is already weak — this is no longer a new supporting factor for the SHORT scenario. Price is also in the lower region (20%) of the 24h range, where a technical rebound could easily occur. If price closes above the stop-loss level shown on the signal card, the current SHORT scenario is no longer valid. Do you think this is a liquidity sweep or a genuine reversal signal?
This technical analysis is for educational purposes only and is not investment advice. Cryptocurrency trading involves high risk, and you could lose all your capital. Do your own research and take responsibility for your decisions.
#Binance #Crypto #Futures
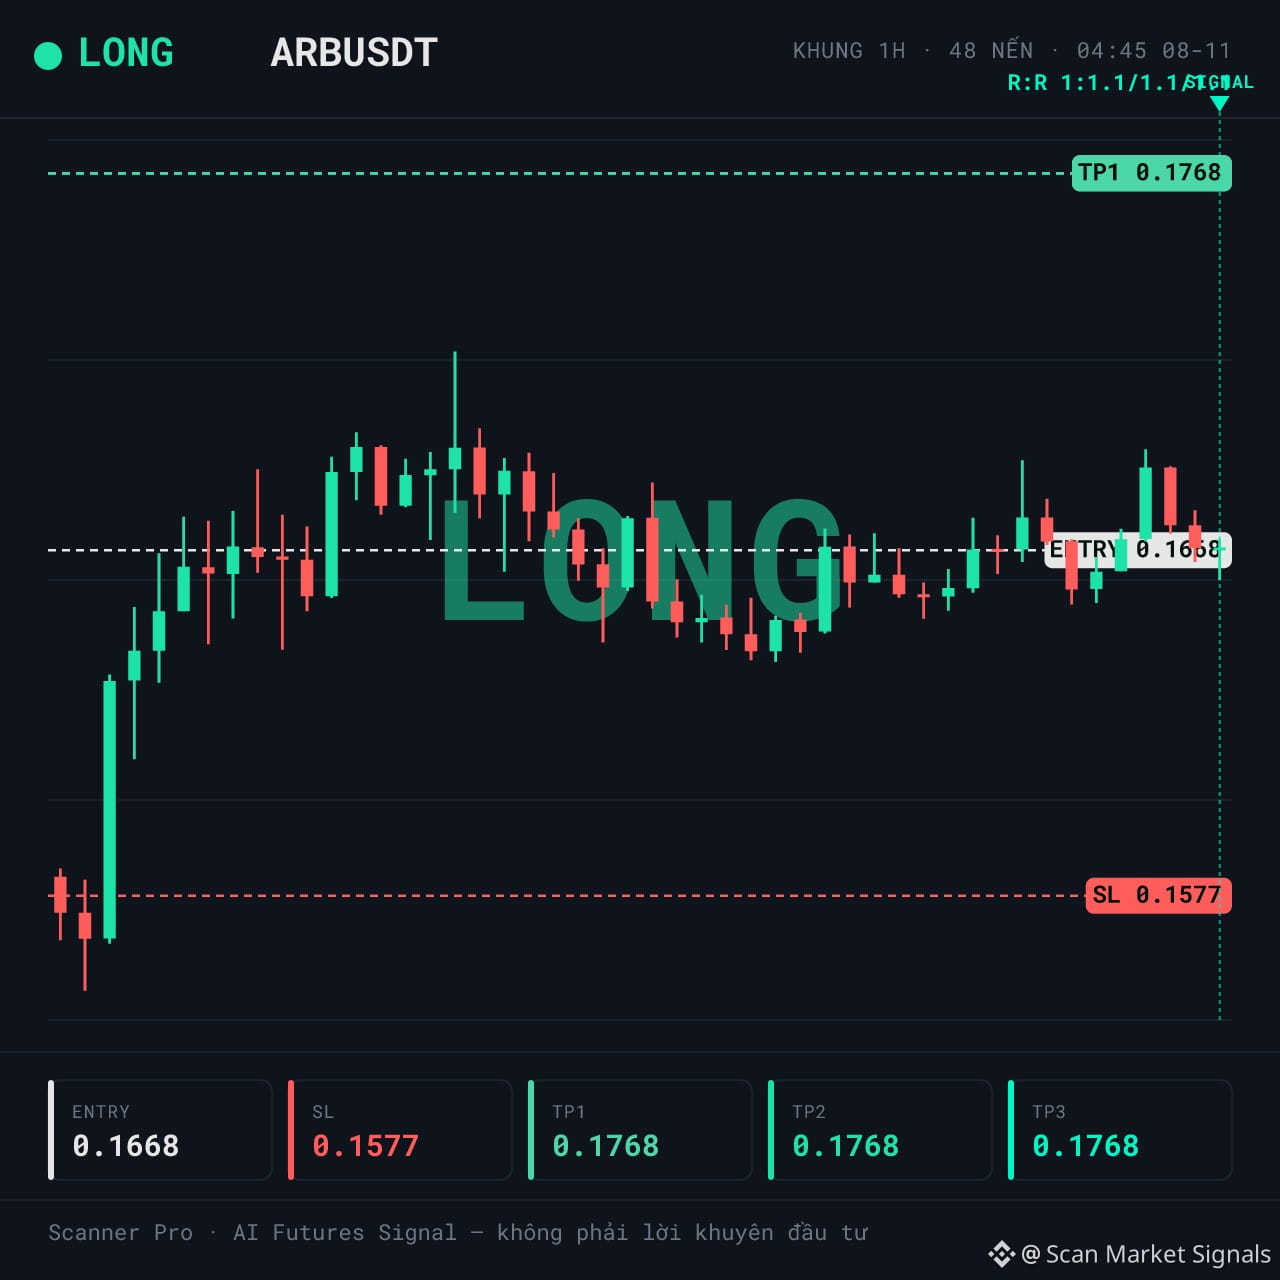
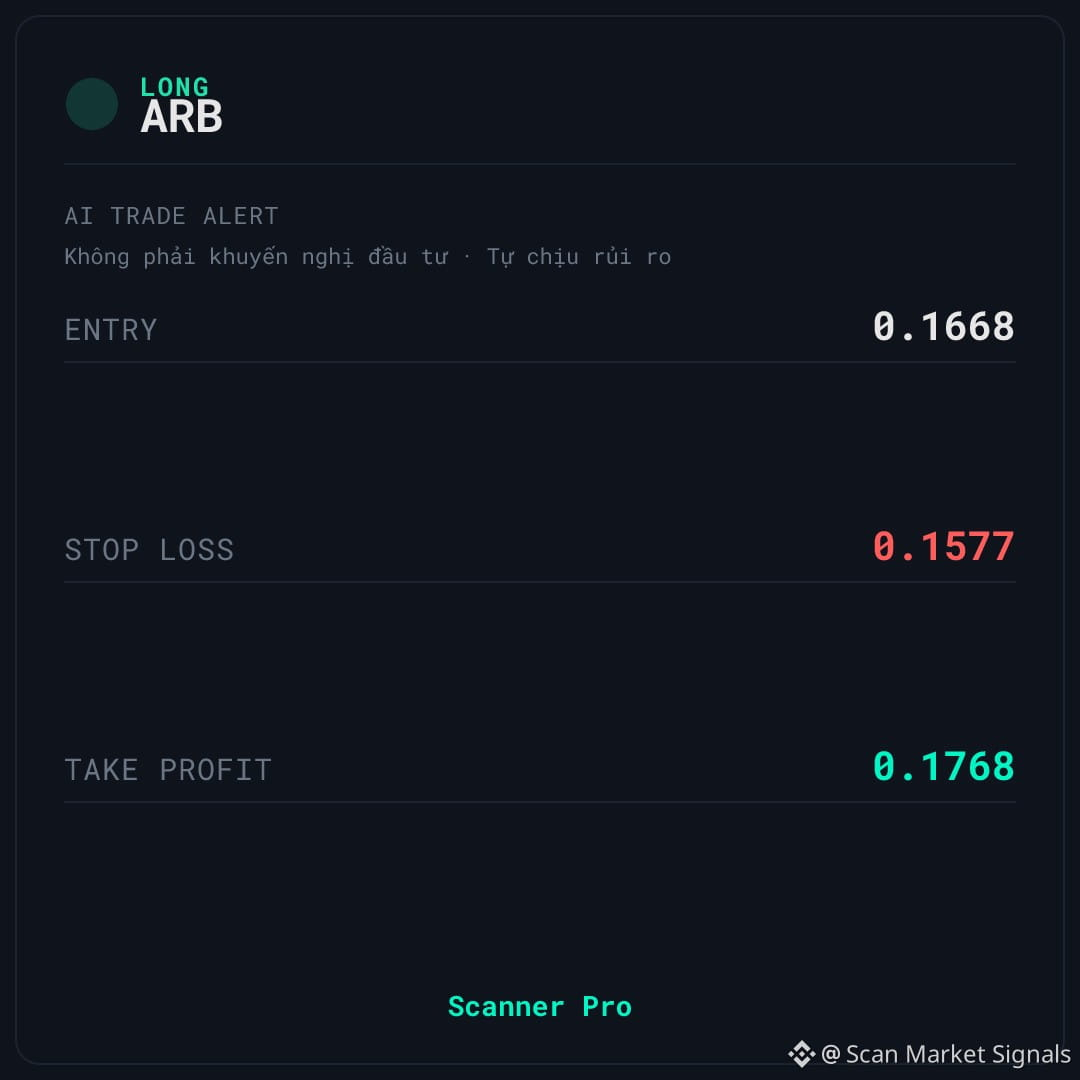
LONG $ARB | Sideways market context — favorable or unfavorable setup?
🚨 AI TRADE ALERT — $ARB
🟢 LONG
📌 Entry: 0.1666 – 0.1671
🛑 Stop Loss: 0.1577
🎯 Take Profit: 0.1768
⏰ Valid for: 6 hours (04:45 – 10:45 VN) - Date: 08/11
↔️ SIDEWAY — sideways market, fade (mean-reversion) signal
$ARB is being monitored by Scanner Pro for a LONG scenario as long as the price holds above the short-term EMAs. The market context is classified as sideways with a confidence level of 55, 24-hour volume of approximately 34,955 million USD, and positive funding of 0.0100%.
📊 WHAT'S HAPPENING
24-hour volume is approximately 34,955,300 in quote asset, with a volume spike of 0.66x — money flow has yet to really surge. Funding at 0.0100% indicates that LONG traders are paying SHORT traders, meaning the crowd is leaning in the same direction as the signal. The price is at 53% of its 24-hour range—not particularly high or low. The market context is sideways with a confidence level of 55—not strong enough to confirm a trend.
⚠️ RISKS TO KNOW FIRST — $ARB
⚠️ The biggest risk: positive funding indicates that LONG traders are crowded and paying fees; this is a disadvantage to monitor. In addition, confidence in the market context classification is only 55—not high—so the scenario may not hold if money flow changes direction. If the price closes below the stop-loss level shown on the signal card, the current LONG scenario is no longer valid. In your view, with positive funding and volume yet to break out, which side has the advantage in this area—the buyers or the sellers?
This technical analysis is for educational purposes and is not investment advice. Cryptocurrency trading carries high risk, and you could lose all your capital. Do your own research and take responsibility for your decisions.
#Binance #Crypto #Futures
LONG $ARB | Sideways market context — favorable or unfavorable setup?
🚨 AI TRADE ALERT — $ARB
🟢 LONG
📌 Entry: 0.1666 – 0.1671
🛑 Stop Loss: 0.1577
🎯 Take Profit: 0.1768
⏰ Valid for: 6 hours (04:45 – 10:45 VN) - Date: 08/11
↔️ SIDEWAY — sideways market, fade (mean-reversion) signal
$ARB is being monitored by Scanner Pro for a LONG scenario as long as the price holds above the short-term EMAs. The market context is classified as sideways with a confidence level of 55, 24-hour volume of approximately 34,955 million USD, and positive funding of 0.0100%.
📊 WHAT'S HAPPENING
24-hour volume is approximately 34,955,300 in quote asset, with a volume spike of 0.66x — money flow has yet to really surge. Funding at 0.0100% indicates that LONG traders are paying SHORT traders, meaning the crowd is leaning in the same direction as the signal. The price is at 53% of its 24-hour range—not particularly high or low. The market context is sideways with a confidence level of 55—not strong enough to confirm a trend.
⚠️ RISKS TO KNOW FIRST — $ARB
⚠️ The biggest risk: positive funding indicates that LONG traders are crowded and paying fees; this is a disadvantage to monitor. In addition, confidence in the market context classification is only 55—not high—so the scenario may not hold if money flow changes direction. If the price closes below the stop-loss level shown on the signal card, the current LONG scenario is no longer valid. In your view, with positive funding and volume yet to break out, which side has the advantage in this area—the buyers or the sellers?
This technical analysis is for educational purposes and is not investment advice. Cryptocurrency trading carries high risk, and you could lose all your capital. Do your own research and take responsibility for your decisions.
#Binance #Crypto #Futures
🚨 AI TRADE ALERT — $ARB
🟢 LONG
📌 Entry: 0.1666 – 0.1671
🛑 Stop Loss: 0.1577
🎯 Take Profit: 0.1768
⏰ Valid for: 6 hours (04:45 – 10:45 VN) - Date: 08/11
↔️ SIDEWAY — sideways market, fade (mean-reversion) signal
$ARB is being monitored by Scanner Pro for a LONG scenario as long as the price holds above the short-term EMAs. The market context is classified as sideways with a confidence level of 55, 24-hour volume of approximately 34,955 million USD, and positive funding of 0.0100%.
📊 WHAT'S HAPPENING
24-hour volume is approximately 34,955,300 in quote asset, with a volume spike of 0.66x — money flow has yet to really surge. Funding at 0.0100% indicates that LONG traders are paying SHORT traders, meaning the crowd is leaning in the same direction as the signal. The price is at 53% of its 24-hour range—not particularly high or low. The market context is sideways with a confidence level of 55—not strong enough to confirm a trend.
⚠️ RISKS TO KNOW FIRST — $ARB
⚠️ The biggest risk: positive funding indicates that LONG traders are crowded and paying fees; this is a disadvantage to monitor. In addition, confidence in the market context classification is only 55—not high—so the scenario may not hold if money flow changes direction. If the price closes below the stop-loss level shown on the signal card, the current LONG scenario is no longer valid. In your view, with positive funding and volume yet to break out, which side has the advantage in this area—the buyers or the sellers?
This technical analysis is for educational purposes and is not investment advice. Cryptocurrency trading carries high risk, and you could lose all your capital. Do your own research and take responsibility for your decisions.
#Binance #Crypto #Futures
9
MEXC targeted by Treasury for disconnection: Is crypto capital reacting to expectations or actual data?
CoinDesk reported on 07/11/2026 that the U.S. Treasury had moved to disconnect the MEXC exchange over allegations involving $16 billion in illicit flows. Meanwhile, market data from around the same time showed BTC, ETH, and SOL moving within a very narrow range, suggesting that the current reaction is driven more by expectations than by confirmation from the data.
Event and macro source
At 17:36 UTC on 07/11/2026, CoinDesk published an article reporting that the U.S. Treasury had taken steps to disconnect the cryptocurrency exchange MEXC over allegations involving $16 billion in illicit flows. This is macroeconomic news that directly affects crypto trading infrastructure, not a price indicator. Details about the legal mechanism or scope of the impact have not yet been…
Transmission channel to crypto
A plausible channel is compliance risk: if a major exchange faces restrictions on its connections, traders may worry about liquidity and rising withdrawal/deposit costs, spreading caution across the market. However, Binance Futures data at 20:20 on 07/11/2026 showed BTC at 75756, with its 24-hour change nearly flat; ETH at 2233, up slightly over 24 hours; and SOL at 89.50, down slightly over 24 hours. RSI…
Opposing scenario: If the flows do not spill over into crypto or the news was already priced in, the transmission channel no longer applies.
Sources: CoinDesk (00:36 08-11) · Binance Futures (03:20 08-11)
This is educational technical analysis, not investment advice. Cryptocurrency trading carries high risk, and you could lose all your capital. Do your own research and take responsibility for your decisions.
#Binance #Crypto #Futures
MEXC targeted by Treasury for disconnection: Is crypto capital reacting to expectations or actual data?
CoinDesk reported on 07/11/2026 that the U.S. Treasury had moved to disconnect the MEXC exchange over allegations involving $16 billion in illicit flows. Meanwhile, market data from around the same time showed BTC, ETH, and SOL moving within a very narrow range, suggesting that the current reaction is driven more by expectations than by confirmation from the data.
Event and macro source
At 17:36 UTC on 07/11/2026, CoinDesk published an article reporting that the U.S. Treasury had taken steps to disconnect the cryptocurrency exchange MEXC over allegations involving $16 billion in illicit flows. This is macroeconomic news that directly affects crypto trading infrastructure, not a price indicator. Details about the legal mechanism or scope of the impact have not yet been…
Transmission channel to crypto
A plausible channel is compliance risk: if a major exchange faces restrictions on its connections, traders may worry about liquidity and rising withdrawal/deposit costs, spreading caution across the market. However, Binance Futures data at 20:20 on 07/11/2026 showed BTC at 75756, with its 24-hour change nearly flat; ETH at 2233, up slightly over 24 hours; and SOL at 89.50, down slightly over 24 hours. RSI…
Opposing scenario: If the flows do not spill over into crypto or the news was already priced in, the transmission channel no longer applies.
Sources: CoinDesk (00:36 08-11) · Binance Futures (03:20 08-11)
This is educational technical analysis, not investment advice. Cryptocurrency trading carries high risk, and you could lose all your capital. Do your own research and take responsibility for your decisions.
#Binance #Crypto #Futures
CoinDesk reported on 07/11/2026 that the U.S. Treasury had moved to disconnect the MEXC exchange over allegations involving $16 billion in illicit flows. Meanwhile, market data from around the same time showed BTC, ETH, and SOL moving within a very narrow range, suggesting that the current reaction is driven more by expectations than by confirmation from the data.
Event and macro source
At 17:36 UTC on 07/11/2026, CoinDesk published an article reporting that the U.S. Treasury had taken steps to disconnect the cryptocurrency exchange MEXC over allegations involving $16 billion in illicit flows. This is macroeconomic news that directly affects crypto trading infrastructure, not a price indicator. Details about the legal mechanism or scope of the impact have not yet been…
Transmission channel to crypto
A plausible channel is compliance risk: if a major exchange faces restrictions on its connections, traders may worry about liquidity and rising withdrawal/deposit costs, spreading caution across the market. However, Binance Futures data at 20:20 on 07/11/2026 showed BTC at 75756, with its 24-hour change nearly flat; ETH at 2233, up slightly over 24 hours; and SOL at 89.50, down slightly over 24 hours. RSI…
Opposing scenario: If the flows do not spill over into crypto or the news was already priced in, the transmission channel no longer applies.
Sources: CoinDesk (00:36 08-11) · Binance Futures (03:20 08-11)
This is educational technical analysis, not investment advice. Cryptocurrency trading carries high risk, and you could lose all your capital. Do your own research and take responsibility for your decisions.
#Binance #Crypto #Futures
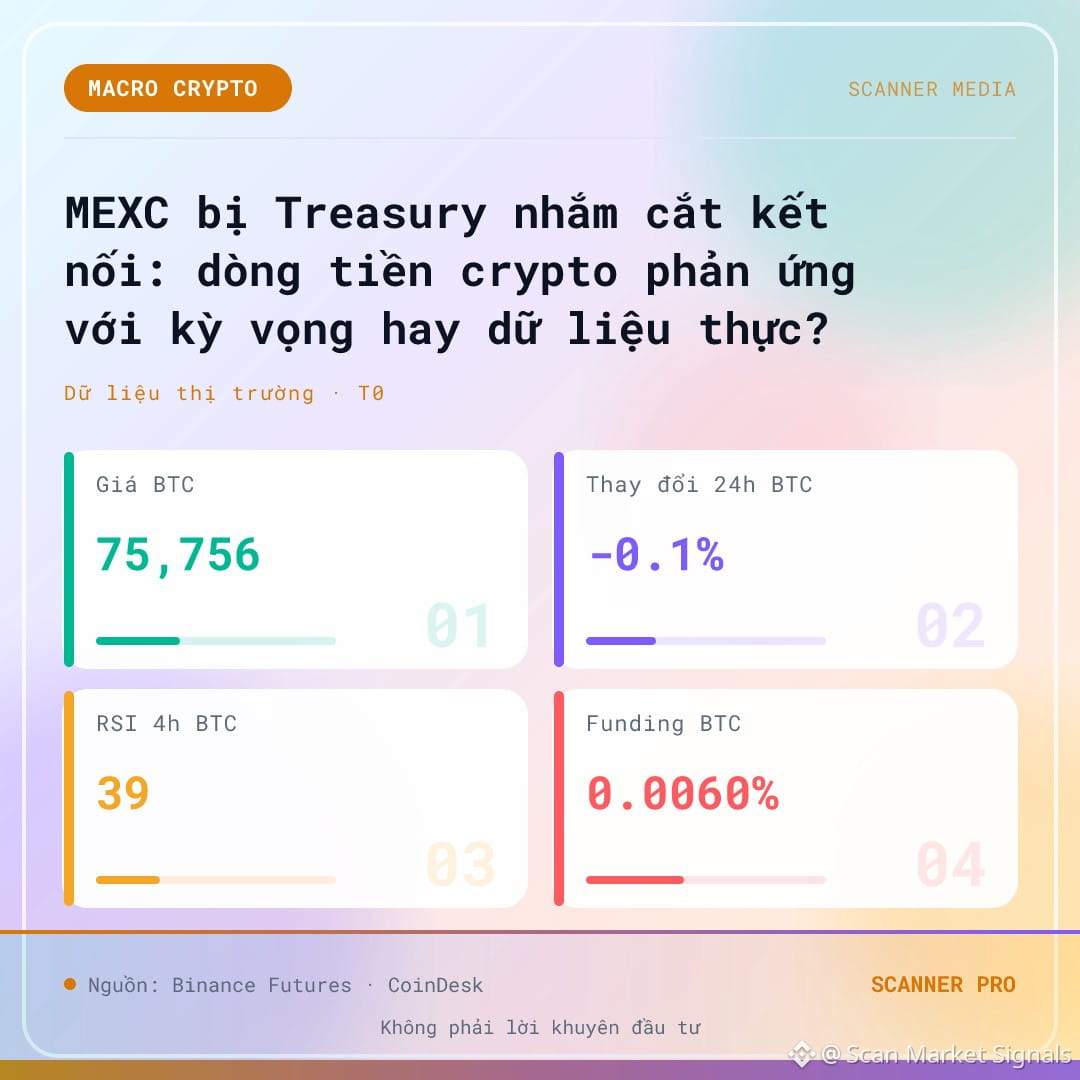
SHORT $DOGE | The 24-hour range is only 2.3% — is the market calm or tense?
🚨 AI TRADE ALERT — $DOGE
🔴 SHORT
📌 Entry: 0.07181 – 0.07203
🛑 Stop Loss: 0.07588
🎯 Take Profit: 0.0676
⏰ Valid for: 6 hours (01:50 – 07:50 VN) - Date: 08/11
↔️ SIDEWAY — the market is moving sideways, with a fade (mean-reversion) signal
$DOGE is being monitored by Scanner Pro for a SHORT scenario as price reacts weakly within a narrow range. The market context is classified as sideway, with a classification confidence of 55, high liquidity, and funding of 0.0022%.
📊 CONTEXT & DATA
The market has no clear trend: price has moved within a 24-hour range of just 2.3%, and is at 31% of that range — meaning the lower half. 24-hour volume is approximately 110,248,580 in quote asset, but the volume spike is only 0.56x, indicating that money has not really flowed in yet. Funding of 0.0022% means LONG traders are paying fees to SHORT traders, so the crowd is leaning against the signal — this supports the SHORT direction. The 1h momentum of 45.8 and 4h momentum of 41.1 are both below neutral, consistent with the scenario that price remains weak.
🚫 INVALIDATION POINT & CAPITAL MANAGEMENT — $DOGE
⚠️ The greatest risk lies in the narrow range itself: price is currently near the bottom of the 24-hour range, so a sudden rebound could happen at any time. In addition, confidence in the market-context classification is only 55 — not high enough to consider the sideway condition certain. 🚫 If price closes above the stop-loss level shown on the signal card, the current SHORT scenario is no longer valid. 💡 Do you think this is accumulation before another downward move, or just a pause before price bounces back?
This is educational technical analysis, not investment advice. Cryptocurrency trading carries high risk, and you could lose all your capital. Do your own research and take responsibility for your decisions.
#Binance #Crypto #Futures
SHORT $DOGE | The 24-hour range is only 2.3% — is the market calm or tense?
🚨 AI TRADE ALERT — $DOGE
🔴 SHORT
📌 Entry: 0.07181 – 0.07203
🛑 Stop Loss: 0.07588
🎯 Take Profit: 0.0676
⏰ Valid for: 6 hours (01:50 – 07:50 VN) - Date: 08/11
↔️ SIDEWAY — the market is moving sideways, with a fade (mean-reversion) signal
$DOGE is being monitored by Scanner Pro for a SHORT scenario as price reacts weakly within a narrow range. The market context is classified as sideway, with a classification confidence of 55, high liquidity, and funding of 0.0022%.
📊 CONTEXT & DATA
The market has no clear trend: price has moved within a 24-hour range of just 2.3%, and is at 31% of that range — meaning the lower half. 24-hour volume is approximately 110,248,580 in quote asset, but the volume spike is only 0.56x, indicating that money has not really flowed in yet. Funding of 0.0022% means LONG traders are paying fees to SHORT traders, so the crowd is leaning against the signal — this supports the SHORT direction. The 1h momentum of 45.8 and 4h momentum of 41.1 are both below neutral, consistent with the scenario that price remains weak.
🚫 INVALIDATION POINT & CAPITAL MANAGEMENT — $DOGE
⚠️ The greatest risk lies in the narrow range itself: price is currently near the bottom of the 24-hour range, so a sudden rebound could happen at any time. In addition, confidence in the market-context classification is only 55 — not high enough to consider the sideway condition certain. 🚫 If price closes above the stop-loss level shown on the signal card, the current SHORT scenario is no longer valid. 💡 Do you think this is accumulation before another downward move, or just a pause before price bounces back?
This is educational technical analysis, not investment advice. Cryptocurrency trading carries high risk, and you could lose all your capital. Do your own research and take responsibility for your decisions.
#Binance #Crypto #Futures
🚨 AI TRADE ALERT — $DOGE
🔴 SHORT
📌 Entry: 0.07181 – 0.07203
🛑 Stop Loss: 0.07588
🎯 Take Profit: 0.0676
⏰ Valid for: 6 hours (01:50 – 07:50 VN) - Date: 08/11
↔️ SIDEWAY — the market is moving sideways, with a fade (mean-reversion) signal
$DOGE is being monitored by Scanner Pro for a SHORT scenario as price reacts weakly within a narrow range. The market context is classified as sideway, with a classification confidence of 55, high liquidity, and funding of 0.0022%.
📊 CONTEXT & DATA
The market has no clear trend: price has moved within a 24-hour range of just 2.3%, and is at 31% of that range — meaning the lower half. 24-hour volume is approximately 110,248,580 in quote asset, but the volume spike is only 0.56x, indicating that money has not really flowed in yet. Funding of 0.0022% means LONG traders are paying fees to SHORT traders, so the crowd is leaning against the signal — this supports the SHORT direction. The 1h momentum of 45.8 and 4h momentum of 41.1 are both below neutral, consistent with the scenario that price remains weak.
🚫 INVALIDATION POINT & CAPITAL MANAGEMENT — $DOGE
⚠️ The greatest risk lies in the narrow range itself: price is currently near the bottom of the 24-hour range, so a sudden rebound could happen at any time. In addition, confidence in the market-context classification is only 55 — not high enough to consider the sideway condition certain. 🚫 If price closes above the stop-loss level shown on the signal card, the current SHORT scenario is no longer valid. 💡 Do you think this is accumulation before another downward move, or just a pause before price bounces back?
This is educational technical analysis, not investment advice. Cryptocurrency trading carries high risk, and you could lose all your capital. Do your own research and take responsibility for your decisions.
#Binance #Crypto #Futures
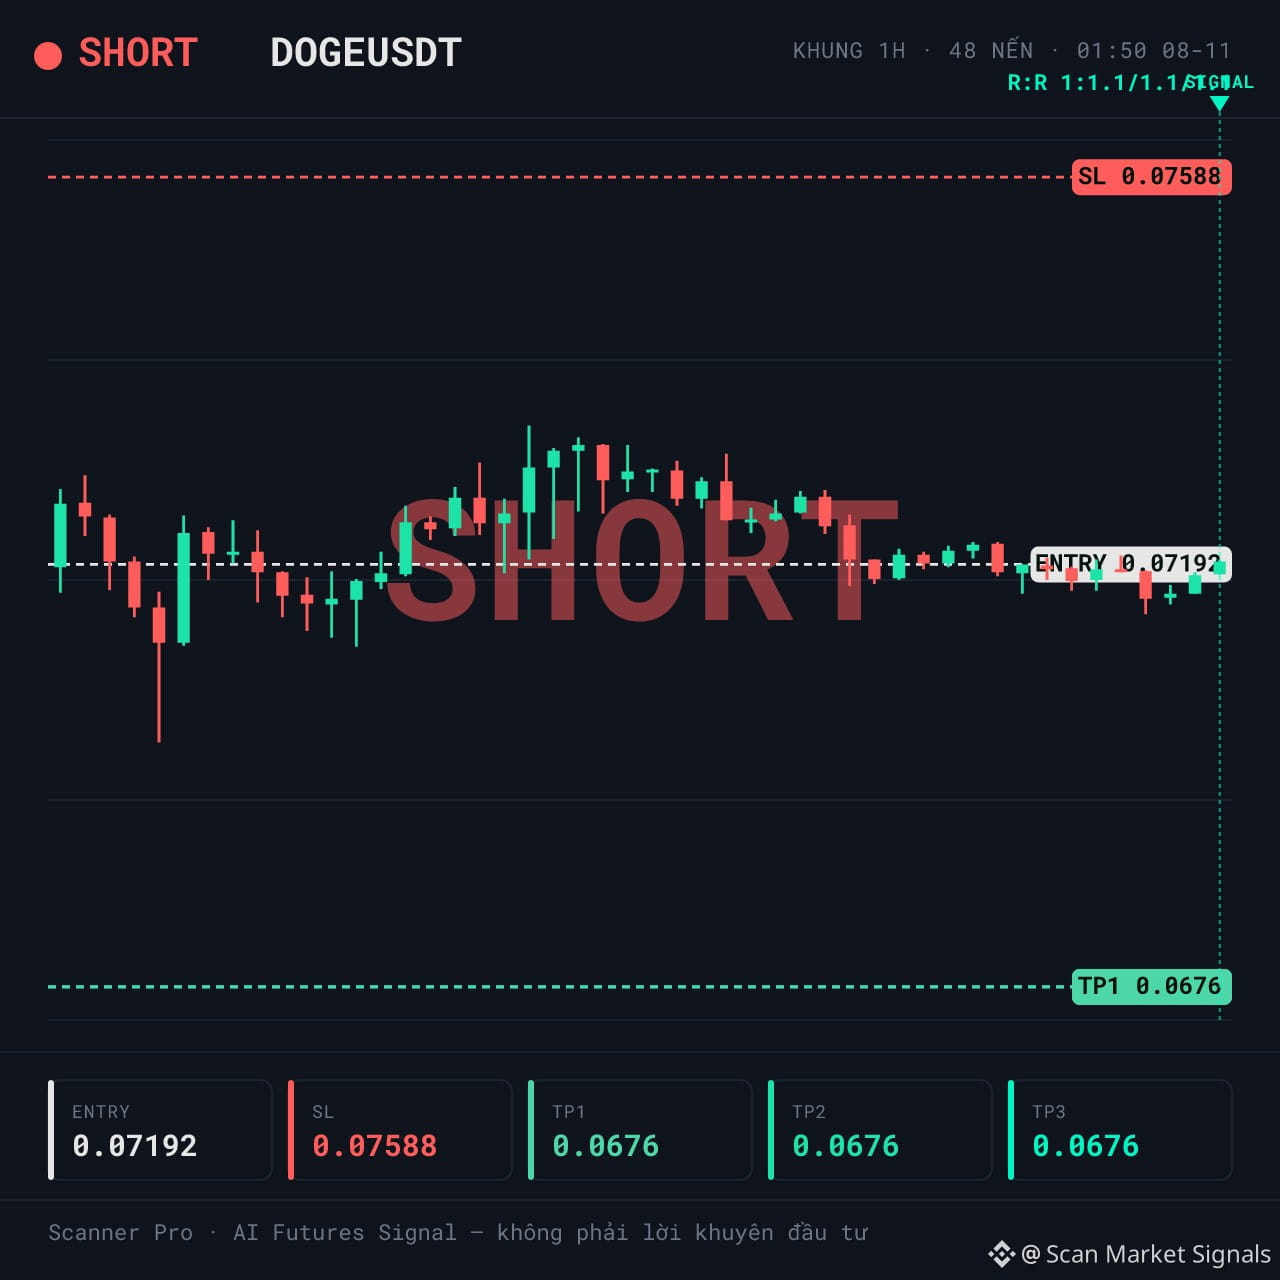
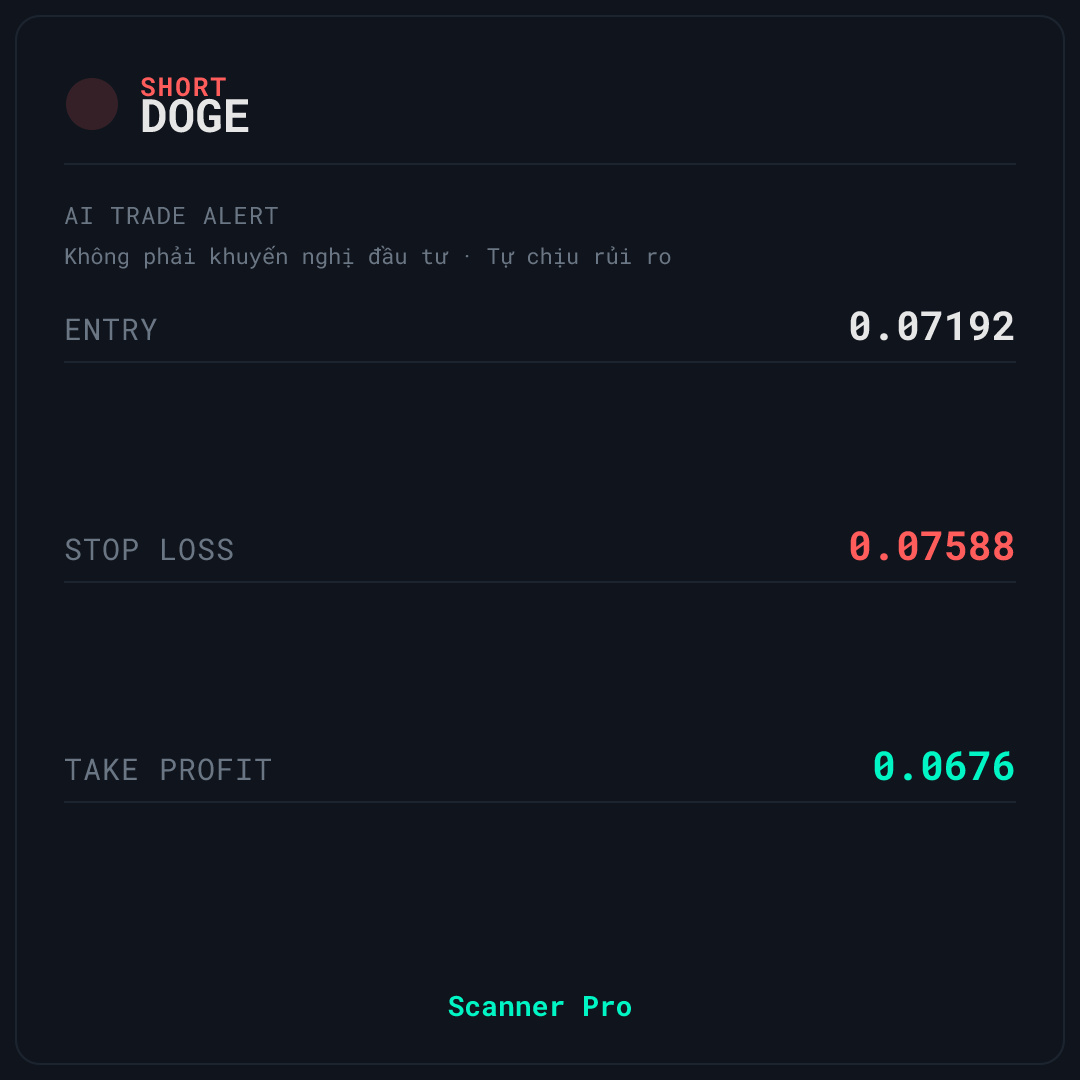
eCash reaches Bitcoin holders: what do price and flows say?
CoinTelegraph reports that Bitcoin holders have received eCash, raising questions about how to use it. Meanwhile, Binance Futures data shows BTC was nearly flat over 24 hours, with derivatives leaning slightly toward selling, so there is no clear confirmation from flows.
What was announced
CoinTelegraph published an article at 13:30 on 07/11/2026 (UTC) titled "Bitcoin holders have received eCash — What can you do with it?", stating that Bitcoin holders have received eCash and discussing how to use the asset. This is an explanatory feature, with no on-chain figures or issuance volume in the headline, so the scope of the event is limited to…
Price and flow reaction
At 18:50 on 07/11/2026, Binance Futures recorded BTC at around 75801, with a 24-hour change of nearly 0 and 24-hour volume of around 3.01 billion USDT. The 1-hour RSI was 43 and the 4-hour RSI was 39, with funding at 0.0055. These indicators suggest that the price is moving sideways within a narrow range, with no breakout corresponding to the eCash news. ETH was up about 0.2 over 24 hours at a price of 2236, while SOL was down about -0.6 at a price of 89.71 —…
Counter-scenario: If the price reaction reverses after the news has already been priced in, the initial impact scenario no longer applies. Specifically, if volume rises alongside a reversal in funding and the RSI moves out of the neutral zone, the interpretation that "the market has not reacted" would be disproven.
Sources: CoinTelegraph (20:30 07-11) · Binance Futures (01:50 08-11)
This is educational technical analysis, not investment advice. Cryptocurrency trading involves high risk, and you could lose all your capital. Do your own research and take responsibility for your decisions.
#Binance #Crypto #Futures
eCash reaches Bitcoin holders: what do price and flows say?
CoinTelegraph reports that Bitcoin holders have received eCash, raising questions about how to use it. Meanwhile, Binance Futures data shows BTC was nearly flat over 24 hours, with derivatives leaning slightly toward selling, so there is no clear confirmation from flows.
What was announced
CoinTelegraph published an article at 13:30 on 07/11/2026 (UTC) titled "Bitcoin holders have received eCash — What can you do with it?", stating that Bitcoin holders have received eCash and discussing how to use the asset. This is an explanatory feature, with no on-chain figures or issuance volume in the headline, so the scope of the event is limited to…
Price and flow reaction
At 18:50 on 07/11/2026, Binance Futures recorded BTC at around 75801, with a 24-hour change of nearly 0 and 24-hour volume of around 3.01 billion USDT. The 1-hour RSI was 43 and the 4-hour RSI was 39, with funding at 0.0055. These indicators suggest that the price is moving sideways within a narrow range, with no breakout corresponding to the eCash news. ETH was up about 0.2 over 24 hours at a price of 2236, while SOL was down about -0.6 at a price of 89.71 —…
Counter-scenario: If the price reaction reverses after the news has already been priced in, the initial impact scenario no longer applies. Specifically, if volume rises alongside a reversal in funding and the RSI moves out of the neutral zone, the interpretation that "the market has not reacted" would be disproven.
Sources: CoinTelegraph (20:30 07-11) · Binance Futures (01:50 08-11)
This is educational technical analysis, not investment advice. Cryptocurrency trading involves high risk, and you could lose all your capital. Do your own research and take responsibility for your decisions.
#Binance #Crypto #Futures
CoinTelegraph reports that Bitcoin holders have received eCash, raising questions about how to use it. Meanwhile, Binance Futures data shows BTC was nearly flat over 24 hours, with derivatives leaning slightly toward selling, so there is no clear confirmation from flows.
What was announced
CoinTelegraph published an article at 13:30 on 07/11/2026 (UTC) titled "Bitcoin holders have received eCash — What can you do with it?", stating that Bitcoin holders have received eCash and discussing how to use the asset. This is an explanatory feature, with no on-chain figures or issuance volume in the headline, so the scope of the event is limited to…
Price and flow reaction
At 18:50 on 07/11/2026, Binance Futures recorded BTC at around 75801, with a 24-hour change of nearly 0 and 24-hour volume of around 3.01 billion USDT. The 1-hour RSI was 43 and the 4-hour RSI was 39, with funding at 0.0055. These indicators suggest that the price is moving sideways within a narrow range, with no breakout corresponding to the eCash news. ETH was up about 0.2 over 24 hours at a price of 2236, while SOL was down about -0.6 at a price of 89.71 —…
Counter-scenario: If the price reaction reverses after the news has already been priced in, the initial impact scenario no longer applies. Specifically, if volume rises alongside a reversal in funding and the RSI moves out of the neutral zone, the interpretation that "the market has not reacted" would be disproven.
Sources: CoinTelegraph (20:30 07-11) · Binance Futures (01:50 08-11)
This is educational technical analysis, not investment advice. Cryptocurrency trading involves high risk, and you could lose all your capital. Do your own research and take responsibility for your decisions.
#Binance #Crypto #Futures
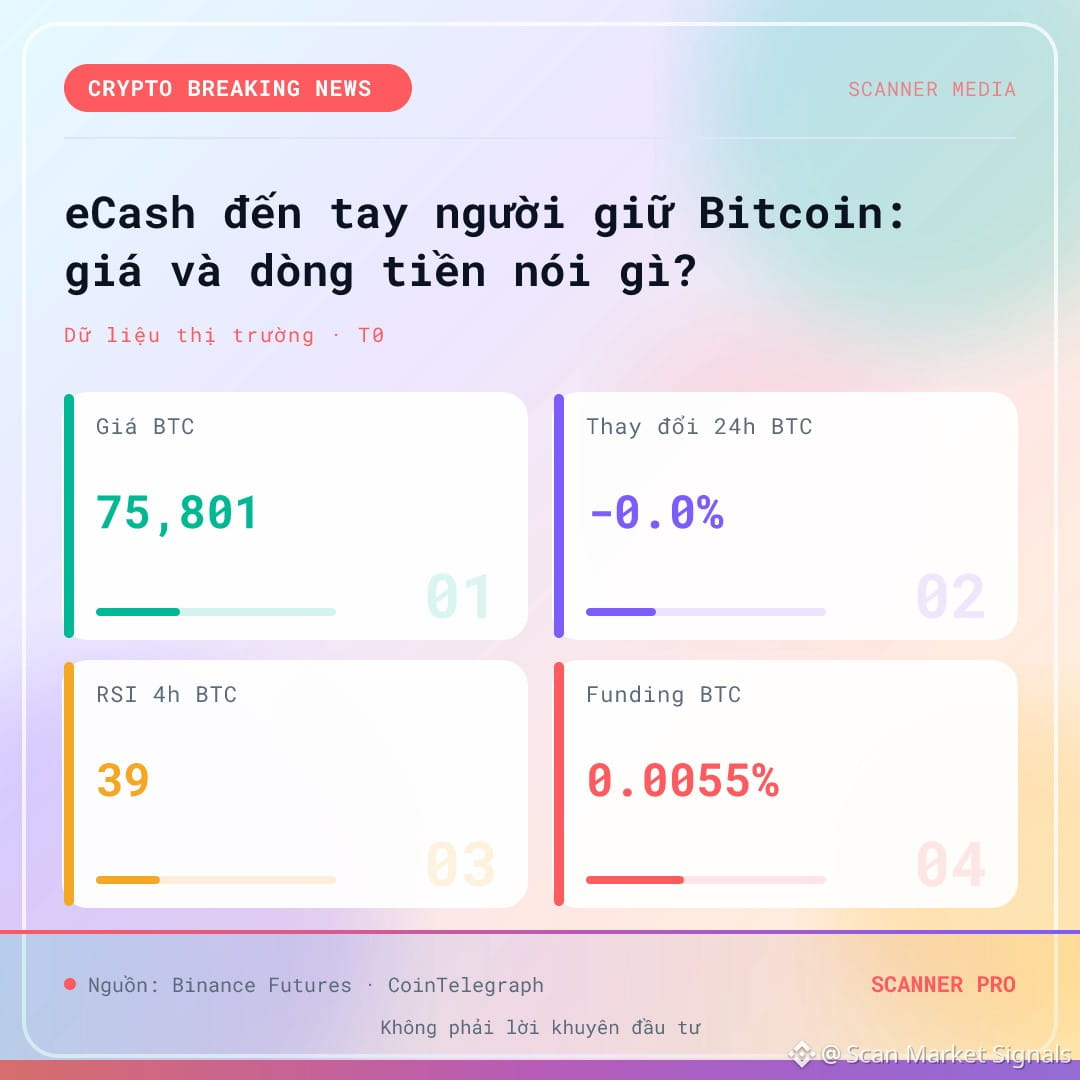
3
$WIF Around 0.1622 USD: What do the 24-hour range and funding indicate?
$WIF is trading around 0.1622 USD, down over the past 24 hours, while funding remains slightly positive. This is a data point worth discussing: the price is weak, but the futures market has yet to show a clear shift in sentiment.
The data point at a glance
According to the Binance Futures snapshot at 18:40 on 07/11/2026, $WIF is trading around 0.1622 USD, with a 24-hour change of -2.9. The pair’s 24-hour trading volume is around 0.01 billion USDT—much thinner than that of the major coins in the same snapshot. Meanwhile, WIF funding is recorded at 0.0043, meaning it remains slightly positive. The 1-hour RSI is 48 and the 4-hour RSI is 42; neither is in extreme territory. The context…
Why it matters
The point worth discussing is not that the price is falling, but that funding remains positive while the price is weak. Positive funding usually reflects longs being willing to pay shorts—but 0.0043 is a small figure, not enough to indicate a clearly lopsided position. Combined with thin liquidity, price swings may be amplified by smaller orders rather than large capital flows. The 1-hour and 4-hour RSI readings are both in neutral territory, not…
Contrary scenario: If WIF’s 24-hour range changes significantly, this question should be reassessed.
Source: Binance Futures (01:40 08-11)
This technical analysis is for educational purposes only and is not investment advice. Cryptocurrency trading carries high risk, and you could lose all your capital. Do your own research and take responsibility for your decisions.
#Binance #Crypto #Futures
$WIF Around 0.1622 USD: What do the 24-hour range and funding indicate?
$WIF is trading around 0.1622 USD, down over the past 24 hours, while funding remains slightly positive. This is a data point worth discussing: the price is weak, but the futures market has yet to show a clear shift in sentiment.
The data point at a glance
According to the Binance Futures snapshot at 18:40 on 07/11/2026, $WIF is trading around 0.1622 USD, with a 24-hour change of -2.9. The pair’s 24-hour trading volume is around 0.01 billion USDT—much thinner than that of the major coins in the same snapshot. Meanwhile, WIF funding is recorded at 0.0043, meaning it remains slightly positive. The 1-hour RSI is 48 and the 4-hour RSI is 42; neither is in extreme territory. The context…
Why it matters
The point worth discussing is not that the price is falling, but that funding remains positive while the price is weak. Positive funding usually reflects longs being willing to pay shorts—but 0.0043 is a small figure, not enough to indicate a clearly lopsided position. Combined with thin liquidity, price swings may be amplified by smaller orders rather than large capital flows. The 1-hour and 4-hour RSI readings are both in neutral territory, not…
Contrary scenario: If WIF’s 24-hour range changes significantly, this question should be reassessed.
Source: Binance Futures (01:40 08-11)
This technical analysis is for educational purposes only and is not investment advice. Cryptocurrency trading carries high risk, and you could lose all your capital. Do your own research and take responsibility for your decisions.
#Binance #Crypto #Futures
$WIF is trading around 0.1622 USD, down over the past 24 hours, while funding remains slightly positive. This is a data point worth discussing: the price is weak, but the futures market has yet to show a clear shift in sentiment.
The data point at a glance
According to the Binance Futures snapshot at 18:40 on 07/11/2026, $WIF is trading around 0.1622 USD, with a 24-hour change of -2.9. The pair’s 24-hour trading volume is around 0.01 billion USDT—much thinner than that of the major coins in the same snapshot. Meanwhile, WIF funding is recorded at 0.0043, meaning it remains slightly positive. The 1-hour RSI is 48 and the 4-hour RSI is 42; neither is in extreme territory. The context…
Why it matters
The point worth discussing is not that the price is falling, but that funding remains positive while the price is weak. Positive funding usually reflects longs being willing to pay shorts—but 0.0043 is a small figure, not enough to indicate a clearly lopsided position. Combined with thin liquidity, price swings may be amplified by smaller orders rather than large capital flows. The 1-hour and 4-hour RSI readings are both in neutral territory, not…
Contrary scenario: If WIF’s 24-hour range changes significantly, this question should be reassessed.
Source: Binance Futures (01:40 08-11)
This technical analysis is for educational purposes only and is not investment advice. Cryptocurrency trading carries high risk, and you could lose all your capital. Do your own research and take responsibility for your decisions.
#Binance #Crypto #Futures
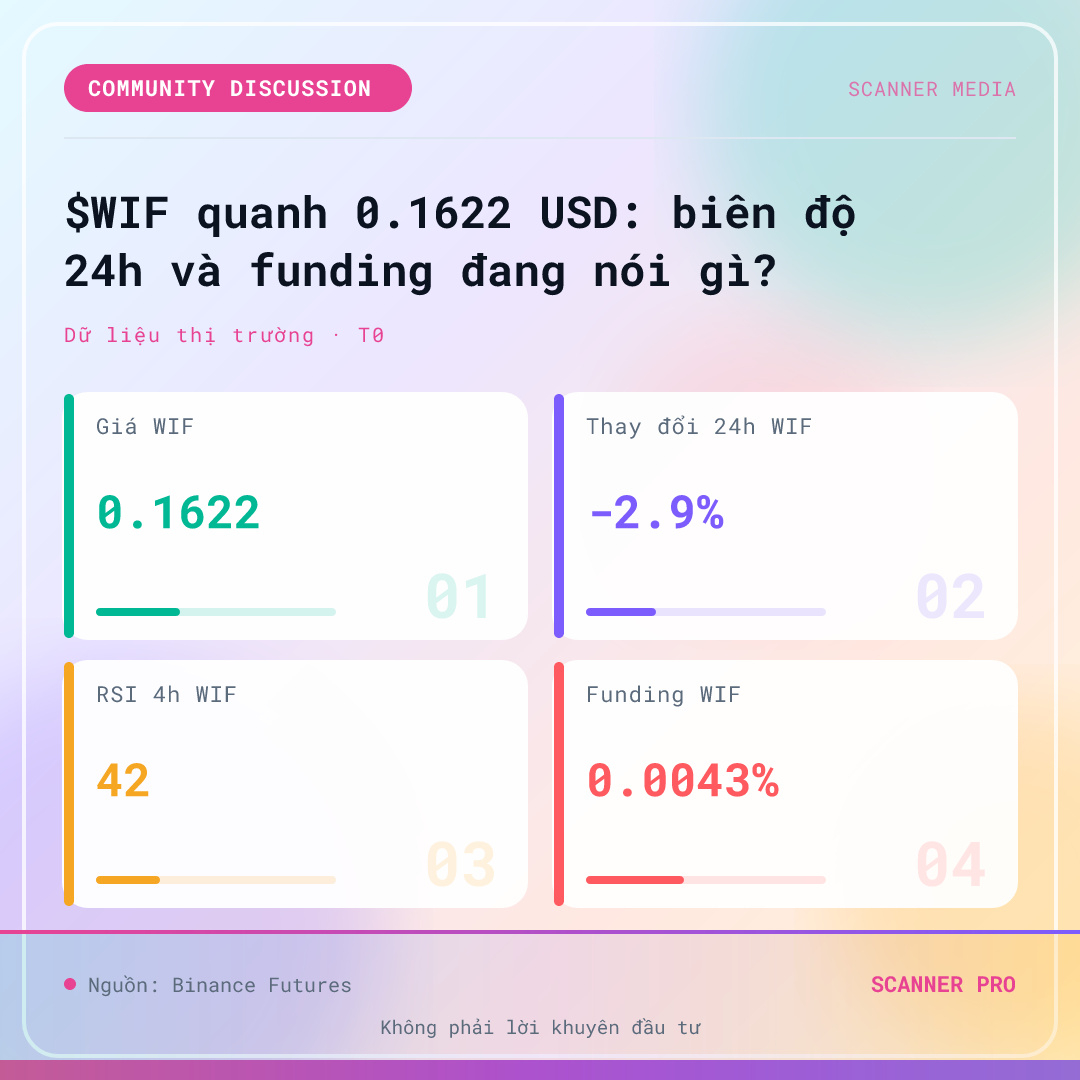
3
Log in to explore more content
Join global crypto users on Binance Square
⚡️ Get latest and useful information about crypto.
💬 Trusted by the world’s largest crypto exchange.
👍 Discover real insights from verified creators.
Email / Phone number
Trending Topics
WhatWillDriveCryptoandStocks’NextRebound?
232 views
55 Discussing
Bitcoin Slips Below $70,000 as Dollar Index Hits 19-Month High
Binance News
·3 Likes
·2.1k views
Anthropic’s6xIPODemandSignalsPotentialRecordRaise
81 views
18 Discussing
HuangExitNvidiaStrategyInFocus
125,345 views
1,300 Discussing