
Spidey男孩
1.1k Posts

Spidey男孩
Report
Block User
Spidys Crypto Radar
BTC Altcoin Setups
Crypto News Market Moves
Simple Analysis Clear Levels No Hype
High-Frequency Trader
1.6 Years
203 Following
14.7K+ Followers
3.2K+ Liked
Posts
All
Quotes
Videos
Live
PINNED
·
--
Bearish
🧨 BIG LESSON LEARNED! 😞💸
Today I made a mistake I’ll never forget…
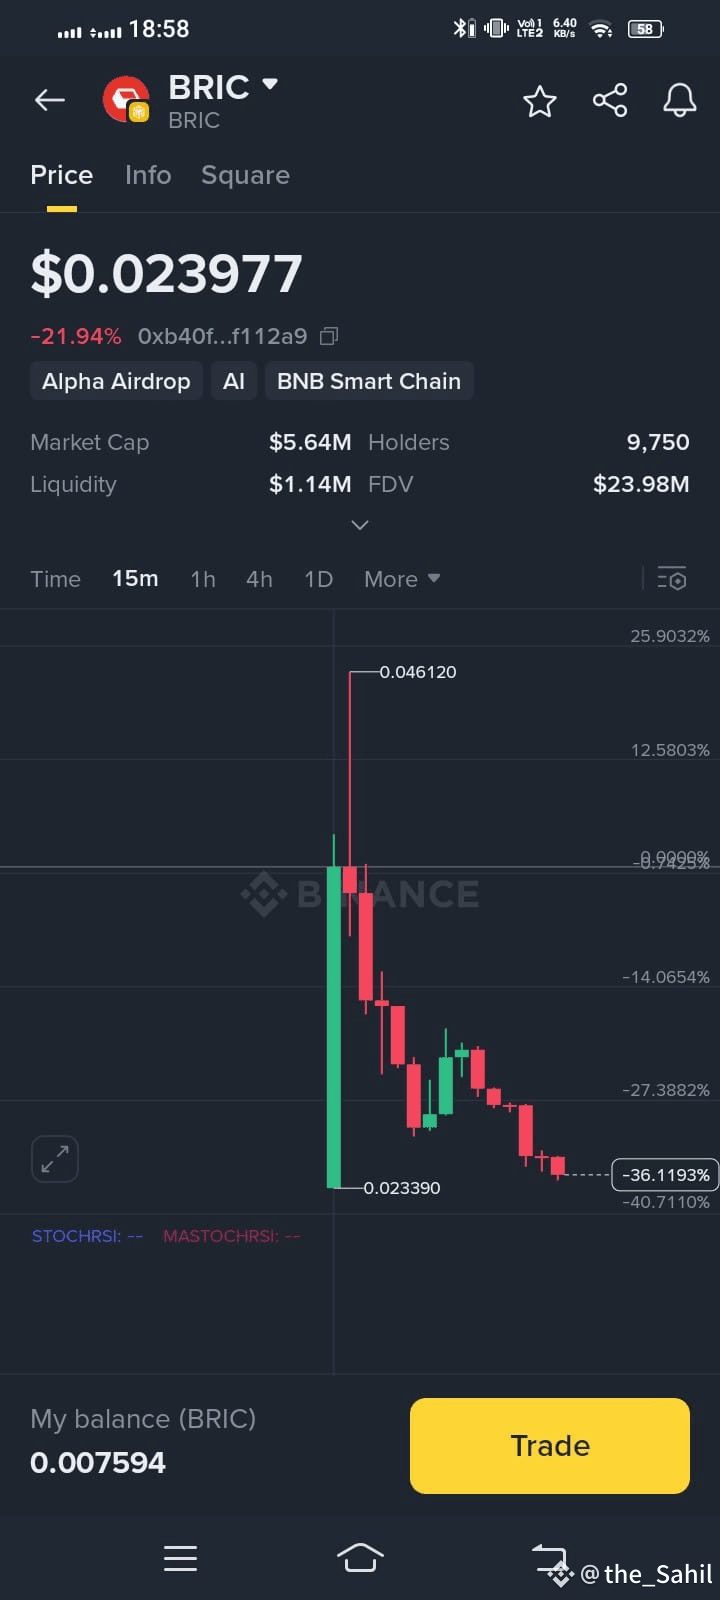
❌ Entered BRIC at the wrong time
❌ No proper strategy
❌ Trusted my overconfidence, not the charts
❌ Thought I was smarter than the market
💥 Result: LOSS of funds, pain in the portfolio & a slap from reality 😓
But you know what?
✅ I’m not quitting
✅ I’m learning from it
✅ And next time, I’ll follow the plan, not emotions
📉 This is your reminder:
> Don’t FOMO in Always do your analysis And never ever trade without a strategy
#CryptoLessons #TradingMistake #CryptoReality #LearnAndGrow #TradingDiscipline
🧨 BIG LESSON LEARNED! 😞💸
Today I made a mistake I’ll never forget…
❌ Entered BRIC at the wrong time
❌ No proper strategy
❌ Trusted my overconfidence, not the charts
❌ Thought I was smarter than the market
💥 Result: LOSS of funds, pain in the portfolio & a slap from reality 😓
But you know what?
✅ I’m not quitting
✅ I’m learning from it
✅ And next time, I’ll follow the plan, not emotions
📉 This is your reminder:
> Don’t FOMO in Always do your analysis And never ever trade without a strategy
#CryptoLessons #TradingMistake #CryptoReality #LearnAndGrow #TradingDiscipline
Today I made a mistake I’ll never forget…
❌ Entered BRIC at the wrong time
❌ No proper strategy
❌ Trusted my overconfidence, not the charts
❌ Thought I was smarter than the market
💥 Result: LOSS of funds, pain in the portfolio & a slap from reality 😓
But you know what?
✅ I’m not quitting
✅ I’m learning from it
✅ And next time, I’ll follow the plan, not emotions
📉 This is your reminder:
> Don’t FOMO in Always do your analysis And never ever trade without a strategy
#CryptoLessons #TradingMistake #CryptoReality #LearnAndGrow #TradingDiscipline
12
5
39
144.4k
PINNED
·
--
Bearish
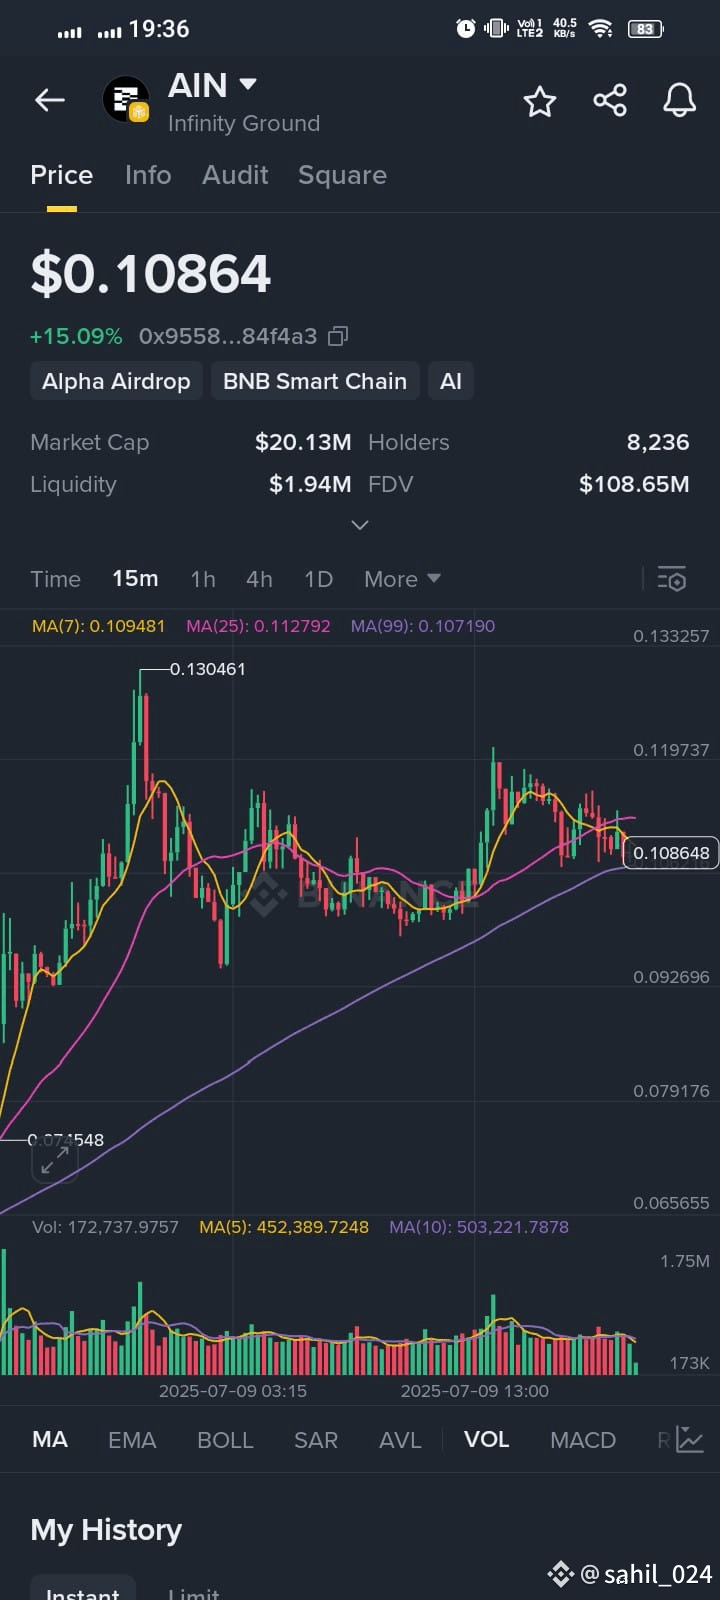
😭 Entry late… Exit early… and wallet empty.
I kept thinking — “This coin is flying!”
And I got on that rocket…
But reality made a landing… directly in the loss zone. 🚀💥
But guess what?
This is not the end… It’s just the first chapter.
📚 Every chart tells a story… and every trader is the hero of that story.
I fell… but now I have learned how to step into the battlefield… with new tools, new rules! ⚔️📈
💡 Lesson learned:
> Entry should not be based on FOMO.
Trading does not work on emotions.
Strategy makes the game.
Today or tomorrow… I will come back — smarter, stronger, sharper. 💪🔥
Don't panic from mistakes — learn, grow, and #TradeLikeAPro 🧠📊
---
🔁 Have you ever made a wrong entry? Share your experience in the comments — maybe your lesson will become someone else's strategy!
#SECETFApproval
$BNB
😭 Entry late… Exit early… and wallet empty.
I kept thinking — “This coin is flying!”
And I got on that rocket…
But reality made a landing… directly in the loss zone. 🚀💥
But guess what?
This is not the end… It’s just the first chapter.
📚 Every chart tells a story… and every trader is the hero of that story.
I fell… but now I have learned how to step into the battlefield… with new tools, new rules! ⚔️📈
💡 Lesson learned:
> Entry should not be based on FOMO.
Trading does not work on emotions.
Strategy makes the game.
Today or tomorrow… I will come back — smarter, stronger, sharper. 💪🔥
Don't panic from mistakes — learn, grow, and #TradeLikeAPro 🧠📊
---
🔁 Have you ever made a wrong entry? Share your experience in the comments — maybe your lesson will become someone else's strategy!
#SECETFApproval
$BNB
I kept thinking — “This coin is flying!”
And I got on that rocket…
But reality made a landing… directly in the loss zone. 🚀💥
But guess what?
This is not the end… It’s just the first chapter.
📚 Every chart tells a story… and every trader is the hero of that story.
I fell… but now I have learned how to step into the battlefield… with new tools, new rules! ⚔️📈
💡 Lesson learned:
> Entry should not be based on FOMO.
Trading does not work on emotions.
Strategy makes the game.
Today or tomorrow… I will come back — smarter, stronger, sharper. 💪🔥
Don't panic from mistakes — learn, grow, and #TradeLikeAPro 🧠📊
---
🔁 Have you ever made a wrong entry? Share your experience in the comments — maybe your lesson will become someone else's strategy!
#SECETFApproval
$BNB
24
13
52
202.9k
·
--
Bearish
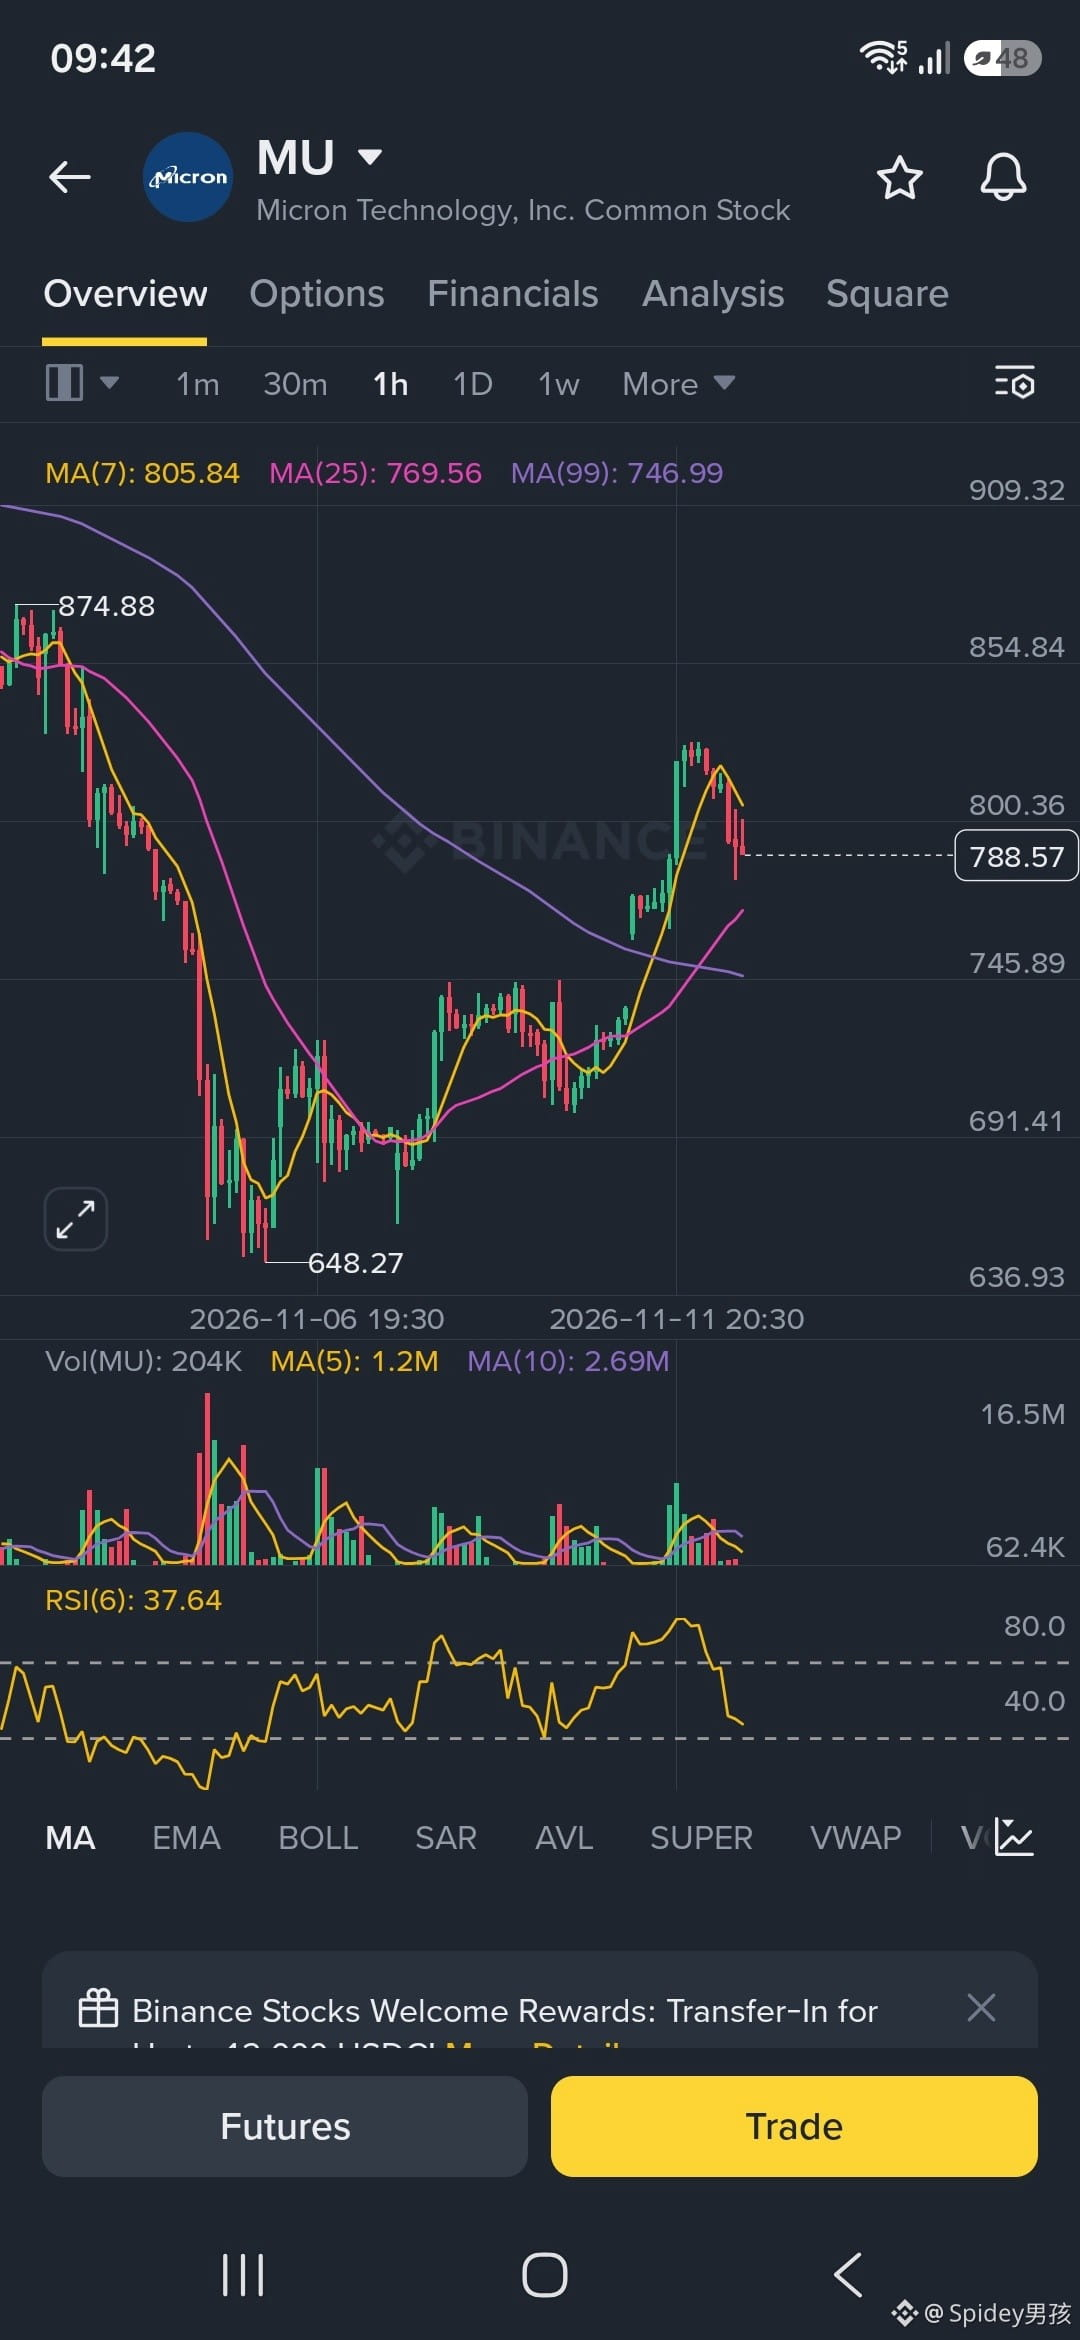
$MU Coin Shows Selling Opportunity for long time and higher Priority for rejection on Poi So don't miss
#Binance #CreatorToken
$MU Coin Shows Selling Opportunity for long time and higher Priority for rejection on Poi So don't miss
#Binance #CreatorToken
#Binance #CreatorToken
1
74
·
--
Bullish
🚀 $AMD (Advanced Micro Devices) – Bulls Are Still in Control!
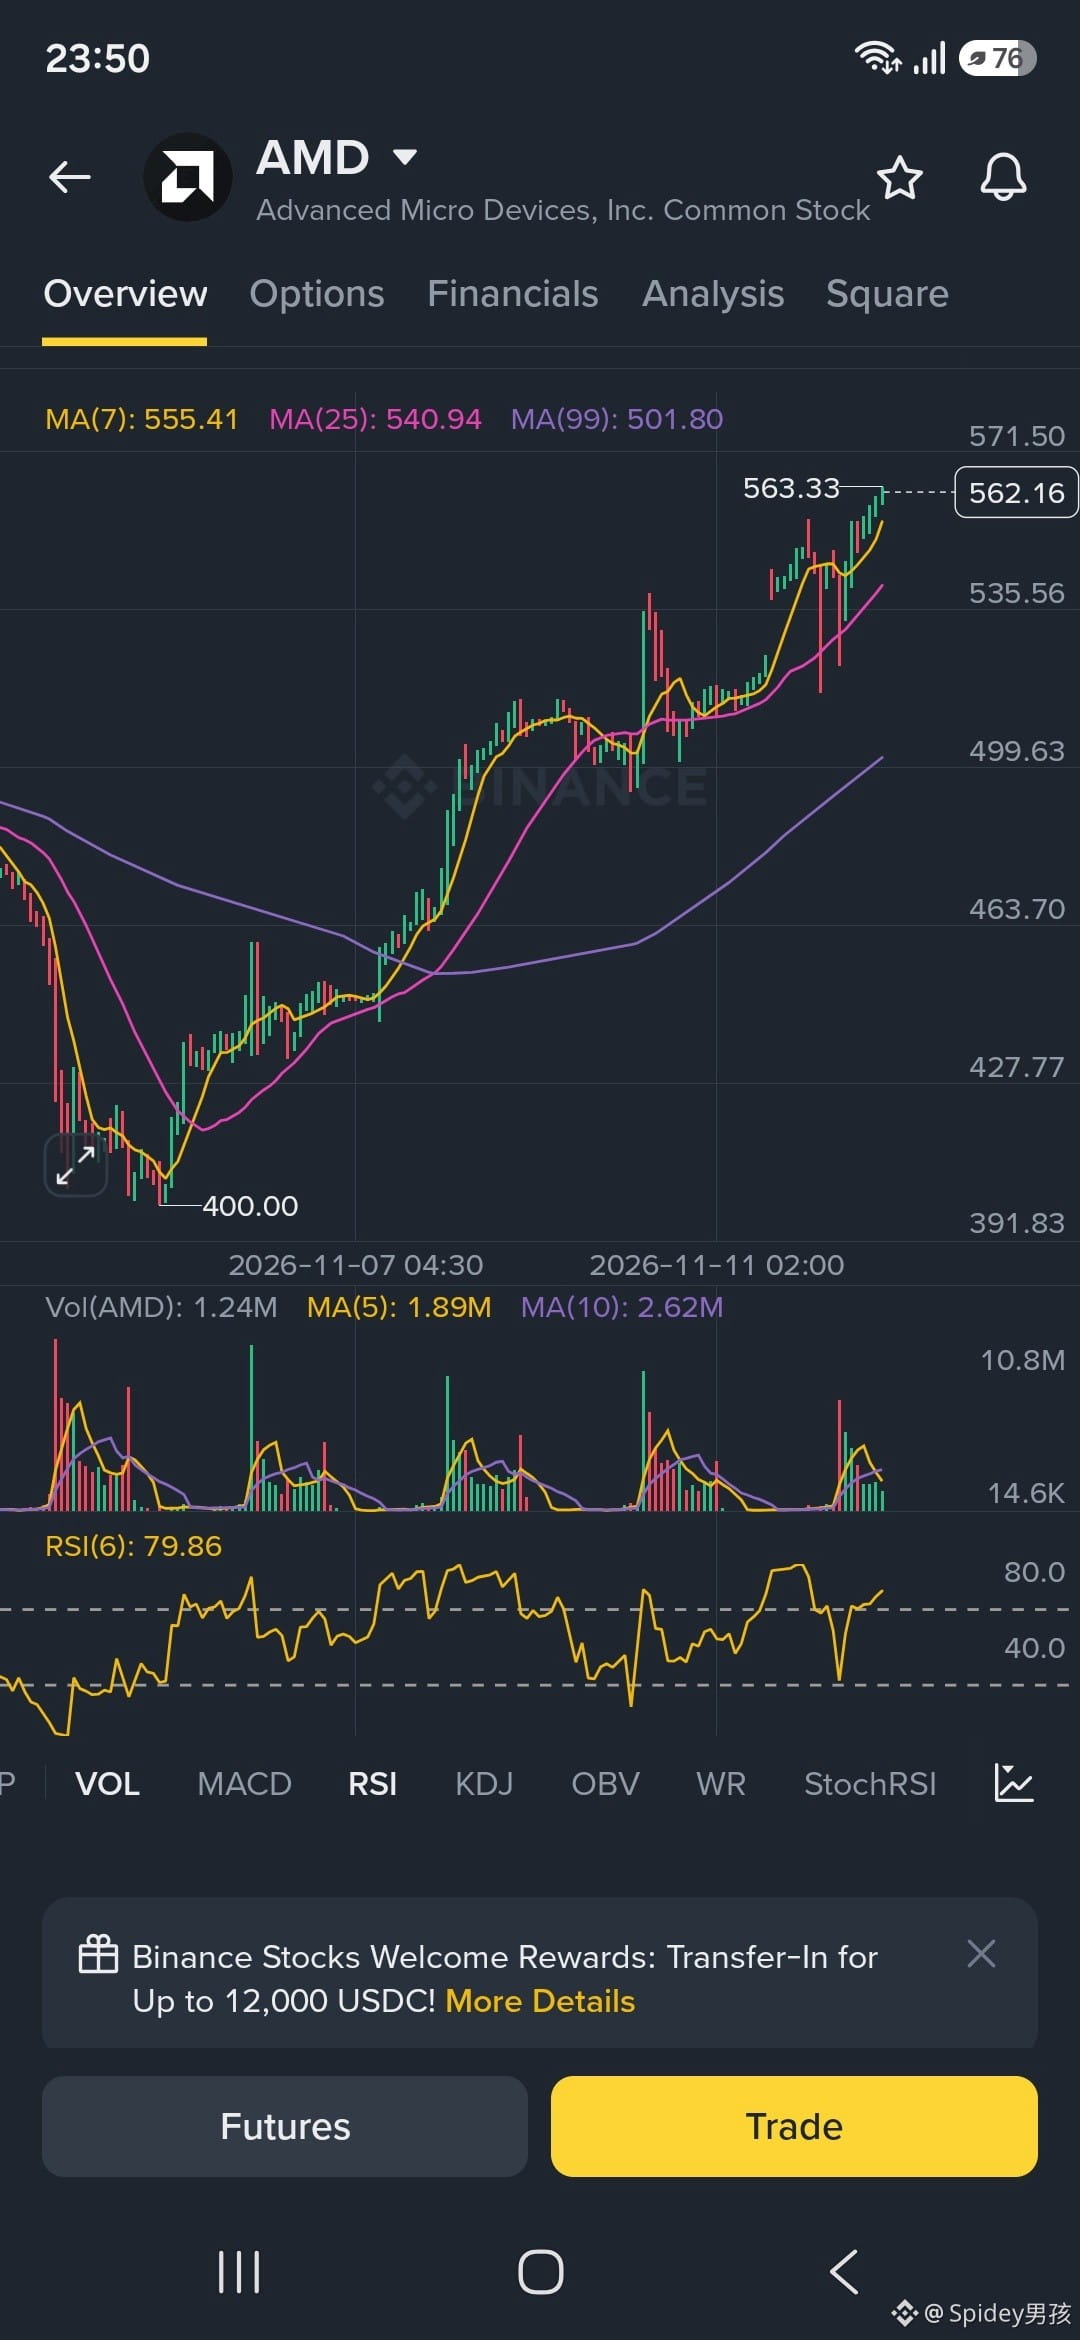
AMD is showing strong bullish momentum, with price currently trading around $562.16, following an impressive recovery from the $400 zone.
📊 Technical Analysis:
🟢 Current Price: $562.16
🟢 MA(7): $555.41
🟢 MA(25): $540.94
🟢 MA(99): $501.80
🟡 RSI(6): 79.86
Bullish Signals:
- Price is trading above all three moving averages.
- MA(7) above MA(25) and MA(99) confirms a strong bullish structure.
- Higher highs and higher lows indicate buyers remain in control.
- AMD is approaching its recent resistance around $563.33.
⚠️ What to Watch Next:
RSI near 80 indicates overbought conditions, so a short-term pullback or consolidation is possible.
A strong breakout above $563.33 could open the door for further upside, while rejection may bring a retest of nearby support.
My Outlook: Bullish overall, but chasing the price at current levels carries risk. Waiting for confirmation or a healthy pullback could offer a better opportunity.
🔥 Can AMD break above $563 and continue its rally, or are the bulls running out of steam?
#AMD #stocks #stockmarket #TechnicalAnalysis
$AMD
🚀 $AMD (Advanced Micro Devices) – Bulls Are Still in Control!
AMD is showing strong bullish momentum, with price currently trading around $562.16, following an impressive recovery from the $400 zone.
📊 Technical Analysis:
🟢 Current Price: $562.16
🟢 MA(7): $555.41
🟢 MA(25): $540.94
🟢 MA(99): $501.80
🟡 RSI(6): 79.86
Bullish Signals:
- Price is trading above all three moving averages.
- MA(7) above MA(25) and MA(99) confirms a strong bullish structure.
- Higher highs and higher lows indicate buyers remain in control.
- AMD is approaching its recent resistance around $563.33.
⚠️ What to Watch Next:
RSI near 80 indicates overbought conditions, so a short-term pullback or consolidation is possible.
A strong breakout above $563.33 could open the door for further upside, while rejection may bring a retest of nearby support.
My Outlook: Bullish overall, but chasing the price at current levels carries risk. Waiting for confirmation or a healthy pullback could offer a better opportunity.
🔥 Can AMD break above $563 and continue its rally, or are the bulls running out of steam?
#AMD #stocks #stockmarket #TechnicalAnalysis
$AMD
AMD is showing strong bullish momentum, with price currently trading around $562.16, following an impressive recovery from the $400 zone.
📊 Technical Analysis:
🟢 Current Price: $562.16
🟢 MA(7): $555.41
🟢 MA(25): $540.94
🟢 MA(99): $501.80
🟡 RSI(6): 79.86
Bullish Signals:
- Price is trading above all three moving averages.
- MA(7) above MA(25) and MA(99) confirms a strong bullish structure.
- Higher highs and higher lows indicate buyers remain in control.
- AMD is approaching its recent resistance around $563.33.
⚠️ What to Watch Next:
RSI near 80 indicates overbought conditions, so a short-term pullback or consolidation is possible.
A strong breakout above $563.33 could open the door for further upside, while rejection may bring a retest of nearby support.
My Outlook: Bullish overall, but chasing the price at current levels carries risk. Waiting for confirmation or a healthy pullback could offer a better opportunity.
🔥 Can AMD break above $563 and continue its rally, or are the bulls running out of steam?
#AMD #stocks #stockmarket #TechnicalAnalysis
$AMD
1
81
·
--
Bearish
📊 NVDA – Bulls Are Trying to Regain Control! 🚀
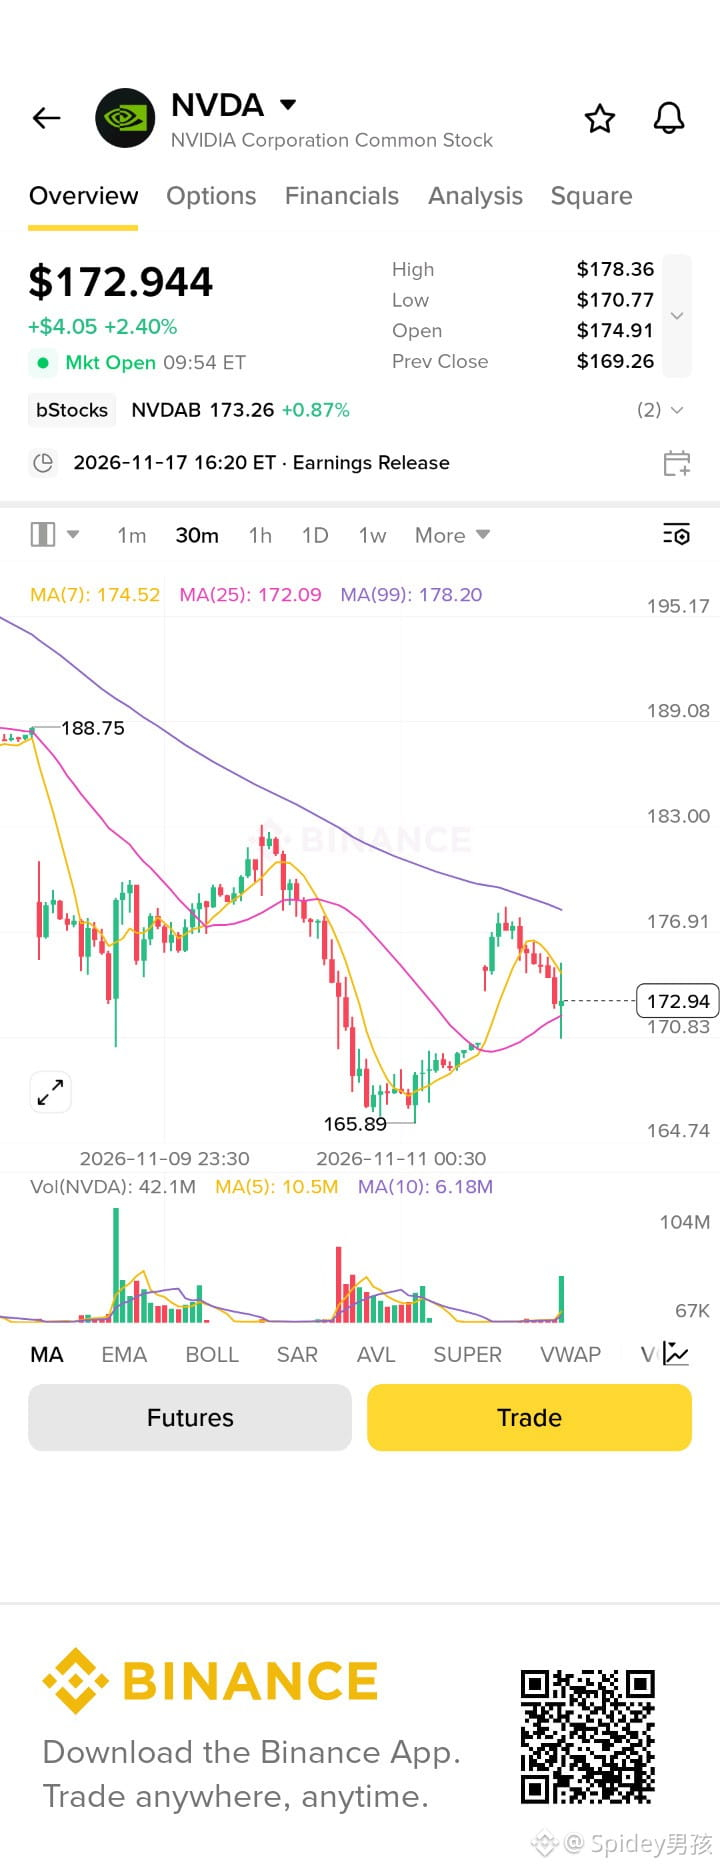
NVIDIA ($NVDA ) is showing signs of recovery after a sharp drop toward the $165.89 support zone.
Currently trading around $172.94 (+2.40%), the stock has bounced back, but the question is: Can bulls maintain this momentum?
🔍 30M Technical Analysis
- Current Price: $172.94
- MA(7): $174.52
- MA(25): $172.09
- MA(99): $178.20
📈 Key Levels to Watch
🟢 Support: $170.80 – $172.00
🟢 Major Support: $165.89
🔴 Resistance: $174.50 – $176.90
🔴 Major Resistance: $178.20
My Market View:
Price is currently hovering around MA(25), while MA(99) remains overhead resistance.
If buyers reclaim $174.50 and sustain above it, we could see another attempt toward $176.90 and potentially $178.20.
However, rejection around $174.50 could bring sellers back into control, putting $170.80 under pressure.
⚡ Bullish above $174.50 | Cautious below $170.80
Remember: Wait for confirmation instead of chasing candles. Manage your risk wisely.
What's your view? NVDA to $180 or back to $165? 👇
#NVIDIA $NVDA
{spot}(NVDABUSDT)
📊 NVDA – Bulls Are Trying to Regain Control! 🚀
NVIDIA ($NVDA ) is showing signs of recovery after a sharp drop toward the $165.89 support zone.
Currently trading around $172.94 (+2.40%), the stock has bounced back, but the question is: Can bulls maintain this momentum?
🔍 30M Technical Analysis
- Current Price: $172.94
- MA(7): $174.52
- MA(25): $172.09
- MA(99): $178.20
📈 Key Levels to Watch
🟢 Support: $170.80 – $172.00
🟢 Major Support: $165.89
🔴 Resistance: $174.50 – $176.90
🔴 Major Resistance: $178.20
My Market View:
Price is currently hovering around MA(25), while MA(99) remains overhead resistance.
If buyers reclaim $174.50 and sustain above it, we could see another attempt toward $176.90 and potentially $178.20.
However, rejection around $174.50 could bring sellers back into control, putting $170.80 under pressure.
⚡ Bullish above $174.50 | Cautious below $170.80
Remember: Wait for confirmation instead of chasing candles. Manage your risk wisely.
What's your view? NVDA to $180 or back to $165? 👇
#NVIDIA $NVDA
NVIDIA ($NVDA ) is showing signs of recovery after a sharp drop toward the $165.89 support zone.
Currently trading around $172.94 (+2.40%), the stock has bounced back, but the question is: Can bulls maintain this momentum?
🔍 30M Technical Analysis
- Current Price: $172.94
- MA(7): $174.52
- MA(25): $172.09
- MA(99): $178.20
📈 Key Levels to Watch
🟢 Support: $170.80 – $172.00
🟢 Major Support: $165.89
🔴 Resistance: $174.50 – $176.90
🔴 Major Resistance: $178.20
My Market View:
Price is currently hovering around MA(25), while MA(99) remains overhead resistance.
If buyers reclaim $174.50 and sustain above it, we could see another attempt toward $176.90 and potentially $178.20.
However, rejection around $174.50 could bring sellers back into control, putting $170.80 under pressure.
⚡ Bullish above $174.50 | Cautious below $170.80
Remember: Wait for confirmation instead of chasing candles. Manage your risk wisely.
What's your view? NVDA to $180 or back to $165? 👇
#NVIDIA $NVDA
1
88
·
--
Bullish
🚀 $IDOL – Bulls Are Taking Control!
IDOL is showing strong bullish momentum with a powerful green candle pushing the price higher. Buyers are stepping in aggressively, and the recent price action is worth watching.
👀 What I'm Watching:
- Strong bullish momentum
- Increasing buying pressure
- Potential continuation if buyers hold control
- Watch for a retest before chasing the move
⚡ Momentum is interesting, but don't confuse a breakout with a guaranteed rally. Manage your risk and wait for confirmation.
Eyes on $IDOL. 🐂
#IDOL #crypto #BinanceSquare #altcoins #trading
{future}(IDOLUSDT)
🚀 $IDOL – Bulls Are Taking Control!
IDOL is showing strong bullish momentum with a powerful green candle pushing the price higher. Buyers are stepping in aggressively, and the recent price action is worth watching.
👀 What I'm Watching:
- Strong bullish momentum
- Increasing buying pressure
- Potential continuation if buyers hold control
- Watch for a retest before chasing the move
⚡ Momentum is interesting, but don't confuse a breakout with a guaranteed rally. Manage your risk and wait for confirmation.
Eyes on $IDOL . 🐂
#IDOL #crypto #BinanceSquare #altcoins #trading
IDOL is showing strong bullish momentum with a powerful green candle pushing the price higher. Buyers are stepping in aggressively, and the recent price action is worth watching.
👀 What I'm Watching:
- Strong bullish momentum
- Increasing buying pressure
- Potential continuation if buyers hold control
- Watch for a retest before chasing the move
⚡ Momentum is interesting, but don't confuse a breakout with a guaranteed rally. Manage your risk and wait for confirmation.
Eyes on $IDOL . 🐂
#IDOL #crypto #BinanceSquare #altcoins #trading
1
47
·
--
🎙️ $PUMP USDT SHOWING MONTH IS BARISH ALWAYS HIGH ACHIEVE THIS MONTH
End
42 m 22 s
29
1
0
·
--
📉 $TRX /USDT Short Setup Execution
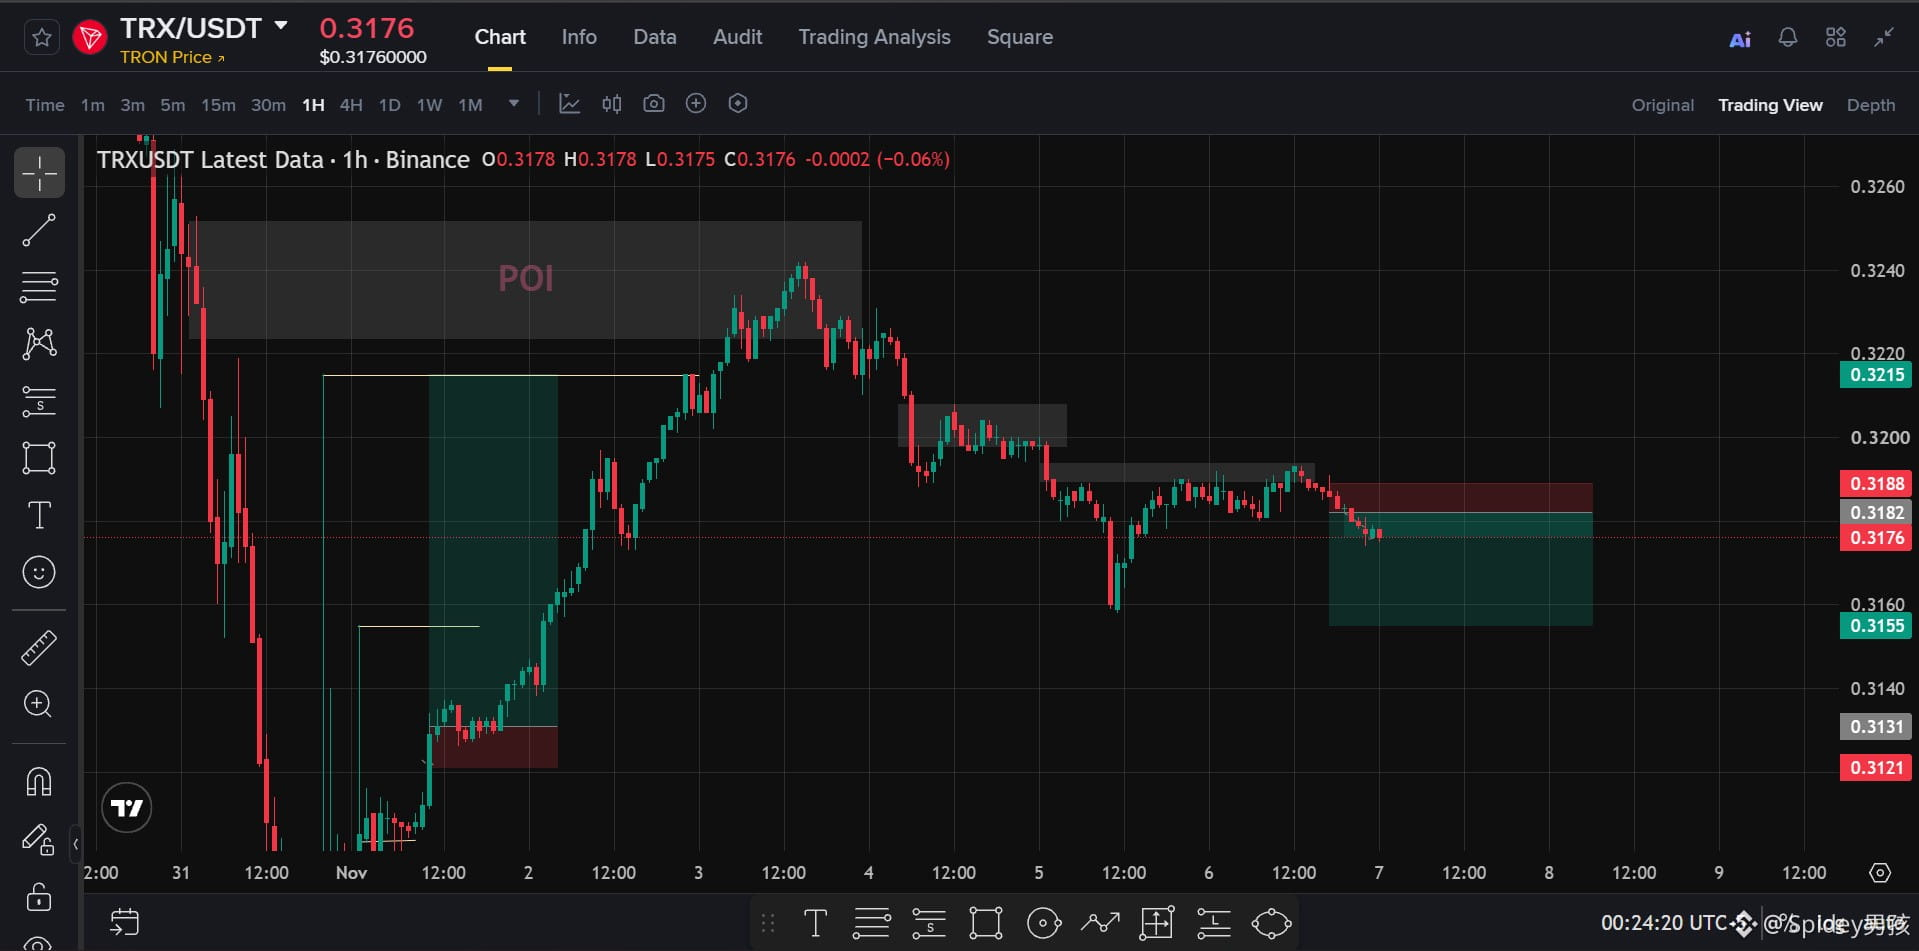
Price action tapped our Point of Interest (POI) supply zone near 0.3240 and reversed hard, confirming strong distribution.
Current Technical Layout:
Trend Shift: Market structure broken to the downside on the 1H timeframe.Bearish Order Block: The local pullback retested a minor mitigation zone around 0.3188, which is holding strong.Current Price: 0.3176 (printing a red continuation candle).
📉 $TRX /USDT Short Setup Execution
Price action tapped our Point of Interest (POI) supply zone near 0.3240 and reversed hard, confirming strong distribution.
Current Technical Layout:
Trend Shift: Market structure broken to the downside on the 1H timeframe.Bearish Order Block: The local pullback retested a minor mitigation zone around 0.3188, which is holding strong.Current Price: 0.3176 (printing a red continuation candle).
Price action tapped our Point of Interest (POI) supply zone near 0.3240 and reversed hard, confirming strong distribution.
Current Technical Layout:
Trend Shift: Market structure broken to the downside on the 1H timeframe.Bearish Order Block: The local pullback retested a minor mitigation zone around 0.3188, which is holding strong.Current Price: 0.3176 (printing a red continuation candle).
1
51
·
--
🟢 $BNB /USDT – Bullish Setup
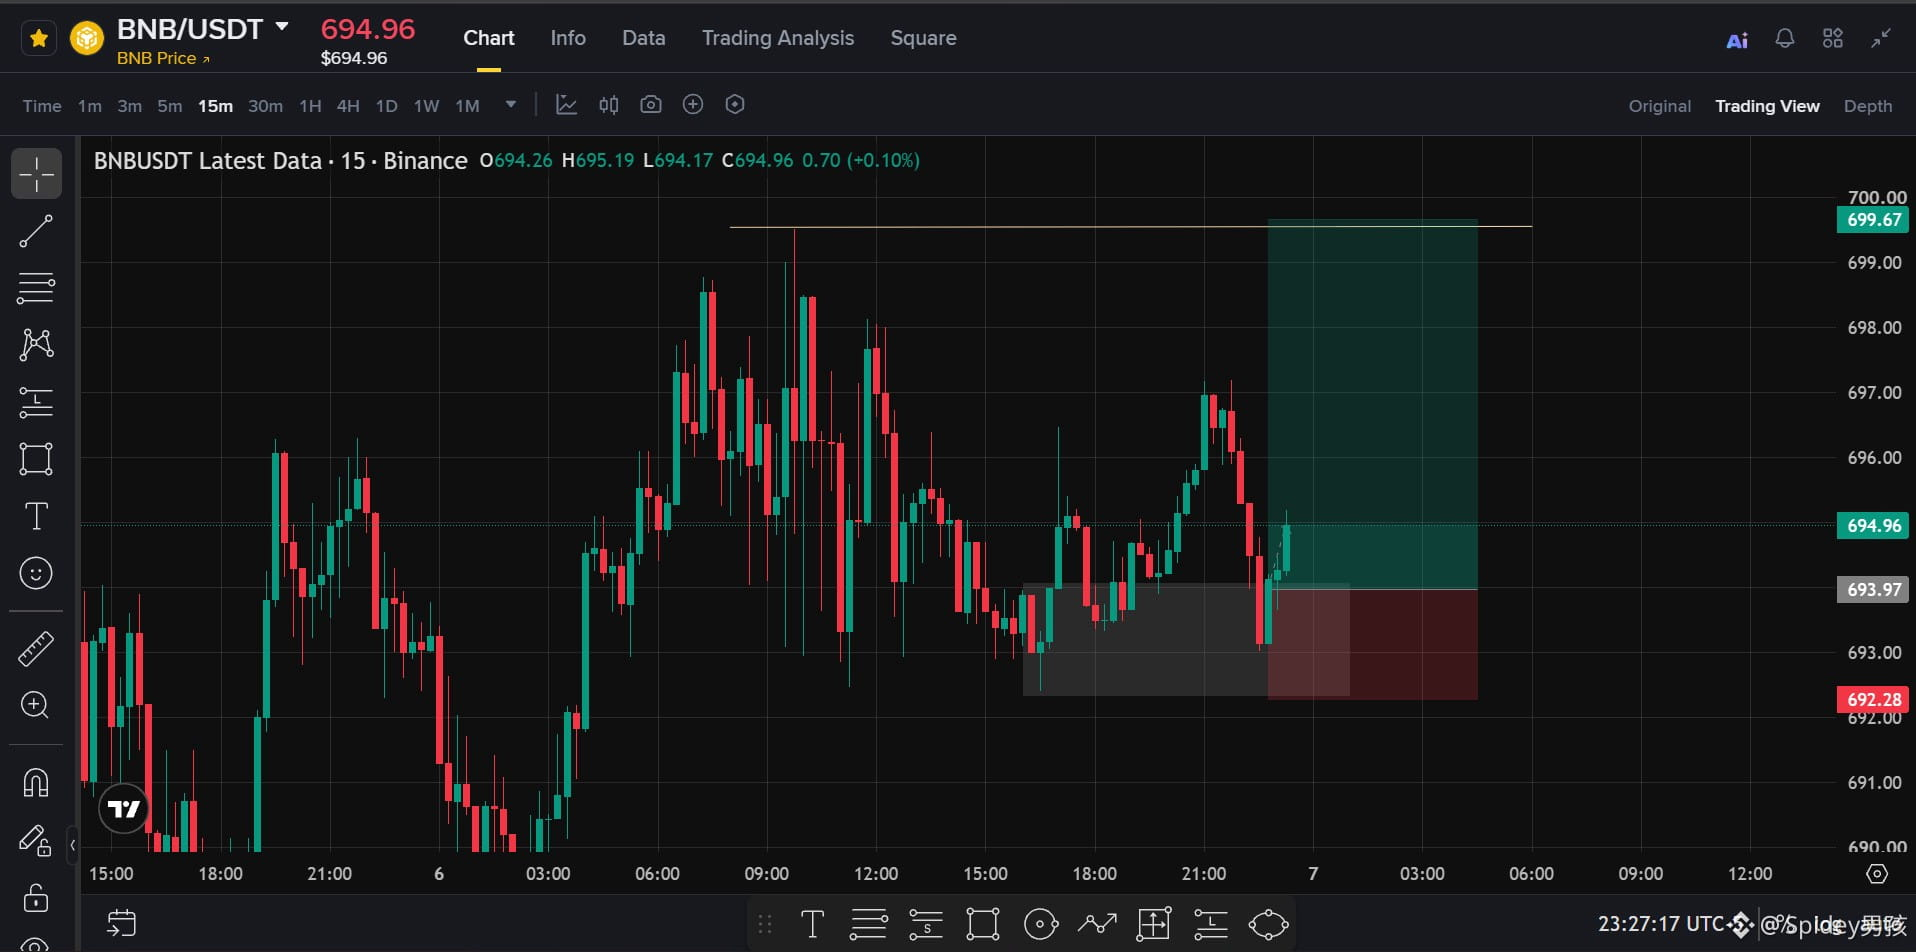
BNB is showing a recovery from the $693 support zone. Buyers are stepping in, with potential upside towards $697 and $699.67.
🎯 Target: $699.67
🛑 Stop Loss: $692.28
📍 Entry: $693.97
Watching for bullish continuation. Stay disciplined and manage risk. 📈
#BNB
#BNBUSDT #CryptoTrading #Binance
🟢 $BNB /USDT – Bullish Setup
BNB is showing a recovery from the $693 support zone. Buyers are stepping in, with potential upside towards $697 and $699.67.
🎯 Target: $699.67
🛑 Stop Loss: $692.28
📍 Entry: $693.97
Watching for bullish continuation. Stay disciplined and manage risk. 📈
#BNB
#BNBUSDT #CryptoTrading #Binance
BNB is showing a recovery from the $693 support zone. Buyers are stepping in, with potential upside towards $697 and $699.67.
🎯 Target: $699.67
🛑 Stop Loss: $692.28
📍 Entry: $693.97
Watching for bullish continuation. Stay disciplined and manage risk. 📈
#BNB
#BNBUSDT #CryptoTrading #Binance
1
85
·
--
📐 TECHNICAL MAP: $LINK
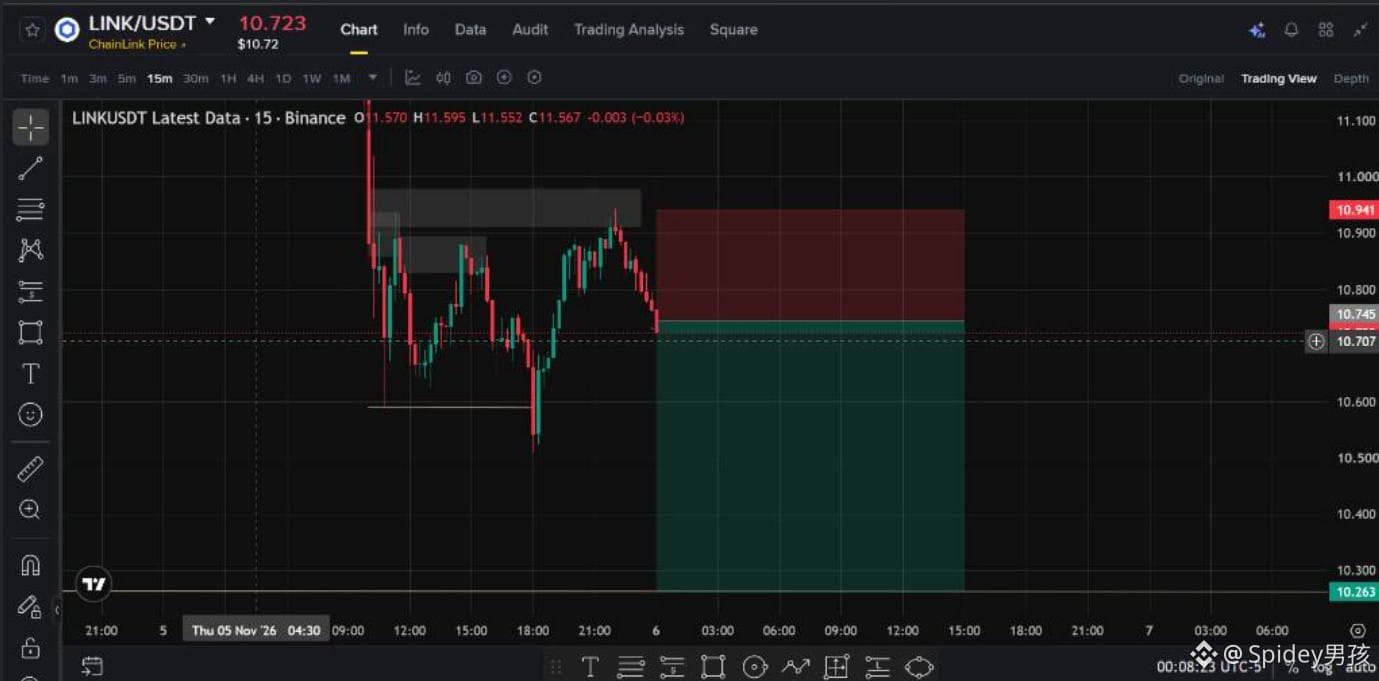
[IN] 📥 Entry Range: 10.745
[OUT] 🛑 Stop Loss: 10.941
[TARGET] 🎯 Take Profit: 10.263
Local resistance area distribution complete ho chuki hai, now looking for clean expansion down towards the primary support liquidity zone.
⚠️ DYOR ALERT: Crypto markets are highly volatile. Trade at your own risk. This is strictly for educational analysis.
📐 TECHNICAL MAP: $LINK
[IN] 📥 Entry Range: 10.745
[OUT] 🛑 Stop Loss: 10.941
[TARGET] 🎯 Take Profit: 10.263
Local resistance area distribution complete ho chuki hai, now looking for clean expansion down towards the primary support liquidity zone.
⚠️ DYOR ALERT: Crypto markets are highly volatile. Trade at your own risk. This is strictly for educational analysis.
[IN] 📥 Entry Range: 10.745
[OUT] 🛑 Stop Loss: 10.941
[TARGET] 🎯 Take Profit: 10.263
Local resistance area distribution complete ho chuki hai, now looking for clean expansion down towards the primary support liquidity zone.
⚠️ DYOR ALERT: Crypto markets are highly volatile. Trade at your own risk. This is strictly for educational analysis.
1
71
·
--
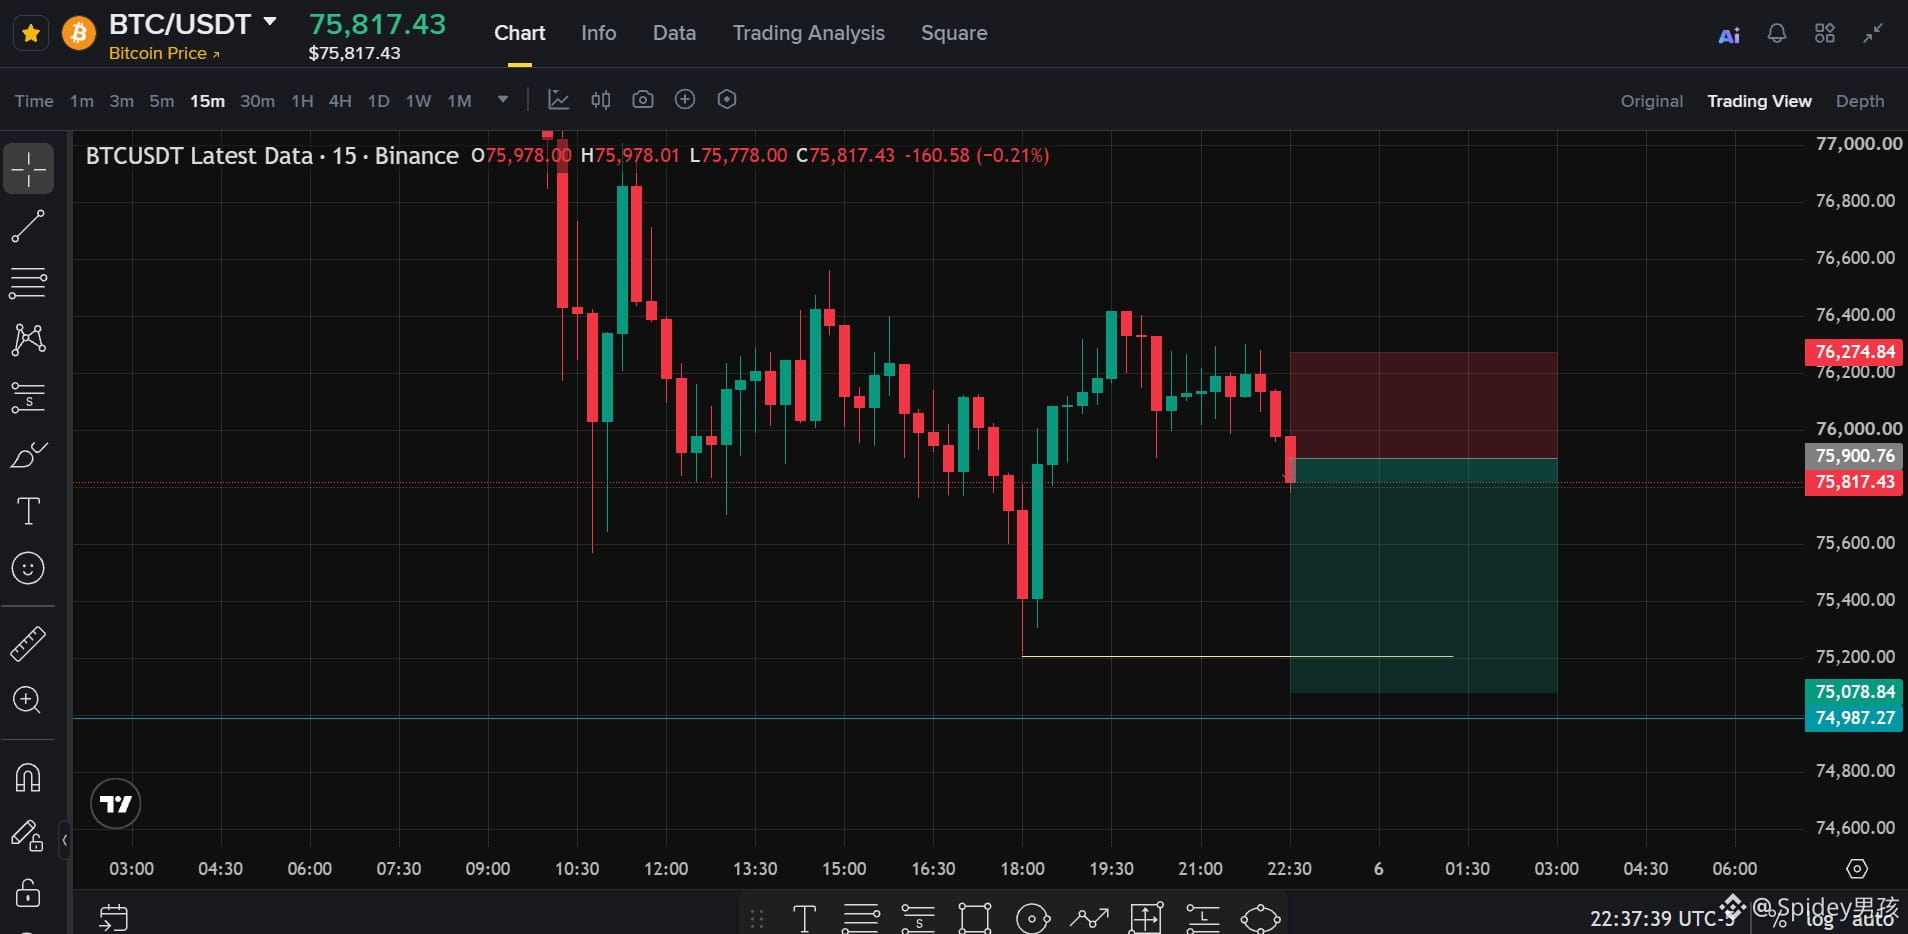
$BTC BEARS ARE TAKING CONTROL! 🔴
BTC/USDT – Short Setup
Entry: $75,900 – $76,000
TP1: $75,200
TP2: $75,079
TP3: $74,987
SL: $76,275
BTC is showing bearish momentum after failing to hold above the $76K zone. Sellers are pushing price lower, with downside liquidity near $75K becoming the next area of interest.
I'll be watching for a clean continuation rather than chasing the move.
Stay disciplined. Manage your risk.
#BTC #Bitcoin #CryptoTrading #Binance #SMC
$BTC BEARS ARE TAKING CONTROL! 🔴
BTC/USDT – Short Setup
Entry: $75,900 – $76,000
TP1: $75,200
TP2: $75,079
TP3: $74,987
SL: $76,275
BTC is showing bearish momentum after failing to hold above the $76K zone. Sellers are pushing price lower, with downside liquidity near $75K becoming the next area of interest.
I'll be watching for a clean continuation rather than chasing the move.
Stay disciplined. Manage your risk.
#BTC #Bitcoin #CryptoTrading #Binance #SMC
BTC/USDT – Short Setup
Entry: $75,900 – $76,000
TP1: $75,200
TP2: $75,079
TP3: $74,987
SL: $76,275
BTC is showing bearish momentum after failing to hold above the $76K zone. Sellers are pushing price lower, with downside liquidity near $75K becoming the next area of interest.
I'll be watching for a clean continuation rather than chasing the move.
Stay disciplined. Manage your risk.
#BTC #Bitcoin #CryptoTrading #Binance #SMC
1
75
·
--
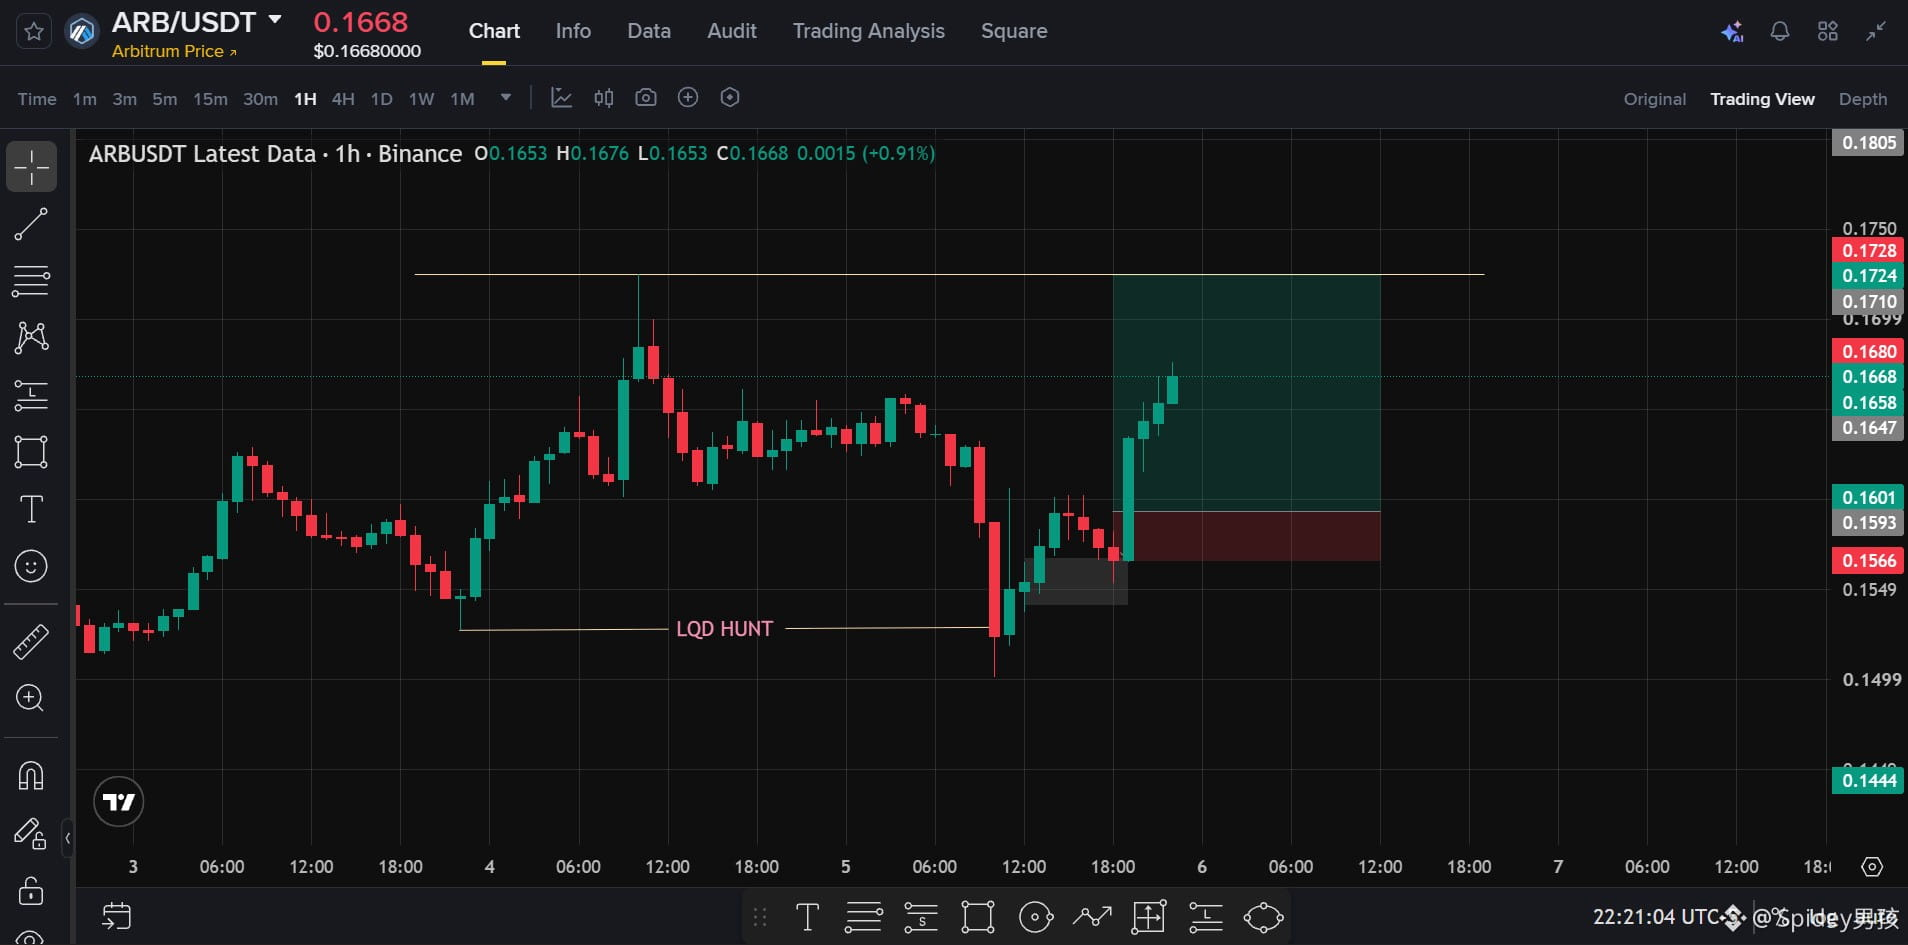
$ARB IS SHOWING SIGNS OF A BULLISH REVERSAL! 🟢
Long Setup – ARB/USDT
Entry: $0.1593 – $0.1601
TP1: $0.1680
TP2: $0.1710
TP3: $0.1728
SL: $0.1566
Liquidity sweep below previous lows followed by strong bullish displacement. Buyers are stepping in with momentum. Watching for continuation toward the $0.1728 liquidity zone.
No chasing — let the setup play out.
#ARB #CryptoTrading #Binance #SMC #Altcoins
$ARB IS SHOWING SIGNS OF A BULLISH REVERSAL! 🟢
Long Setup – ARB/USDT
Entry: $0.1593 – $0.1601
TP1: $0.1680
TP2: $0.1710
TP3: $0.1728
SL: $0.1566
Liquidity sweep below previous lows followed by strong bullish displacement. Buyers are stepping in with momentum. Watching for continuation toward the $0.1728 liquidity zone.
No chasing — let the setup play out.
#ARB #CryptoTrading #Binance #SMC #Altcoins
Long Setup – ARB/USDT
Entry: $0.1593 – $0.1601
TP1: $0.1680
TP2: $0.1710
TP3: $0.1728
SL: $0.1566
Liquidity sweep below previous lows followed by strong bullish displacement. Buyers are stepping in with momentum. Watching for continuation toward the $0.1728 liquidity zone.
No chasing — let the setup play out.
#ARB #CryptoTrading #Binance #SMC #Altcoins
1
76
·
--
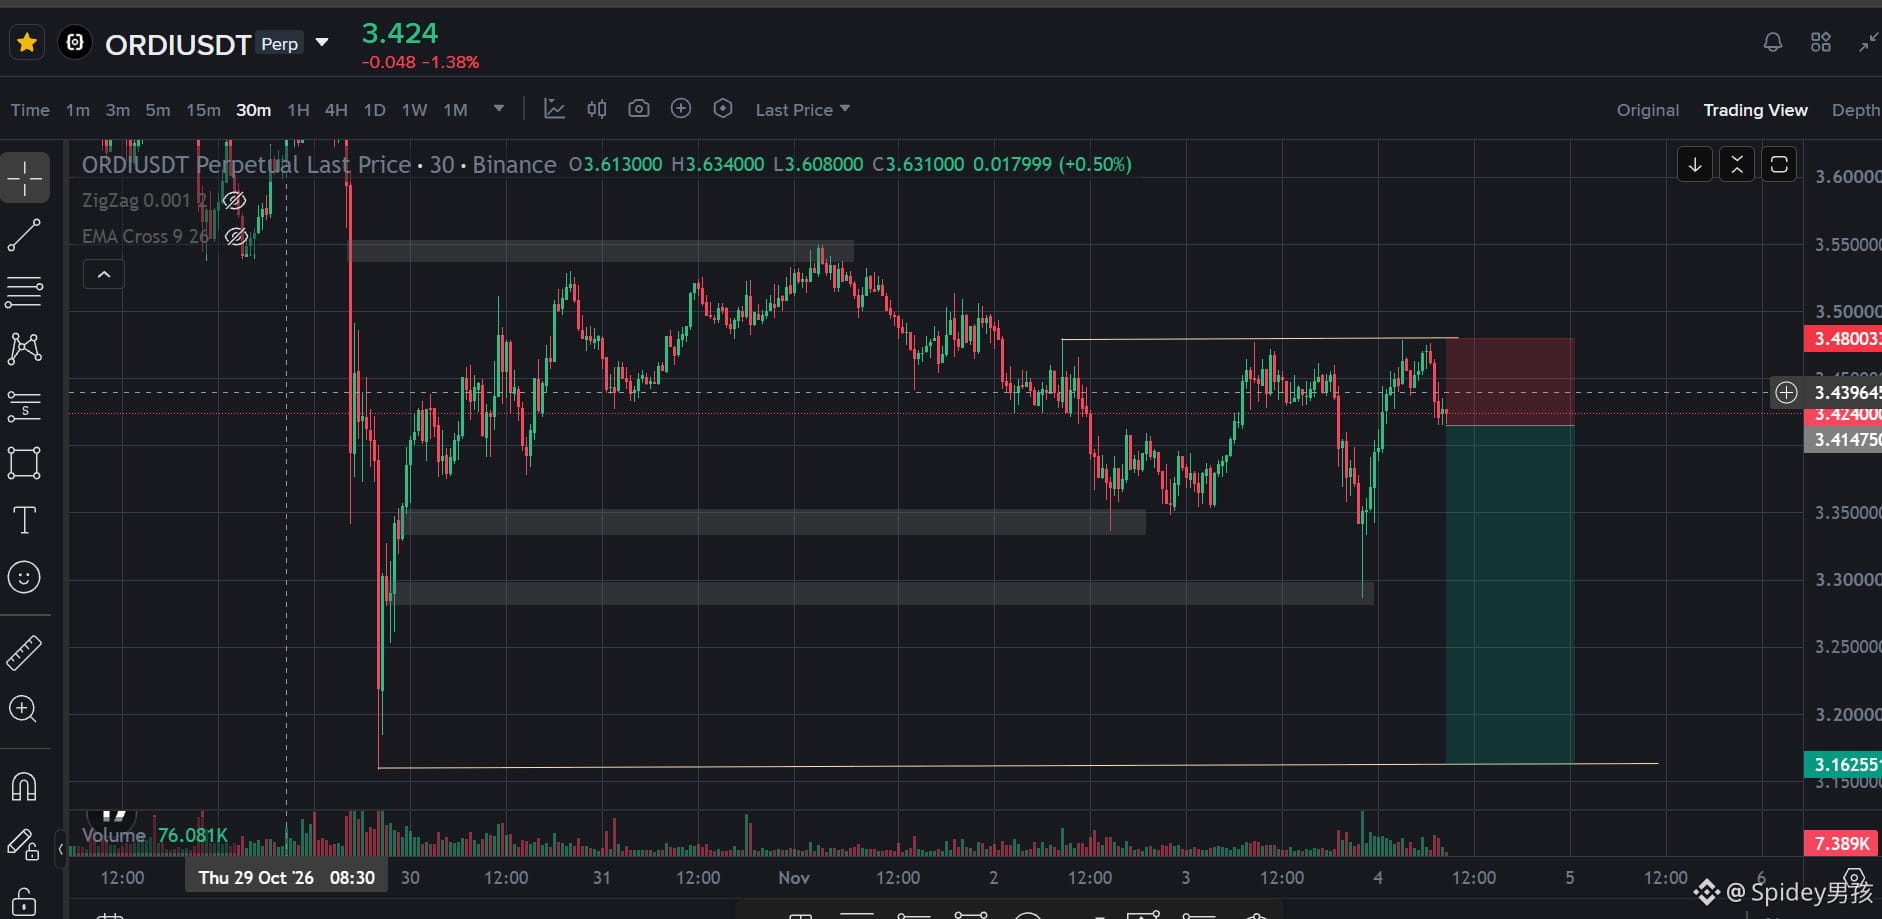
Thinking about $ORDI for the next major session transition... 👀
The lower timeframe structure is showing a clean rejection right beneath the current key resistance level after a sweep.
• Trigger Zone: 3.424
• Safety Invalidation (SL): 3.480
• Target Milestone (TP): 3.162
Let's watch how the structure unfolds over the next few H1 candle closes! 📉
⚠️ DYOR ALERT: Crypto markets are highly volatile. Trade at your own risk. This is strictly for educational analysis.
🔗 Inviting you to join my group 🕷️ SPIDY'S RADAR PREMIUM HUB:binance.com
(This is a premium subscription channel where highly accurate A+ setups are shared regularly!)
#spideyradar #spidyboi #ORDI
#TechnicalAnalysis
Thinking about $ORDI for the next major session transition... 👀
The lower timeframe structure is showing a clean rejection right beneath the current key resistance level after a sweep.
• Trigger Zone: 3.424
• Safety Invalidation (SL): 3.480
• Target Milestone (TP): 3.162
Let's watch how the structure unfolds over the next few H1 candle closes! 📉
⚠️ DYOR ALERT: Crypto markets are highly volatile. Trade at your own risk. This is strictly for educational analysis.
🔗 Inviting you to join my group 🕷️ SPIDY'S RADAR PREMIUM HUB:binance.com
(This is a premium subscription channel where highly accurate A+ setups are shared regularly!)
#spideyradar #spidyboi #ORDI
#TechnicalAnalysis
The lower timeframe structure is showing a clean rejection right beneath the current key resistance level after a sweep.
• Trigger Zone: 3.424
• Safety Invalidation (SL): 3.480
• Target Milestone (TP): 3.162
Let's watch how the structure unfolds over the next few H1 candle closes! 📉
⚠️ DYOR ALERT: Crypto markets are highly volatile. Trade at your own risk. This is strictly for educational analysis.
🔗 Inviting you to join my group 🕷️ SPIDY'S RADAR PREMIUM HUB:binance.com
(This is a premium subscription channel where highly accurate A+ setups are shared regularly!)
#spideyradar #spidyboi #ORDI
#TechnicalAnalysis
1
113
·
--
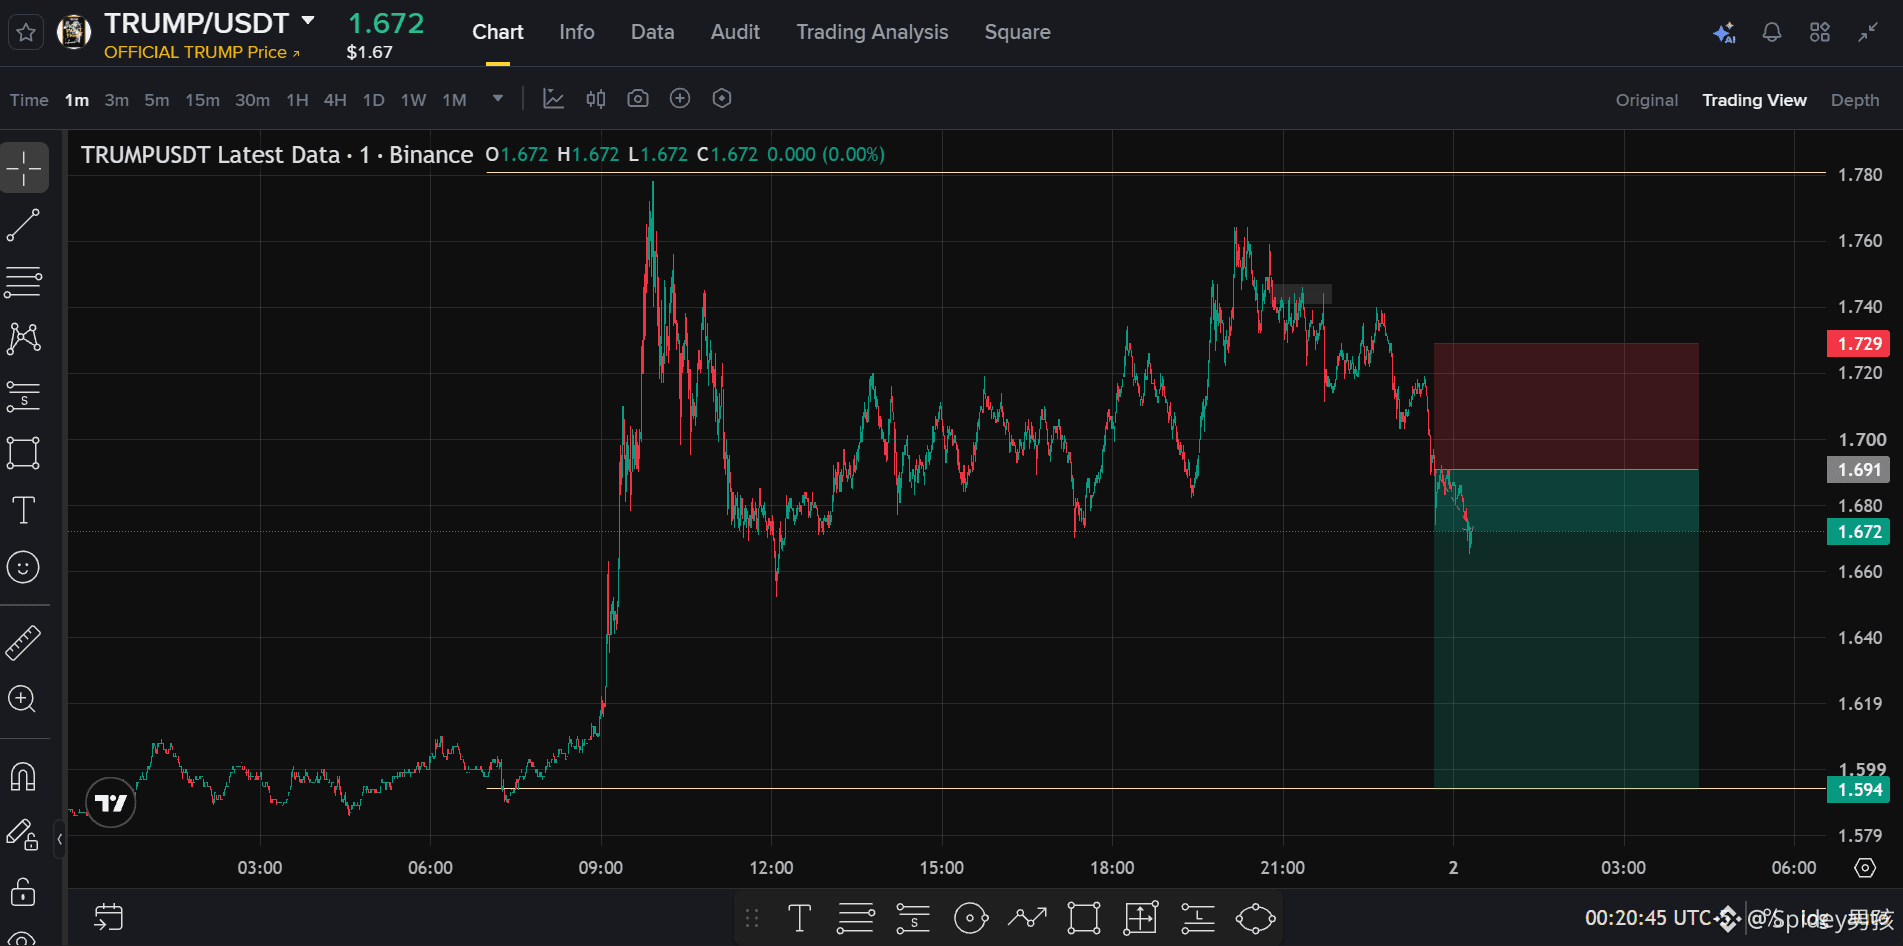
⚡ $TRUMP /USDT Trade Execution Strategy ⚡
• Trigger Zone: 1.691
• Safety Invalidation (SL): 1.729
• Target Milestone (TP): 1.594
Market structure looks solid on the short side. Manage your risk properly.
⚠️ DYOR ALERT: Crypto markets are highly volatile. Trade at your own risk. This is strictly for educational analysis.
🔗 Inviting you to join my group 🕷️ SPIDY'S RADAR PREMIUM HUB:binance.com
(This is a premium subscription channel where highly accurate A+ setups are shared regularly!)
#spideyradar #spidyboi #TRUMP #Altcoins #TechnicalAnalysis
⚡ $TRUMP /USDT Trade Execution Strategy ⚡
• Trigger Zone: 1.691
• Safety Invalidation (SL): 1.729
• Target Milestone (TP): 1.594
Market structure looks solid on the short side. Manage your risk properly.
⚠️ DYOR ALERT: Crypto markets are highly volatile. Trade at your own risk. This is strictly for educational analysis.
🔗 Inviting you to join my group 🕷️ SPIDY'S RADAR PREMIUM HUB:binance.com
(This is a premium subscription channel where highly accurate A+ setups are shared regularly!)
#spideyradar #spidyboi #TRUMP #Altcoins #TechnicalAnalysis
• Trigger Zone: 1.691
• Safety Invalidation (SL): 1.729
• Target Milestone (TP): 1.594
Market structure looks solid on the short side. Manage your risk properly.
⚠️ DYOR ALERT: Crypto markets are highly volatile. Trade at your own risk. This is strictly for educational analysis.
🔗 Inviting you to join my group 🕷️ SPIDY'S RADAR PREMIUM HUB:binance.com
(This is a premium subscription channel where highly accurate A+ setups are shared regularly!)
#spideyradar #spidyboi #TRUMP #Altcoins #TechnicalAnalysis
1
42
·
--
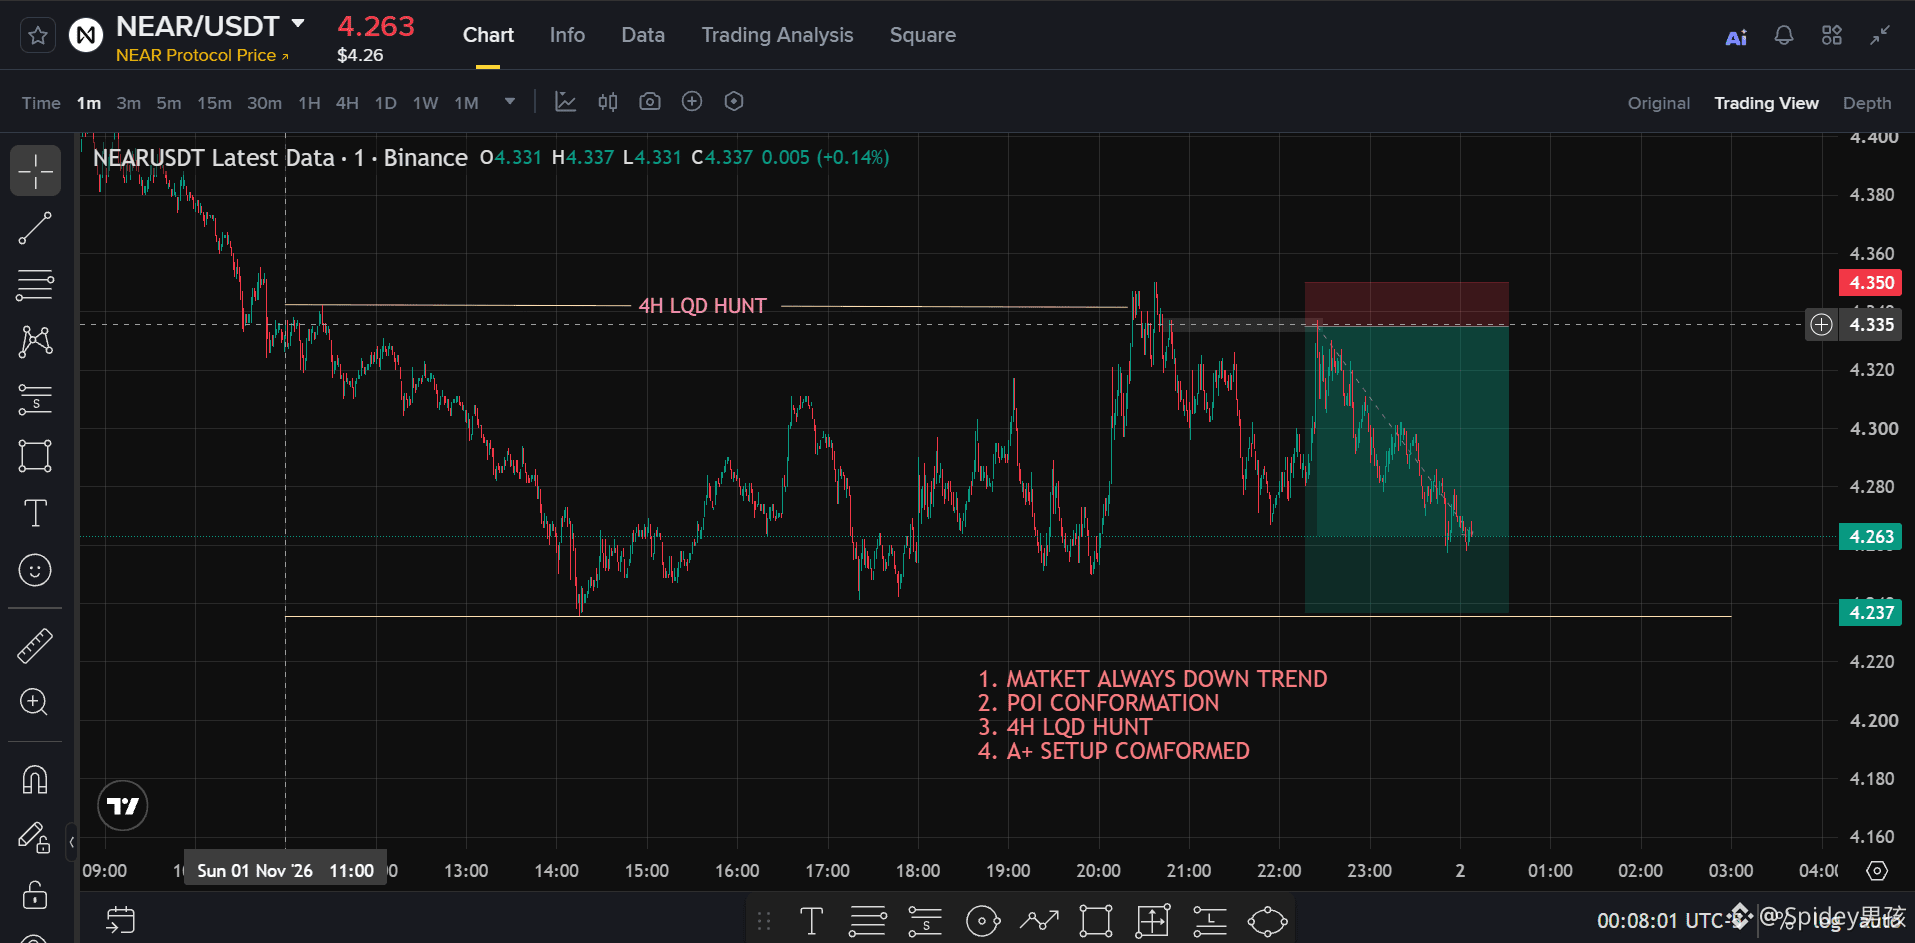
The green and red overlay represents a short position risk-to-reward projection:
Current Price: $4.263 (reflecting a gain of +0.14% on the localized candle).Entry Zone / Invalidations: The short was initiated following the liquidity hunt rejection near $4.335, aiming for a stop loss slightly above the local swing high at $4.350.Take Profit Target: The target level rests lower in the market structure, aligned near the horizontal support line visible around the $4.237 mark.
The green and red overlay represents a short position risk-to-reward projection:
Current Price: $4.263 (reflecting a gain of +0.14% on the localized candle).Entry Zone / Invalidations: The short was initiated following the liquidity hunt rejection near $4.335, aiming for a stop loss slightly above the local swing high at $4.350.Take Profit Target: The target level rests lower in the market structure, aligned near the horizontal support line visible around the $4.237 mark.
Current Price: $4.263 (reflecting a gain of +0.14% on the localized candle).Entry Zone / Invalidations: The short was initiated following the liquidity hunt rejection near $4.335, aiming for a stop loss slightly above the local swing high at $4.350.Take Profit Target: The target level rests lower in the market structure, aligned near the horizontal support line visible around the $4.237 mark.
1
43
·
--
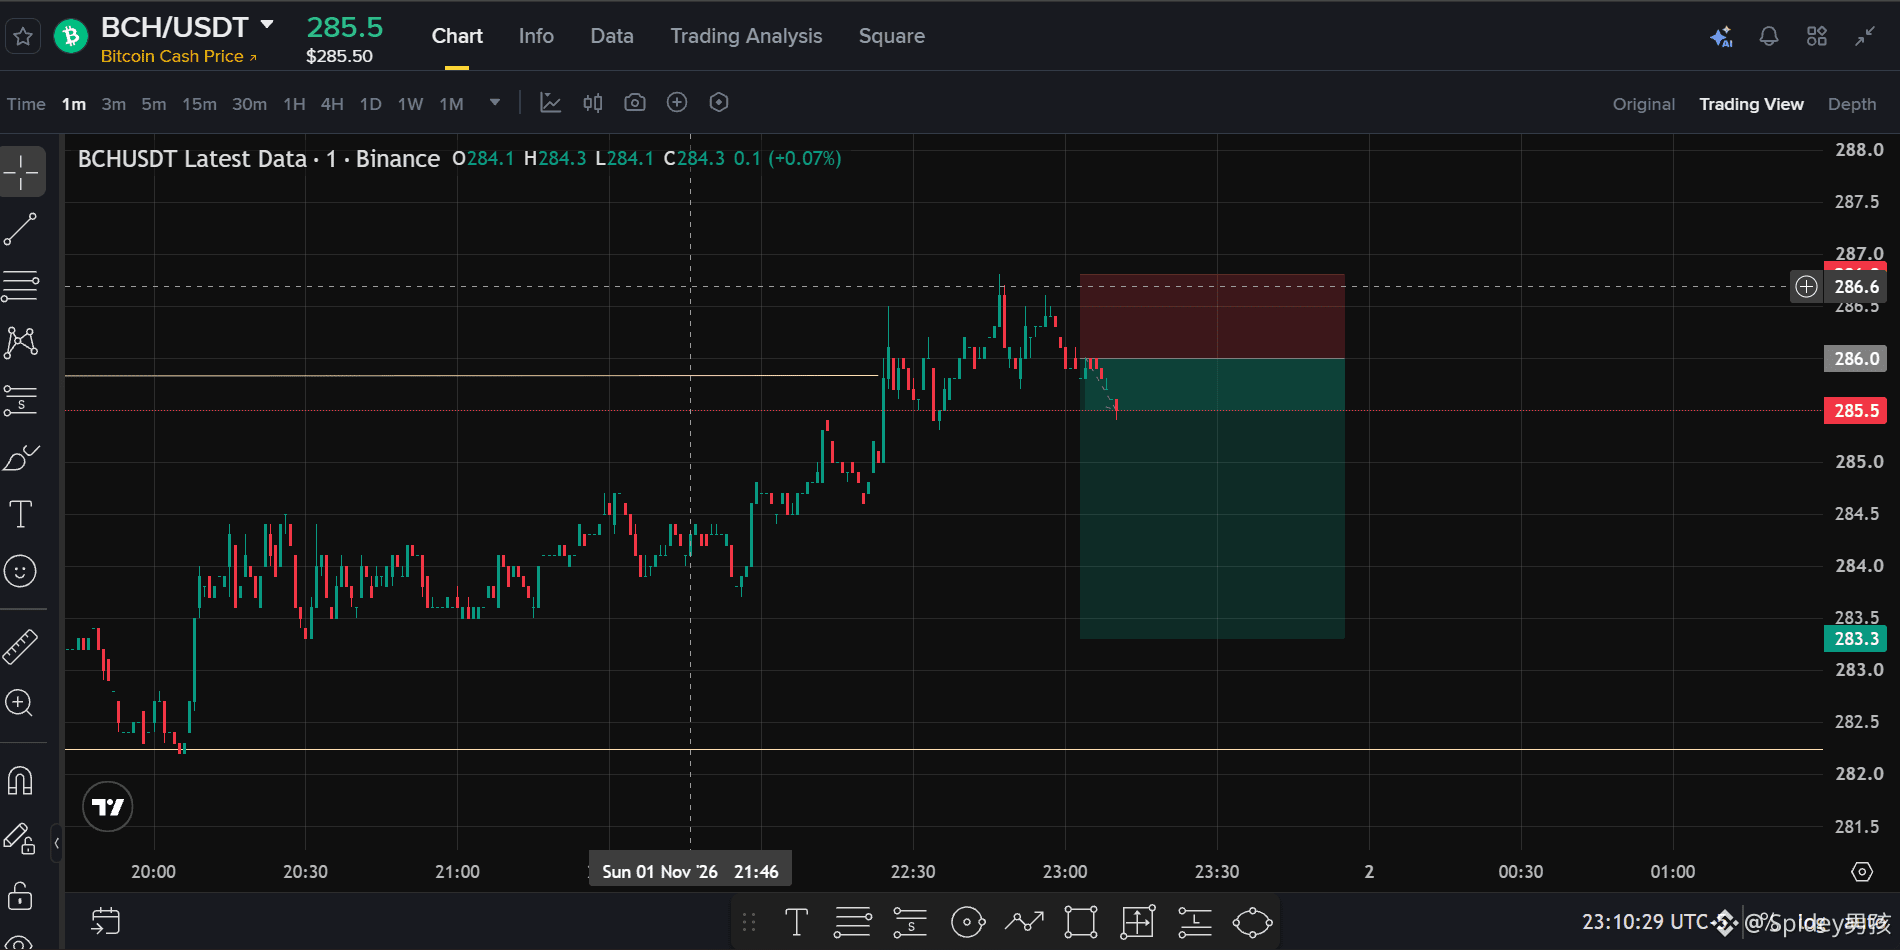
🏹 $BCH Trade Target Hunting
• Execution Point: 286.0
• Defense Line (SL): 286.6
• Final Destination (TP): 283.3
Riding the macro trend till downside liquidity is fully purged.
⚠️ DYOR ALERT: Crypto markets are highly volatile. Trade at your own risk. This is strictly for educational analysis.
🔗 Inviting you to join my group 🕷️ SPIDY'S RADAR PREMIUM HUB:binance.com
(This is a premium subscription channel where highly accurate A+ setups are shared regularly!)
#spideyradar #spidyboi #BCH #CryptoTrading #WhaleTracker
🏹 $BCH Trade Target Hunting
• Execution Point: 286.0
• Defense Line (SL): 286.6
• Final Destination (TP): 283.3
Riding the macro trend till downside liquidity is fully purged.
⚠️ DYOR ALERT: Crypto markets are highly volatile. Trade at your own risk. This is strictly for educational analysis.
🔗 Inviting you to join my group 🕷️ SPIDY'S RADAR PREMIUM HUB:binance.com
(This is a premium subscription channel where highly accurate A+ setups are shared regularly!)
#spideyradar #spidyboi #BCH #CryptoTrading #WhaleTracker
• Execution Point: 286.0
• Defense Line (SL): 286.6
• Final Destination (TP): 283.3
Riding the macro trend till downside liquidity is fully purged.
⚠️ DYOR ALERT: Crypto markets are highly volatile. Trade at your own risk. This is strictly for educational analysis.
🔗 Inviting you to join my group 🕷️ SPIDY'S RADAR PREMIUM HUB:binance.com
(This is a premium subscription channel where highly accurate A+ setups are shared regularly!)
#spideyradar #spidyboi #BCH #CryptoTrading #WhaleTracker
1
42
·
--
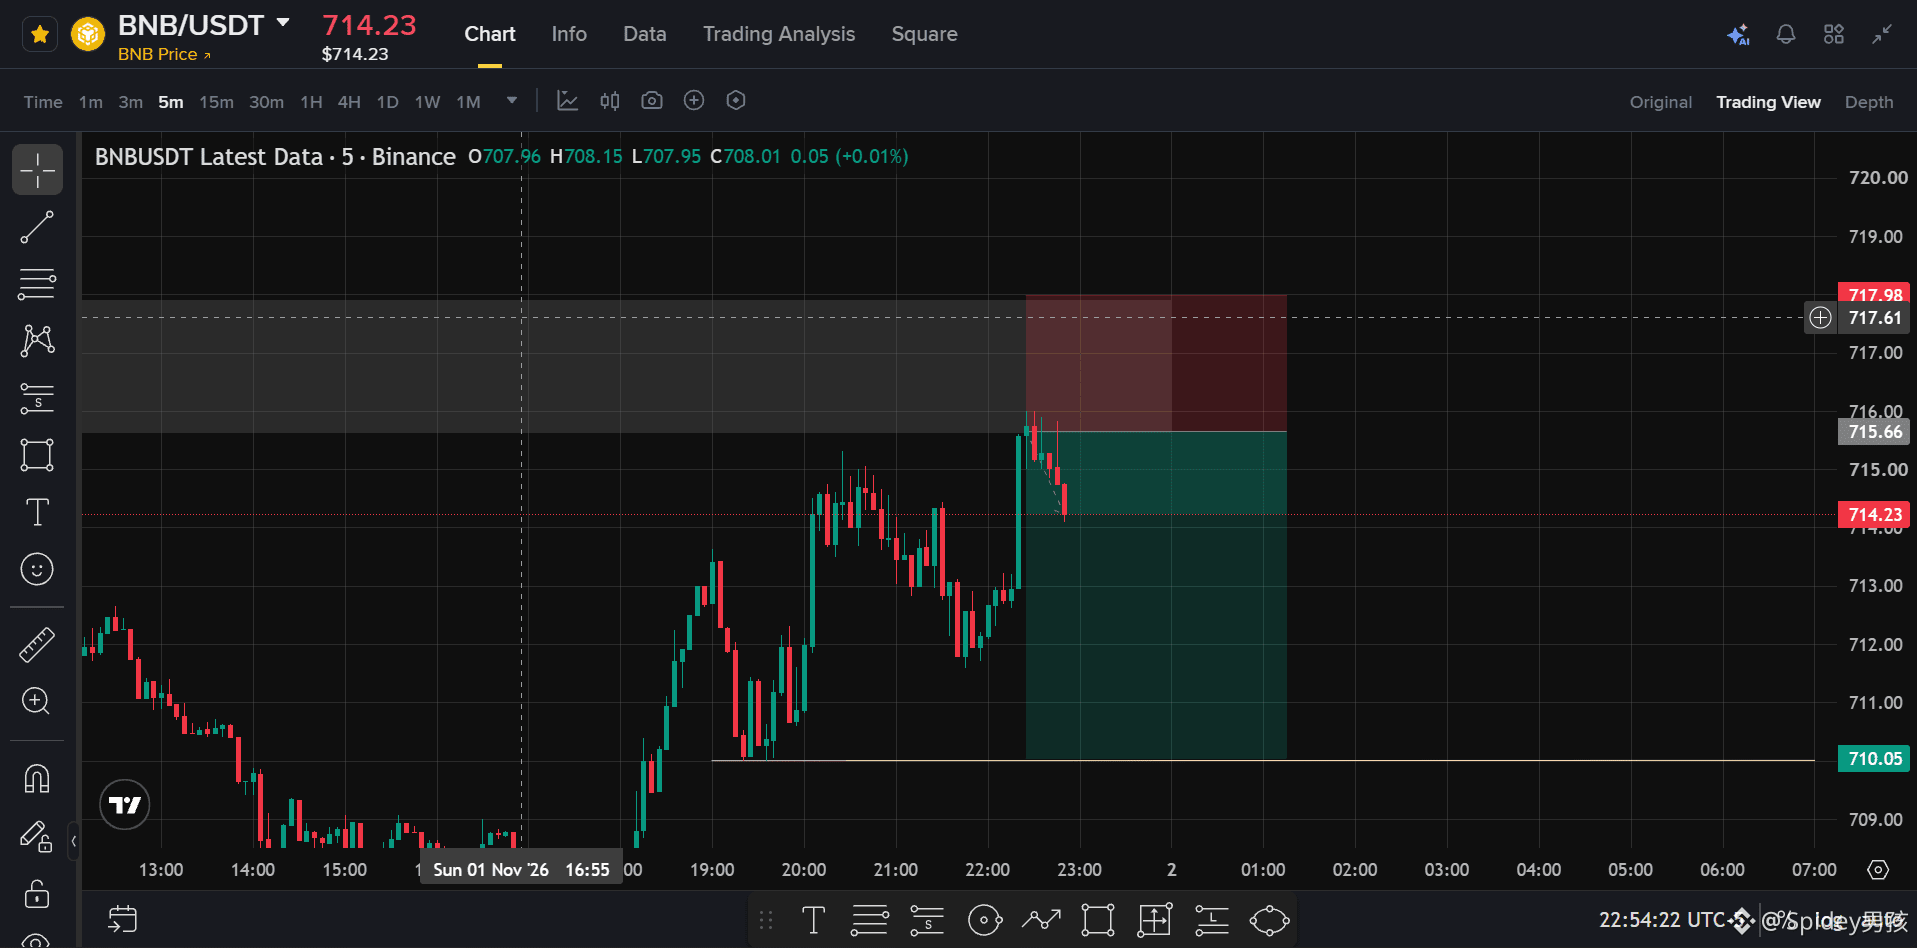
📉 Setup: $BNB
• Entry 👉 715.66
• SL 👉 717.98
• TP 👉 710.05
Strictly following the current session order flow and resistance block. 🕒
⚠️ DYOR ALERT: Crypto markets are highly volatile. Trade at your own risk. This is strictly for educational analysis.
🔗 Inviting you to join my group 🕷️ SPIDY'S RADAR PREMIUM HUB:binance.com
(This is a premium subscription channel where highly accurate A+ setups are shared regularly!)
#spideyradar #spidyboi #BNB #CryptoMarket #PriceAction
📉 Setup: $BNB
• Entry 👉 715.66
• SL 👉 717.98
• TP 👉 710.05
Strictly following the current session order flow and resistance block. 🕒
⚠️ DYOR ALERT: Crypto markets are highly volatile. Trade at your own risk. This is strictly for educational analysis.
🔗 Inviting you to join my group 🕷️ SPIDY'S RADAR PREMIUM HUB:binance.com
(This is a premium subscription channel where highly accurate A+ setups are shared regularly!)
#spideyradar #spidyboi #BNB #CryptoMarket #PriceAction
• Entry 👉 715.66
• SL 👉 717.98
• TP 👉 710.05
Strictly following the current session order flow and resistance block. 🕒
⚠️ DYOR ALERT: Crypto markets are highly volatile. Trade at your own risk. This is strictly for educational analysis.
🔗 Inviting you to join my group 🕷️ SPIDY'S RADAR PREMIUM HUB:binance.com
(This is a premium subscription channel where highly accurate A+ setups are shared regularly!)
#spideyradar #spidyboi #BNB #CryptoMarket #PriceAction
1
67
·
--
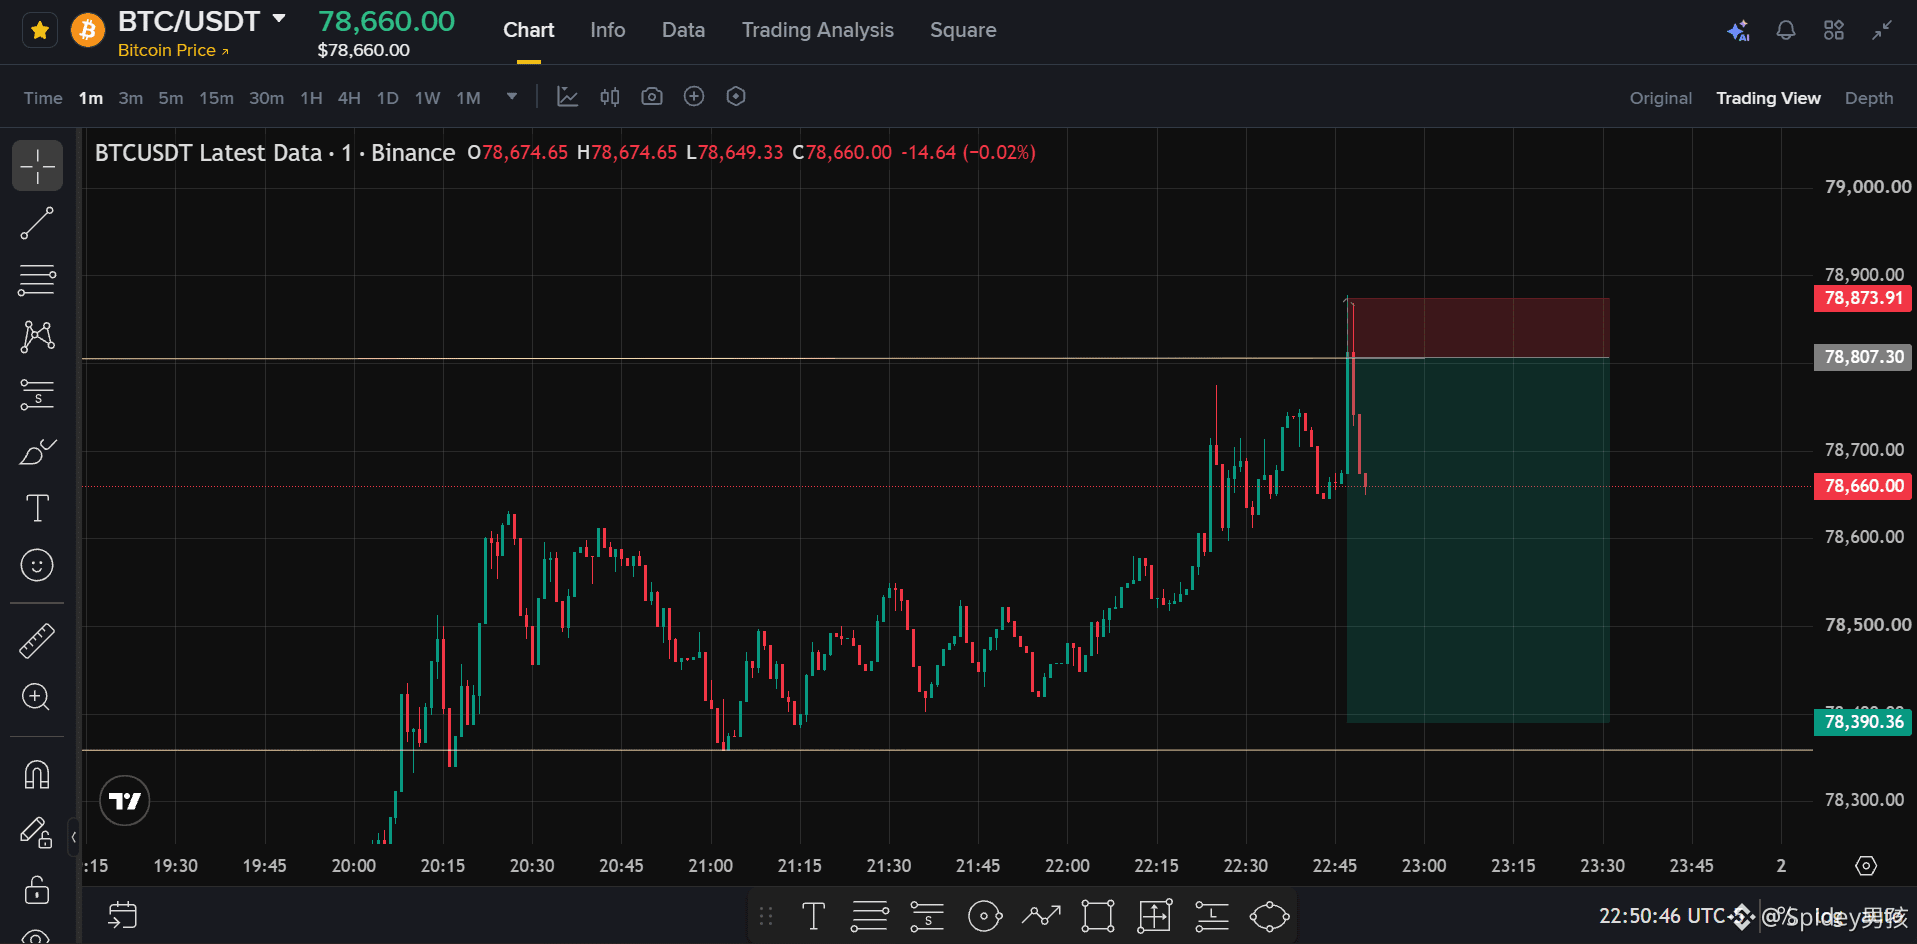
⚠️ CRITICAL LEVELS: $BTC/USDT ⚠️
1️⃣ Order Trigger (Entry): 78,807.30
2️⃣ Exit On Wrong Move (SL): 78,873.91
3️⃣ Profit Objective (TP): 78,390.36
Always wait for candle closing confirmation before diving in!
⚠️ DYOR ALERT: Crypto markets are highly volatile. Trade at your own risk. This is strictly for educational analysis.
🔗 Inviting you to join my group 🕷️ SPIDY'S RADAR PREMIUM HUB:binance.com
(This is a premium subscription channel where highly accurate A+ setups are shared regularly!)
#spideyradar #spidyboi #BTC #CryptoTrading #WhaleWatch
⚠️ CRITICAL LEVELS: $BTC/USDT ⚠️
1️⃣ Order Trigger (Entry): 78,807.30
2️⃣ Exit On Wrong Move (SL): 78,873.91
3️⃣ Profit Objective (TP): 78,390.36
Always wait for candle closing confirmation before diving in!
⚠️ DYOR ALERT: Crypto markets are highly volatile. Trade at your own risk. This is strictly for educational analysis.
🔗 Inviting you to join my group 🕷️ SPIDY'S RADAR PREMIUM HUB:binance.com
(This is a premium subscription channel where highly accurate A+ setups are shared regularly!)
#spideyradar #spidyboi #BTC #CryptoTrading #WhaleWatch
1️⃣ Order Trigger (Entry): 78,807.30
2️⃣ Exit On Wrong Move (SL): 78,873.91
3️⃣ Profit Objective (TP): 78,390.36
Always wait for candle closing confirmation before diving in!
⚠️ DYOR ALERT: Crypto markets are highly volatile. Trade at your own risk. This is strictly for educational analysis.
🔗 Inviting you to join my group 🕷️ SPIDY'S RADAR PREMIUM HUB:binance.com
(This is a premium subscription channel where highly accurate A+ setups are shared regularly!)
#spideyradar #spidyboi #BTC #CryptoTrading #WhaleWatch
1
79
Log in to explore more content
Join global crypto users on Binance Square
⚡️ Get latest and useful information about crypto.
💬 Trusted by the world’s largest crypto exchange.
👍 Discover real insights from verified creators.
Email / Phone number
Trending Topics
HuangExitNvidiaStrategyInFocus
20,356 views
511 Discussing
STOCKS | Nvidia’s Jensen Huang Resigns, Colette Kress Named as Interim CEO
Binance News
·13 Likes
·14.6k views
AnthropicRejectsIPODelayValuationinQuestion
586,796 views
4,880 Discussing
BitMineReports$6.3BNetLossForFiscal2026
2,955 views
77 Discussing