

Proekt_73
7.8k Posts

Proekt_73
 Square Verified+
Report
Block User
Мы в Twitter и др - @Proekt_73. Анализ крипторынка, новости, сделки с объяснением. Не даем финансовых рекомендаций, DYOR! Тупые комменты, "вангования" - бан
1 Following
51.2K+ Followers
117.0K+ Liked
Posts
All
Quotes
Videos
PINNED
·
--
Article
ATTENTION, COPYISTS who, together with us, were building a spot portfolio in October 2025ATTENTION, COPYISTS who, together with us, were building a spot portfolio in October 2025. We waited a long time for the opportunity to prepare this post
[https://www.binance.com/copy-trading/lead-details/4725495168516894721?ref=45164596](https://www.binance.com/copy-trading/lead-details/4725495168516894721?ref=45164596).
In our chat for copyists, we already received information about an important signal that we are now monitoring for ADDING to this portfolio.
ATTENTION, COPYISTS who, together with us, were building a spot portfolio in October 2025
ATTENTION, COPYISTS who, together with us, were building a spot portfolio in October 2025. We waited a long time for the opportunity to prepare this post
https://www.binance.com/copy-trading/lead-details/4725495168516894721?ref=45164596.
In our chat for copyists, we already received information about an important signal that we are now monitoring for ADDING to this portfolio.
https://www.binance.com/copy-trading/lead-details/4725495168516894721?ref=45164596.
In our chat for copyists, we already received information about an important signal that we are now monitoring for ADDING to this portfolio.
9
18
4.1k
·
--
Article
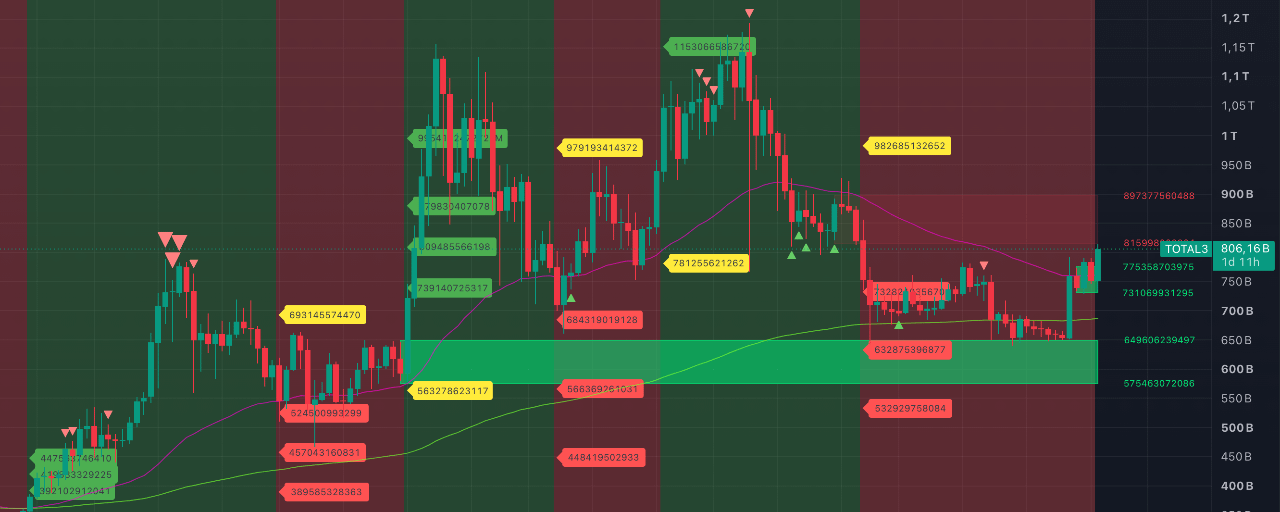
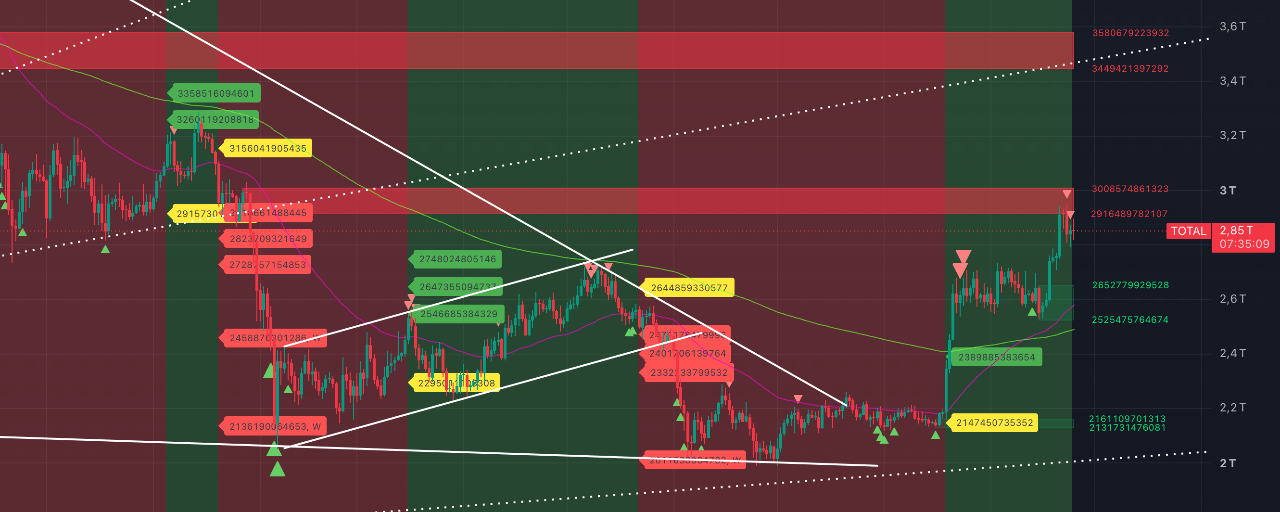
We remind you of the picture that is currently present on TOTAL, TOTAL2, TOTAL3, and OTHERS on the daily timeframeWe remind you of the picture that is currently present on TOTAL, TOTAL2, TOTAL3, and OTHERS on the daily timeframe. And, by the way, even on the capitalization of meme coins MEME.C.
On all of these charts of the crypto market’s capitalization, there are already two or three marks of a potential high on the daily timeframe. Where there are two—those were yesterday and the day before yesterday, and today the mark is no longer there. That means today’s candle is potentially the first one in a declining structure. Where there are three, it means today’s candle is still within an ascending structure. It’s interesting that there are three marks for TOTAL3 and OTHERS. Which, in the past, were always weaker than the main assets. On the other hand, the memes didn’t disappoint—MEME.C had only one mark of a potential high, and that’s where the correction started. Moreover, the meme market cap came down to the EMA 200 support level. And in a bullish scenario for the coming week (which we don’t expect)—from here it could continue to rise.
We remind you of the picture that is currently present on TOTAL, TOTAL2, TOTAL3, and OTHERS on the daily timeframe
We remind you of the picture that is currently present on TOTAL, TOTAL2, TOTAL3, and OTHERS on the daily timeframe. And, by the way, even on the capitalization of meme coins MEME.C.
On all of these charts of the crypto market’s capitalization, there are already two or three marks of a potential high on the daily timeframe. Where there are two—those were yesterday and the day before yesterday, and today the mark is no longer there. That means today’s candle is potentially the first one in a declining structure. Where there are three, it means today’s candle is still within an ascending structure. It’s interesting that there are three marks for TOTAL3 and OTHERS. Which, in the past, were always weaker than the main assets. On the other hand, the memes didn’t disappoint—MEME.C had only one mark of a potential high, and that’s where the correction started. Moreover, the meme market cap came down to the EMA 200 support level. And in a bullish scenario for the coming week (which we don’t expect)—from here it could continue to rise.
On all of these charts of the crypto market’s capitalization, there are already two or three marks of a potential high on the daily timeframe. Where there are two—those were yesterday and the day before yesterday, and today the mark is no longer there. That means today’s candle is potentially the first one in a declining structure. Where there are three, it means today’s candle is still within an ascending structure. It’s interesting that there are three marks for TOTAL3 and OTHERS. Which, in the past, were always weaker than the main assets. On the other hand, the memes didn’t disappoint—MEME.C had only one mark of a potential high, and that’s where the correction started. Moreover, the meme market cap came down to the EMA 200 support level. And in a bullish scenario for the coming week (which we don’t expect)—from here it could continue to rise.
1
17
5.4k
·
--
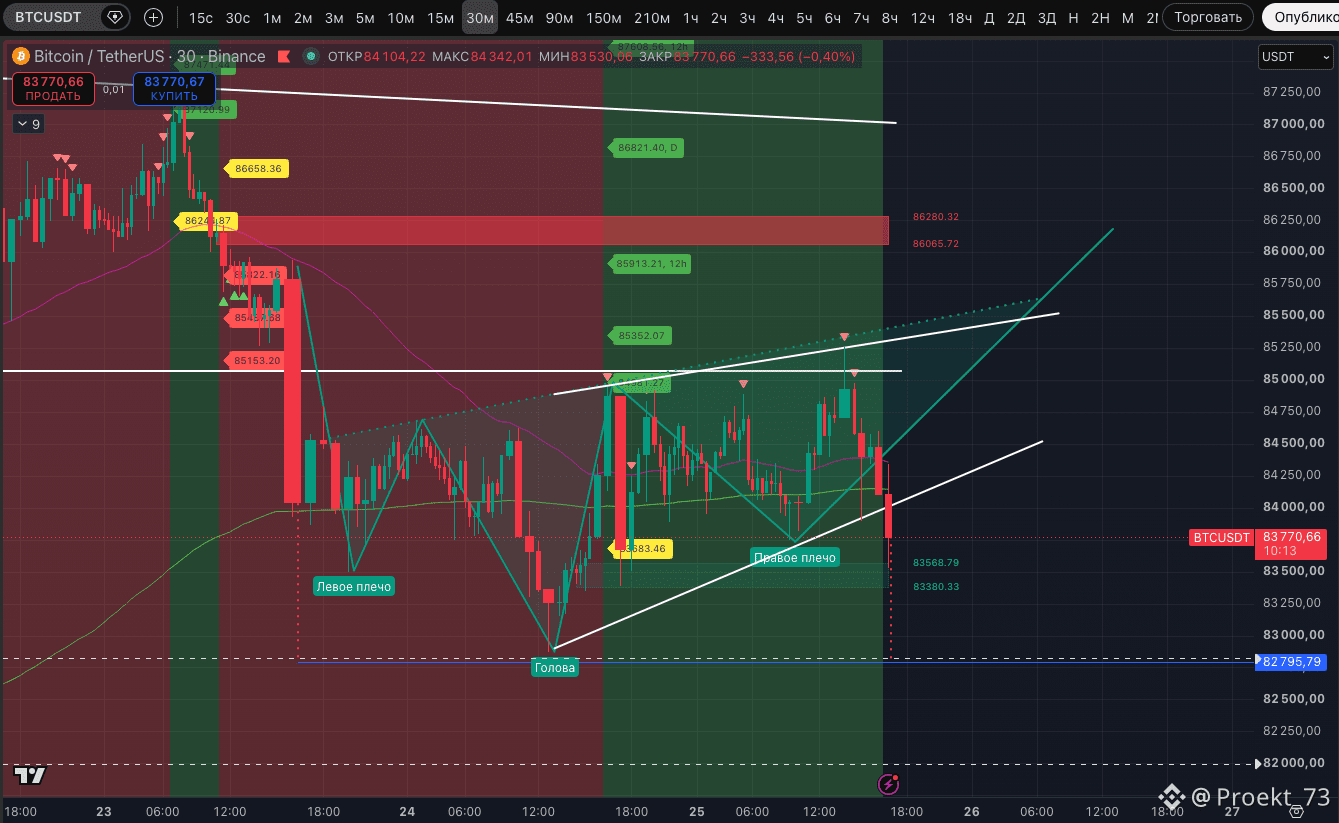
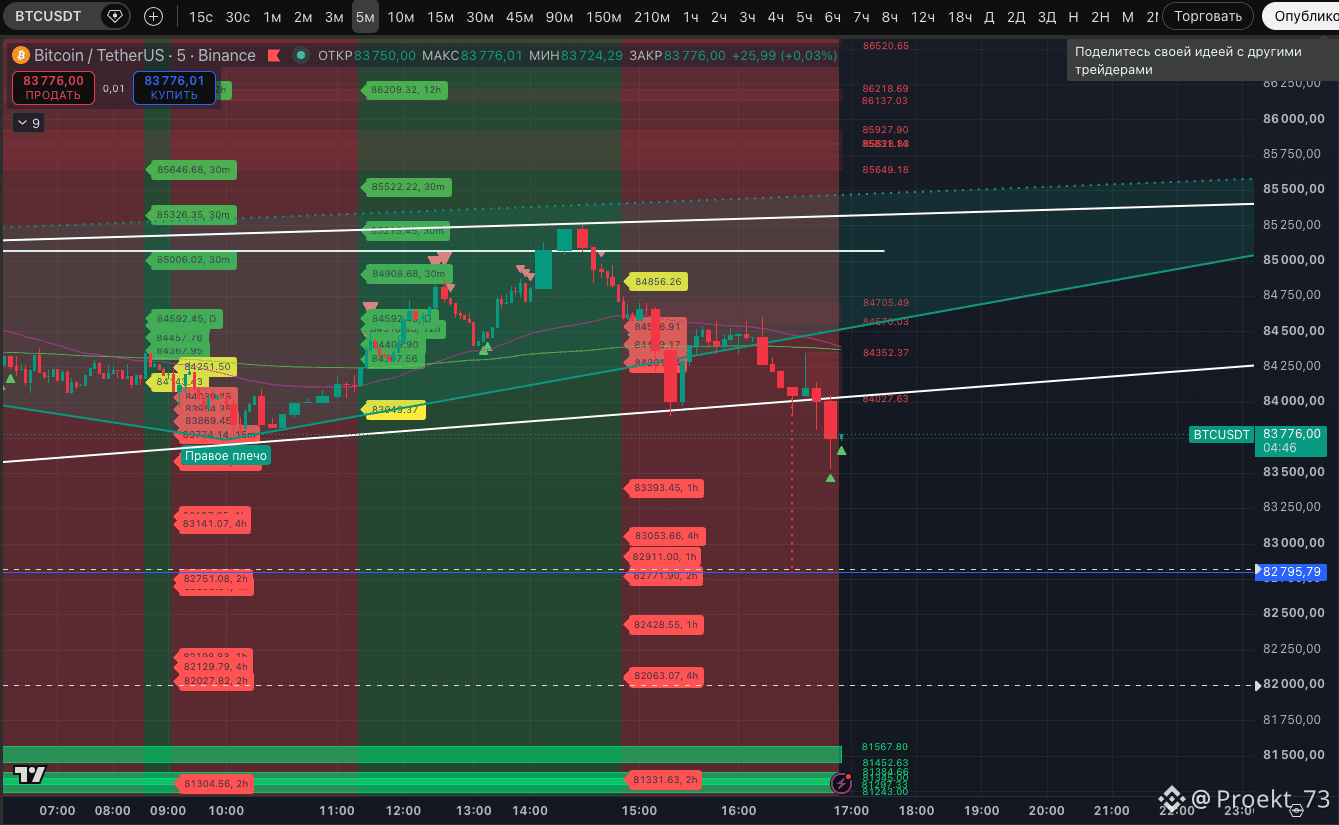
BTC formed a local "Bearish wedge" and started working through it. It’s amusing, but its target is roughly the same as the almost-completed target of the "Double top" at $82,795. The difference is minimal.
On the 30-minute timeframe, we see that for the fourth time already, as of September 23, the potential high markers on this timeframe have been perfectly worked out. We warned about these markers.
As a result, although the structure of rising lows and highs from yesterday’s low has not yet been broken—about the "bear trap" threatening the bulls, you can probably forget. And it’s more reasonable to talk either about a potential "Double bottom" or, alternatively, about the continuation of the decline.
For the bears, the key story is still the same: it’s necessary to break the sustained uptrends on the 30-minute and 45-minute timeframe. This will open the way to new lows.
While preparing the post, BTC showed a Strong signal for a potential low on the 5-minute timeframe (but in the end it did not hold at the candle close—this is very rare, but it does happen). Taking into account the liquidity zone test on the 30-minute timeframe, you can expect a move toward a retest of the breakout from the bearish pattern.
BTC formed a local "Bearish wedge" and started working through it. It’s amusing, but its target is roughly the same as the almost-completed target of the "Double top" at $82,795. The difference is minimal.
On the 30-minute timeframe, we see that for the fourth time already, as of September 23, the potential high markers on this timeframe have been perfectly worked out. We warned about these markers.
As a result, although the structure of rising lows and highs from yesterday’s low has not yet been broken—about the "bear trap" threatening the bulls, you can probably forget. And it’s more reasonable to talk either about a potential "Double bottom" or, alternatively, about the continuation of the decline.
For the bears, the key story is still the same: it’s necessary to break the sustained uptrends on the 30-minute and 45-minute timeframe. This will open the way to new lows.
While preparing the post, BTC showed a Strong signal for a potential low on the 5-minute timeframe (but in the end it did not hold at the candle close—this is very rare, but it does happen). Taking into account the liquidity zone test on the 30-minute timeframe, you can expect a move toward a retest of the breakout from the bearish pattern.
On the 30-minute timeframe, we see that for the fourth time already, as of September 23, the potential high markers on this timeframe have been perfectly worked out. We warned about these markers.
As a result, although the structure of rising lows and highs from yesterday’s low has not yet been broken—about the "bear trap" threatening the bulls, you can probably forget. And it’s more reasonable to talk either about a potential "Double bottom" or, alternatively, about the continuation of the decline.
For the bears, the key story is still the same: it’s necessary to break the sustained uptrends on the 30-minute and 45-minute timeframe. This will open the way to new lows.
While preparing the post, BTC showed a Strong signal for a potential low on the 5-minute timeframe (but in the end it did not hold at the candle close—this is very rare, but it does happen). Taking into account the liquidity zone test on the 30-minute timeframe, you can expect a move toward a retest of the breakout from the bearish pattern.
2
8
4.2k
·
--
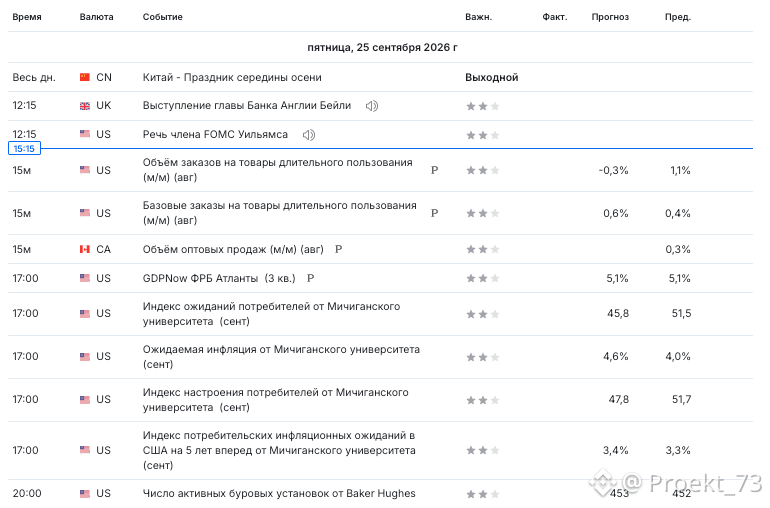
Important events for the crypto market on September 25 from the economic calendar.
Today is the key day of the week by macro data. And markets may start to “storm” already within this hour.
Schedule:
❗️- 15:30 Kyiv and Moscow time / 17:30 Astana time — Orders for durable goods and core durable goods orders in the US for August. Important for assessing business activity and demand conditions in the US economy.
❗️- 17:00 Kyiv and Moscow time / 19:00 Astana time — University of Michigan data block for September:
-- Expected inflation.
-- US consumer inflation expectations index for the next 5 years.
-- Consumer expectations index.
-- Consumer sentiment index.
This is an important set of figures for assessing inflation expectations and the mood of the American consumer.
Important events for the crypto market on September 25 from the economic calendar.
Today is the key day of the week by macro data. And markets may start to “storm” already within this hour.
Schedule:
❗️- 15:30 Kyiv and Moscow time / 17:30 Astana time — Orders for durable goods and core durable goods orders in the US for August. Important for assessing business activity and demand conditions in the US economy.
❗️- 17:00 Kyiv and Moscow time / 19:00 Astana time — University of Michigan data block for September:
-- Expected inflation.
-- US consumer inflation expectations index for the next 5 years.
-- Consumer expectations index.
-- Consumer sentiment index.
This is an important set of figures for assessing inflation expectations and the mood of the American consumer.
Today is the key day of the week by macro data. And markets may start to “storm” already within this hour.
Schedule:
❗️- 15:30 Kyiv and Moscow time / 17:30 Astana time — Orders for durable goods and core durable goods orders in the US for August. Important for assessing business activity and demand conditions in the US economy.
❗️- 17:00 Kyiv and Moscow time / 19:00 Astana time — University of Michigan data block for September:
-- Expected inflation.
-- US consumer inflation expectations index for the next 5 years.
-- Consumer expectations index.
-- Consumer sentiment index.
This is an important set of figures for assessing inflation expectations and the mood of the American consumer.
7
3.1k
·
--
Article
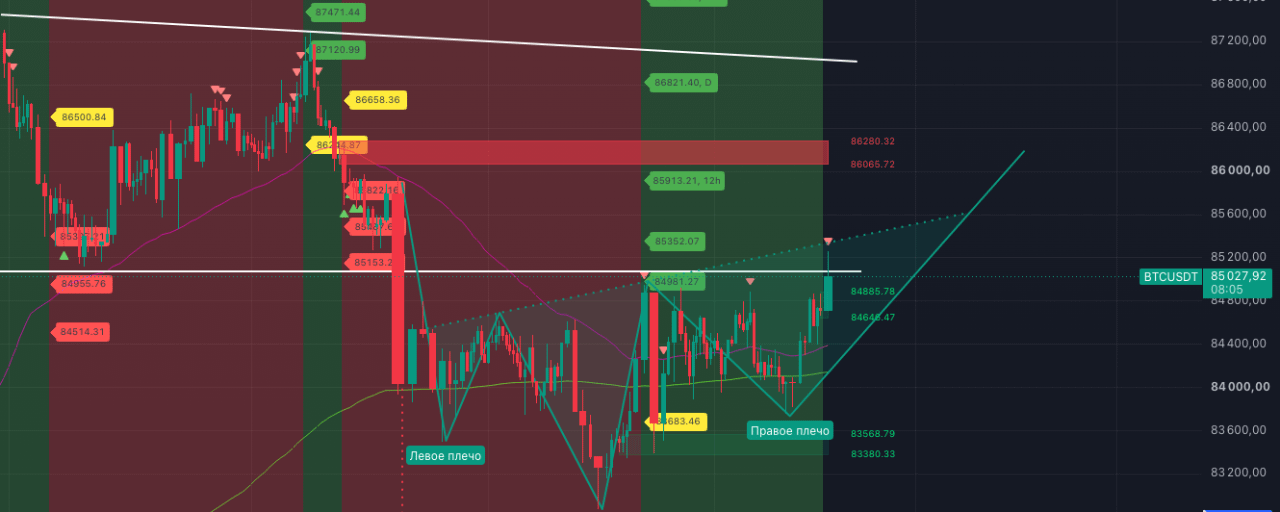
BTC is currently recovering above 85 000$, testing the "neck line" of a "Double Top"BTC is currently recovering above 85 000$, testing the "neck line" of a "Double Top". This is 85 114$. By the way, let’s note that the target of the "Double Top" has practically been fully reached—at the target 82 795$, the price yesterday briefly dropped to 82 874$.
Yesterday’s risky short add-on for 84 678.90$ on a Strong signal of a potential 15-minute TF local top was executed at the local high; after that, the price immediately headed down to 83 388. BUT in the end, this drop was absorbed by buyers and the price started trading in a range, from which it began to break upward in the second half of the day.
BTC is currently recovering above 85 000$, testing the "neck line" of a "Double Top"
BTC is currently recovering above 85 000$, testing the "neck line" of a "Double Top". This is 85 114$. By the way, let’s note that the target of the "Double Top" has practically been fully reached—at the target 82 795$, the price yesterday briefly dropped to 82 874$.
Yesterday’s risky short add-on for 84 678.90$ on a Strong signal of a potential 15-minute TF local top was executed at the local high; after that, the price immediately headed down to 83 388. BUT in the end, this drop was absorbed by buyers and the price started trading in a range, from which it began to break upward in the second half of the day.
Yesterday’s risky short add-on for 84 678.90$ on a Strong signal of a potential 15-minute TF local top was executed at the local high; after that, the price immediately headed down to 83 388. BUT in the end, this drop was absorbed by buyers and the price started trading in a range, from which it began to break upward in the second half of the day.
11
2.9k
·
--
Article
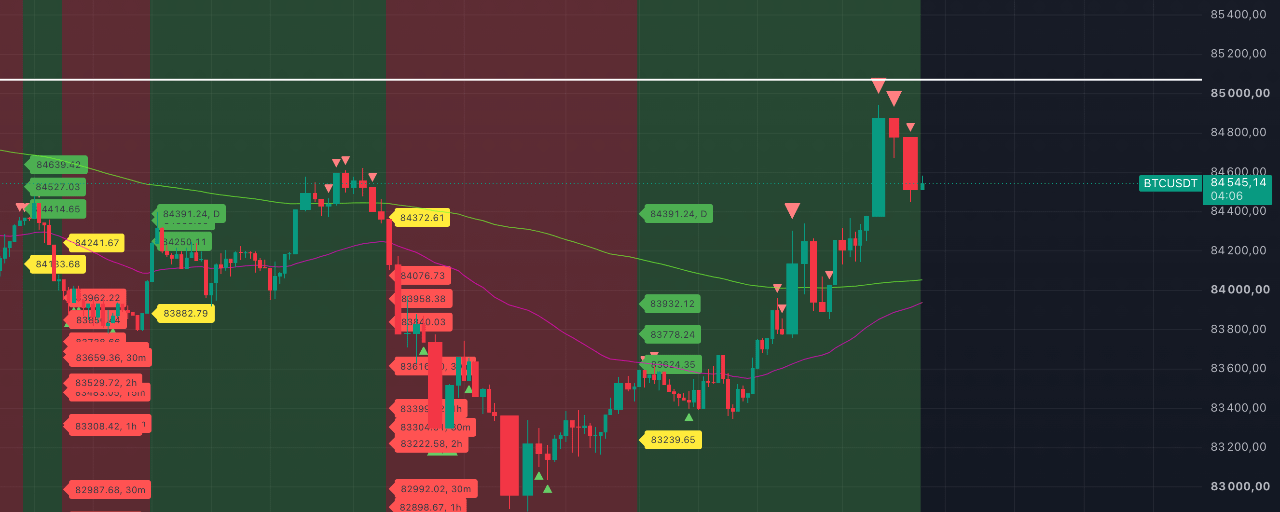
BTC price shows a Strong signal of a potential top on the 15-minute timeframeThe BTC price shows a Strong signal of a potential top on the 15-minute timeframe; we add to the short. The asset has almost reached the retest of the “neckline” on the “Double Top,” and this is the low of September 22, 85,114$. At the moment, we also have a Strong signal of a potential top on the 5- and 15-minute timeframes on the chart. And on the 15-minute timeframe, we are talking about the third candle with a marker from three possible ones. There is a regular marker as well on the 30-minute timeframe, but at the same time there is also a return to a stable uptrend on it. For now, we’re observing a price pullback.
BTC price shows a Strong signal of a potential top on the 15-minute timeframe
The BTC price shows a Strong signal of a potential top on the 15-minute timeframe; we add to the short. The asset has almost reached the retest of the “neckline” on the “Double Top,” and this is the low of September 22, 85,114$. At the moment, we also have a Strong signal of a potential top on the 5- and 15-minute timeframes on the chart. And on the 15-minute timeframe, we are talking about the third candle with a marker from three possible ones. There is a regular marker as well on the 30-minute timeframe, but at the same time there is also a return to a stable uptrend on it. For now, we’re observing a price pullback.
11
1
19
6.1k
·
--
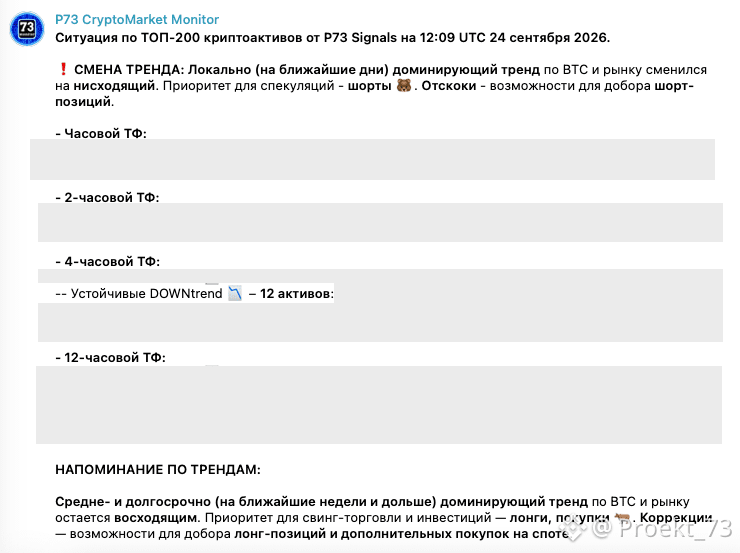
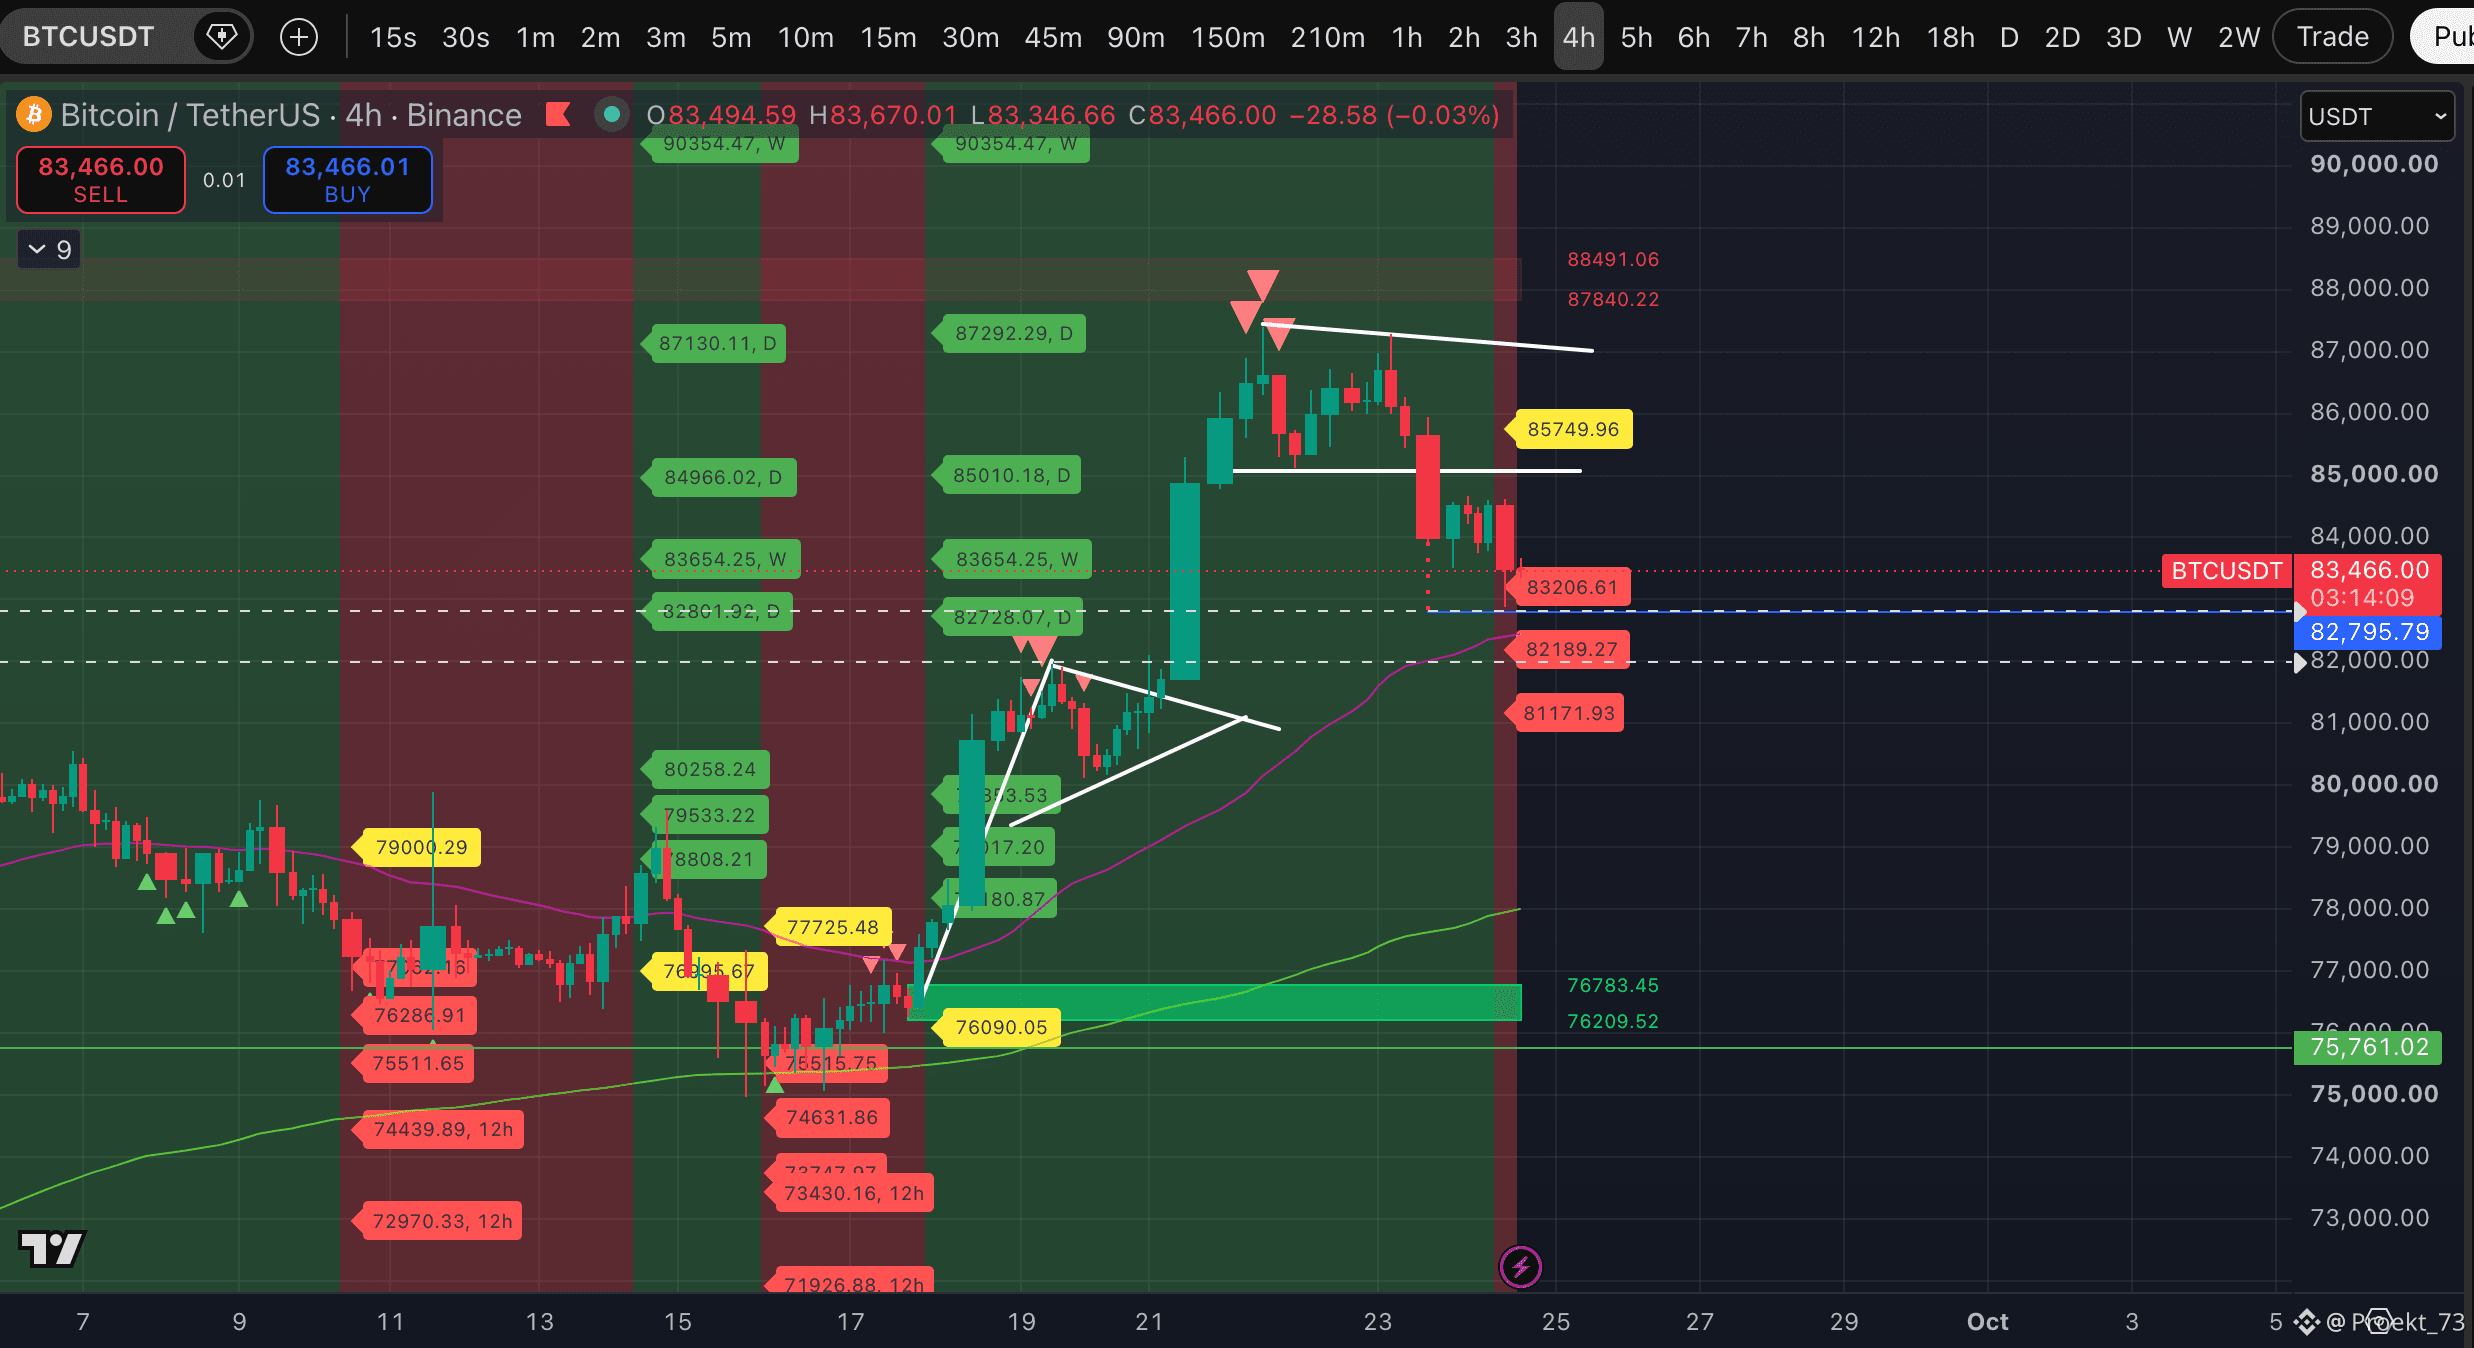
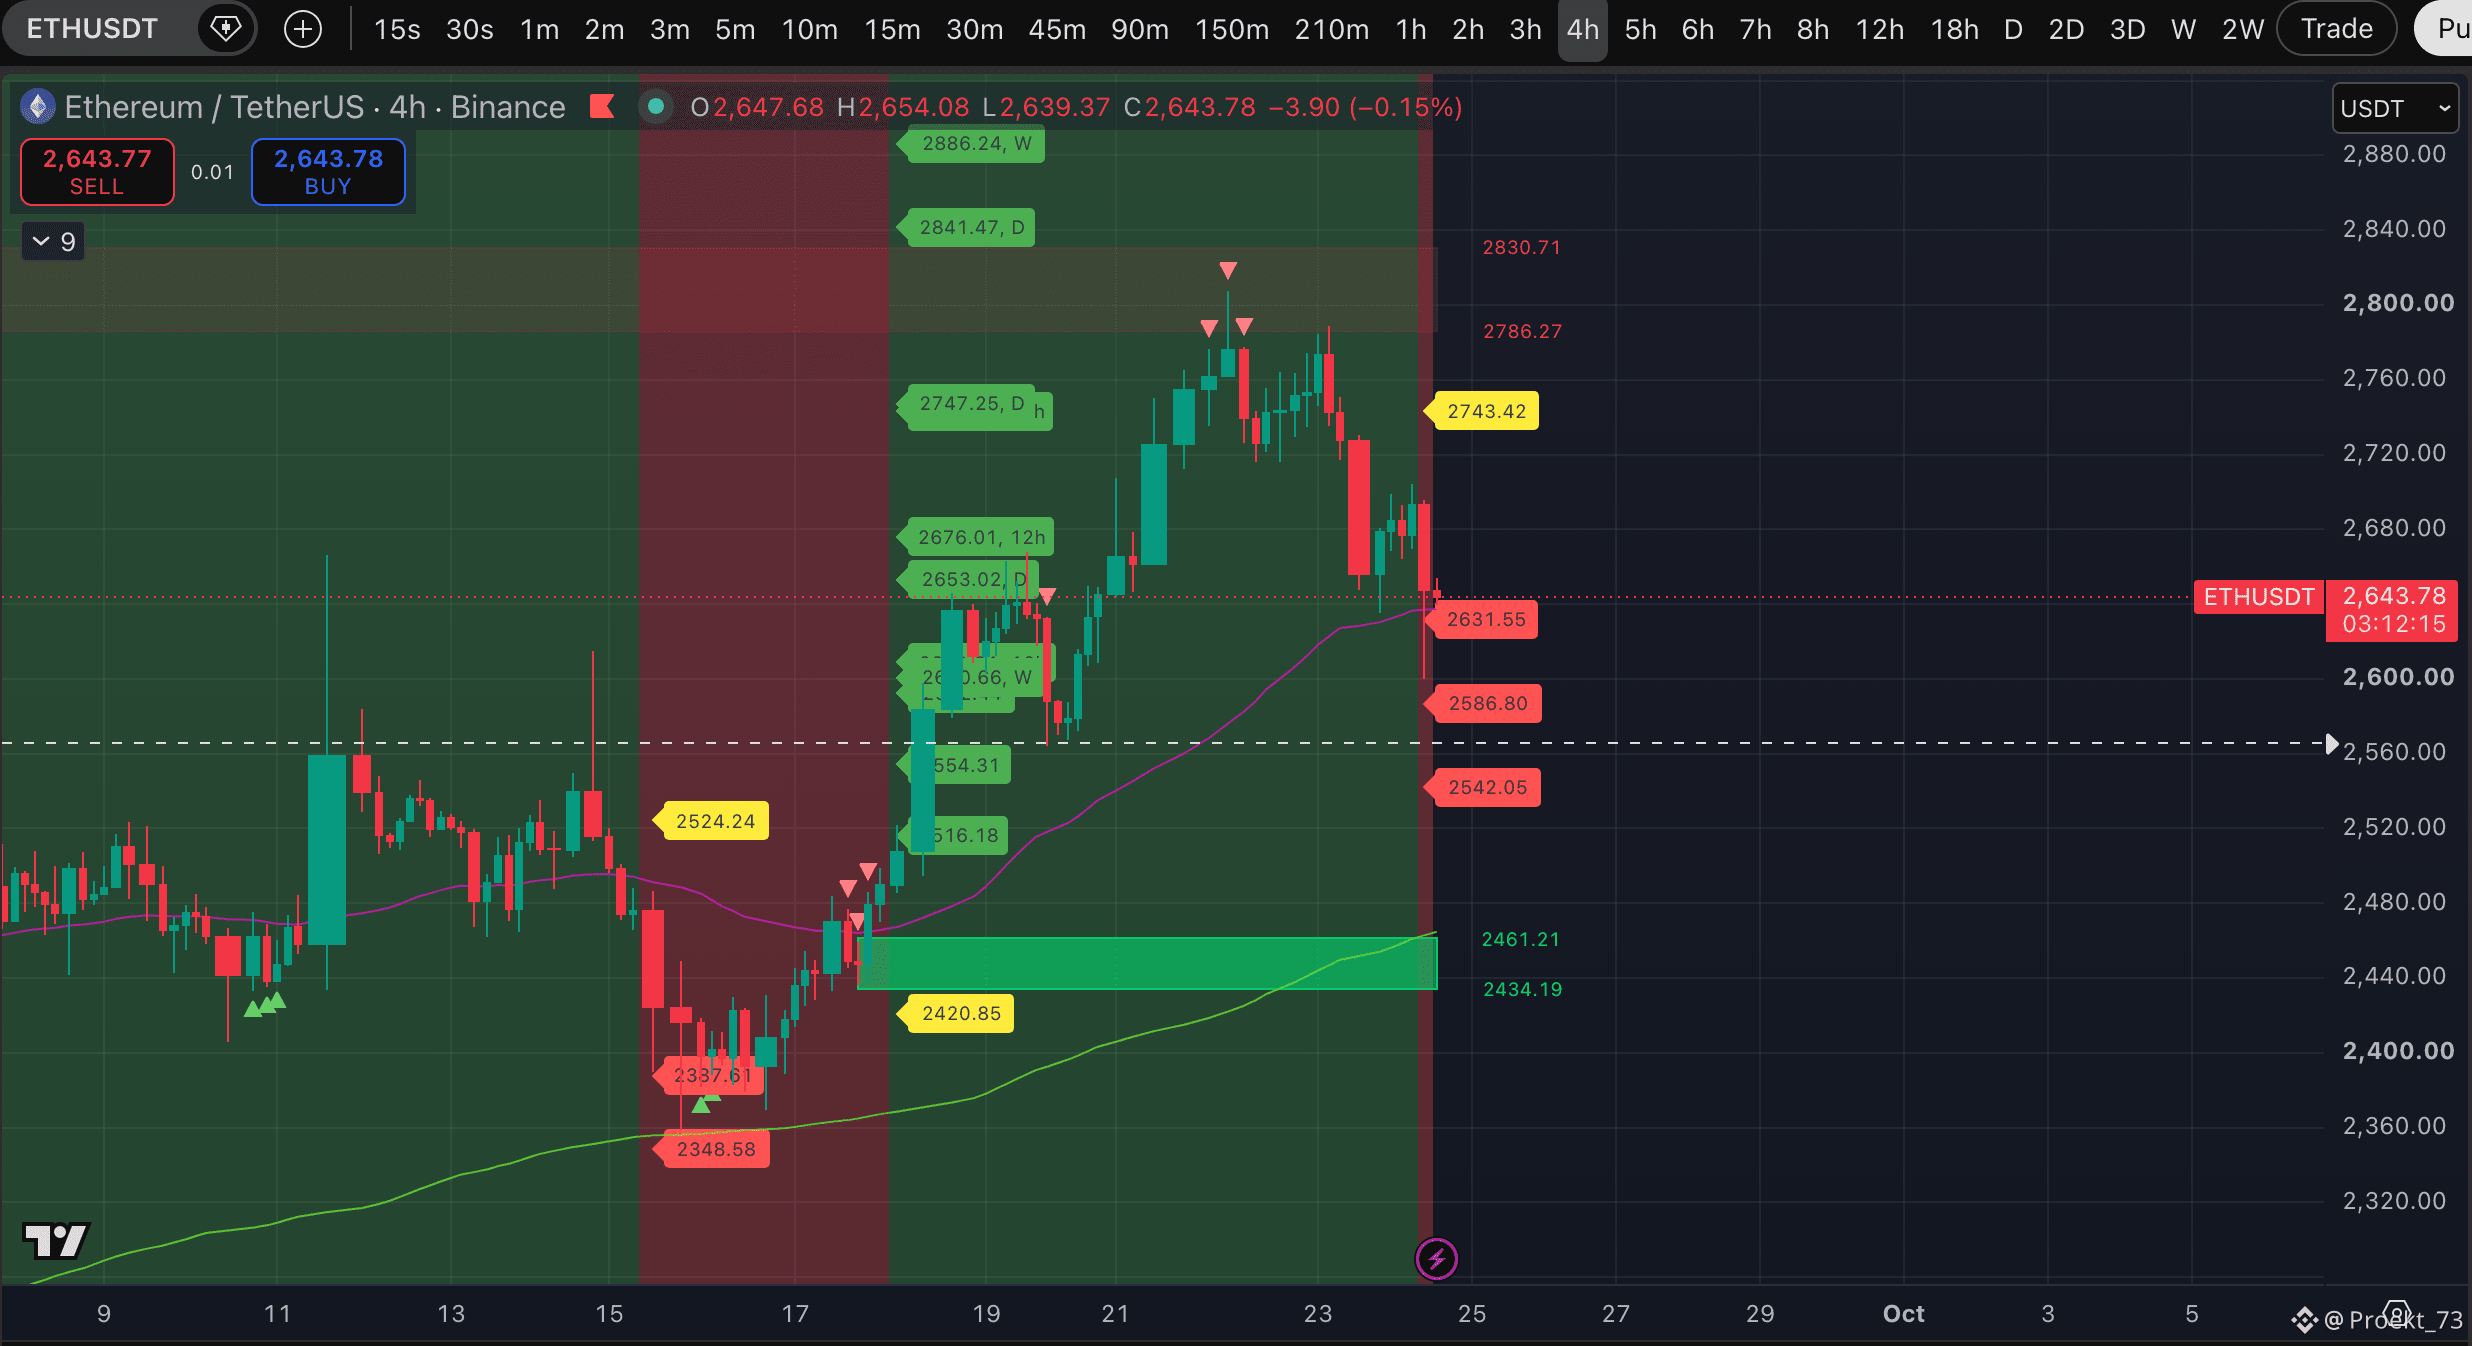
BTC and ETH have moved into a steady downtrend on the 4-hour timeframe. By the way, #HYPE has also switched to a downtrend on this timeframe—symbolic that on the day of listing on Binance’s spot market (listing on a top exchange is a good time for distribution).
As of now, 12 assets out of the TOP-200 have moved into a downtrend on this timeframe, but the presence of #BTC and #ETH in the list significantly increases the importance of this signal.
The baseline and additional targets, the level of potential breakdown, and liquidity zones are shown in the screenshots.
For speculation, the market is giving more and more signals for short scenarios, but for the short we still expect an opportunity to add specifically on a bounce, in order to bring the trade to break-even from the current level of 75 610,24$.
BTC and ETH have moved into a steady downtrend on the 4-hour timeframe. By the way, #HYPE has also switched to a downtrend on this timeframe—symbolic that on the day of listing on Binance’s spot market (listing on a top exchange is a good time for distribution).
As of now, 12 assets out of the TOP-200 have moved into a downtrend on this timeframe, but the presence of #BTC and #ETH in the list significantly increases the importance of this signal.
The baseline and additional targets, the level of potential breakdown, and liquidity zones are shown in the screenshots.
For speculation, the market is giving more and more signals for short scenarios, but for the short we still expect an opportunity to add specifically on a bounce, in order to bring the trade to break-even from the current level of 75 610,24$.
As of now, 12 assets out of the TOP-200 have moved into a downtrend on this timeframe, but the presence of #BTC and #ETH in the list significantly increases the importance of this signal.
The baseline and additional targets, the level of potential breakdown, and liquidity zones are shown in the screenshots.
For speculation, the market is giving more and more signals for short scenarios, but for the short we still expect an opportunity to add specifically on a bounce, in order to bring the trade to break-even from the current level of 75 610,24$.
1
7
6.3k
·
--
Verified
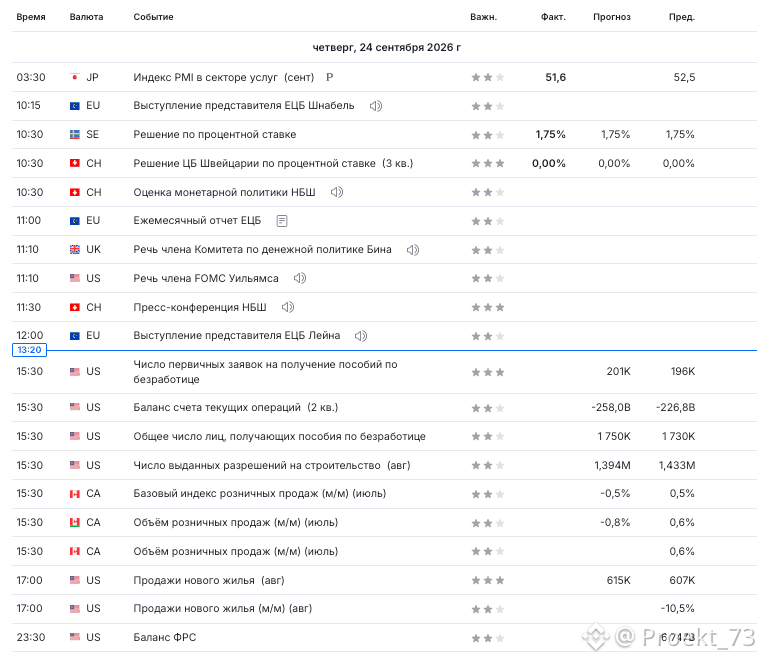
Important events for the crypto market on September 24 from the economic calendar.
Today is a relatively quiet day, the third most important day of the week (first is Friday, second is Wednesday—and it already proved it). In the morning, decisions from the central banks of Sweden and Switzerland on the interest rate were already released—important due to the role of the Swedish krona and the Swiss franc in the calculation of the US Dollar Index (DXY). In both cases—pauses.
Schedule for the rest of the day:
❗️- 15:30 Kyiv and Moscow time / 17:30 Astana time — Number of initial unemployment benefit claims and the total number of people receiving unemployment benefits in the USA. Important for assessing the resilience of the US labor market.
- 15:30 Kyiv and Moscow time / 17:30 Astana time — Balance of the US current account for Q2. Important for assessing the external balance of the US economy.
❗️- 23:30 Kyiv and Moscow time / 01:30 of the new day in Astana — Balance of the US Fed.
Important events for the crypto market on September 24 from the economic calendar.
Today is a relatively quiet day, the third most important day of the week (first is Friday, second is Wednesday—and it already proved it). In the morning, decisions from the central banks of Sweden and Switzerland on the interest rate were already released—important due to the role of the Swedish krona and the Swiss franc in the calculation of the US Dollar Index (DXY). In both cases—pauses.
Schedule for the rest of the day:
❗️- 15:30 Kyiv and Moscow time / 17:30 Astana time — Number of initial unemployment benefit claims and the total number of people receiving unemployment benefits in the USA. Important for assessing the resilience of the US labor market.
- 15:30 Kyiv and Moscow time / 17:30 Astana time — Balance of the US current account for Q2. Important for assessing the external balance of the US economy.
❗️- 23:30 Kyiv and Moscow time / 01:30 of the new day in Astana — Balance of the US Fed.
Today is a relatively quiet day, the third most important day of the week (first is Friday, second is Wednesday—and it already proved it). In the morning, decisions from the central banks of Sweden and Switzerland on the interest rate were already released—important due to the role of the Swedish krona and the Swiss franc in the calculation of the US Dollar Index (DXY). In both cases—pauses.
Schedule for the rest of the day:
❗️- 15:30 Kyiv and Moscow time / 17:30 Astana time — Number of initial unemployment benefit claims and the total number of people receiving unemployment benefits in the USA. Important for assessing the resilience of the US labor market.
- 15:30 Kyiv and Moscow time / 17:30 Astana time — Balance of the US current account for Q2. Important for assessing the external balance of the US economy.
❗️- 23:30 Kyiv and Moscow time / 01:30 of the new day in Astana — Balance of the US Fed.
3
3.4k
·
--
Article
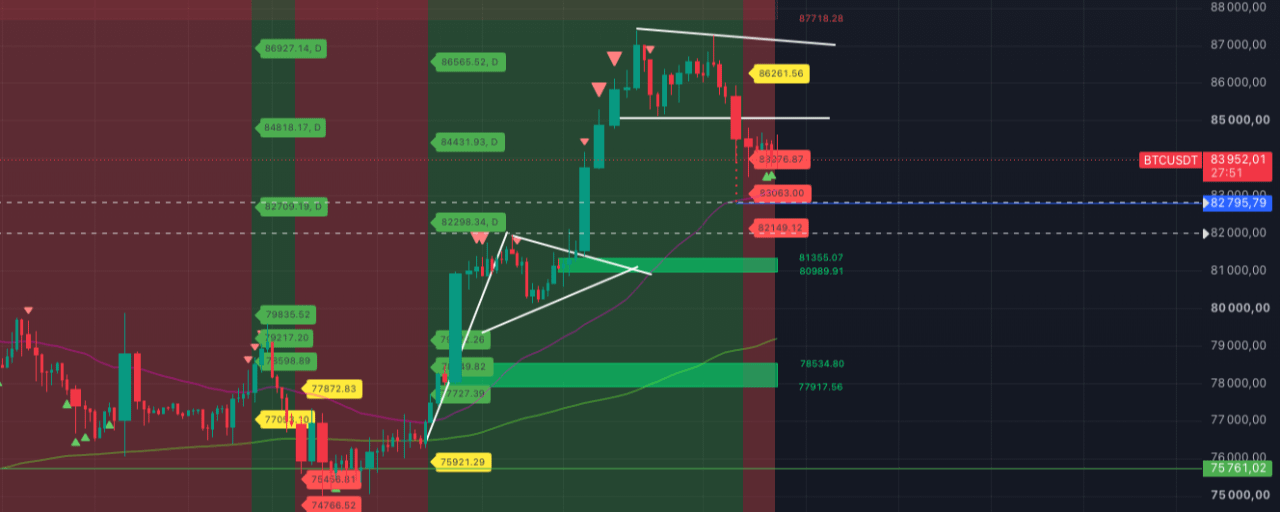
Key signal for BTC right now — the asset price has moved into a stable downtrend on the 3-hour timeframeKey signal for BTC right now — the asset price has moved into a stable downtrend on the 3-hour timeframe. An early signal for this was the shift into a downtrend on the 2.5-hour timeframe — and again, it didn’t disappoint.
Let us remind you: for us, this is a trigger timeframe — whichever trend our indicator shows there, that’s where we work speculatively and with priority. Considering that before this, the price was showing a Strong signal for a potential top on the 12- and 18-hour timeframe (and on those timeframes, the fourth additional markers have also been set), and today on the daily timeframe a marker for a potential top has appeared — everything points to a picture of the correction continuing. More precisely — that this is only the beginning.
Key signal for BTC right now — the asset price has moved into a stable downtrend on the 3-hour timeframe
Key signal for BTC right now — the asset price has moved into a stable downtrend on the 3-hour timeframe. An early signal for this was the shift into a downtrend on the 2.5-hour timeframe — and again, it didn’t disappoint.
Let us remind you: for us, this is a trigger timeframe — whichever trend our indicator shows there, that’s where we work speculatively and with priority. Considering that before this, the price was showing a Strong signal for a potential top on the 12- and 18-hour timeframe (and on those timeframes, the fourth additional markers have also been set), and today on the daily timeframe a marker for a potential top has appeared — everything points to a picture of the correction continuing. More precisely — that this is only the beginning.
Let us remind you: for us, this is a trigger timeframe — whichever trend our indicator shows there, that’s where we work speculatively and with priority. Considering that before this, the price was showing a Strong signal for a potential top on the 12- and 18-hour timeframe (and on those timeframes, the fourth additional markers have also been set), and today on the daily timeframe a marker for a potential top has appeared — everything points to a picture of the correction continuing. More precisely — that this is only the beginning.
13
4.9k
·
--
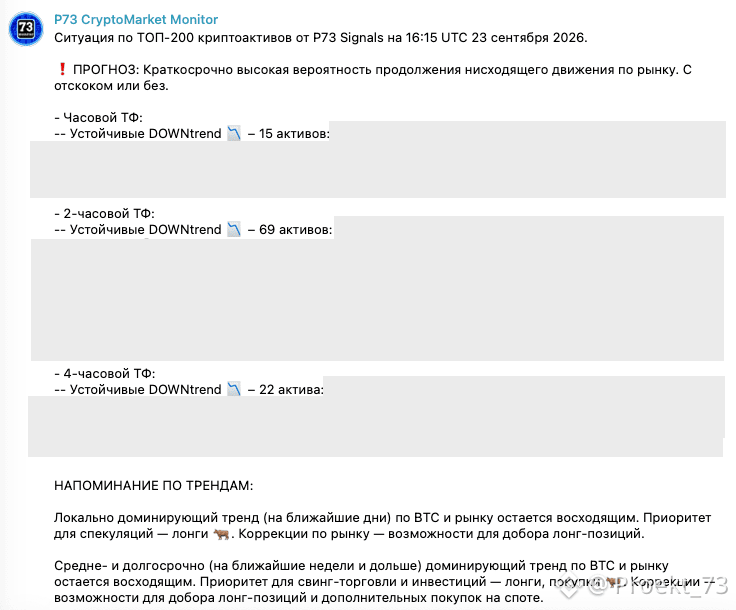
We show what the current results of the bearish impulse look like on the crypto market in this hour. A slice from P73 CryptoMarket Monitor, for the TOP-200 crypto assets:
- on the 1-hour TF, another 15 assets have shifted into a sustained downtrend,
- on the 2-hour TF, 69 assets have shifted into a sustained downtrend, including #BTС and #ETH,
- on the 4-hour TF, 22 assets have shifted into a sustained downtrend, including #AVAX, #BNB, #LINK.
The monitor provides an auto forecast with a high probability of the market continuing its downward move.
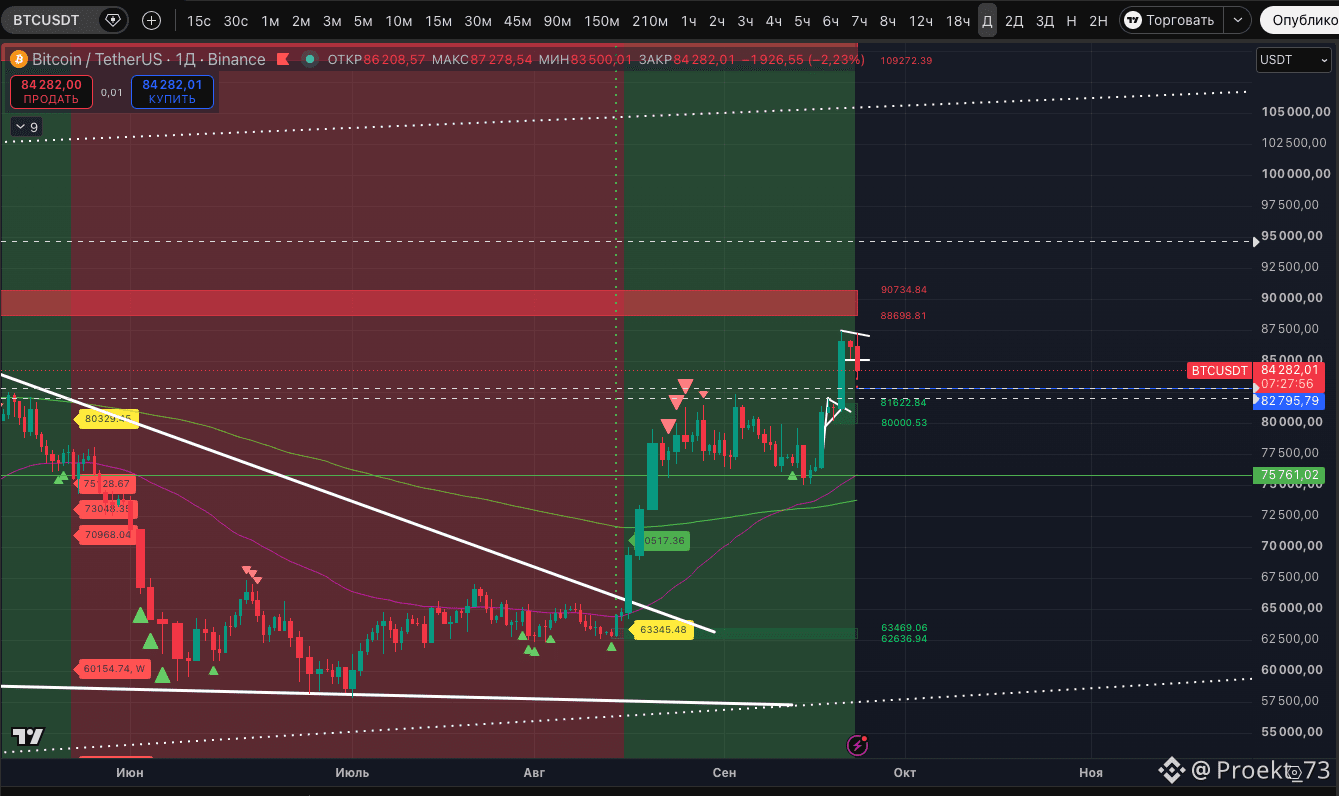
Right now, it doesn’t look like a long squeeze. It looks more like a correction—at least the pump-and-rise from September 16. It’s hard to say more until the price of #BTC holds above the level of 75 761$. Which, according to our assessment, separates the bearish and bullish markets. BUT taking into account the fact that a number of assets, including top ones (BTC, ETH, SOL, etc.), shifted into a sustained uptrend during the week—now prices below 75 761$ - are no longer in the bearish market zone, but in the zone of opportunities for long-term purchases.
We show what the current results of the bearish impulse look like on the crypto market in this hour. A slice from P73 CryptoMarket Monitor, for the TOP-200 crypto assets:
- on the 1-hour TF, another 15 assets have shifted into a sustained downtrend,
- on the 2-hour TF, 69 assets have shifted into a sustained downtrend, including #BTС and #ETH,
- on the 4-hour TF, 22 assets have shifted into a sustained downtrend, including #AVAX, #BNB, #LINK.
The monitor provides an auto forecast with a high probability of the market continuing its downward move.
Right now, it doesn’t look like a long squeeze. It looks more like a correction—at least the pump-and-rise from September 16. It’s hard to say more until the price of #BTC holds above the level of 75 761$. Which, according to our assessment, separates the bearish and bullish markets. BUT taking into account the fact that a number of assets, including top ones (BTC, ETH, SOL, etc.), shifted into a sustained uptrend during the week—now prices below 75 761$ - are no longer in the bearish market zone, but in the zone of opportunities for long-term purchases.
- on the 1-hour TF, another 15 assets have shifted into a sustained downtrend,
- on the 2-hour TF, 69 assets have shifted into a sustained downtrend, including #BTС and #ETH,
- on the 4-hour TF, 22 assets have shifted into a sustained downtrend, including #AVAX, #BNB, #LINK.
The monitor provides an auto forecast with a high probability of the market continuing its downward move.
Right now, it doesn’t look like a long squeeze. It looks more like a correction—at least the pump-and-rise from September 16. It’s hard to say more until the price of #BTC holds above the level of 75 761$. Which, according to our assessment, separates the bearish and bullish markets. BUT taking into account the fact that a number of assets, including top ones (BTC, ETH, SOL, etc.), shifted into a sustained uptrend during the week—now prices below 75 761$ - are no longer in the bearish market zone, but in the zone of opportunities for long-term purchases.
2
13
3.9k
·
--
Article
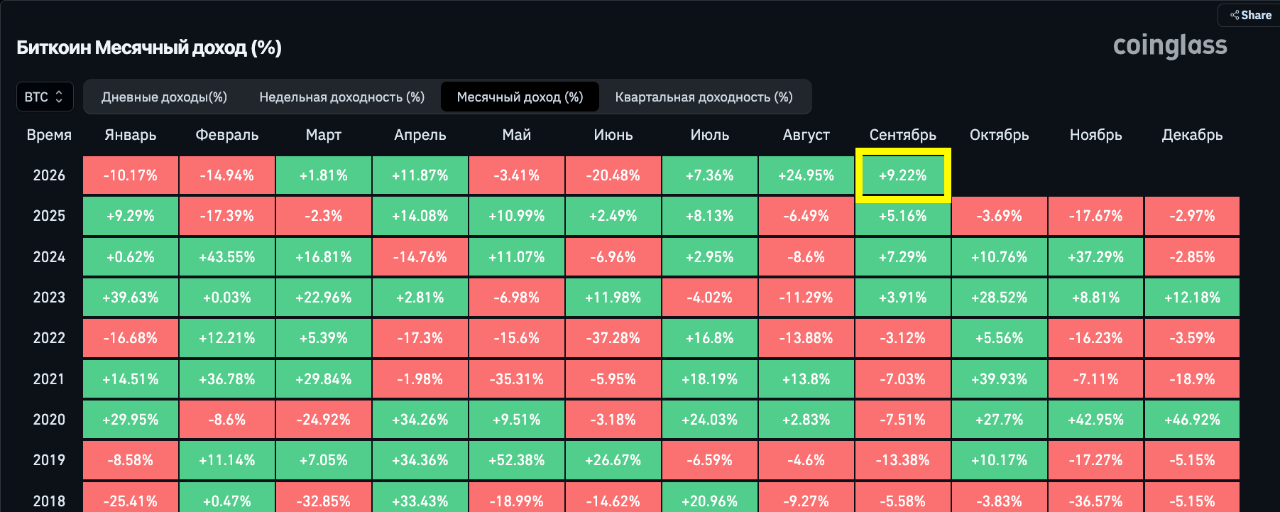
Coinglass: BTC posts the best September in the entire history of observationsCoinglass: BTC posts the best September in the entire history of observations.
As of now, #BTC’s return for September is +9.22%. This is higher than the previous positive results: +7.29% in 2024, +5.16% in 2025, and +3.91% in 2023.
The effect is particularly noticeable against the backdrop of historically weak seasonality: the average BTC return in September is -2.21%, and the median is -2.44%. In other words, this month not only goes against the usual statistics, but so far is clearly outperforming every past September in the sample.
Coinglass: BTC posts the best September in the entire history of observations
Coinglass: BTC posts the best September in the entire history of observations.
As of now, #BTC’s return for September is +9.22%. This is higher than the previous positive results: +7.29% in 2024, +5.16% in 2025, and +3.91% in 2023.
The effect is particularly noticeable against the backdrop of historically weak seasonality: the average BTC return in September is -2.21%, and the median is -2.44%. In other words, this month not only goes against the usual statistics, but so far is clearly outperforming every past September in the sample.
As of now, #BTC’s return for September is +9.22%. This is higher than the previous positive results: +7.29% in 2024, +5.16% in 2025, and +3.91% in 2023.
The effect is particularly noticeable against the backdrop of historically weak seasonality: the average BTC return in September is -2.21%, and the median is -2.44%. In other words, this month not only goes against the usual statistics, but so far is clearly outperforming every past September in the sample.
1
14
3.9k
·
--
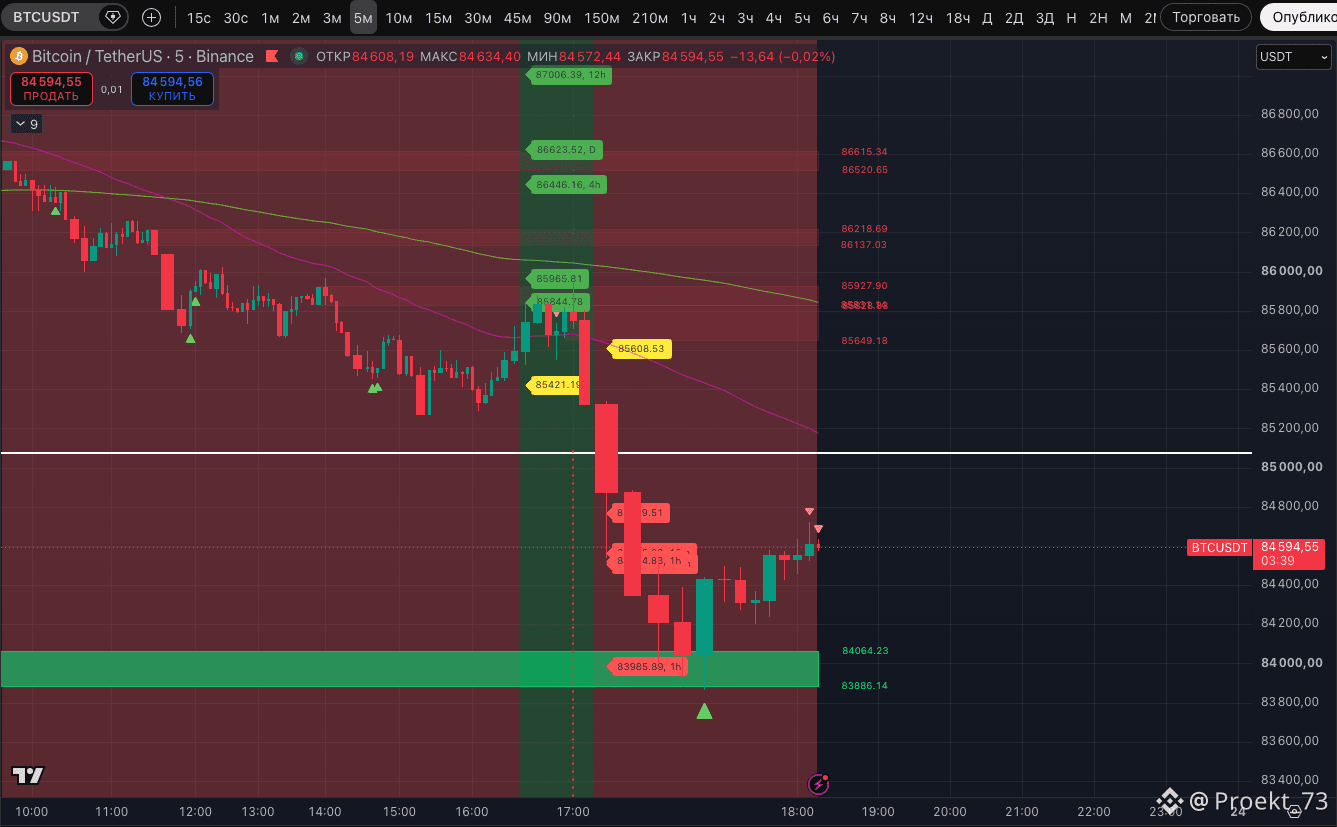
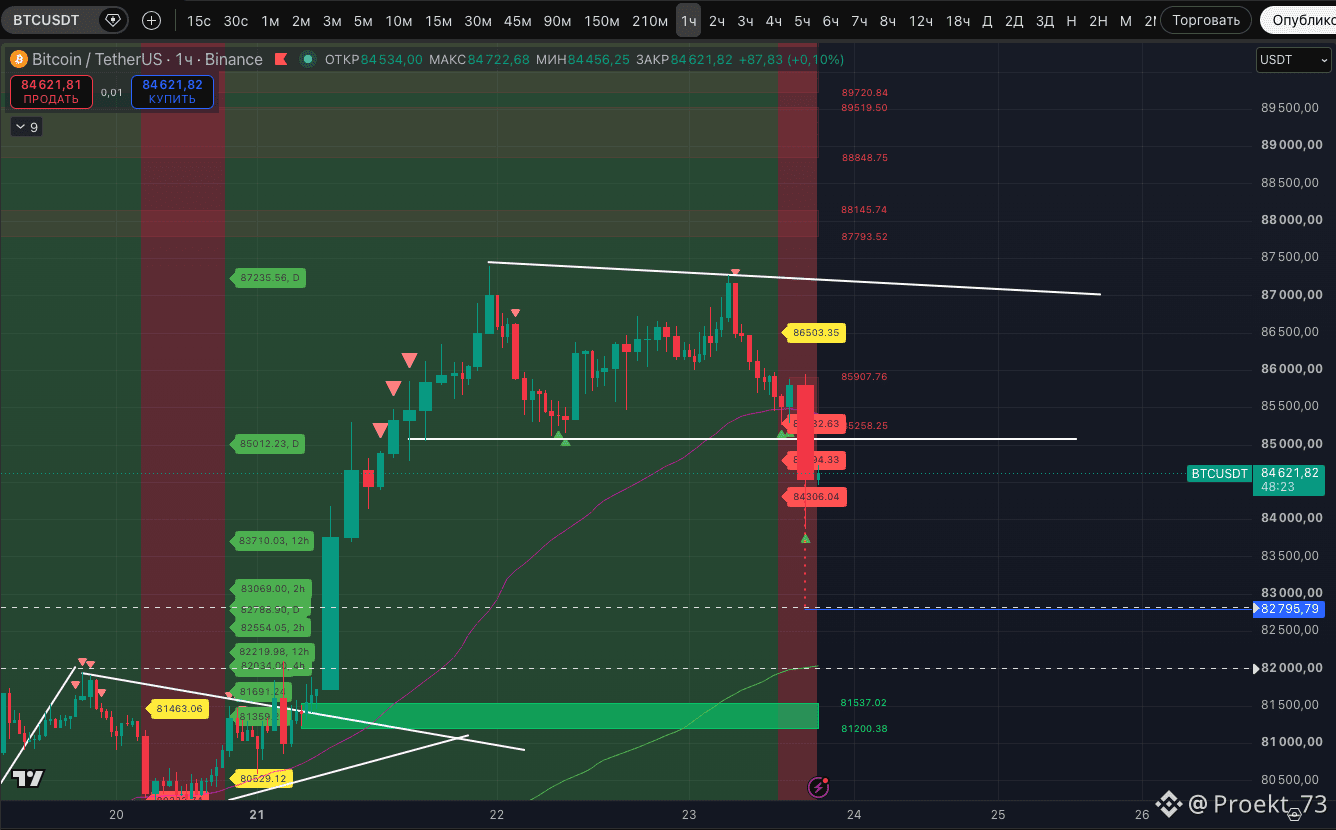
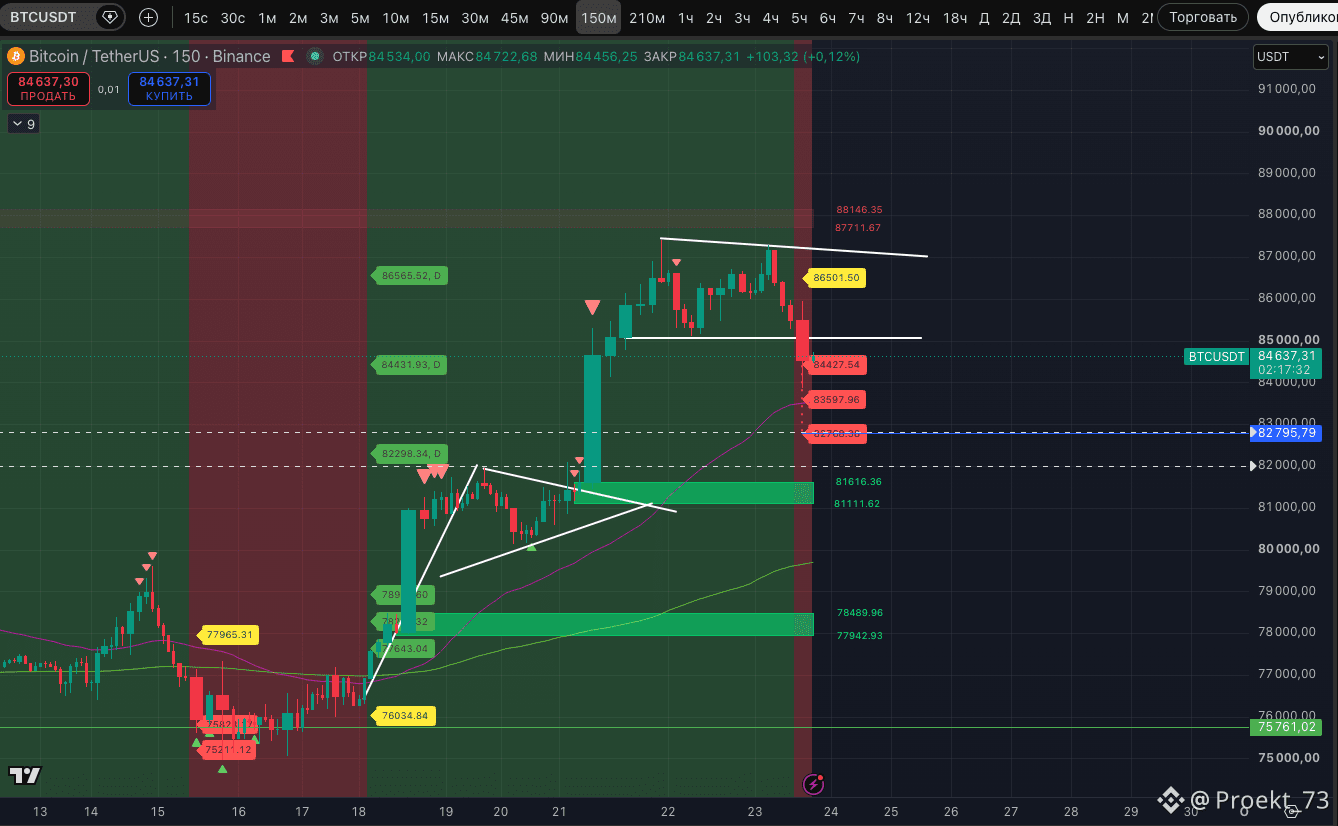
In the new hour, BTC shifted into a stable downtrend immediately on the 2.5-hour timeframe. And, according to statistics—let’s remind ourselves of this—it most often leads to a stable downtrend on the 3-hour timeframe as well, which for us is the trigger for shorts.
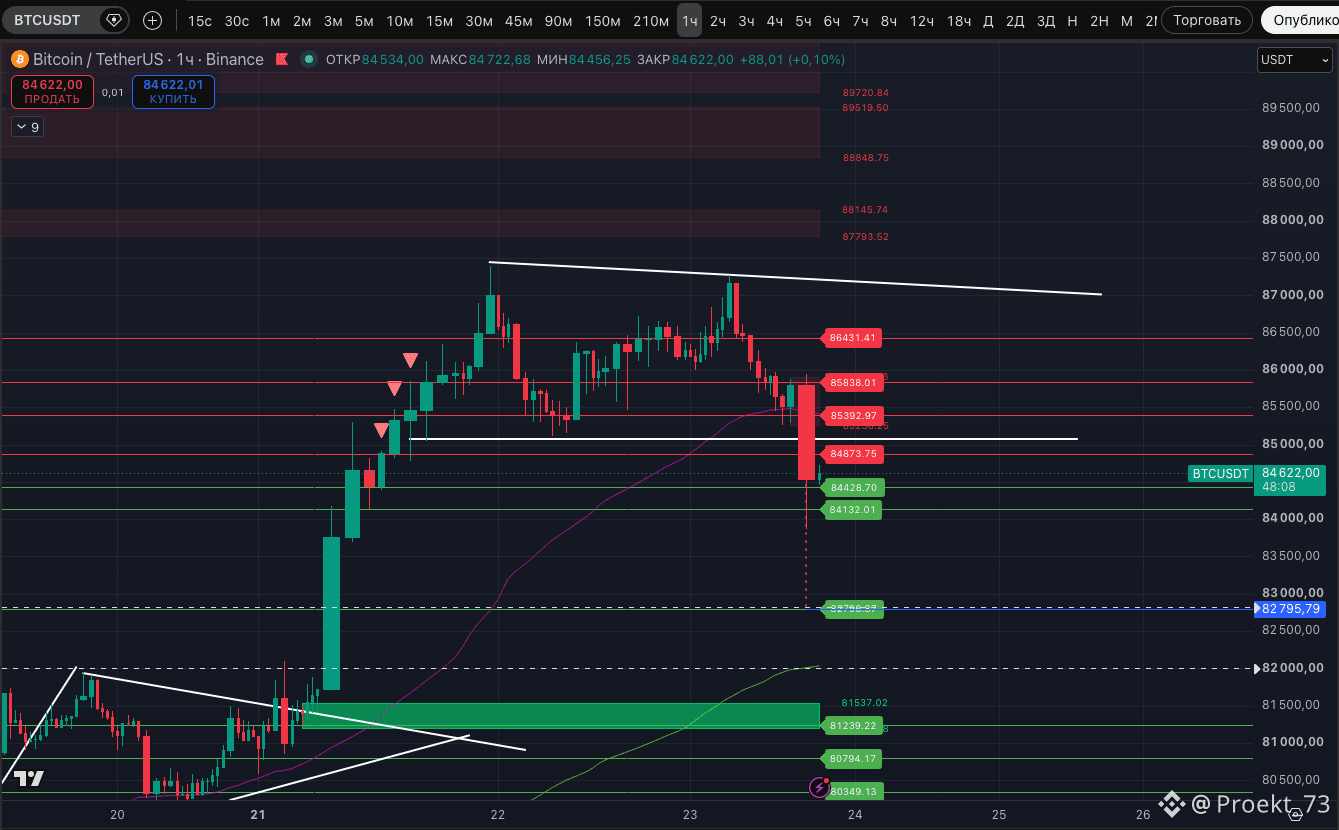
Basic targets: $84,427, $83,597, $82,768. The potential breakdown level: $86,501. As we can see, the third target overlaps with the full target of the “Double Top.”
At the moment, the price broke through an important horizontal level on the 1-hour timeframe at $84,132, which opens the way for an impulse up to the next level at $82,790. But from the Strong signal area on the 5-minute timeframe and the liquidity zone $83,886-$84,064$ - we can see a reaction from buyers. They are trying to defend the rise.
Right now, we’d like to see at least a retest of the “neck line” on the “Double Top,” which is yesterday’s low at $85,114. And to add to the short there. Given the three “Loya” marks on the 1-hour timeframe and the Strong signal of a potential high on the chart of stablecoins capitalization (USDT+USDC), it looks realistic to expect a move higher.
Ideally, it would be good to see a local extreme, like a Strong signal of a potential high on the 5-minute timeframe.
In the new hour, BTC shifted into a stable downtrend immediately on the 2.5-hour timeframe. And, according to statistics—let’s remind ourselves of this—it most often leads to a stable downtrend on the 3-hour timeframe as well, which for us is the trigger for shorts.
Basic targets: $84,427, $83,597, $82,768. The potential breakdown level: $86,501. As we can see, the third target overlaps with the full target of the “Double Top.”
At the moment, the price broke through an important horizontal level on the 1-hour timeframe at $84,132, which opens the way for an impulse up to the next level at $82,790. But from the Strong signal area on the 5-minute timeframe and the liquidity zone $83,886-$84,064$ - we can see a reaction from buyers. They are trying to defend the rise.
Right now, we’d like to see at least a retest of the “neck line” on the “Double Top,” which is yesterday’s low at $85,114. And to add to the short there. Given the three “Loya” marks on the 1-hour timeframe and the Strong signal of a potential high on the chart of stablecoins capitalization (USDT+USDC), it looks realistic to expect a move higher.
Ideally, it would be good to see a local extreme, like a Strong signal of a potential high on the 5-minute timeframe.
Basic targets: $84,427, $83,597, $82,768. The potential breakdown level: $86,501. As we can see, the third target overlaps with the full target of the “Double Top.”
At the moment, the price broke through an important horizontal level on the 1-hour timeframe at $84,132, which opens the way for an impulse up to the next level at $82,790. But from the Strong signal area on the 5-minute timeframe and the liquidity zone $83,886-$84,064$ - we can see a reaction from buyers. They are trying to defend the rise.
Right now, we’d like to see at least a retest of the “neck line” on the “Double Top,” which is yesterday’s low at $85,114. And to add to the short there. Given the three “Loya” marks on the 1-hour timeframe and the Strong signal of a potential high on the chart of stablecoins capitalization (USDT+USDC), it looks realistic to expect a move higher.
Ideally, it would be good to see a local extreme, like a Strong signal of a potential high on the 5-minute timeframe.
10
2.4k
·
--
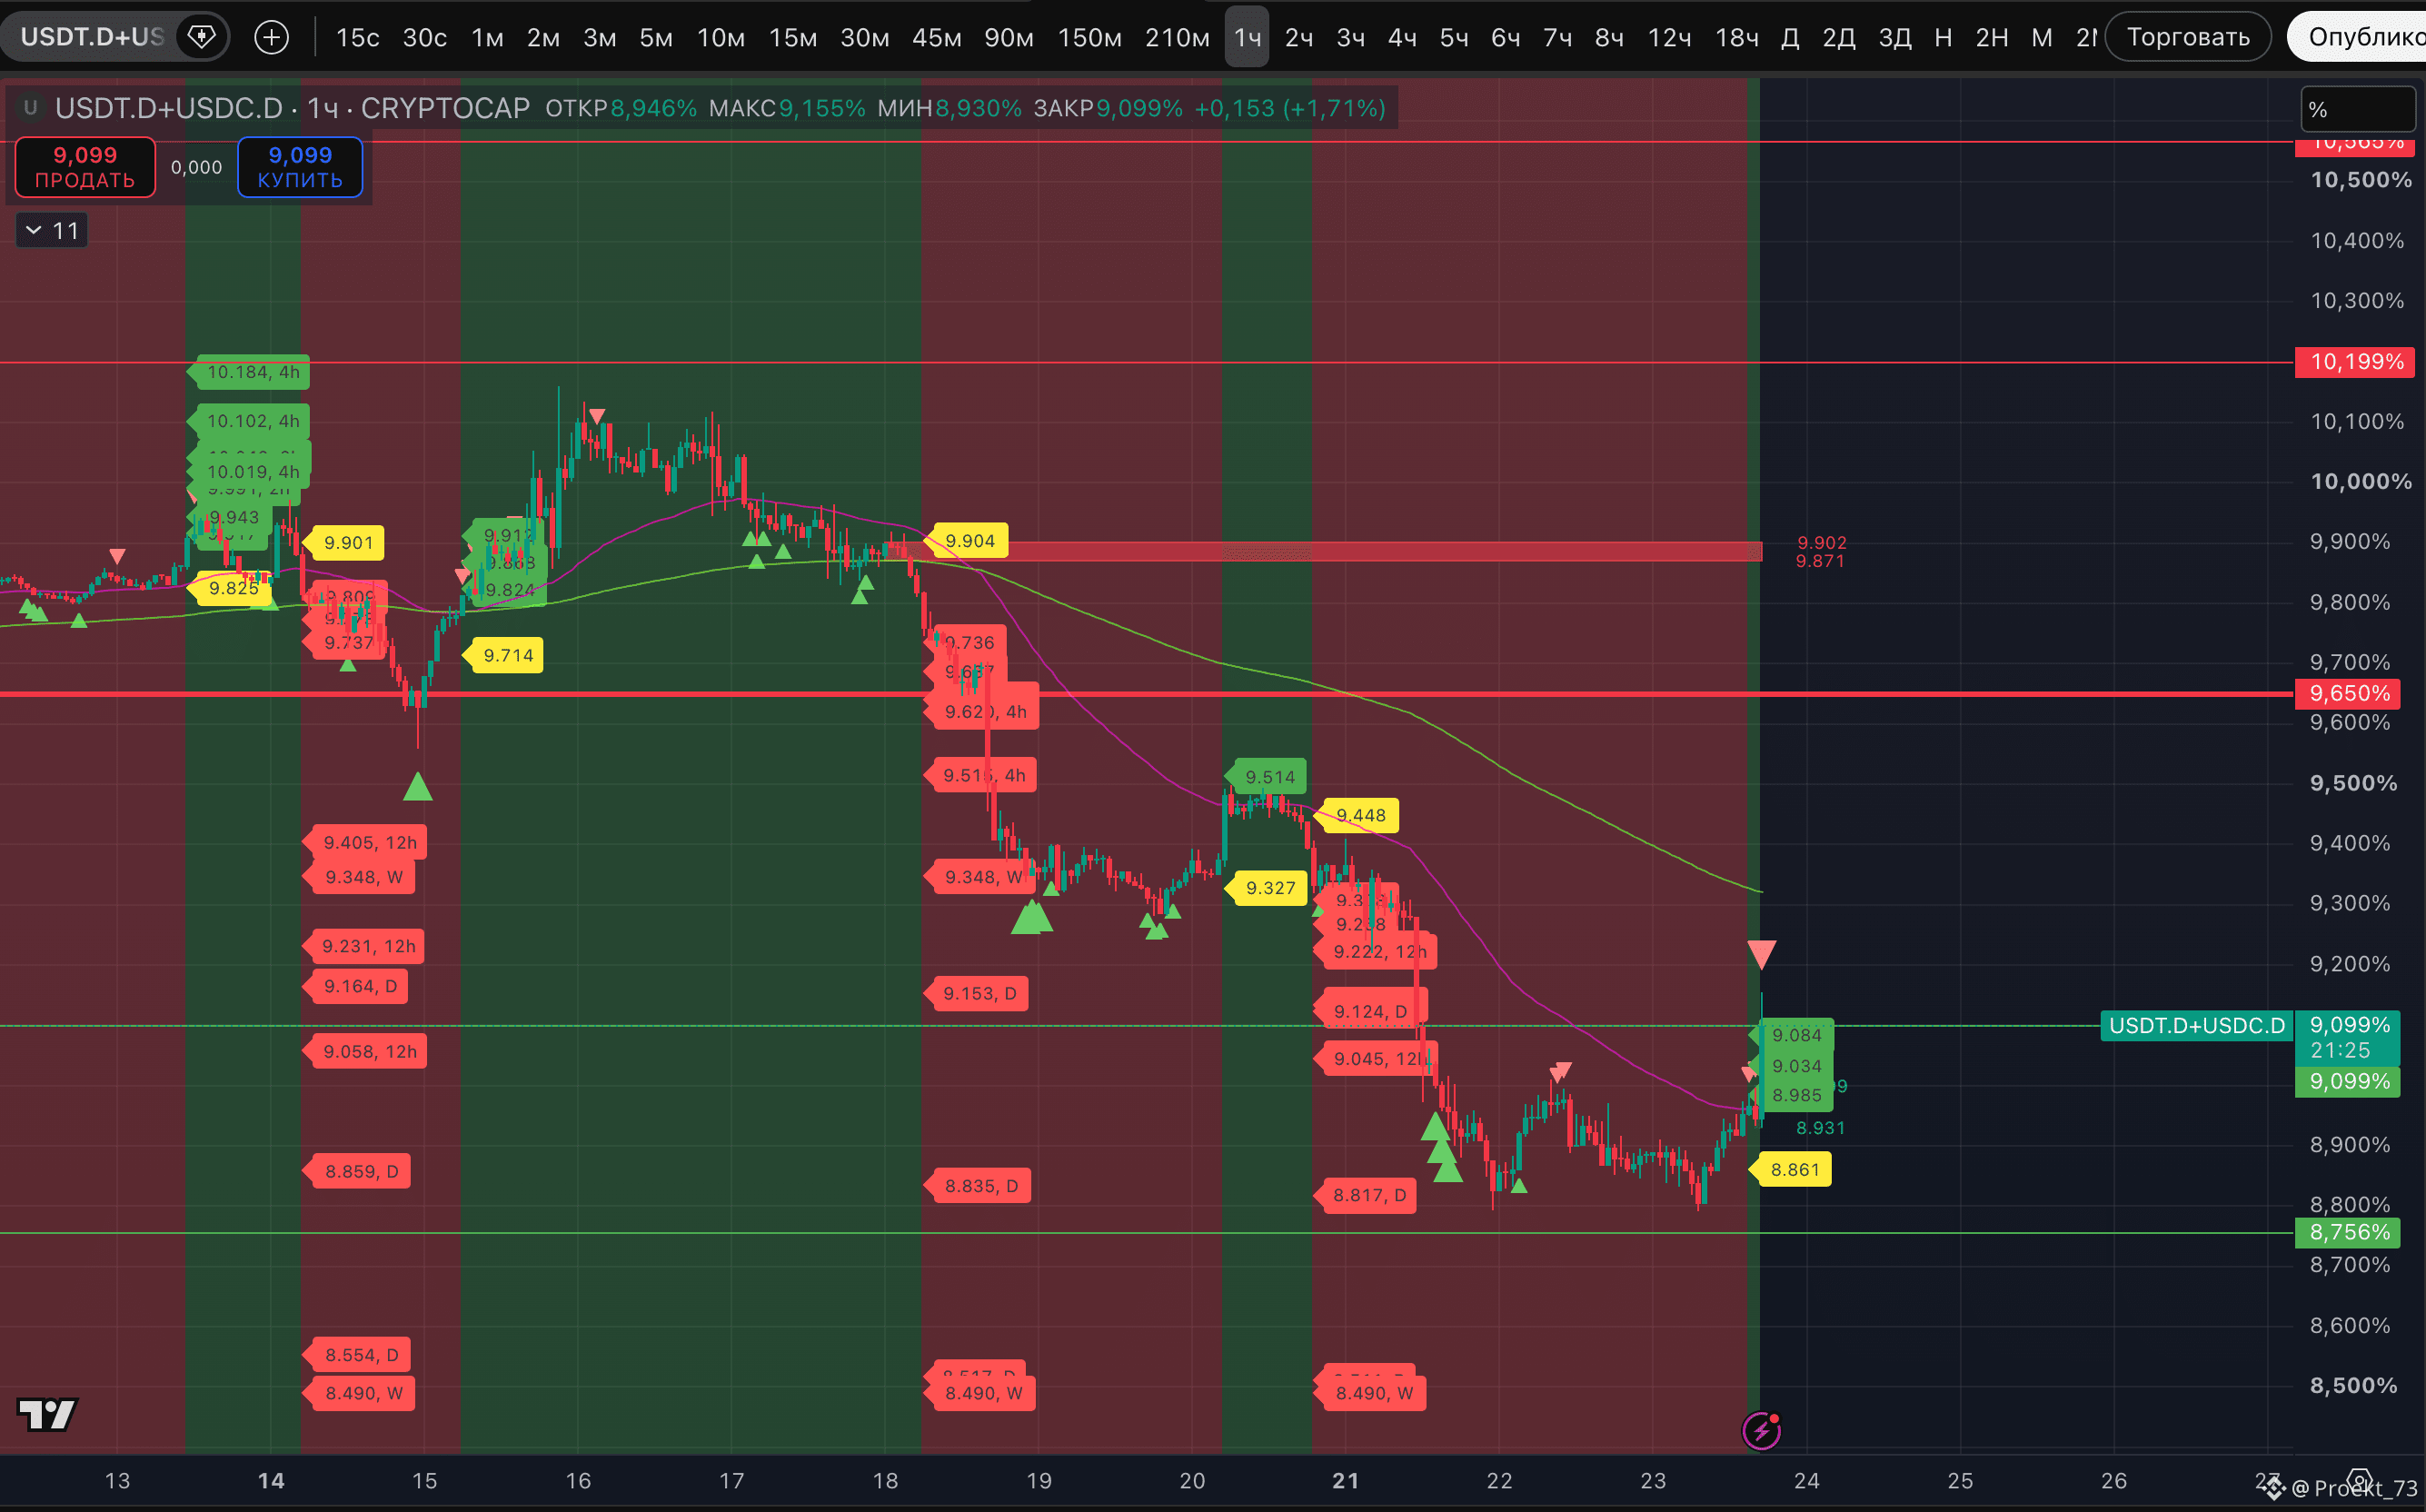
Stablecoin dominance USDT+USDC for now is showing a strong signal of a potential high on the hourly timeframe. Which is also unusual compared to the past month.
What’s important is that the strong signal appeared at the third marker, and the dominance has hit the horizontal level of 9.099% as resistance. Therefore, the remaining 20 minutes are clearly a bad time to build shorts. It’s better to wait for a pullback. And then see how many sustained downtrends—and on which timeframes—the market shows at the start of the new hour. If you didn’t make it, then you’re late: jumping into the “bear wagon” at the day’s low is a questionable pleasure. But for now, this impulse looks promising.
It’s also worth reminding that the key level on this chart is 9.65%, which—according to our assessment—separates the bear and bull markets.
Stablecoin dominance USDT+USDC for now is showing a strong signal of a potential high on the hourly timeframe. Which is also unusual compared to the past month.
What’s important is that the strong signal appeared at the third marker, and the dominance has hit the horizontal level of 9.099% as resistance. Therefore, the remaining 20 minutes are clearly a bad time to build shorts. It’s better to wait for a pullback. And then see how many sustained downtrends—and on which timeframes—the market shows at the start of the new hour. If you didn’t make it, then you’re late: jumping into the “bear wagon” at the day’s low is a questionable pleasure. But for now, this impulse looks promising.
It’s also worth reminding that the key level on this chart is 9.65%, which—according to our assessment—separates the bear and bull markets.
What’s important is that the strong signal appeared at the third marker, and the dominance has hit the horizontal level of 9.099% as resistance. Therefore, the remaining 20 minutes are clearly a bad time to build shorts. It’s better to wait for a pullback. And then see how many sustained downtrends—and on which timeframes—the market shows at the start of the new hour. If you didn’t make it, then you’re late: jumping into the “bear wagon” at the day’s low is a questionable pleasure. But for now, this impulse looks promising.
It’s also worth reminding that the key level on this chart is 9.65%, which—according to our assessment—separates the bear and bull markets.
11
2.4k
·
--
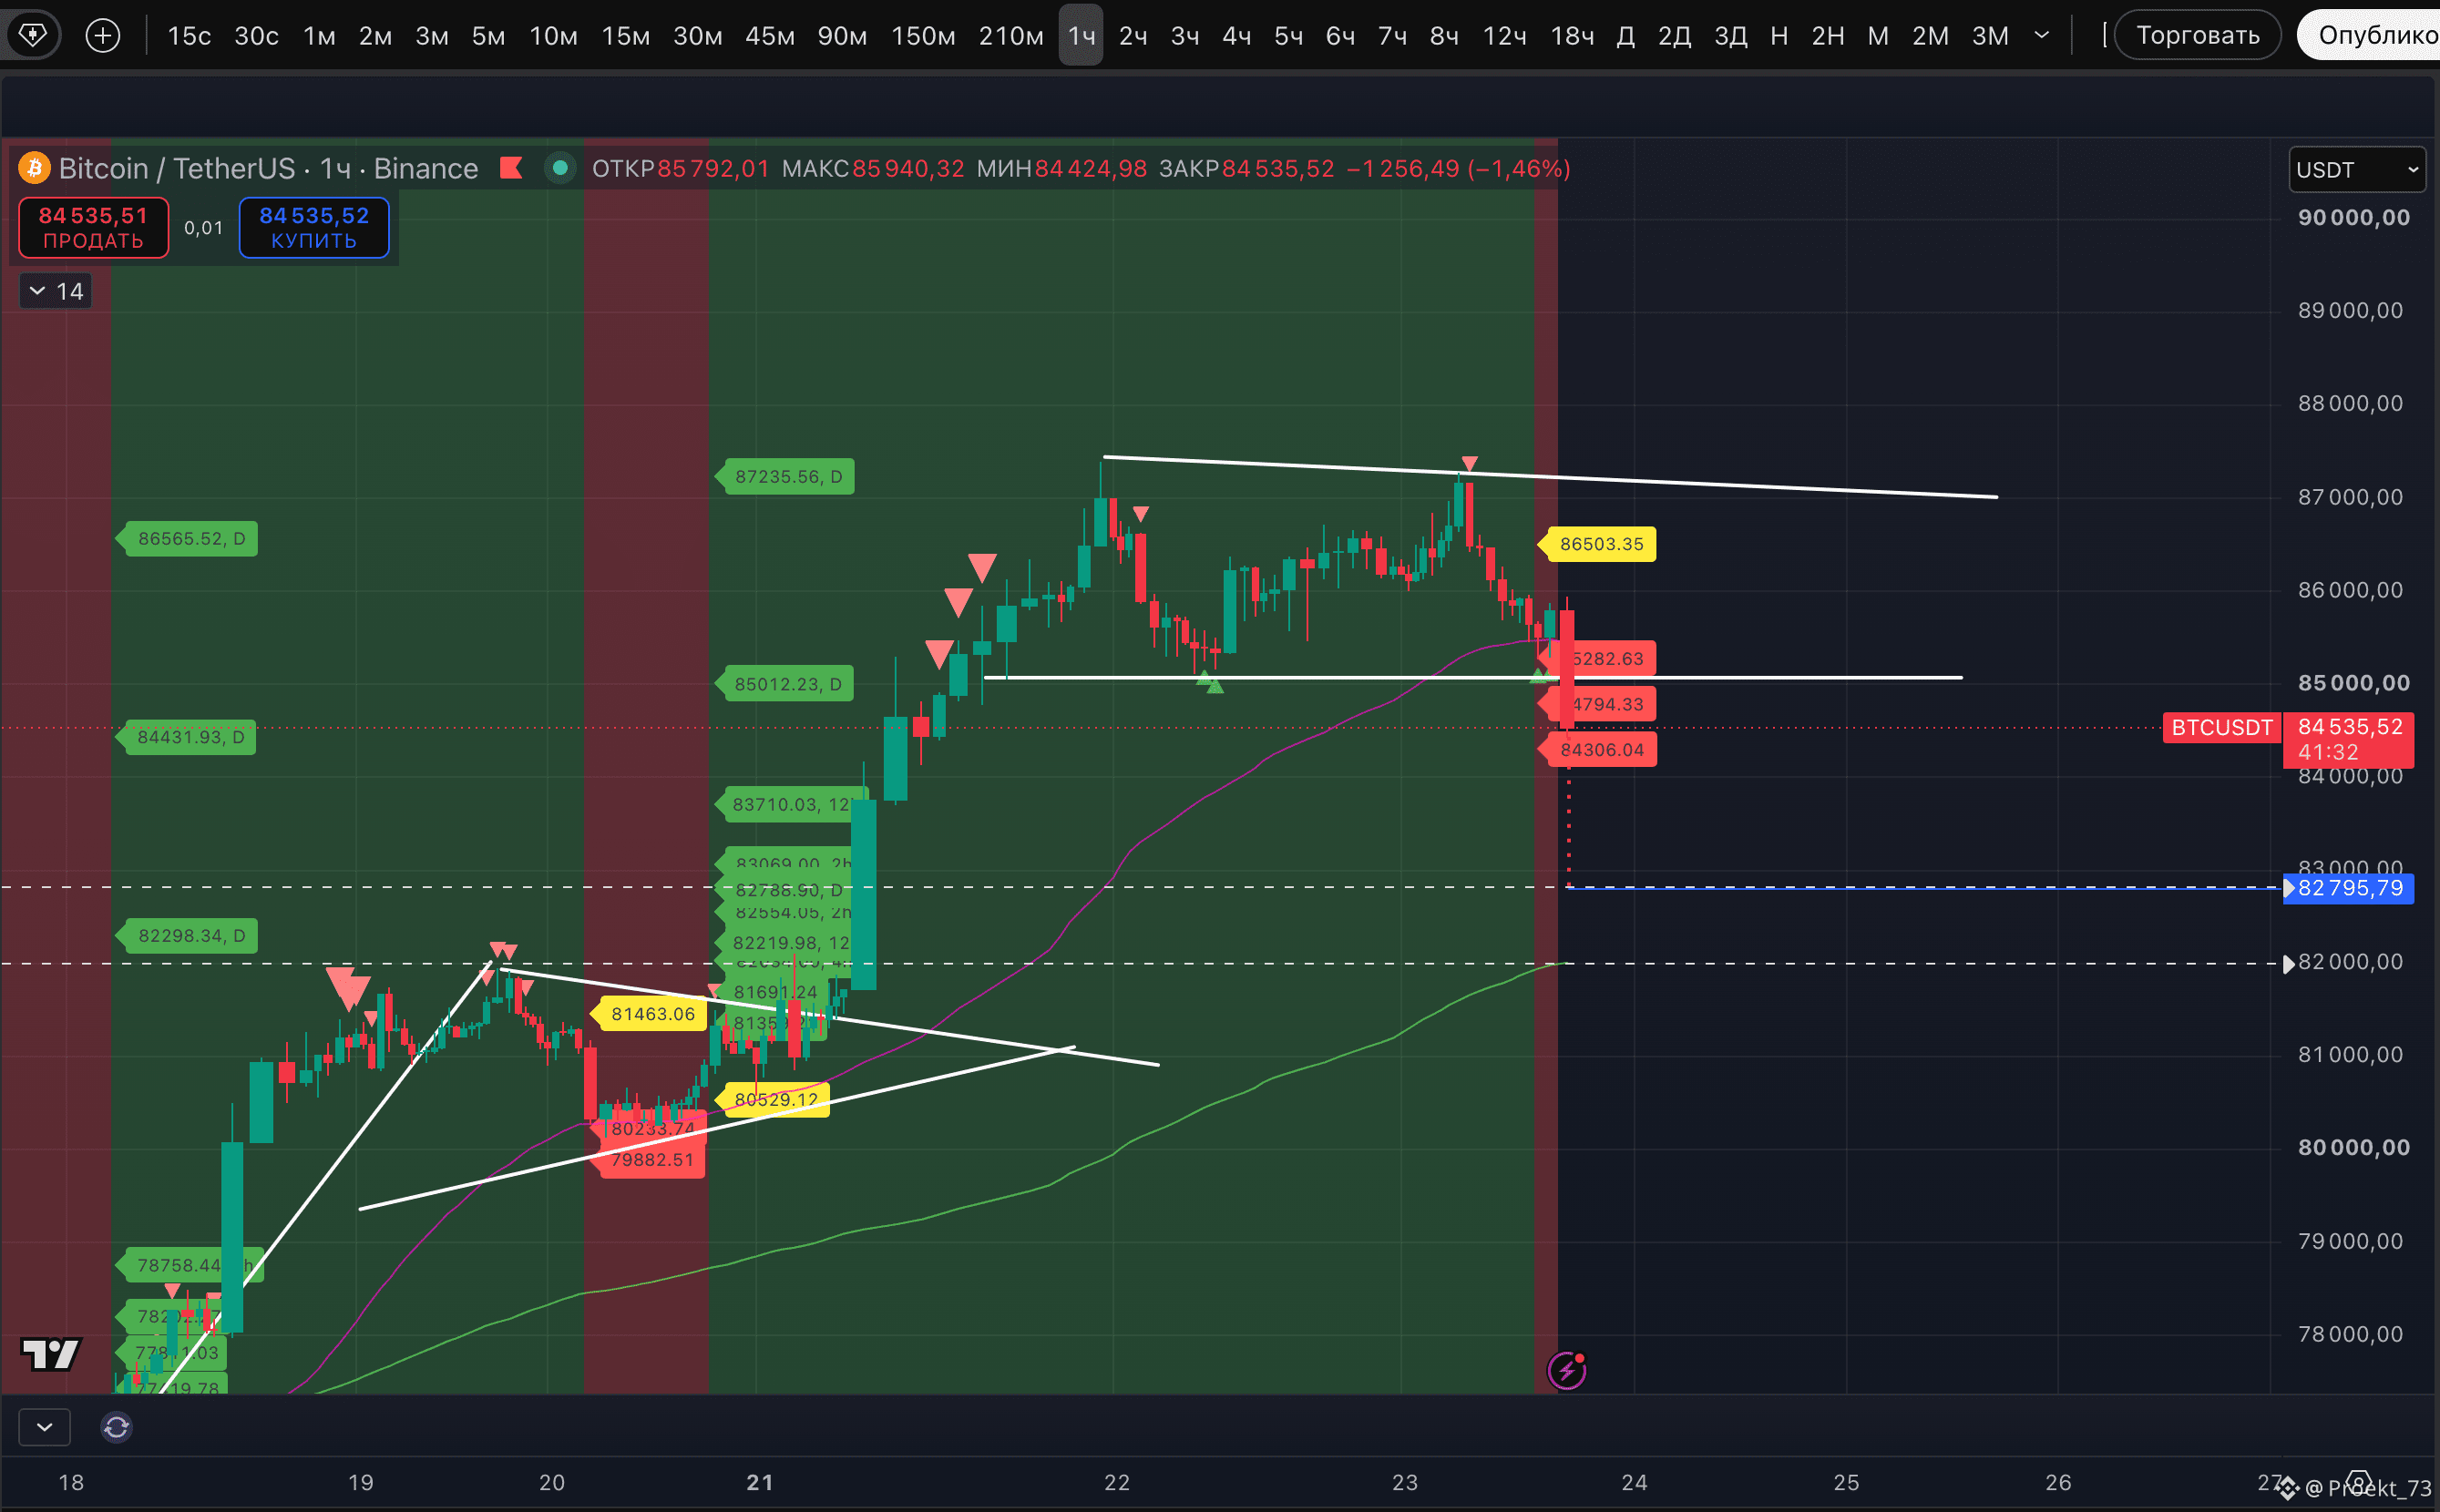
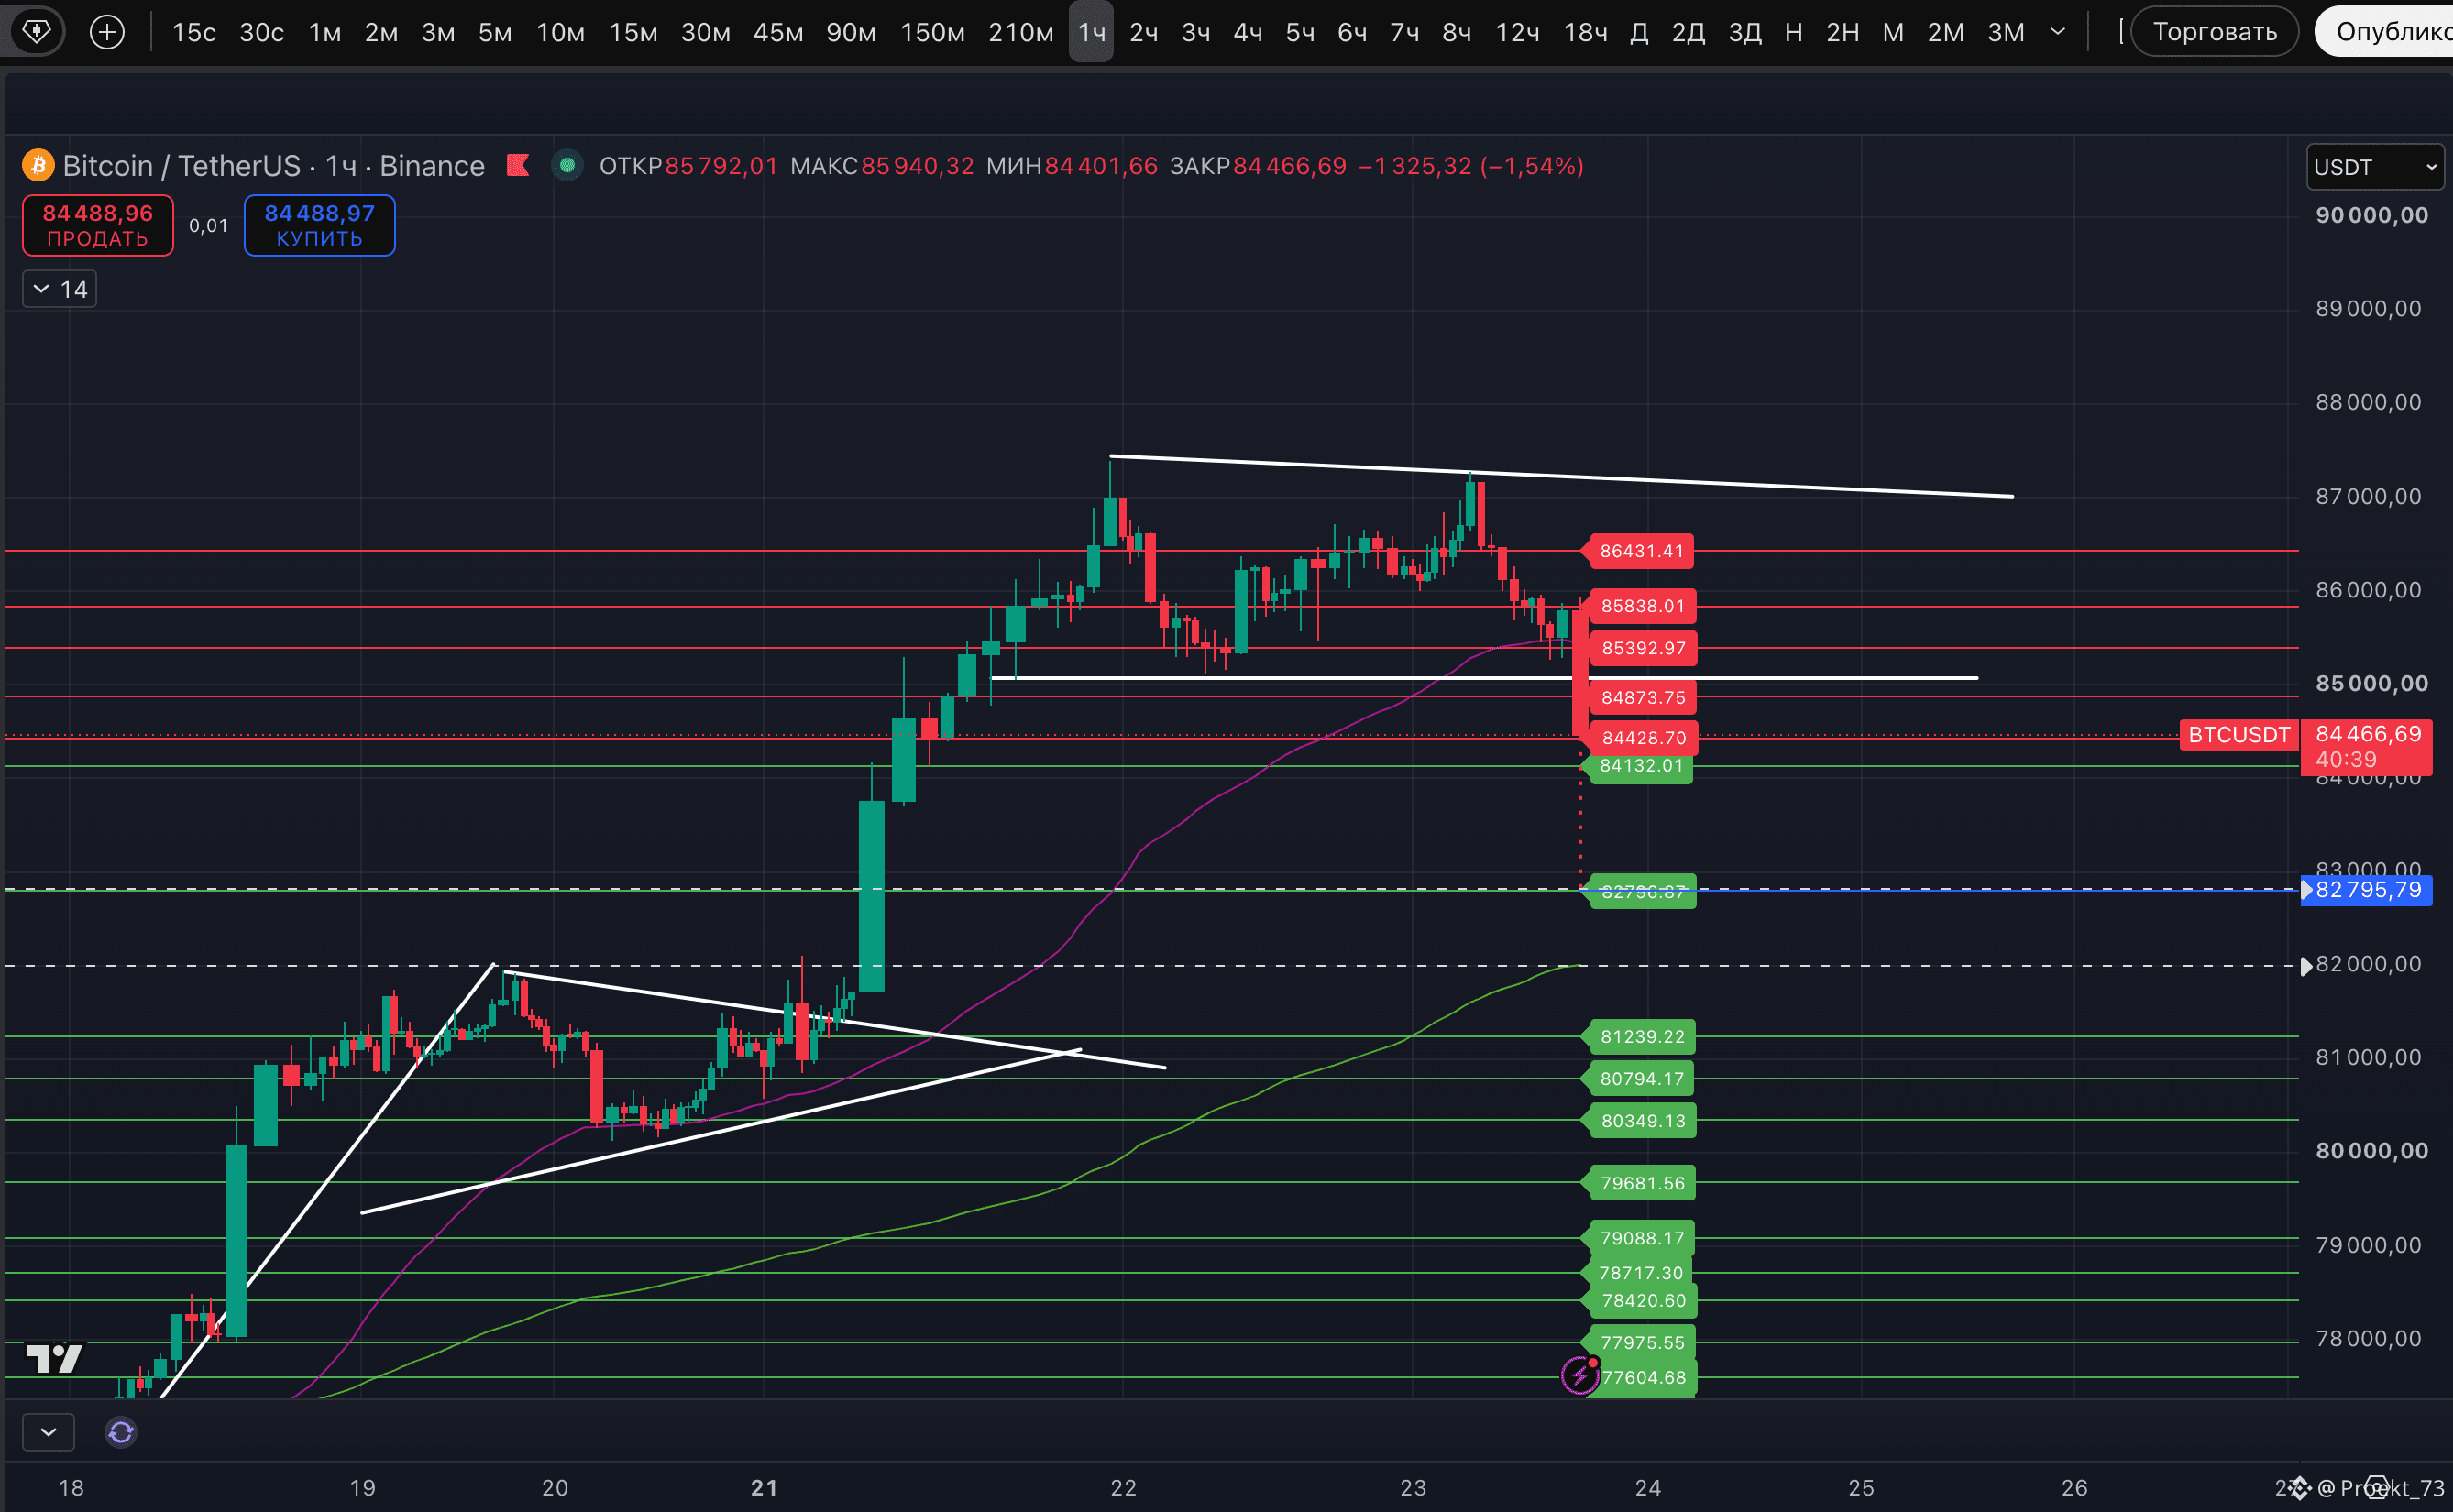
BTC breaks the psychological $85,000 mark, kicking off the execution of the “Double Top” pattern. With a full target of $82,795. Even though it’s somehow unusual to run the target downwards rather than upwards. Literally just before this impulse, we were discussing in the chat that price has entered a range and is forming a potential new “Bullish Pennant,” against the execution of which local trends are currently — for now — working. And as we can see, they are strongly against it.
Since the last review, which warned about a fresh downtrend, another one has been added — on the 1-hour timeframe. And at this point, the second of its targets has already been completed at $84,794. The third remains at $84,306.
The expected bounce still isn’t showing up, but at the same time there are already three marks of potential lows on the 1-hour timeframe, which makes us wait a bit longer. But overall, buyers today are not in shape.
By the way, according to our horizontal levels indicator, the situation is as follows: in the event of a break of 84 132$ , the price may accelerate and quickly reach $82,790. And that, again, is close to the “Double Top” target.
BTC breaks the psychological $85,000 mark, kicking off the execution of the “Double Top” pattern. With a full target of $82,795. Even though it’s somehow unusual to run the target downwards rather than upwards. Literally just before this impulse, we were discussing in the chat that price has entered a range and is forming a potential new “Bullish Pennant,” against the execution of which local trends are currently — for now — working. And as we can see, they are strongly against it.
Since the last review, which warned about a fresh downtrend, another one has been added — on the 1-hour timeframe. And at this point, the second of its targets has already been completed at $84,794. The third remains at $84,306.
The expected bounce still isn’t showing up, but at the same time there are already three marks of potential lows on the 1-hour timeframe, which makes us wait a bit longer. But overall, buyers today are not in shape.
By the way, according to our horizontal levels indicator, the situation is as follows: in the event of a break of 84 132$ , the price may accelerate and quickly reach $82,790. And that, again, is close to the “Double Top” target.
Since the last review, which warned about a fresh downtrend, another one has been added — on the 1-hour timeframe. And at this point, the second of its targets has already been completed at $84,794. The third remains at $84,306.
The expected bounce still isn’t showing up, but at the same time there are already three marks of potential lows on the 1-hour timeframe, which makes us wait a bit longer. But overall, buyers today are not in shape.
By the way, according to our horizontal levels indicator, the situation is as follows: in the event of a break of 84 132$ , the price may accelerate and quickly reach $82,790. And that, again, is close to the “Double Top” target.
3
14
4.7k
·
--
Article
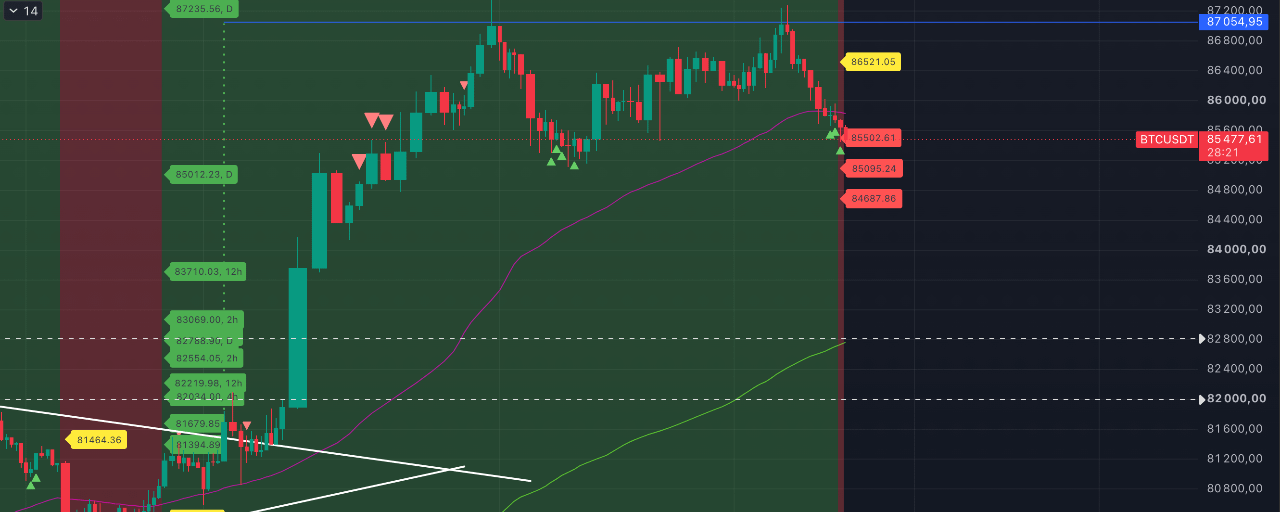
BTC has entered a sustained downtrend on the 45-minute timeframe, which is for us — "to the starting line" — for a new short add-onBTC has entered a sustained downtrend on the 45-minute timeframe, which is — "to the starting line" — for us for a new short attempt.
Against this background, especially since #BTC has shown (but still needs to hold) the fourth additional mark of a potential high on the 12- and 18-hour timeframe. They signal a new attempt at a correction after three marks following the failed attempt to break above. But it’s important to wait until the mark remains on the candles as confirmed after they close.
BTC has entered a sustained downtrend on the 45-minute timeframe, which is for us — "to the starting line" — for a new short add-on
BTC has entered a sustained downtrend on the 45-minute timeframe, which is — "to the starting line" — for us for a new short attempt.
Against this background, especially since #BTC has shown (but still needs to hold) the fourth additional mark of a potential high on the 12- and 18-hour timeframe. They signal a new attempt at a correction after three marks following the failed attempt to break above. But it’s important to wait until the mark remains on the candles as confirmed after they close.
Against this background, especially since #BTC has shown (but still needs to hold) the fourth additional mark of a potential high on the 12- and 18-hour timeframe. They signal a new attempt at a correction after three marks following the failed attempt to break above. But it’s important to wait until the mark remains on the candles as confirmed after they close.
2
10
4.8k
·
--
Article
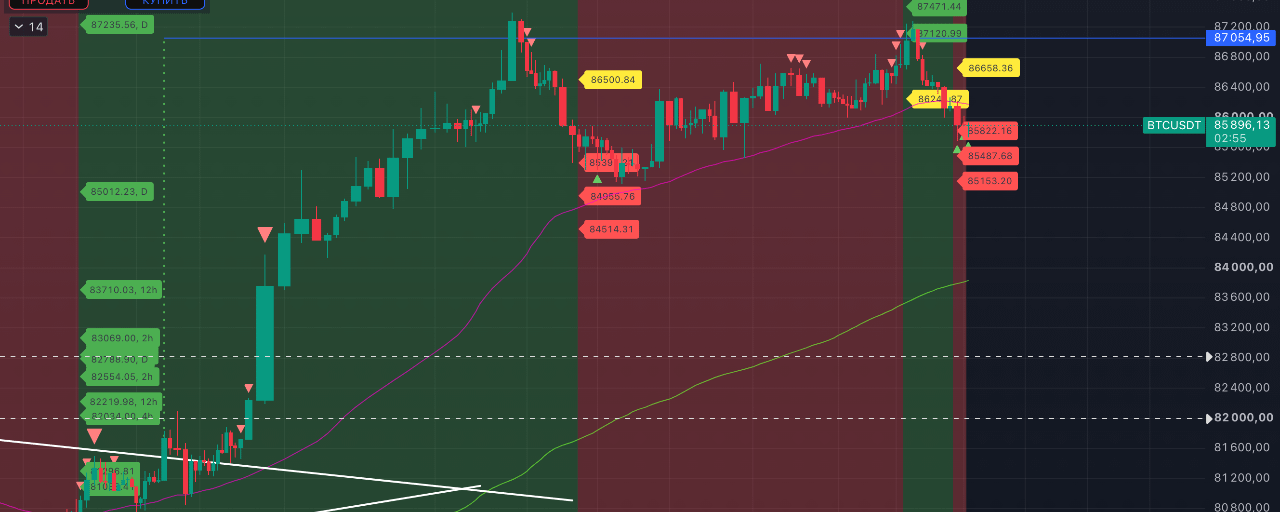
BTC overnight on September 23 nearly broke the local highBTC overnight on September 23 almost broke the local high. And at that moment, I got a steady uptrend on the 30-minute timeframe. That is what made us start talking about the return of elevated risk for the bears. BUT in the end, this uptrend turned out to be false, and after the trend change, the price immediately moved into a correction and broke it.
BTC overnight on September 23 nearly broke the local high
BTC overnight on September 23 almost broke the local high. And at that moment, I got a steady uptrend on the 30-minute timeframe. That is what made us start talking about the return of elevated risk for the bears. BUT in the end, this uptrend turned out to be false, and after the trend change, the price immediately moved into a correction and broke it.
9
4.4k
·
--
Article
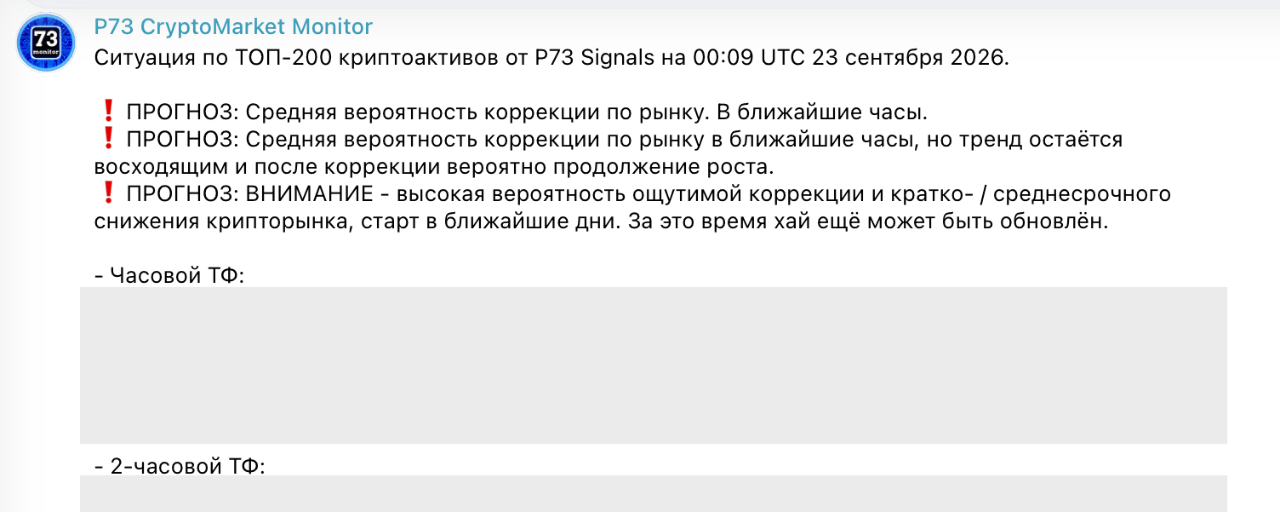
This night, our P73 CryptoMarket Monitor subscribers received an important signal regarding extremesThis night, our P73 CryptoMarket Monitor subscribers received an important signal regarding extremes.
50 assets from the TOP-200 received a potential top label on the daily timeframe, and another 9 assets received a Strong signal for a potential top. The list includes such assets as #AVAX, #BNB, #HYPE, #LINK, #NEAR, #SOL. Many of the growth leaders.
This night, our P73 CryptoMarket Monitor subscribers received an important signal regarding extremes
This night, our P73 CryptoMarket Monitor subscribers received an important signal regarding extremes.
50 assets from the TOP-200 received a potential top label on the daily timeframe, and another 9 assets received a Strong signal for a potential top. The list includes such assets as #AVAX, #BNB, #HYPE, #LINK, #NEAR, #SOL. Many of the growth leaders.
50 assets from the TOP-200 received a potential top label on the daily timeframe, and another 9 assets received a Strong signal for a potential top. The list includes such assets as #AVAX, #BNB, #HYPE, #LINK, #NEAR, #SOL. Many of the growth leaders.
4
13
3.4k
·
--
Verified
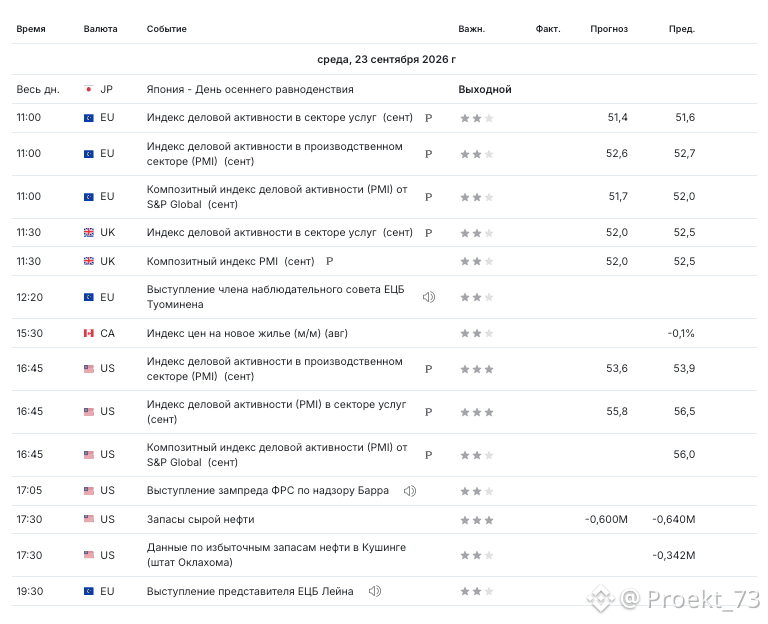
Important events for the crypto market on September 23 from the economic calendar.
Today is one of the three main macro data days of the week. But not the key one. Second in importance. The reason is the business activity indexes in the United States.
Schedule for the day:
In Japan, it’s a holiday.
- 11:00 Kyiv and MSK / 13:00 Astana — Eurozone business activity index block for September:
-- Business activity index in the services sector.
-- Business activity index in the manufacturing sector.
-- Composite business activity index from S&P Global.
Important due to the euro’s role in the DXY calculation and for assessing the state of the Eurozone economy.
- 11:30 Kyiv and MSK / 13:30 Astana — Business activity index in the UK services sector and the composite PMI for September. Important due to the role of the British pound in the DXY calculation.
❗️- 16:45 Kyiv and MSK / 18:45 Astana — US business activity index block for September:
-- Business activity index in the manufacturing sector.
-- Business activity index in the services sector.
-- Composite business activity index from S&P Global.
This is an important set for assessing the state of the US economy, slowdown risks, and expectations for the Fed rate.
- 17:05 Kyiv and MSK / 19:05 Astana — Remarks by the Fed Vice Chair for Supervision, Barr.
Important events for the crypto market on September 23 from the economic calendar.
Today is one of the three main macro data days of the week. But not the key one. Second in importance. The reason is the business activity indexes in the United States.
Schedule for the day:
In Japan, it’s a holiday.
- 11:00 Kyiv and MSK / 13:00 Astana — Eurozone business activity index block for September:
-- Business activity index in the services sector.
-- Business activity index in the manufacturing sector.
-- Composite business activity index from S&P Global.
Important due to the euro’s role in the DXY calculation and for assessing the state of the Eurozone economy.
- 11:30 Kyiv and MSK / 13:30 Astana — Business activity index in the UK services sector and the composite PMI for September. Important due to the role of the British pound in the DXY calculation.
❗️- 16:45 Kyiv and MSK / 18:45 Astana — US business activity index block for September:
-- Business activity index in the manufacturing sector.
-- Business activity index in the services sector.
-- Composite business activity index from S&P Global.
This is an important set for assessing the state of the US economy, slowdown risks, and expectations for the Fed rate.
- 17:05 Kyiv and MSK / 19:05 Astana — Remarks by the Fed Vice Chair for Supervision, Barr.
Today is one of the three main macro data days of the week. But not the key one. Second in importance. The reason is the business activity indexes in the United States.
Schedule for the day:
In Japan, it’s a holiday.
- 11:00 Kyiv and MSK / 13:00 Astana — Eurozone business activity index block for September:
-- Business activity index in the services sector.
-- Business activity index in the manufacturing sector.
-- Composite business activity index from S&P Global.
Important due to the euro’s role in the DXY calculation and for assessing the state of the Eurozone economy.
- 11:30 Kyiv and MSK / 13:30 Astana — Business activity index in the UK services sector and the composite PMI for September. Important due to the role of the British pound in the DXY calculation.
❗️- 16:45 Kyiv and MSK / 18:45 Astana — US business activity index block for September:
-- Business activity index in the manufacturing sector.
-- Business activity index in the services sector.
-- Composite business activity index from S&P Global.
This is an important set for assessing the state of the US economy, slowdown risks, and expectations for the Fed rate.
- 17:05 Kyiv and MSK / 19:05 Astana — Remarks by the Fed Vice Chair for Supervision, Barr.
8
3.9k
·
--
Article
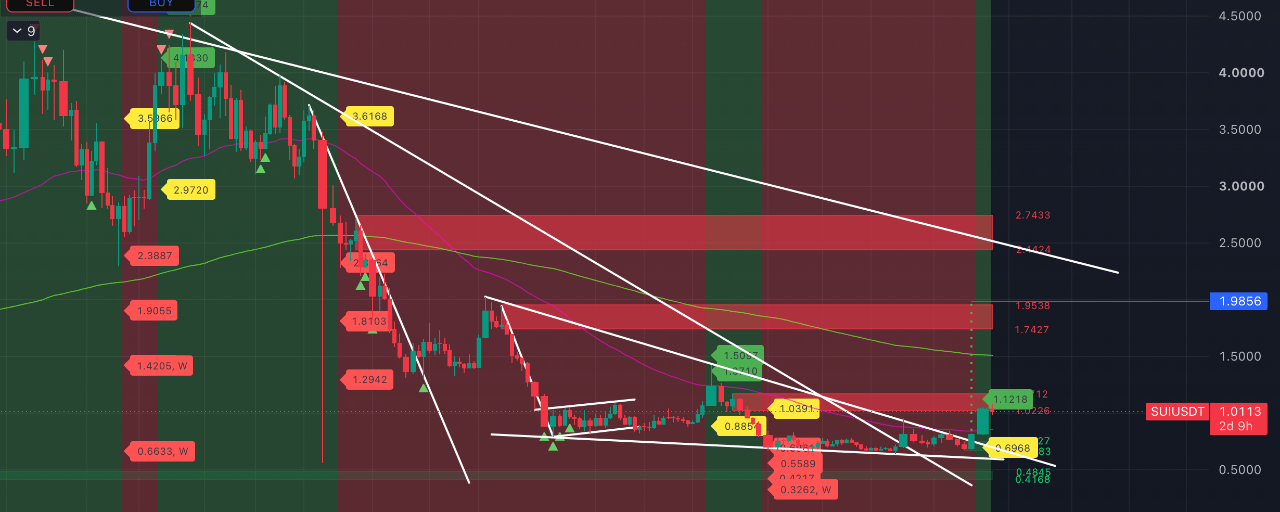
Let’s also show a few altcoins that today shifted into a stable uptrend on the 3-day timeframeLet’s also show a few altcoins that today shifted into a stable uptrend on the 3-day timeframe. Today alone there were 8 transitions into an uptrend on this timeframe; we’ll show 4. The remaining ones are available to subscribers of our Monitor and the 3-day timeframe signals channel.
- #SUI. The first attempt at a bull reversal on this timeframe wasn’t too long ago, back in May. But the price fell through during the downtrend and moved into consolidation. Now there is a new impulse as part of the breakout from the “Bull Wedge” lasting throughout all of 2026. The wedge’s full target is $1.9856, and as long as the uptrend holds, the price is heading there. BUT it’s worth considering the impulsiveness of the rise and the fact that the price has now reached a liquidity zone. Here it makes sense to see a pullback to the nearest supports, and it would also be logical to see a retest of the EMA 50 breakout, which is currently at 0.8608$.
Let’s also show a few altcoins that today shifted into a stable uptrend on the 3-day timeframe
Let’s also show a few altcoins that today shifted into a stable uptrend on the 3-day timeframe. Today alone there were 8 transitions into an uptrend on this timeframe; we’ll show 4. The remaining ones are available to subscribers of our Monitor and the 3-day timeframe signals channel.
- #SUI. The first attempt at a bull reversal on this timeframe wasn’t too long ago, back in May. But the price fell through during the downtrend and moved into consolidation. Now there is a new impulse as part of the breakout from the “Bull Wedge” lasting throughout all of 2026. The wedge’s full target is $1.9856, and as long as the uptrend holds, the price is heading there. BUT it’s worth considering the impulsiveness of the rise and the fact that the price has now reached a liquidity zone. Here it makes sense to see a pullback to the nearest supports, and it would also be logical to see a retest of the EMA 50 breakout, which is currently at 0.8608$.
- #SUI. The first attempt at a bull reversal on this timeframe wasn’t too long ago, back in May. But the price fell through during the downtrend and moved into consolidation. Now there is a new impulse as part of the breakout from the “Bull Wedge” lasting throughout all of 2026. The wedge’s full target is $1.9856, and as long as the uptrend holds, the price is heading there. BUT it’s worth considering the impulsiveness of the rise and the fact that the price has now reached a liquidity zone. Here it makes sense to see a pullback to the nearest supports, and it would also be logical to see a retest of the EMA 50 breakout, which is currently at 0.8608$.
1
1
9
5k
·
--
Article
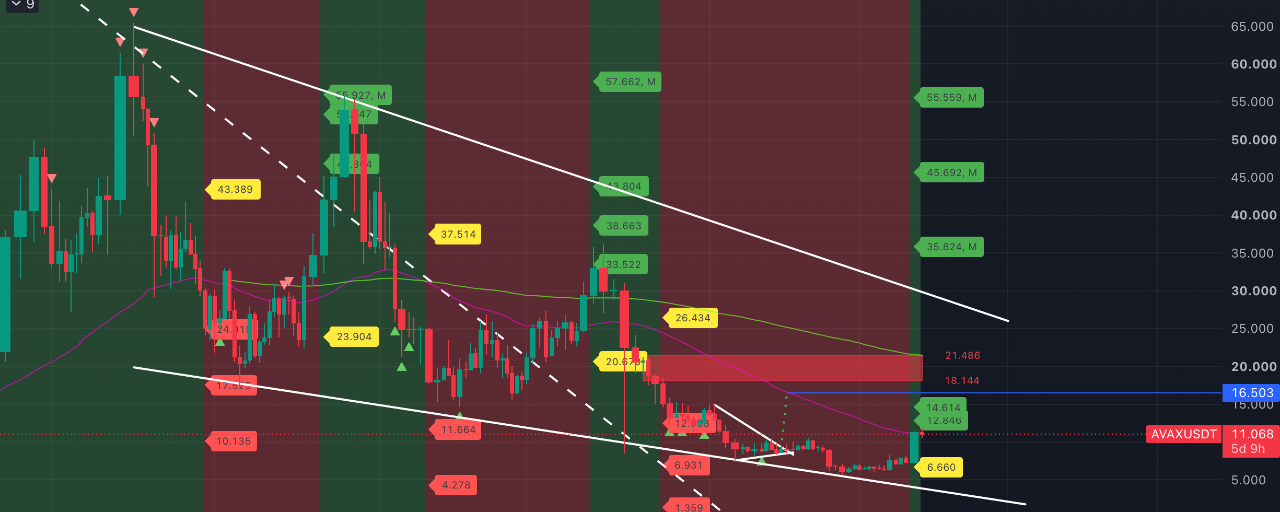
Which altcoins from the TOP-200 moved into a sustained app trend on the weekly timeframe this week?Which altcoins from the TOP-200 moved into a sustained app trend on the weekly timeframe this week?
Note that this week the shift in the app trend showed #BTC, for the first time since October 2025, and this is the most important thing for market prospects, a bull market.
BUT considering how altcoins behaved in 2024–2026, you shouldn’t assume that a shift into a bull market for BTC automatically means a shift for all altcoins.
Which altcoins from the TOP-200 moved into a sustained app trend on the weekly timeframe this week?
Which altcoins from the TOP-200 moved into a sustained app trend on the weekly timeframe this week?
Note that this week the shift in the app trend showed #BTC, for the first time since October 2025, and this is the most important thing for market prospects, a bull market.
BUT considering how altcoins behaved in 2024–2026, you shouldn’t assume that a shift into a bull market for BTC automatically means a shift for all altcoins.
Note that this week the shift in the app trend showed #BTC, for the first time since October 2025, and this is the most important thing for market prospects, a bull market.
BUT considering how altcoins behaved in 2024–2026, you shouldn’t assume that a shift into a bull market for BTC automatically means a shift for all altcoins.
1
18
5.8k
Log in to explore more content
Join global crypto users on Binance Square
⚡️ Get latest and useful information about crypto.
💬 Trusted by the world’s largest crypto exchange.
👍 Discover real insights from verified creators.
Email / Phone number