
Bloock CHAIN 1
5k Posts

Bloock CHAIN 1
Report
Block User
he crypto sajjad Ahmed 804 market price trading value and all coin
14 Following
28.0K+ Followers
9.2K+ Liked
Posts
All
Quotes
Live
HUMA Finance Surges 31.63%: Is HUMA Preparing for Another Breakout?
HUMA Finance is attracting significant market attention after delivering a strong 31.63% gain, pushing the HUMA/USDT price toward $0.00878. The move reflects growing trading activity, with 24-hour volume reaching approximately 2.06 billion HUMA and $18.22 million in USDT. This increase in activity suggests that traders are actively positioning around the token.
However, the latest price action deserves closer attention. After reaching the $0.01055 daily high, HUMA experienced a noticeable pullback. The short-term chart shows selling pressure pushing the price toward $0.00876 before buyers attempted a small recovery around $0.00878. This is an important area to monitor because the market is currently showing signs of hesitation after its strong upward move.
The immediate challenge for buyers is to regain momentum and push the price back above the $0.00890–$0.00900 region. A sustained move above this resistance area could improve short-term sentiment and potentially open the door toward $0.00950, followed by a retest of the $0.01000 psychological level.
On the downside, $0.00876 is the immediate short-term support visible on the chart. If sellers push the price below this level, further weakness could develop. A stronger correction may bring the previous $0.00850 area into focus.
My Trading Perspective
I am watching how HUMA behaves around its current support rather than chasing the recent rally. The significant volume spike shows increased participation, but buyers still need to demonstrate that they can defend the price and reclaim nearby resistance.
HUMA has already delivered an impressive daily move. The next important signal will be whether buyers can turn this pullback into another upward opportunity or whether sellers take control.
The next move could be decisive for HUMA traders.
$HUMA
{spot}(HUMAUSDT)
$MMT
{spot}(MMTUSDT)
$INJ
{spot}(INJUSDT)
HUMA Finance Surges 31.63%: Is HUMA Preparing for Another Breakout?
HUMA Finance is attracting significant market attention after delivering a strong 31.63% gain, pushing the HUMA/USDT price toward $0.00878. The move reflects growing trading activity, with 24-hour volume reaching approximately 2.06 billion HUMA and $18.22 million in USDT. This increase in activity suggests that traders are actively positioning around the token.
However, the latest price action deserves closer attention. After reaching the $0.01055 daily high, HUMA experienced a noticeable pullback. The short-term chart shows selling pressure pushing the price toward $0.00876 before buyers attempted a small recovery around $0.00878. This is an important area to monitor because the market is currently showing signs of hesitation after its strong upward move.
The immediate challenge for buyers is to regain momentum and push the price back above the $0.00890–$0.00900 region. A sustained move above this resistance area could improve short-term sentiment and potentially open the door toward $0.00950, followed by a retest of the $0.01000 psychological level.
On the downside, $0.00876 is the immediate short-term support visible on the chart. If sellers push the price below this level, further weakness could develop. A stronger correction may bring the previous $0.00850 area into focus.
My Trading Perspective
I am watching how HUMA behaves around its current support rather than chasing the recent rally. The significant volume spike shows increased participation, but buyers still need to demonstrate that they can defend the price and reclaim nearby resistance.
HUMA has already delivered an impressive daily move. The next important signal will be whether buyers can turn this pullback into another upward opportunity or whether sellers take control.
The next move could be decisive for HUMA traders.
$HUMA
$MMT
$INJ
HUMA Finance is attracting significant market attention after delivering a strong 31.63% gain, pushing the HUMA/USDT price toward $0.00878. The move reflects growing trading activity, with 24-hour volume reaching approximately 2.06 billion HUMA and $18.22 million in USDT. This increase in activity suggests that traders are actively positioning around the token.
However, the latest price action deserves closer attention. After reaching the $0.01055 daily high, HUMA experienced a noticeable pullback. The short-term chart shows selling pressure pushing the price toward $0.00876 before buyers attempted a small recovery around $0.00878. This is an important area to monitor because the market is currently showing signs of hesitation after its strong upward move.
The immediate challenge for buyers is to regain momentum and push the price back above the $0.00890–$0.00900 region. A sustained move above this resistance area could improve short-term sentiment and potentially open the door toward $0.00950, followed by a retest of the $0.01000 psychological level.
On the downside, $0.00876 is the immediate short-term support visible on the chart. If sellers push the price below this level, further weakness could develop. A stronger correction may bring the previous $0.00850 area into focus.
My Trading Perspective
I am watching how HUMA behaves around its current support rather than chasing the recent rally. The significant volume spike shows increased participation, but buyers still need to demonstrate that they can defend the price and reclaim nearby resistance.
HUMA has already delivered an impressive daily move. The next important signal will be whether buyers can turn this pullback into another upward opportunity or whether sellers take control.
The next move could be decisive for HUMA traders.
$HUMA
$MMT
$INJ
📈 Buyers are gaining strength
0%
🐻 Sellers are taking control
100%
⚔️ The battle between bulls
0%
🌟 Buyers may be preparing for
0%
1 votes • Voting closed
1
176
$TRX Gains 0.99% as Buyers Maintain Market Strength
is trading around $0.3059, showing a 0.99% increase over the last 24 hours. The asset is maintaining a positive position, reflecting relatively steady buying interest. The next important factor will be whether buyers can increase participation and push TRX toward stronger upward momentum. If demand remains consistent, another recovery attempt could develop. However, weaker volume may keep the price within a consolidation range. Traders should monitor upcoming market activity and important price levels before making trading decisions. TRX remains on the watchlist as the market evolves.
$TRX Gains 0.99% as Buyers Maintain Market Strength
is trading around $0.3059, showing a 0.99% increase over the last 24 hours. The asset is maintaining a positive position, reflecting relatively steady buying interest. The next important factor will be whether buyers can increase participation and push TRX toward stronger upward momentum. If demand remains consistent, another recovery attempt could develop. However, weaker volume may keep the price within a consolidation range. Traders should monitor upcoming market activity and important price levels before making trading decisions. TRX remains on the watchlist as the market evolves.
is trading around $0.3059, showing a 0.99% increase over the last 24 hours. The asset is maintaining a positive position, reflecting relatively steady buying interest. The next important factor will be whether buyers can increase participation and push TRX toward stronger upward momentum. If demand remains consistent, another recovery attempt could develop. However, weaker volume may keep the price within a consolidation range. Traders should monitor upcoming market activity and important price levels before making trading decisions. TRX remains on the watchlist as the market evolves.
24
$DOGE Dogecoin Maintains a Small Gain as Traders Watch Momentum
Dogecoin is trading around $0.05871, showing a 0.38% increase over the last 24 hours. The movement remains relatively limited, suggesting that the market has not yet established strong directional momentum. Buyers will need to demonstrate stronger demand before DOGE can attempt a meaningful upward move. Trading volume and broader market sentiment could play an important role in determining its next direction. If participation remains weak, consolidation may continue. Traders should watch for a clear change in momentum rather than reacting to small price fluctuations.
$DOGE Dogecoin Maintains a Small Gain as Traders Watch Momentum
Dogecoin is trading around $0.05871, showing a 0.38% increase over the last 24 hours. The movement remains relatively limited, suggesting that the market has not yet established strong directional momentum. Buyers will need to demonstrate stronger demand before DOGE can attempt a meaningful upward move. Trading volume and broader market sentiment could play an important role in determining its next direction. If participation remains weak, consolidation may continue. Traders should watch for a clear change in momentum rather than reacting to small price fluctuations.
Dogecoin is trading around $0.05871, showing a 0.38% increase over the last 24 hours. The movement remains relatively limited, suggesting that the market has not yet established strong directional momentum. Buyers will need to demonstrate stronger demand before DOGE can attempt a meaningful upward move. Trading volume and broader market sentiment could play an important role in determining its next direction. If participation remains weak, consolidation may continue. Traders should watch for a clear change in momentum rather than reacting to small price fluctuations.
34
$SOPH Surges 11.24% as Bullish Activity Increases
Sophon is trading near $0.00099, recording an impressive 11.24% gain over the last 24 hours. This places SOPH among the strongest gainers in the provided market snapshot. The increase suggests growing trader attention and improving short-term momentum. However, sharp rallies can also attract profit-taking, creating additional volatility. Buyers will need to maintain demand and support the current price action if the recovery is to continue. Traders should carefully monitor volume and avoid entering positions without confirmation. SOPH is definitely an asset worth watching.
$SOPH Surges 11.24% as Bullish Activity Increases
Sophon is trading near $0.00099, recording an impressive 11.24% gain over the last 24 hours. This places SOPH among the strongest gainers in the provided market snapshot. The increase suggests growing trader attention and improving short-term momentum. However, sharp rallies can also attract profit-taking, creating additional volatility. Buyers will need to maintain demand and support the current price action if the recovery is to continue. Traders should carefully monitor volume and avoid entering positions without confirmation. SOPH is definitely an asset worth watching.
Sophon is trading near $0.00099, recording an impressive 11.24% gain over the last 24 hours. This places SOPH among the strongest gainers in the provided market snapshot. The increase suggests growing trader attention and improving short-term momentum. However, sharp rallies can also attract profit-taking, creating additional volatility. Buyers will need to maintain demand and support the current price action if the recovery is to continue. Traders should carefully monitor volume and avoid entering positions without confirmation. SOPH is definitely an asset worth watching.
766
$NEAR Protocol Advances 2.18% as Buyers Gain Confidence
NEAR Protocol is trading around $3.232, showing a 2.18% increase over the past 24 hours. The positive performance suggests improving short-term market sentiment. Buyers are showing interest, but stronger participation will be necessary to support a continued recovery. If volume increases and demand remains consistent, NEAR could attempt to move toward higher price levels. However, weakening buying pressure could lead to consolidation. Traders should closely follow the next price movements to determine whether this positive performance can develop into a stronger trend.
$NEAR Protocol Advances 2.18% as Buyers Gain Confidence
NEAR Protocol is trading around $3.232, showing a 2.18% increase over the past 24 hours. The positive performance suggests improving short-term market sentiment. Buyers are showing interest, but stronger participation will be necessary to support a continued recovery. If volume increases and demand remains consistent, NEAR could attempt to move toward higher price levels. However, weakening buying pressure could lead to consolidation. Traders should closely follow the next price movements to determine whether this positive performance can develop into a stronger trend.
NEAR Protocol is trading around $3.232, showing a 2.18% increase over the past 24 hours. The positive performance suggests improving short-term market sentiment. Buyers are showing interest, but stronger participation will be necessary to support a continued recovery. If volume increases and demand remains consistent, NEAR could attempt to move toward higher price levels. However, weakening buying pressure could lead to consolidation. Traders should closely follow the next price movements to determine whether this positive performance can develop into a stronger trend.
92
$SUI Holds Green Territory as Market Momentum Develops
SUI is currently trading at $0.7211, recording a 0.64% increase over the last 24 hours. Although the gain is relatively modest, the asset is maintaining positive territory. The important question now is whether buyers can build enough momentum to support a stronger recovery. Increased trading volume could improve the outlook, while a decline in demand may keep SUI moving sideways. Traders should monitor market participation and price stability before expecting a significant breakout. The next sessions could reveal the strength behind this recovery.
$SUI Holds Green Territory as Market Momentum Develops
SUI is currently trading at $0.7211, recording a 0.64% increase over the last 24 hours. Although the gain is relatively modest, the asset is maintaining positive territory. The important question now is whether buyers can build enough momentum to support a stronger recovery. Increased trading volume could improve the outlook, while a decline in demand may keep SUI moving sideways. Traders should monitor market participation and price stability before expecting a significant breakout. The next sessions could reveal the strength behind this recovery.
SUI is currently trading at $0.7211, recording a 0.64% increase over the last 24 hours. Although the gain is relatively modest, the asset is maintaining positive territory. The important question now is whether buyers can build enough momentum to support a stronger recovery. Increased trading volume could improve the outlook, while a decline in demand may keep SUI moving sideways. Traders should monitor market participation and price stability before expecting a significant breakout. The next sessions could reveal the strength behind this recovery.
1
1
108
$ZEC Zcash Outperforms Major Coins With a 3.11% Gain
Zcash is trading around $913.92, gaining 3.11% over the last 24 hours. This makes ZEC one of the strongest performers among the assets shown in the market snapshot. The recent increase suggests improving buying interest and positive short-term momentum. However, traders should watch whether this strength continues or whether early buyers begin taking profits. Sustained volume could help support another upward attempt. A sudden decline in demand may create a temporary correction. ZEC deserves attention as traders evaluate its next potential move.
$ZEC Zcash Outperforms Major Coins With a 3.11% Gain
Zcash is trading around $913.92, gaining 3.11% over the last 24 hours. This makes ZEC one of the strongest performers among the assets shown in the market snapshot. The recent increase suggests improving buying interest and positive short-term momentum. However, traders should watch whether this strength continues or whether early buyers begin taking profits. Sustained volume could help support another upward attempt. A sudden decline in demand may create a temporary correction. ZEC deserves attention as traders evaluate its next potential move.
Zcash is trading around $913.92, gaining 3.11% over the last 24 hours. This makes ZEC one of the strongest performers among the assets shown in the market snapshot. The recent increase suggests improving buying interest and positive short-term momentum. However, traders should watch whether this strength continues or whether early buyers begin taking profits. Sustained volume could help support another upward attempt. A sudden decline in demand may create a temporary correction. ZEC deserves attention as traders evaluate its next potential move.
130
$HUMA Explodes 31.41% as Trading Interest Surges
HUMA is trading near $0.00841, recording an impressive 31.41% gain over the last 24 hours. This is the strongest percentage performance among the 13 cryptocurrencies in the provided snapshot. Such a sharp increase can attract additional market attention, but it also brings significant volatility. Traders should watch whether buyers can defend the recent gains and maintain strong volume. Profit-taking could create sudden price fluctuations after such a rally. The next trading sessions will be important in determining whether HUMA can extend its upward momentum.
$HUMA Explodes 31.41% as Trading Interest Surges
HUMA is trading near $0.00841, recording an impressive 31.41% gain over the last 24 hours. This is the strongest percentage performance among the 13 cryptocurrencies in the provided snapshot. Such a sharp increase can attract additional market attention, but it also brings significant volatility. Traders should watch whether buyers can defend the recent gains and maintain strong volume. Profit-taking could create sudden price fluctuations after such a rally. The next trading sessions will be important in determining whether HUMA can extend its upward momentum.
HUMA is trading near $0.00841, recording an impressive 31.41% gain over the last 24 hours. This is the strongest percentage performance among the 13 cryptocurrencies in the provided snapshot. Such a sharp increase can attract additional market attention, but it also brings significant volatility. Traders should watch whether buyers can defend the recent gains and maintain strong volume. Profit-taking could create sudden price fluctuations after such a rally. The next trading sessions will be important in determining whether HUMA can extend its upward momentum.
111
$PEPE Climbs 2.12% as Meme Coin Interest Returns
PEPE is currently trading near $0.00000385, gaining 2.12% over the past 24 hours. The positive movement suggests renewed interest among meme coin traders. However, PEPE remains highly volatile, and sudden changes in market sentiment can quickly influence its price. Buyers will need to maintain strong participation if the recovery is to continue. An increase in trading volume could support further upside, while declining demand may trigger a pullback. Traders should avoid chasing sudden price movements and wait for stronger confirmation before making decisions.
$PEPE Climbs 2.12% as Meme Coin Interest Returns
PEPE is currently trading near $0.00000385, gaining 2.12% over the past 24 hours. The positive movement suggests renewed interest among meme coin traders. However, PEPE remains highly volatile, and sudden changes in market sentiment can quickly influence its price. Buyers will need to maintain strong participation if the recovery is to continue. An increase in trading volume could support further upside, while declining demand may trigger a pullback. Traders should avoid chasing sudden price movements and wait for stronger confirmation before making decisions.
PEPE is currently trading near $0.00000385, gaining 2.12% over the past 24 hours. The positive movement suggests renewed interest among meme coin traders. However, PEPE remains highly volatile, and sudden changes in market sentiment can quickly influence its price. Buyers will need to maintain strong participation if the recovery is to continue. An increase in trading volume could support further upside, while declining demand may trigger a pullback. Traders should avoid chasing sudden price movements and wait for stronger confirmation before making decisions.
2
135
$XRP Maintains Positive Momentum Above $0.95
XRP is trading around $0.9563, recording a 0.67% gain over the last 24 hours. The market is showing a modest recovery, with buyers attempting to maintain control. The next challenge for XRP will be attracting stronger demand to support a more meaningful upward move. If buying pressure increases, the asset could continue its recovery. However, weakening momentum may result in sideways price action. Traders should monitor volume and important support and resistance areas. XRP's next move could provide a clearer picture of short-term market sentiment.
$XRP Maintains Positive Momentum Above $0.95
XRP is trading around $0.9563, recording a 0.67% gain over the last 24 hours. The market is showing a modest recovery, with buyers attempting to maintain control. The next challenge for XRP will be attracting stronger demand to support a more meaningful upward move. If buying pressure increases, the asset could continue its recovery. However, weakening momentum may result in sideways price action. Traders should monitor volume and important support and resistance areas. XRP's next move could provide a clearer picture of short-term market sentiment.
XRP is trading around $0.9563, recording a 0.67% gain over the last 24 hours. The market is showing a modest recovery, with buyers attempting to maintain control. The next challenge for XRP will be attracting stronger demand to support a more meaningful upward move. If buying pressure increases, the asset could continue its recovery. However, weakening momentum may result in sideways price action. Traders should monitor volume and important support and resistance areas. XRP's next move could provide a clearer picture of short-term market sentiment.
104
$ETH Ethereum Builds Positive Momentum as Buyers Return
Ethereum is currently trading at $1,818.02, gaining 0.95% in the past 24 hours. The latest movement indicates improving buying interest, although the market still needs stronger confirmation before expecting a major breakout. If buyers maintain control and trading volume increases, ETH could attempt to extend its recovery. On the other hand, weakening demand may push the price into another consolidation phase. Traders should watch the upcoming price action carefully. Ethereum's ability to maintain its positive momentum will be important for the broader altcoin market.
$ETH Ethereum Builds Positive Momentum as Buyers Return
Ethereum is currently trading at $1,818.02, gaining 0.95% in the past 24 hours. The latest movement indicates improving buying interest, although the market still needs stronger confirmation before expecting a major breakout. If buyers maintain control and trading volume increases, ETH could attempt to extend its recovery. On the other hand, weakening demand may push the price into another consolidation phase. Traders should watch the upcoming price action carefully. Ethereum's ability to maintain its positive momentum will be important for the broader altcoin market.
Ethereum is currently trading at $1,818.02, gaining 0.95% in the past 24 hours. The latest movement indicates improving buying interest, although the market still needs stronger confirmation before expecting a major breakout. If buyers maintain control and trading volume increases, ETH could attempt to extend its recovery. On the other hand, weakening demand may push the price into another consolidation phase. Traders should watch the upcoming price action carefully. Ethereum's ability to maintain its positive momentum will be important for the broader altcoin market.
44
$SOL Solana Gains 2.29% as Bullish Momentum Improves
Solana is trading around $72.34, showing a 2.29% increase over the last 24 hours. SOL is demonstrating stronger performance compared with several other major cryptocurrencies in the current market snapshot. Buyers appear more active, but maintaining this strength will be essential for further upside. If buying pressure continues to increase, Solana could attempt another upward move. However, traders should remain alert for profit-taking after the recent gains. The coming sessions will help determine whether this movement develops into a sustained recovery or a temporary bounce.
$SOL Solana Gains 2.29% as Bullish Momentum Improves
Solana is trading around $72.34, showing a 2.29% increase over the last 24 hours. SOL is demonstrating stronger performance compared with several other major cryptocurrencies in the current market snapshot. Buyers appear more active, but maintaining this strength will be essential for further upside. If buying pressure continues to increase, Solana could attempt another upward move. However, traders should remain alert for profit-taking after the recent gains. The coming sessions will help determine whether this movement develops into a sustained recovery or a temporary bounce.
Solana is trading around $72.34, showing a 2.29% increase over the last 24 hours. SOL is demonstrating stronger performance compared with several other major cryptocurrencies in the current market snapshot. Buyers appear more active, but maintaining this strength will be essential for further upside. If buying pressure continues to increase, Solana could attempt another upward move. However, traders should remain alert for profit-taking after the recent gains. The coming sessions will help determine whether this movement develops into a sustained recovery or a temporary bounce.
67
$BTC Bitcoin Faces Minor Selling Pressure Near $64,259
Bitcoin is trading around $64,259.69, recording a 0.19% decline over the last 24 hours. Although the correction remains relatively small, traders are watching whether buyers can regain control. Bitcoin's next move could influence sentiment across the entire cryptocurrency market. A recovery supported by stronger volume may encourage renewed buying interest, while continued weakness could increase pressure on altcoins. The key is whether BTC can stabilize around its current trading area. For now, patience is important as the market waits for a clearer directional signal.
$BTC Bitcoin Faces Minor Selling Pressure Near $64,259
Bitcoin is trading around $64,259.69, recording a 0.19% decline over the last 24 hours. Although the correction remains relatively small, traders are watching whether buyers can regain control. Bitcoin's next move could influence sentiment across the entire cryptocurrency market. A recovery supported by stronger volume may encourage renewed buying interest, while continued weakness could increase pressure on altcoins. The key is whether BTC can stabilize around its current trading area. For now, patience is important as the market waits for a clearer directional signal.
Bitcoin is trading around $64,259.69, recording a 0.19% decline over the last 24 hours. Although the correction remains relatively small, traders are watching whether buyers can regain control. Bitcoin's next move could influence sentiment across the entire cryptocurrency market. A recovery supported by stronger volume may encourage renewed buying interest, while continued weakness could increase pressure on altcoins. The key is whether BTC can stabilize around its current trading area. For now, patience is important as the market waits for a clearer directional signal.
67
$BNB Shows Steady Strength as Buyers Defend Momentum
BNB is currently trading at $590.98, showing a 0.40% gain over the past 24 hours. The market is displaying relatively stable price action, with buyers maintaining a slight advantage. The next important development will be whether BNB can attract stronger buying volume and continue moving upward. If momentum improves, another recovery attempt could develop. However, losing short-term support may bring selling pressure back into the market. Traders should closely monitor volume and price stability before expecting a stronger move. BNB remains worth watching as the broader crypto market develops its next direction.
$BNB Shows Steady Strength as Buyers Defend Momentum
BNB is currently trading at $590.98, showing a 0.40% gain over the past 24 hours. The market is displaying relatively stable price action, with buyers maintaining a slight advantage. The next important development will be whether BNB can attract stronger buying volume and continue moving upward. If momentum improves, another recovery attempt could develop. However, losing short-term support may bring selling pressure back into the market. Traders should closely monitor volume and price stability before expecting a stronger move. BNB remains worth watching as the broader crypto market develops its next direction.
BNB is currently trading at $590.98, showing a 0.40% gain over the past 24 hours. The market is displaying relatively stable price action, with buyers maintaining a slight advantage. The next important development will be whether BNB can attract stronger buying volume and continue moving upward. If momentum improves, another recovery attempt could develop. However, losing short-term support may bring selling pressure back into the market. Traders should closely monitor volume and price stability before expecting a stronger move. BNB remains worth watching as the broader crypto market develops its next direction.
44
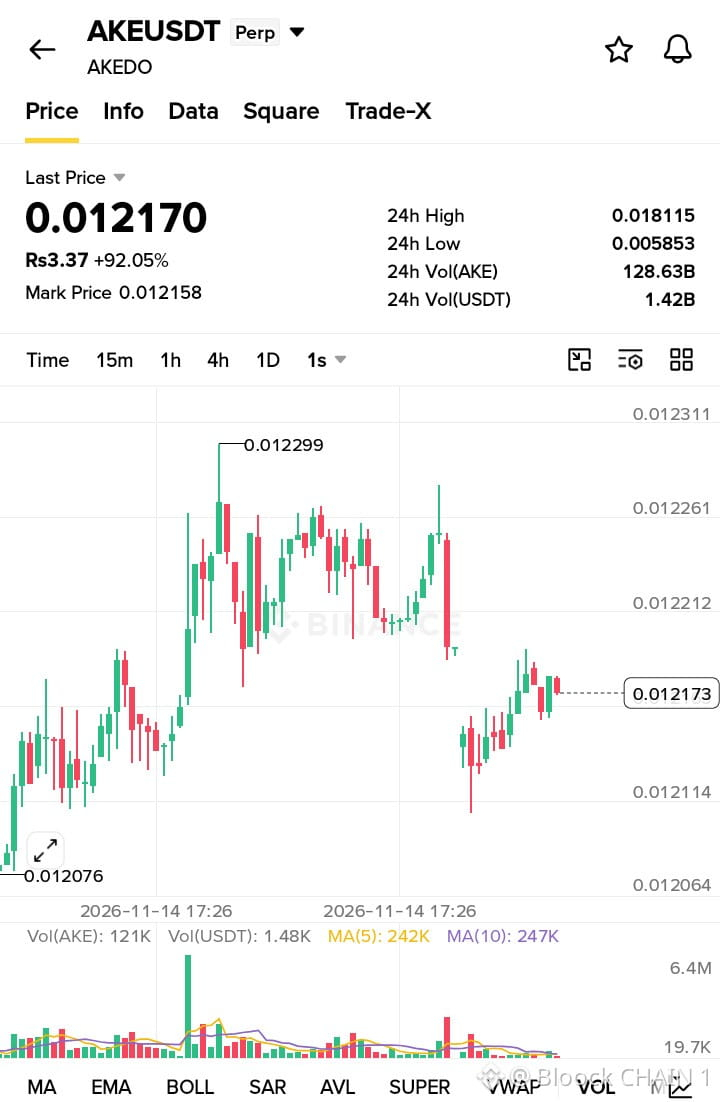
$AKE USDT is showing remarkable bullish momentum, trading around $0.012170, with an impressive 92.05% gain. The latest market data highlights strong buying interest and significant volatility, indicating that AKEDO has attracted considerable attention from traders. However, after such a substantial rally, the market is entering an important phase where buyers must prove their strength to sustain the upward movement.
Looking at the visible price action, AKE experienced a strong upward push from approximately $0.012076 toward the local high near $0.012299. Following this sharp move, the price entered a consolidation phase, with several candles moving sideways between buyers and sellers. This suggests that the market is attempting to establish a short-term balance after the initial bullish expansion. The recent recovery toward $0.012170 indicates that buyers are still active, although the latest candles show some hesitation near the current trading level.
From a technical perspective, $0.012200–$0.012261 represents an important nearby resistance zone, while $0.012299 is the immediate visible swing high. A convincing breakout above this area, supported by increasing trading volume, could create another opportunity for upward continuation. On the downside, $0.012114 is an important short-term support reference, followed by the visible low around $0.012076. Losing these levels could increase selling pressure and expose the price to further consolidation.
Volume deserves particular attention. The displayed current volume is approximately 121K AKE, while the MA(5) and MA(10) volume readings are around 242K and 247K respectively. This suggests that immediate trading activity is currently below those volume averages, making strong confirmation essential before assuming another breakout.
The broader 24-hour statistics are also notable, with a high of $0.018115, a low of $0.005853, and reported turnover of approximately 1.42 billion USDT.
$AKE USDT is showing remarkable bullish momentum, trading around $0.012170, with an impressive 92.05% gain. The latest market data highlights strong buying interest and significant volatility, indicating that AKEDO has attracted considerable attention from traders. However, after such a substantial rally, the market is entering an important phase where buyers must prove their strength to sustain the upward movement.
Looking at the visible price action, AKE experienced a strong upward push from approximately $0.012076 toward the local high near $0.012299. Following this sharp move, the price entered a consolidation phase, with several candles moving sideways between buyers and sellers. This suggests that the market is attempting to establish a short-term balance after the initial bullish expansion. The recent recovery toward $0.012170 indicates that buyers are still active, although the latest candles show some hesitation near the current trading level.
From a technical perspective, $0.012200–$0.012261 represents an important nearby resistance zone, while $0.012299 is the immediate visible swing high. A convincing breakout above this area, supported by increasing trading volume, could create another opportunity for upward continuation. On the downside, $0.012114 is an important short-term support reference, followed by the visible low around $0.012076. Losing these levels could increase selling pressure and expose the price to further consolidation.
Volume deserves particular attention. The displayed current volume is approximately 121K AKE, while the MA(5) and MA(10) volume readings are around 242K and 247K respectively. This suggests that immediate trading activity is currently below those volume averages, making strong confirmation essential before assuming another breakout.
The broader 24-hour statistics are also notable, with a high of $0.018115, a low of $0.005853, and reported turnover of approximately 1.42 billion USDT.
Looking at the visible price action, AKE experienced a strong upward push from approximately $0.012076 toward the local high near $0.012299. Following this sharp move, the price entered a consolidation phase, with several candles moving sideways between buyers and sellers. This suggests that the market is attempting to establish a short-term balance after the initial bullish expansion. The recent recovery toward $0.012170 indicates that buyers are still active, although the latest candles show some hesitation near the current trading level.
From a technical perspective, $0.012200–$0.012261 represents an important nearby resistance zone, while $0.012299 is the immediate visible swing high. A convincing breakout above this area, supported by increasing trading volume, could create another opportunity for upward continuation. On the downside, $0.012114 is an important short-term support reference, followed by the visible low around $0.012076. Losing these levels could increase selling pressure and expose the price to further consolidation.
Volume deserves particular attention. The displayed current volume is approximately 121K AKE, while the MA(5) and MA(10) volume readings are around 242K and 247K respectively. This suggests that immediate trading activity is currently below those volume averages, making strong confirmation essential before assuming another breakout.
The broader 24-hour statistics are also notable, with a high of $0.018115, a low of $0.005853, and reported turnover of approximately 1.42 billion USDT.
1
347
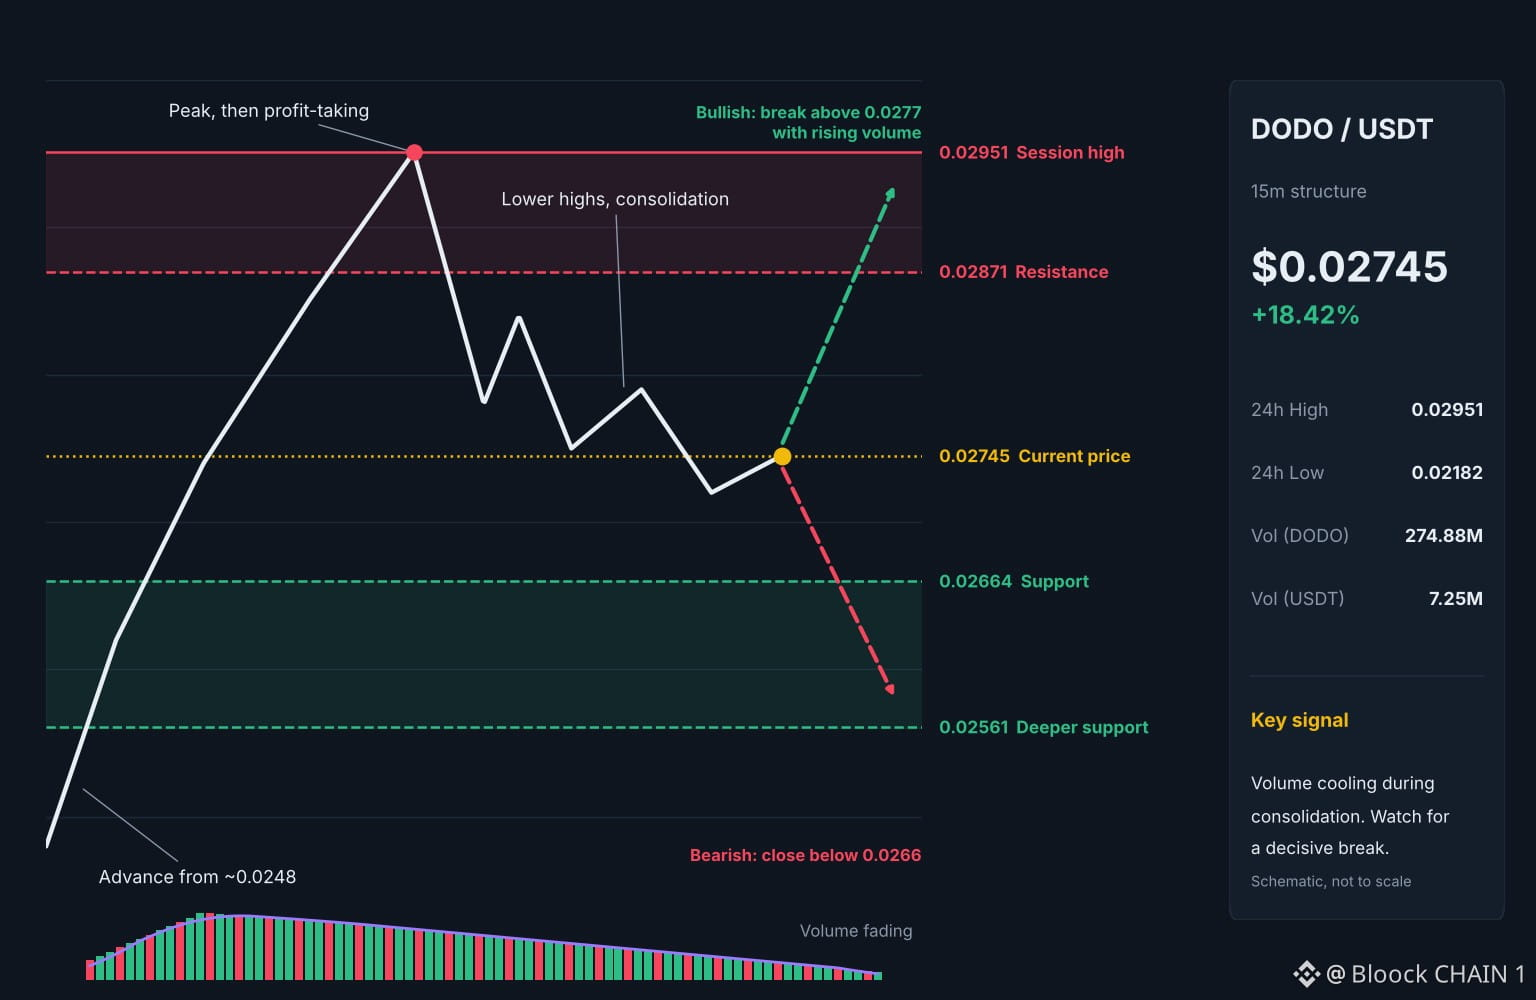
$DODO has climbed 18.42% to $0.02745, a strong gain that still leaves it well below the session peak of $0.02951. The 24h range runs from $0.02182 to $0.02951, with 274.88M DODO (7.25M USDT) changing hands, so participation behind the move has been substantial.
On the 15-minute chart, the structure tells a two-part story. Buyers dominated the advance from roughly $0.0248 through $0.0295, producing a run of strong green candles. After the high, a sharp red candle with a long upper wick signaled aggressive profit-taking, and price has since drifted into a lower-high sequence, now consolidating around $0.0274 to $0.0277.
Volume is the most significant signal. Bars have faded steadily from the surge, and both moving averages are sloping downward, which shows that buying conviction has cooled. Declining volume during consolidation often precedes a decisive break.
Resistance sits near $0.0287, then $0.0295. Support is visible around $0.0266, with $0.0256 below it. A push above $0.0277 on rising volume would reopen the upper range, while a close under $0.0266 would suggest sellers are taking control.
The trend remains constructive, but momentum is pausing. Confirmation will come from volume, not price alone.
Will DODO defend $0.0266 and rebuild momentum, or is this consolidation a prelude to a deeper pullback
$DODO has climbed 18.42% to $0.02745, a strong gain that still leaves it well below the session peak of $0.02951. The 24h range runs from $0.02182 to $0.02951, with 274.88M DODO (7.25M USDT) changing hands, so participation behind the move has been substantial.
On the 15-minute chart, the structure tells a two-part story. Buyers dominated the advance from roughly $0.0248 through $0.0295, producing a run of strong green candles. After the high, a sharp red candle with a long upper wick signaled aggressive profit-taking, and price has since drifted into a lower-high sequence, now consolidating around $0.0274 to $0.0277.
Volume is the most significant signal. Bars have faded steadily from the surge, and both moving averages are sloping downward, which shows that buying conviction has cooled. Declining volume during consolidation often precedes a decisive break.
Resistance sits near $0.0287, then $0.0295. Support is visible around $0.0266, with $0.0256 below it. A push above $0.0277 on rising volume would reopen the upper range, while a close under $0.0266 would suggest sellers are taking control.
The trend remains constructive, but momentum is pausing. Confirmation will come from volume, not price alone.
Will DODO defend $0.0266 and rebuild momentum, or is this consolidation a prelude to a deeper pullback
On the 15-minute chart, the structure tells a two-part story. Buyers dominated the advance from roughly $0.0248 through $0.0295, producing a run of strong green candles. After the high, a sharp red candle with a long upper wick signaled aggressive profit-taking, and price has since drifted into a lower-high sequence, now consolidating around $0.0274 to $0.0277.
Volume is the most significant signal. Bars have faded steadily from the surge, and both moving averages are sloping downward, which shows that buying conviction has cooled. Declining volume during consolidation often precedes a decisive break.
Resistance sits near $0.0287, then $0.0295. Support is visible around $0.0266, with $0.0256 below it. A push above $0.0277 on rising volume would reopen the upper range, while a close under $0.0266 would suggest sellers are taking control.
The trend remains constructive, but momentum is pausing. Confirmation will come from volume, not price alone.
Will DODO defend $0.0266 and rebuild momentum, or is this consolidation a prelude to a deeper pullback
125
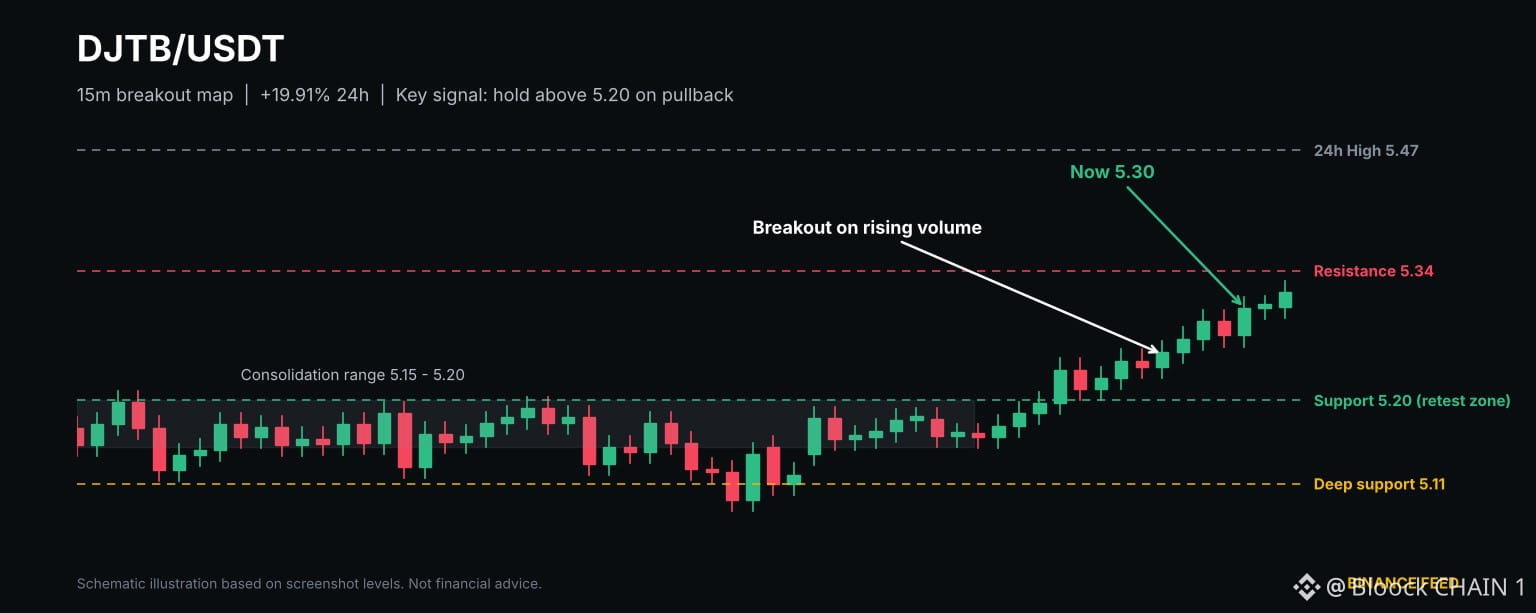
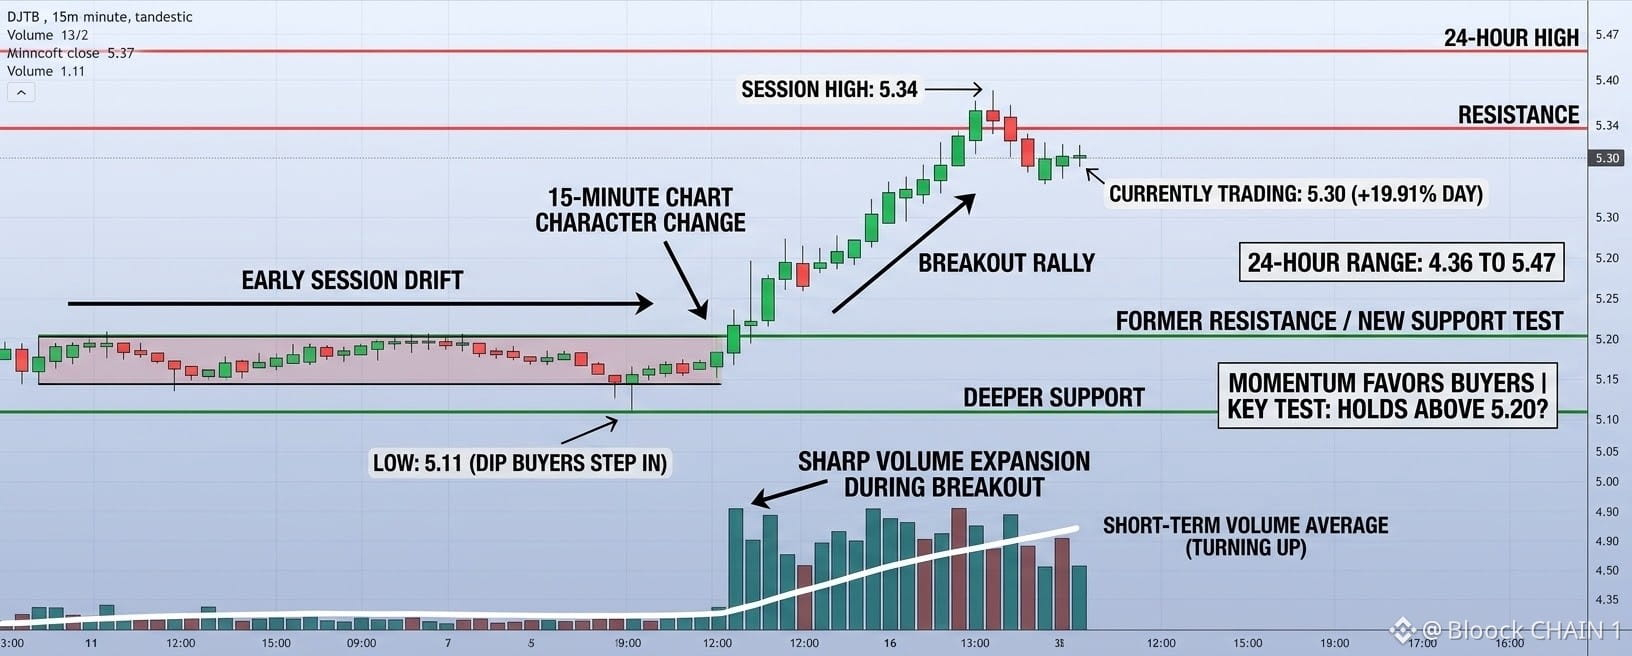
For most of the session, $DJTB drifted sideways in a narrow band around 5.15 to 5.20, with sellers briefly pushing price down to 5.11 before dip buyers stepped in. Then the 15-minute chart changed character. A string of strong green candles carried the pair to a session high of 5.34, and it now trades at 5.30, up 19.91 percent on the day.
Volume confirms the move. Trading activity expanded sharply during the breakout, and the short-term volume average has turned upward, which suggests genuine participation rather than a thin spike. The 24-hour range of 4.36 to 5.47 shows the pair is still working below its daily high.
Key levels are clear. Support sits near 5.20, the former consolidation ceiling, with deeper support at 5.11. Resistance appears at 5.34, then the 24-hour high of 5.47.
The most important signal is whether price holds above 5.20 on any pullback. A successful retest would strengthen the bullish case, while a close back inside the old range would hint at a failed breakout. The pair also trades slightly below the underlying stock's reference price, a gap worth monitoring.
Momentum favors buyers for now, but a near-20 percent daily gain demands discipline and defined risk.
Will DJTB convert 5.20 into lasting support, or return to its range
For most of the session, $DJTB drifted sideways in a narrow band around 5.15 to 5.20, with sellers briefly pushing price down to 5.11 before dip buyers stepped in. Then the 15-minute chart changed character. A string of strong green candles carried the pair to a session high of 5.34, and it now trades at 5.30, up 19.91 percent on the day.
Volume confirms the move. Trading activity expanded sharply during the breakout, and the short-term volume average has turned upward, which suggests genuine participation rather than a thin spike. The 24-hour range of 4.36 to 5.47 shows the pair is still working below its daily high.
Key levels are clear. Support sits near 5.20, the former consolidation ceiling, with deeper support at 5.11. Resistance appears at 5.34, then the 24-hour high of 5.47.
The most important signal is whether price holds above 5.20 on any pullback. A successful retest would strengthen the bullish case, while a close back inside the old range would hint at a failed breakout. The pair also trades slightly below the underlying stock's reference price, a gap worth monitoring.
Momentum favors buyers for now, but a near-20 percent daily gain demands discipline and defined risk.
Will DJTB convert 5.20 into lasting support, or return to its range
Volume confirms the move. Trading activity expanded sharply during the breakout, and the short-term volume average has turned upward, which suggests genuine participation rather than a thin spike. The 24-hour range of 4.36 to 5.47 shows the pair is still working below its daily high.
Key levels are clear. Support sits near 5.20, the former consolidation ceiling, with deeper support at 5.11. Resistance appears at 5.34, then the 24-hour high of 5.47.
The most important signal is whether price holds above 5.20 on any pullback. A successful retest would strengthen the bullish case, while a close back inside the old range would hint at a failed breakout. The pair also trades slightly below the underlying stock's reference price, a gap worth monitoring.
Momentum favors buyers for now, but a near-20 percent daily gain demands discipline and defined risk.
Will DJTB convert 5.20 into lasting support, or return to its range
94
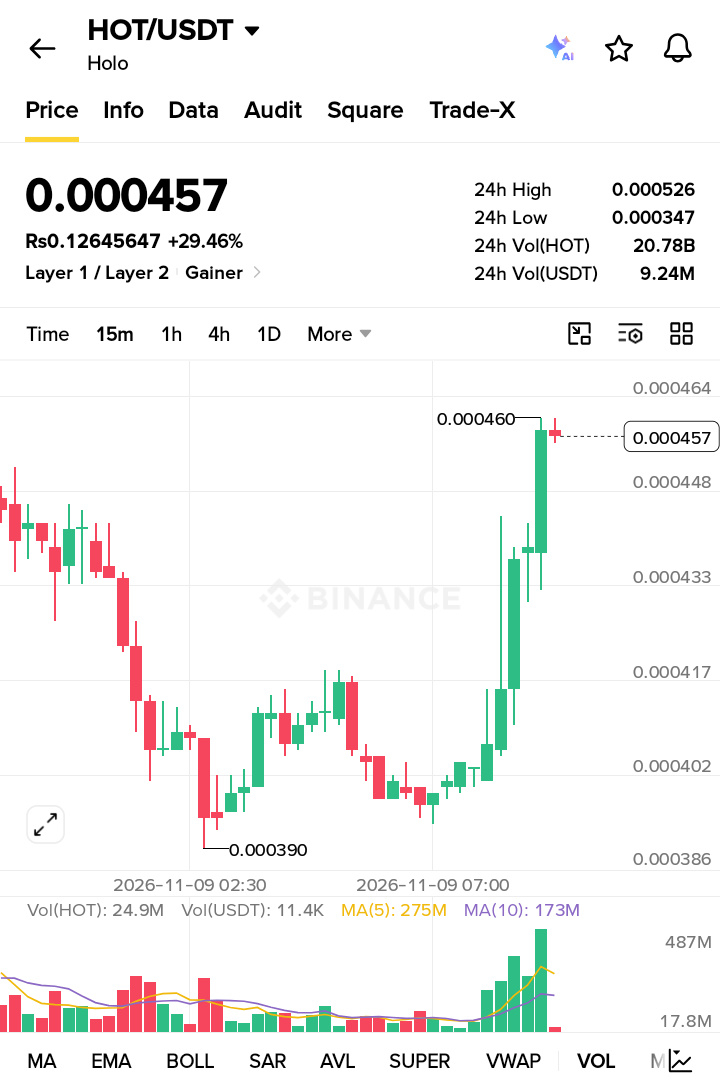
$HOT /USDT: A Powerful Rebound Brings Buyers Back Into Focus
Holo (HOT) is showing renewed bullish strength, trading at $0.000457, up 29.46% over the last 24 hours. The 15-minute chart reveals a notable recovery after price declined toward the $0.000390 area. Buyers gradually regained control, building momentum before a sharp upward move pushed HOT toward $0.000460.
However, the latest candles suggest the market is approaching an important decision zone. The $0.000460 level is the immediate resistance, while the broader 24-hour high of $0.000526 represents the next major upside barrier.
On the downside, $0.000448 and $0.000433 are the first support areas to monitor. A deeper retracement could bring $0.000417 and $0.000402 into focus.
If buyers maintain control above $0.000448 and secure a convincing breakout above $0.000460, bullish momentum could continue. Conversely, rejection near resistance may trigger profit-taking and a temporary cooling phase.
Key Takeaway: HOT has demonstrated impressive recovery strength, but holding recent gains and overcoming resistance will determine whether this rally develops into a stronger trend.
$HOT /USDT: A Powerful Rebound Brings Buyers Back Into Focus
Holo (HOT) is showing renewed bullish strength, trading at $0.000457, up 29.46% over the last 24 hours. The 15-minute chart reveals a notable recovery after price declined toward the $0.000390 area. Buyers gradually regained control, building momentum before a sharp upward move pushed HOT toward $0.000460.
However, the latest candles suggest the market is approaching an important decision zone. The $0.000460 level is the immediate resistance, while the broader 24-hour high of $0.000526 represents the next major upside barrier.
On the downside, $0.000448 and $0.000433 are the first support areas to monitor. A deeper retracement could bring $0.000417 and $0.000402 into focus.
If buyers maintain control above $0.000448 and secure a convincing breakout above $0.000460, bullish momentum could continue. Conversely, rejection near resistance may trigger profit-taking and a temporary cooling phase.
Key Takeaway: HOT has demonstrated impressive recovery strength, but holding recent gains and overcoming resistance will determine whether this rally develops into a stronger trend.
Holo (HOT) is showing renewed bullish strength, trading at $0.000457, up 29.46% over the last 24 hours. The 15-minute chart reveals a notable recovery after price declined toward the $0.000390 area. Buyers gradually regained control, building momentum before a sharp upward move pushed HOT toward $0.000460.
However, the latest candles suggest the market is approaching an important decision zone. The $0.000460 level is the immediate resistance, while the broader 24-hour high of $0.000526 represents the next major upside barrier.
On the downside, $0.000448 and $0.000433 are the first support areas to monitor. A deeper retracement could bring $0.000417 and $0.000402 into focus.
If buyers maintain control above $0.000448 and secure a convincing breakout above $0.000460, bullish momentum could continue. Conversely, rejection near resistance may trigger profit-taking and a temporary cooling phase.
Key Takeaway: HOT has demonstrated impressive recovery strength, but holding recent gains and overcoming resistance will determine whether this rally develops into a stronger trend.
199
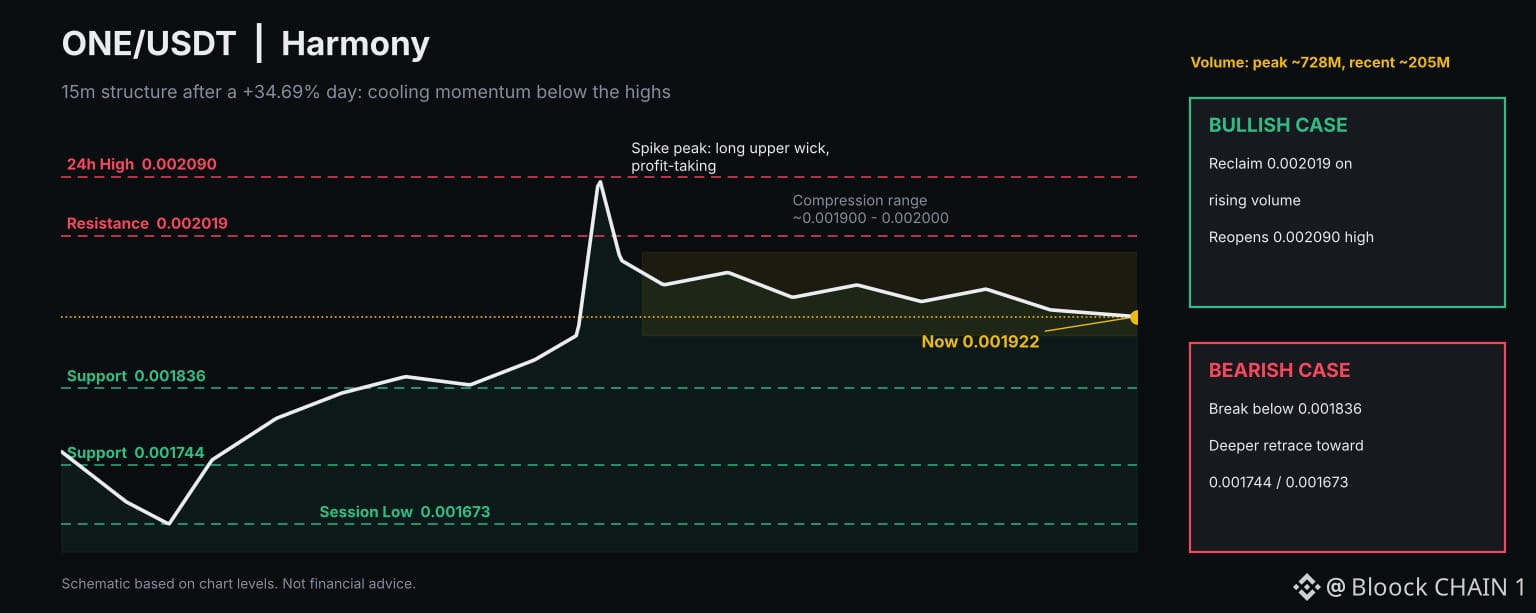
Harmony's $ONE /USDT is trading at 0.001922, up 34.69% on the day, yet the 15-minute chart shows momentum fading near the highs. A sharp vertical push carried price to the 24h high of 0.002090, but the long upper wick on that candle signals aggressive profit-taking. Sellers have defended that zone ever since.
Since then, price has compressed into a tight band between roughly 0.001900 and 0.002000, printing a string of small-bodied candles. The latest red candles, with upper wicks near 0.002000, suggest buyers are struggling to reclaim momentum.
Volume tells a similar story. The spike candle drew the largest bar on the chart, near 728M, while recent bars are noticeably lighter, hovering around 205M. The 5-period volume average has slipped back toward the 10-period line, showing cooling participation.
Key levels: support sits near 0.001836, with deeper support at 0.001744 and the session low at 0.001673. Resistance is 0.002019, then the 0.002090 peak.
Bullish case: a clean reclaim of 0.002019 on rising volume reopens the high. Bearish case: a breakdown below 0.001836 could trigger a deeper retracement.
Takeaway: after a 34% day, patience and confirmation matter more than chasing candles.
Harmony's $ONE /USDT is trading at 0.001922, up 34.69% on the day, yet the 15-minute chart shows momentum fading near the highs. A sharp vertical push carried price to the 24h high of 0.002090, but the long upper wick on that candle signals aggressive profit-taking. Sellers have defended that zone ever since.
Since then, price has compressed into a tight band between roughly 0.001900 and 0.002000, printing a string of small-bodied candles. The latest red candles, with upper wicks near 0.002000, suggest buyers are struggling to reclaim momentum.
Volume tells a similar story. The spike candle drew the largest bar on the chart, near 728M, while recent bars are noticeably lighter, hovering around 205M. The 5-period volume average has slipped back toward the 10-period line, showing cooling participation.
Key levels: support sits near 0.001836, with deeper support at 0.001744 and the session low at 0.001673. Resistance is 0.002019, then the 0.002090 peak.
Bullish case: a clean reclaim of 0.002019 on rising volume reopens the high. Bearish case: a breakdown below 0.001836 could trigger a deeper retracement.
Takeaway: after a 34% day, patience and confirmation matter more than chasing candles.
Since then, price has compressed into a tight band between roughly 0.001900 and 0.002000, printing a string of small-bodied candles. The latest red candles, with upper wicks near 0.002000, suggest buyers are struggling to reclaim momentum.
Volume tells a similar story. The spike candle drew the largest bar on the chart, near 728M, while recent bars are noticeably lighter, hovering around 205M. The 5-period volume average has slipped back toward the 10-period line, showing cooling participation.
Key levels: support sits near 0.001836, with deeper support at 0.001744 and the session low at 0.001673. Resistance is 0.002019, then the 0.002090 peak.
Bullish case: a clean reclaim of 0.002019 on rising volume reopens the high. Bearish case: a breakdown below 0.001836 could trigger a deeper retracement.
Takeaway: after a 34% day, patience and confirmation matter more than chasing candles.
299
·
--
Bullish
$APPB Cools Near 330 After a Violent Breakout: Digestion or Distribution?
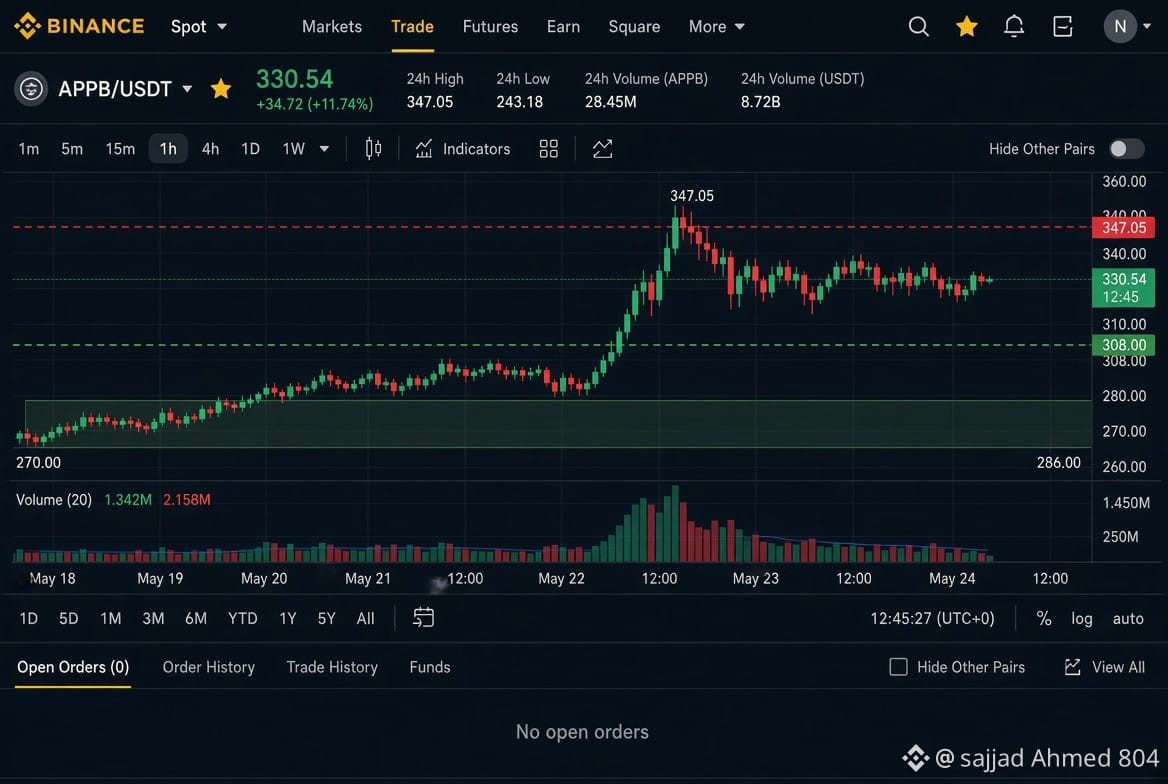
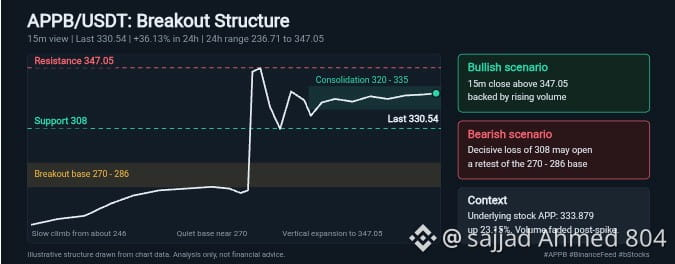
APPB/USDT sits at 330.54, up 36.13% over 24 hours, with a range between 236.71 and 347.05. The chart reads like two different markets stitched together. First came a patient grind from about 246 toward 270, then an abrupt vertical push that took price to the 347.05 high within a handful of candles.
What matters now is how price is behaving after the spike. Instead of a sharp reversal, candles have compressed into a narrow band between roughly 320 and 335. That kind of tight, small-bodied action often points to the market absorbing gains, though it can also precede a move in either direction. The underlying stock, APP, trades at 333.879, up 23.15%, keeping the bStocks pairing in line with its reference asset.
Resistance: 347.05. Support: 308, with the pre-breakout base around 270 to 286 as a deeper fallback.
Bullish scenario: a 15m close above 347.05 backed by renewed volume. Bearish scenario: a decisive loss of 308 could invite a pullback toward the breakout zone.
Volume surged on the move and has since cooled, so the next volume expansion will likely reveal intent.
Takeaway: after vertical rallies, defined levels beat emotion. Not financial advice.
$APPB Cools Near 330 After a Violent Breakout: Digestion or Distribution?
APPB/USDT sits at 330.54, up 36.13% over 24 hours, with a range between 236.71 and 347.05. The chart reads like two different markets stitched together. First came a patient grind from about 246 toward 270, then an abrupt vertical push that took price to the 347.05 high within a handful of candles.
What matters now is how price is behaving after the spike. Instead of a sharp reversal, candles have compressed into a narrow band between roughly 320 and 335. That kind of tight, small-bodied action often points to the market absorbing gains, though it can also precede a move in either direction. The underlying stock, APP, trades at 333.879, up 23.15%, keeping the bStocks pairing in line with its reference asset.
Resistance: 347.05. Support: 308, with the pre-breakout base around 270 to 286 as a deeper fallback.
Bullish scenario: a 15m close above 347.05 backed by renewed volume. Bearish scenario: a decisive loss of 308 could invite a pullback toward the breakout zone.
Volume surged on the move and has since cooled, so the next volume expansion will likely reveal intent.
Takeaway: after vertical rallies, defined levels beat emotion. Not financial advice.
APPB/USDT sits at 330.54, up 36.13% over 24 hours, with a range between 236.71 and 347.05. The chart reads like two different markets stitched together. First came a patient grind from about 246 toward 270, then an abrupt vertical push that took price to the 347.05 high within a handful of candles.
What matters now is how price is behaving after the spike. Instead of a sharp reversal, candles have compressed into a narrow band between roughly 320 and 335. That kind of tight, small-bodied action often points to the market absorbing gains, though it can also precede a move in either direction. The underlying stock, APP, trades at 333.879, up 23.15%, keeping the bStocks pairing in line with its reference asset.
Resistance: 347.05. Support: 308, with the pre-breakout base around 270 to 286 as a deeper fallback.
Bullish scenario: a 15m close above 347.05 backed by renewed volume. Bearish scenario: a decisive loss of 308 could invite a pullback toward the breakout zone.
Volume surged on the move and has since cooled, so the next volume expansion will likely reveal intent.
Takeaway: after vertical rallies, defined levels beat emotion. Not financial advice.
1
196
Log in to explore more content
Join global crypto users on Binance Square
⚡️ Get latest and useful information about crypto.
💬 Trusted by the world’s largest crypto exchange.
👍 Discover real insights from verified creators.
Email / Phone number
Trending Topics
NvidiaBeatsEstimatesWith$130BQ4Outlook
33,099 views
231 Discussing
Nvidia Beats With $115.8 Billion in Revenue, Guides to $130 Billion and Adds $150 Billion Buyback
Binance News
·71 Likes
·47.8k views
AnthropicIPOPriceCouldExceed$80
22,019 views
200 Discussing
RussiaCentralBankAddsAlfaBankToCryptoExchangeRegister
1,015 views
20 Discussing