
NOUMAN_DON
4.2k Posts

NOUMAN_DON
Report
Block User
🐋 whales chart patterns 🐋
🚀 Crypto Analyst | 📊 Technical Analysis & Market Structure | 🔥 Breakouts & High-Potential Setups | 🧠 No Hype, Just Charts
Frequent Trader
2.6 Years
44 Following
718 Followers
7.3K+ Liked
Posts
All
Quotes
Videos
·
--
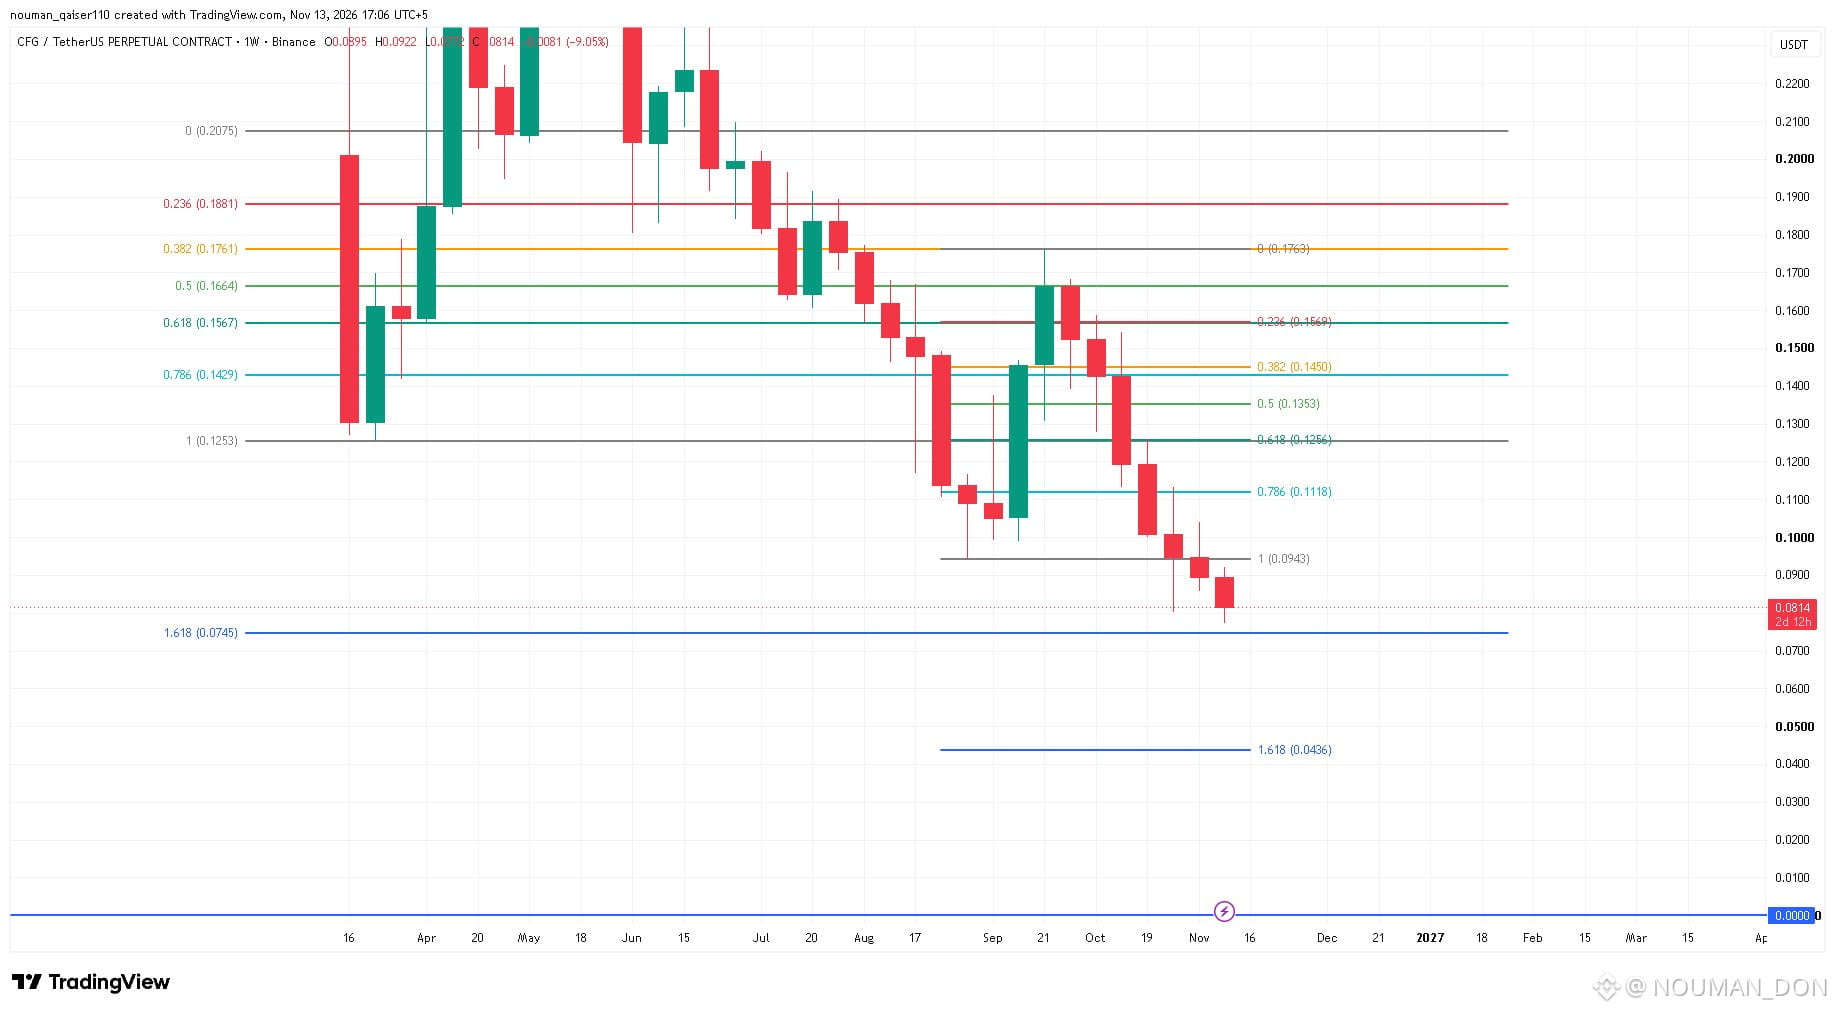
$CFG /USDT Perpetual Technical Analysis: Breakdown Testing Deep Macro Supports 🚨
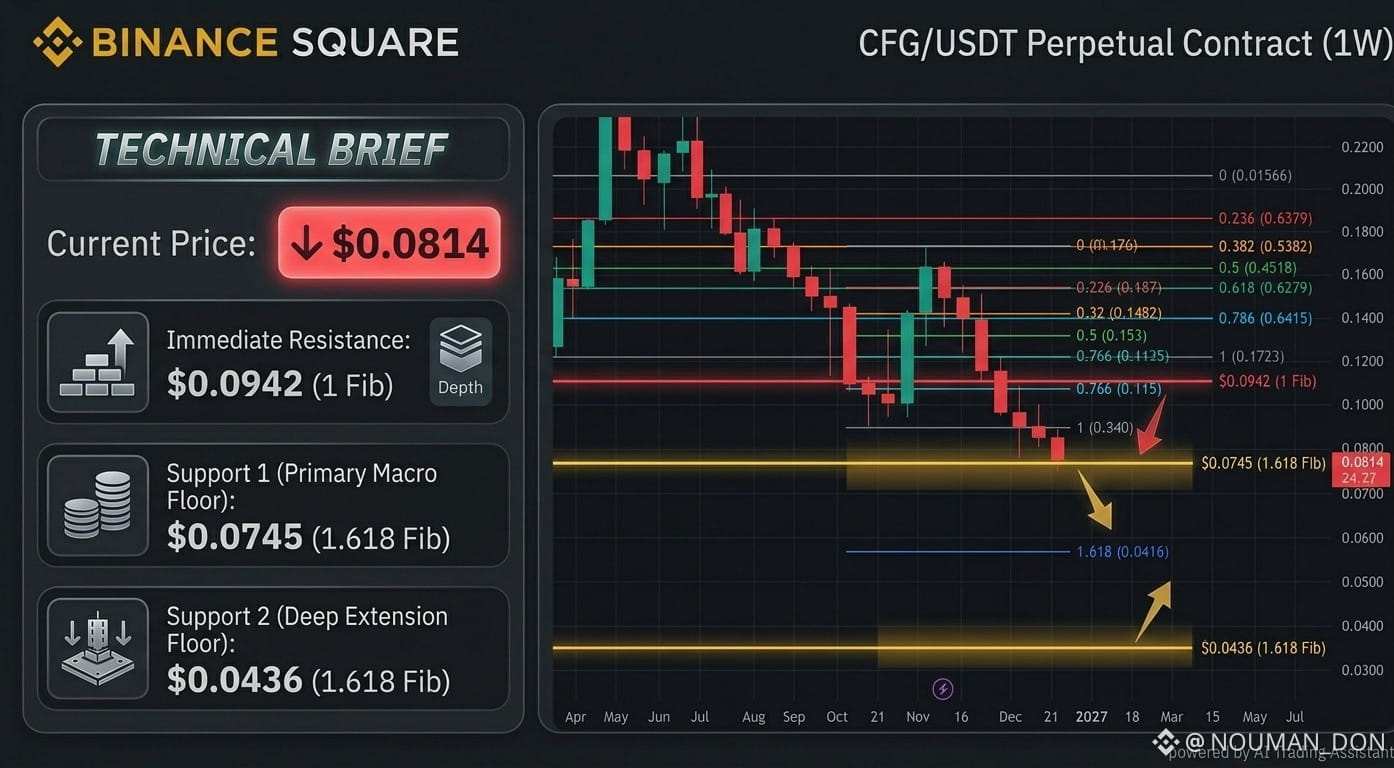
The weekly chart shows $CFG facing sustained bearish momentum (-9.05%), breaking below its local consolidation baseline and sliding directly toward critical Fibonacci extension support levels.
📉 Strong Macro Supports & Levels:
• Current Price: $0.0814
• Immediate Resistance Flipped: Sellers cleanly sliced through the local 1 Fib baseline at $0.0942, flipping this former floor into immediate overhead resistance.
• Support 1 (Primary Macro Floor): Price is rapidly approaching the major macro 1.618 Fibonacci extension sitting right at $0.0745. Strong buyer defense is anticipated at this historical threshold.
• Support 2 (Deep Extension Floor): If $0.0745 fails to hold on a weekly close, the next major structural demand floor rests down at the local 1.618 Fib extension at $0.0436.
💡 Trading Strategy:
Reversal Watch: Look for strong weekly buyer absorption or long-wick defense near $0.0745 before scaling into long positions.Risk Note: Keep stop-losses tight below $0.0710 to protect against a deeper breakdown toward $0.0436.
#CFGUSDT #cryptotrading #TechnicalAnalysis #BinanceSquare #Fibonacci
{spot}(CFGUSDT)
{future}(CFGUSDT)
$CFG /USDT Perpetual Technical Analysis: Breakdown Testing Deep Macro Supports 🚨
The weekly chart shows $CFG facing sustained bearish momentum (-9.05%), breaking below its local consolidation baseline and sliding directly toward critical Fibonacci extension support levels.
📉 Strong Macro Supports & Levels:
• Current Price: $0.0814
• Immediate Resistance Flipped: Sellers cleanly sliced through the local 1 Fib baseline at $0.0942, flipping this former floor into immediate overhead resistance.
• Support 1 (Primary Macro Floor): Price is rapidly approaching the major macro 1.618 Fibonacci extension sitting right at $0.0745. Strong buyer defense is anticipated at this historical threshold.
• Support 2 (Deep Extension Floor): If $0.0745 fails to hold on a weekly close, the next major structural demand floor rests down at the local 1.618 Fib extension at $0.0436.
💡 Trading Strategy:
Reversal Watch: Look for strong weekly buyer absorption or long-wick defense near $0.0745 before scaling into long positions.Risk Note: Keep stop-losses tight below $0.0710 to protect against a deeper breakdown toward $0.0436.
#CFGUSDT #cryptotrading #TechnicalAnalysis #BinanceSquare #Fibonacci
The weekly chart shows $CFG facing sustained bearish momentum (-9.05%), breaking below its local consolidation baseline and sliding directly toward critical Fibonacci extension support levels.
📉 Strong Macro Supports & Levels:
• Current Price: $0.0814
• Immediate Resistance Flipped: Sellers cleanly sliced through the local 1 Fib baseline at $0.0942, flipping this former floor into immediate overhead resistance.
• Support 1 (Primary Macro Floor): Price is rapidly approaching the major macro 1.618 Fibonacci extension sitting right at $0.0745. Strong buyer defense is anticipated at this historical threshold.
• Support 2 (Deep Extension Floor): If $0.0745 fails to hold on a weekly close, the next major structural demand floor rests down at the local 1.618 Fib extension at $0.0436.
💡 Trading Strategy:
Reversal Watch: Look for strong weekly buyer absorption or long-wick defense near $0.0745 before scaling into long positions.Risk Note: Keep stop-losses tight below $0.0710 to protect against a deeper breakdown toward $0.0436.
#CFGUSDT #cryptotrading #TechnicalAnalysis #BinanceSquare #Fibonacci
1
1
·
--
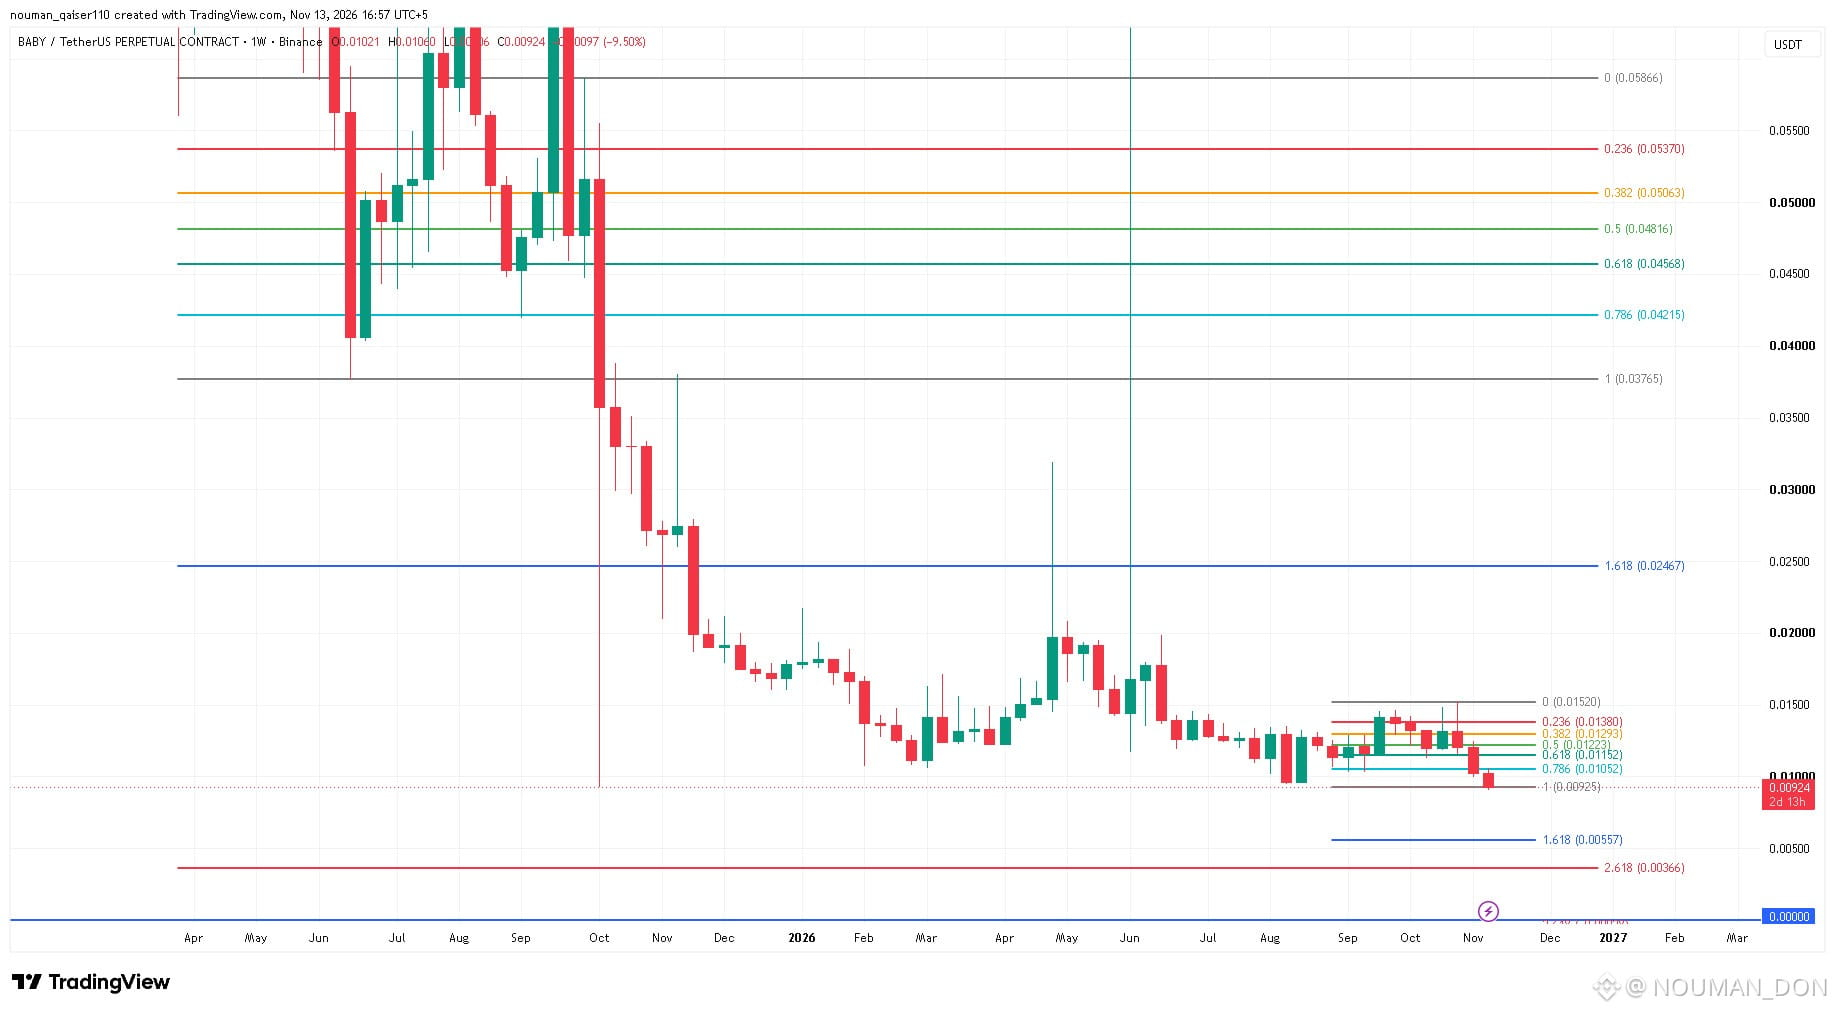
$BABY /USDT Perpetual Technical Analysis: Testing Critical Macro Support Floors 🚨
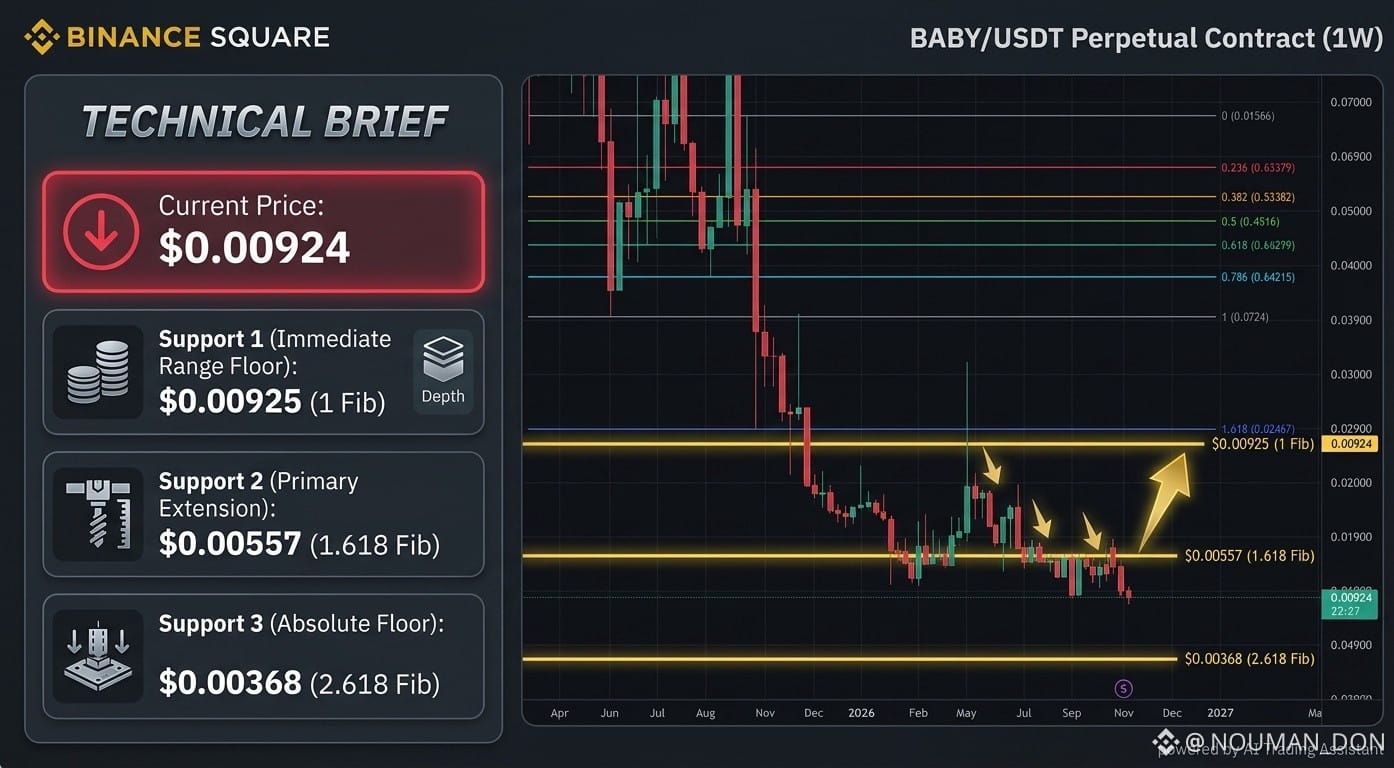
The weekly chart shows $BABY facing renewed bearish pressure (-9.50%), pressing directly against the bottom of its multi-month consolidation range and testing crucial Fibonacci support levels.
📉 Strong Macro Supports & Levels:
• Current Price: $0.00924
• Support 1 (Immediate Range Floor): Price is sitting directly on the critical 1 Fib range baseline at $0.00925. Holding this multi-week horizontal support is vital to prevent a structural breakdown.
• Support 2 (Primary Extension Floor): If $0.00925 breaks on a weekly close, the next major defensive demand zone rests at the 1.618 Fibonacci extension down at $0.00557.
• Support 3 (Absolute Macro Floor): A deeper capitulation move points toward the ultimate structural support at the 2.618 Fib extension near $0.00368.
💡 Trading Strategy:
Reversal Watch: Look for strong weekly buyer defense or long-wick rejection at $0.00925 before considering long entries.Risk Note: Keep stop-losses tight below $0.00890 to protect against a breakdown toward $0.00557.
#BABYUSDT #cryptotrading #TechnicalAnalysis #BinanceSquare #Fibonacci
{spot}(BABYUSDT)
{future}(BABYUSDT)
$BABY /USDT Perpetual Technical Analysis: Testing Critical Macro Support Floors 🚨
The weekly chart shows $BABY facing renewed bearish pressure (-9.50%), pressing directly against the bottom of its multi-month consolidation range and testing crucial Fibonacci support levels.
📉 Strong Macro Supports & Levels:
• Current Price: $0.00924
• Support 1 (Immediate Range Floor): Price is sitting directly on the critical 1 Fib range baseline at $0.00925. Holding this multi-week horizontal support is vital to prevent a structural breakdown.
• Support 2 (Primary Extension Floor): If $0.00925 breaks on a weekly close, the next major defensive demand zone rests at the 1.618 Fibonacci extension down at $0.00557.
• Support 3 (Absolute Macro Floor): A deeper capitulation move points toward the ultimate structural support at the 2.618 Fib extension near $0.00368.
💡 Trading Strategy:
Reversal Watch: Look for strong weekly buyer defense or long-wick rejection at $0.00925 before considering long entries.Risk Note: Keep stop-losses tight below $0.00890 to protect against a breakdown toward $0.00557.
#BABYUSDT #cryptotrading #TechnicalAnalysis #BinanceSquare #Fibonacci
The weekly chart shows $BABY facing renewed bearish pressure (-9.50%), pressing directly against the bottom of its multi-month consolidation range and testing crucial Fibonacci support levels.
📉 Strong Macro Supports & Levels:
• Current Price: $0.00924
• Support 1 (Immediate Range Floor): Price is sitting directly on the critical 1 Fib range baseline at $0.00925. Holding this multi-week horizontal support is vital to prevent a structural breakdown.
• Support 2 (Primary Extension Floor): If $0.00925 breaks on a weekly close, the next major defensive demand zone rests at the 1.618 Fibonacci extension down at $0.00557.
• Support 3 (Absolute Macro Floor): A deeper capitulation move points toward the ultimate structural support at the 2.618 Fib extension near $0.00368.
💡 Trading Strategy:
Reversal Watch: Look for strong weekly buyer defense or long-wick rejection at $0.00925 before considering long entries.Risk Note: Keep stop-losses tight below $0.00890 to protect against a breakdown toward $0.00557.
#BABYUSDT #cryptotrading #TechnicalAnalysis #BinanceSquare #Fibonacci
1
10
·
--
$MANTRA /USDT Perpetual Technical Analysis: Capitulation Testing Last Three Strong Supports 🚨
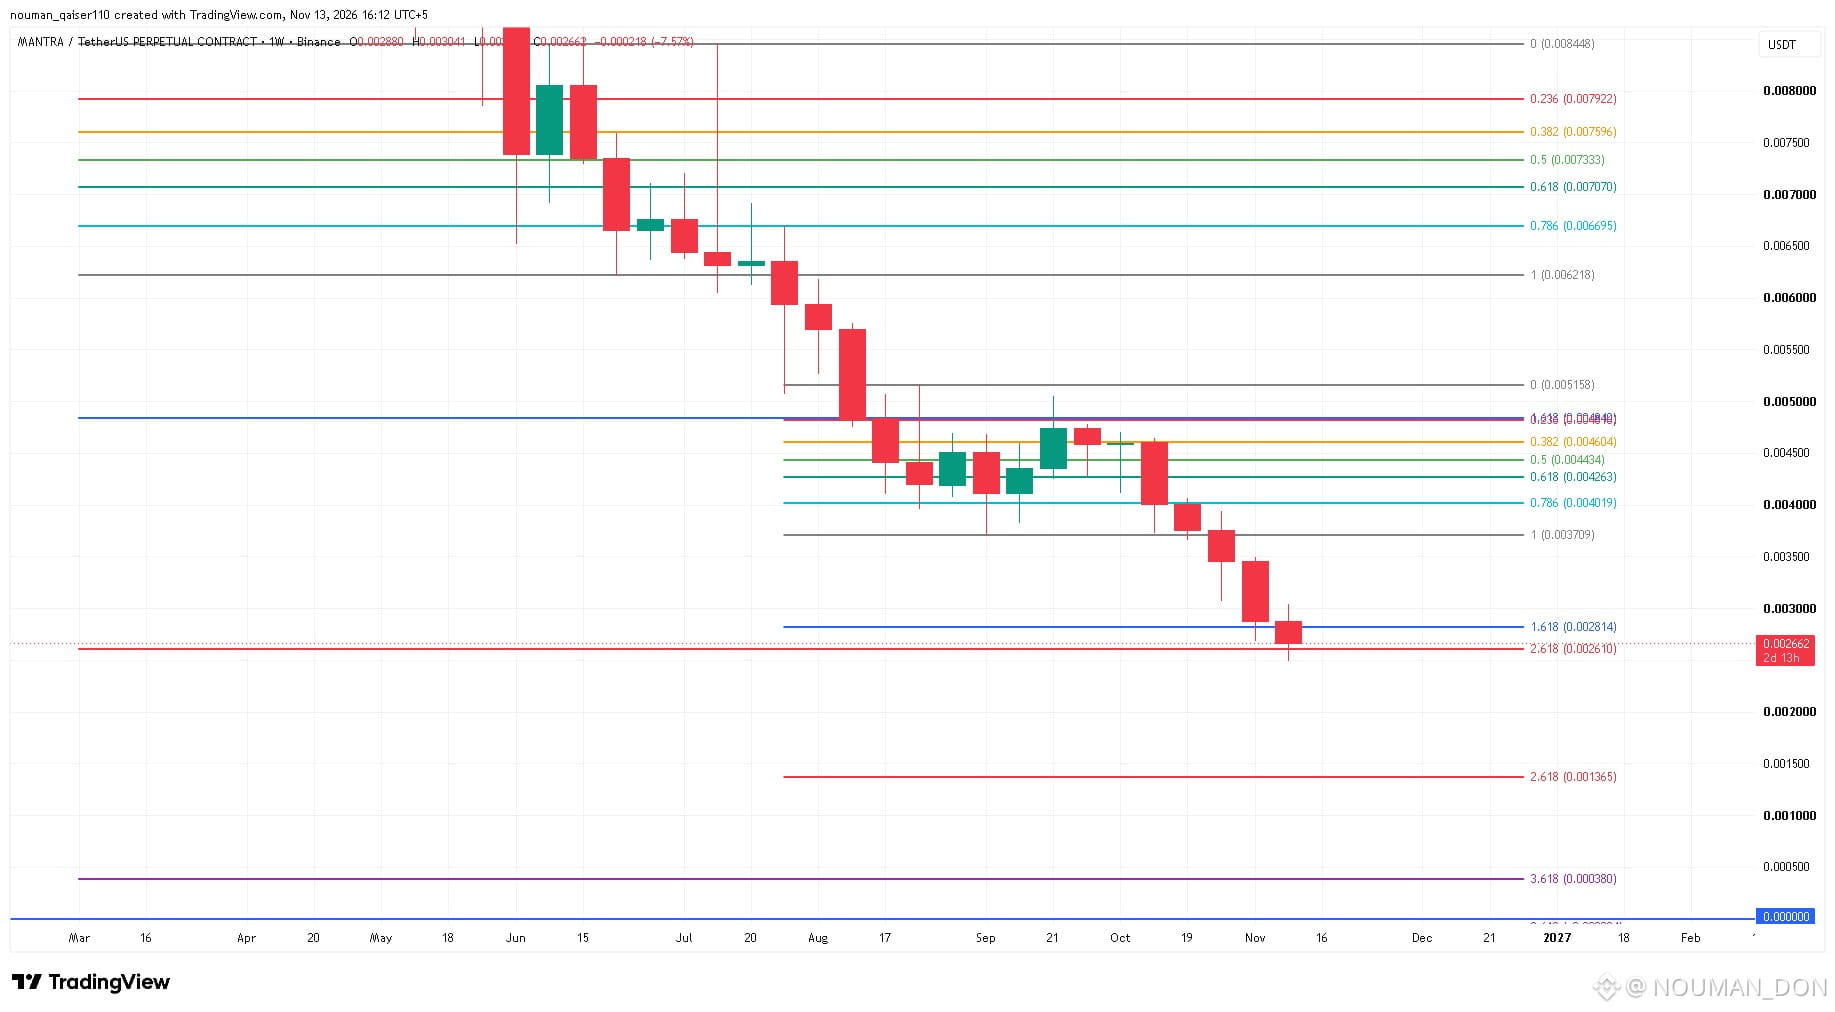
The weekly chart shows $MANTRA experiencing an aggressive, multi-month sell-off (-7.53%), breaking below local consolidation ranges and sliding directly into deep macro Fibonacci extension floors.
📉 Last Three Strong Macro Supports:
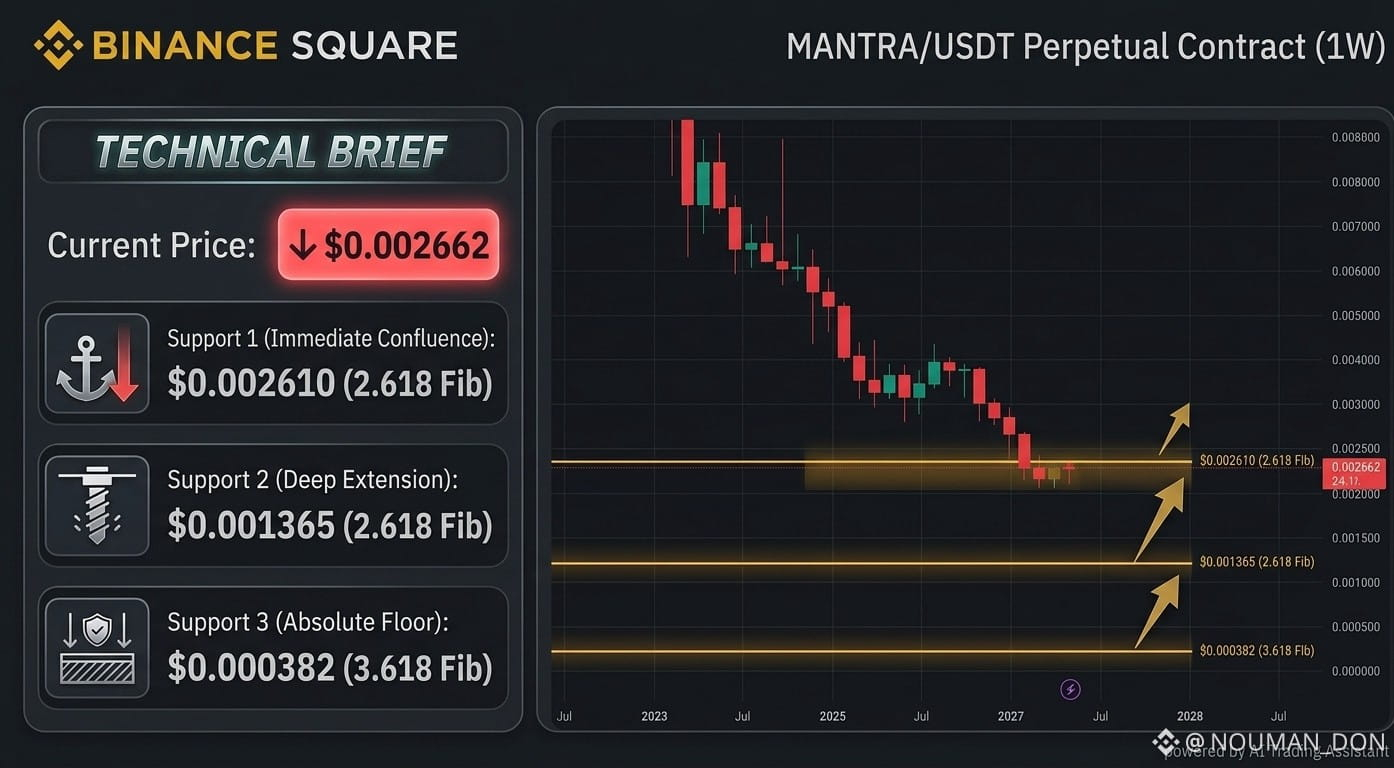
• Current Price: $0.002662
• Support 1 (Immediate Confluence): Price is currently testing a tight cluster between the local 1.618 Fib ($0.002814) and the macro 2.618 Fib extension at $0.002610.
• Support 2 (Deep Extension Floor): If this immediate cluster fails on a weekly close, the next major defensive target sits down at the local 2.618 Fib extension at $0.001365.
• Support 3 (Absolute Macro Floor): A full capitulation scenario points toward the final historical demand floor at the 3.618 Fib extension near $0.000382.
💡 Trading Strategy:
Reversal Watch: Look for strong weekly buyer absorption or a long-wick rejection at $0.002610 before considering long entries.Risk Note: Volatility is extreme; keep stops tight below $0.002500 to protect against deeper extensions.
#MANTRAUSDT #cryptotrading #TechnicalAnalysis #BinanceSquare #Fibonacci
{spot}(MANTRAUSDT)
{future}(MANTRAUSDT)
$MANTRA /USDT Perpetual Technical Analysis: Capitulation Testing Last Three Strong Supports 🚨
The weekly chart shows $MANTRA experiencing an aggressive, multi-month sell-off (-7.53%), breaking below local consolidation ranges and sliding directly into deep macro Fibonacci extension floors.
📉 Last Three Strong Macro Supports:
• Current Price: $0.002662
• Support 1 (Immediate Confluence): Price is currently testing a tight cluster between the local 1.618 Fib ($0.002814) and the macro 2.618 Fib extension at $0.002610.
• Support 2 (Deep Extension Floor): If this immediate cluster fails on a weekly close, the next major defensive target sits down at the local 2.618 Fib extension at $0.001365.
• Support 3 (Absolute Macro Floor): A full capitulation scenario points toward the final historical demand floor at the 3.618 Fib extension near $0.000382.
💡 Trading Strategy:
Reversal Watch: Look for strong weekly buyer absorption or a long-wick rejection at $0.002610 before considering long entries.Risk Note: Volatility is extreme; keep stops tight below $0.002500 to protect against deeper extensions.
#MANTRAUSDT #cryptotrading #TechnicalAnalysis #BinanceSquare #Fibonacci
The weekly chart shows $MANTRA experiencing an aggressive, multi-month sell-off (-7.53%), breaking below local consolidation ranges and sliding directly into deep macro Fibonacci extension floors.
📉 Last Three Strong Macro Supports:
• Current Price: $0.002662
• Support 1 (Immediate Confluence): Price is currently testing a tight cluster between the local 1.618 Fib ($0.002814) and the macro 2.618 Fib extension at $0.002610.
• Support 2 (Deep Extension Floor): If this immediate cluster fails on a weekly close, the next major defensive target sits down at the local 2.618 Fib extension at $0.001365.
• Support 3 (Absolute Macro Floor): A full capitulation scenario points toward the final historical demand floor at the 3.618 Fib extension near $0.000382.
💡 Trading Strategy:
Reversal Watch: Look for strong weekly buyer absorption or a long-wick rejection at $0.002610 before considering long entries.Risk Note: Volatility is extreme; keep stops tight below $0.002500 to protect against deeper extensions.
#MANTRAUSDT #cryptotrading #TechnicalAnalysis #BinanceSquare #Fibonacci
1
97
·
--
$ENSO /USDT Perpetual Technical Analysis: Breakdown Testing Macro Support Floor 🚨
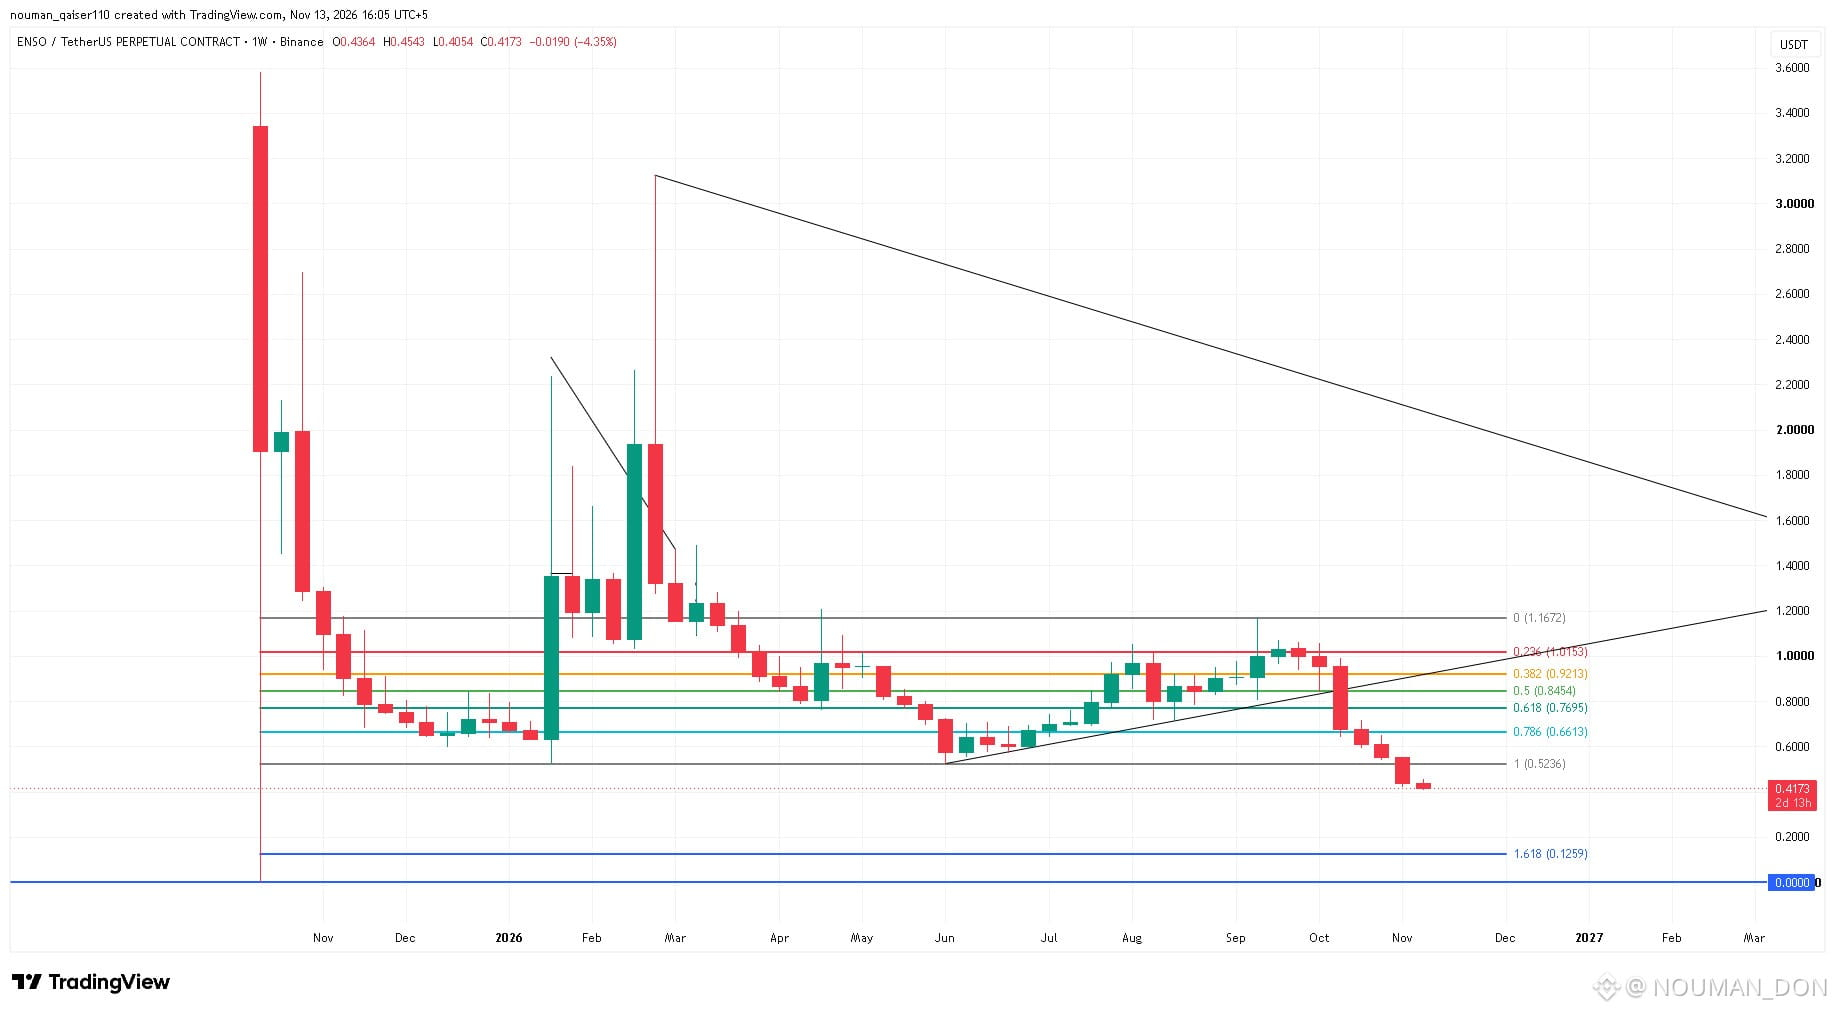
The weekly chart shows $ENSO experiencing a steep multi-week sell-off (-4.28%), breaking below its ascending trendline and slipping beneath its previous range low to search for macro demand.
📉 Strong Macro Supports & Levels:
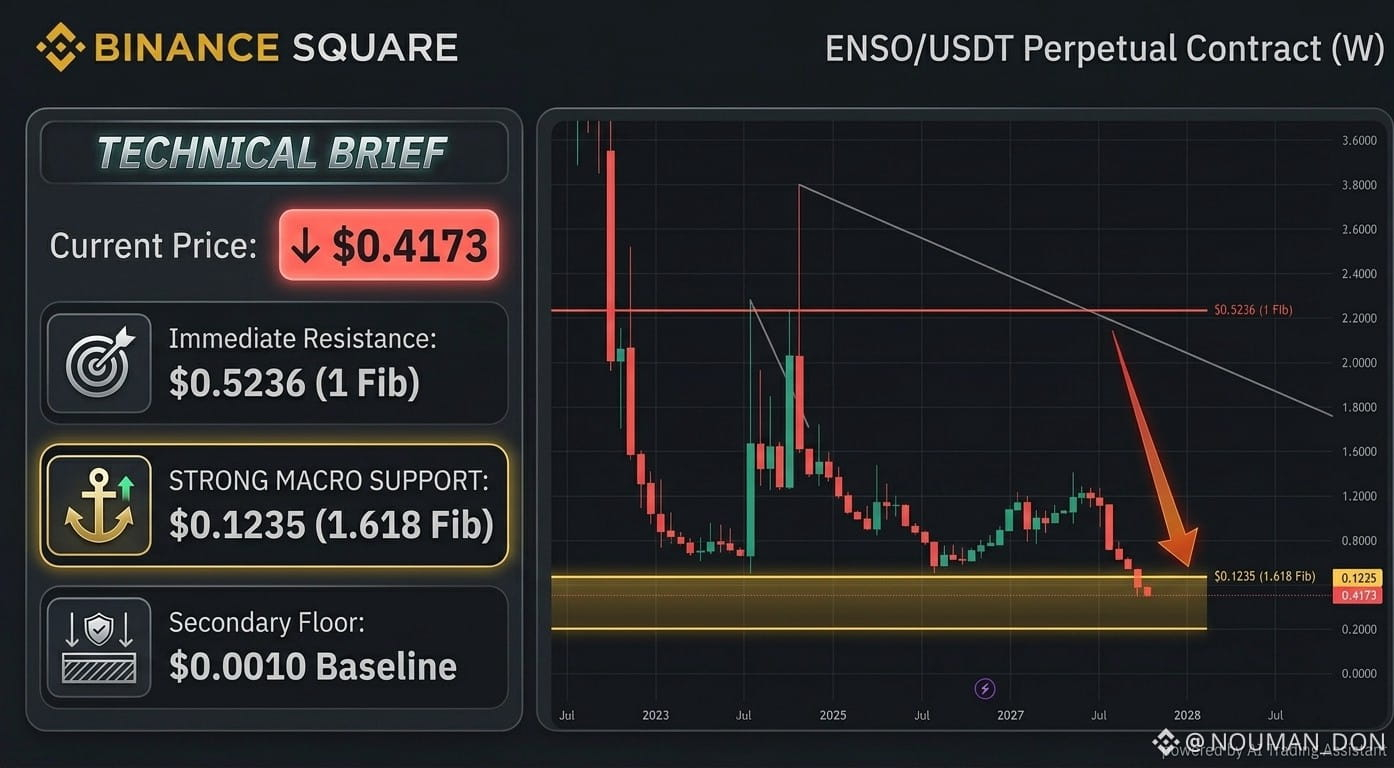
• Current Price: $0.4173
• Immediate Resistance Flipped: Sellers cleanly sliced through the 1 Fib range baseline at $0.5236, flipping this historical floor into immediate overhead supply.
• Strong Macro Support ($0.1235): With local supports invalidated, the primary structural target sits down at the 1.618 Fibonacci extension level located at $0.1235, marking the ultimate macro demand zone.
• Secondary Floor: Directly below sits the psychological $0.0010 baseline.
💡 Trading Strategy:
Reversal Watch: Avoid catching falling knives; wait for clear weekly buyer absorption near $0.1235 or a clean reclaim back above $0.5236.Risk Note: Volatility remains elevated during structural discovery.
#ENSOUSDT #cryptotrading #TechnicalAnalysis #BinanceSquare #Fibonacci
{spot}(ENSOUSDT)
{future}(ENSOUSDT)
$ENSO /USDT Perpetual Technical Analysis: Breakdown Testing Macro Support Floor 🚨
The weekly chart shows $ENSO experiencing a steep multi-week sell-off (-4.28%), breaking below its ascending trendline and slipping beneath its previous range low to search for macro demand.
📉 Strong Macro Supports & Levels:
• Current Price: $0.4173
• Immediate Resistance Flipped: Sellers cleanly sliced through the 1 Fib range baseline at $0.5236, flipping this historical floor into immediate overhead supply.
• Strong Macro Support ($0.1235): With local supports invalidated, the primary structural target sits down at the 1.618 Fibonacci extension level located at $0.1235, marking the ultimate macro demand zone.
• Secondary Floor: Directly below sits the psychological $0.0010 baseline.
💡 Trading Strategy:
Reversal Watch: Avoid catching falling knives; wait for clear weekly buyer absorption near $0.1235 or a clean reclaim back above $0.5236.Risk Note: Volatility remains elevated during structural discovery.
#ENSOUSDT #cryptotrading #TechnicalAnalysis #BinanceSquare #Fibonacci
The weekly chart shows $ENSO experiencing a steep multi-week sell-off (-4.28%), breaking below its ascending trendline and slipping beneath its previous range low to search for macro demand.
📉 Strong Macro Supports & Levels:
• Current Price: $0.4173
• Immediate Resistance Flipped: Sellers cleanly sliced through the 1 Fib range baseline at $0.5236, flipping this historical floor into immediate overhead supply.
• Strong Macro Support ($0.1235): With local supports invalidated, the primary structural target sits down at the 1.618 Fibonacci extension level located at $0.1235, marking the ultimate macro demand zone.
• Secondary Floor: Directly below sits the psychological $0.0010 baseline.
💡 Trading Strategy:
Reversal Watch: Avoid catching falling knives; wait for clear weekly buyer absorption near $0.1235 or a clean reclaim back above $0.5236.Risk Note: Volatility remains elevated during structural discovery.
#ENSOUSDT #cryptotrading #TechnicalAnalysis #BinanceSquare #Fibonacci
1
23
·
--
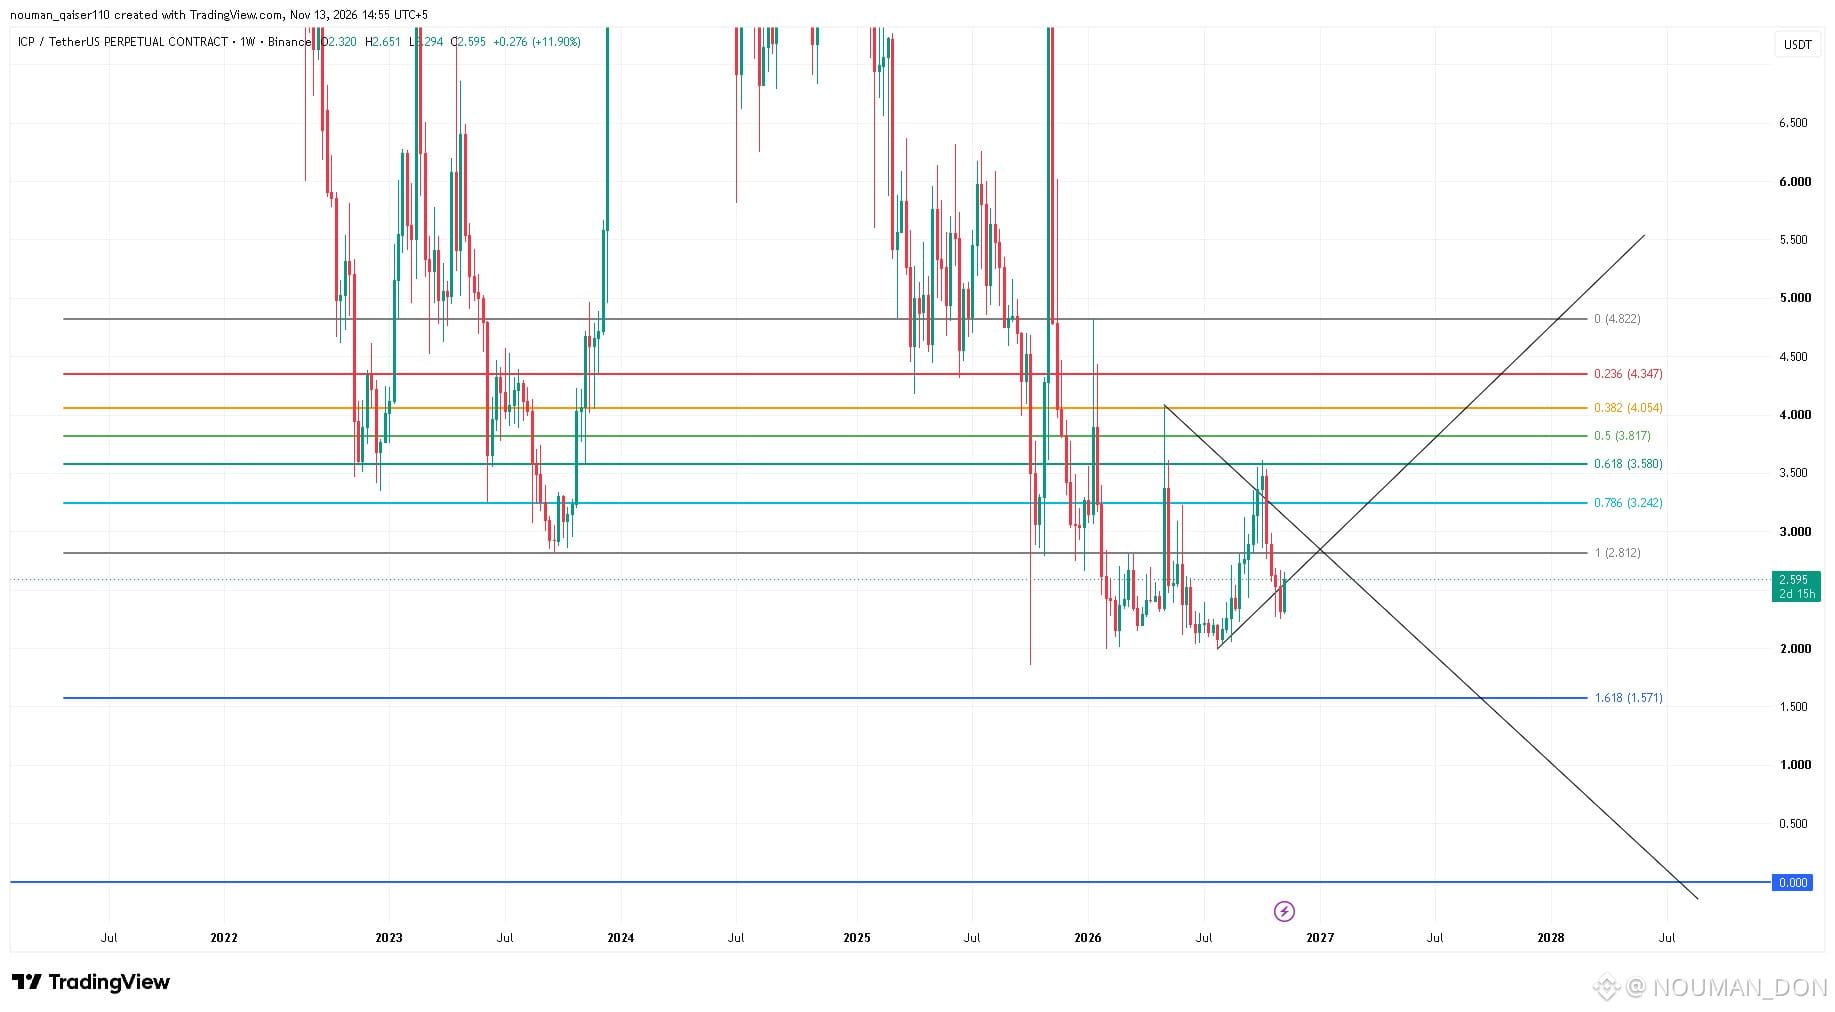
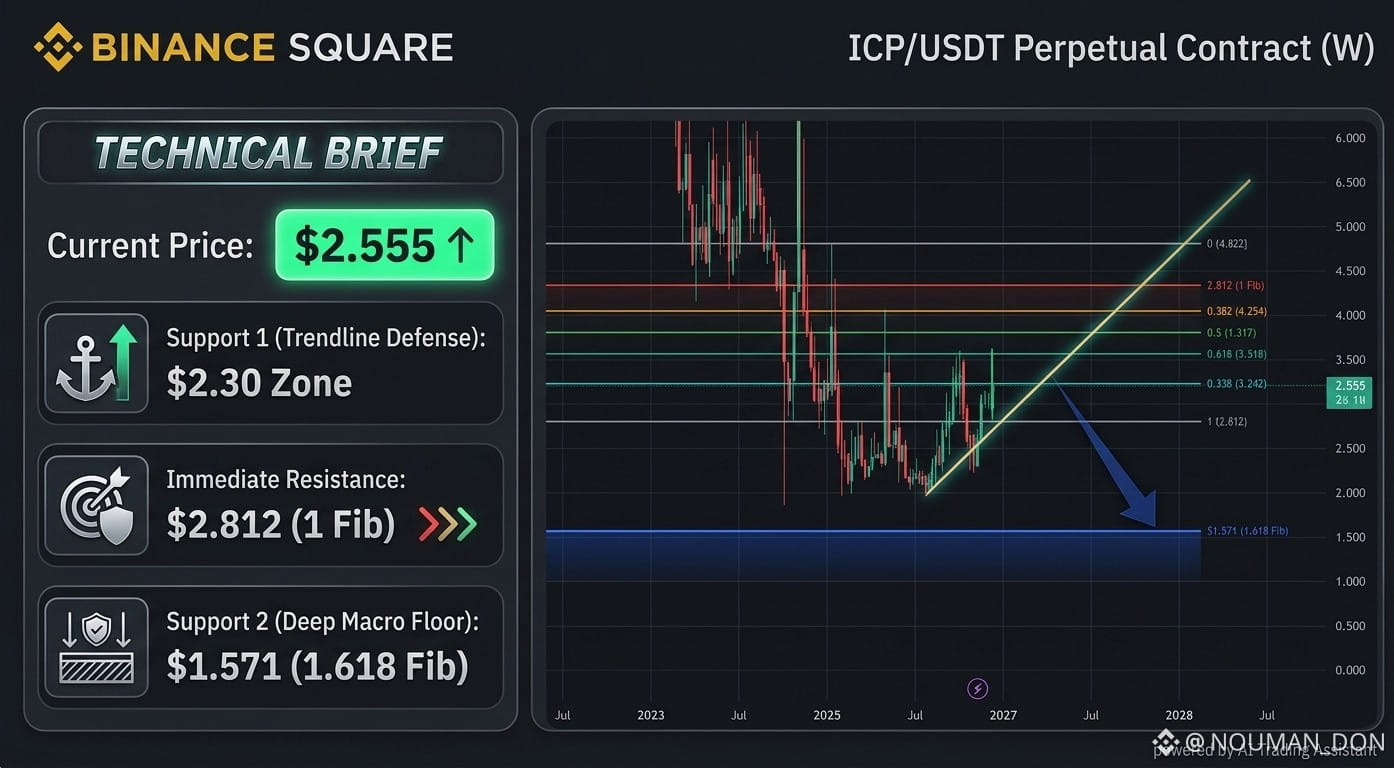
$ICP /USDT Perpetual Technical Analysis: Rebound Off Key Macro Trendline Support 🚀
The weekly chart shows $ICP staging a strong bullish recovery (+11.93%), bouncing directly off a critical multi-month ascending trendline after slipping beneath local baseline levels.
📉 Strong Macro Supports & Levels:
• Current Price: $2.555
• Support 1 (Ascending Trendline Defense): Buyers stepped in aggressively at the rising macro trendline near the $2.29–$2.30 zone, validating it as strong structural support.
• Immediate Resistance Flipped: Price is pushing back up toward the 1 Fib range baseline at $2.812. Reclaiming this level unlocks targets at $3.242 (0.786 Fib) and $3.580 (0.618 Fib).
• Support 2 (Deep Macro Floor): If the ascending trendline fails on a weekly close, the ultimate structural demand rests down at the 1.618 Fib extension at $1.571.
💡 Trading Strategy:
Trendline Long: Scale into long setups on pullbacks toward the rising trendline support ($2.30), targeting a reclaim of $2.812 and $3.242.Risk Note: Keep stop-losses tight below $2.15 to protect against trendline invalidation.
#ICPUSDT #cryptotrading #TechnicalAnalysis #BinanceSquare #Fibonacci
{spot}(ICPUSDT)
{future}(ICPUSDT)
$ICP /USDT Perpetual Technical Analysis: Rebound Off Key Macro Trendline Support 🚀
The weekly chart shows $ICP staging a strong bullish recovery (+11.93%), bouncing directly off a critical multi-month ascending trendline after slipping beneath local baseline levels.
📉 Strong Macro Supports & Levels:
• Current Price: $2.555
• Support 1 (Ascending Trendline Defense): Buyers stepped in aggressively at the rising macro trendline near the $2.29–$2.30 zone, validating it as strong structural support.
• Immediate Resistance Flipped: Price is pushing back up toward the 1 Fib range baseline at $2.812. Reclaiming this level unlocks targets at $3.242 (0.786 Fib) and $3.580 (0.618 Fib).
• Support 2 (Deep Macro Floor): If the ascending trendline fails on a weekly close, the ultimate structural demand rests down at the 1.618 Fib extension at $1.571.
💡 Trading Strategy:
Trendline Long: Scale into long setups on pullbacks toward the rising trendline support ($2.30), targeting a reclaim of $2.812 and $3.242.Risk Note: Keep stop-losses tight below $2.15 to protect against trendline invalidation.
#ICPUSDT #cryptotrading #TechnicalAnalysis #BinanceSquare #Fibonacci
The weekly chart shows $ICP staging a strong bullish recovery (+11.93%), bouncing directly off a critical multi-month ascending trendline after slipping beneath local baseline levels.
📉 Strong Macro Supports & Levels:
• Current Price: $2.555
• Support 1 (Ascending Trendline Defense): Buyers stepped in aggressively at the rising macro trendline near the $2.29–$2.30 zone, validating it as strong structural support.
• Immediate Resistance Flipped: Price is pushing back up toward the 1 Fib range baseline at $2.812. Reclaiming this level unlocks targets at $3.242 (0.786 Fib) and $3.580 (0.618 Fib).
• Support 2 (Deep Macro Floor): If the ascending trendline fails on a weekly close, the ultimate structural demand rests down at the 1.618 Fib extension at $1.571.
💡 Trading Strategy:
Trendline Long: Scale into long setups on pullbacks toward the rising trendline support ($2.30), targeting a reclaim of $2.812 and $3.242.Risk Note: Keep stop-losses tight below $2.15 to protect against trendline invalidation.
#ICPUSDT #cryptotrading #TechnicalAnalysis #BinanceSquare #Fibonacci
1
2
272
·
--
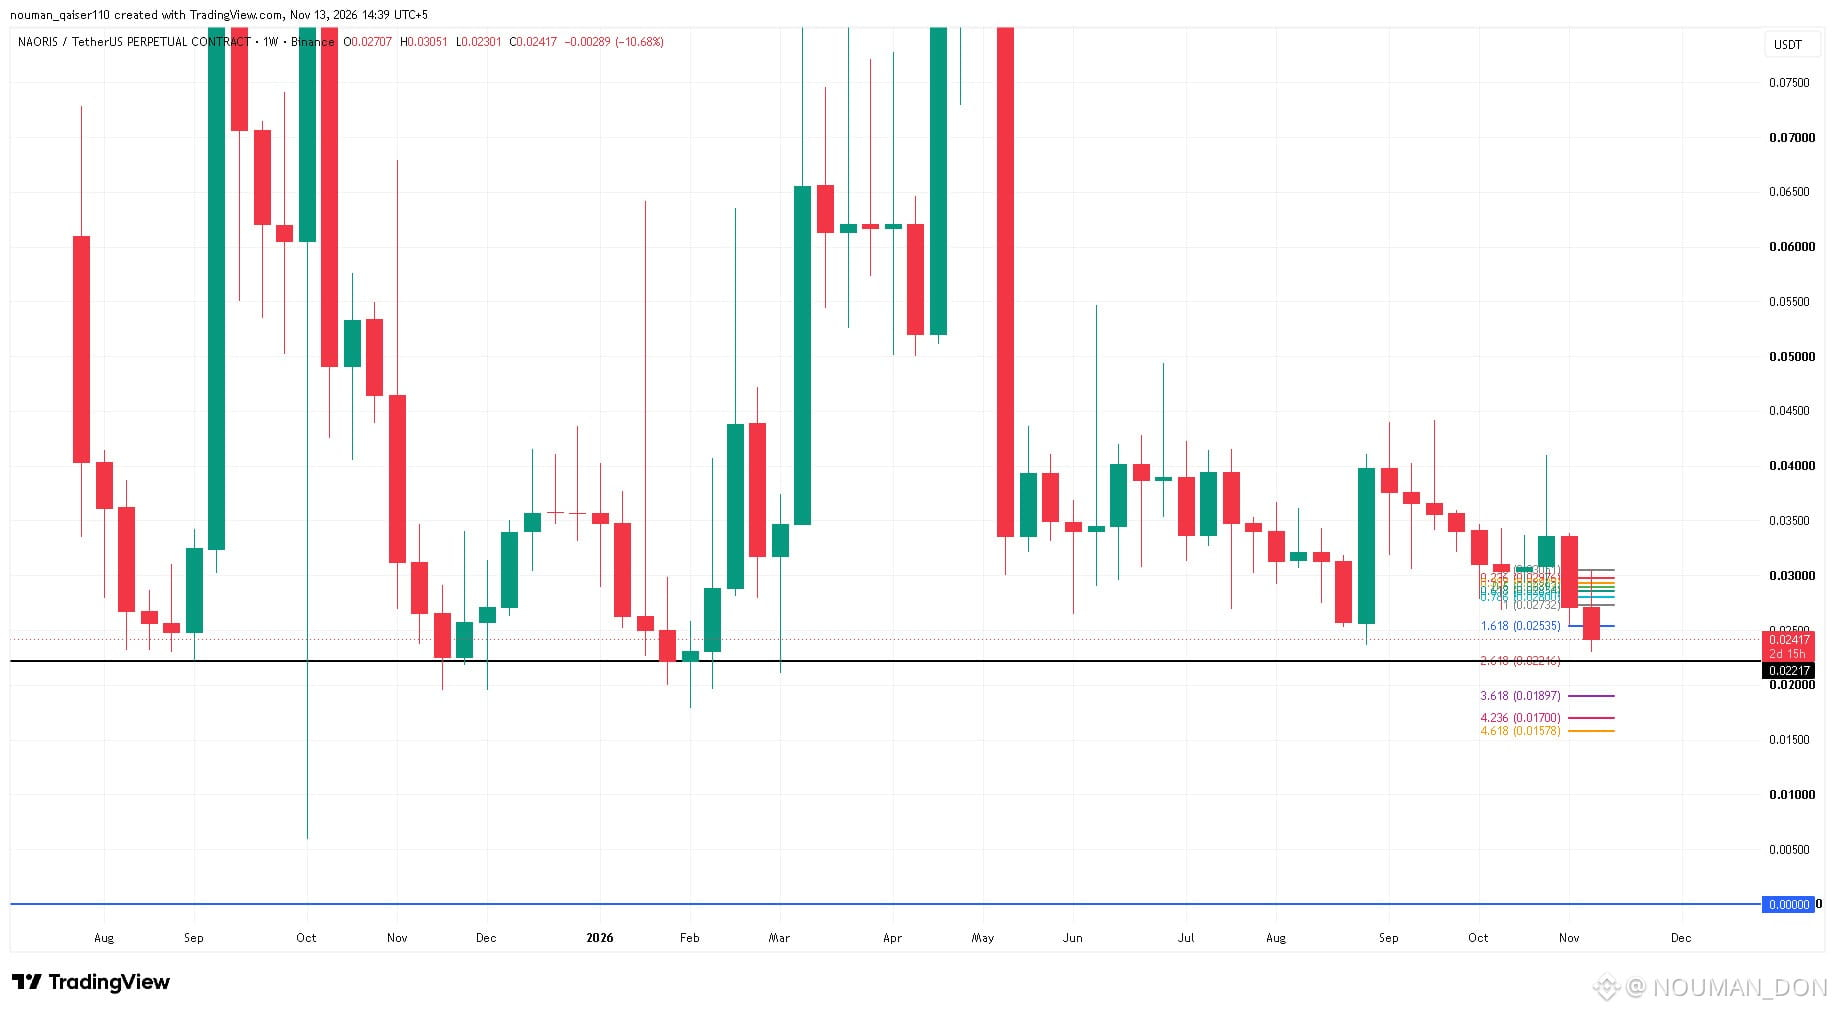
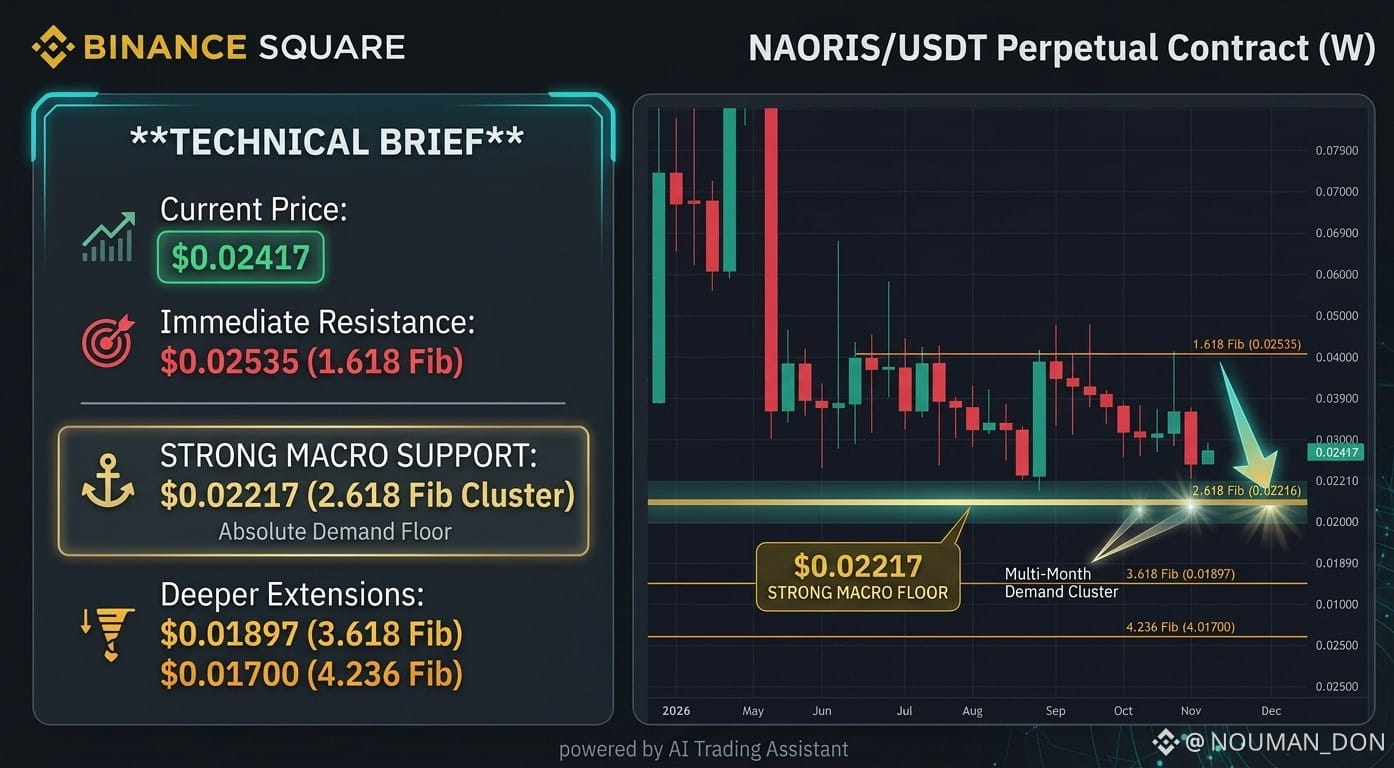
$NAORIS /USDT Perpetual Technical Analysis: Testing Major Macro Support Floor 🚨
The weekly chart shows $NAORIS pressing directly down into a multi-month horizontal floor after slipping below its local consolidation base, putting strong structural defense levels to the test.
📉 Strong Macro Supports:
• Current Price: $0.02417
• Immediate Resistance Flipped: Price recently breached the 1.618 Fib extension at $0.02535, which now acts as immediate overhead resistance on relief bounces.
• Strong Macro Support ($0.02217): All eyes are locked on the critical horizontal baseline at $0.02217, which aligns tightly with the 2.618 Fib extension ($0.02216). This multi-month historical demand floor has repeatedly absorbed heavy selling pressure in the past.
• Deeper Extension Floors: If $0.02217 fails to hold on a weekly close, deeper downside extensions sit at $0.01897 (3.618 Fib) and $0.01700 (4.236 Fib).
💡 Trading Strategy:
Reversal Play: Watch for strong weekly buyer absorption or long-wick defense right at the $0.02217 macro floor before scaling into long positions.Risk Note: Keep stops tight beneath $0.02150 to protect against deeper breakdowns.
#naorisusdt #cryptotrading #TechnicalAnalysis #BinanceSquare #Fibonacci
{alpha}(560x1b379a79c91a540b2bcd612b4d713f31de1b80cc)
{future}(NAORISUSDT)
$NAORIS /USDT Perpetual Technical Analysis: Testing Major Macro Support Floor 🚨
The weekly chart shows $NAORIS pressing directly down into a multi-month horizontal floor after slipping below its local consolidation base, putting strong structural defense levels to the test.
📉 Strong Macro Supports:
• Current Price: $0.02417
• Immediate Resistance Flipped: Price recently breached the 1.618 Fib extension at $0.02535, which now acts as immediate overhead resistance on relief bounces.
• Strong Macro Support ($0.02217): All eyes are locked on the critical horizontal baseline at $0.02217, which aligns tightly with the 2.618 Fib extension ($0.02216). This multi-month historical demand floor has repeatedly absorbed heavy selling pressure in the past.
• Deeper Extension Floors: If $0.02217 fails to hold on a weekly close, deeper downside extensions sit at $0.01897 (3.618 Fib) and $0.01700 (4.236 Fib).
💡 Trading Strategy:
Reversal Play: Watch for strong weekly buyer absorption or long-wick defense right at the $0.02217 macro floor before scaling into long positions.Risk Note: Keep stops tight beneath $0.02150 to protect against deeper breakdowns.
#naorisusdt #cryptotrading #TechnicalAnalysis #BinanceSquare #Fibonacci
The weekly chart shows $NAORIS pressing directly down into a multi-month horizontal floor after slipping below its local consolidation base, putting strong structural defense levels to the test.
📉 Strong Macro Supports:
• Current Price: $0.02417
• Immediate Resistance Flipped: Price recently breached the 1.618 Fib extension at $0.02535, which now acts as immediate overhead resistance on relief bounces.
• Strong Macro Support ($0.02217): All eyes are locked on the critical horizontal baseline at $0.02217, which aligns tightly with the 2.618 Fib extension ($0.02216). This multi-month historical demand floor has repeatedly absorbed heavy selling pressure in the past.
• Deeper Extension Floors: If $0.02217 fails to hold on a weekly close, deeper downside extensions sit at $0.01897 (3.618 Fib) and $0.01700 (4.236 Fib).
💡 Trading Strategy:
Reversal Play: Watch for strong weekly buyer absorption or long-wick defense right at the $0.02217 macro floor before scaling into long positions.Risk Note: Keep stops tight beneath $0.02150 to protect against deeper breakdowns.
#naorisusdt #cryptotrading #TechnicalAnalysis #BinanceSquare #Fibonacci
2
110
·
--
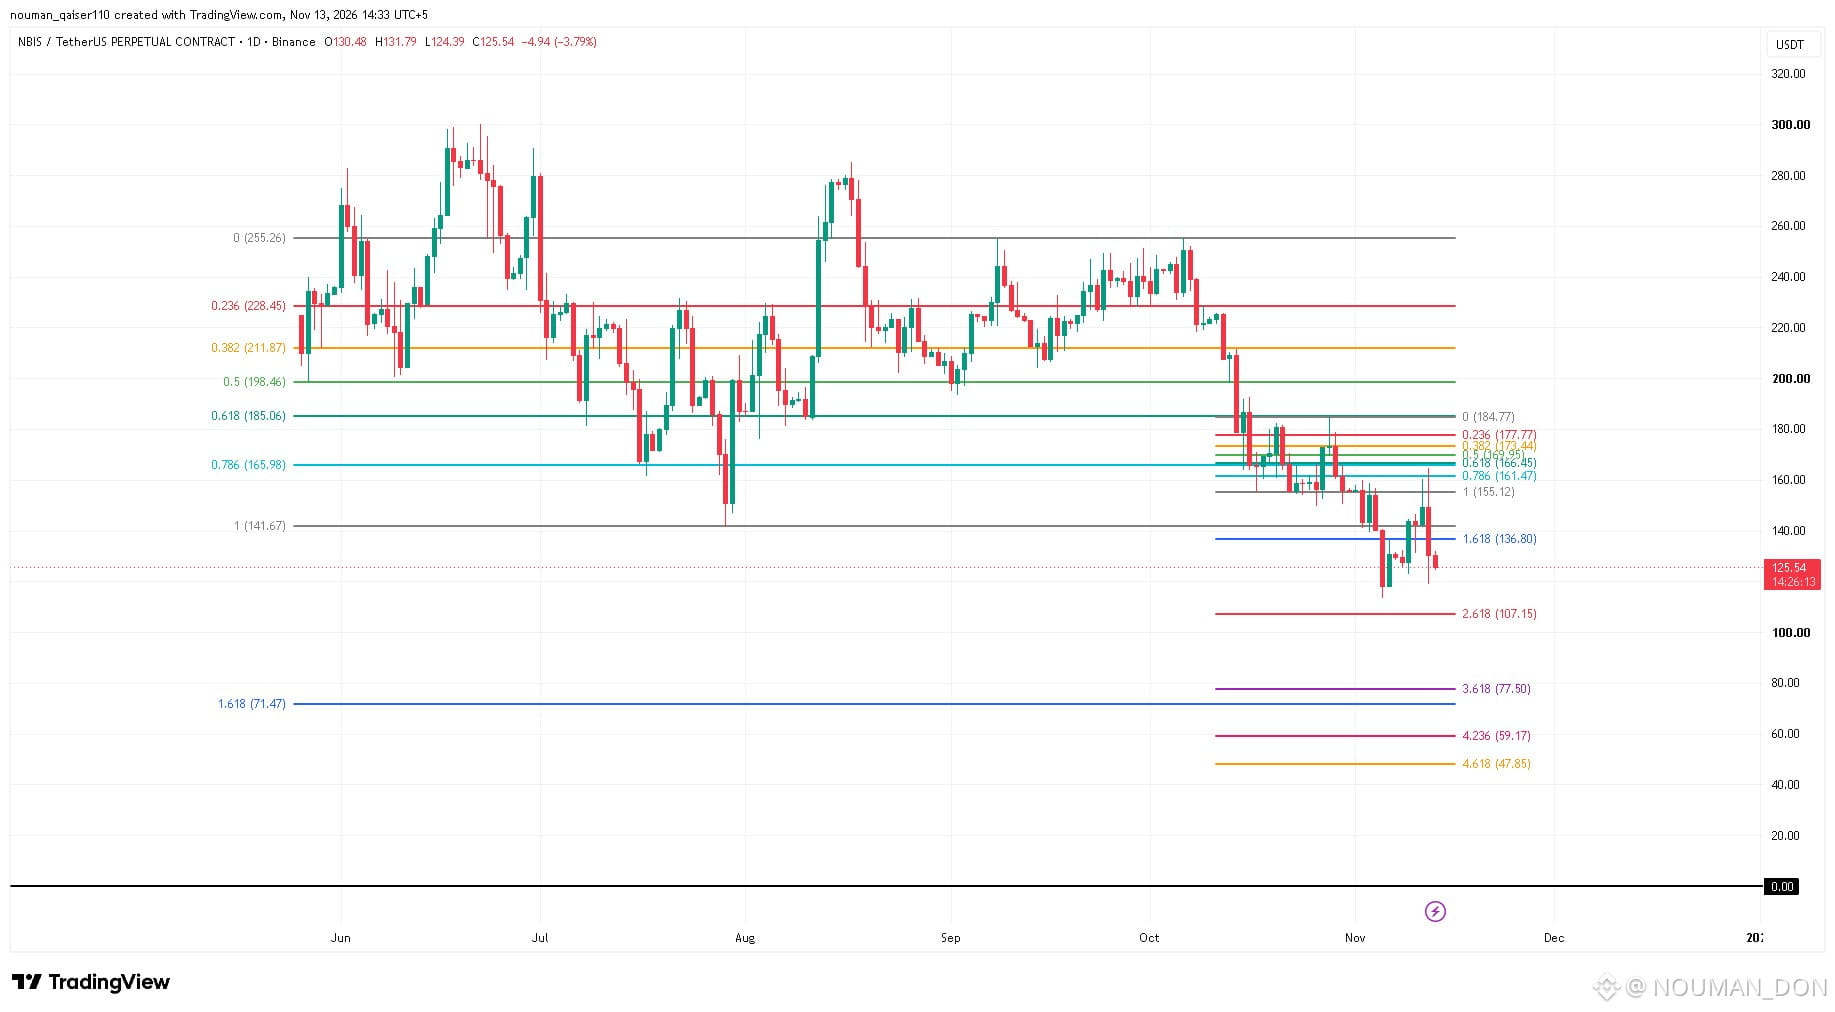
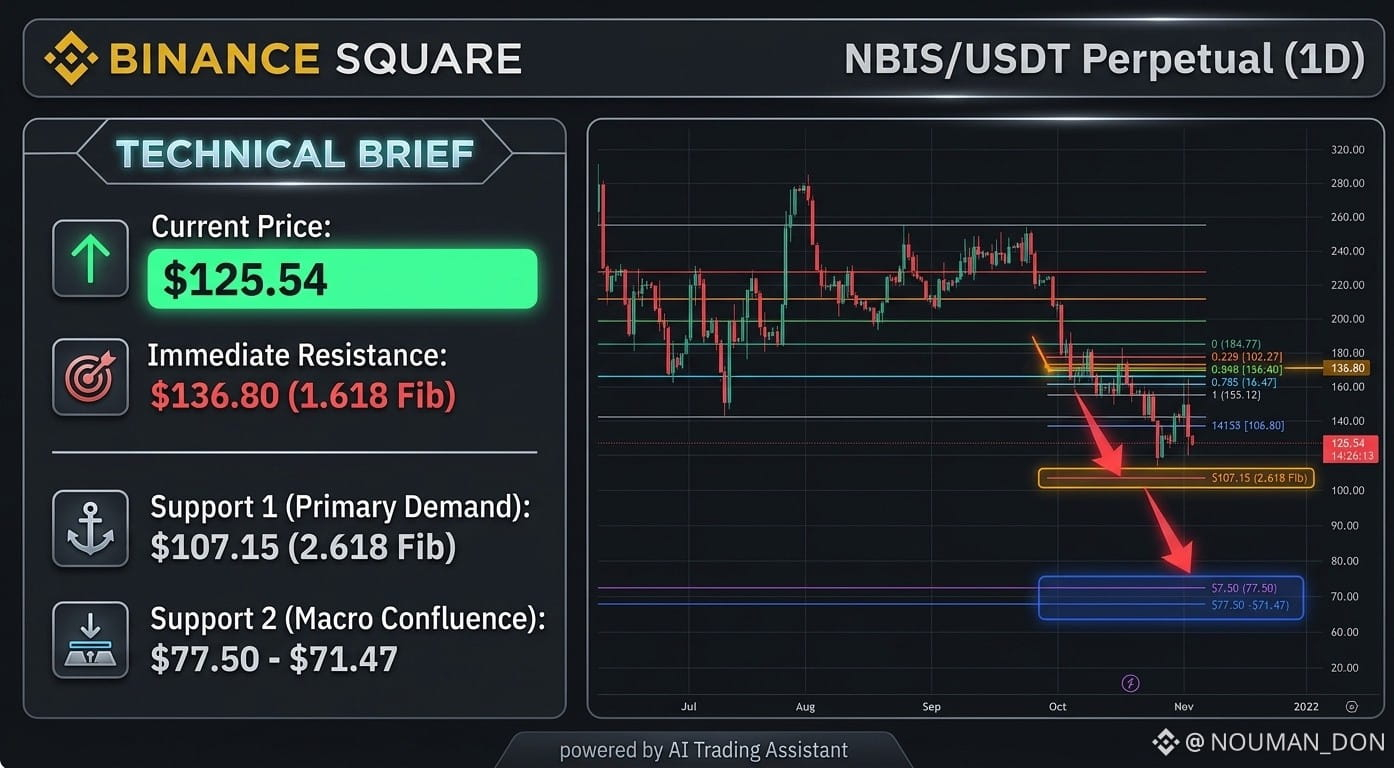
$NBIS /USDT Perpetual Technical Analysis: Breakdown Testing Strong Macro Supports 🚨
The daily chart shows $NBIS extending its corrective markdown phase, slipping beneath local consolidation floors and sliding directly toward critical macro Fibonacci support structures.
📉 Strong Macro Supports:
• Current Price: $125.54
• Immediate Resistance Flipped: Price has cleanly broken down beneath the local 1.618 Fib extension at $136.80 and the broader macro 1 Fib baseline ($141.57), turning them into overhead supply.
• Support 1 (Primary Demand): The immediate structural target sits down at the 2.618 Fib extension located at $107.15, where initial buyer absorption is expected.
• Support 2 (Macro Confluence Floor): A deeper breakdown opens a clear path toward the heavy macro support cluster between $77.50 (3.618 Fib) and $71.47 (broader 1.618 Fib).
💡 Trading Strategy:
Defensive Bidding: Scale bids defensively near $107.15 only upon seeing clear daily buyer exhaustion or long-wick rejection.Risk Note: Volatility remains elevated; manage stop-losses tightly below structural floors.
#nbisusdt #cryptotrading #TechnicalAnalysis #BinanceSquare #Fibonacci
{spot}(NBISBUSDT)
{future}(NBISUSDT)
$NBIS /USDT Perpetual Technical Analysis: Breakdown Testing Strong Macro Supports 🚨
The daily chart shows $NBIS extending its corrective markdown phase, slipping beneath local consolidation floors and sliding directly toward critical macro Fibonacci support structures.
📉 Strong Macro Supports:
• Current Price: $125.54
• Immediate Resistance Flipped: Price has cleanly broken down beneath the local 1.618 Fib extension at $136.80 and the broader macro 1 Fib baseline ($141.57), turning them into overhead supply.
• Support 1 (Primary Demand): The immediate structural target sits down at the 2.618 Fib extension located at $107.15, where initial buyer absorption is expected.
• Support 2 (Macro Confluence Floor): A deeper breakdown opens a clear path toward the heavy macro support cluster between $77.50 (3.618 Fib) and $71.47 (broader 1.618 Fib).
💡 Trading Strategy:
Defensive Bidding: Scale bids defensively near $107.15 only upon seeing clear daily buyer exhaustion or long-wick rejection.Risk Note: Volatility remains elevated; manage stop-losses tightly below structural floors.
#nbisusdt #cryptotrading #TechnicalAnalysis #BinanceSquare #Fibonacci
The daily chart shows $NBIS extending its corrective markdown phase, slipping beneath local consolidation floors and sliding directly toward critical macro Fibonacci support structures.
📉 Strong Macro Supports:
• Current Price: $125.54
• Immediate Resistance Flipped: Price has cleanly broken down beneath the local 1.618 Fib extension at $136.80 and the broader macro 1 Fib baseline ($141.57), turning them into overhead supply.
• Support 1 (Primary Demand): The immediate structural target sits down at the 2.618 Fib extension located at $107.15, where initial buyer absorption is expected.
• Support 2 (Macro Confluence Floor): A deeper breakdown opens a clear path toward the heavy macro support cluster between $77.50 (3.618 Fib) and $71.47 (broader 1.618 Fib).
💡 Trading Strategy:
Defensive Bidding: Scale bids defensively near $107.15 only upon seeing clear daily buyer exhaustion or long-wick rejection.Risk Note: Volatility remains elevated; manage stop-losses tightly below structural floors.
#nbisusdt #cryptotrading #TechnicalAnalysis #BinanceSquare #Fibonacci
1
185
·
--
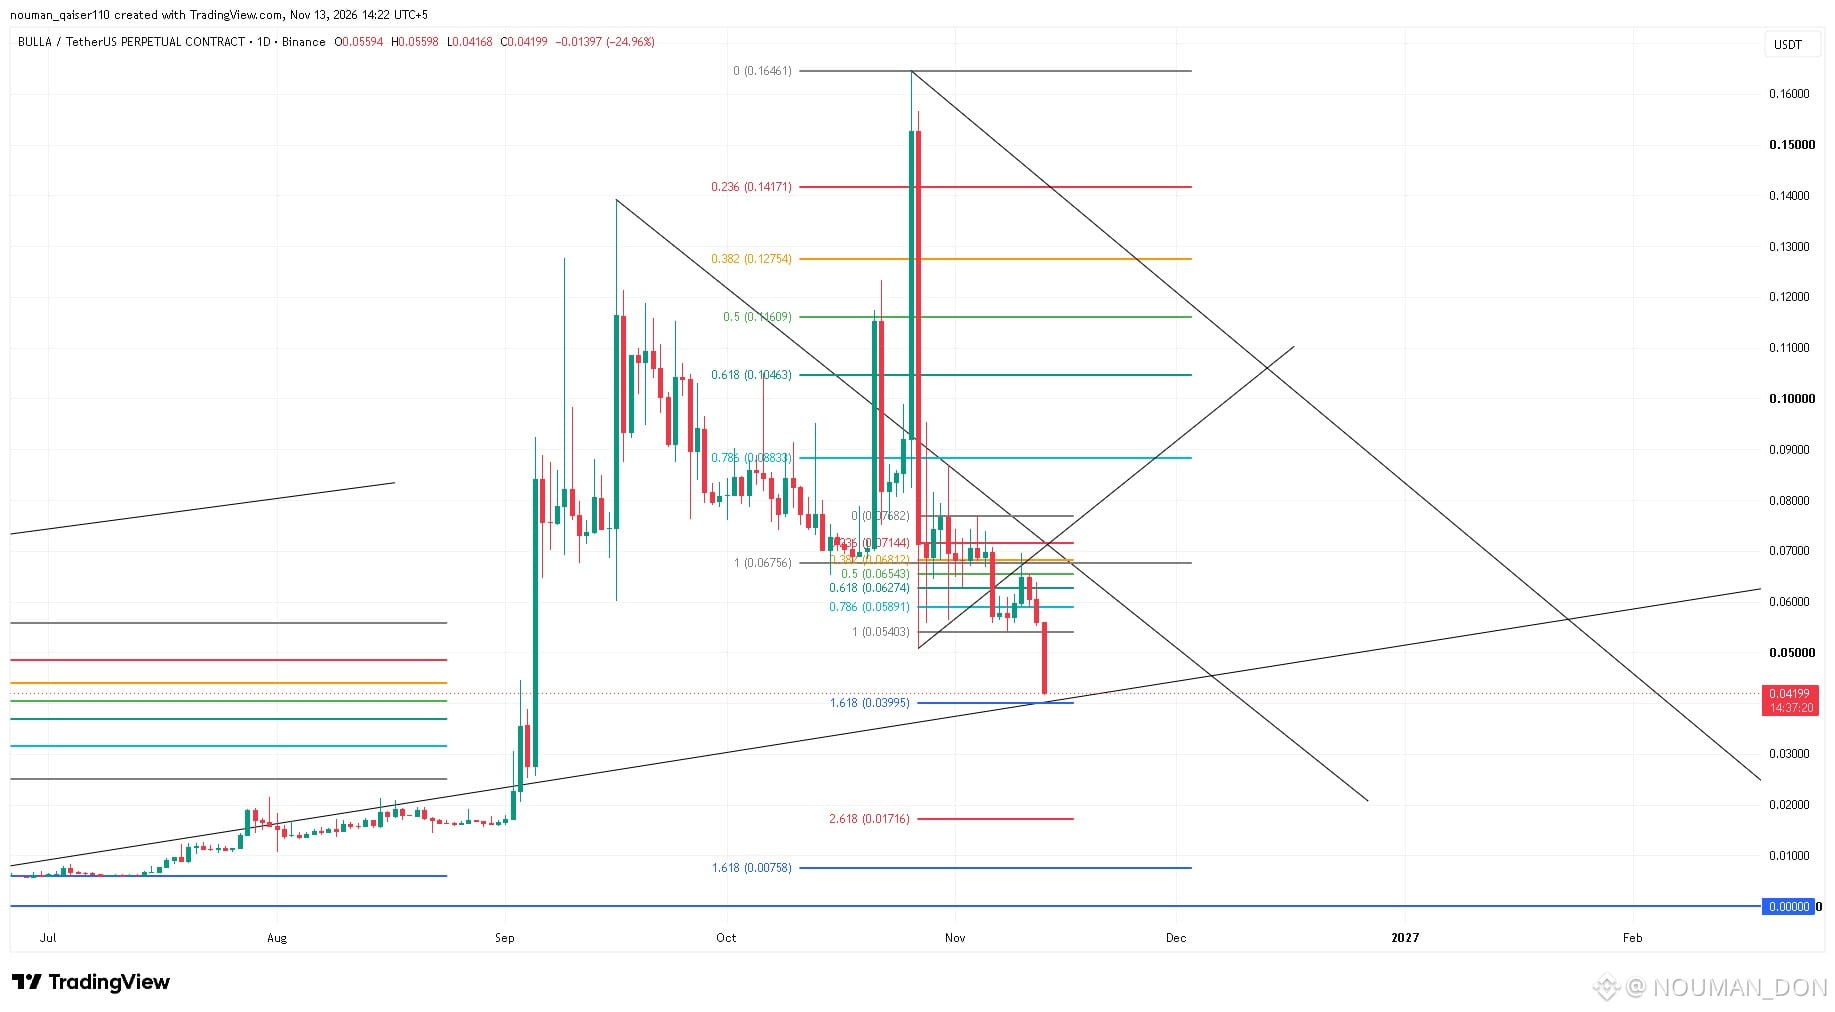
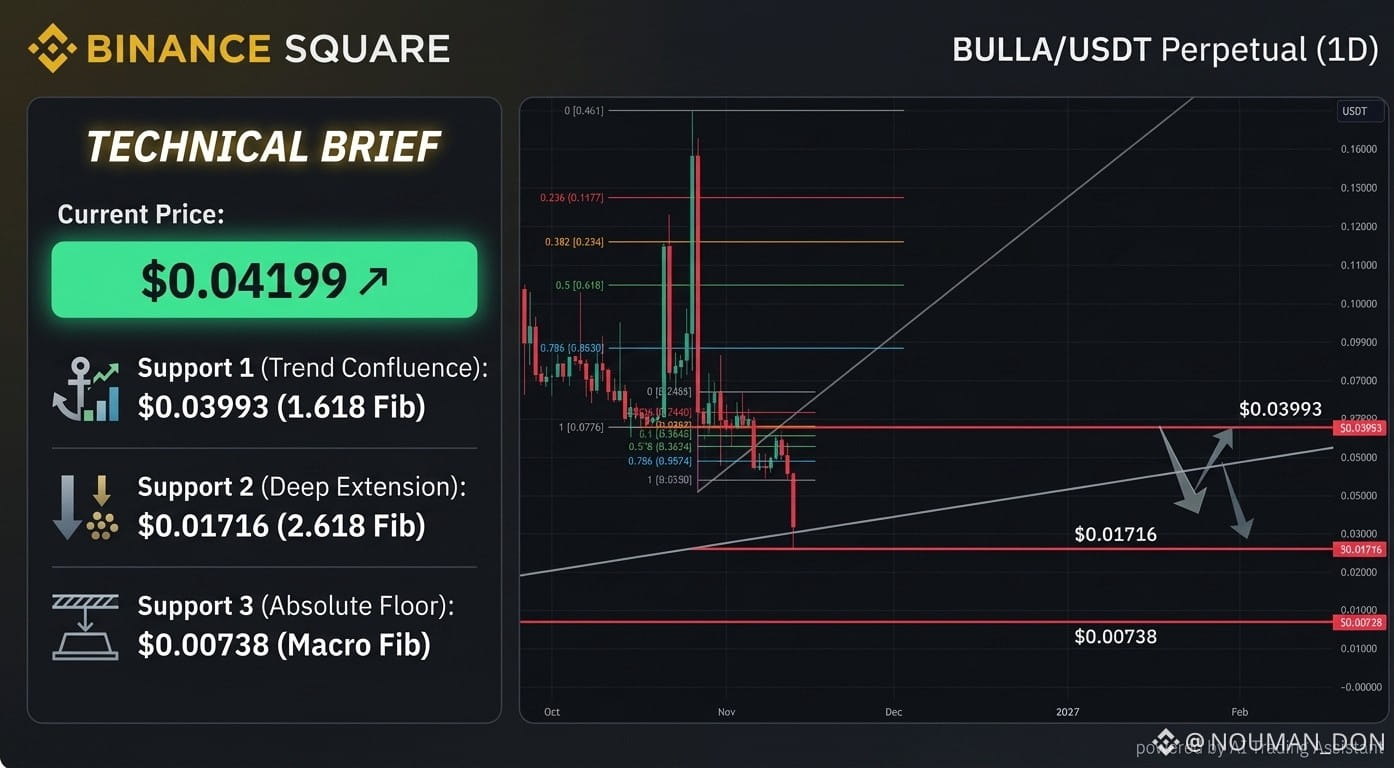
$BULLA /USDT Perpetual Technical Analysis: Capitulation Testing Three Strong Supports 🚨
The daily chart shows $BULLA suffering a heavy liquidation flush (-24%), wiping out local ranges and plunging straight toward critical multi-month support lines.
📉 Three Strong Macro Supports:
• Current Price: $0.04199
• Support 1 (Immediate Confluence): Price is hammering directly into the 1.618 Fib extension at $0.03993, intersecting perfectly with the primary ascending macro trendline.
• Support 2 (Deep Extension): If this trendline confluence fails to absorb the selling pressure, the next defensive floor sits at the 2.618 Fib extension down at $0.01716.
• Support 3 (Absolute Macro Floor): A full capitulation scenario points toward the ultimate historical demand base at the 1.618 macro extension near $0.00738.
💡 Trading Strategy:
Bounce Play: Watch for strong daily buyer absorption or a long-wick rejection at the $0.03993 trendline confluence before considering long entries.Risk Note: Volatility is extreme; keep stops tight below $0.03900 to protect capital against deeper extensions.
#Bullausdt #cryptotrading #TechnicalAnalysis #BinanceSquare #Fibonacci
{alpha}(560x595e21b20e78674f8a64c1566a20b2b316bc3511)
{future}(BULLAUSDT)
$BULLA /USDT Perpetual Technical Analysis: Capitulation Testing Three Strong Supports 🚨
The daily chart shows $BULLA suffering a heavy liquidation flush (-24%), wiping out local ranges and plunging straight toward critical multi-month support lines.
📉 Three Strong Macro Supports:
• Current Price: $0.04199
• Support 1 (Immediate Confluence): Price is hammering directly into the 1.618 Fib extension at $0.03993, intersecting perfectly with the primary ascending macro trendline.
• Support 2 (Deep Extension): If this trendline confluence fails to absorb the selling pressure, the next defensive floor sits at the 2.618 Fib extension down at $0.01716.
• Support 3 (Absolute Macro Floor): A full capitulation scenario points toward the ultimate historical demand base at the 1.618 macro extension near $0.00738.
💡 Trading Strategy:
Bounce Play: Watch for strong daily buyer absorption or a long-wick rejection at the $0.03993 trendline confluence before considering long entries.Risk Note: Volatility is extreme; keep stops tight below $0.03900 to protect capital against deeper extensions.
#Bullausdt #cryptotrading #TechnicalAnalysis #BinanceSquare #Fibonacci
The daily chart shows $BULLA suffering a heavy liquidation flush (-24%), wiping out local ranges and plunging straight toward critical multi-month support lines.
📉 Three Strong Macro Supports:
• Current Price: $0.04199
• Support 1 (Immediate Confluence): Price is hammering directly into the 1.618 Fib extension at $0.03993, intersecting perfectly with the primary ascending macro trendline.
• Support 2 (Deep Extension): If this trendline confluence fails to absorb the selling pressure, the next defensive floor sits at the 2.618 Fib extension down at $0.01716.
• Support 3 (Absolute Macro Floor): A full capitulation scenario points toward the ultimate historical demand base at the 1.618 macro extension near $0.00738.
💡 Trading Strategy:
Bounce Play: Watch for strong daily buyer absorption or a long-wick rejection at the $0.03993 trendline confluence before considering long entries.Risk Note: Volatility is extreme; keep stops tight below $0.03900 to protect capital against deeper extensions.
#Bullausdt #cryptotrading #TechnicalAnalysis #BinanceSquare #Fibonacci
1
275
·
--
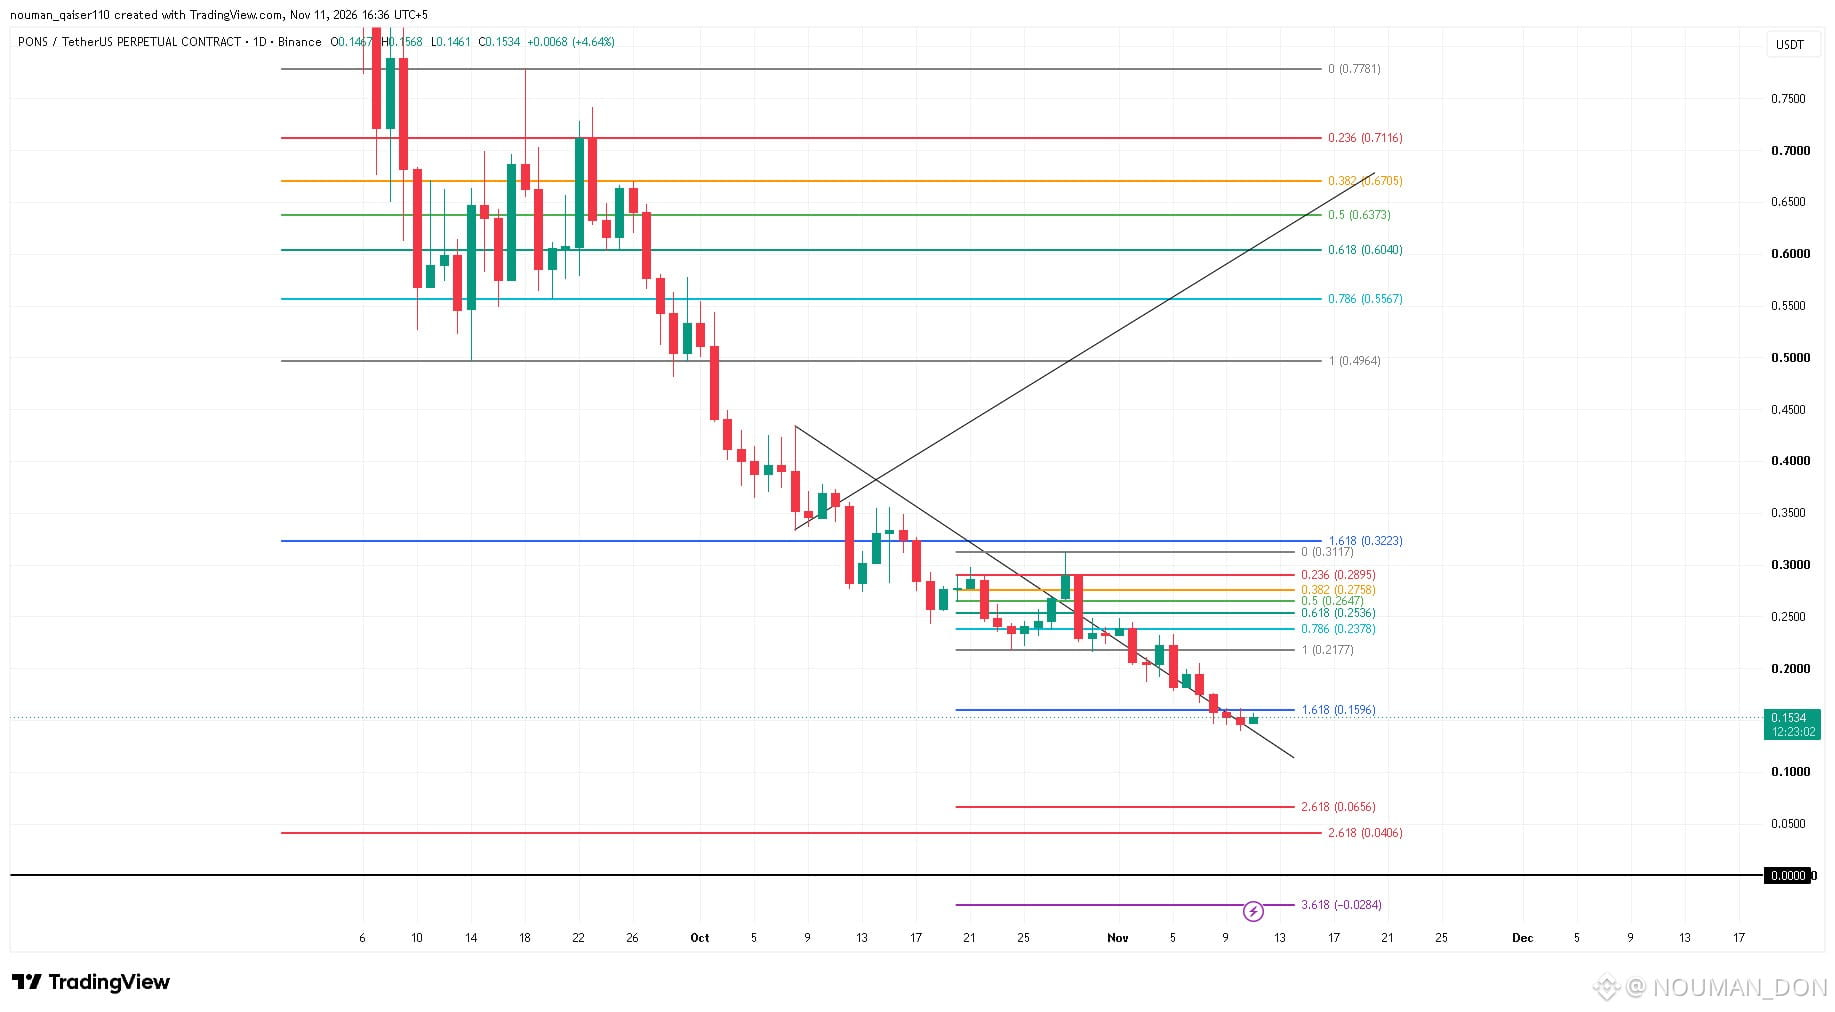
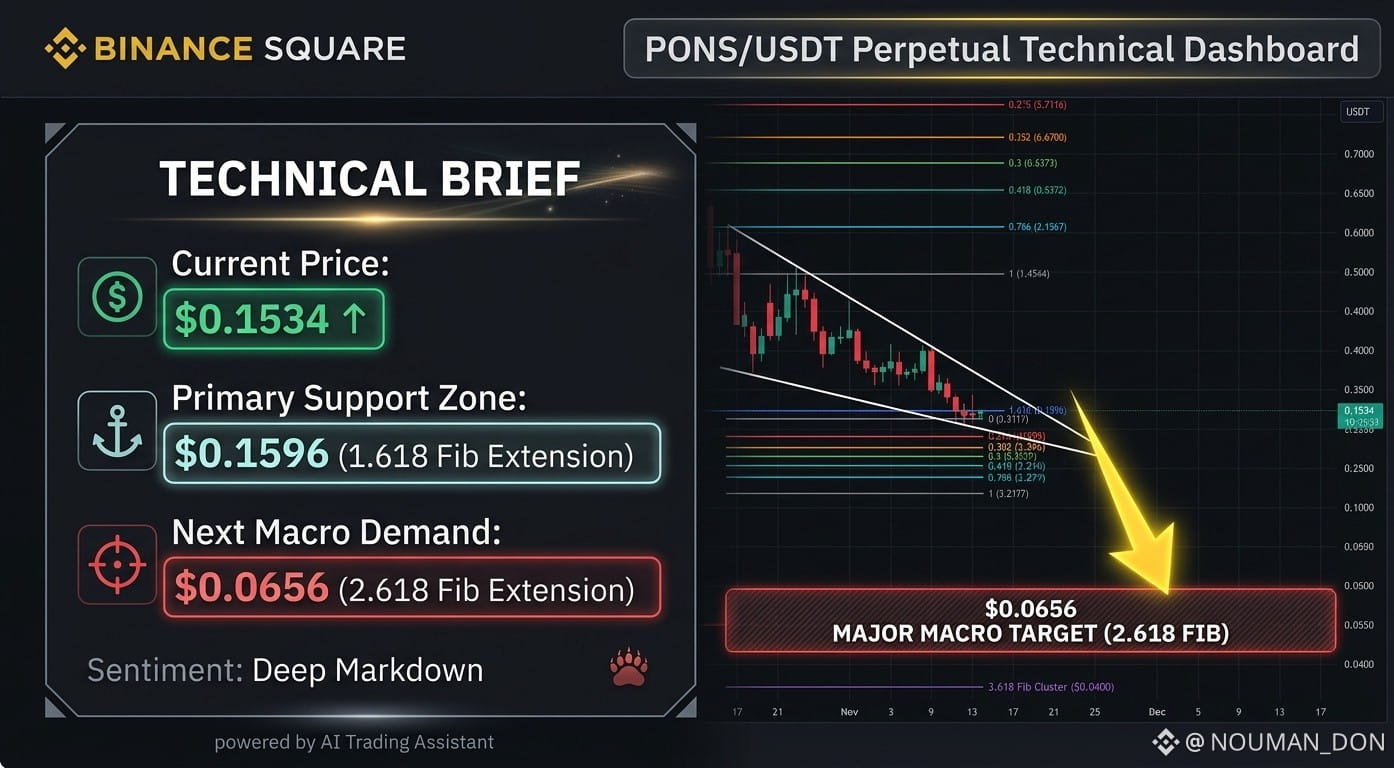
$PONS /USDT Perpetual Technical Analysis: Capitulation Testing Macro Floors 🚨
The daily chart shows $PONS extending its macro markdown phase into deep oversold conditions, slipping beneath short-term consolidation ranges to test key multi-month Fibonacci support structures.
📉 Technical Breakdown:
• Current Price: $0.1534
• Support Zone Testing: The downward expansion is hammering directly into immediate horizontal support at the 1.618 Fib extension level ($0.1596).
• Next Crucial Defense Floors: If sellers sustain command below this local boundary, the next major historical demand nests down at the 2.618 Fib extension cluster located around $0.0656 to $0.0400, representing an absolute capitulation value floor.
• Overhead Supply: Any potential mean-reversion relief rally will face heavy structural resistance back up near the 1 Fib range baseline at $0.2177.
💡 Trading Strategy:
Reversal Watch: Wait for clear daily buyer absorption or long-wick defense around these extreme extensions before looking to scale long exposure.Invalidation Metric: Maintain strict risk protocols; structural invalidations occur if support zones give way to severe volume expansion.
#ponsusdt #cryptotrading #TechnicalAnalysis #BinanceSquare #Fibonacci
{alpha}(46630x39dbed3a2bd333467115de45665cc57f813c4571)
{future}(PONSUSDT)
$PONS /USDT Perpetual Technical Analysis: Capitulation Testing Macro Floors 🚨
The daily chart shows $PONS extending its macro markdown phase into deep oversold conditions, slipping beneath short-term consolidation ranges to test key multi-month Fibonacci support structures.
📉 Technical Breakdown:
• Current Price: $0.1534
• Support Zone Testing: The downward expansion is hammering directly into immediate horizontal support at the 1.618 Fib extension level ($0.1596).
• Next Crucial Defense Floors: If sellers sustain command below this local boundary, the next major historical demand nests down at the 2.618 Fib extension cluster located around $0.0656 to $0.0400, representing an absolute capitulation value floor.
• Overhead Supply: Any potential mean-reversion relief rally will face heavy structural resistance back up near the 1 Fib range baseline at $0.2177.
💡 Trading Strategy:
Reversal Watch: Wait for clear daily buyer absorption or long-wick defense around these extreme extensions before looking to scale long exposure.Invalidation Metric: Maintain strict risk protocols; structural invalidations occur if support zones give way to severe volume expansion.
#ponsusdt #cryptotrading #TechnicalAnalysis #BinanceSquare #Fibonacci
The daily chart shows $PONS extending its macro markdown phase into deep oversold conditions, slipping beneath short-term consolidation ranges to test key multi-month Fibonacci support structures.
📉 Technical Breakdown:
• Current Price: $0.1534
• Support Zone Testing: The downward expansion is hammering directly into immediate horizontal support at the 1.618 Fib extension level ($0.1596).
• Next Crucial Defense Floors: If sellers sustain command below this local boundary, the next major historical demand nests down at the 2.618 Fib extension cluster located around $0.0656 to $0.0400, representing an absolute capitulation value floor.
• Overhead Supply: Any potential mean-reversion relief rally will face heavy structural resistance back up near the 1 Fib range baseline at $0.2177.
💡 Trading Strategy:
Reversal Watch: Wait for clear daily buyer absorption or long-wick defense around these extreme extensions before looking to scale long exposure.Invalidation Metric: Maintain strict risk protocols; structural invalidations occur if support zones give way to severe volume expansion.
#ponsusdt #cryptotrading #TechnicalAnalysis #BinanceSquare #Fibonacci
4
844
·
--
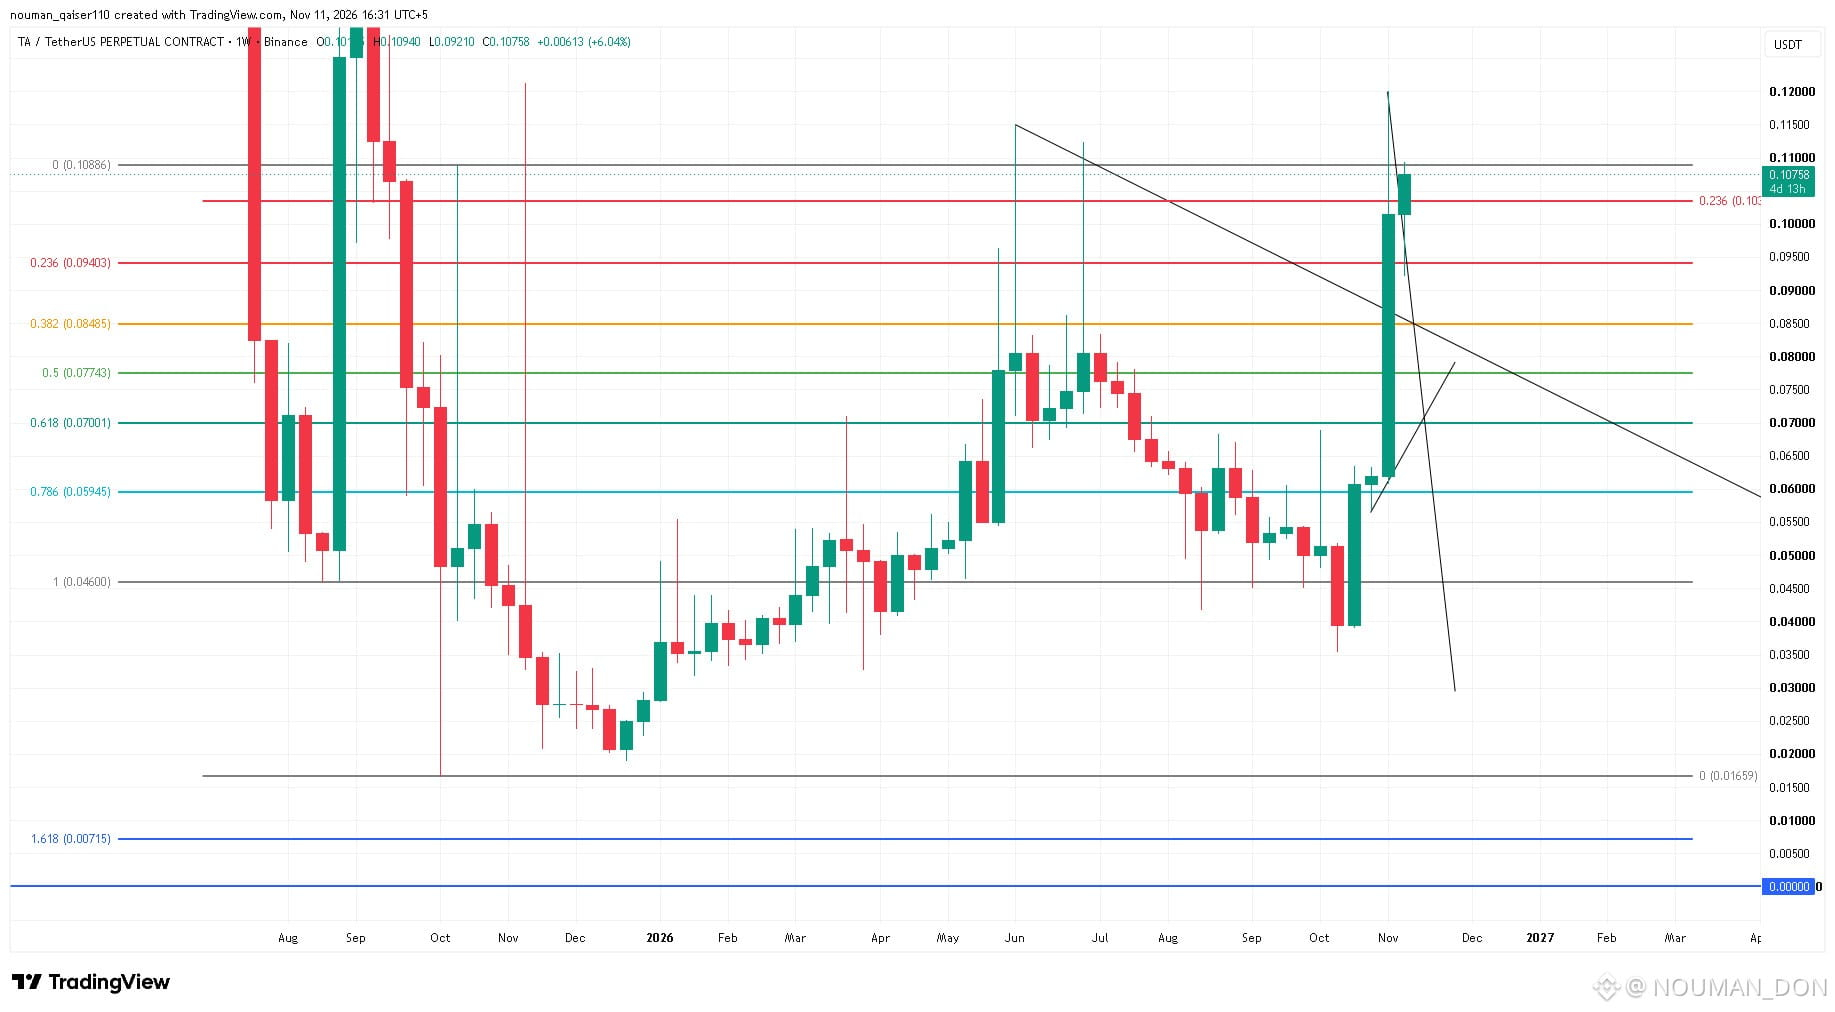
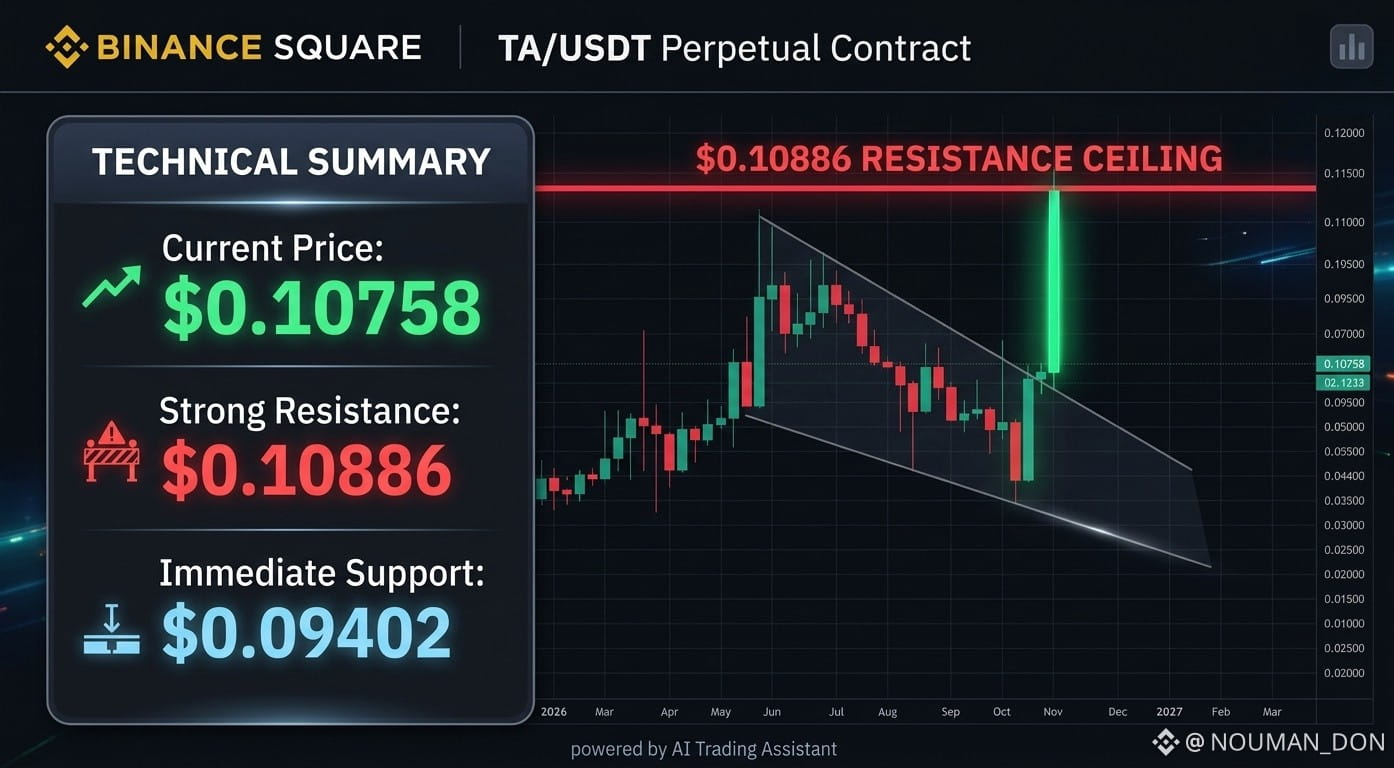
$TA /USDT Perpetual Technical Analysis: Explosive Breakout Testing Major Resistance 🚀
The daily chart shows $TA initiating a massive vertical breakout vector, blasting cleanly out of multi-month descending wedge compression and surging straight into major historical macro resistance layers.
📈 Technical Breakdown:
• Current Price: $0.10758
• Strong Resistance Check: Momentum is running directly into a heavy supply ceiling sitting at the 0 Fib baseline at $0.10886. This level represents a critical inflection point for full macro continuation.
• Upside Target Path: A decisive daily close above $0.10886 validates a clean breakout extension, opening the path for a powerful run toward higher key resistance structures.
• Immediate Demand Floor: On short-term structural pullbacks, the previous wedge breaker zone near the 0.236 Fib level ($0.09402) acts as fresh support.
💡 Trading Strategy:
Breakout Play: Position for structural expansion once a clean daily candle closes firmly above $0.10886.Pullback Setup: Look to catch low-risk long exposure on healthy retests of the $0.09402 breakout region.
#TAUSDT #cryptotrading #TechnicalAnalysis #BinanceSquare #Fibonacci
{alpha}(560x539ae81a166e5e80aed211731563e549c411b140)
{future}(TAUSDT)
$TA /USDT Perpetual Technical Analysis: Explosive Breakout Testing Major Resistance 🚀
The daily chart shows $TA initiating a massive vertical breakout vector, blasting cleanly out of multi-month descending wedge compression and surging straight into major historical macro resistance layers.
📈 Technical Breakdown:
• Current Price: $0.10758
• Strong Resistance Check: Momentum is running directly into a heavy supply ceiling sitting at the 0 Fib baseline at $0.10886. This level represents a critical inflection point for full macro continuation.
• Upside Target Path: A decisive daily close above $0.10886 validates a clean breakout extension, opening the path for a powerful run toward higher key resistance structures.
• Immediate Demand Floor: On short-term structural pullbacks, the previous wedge breaker zone near the 0.236 Fib level ($0.09402) acts as fresh support.
💡 Trading Strategy:
Breakout Play: Position for structural expansion once a clean daily candle closes firmly above $0.10886.Pullback Setup: Look to catch low-risk long exposure on healthy retests of the $0.09402 breakout region.
#TAUSDT #cryptotrading #TechnicalAnalysis #BinanceSquare #Fibonacci
The daily chart shows $TA initiating a massive vertical breakout vector, blasting cleanly out of multi-month descending wedge compression and surging straight into major historical macro resistance layers.
📈 Technical Breakdown:
• Current Price: $0.10758
• Strong Resistance Check: Momentum is running directly into a heavy supply ceiling sitting at the 0 Fib baseline at $0.10886. This level represents a critical inflection point for full macro continuation.
• Upside Target Path: A decisive daily close above $0.10886 validates a clean breakout extension, opening the path for a powerful run toward higher key resistance structures.
• Immediate Demand Floor: On short-term structural pullbacks, the previous wedge breaker zone near the 0.236 Fib level ($0.09402) acts as fresh support.
💡 Trading Strategy:
Breakout Play: Position for structural expansion once a clean daily candle closes firmly above $0.10886.Pullback Setup: Look to catch low-risk long exposure on healthy retests of the $0.09402 breakout region.
#TAUSDT #cryptotrading #TechnicalAnalysis #BinanceSquare #Fibonacci
1
279
·
--
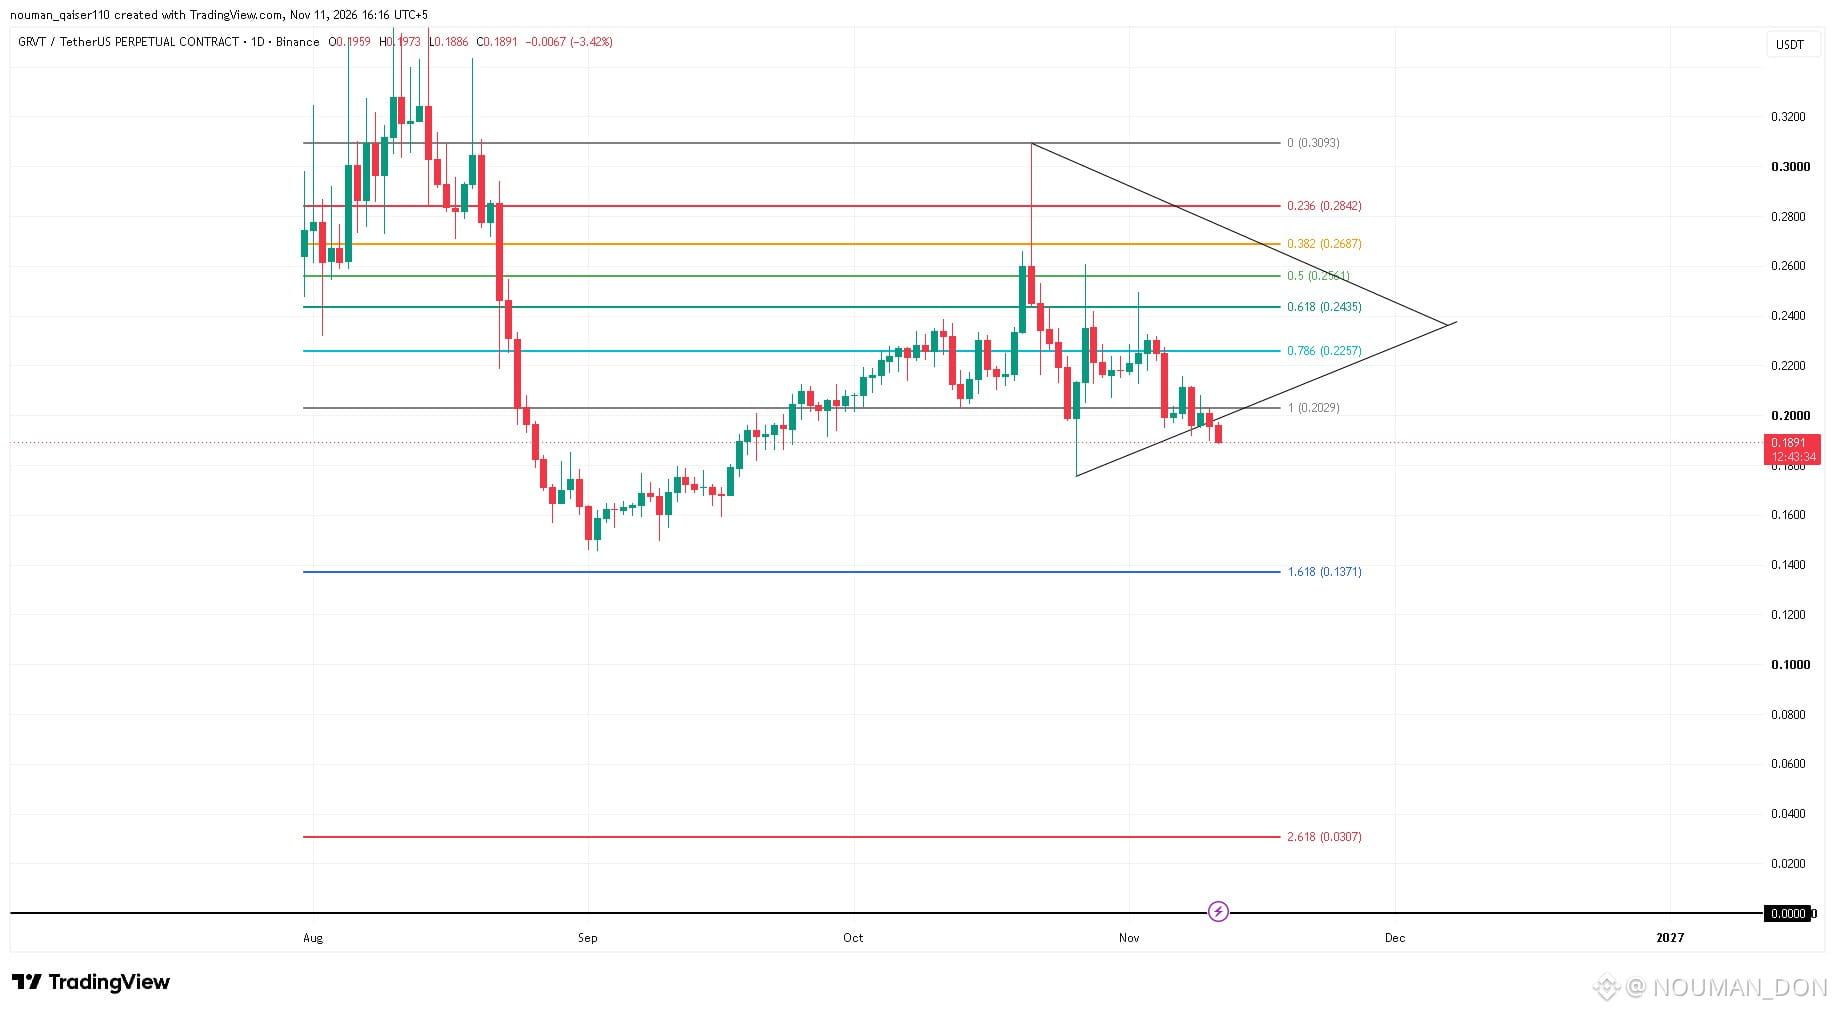
$GRVT /USDT Perpetual Technical Analysis: Bearish Breakdown – Downside Levels Exposed 🚨
The daily chart shows $GRVT breaking down out of a macro symmetrical triangle structure, invalidating its recent consolidation floor as selling pressure takes full control.
📉 Technical Breakdown:
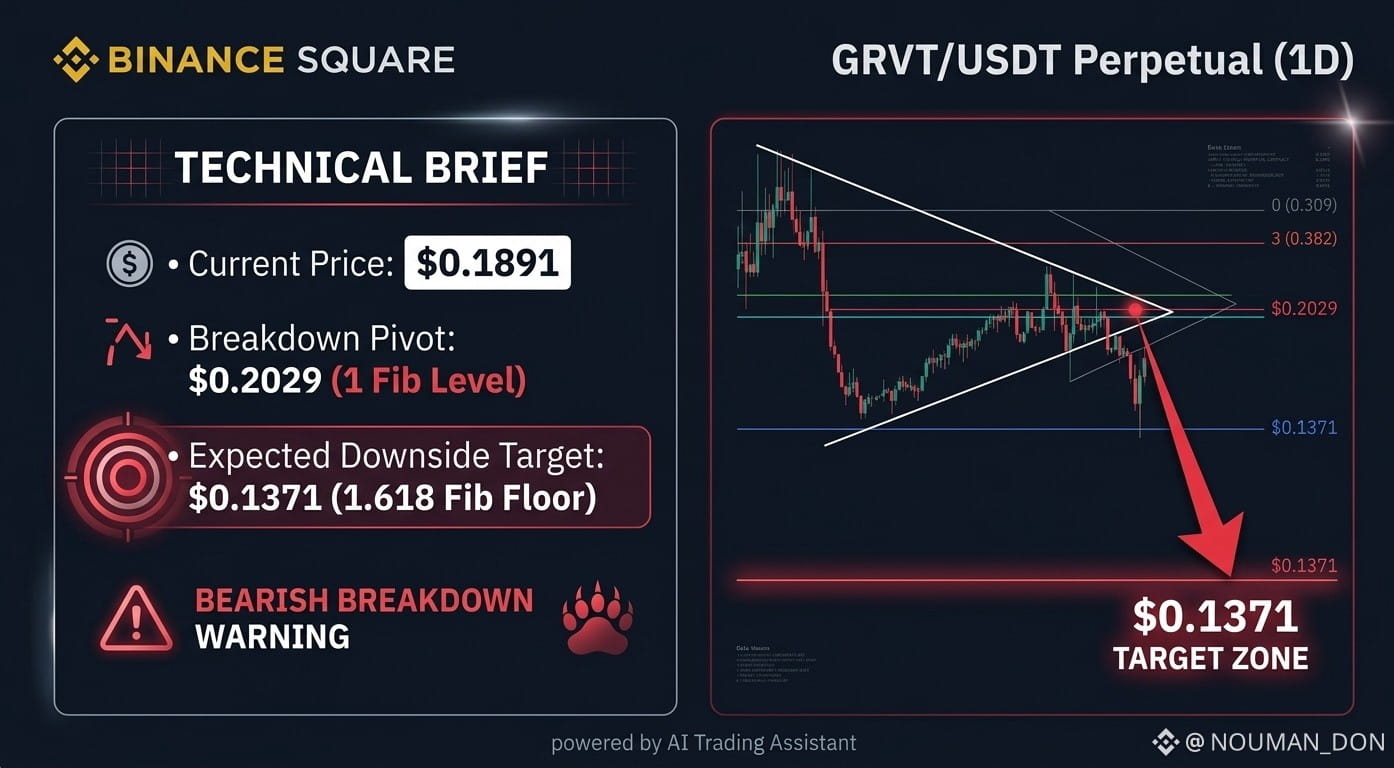
• Current Price: $0.1891
• Range Breakdown: The price failed to sustain within the wedge compression pattern, aggressively breaking past the 1 Fib baseline at $0.2029. This structural breakdown shifts short-term market momentum heavily in favor of sellers.
• Expected Downside Targets: If bulls fail to initiate an immediate reclaim above $0.2029, momentum is expected to press downward toward the next critical macro defense zone at the 1.618 Fibonacci expansion level down at $0.1371.
💡 Trading Strategy:
Short Position: Target the macro structural floor at $0.1371 on continued bearish validation.Invalidation Level: Set risk strictly above the $0.2029 breakdown pivot line.
#grvtusdt #cryptotrading #TechnicalAnalysis #BinanceSquare #Fibonacci
{alpha}(560x46f2564e0fa8248d15125e7e54173cfbdef91be7)
{future}(GRVTUSDT)
$GRVT /USDT Perpetual Technical Analysis: Bearish Breakdown – Downside Levels Exposed 🚨
The daily chart shows $GRVT breaking down out of a macro symmetrical triangle structure, invalidating its recent consolidation floor as selling pressure takes full control.
📉 Technical Breakdown:
• Current Price: $0.1891
• Range Breakdown: The price failed to sustain within the wedge compression pattern, aggressively breaking past the 1 Fib baseline at $0.2029. This structural breakdown shifts short-term market momentum heavily in favor of sellers.
• Expected Downside Targets: If bulls fail to initiate an immediate reclaim above $0.2029, momentum is expected to press downward toward the next critical macro defense zone at the 1.618 Fibonacci expansion level down at $0.1371.
💡 Trading Strategy:
Short Position: Target the macro structural floor at $0.1371 on continued bearish validation.Invalidation Level: Set risk strictly above the $0.2029 breakdown pivot line.
#grvtusdt #cryptotrading #TechnicalAnalysis #BinanceSquare #Fibonacci
The daily chart shows $GRVT breaking down out of a macro symmetrical triangle structure, invalidating its recent consolidation floor as selling pressure takes full control.
📉 Technical Breakdown:
• Current Price: $0.1891
• Range Breakdown: The price failed to sustain within the wedge compression pattern, aggressively breaking past the 1 Fib baseline at $0.2029. This structural breakdown shifts short-term market momentum heavily in favor of sellers.
• Expected Downside Targets: If bulls fail to initiate an immediate reclaim above $0.2029, momentum is expected to press downward toward the next critical macro defense zone at the 1.618 Fibonacci expansion level down at $0.1371.
💡 Trading Strategy:
Short Position: Target the macro structural floor at $0.1371 on continued bearish validation.Invalidation Level: Set risk strictly above the $0.2029 breakdown pivot line.
#grvtusdt #cryptotrading #TechnicalAnalysis #BinanceSquare #Fibonacci
2
463
·
--
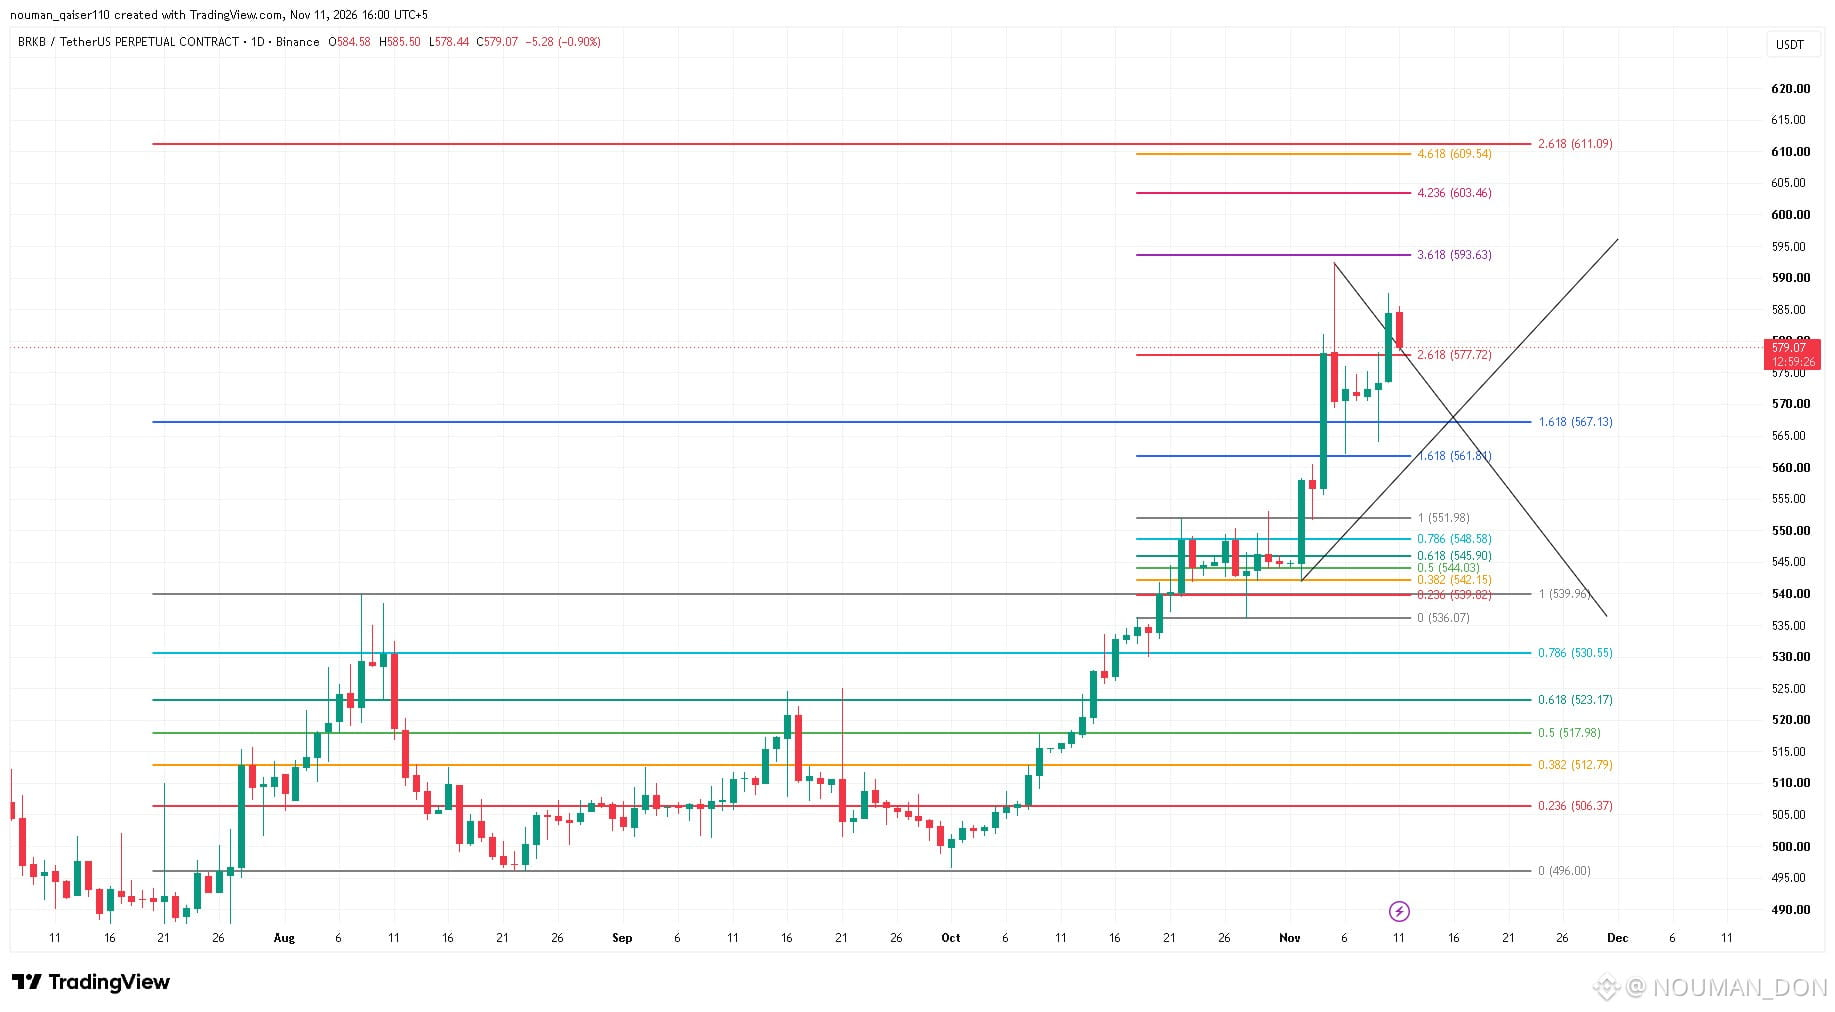
$BRKB /USDT Perpetual Technical Analysis: Compressing at Key Multi-Month Junction 🚨
The daily chart shows $BRKB holding strong local momentum, consolidating within a bullish symmetrical structure and stabilizing tightly around major historical Fibonacci extension levels.
📈 Technical Breakdown:
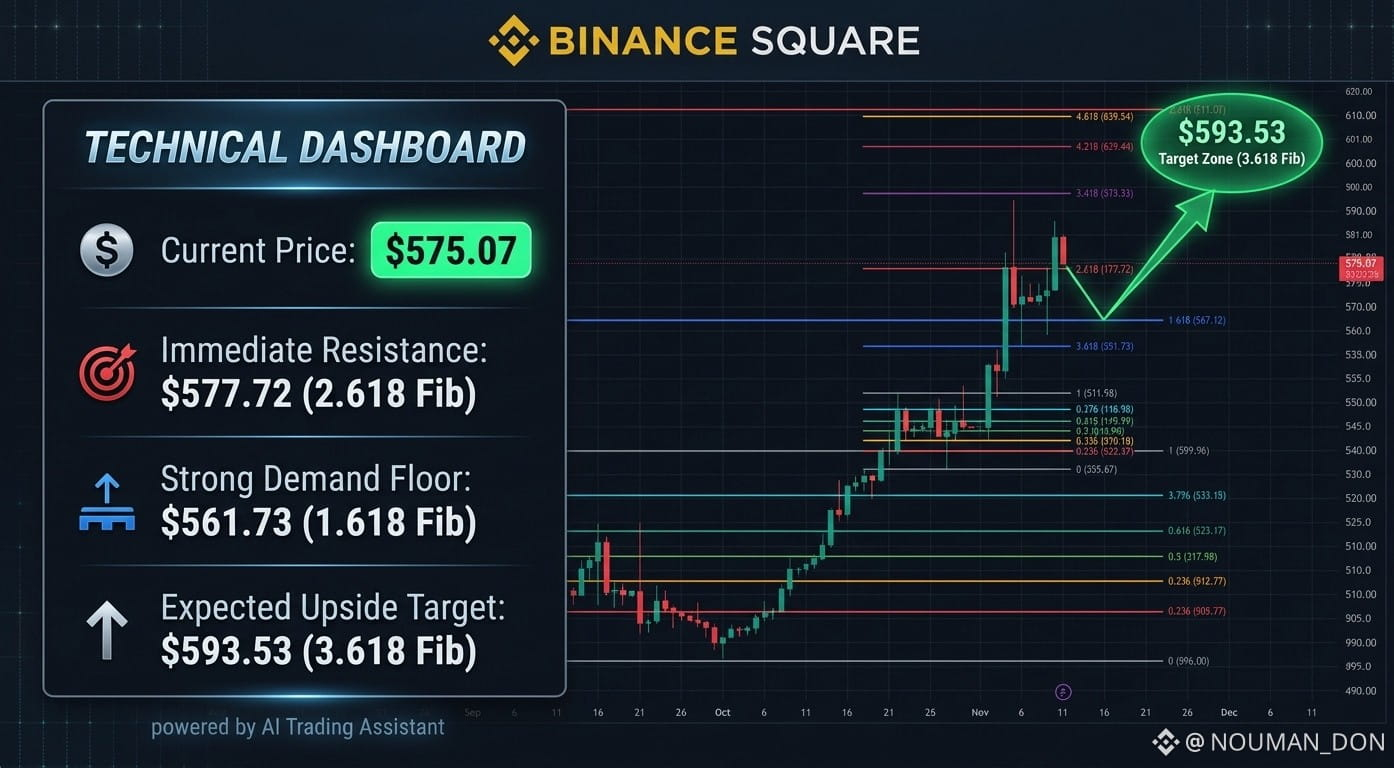
• Current Price: $575.07
• Immediate Resistance: The key overhead barrier sits at the 2.618 Fib extension line at $577.72. Successfully securing a daily candle close above this level activates the next structural expansion wave.
• Expected Macro Targets: Reclaiming $577.72 opens a path toward the 3.618 Fib extension at $593.53, with full range extensions eyeing the 4.236 ($603.46) and 4.618 ($609.54) macro ceilings.
• Strong Demand Floor: Immediate foundational support rests at the 1.618 Fib extension located back down at $561.73.
💡 Trading Strategy:
Breakout Trade: Position for dynamic expansion once a clear daily close prints above $577.72 targeting $593.53.Stop-Loss Placement: Risk structures remain invalid if price closes underneath $561.73.
#BRKBUSDT #cryptotrading #TechnicalAnalysis #BinanceSquare #Fibonacci
{spot}(BRKBBUSDT)
{future}(BRKBUSDT)
$BRKB /USDT Perpetual Technical Analysis: Compressing at Key Multi-Month Junction 🚨
The daily chart shows $BRKB holding strong local momentum, consolidating within a bullish symmetrical structure and stabilizing tightly around major historical Fibonacci extension levels.
📈 Technical Breakdown:
• Current Price: $575.07
• Immediate Resistance: The key overhead barrier sits at the 2.618 Fib extension line at $577.72. Successfully securing a daily candle close above this level activates the next structural expansion wave.
• Expected Macro Targets: Reclaiming $577.72 opens a path toward the 3.618 Fib extension at $593.53, with full range extensions eyeing the 4.236 ($603.46) and 4.618 ($609.54) macro ceilings.
• Strong Demand Floor: Immediate foundational support rests at the 1.618 Fib extension located back down at $561.73.
💡 Trading Strategy:
Breakout Trade: Position for dynamic expansion once a clear daily close prints above $577.72 targeting $593.53.Stop-Loss Placement: Risk structures remain invalid if price closes underneath $561.73.
#BRKBUSDT #cryptotrading #TechnicalAnalysis #BinanceSquare #Fibonacci
The daily chart shows $BRKB holding strong local momentum, consolidating within a bullish symmetrical structure and stabilizing tightly around major historical Fibonacci extension levels.
📈 Technical Breakdown:
• Current Price: $575.07
• Immediate Resistance: The key overhead barrier sits at the 2.618 Fib extension line at $577.72. Successfully securing a daily candle close above this level activates the next structural expansion wave.
• Expected Macro Targets: Reclaiming $577.72 opens a path toward the 3.618 Fib extension at $593.53, with full range extensions eyeing the 4.236 ($603.46) and 4.618 ($609.54) macro ceilings.
• Strong Demand Floor: Immediate foundational support rests at the 1.618 Fib extension located back down at $561.73.
💡 Trading Strategy:
Breakout Trade: Position for dynamic expansion once a clear daily close prints above $577.72 targeting $593.53.Stop-Loss Placement: Risk structures remain invalid if price closes underneath $561.73.
#BRKBUSDT #cryptotrading #TechnicalAnalysis #BinanceSquare #Fibonacci
1
78
·
--
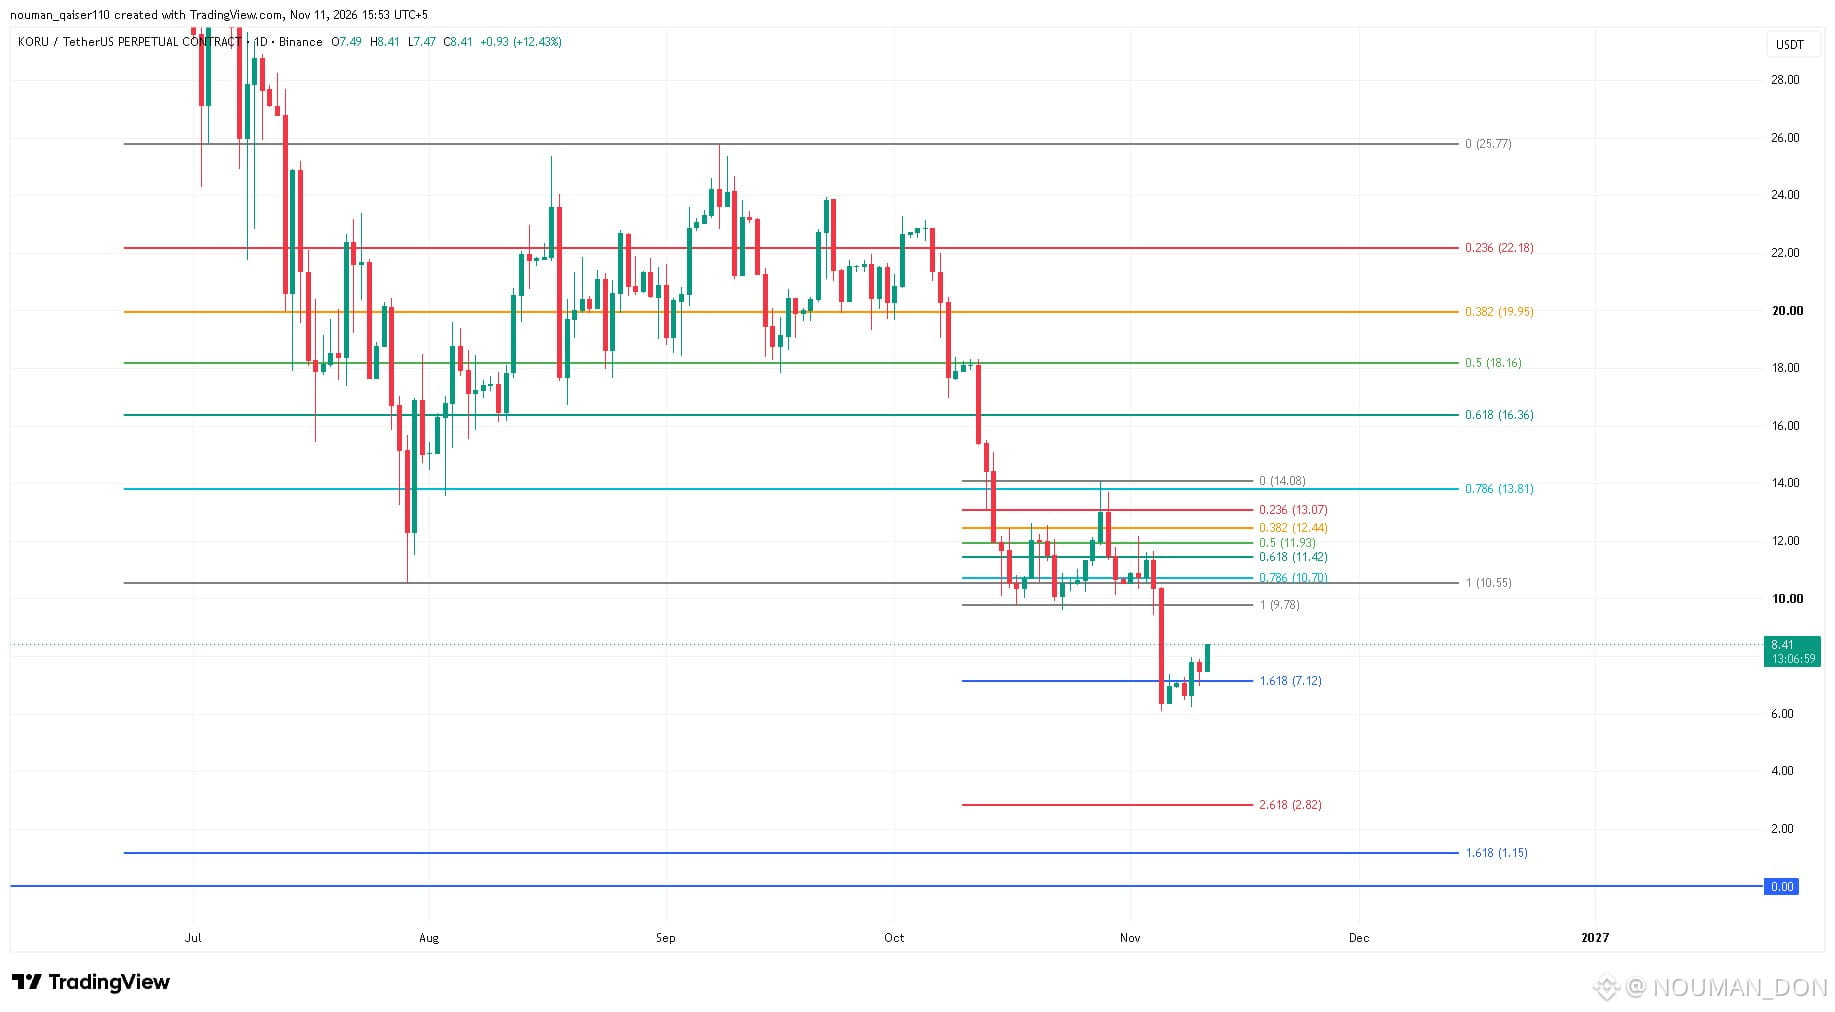
$KORU /USDT Perpetual Technical Analysis: Macro Floor Defended – Relief Play Formulating 📈
The daily chart shows $KORU staging a stabilization bounce after printing a significant markdown flush below its macro baseline, validating fresh buyer demand near deep Fibonacci extension targets.
📉 Technical Breakdown:
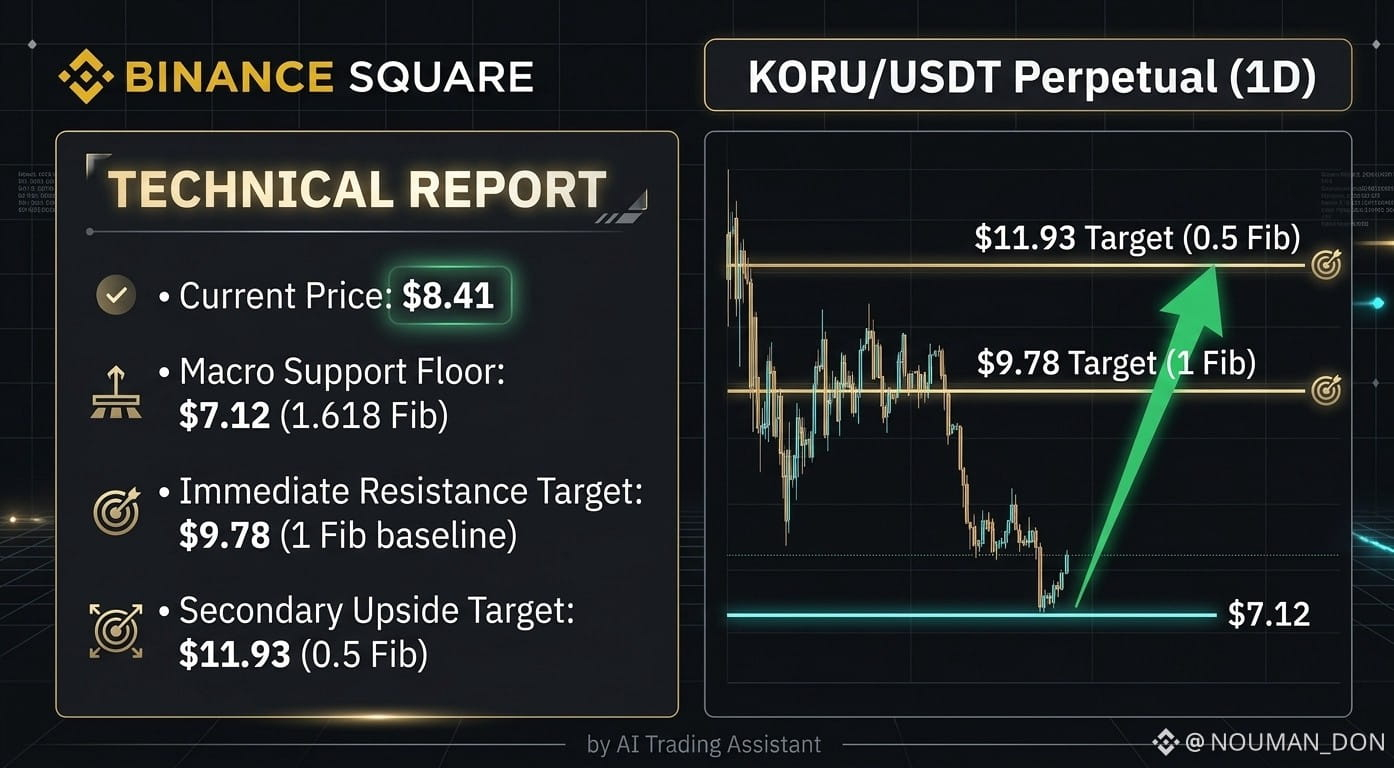
• Current Price: $8.41
• Range Validation: The correction found a temporary bottom right around the 1.618 Fib extension at $7.12. Holding this floor confirms aggressive absorption.
• Expected Macro Upside: A continued relief structure eyes immediate resistance back at the 1 Fib range baseline located at $9.78. Successfully reclaiming $9.78 opens a clear momentum path back into the inner consolidation cluster, targeting the 0.5 Fib retracement level up at $11.93.
💡 Trading Strategy:
Long Configuration: Accumulate low-leverage exposure above $7.12 targeting $9.78 and $11.93.Invalidated Risk: Cut exposure tightly if a daily close prints firmly underneath the $7.12 support floor.
#KORUUSDT #cryptotrading #TechnicalAnalysis #BinanceSquare #Fibonacci
{spot}(KORUBUSDT)
{future}(KORUUSDT)
$KORU /USDT Perpetual Technical Analysis: Macro Floor Defended – Relief Play Formulating 📈
The daily chart shows $KORU staging a stabilization bounce after printing a significant markdown flush below its macro baseline, validating fresh buyer demand near deep Fibonacci extension targets.
📉 Technical Breakdown:
• Current Price: $8.41
• Range Validation: The correction found a temporary bottom right around the 1.618 Fib extension at $7.12. Holding this floor confirms aggressive absorption.
• Expected Macro Upside: A continued relief structure eyes immediate resistance back at the 1 Fib range baseline located at $9.78. Successfully reclaiming $9.78 opens a clear momentum path back into the inner consolidation cluster, targeting the 0.5 Fib retracement level up at $11.93.
💡 Trading Strategy:
Long Configuration: Accumulate low-leverage exposure above $7.12 targeting $9.78 and $11.93.Invalidated Risk: Cut exposure tightly if a daily close prints firmly underneath the $7.12 support floor.
#KORUUSDT #cryptotrading #TechnicalAnalysis #BinanceSquare #Fibonacci
The daily chart shows $KORU staging a stabilization bounce after printing a significant markdown flush below its macro baseline, validating fresh buyer demand near deep Fibonacci extension targets.
📉 Technical Breakdown:
• Current Price: $8.41
• Range Validation: The correction found a temporary bottom right around the 1.618 Fib extension at $7.12. Holding this floor confirms aggressive absorption.
• Expected Macro Upside: A continued relief structure eyes immediate resistance back at the 1 Fib range baseline located at $9.78. Successfully reclaiming $9.78 opens a clear momentum path back into the inner consolidation cluster, targeting the 0.5 Fib retracement level up at $11.93.
💡 Trading Strategy:
Long Configuration: Accumulate low-leverage exposure above $7.12 targeting $9.78 and $11.93.Invalidated Risk: Cut exposure tightly if a daily close prints firmly underneath the $7.12 support floor.
#KORUUSDT #cryptotrading #TechnicalAnalysis #BinanceSquare #Fibonacci
1
389
·
--
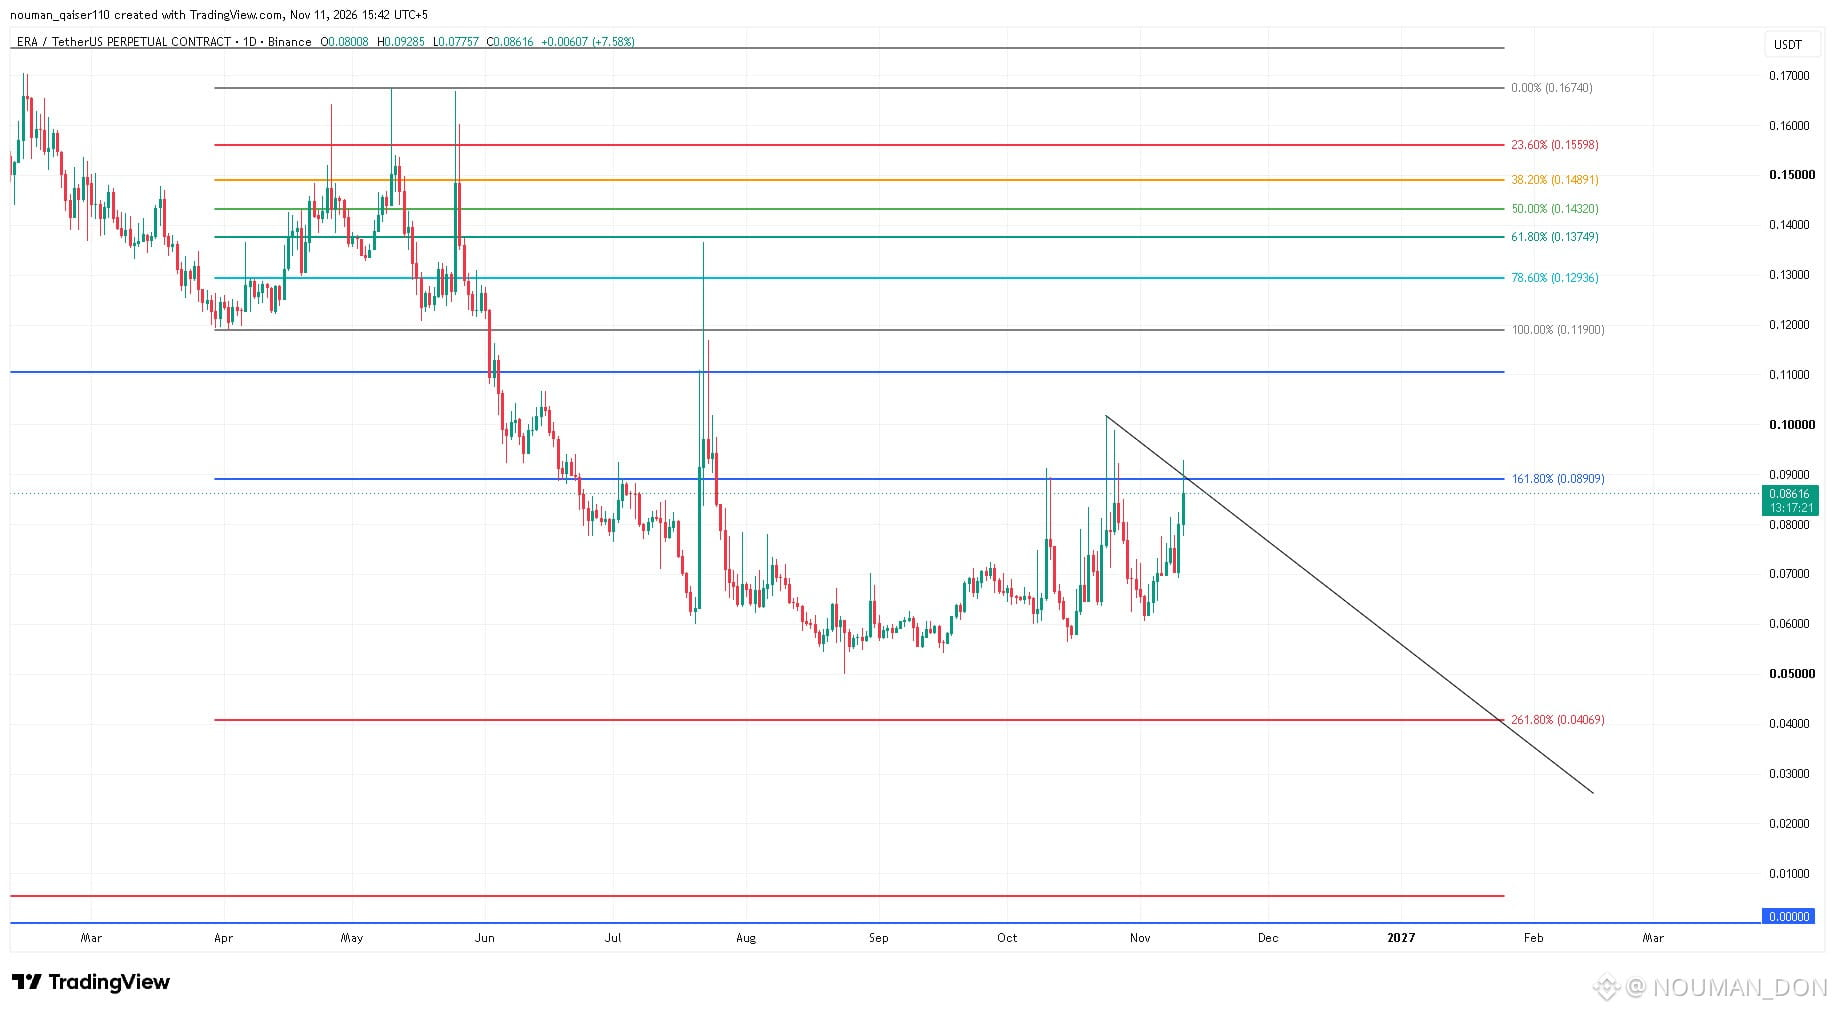
$ERA /USDT Perpetual Technical Analysis: Crucial Make-or-Break Pivot 🚨
The daily chart shows $ERA tightly testing a key macro crossroads, compressing directly underneath local trendline resistance and an important Fibonacci level.
📉 Technical Breakdown:
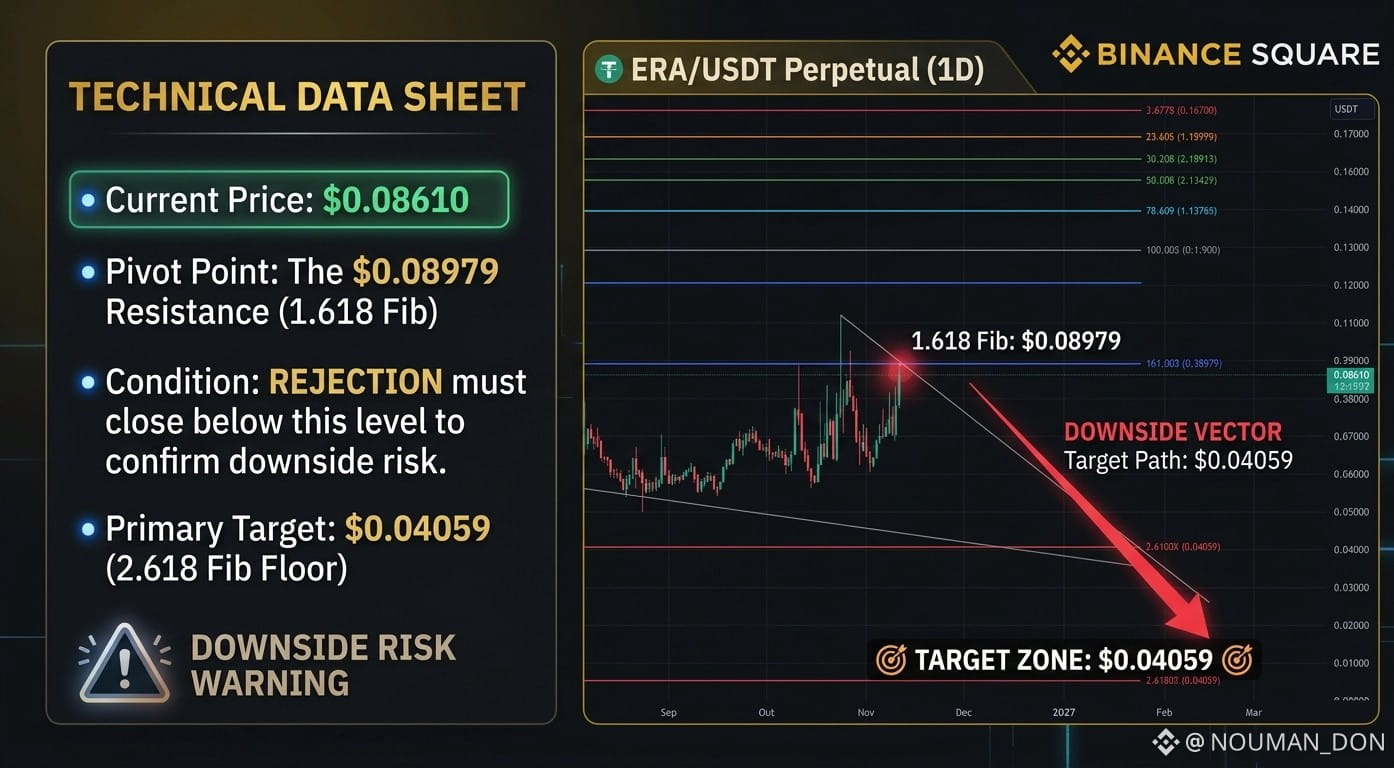
• Current Price: $0.08610
• Critical Overhead Resistance: The immediate hurdle is the 1.618 Fib extension line sitting at $0.08979, tightly conjoined with the descending local trendline.
• The Downside Risk Scenario: Failure to breach and close above the $0.08979 resistance block next week invalidates the local recovery structure. If bulls cannot absorb the selling pressure here, a rejection must drive momentum downward toward the next major structural floor at the 2.618 macro Fibonacci expansion level down at $0.04059.
💡 Trading Strategy:
Rejection Short: Play a clear failure to close over $0.08979 with targets set down toward $0.04059.Stop-Loss Note: Maintain an absolute invalidation stop tightly above the local trendline.
#ERAUSDT #cryptotrading #TechnicalAnalysis #BinanceSquare #Fibonacci
{spot}(ERAUSDT)
{future}(ERAUSDT)
$ERA /USDT Perpetual Technical Analysis: Crucial Make-or-Break Pivot 🚨
The daily chart shows $ERA tightly testing a key macro crossroads, compressing directly underneath local trendline resistance and an important Fibonacci level.
📉 Technical Breakdown:
• Current Price: $0.08610
• Critical Overhead Resistance: The immediate hurdle is the 1.618 Fib extension line sitting at $0.08979, tightly conjoined with the descending local trendline.
• The Downside Risk Scenario: Failure to breach and close above the $0.08979 resistance block next week invalidates the local recovery structure. If bulls cannot absorb the selling pressure here, a rejection must drive momentum downward toward the next major structural floor at the 2.618 macro Fibonacci expansion level down at $0.04059.
💡 Trading Strategy:
Rejection Short: Play a clear failure to close over $0.08979 with targets set down toward $0.04059.Stop-Loss Note: Maintain an absolute invalidation stop tightly above the local trendline.
#ERAUSDT #cryptotrading #TechnicalAnalysis #BinanceSquare #Fibonacci
The daily chart shows $ERA tightly testing a key macro crossroads, compressing directly underneath local trendline resistance and an important Fibonacci level.
📉 Technical Breakdown:
• Current Price: $0.08610
• Critical Overhead Resistance: The immediate hurdle is the 1.618 Fib extension line sitting at $0.08979, tightly conjoined with the descending local trendline.
• The Downside Risk Scenario: Failure to breach and close above the $0.08979 resistance block next week invalidates the local recovery structure. If bulls cannot absorb the selling pressure here, a rejection must drive momentum downward toward the next major structural floor at the 2.618 macro Fibonacci expansion level down at $0.04059.
💡 Trading Strategy:
Rejection Short: Play a clear failure to close over $0.08979 with targets set down toward $0.04059.Stop-Loss Note: Maintain an absolute invalidation stop tightly above the local trendline.
#ERAUSDT #cryptotrading #TechnicalAnalysis #BinanceSquare #Fibonacci
1
148
·
--
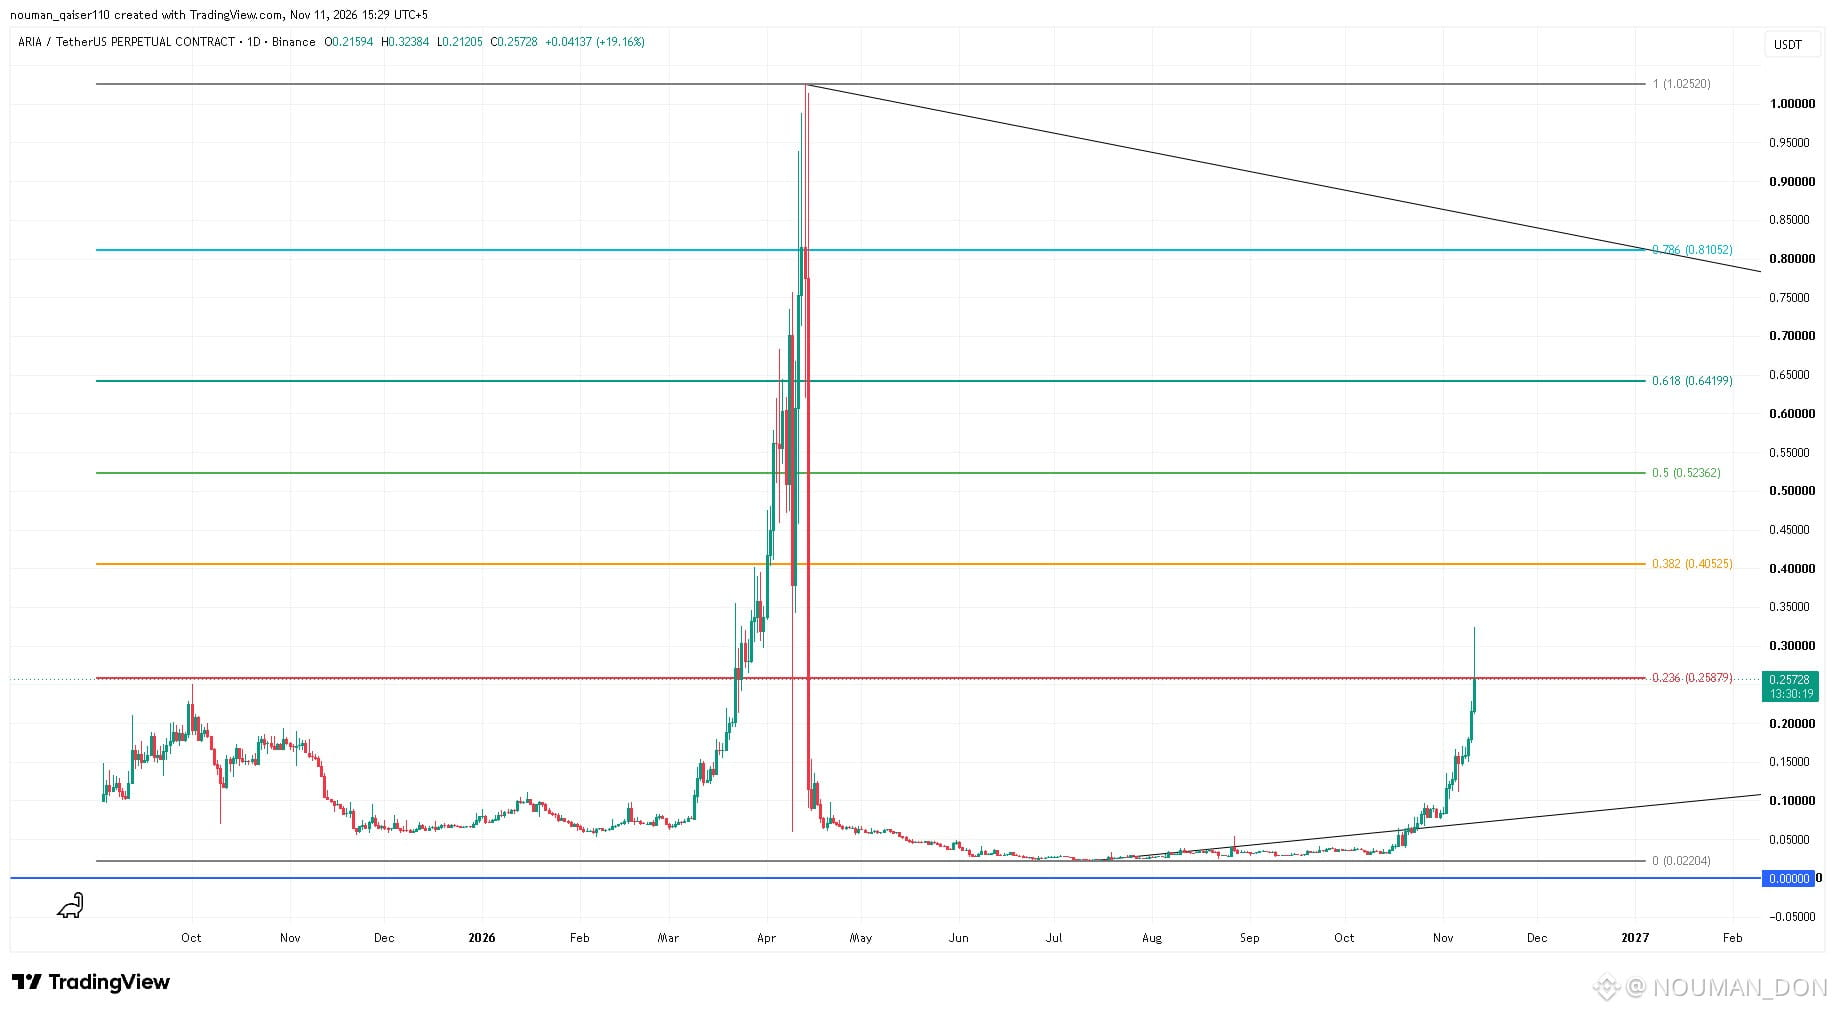
$ARIA /USDT Perpetual Technical Analysis: Aggressive Rebound Approaching Key Targets 🚀
The daily chart shows $ARIA executing a powerful, high-momentum recovery rally from its absolute macro floor, slicing cleanly through local accumulation layers and challenging key Fibonacci structures.
📈 Technical Breakdown:
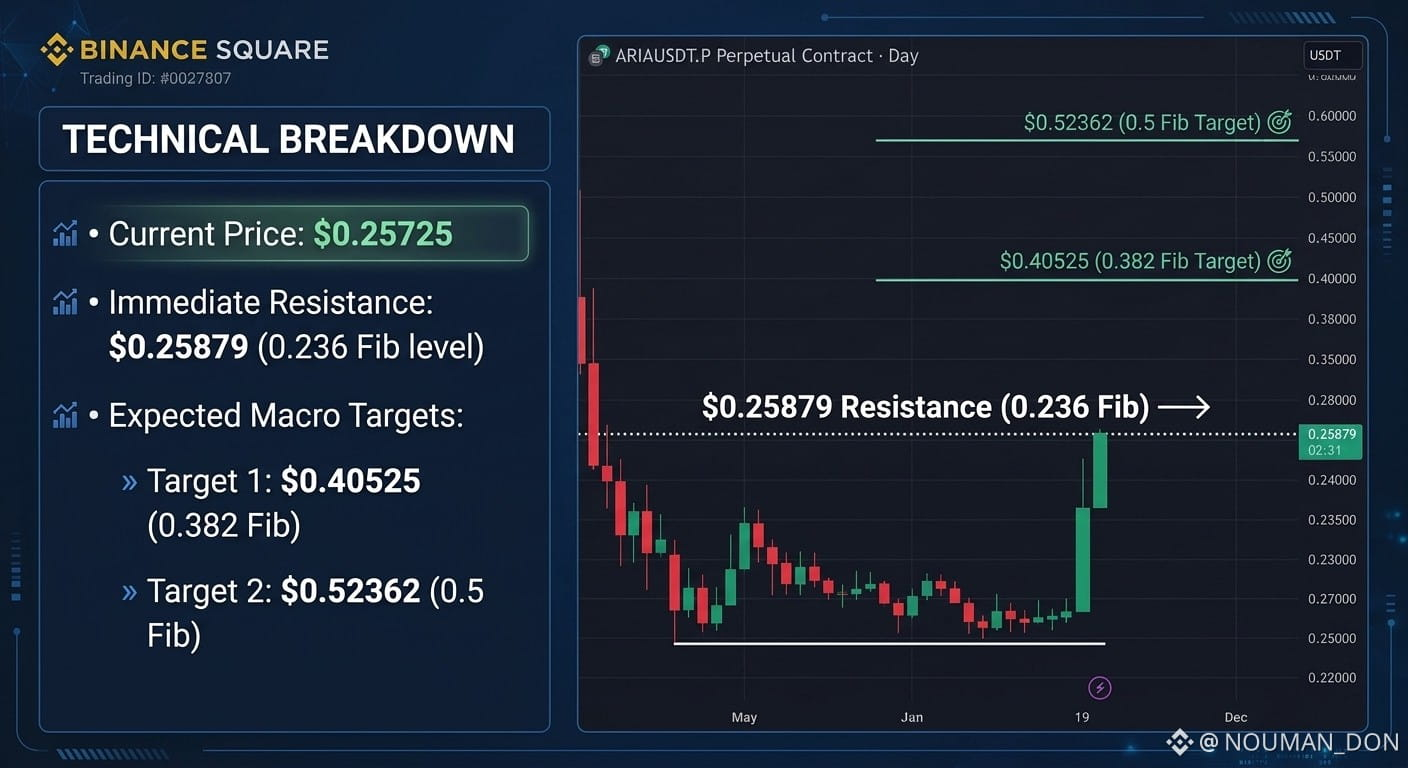
• Current Price: $0.25725
• Immediate Resistance: The price is currently hammering directly against the critical 0.236 Fibonacci retracement level at $0.25879.
• Expected Macro Upside: A decisive daily candle close above $0.25879 flips this key barrier into support, paving a clear expansion path toward the next structural targets at the 0.382 Fib level ($0.40525) and the 0.5 Fib baseline ($0.52362).
• Macro Support Floor: Strong foundational demand resides down at the structural trend line support floor near the $0.05204 (0 Fib) baseline.
💡 Trading Strategy:
Breakout Long: Enter on a confirmed daily close above $0.25879 targeting $0.405 and $0.523.Risk Note: Lock stop-losses tight beneath local 4H swing lows to safely mitigate high volatility.
#ARIAUSDT #cryptotrading #TechnicalAnalysis #BinanceSquare #Fibonacci
{alpha}(560x5d3a12c42e5372b2cc3264ab3cdcf660a1555238)
{future}(ARIAUSDT)
$ARIA /USDT Perpetual Technical Analysis: Aggressive Rebound Approaching Key Targets 🚀
The daily chart shows $ARIA executing a powerful, high-momentum recovery rally from its absolute macro floor, slicing cleanly through local accumulation layers and challenging key Fibonacci structures.
📈 Technical Breakdown:
• Current Price: $0.25725
• Immediate Resistance: The price is currently hammering directly against the critical 0.236 Fibonacci retracement level at $0.25879.
• Expected Macro Upside: A decisive daily candle close above $0.25879 flips this key barrier into support, paving a clear expansion path toward the next structural targets at the 0.382 Fib level ($0.40525) and the 0.5 Fib baseline ($0.52362).
• Macro Support Floor: Strong foundational demand resides down at the structural trend line support floor near the $0.05204 (0 Fib) baseline.
💡 Trading Strategy:
Breakout Long: Enter on a confirmed daily close above $0.25879 targeting $0.405 and $0.523.Risk Note: Lock stop-losses tight beneath local 4H swing lows to safely mitigate high volatility.
#ARIAUSDT #cryptotrading #TechnicalAnalysis #BinanceSquare #Fibonacci
The daily chart shows $ARIA executing a powerful, high-momentum recovery rally from its absolute macro floor, slicing cleanly through local accumulation layers and challenging key Fibonacci structures.
📈 Technical Breakdown:
• Current Price: $0.25725
• Immediate Resistance: The price is currently hammering directly against the critical 0.236 Fibonacci retracement level at $0.25879.
• Expected Macro Upside: A decisive daily candle close above $0.25879 flips this key barrier into support, paving a clear expansion path toward the next structural targets at the 0.382 Fib level ($0.40525) and the 0.5 Fib baseline ($0.52362).
• Macro Support Floor: Strong foundational demand resides down at the structural trend line support floor near the $0.05204 (0 Fib) baseline.
💡 Trading Strategy:
Breakout Long: Enter on a confirmed daily close above $0.25879 targeting $0.405 and $0.523.Risk Note: Lock stop-losses tight beneath local 4H swing lows to safely mitigate high volatility.
#ARIAUSDT #cryptotrading #TechnicalAnalysis #BinanceSquare #Fibonacci
1
1
777
·
--
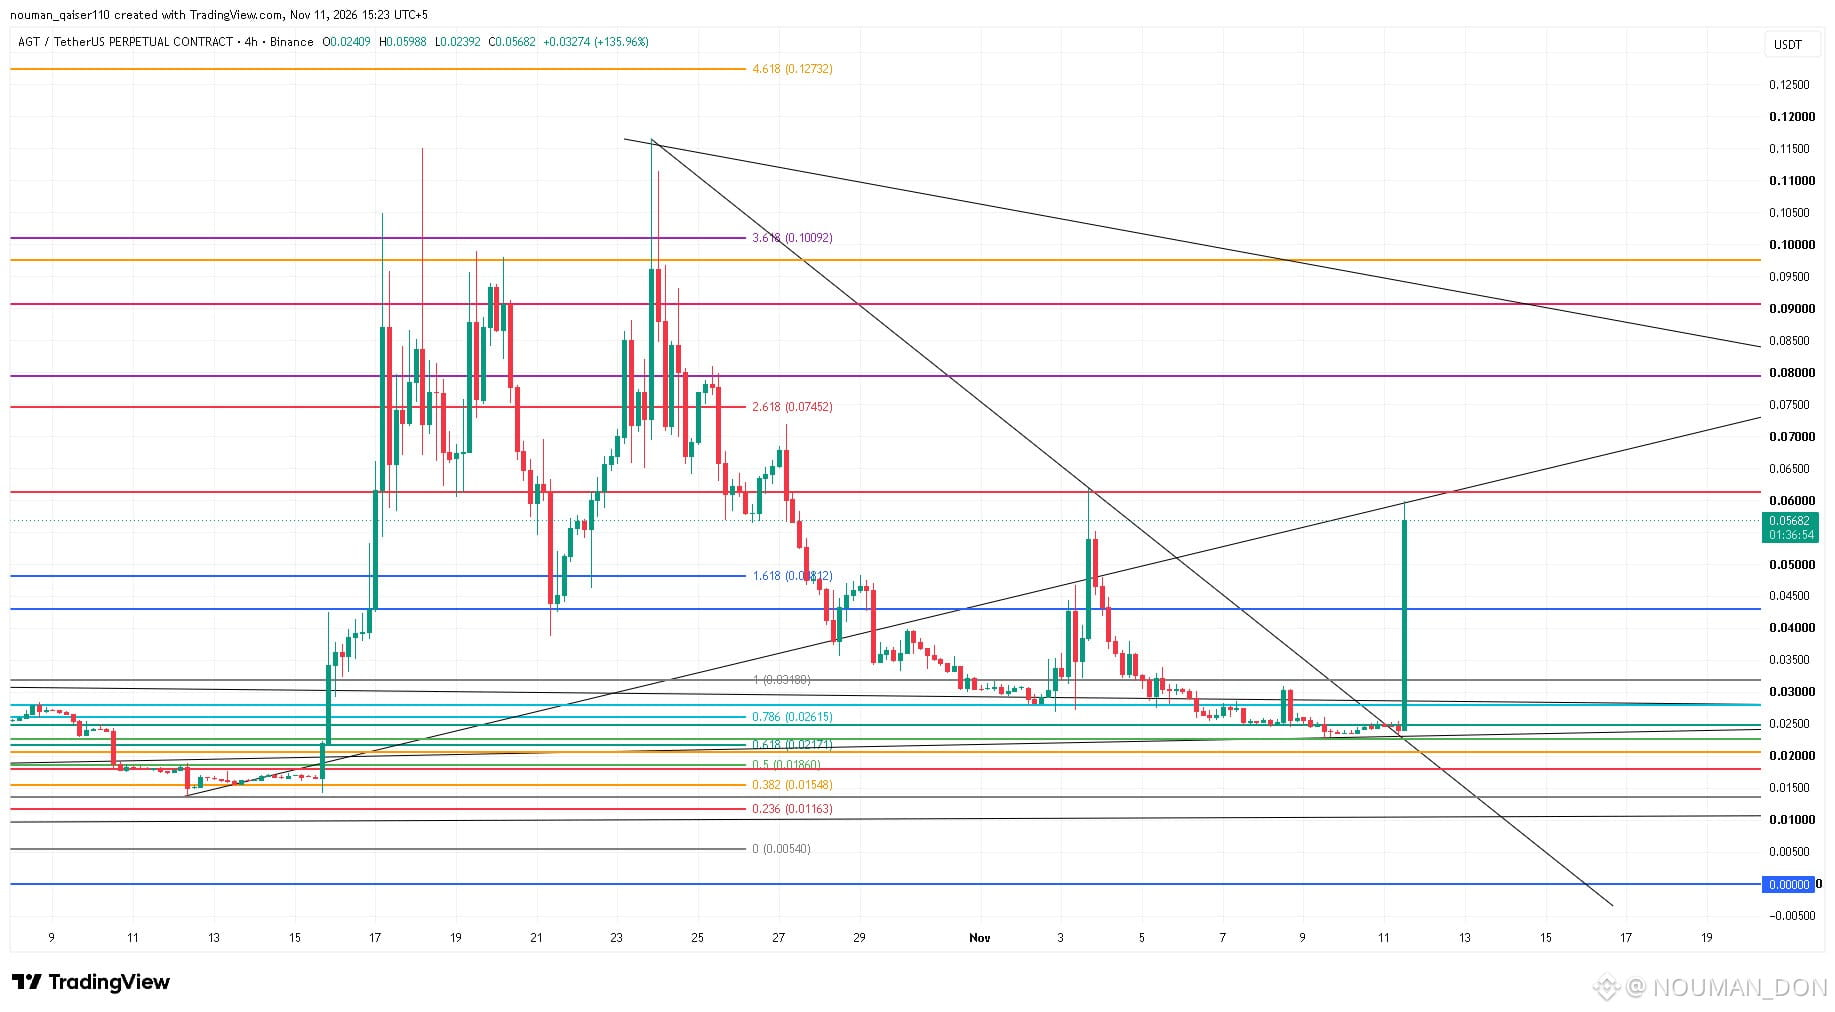
$AGT /USDT Perpetual Technical Analysis: Massive Breakout Vector Triggered 🚀
The 4H chart shows $AGT triggering an explosive, high-volume breakout, piercing cleanly through immediate local resistance lines and invalidating the major descending wedge ceiling.
📈 Technical Breakdown:
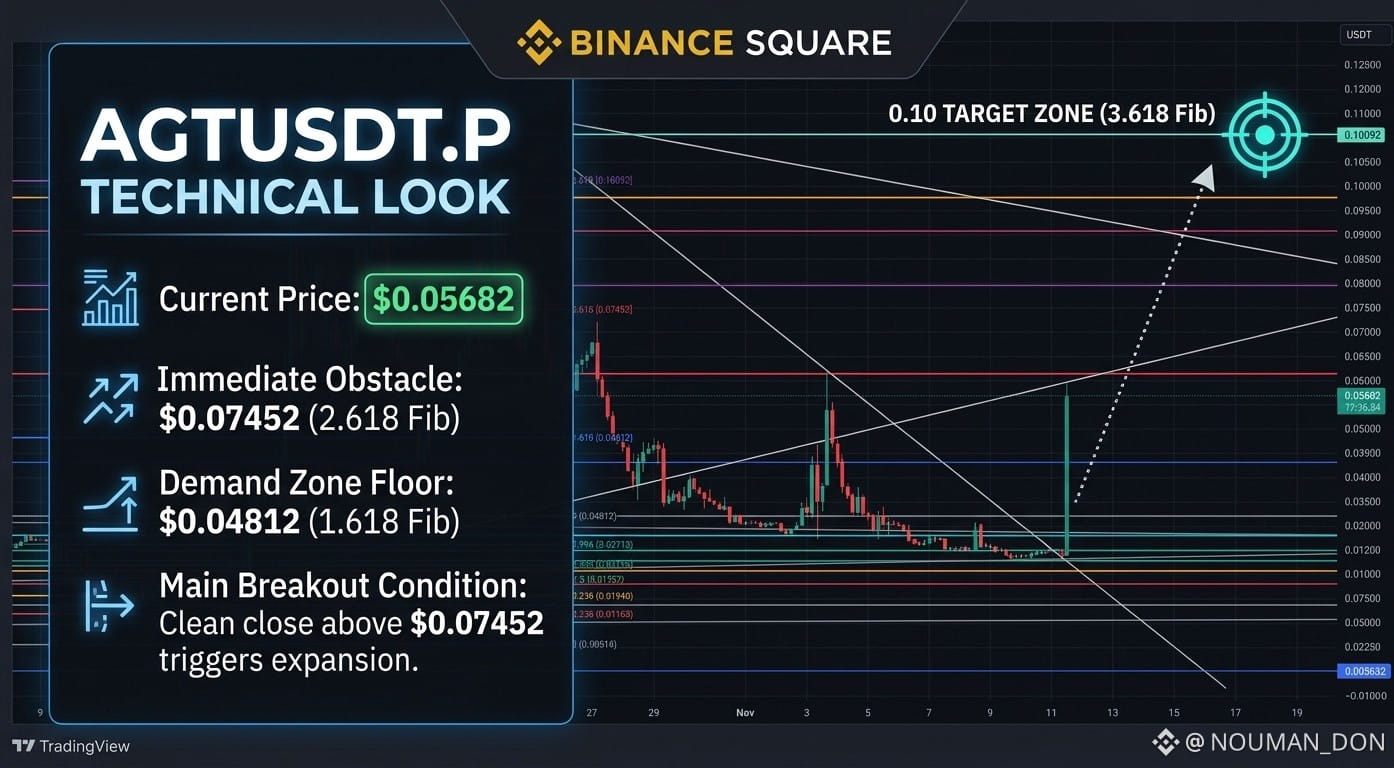
• Current Price: $0.05682
• Immediate Resistance: The immediate obstacle sits at the 2.618 Fib extension line at $0.07452. Reclaiming this level confirms structural continuation.
• The 0.10 Expansion Vector: If momentum sustains and the price successfully breaks above the $0.07452 threshold, it opens a clean macro extension path. The primary target cluster points directly to the 3.618 macro Fibonacci expansion line located at $0.10092.
• Key Demand: Pullbacks must now find a firm floor above the 1.618 Fib level at $0.04812.
💡 Trading Strategy:
Breakout Play: Position for a continuation run once a 4H close clears $0.07452 to capture the move toward $0.10.Risk Invalidation: Tightly manage stops beneath $0.04812.
#AGTUSDT #cryptotrading #TechnicalAnalysis #BinanceSquare #Fibonacci
{alpha}(560x5dbde81fce337ff4bcaaee4ca3466c00aecae274)
{future}(AGTUSDT)
$AGT /USDT Perpetual Technical Analysis: Massive Breakout Vector Triggered 🚀
The 4H chart shows $AGT triggering an explosive, high-volume breakout, piercing cleanly through immediate local resistance lines and invalidating the major descending wedge ceiling.
📈 Technical Breakdown:
• Current Price: $0.05682
• Immediate Resistance: The immediate obstacle sits at the 2.618 Fib extension line at $0.07452. Reclaiming this level confirms structural continuation.
• The 0.10 Expansion Vector: If momentum sustains and the price successfully breaks above the $0.07452 threshold, it opens a clean macro extension path. The primary target cluster points directly to the 3.618 macro Fibonacci expansion line located at $0.10092.
• Key Demand: Pullbacks must now find a firm floor above the 1.618 Fib level at $0.04812.
💡 Trading Strategy:
Breakout Play: Position for a continuation run once a 4H close clears $0.07452 to capture the move toward $0.10.Risk Invalidation: Tightly manage stops beneath $0.04812.
#AGTUSDT #cryptotrading #TechnicalAnalysis #BinanceSquare #Fibonacci
The 4H chart shows $AGT triggering an explosive, high-volume breakout, piercing cleanly through immediate local resistance lines and invalidating the major descending wedge ceiling.
📈 Technical Breakdown:
• Current Price: $0.05682
• Immediate Resistance: The immediate obstacle sits at the 2.618 Fib extension line at $0.07452. Reclaiming this level confirms structural continuation.
• The 0.10 Expansion Vector: If momentum sustains and the price successfully breaks above the $0.07452 threshold, it opens a clean macro extension path. The primary target cluster points directly to the 3.618 macro Fibonacci expansion line located at $0.10092.
• Key Demand: Pullbacks must now find a firm floor above the 1.618 Fib level at $0.04812.
💡 Trading Strategy:
Breakout Play: Position for a continuation run once a 4H close clears $0.07452 to capture the move toward $0.10.Risk Invalidation: Tightly manage stops beneath $0.04812.
#AGTUSDT #cryptotrading #TechnicalAnalysis #BinanceSquare #Fibonacci
1
377
·
--
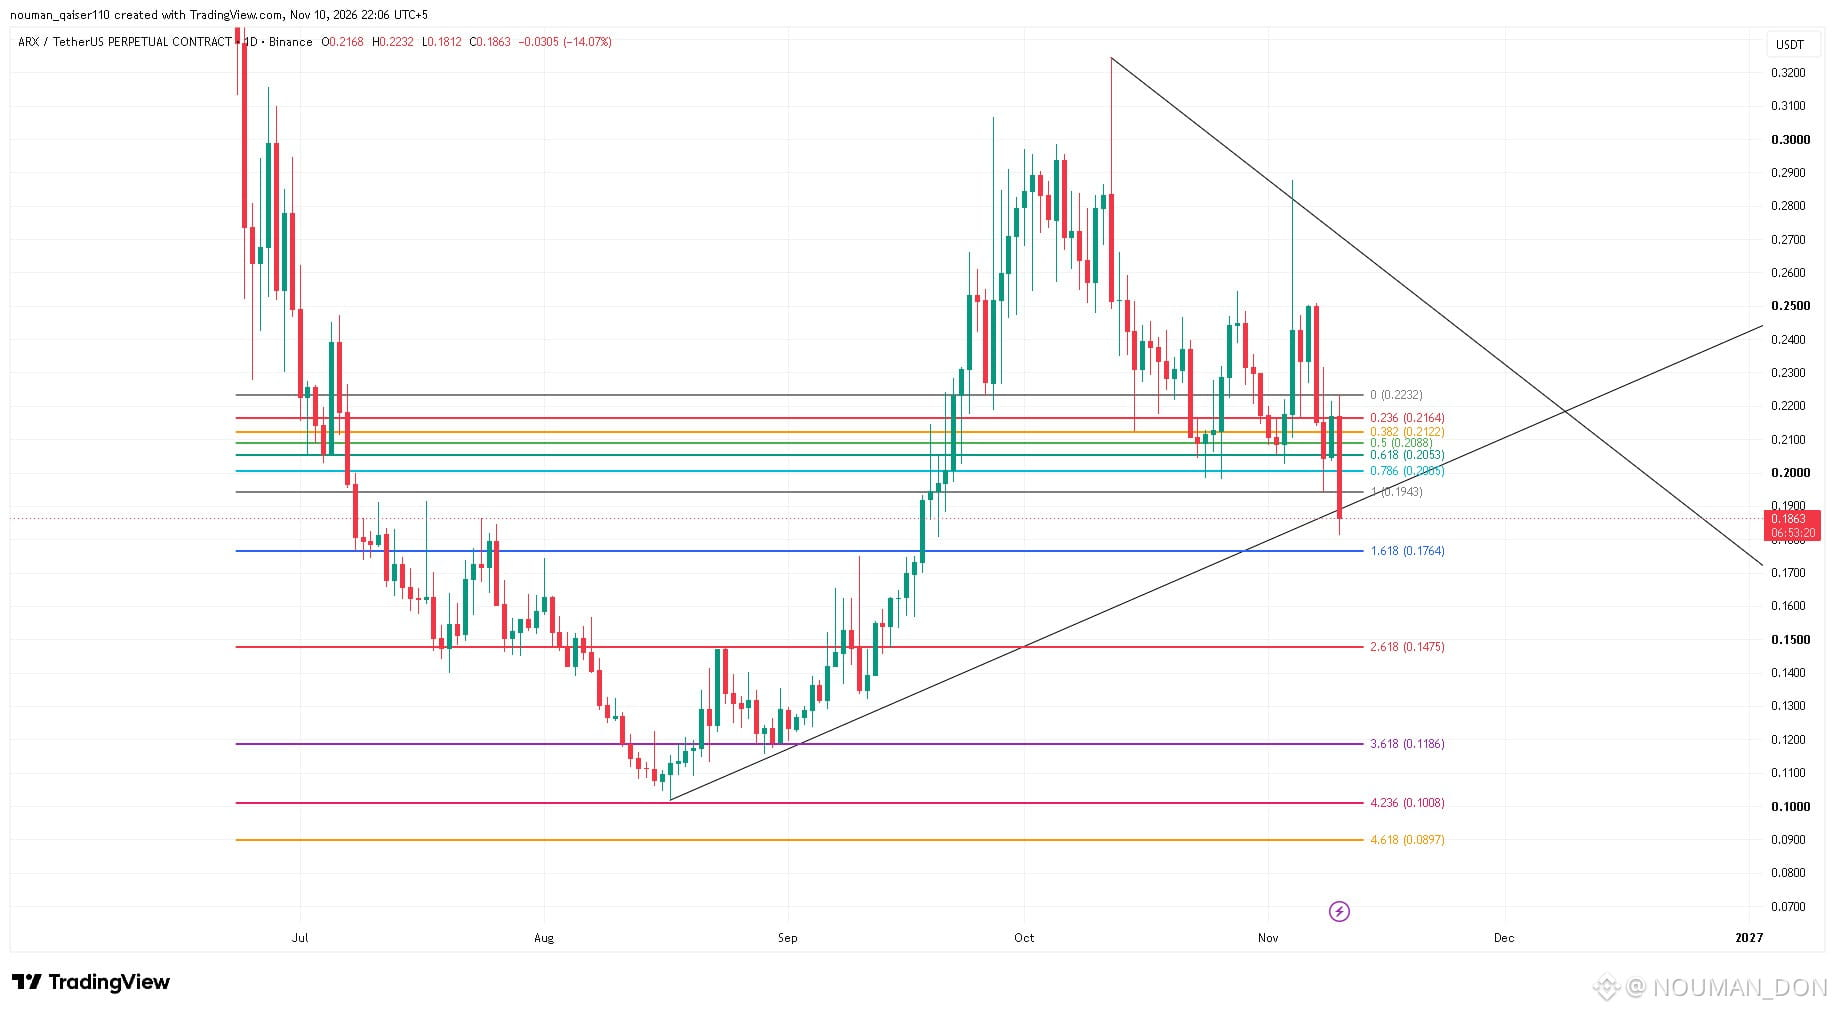
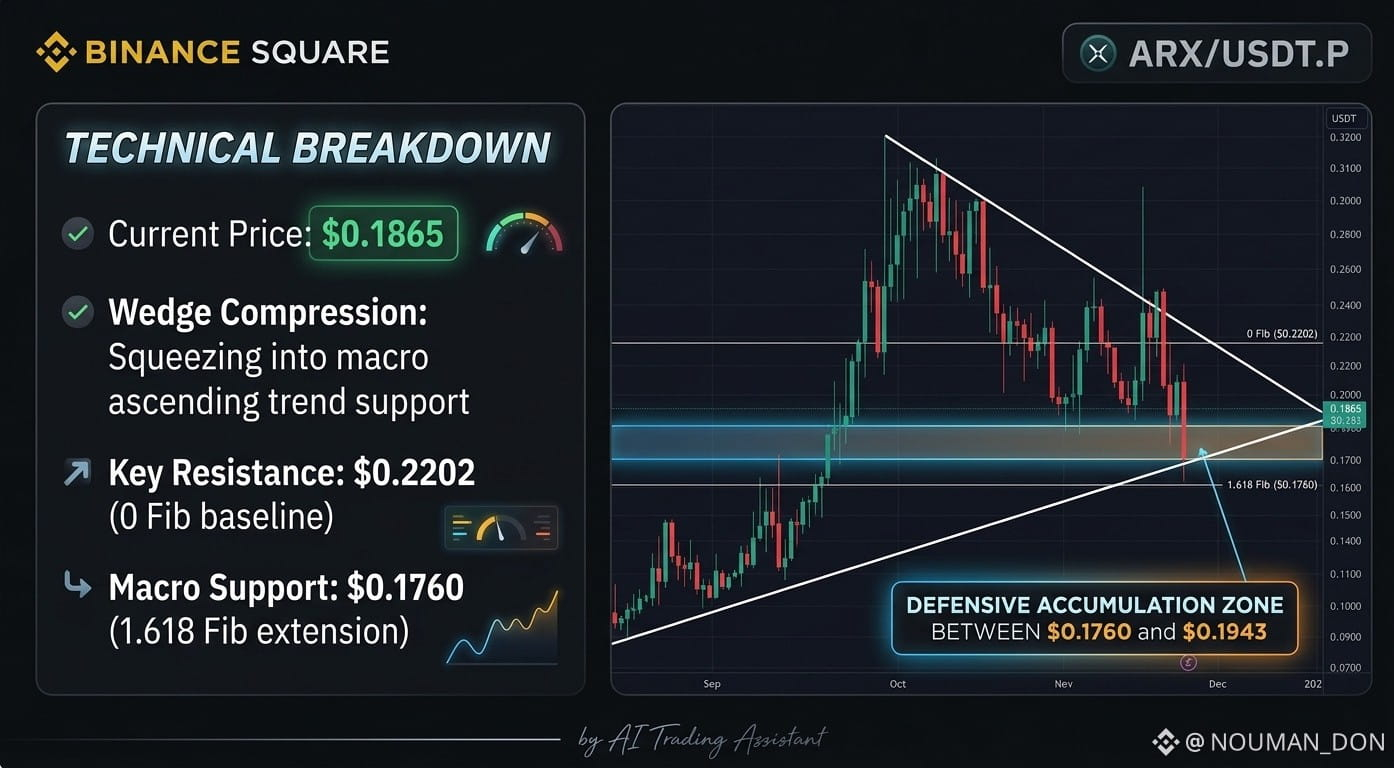
$ARX /USDT Perpetual Technical Analysis: Squeezing Into Macro Trend Junction 🚨
The daily chart shows $ARX compressing significantly within a large descending wedge structure, sliding directly down toward an intersecting multi-month macro ascending trend line.
📉 Technical Breakdown:
• Current Price: $0.1865
• Local Overhead Resistance: The immediate obstacle sits right at the 0 Fib baseline around $0.2202. Reclaiming this level shifts control back to the buyers.
• Key Support Clusters: Price is currently hammering into the 0.786 Fib level at $0.1943. Directly below this lies the primary macro ascending trend line, closely backed by the crucial 1.618 Fibonacci macro extension support at $0.1760.
💡 Trading Strategy:
Wedge Breakout Play: A decisive daily close above the upper descending resistance trend line opens massive expansion potential.Defensive Range: Watch for aggressive buyer absorption inside the $0.1760–$0.1943 region to scale tight risk long configurations.
#ARXUSDT #cryptotrading #TechnicalAnalysis #BinanceSquare #Fibonacci
{alpha}(560xd5f6ef5deabe61e6d5cdb49bfb6f156f2c1ca715)
{future}(ARXUSDT)
$ARX /USDT Perpetual Technical Analysis: Squeezing Into Macro Trend Junction 🚨
The daily chart shows $ARX compressing significantly within a large descending wedge structure, sliding directly down toward an intersecting multi-month macro ascending trend line.
📉 Technical Breakdown:
• Current Price: $0.1865
• Local Overhead Resistance: The immediate obstacle sits right at the 0 Fib baseline around $0.2202. Reclaiming this level shifts control back to the buyers.
• Key Support Clusters: Price is currently hammering into the 0.786 Fib level at $0.1943. Directly below this lies the primary macro ascending trend line, closely backed by the crucial 1.618 Fibonacci macro extension support at $0.1760.
💡 Trading Strategy:
Wedge Breakout Play: A decisive daily close above the upper descending resistance trend line opens massive expansion potential.Defensive Range: Watch for aggressive buyer absorption inside the $0.1760–$0.1943 region to scale tight risk long configurations.
#ARXUSDT #cryptotrading #TechnicalAnalysis #BinanceSquare #Fibonacci
The daily chart shows $ARX compressing significantly within a large descending wedge structure, sliding directly down toward an intersecting multi-month macro ascending trend line.
📉 Technical Breakdown:
• Current Price: $0.1865
• Local Overhead Resistance: The immediate obstacle sits right at the 0 Fib baseline around $0.2202. Reclaiming this level shifts control back to the buyers.
• Key Support Clusters: Price is currently hammering into the 0.786 Fib level at $0.1943. Directly below this lies the primary macro ascending trend line, closely backed by the crucial 1.618 Fibonacci macro extension support at $0.1760.
💡 Trading Strategy:
Wedge Breakout Play: A decisive daily close above the upper descending resistance trend line opens massive expansion potential.Defensive Range: Watch for aggressive buyer absorption inside the $0.1760–$0.1943 region to scale tight risk long configurations.
#ARXUSDT #cryptotrading #TechnicalAnalysis #BinanceSquare #Fibonacci
1
378
·
--
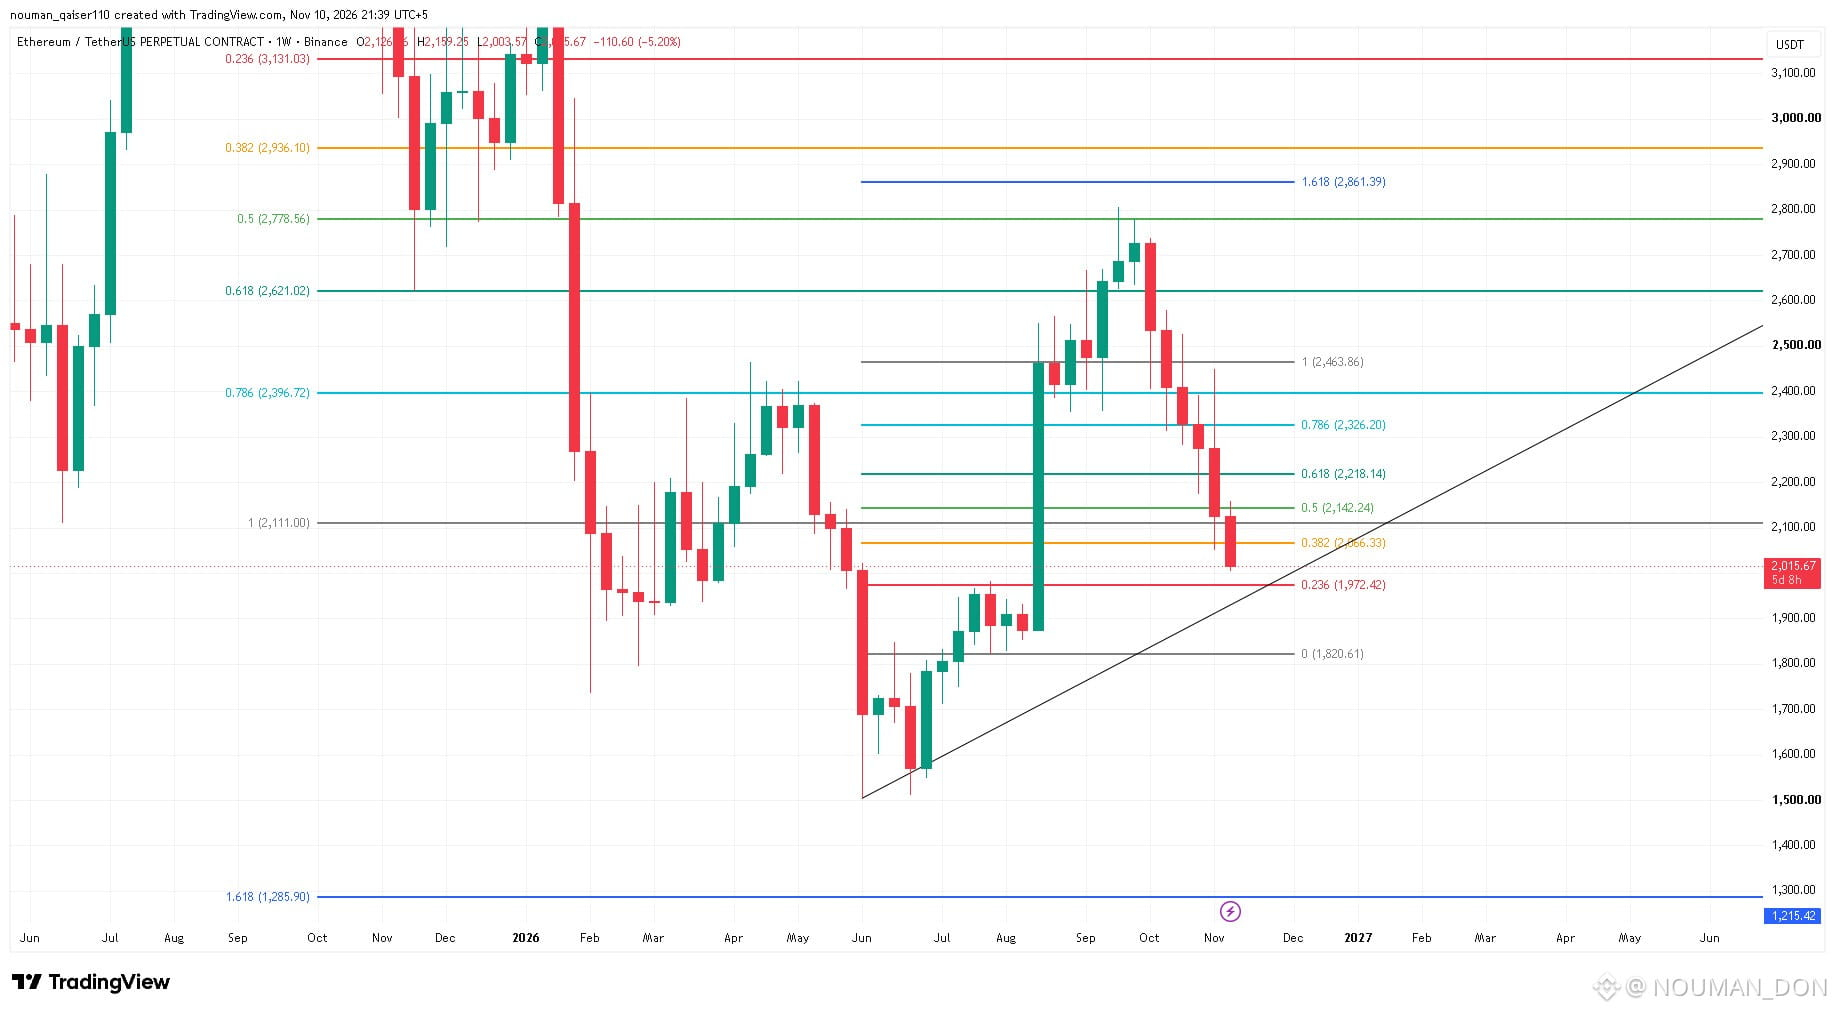
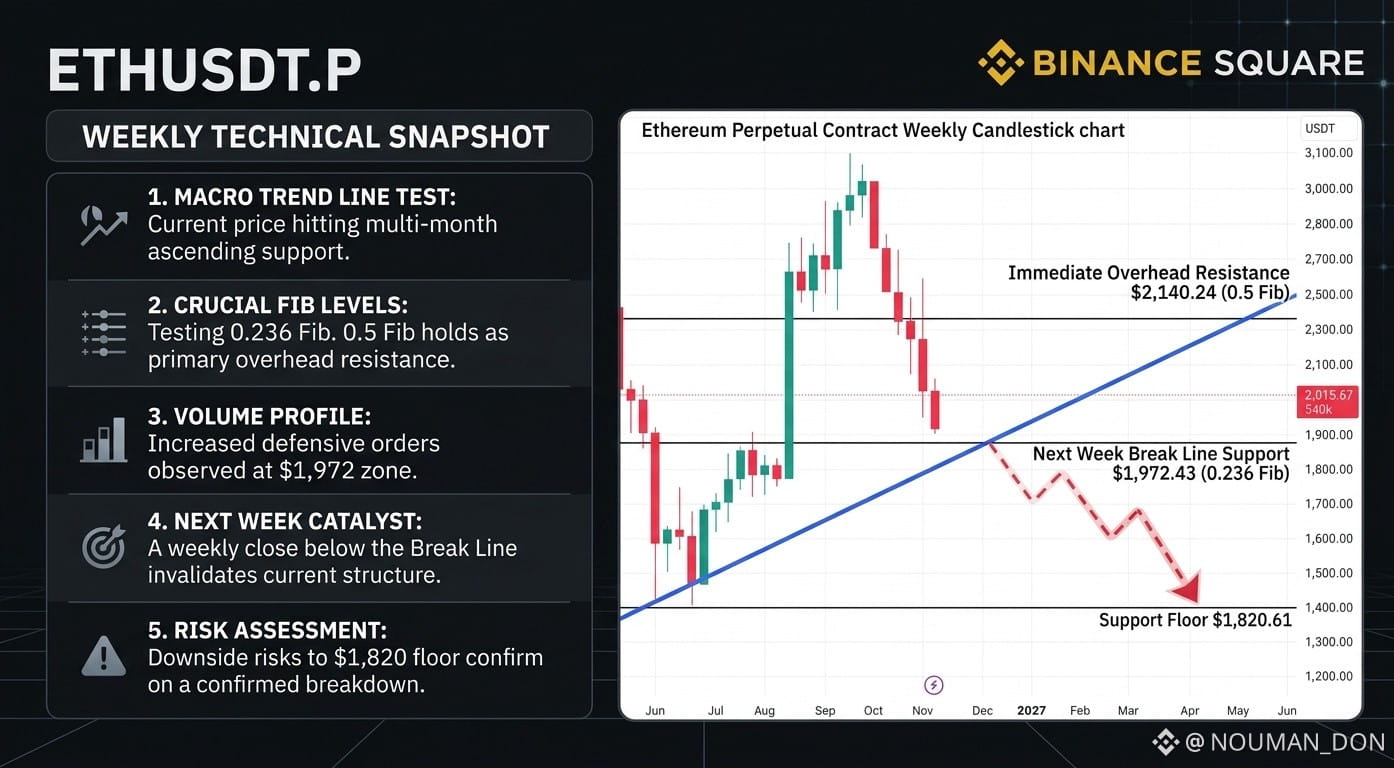
$ETH /USDT Perpetual Technical Analysis: Testing Major Macro Trend Line 🚨
The weekly chart shows $ETH undergoing a multi-week correction phase, moving down from its local swing high and sliding directly toward a primary multi-month macro trend support line.
📉 Technical Breakdown:
• Current Price: $2,015.67
• Immediate Resistance: Overhead supply sits firmly at the 0.5 Fib retracement level at $2,140.24, which must be reclaimed to shift momentum back to bulls.
• The Next Week Break Line: All structural eyes are locked onto the intersecting zone of the 0.236 Fib level at $1,972.43 and the ascending macro trend line. A decisive weekly close beneath this critical junction marks next week's breakdown line, which would risk exposing a deep continuation target toward the $1,820.61 horizontal floor (0 Fib).
💡 Trading Strategy:
Defensive Play: Monitor the $1,972 trend support closely for long-wick rejections or accumulation before opening long exposure.Breakout Setup: A clean break below the macro trend line next week confirms invalidation, opening short opportunities to $1,820.
#ETHUSDT #Ethereum #cryptotrading #TechnicalAnalysis #BinanceSquare
{spot}(ETHUSDT)
{future}(ETHUSDT)
$ETH /USDT Perpetual Technical Analysis: Testing Major Macro Trend Line 🚨
The weekly chart shows $ETH undergoing a multi-week correction phase, moving down from its local swing high and sliding directly toward a primary multi-month macro trend support line.
📉 Technical Breakdown:
• Current Price: $2,015.67
• Immediate Resistance: Overhead supply sits firmly at the 0.5 Fib retracement level at $2,140.24, which must be reclaimed to shift momentum back to bulls.
• The Next Week Break Line: All structural eyes are locked onto the intersecting zone of the 0.236 Fib level at $1,972.43 and the ascending macro trend line. A decisive weekly close beneath this critical junction marks next week's breakdown line, which would risk exposing a deep continuation target toward the $1,820.61 horizontal floor (0 Fib).
💡 Trading Strategy:
Defensive Play: Monitor the $1,972 trend support closely for long-wick rejections or accumulation before opening long exposure.Breakout Setup: A clean break below the macro trend line next week confirms invalidation, opening short opportunities to $1,820.
#ETHUSDT #Ethereum #cryptotrading #TechnicalAnalysis #BinanceSquare
The weekly chart shows $ETH undergoing a multi-week correction phase, moving down from its local swing high and sliding directly toward a primary multi-month macro trend support line.
📉 Technical Breakdown:
• Current Price: $2,015.67
• Immediate Resistance: Overhead supply sits firmly at the 0.5 Fib retracement level at $2,140.24, which must be reclaimed to shift momentum back to bulls.
• The Next Week Break Line: All structural eyes are locked onto the intersecting zone of the 0.236 Fib level at $1,972.43 and the ascending macro trend line. A decisive weekly close beneath this critical junction marks next week's breakdown line, which would risk exposing a deep continuation target toward the $1,820.61 horizontal floor (0 Fib).
💡 Trading Strategy:
Defensive Play: Monitor the $1,972 trend support closely for long-wick rejections or accumulation before opening long exposure.Breakout Setup: A clean break below the macro trend line next week confirms invalidation, opening short opportunities to $1,820.
#ETHUSDT #Ethereum #cryptotrading #TechnicalAnalysis #BinanceSquare
1
65
·
--
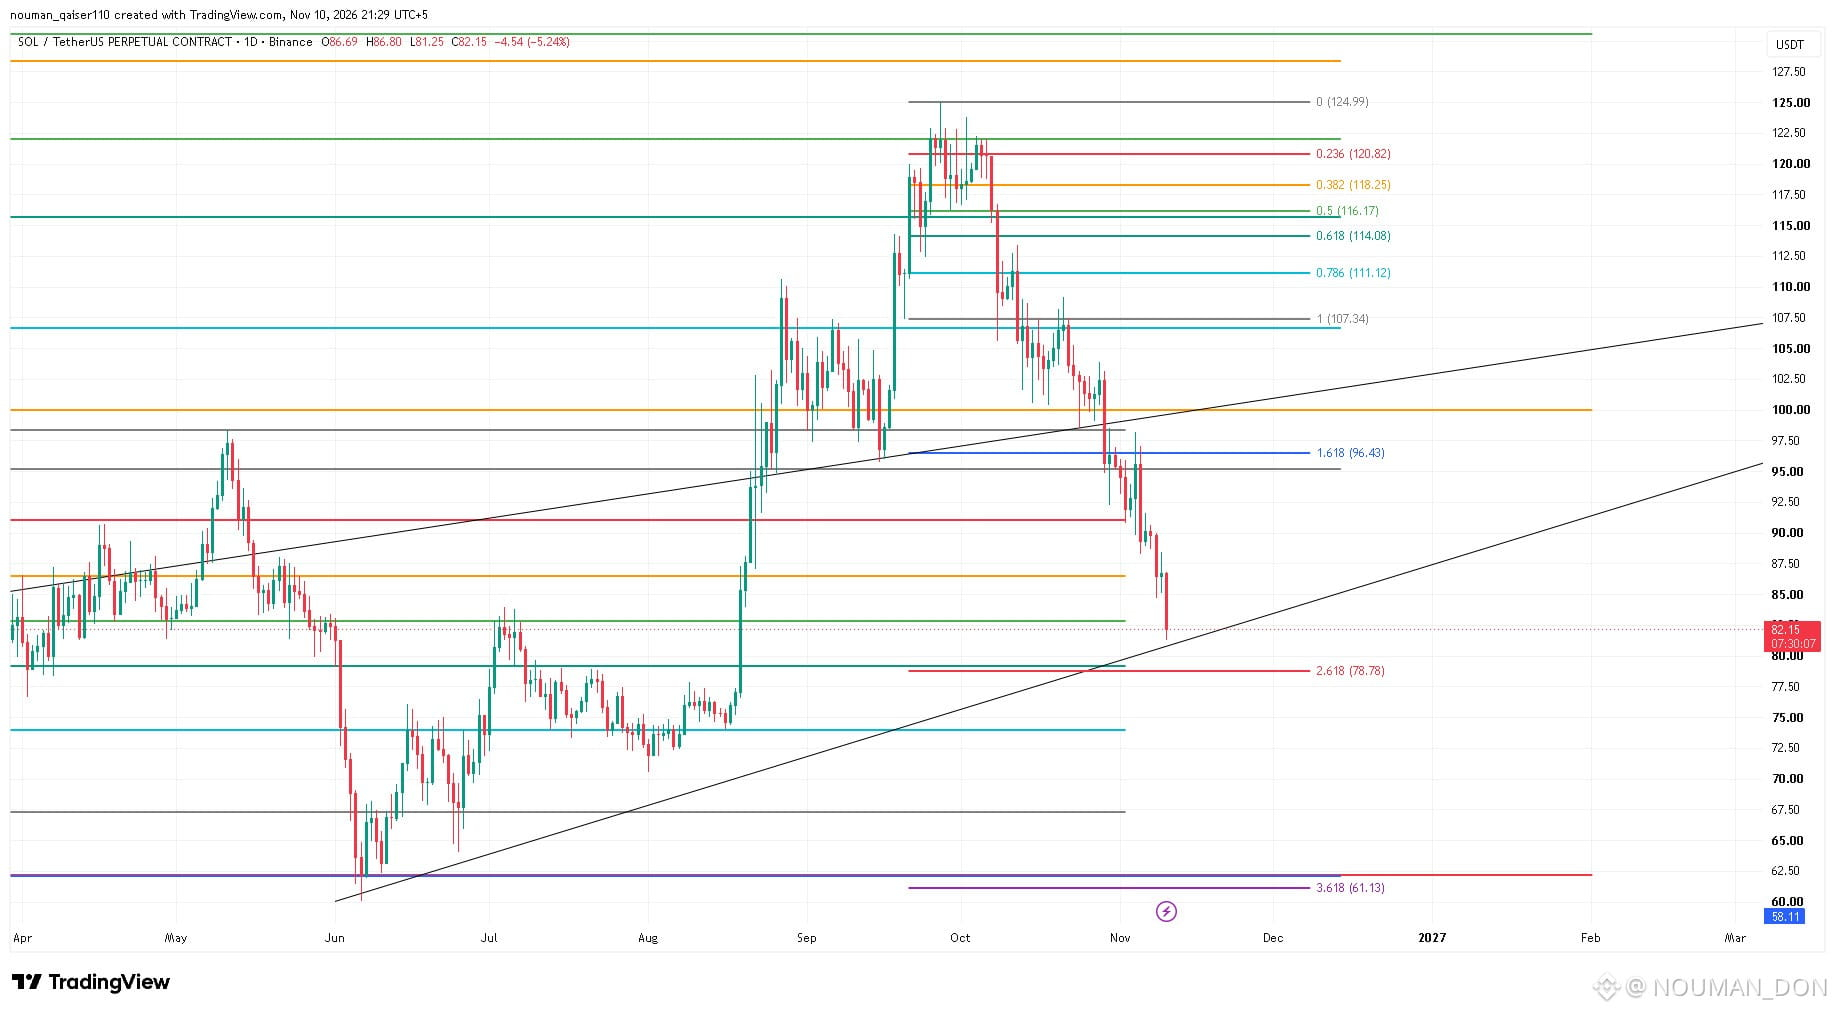
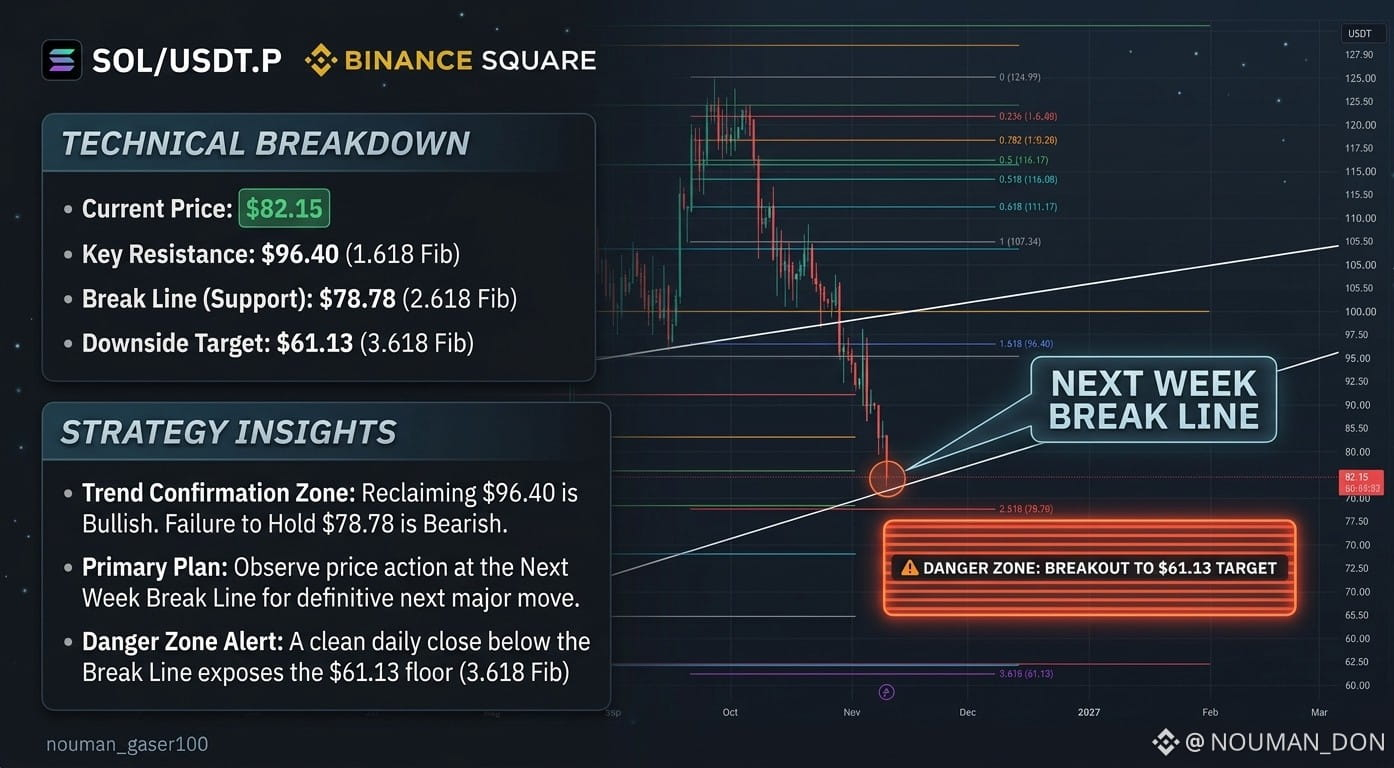
$SOL /USDT Perpetual Technical Analysis: Crucial Invalidation at Macro Trend Line 🚨
The daily chart shows $SOL undergoing a sharp multi-week markdown phase, wiping out upper consolidation ranges and rapidly sliding down toward a defining multi-month structural trend support line.
📉 Technical Breakdown:
• Current Price: $82.15
• Key Support Violated: Price has breached the 1.618 Fib extension level at $96.40, flipping it into an immediate overhead resistance barrier.
• The Next Week Break Line: All eyes are on the ascending macro trend line currently intersecting right around the $78.78 horizontal cluster (2.618 Fib extension). A clean daily candle break below this critical junction next week marks the confirmation line for a deep continuation down toward the 3.618 Fib floor at $61.13.
💡 Trading Strategy:
Defensive Hold: Watch for defensive buyer absorption or a aggressive fakeout sweep right at the $78.78 trend line before seeking long exposure.Breakout Short: A decisive break and close under the trend line next week validates an extension target toward $61.13.
#SOLUSDT #cryptotrading #TechnicalAnalysis #BinanceSquare #Fibonacci
{spot}(SOLUSDT)
{future}(SOLUSDT)
$SOL /USDT Perpetual Technical Analysis: Crucial Invalidation at Macro Trend Line 🚨
The daily chart shows $SOL undergoing a sharp multi-week markdown phase, wiping out upper consolidation ranges and rapidly sliding down toward a defining multi-month structural trend support line.
📉 Technical Breakdown:
• Current Price: $82.15
• Key Support Violated: Price has breached the 1.618 Fib extension level at $96.40, flipping it into an immediate overhead resistance barrier.
• The Next Week Break Line: All eyes are on the ascending macro trend line currently intersecting right around the $78.78 horizontal cluster (2.618 Fib extension). A clean daily candle break below this critical junction next week marks the confirmation line for a deep continuation down toward the 3.618 Fib floor at $61.13.
💡 Trading Strategy:
Defensive Hold: Watch for defensive buyer absorption or a aggressive fakeout sweep right at the $78.78 trend line before seeking long exposure.Breakout Short: A decisive break and close under the trend line next week validates an extension target toward $61.13.
#SOLUSDT #cryptotrading #TechnicalAnalysis #BinanceSquare #Fibonacci
The daily chart shows $SOL undergoing a sharp multi-week markdown phase, wiping out upper consolidation ranges and rapidly sliding down toward a defining multi-month structural trend support line.
📉 Technical Breakdown:
• Current Price: $82.15
• Key Support Violated: Price has breached the 1.618 Fib extension level at $96.40, flipping it into an immediate overhead resistance barrier.
• The Next Week Break Line: All eyes are on the ascending macro trend line currently intersecting right around the $78.78 horizontal cluster (2.618 Fib extension). A clean daily candle break below this critical junction next week marks the confirmation line for a deep continuation down toward the 3.618 Fib floor at $61.13.
💡 Trading Strategy:
Defensive Hold: Watch for defensive buyer absorption or a aggressive fakeout sweep right at the $78.78 trend line before seeking long exposure.Breakout Short: A decisive break and close under the trend line next week validates an extension target toward $61.13.
#SOLUSDT #cryptotrading #TechnicalAnalysis #BinanceSquare #Fibonacci
1
139
·
--
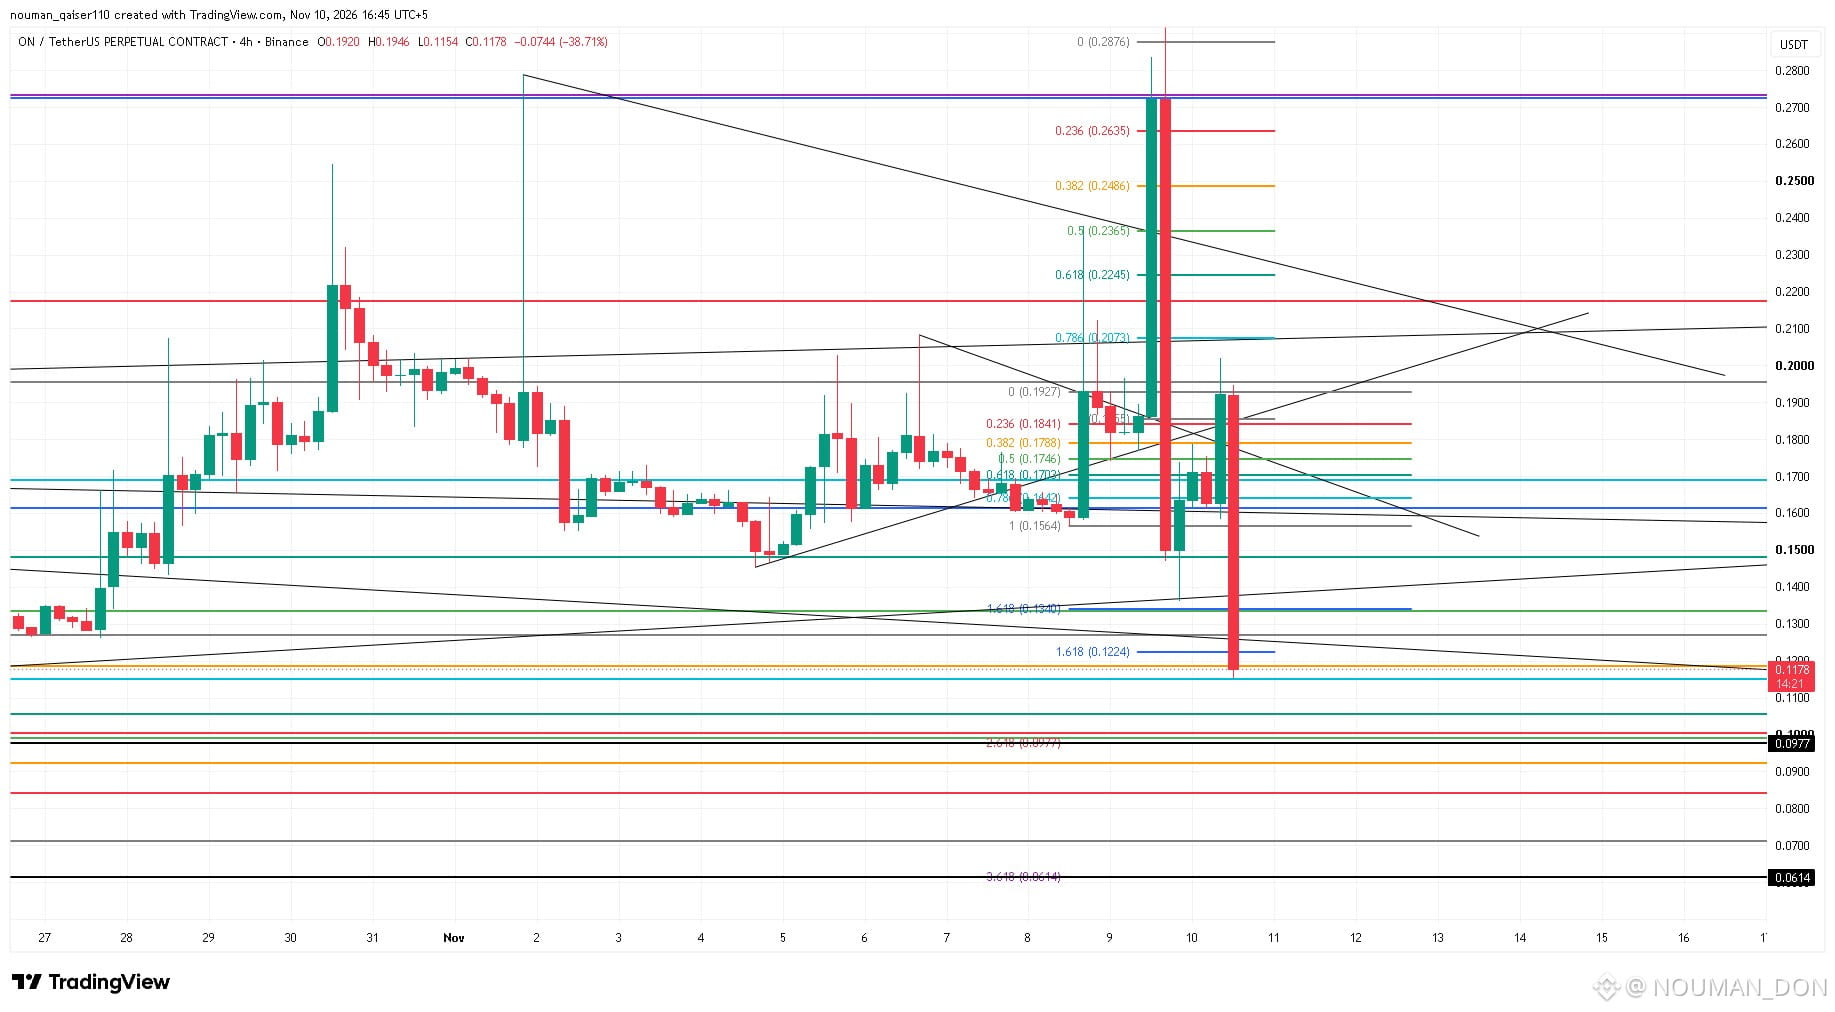
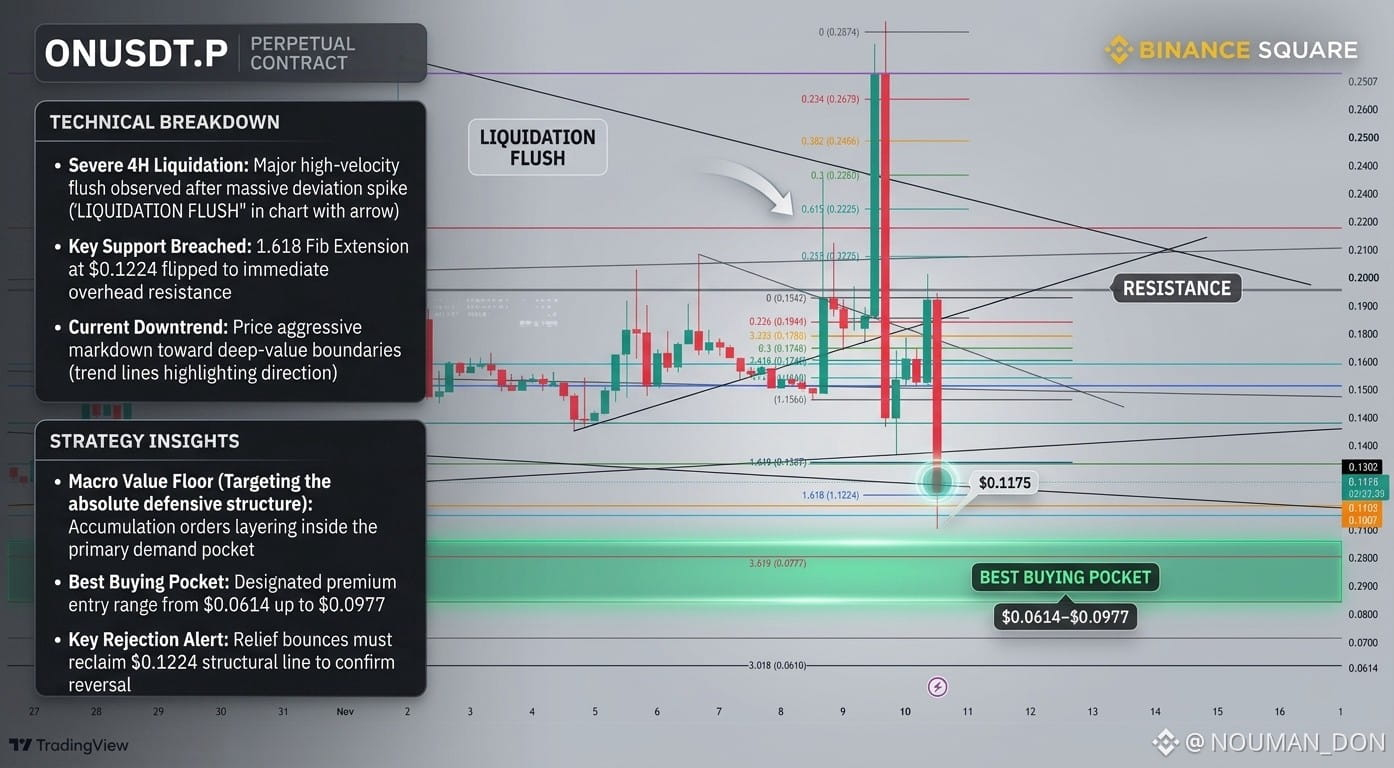
$ON /USDT Perpetual Technical Analysis: Severe Liquidation Into Deep Macro Floor 🚨
The user-provided 4H chart shows $ON executing a massive, high-velocity liquidation flush, wiping out local support structures completely and descending directly toward its macro baseline boundaries.
📉 Technical Breakdown:
• Current Price: $0.1175
• Massive Deviations: Price experienced a violent spike and immediate rejection, slicing straight through the 1.618 Fib extension level at $0.1224.
• Ultimate Value Pocket: Momentum is pushing down into a deep-value territory. The final defensive structure rests between the 4.236 macro extension ($0.0977) and the absolute structural 4.618 floor ($0.0614), presenting a top-tier historical buying zone from $0.0614 to $0.0977.
💡 Trading Strategy:
Accumulation Plan: Layer defensive orders inside the $0.0614–$0.0977 region where macro buyers are expected to defend.Resistance Zone: Relief bounces will face immediate overhead resistance back near the $0.1224 structural breakdown line.
#ONUSDT #cryptotrading #TechnicalAnalysis #BinanceSquare #Fibonacci
{alpha}(560x0e4f6209ed984b21edea43ace6e09559ed051d48)
{future}(ONUSDT)
$ON /USDT Perpetual Technical Analysis: Severe Liquidation Into Deep Macro Floor 🚨
The user-provided 4H chart shows $ON executing a massive, high-velocity liquidation flush, wiping out local support structures completely and descending directly toward its macro baseline boundaries.
📉 Technical Breakdown:
• Current Price: $0.1175
• Massive Deviations: Price experienced a violent spike and immediate rejection, slicing straight through the 1.618 Fib extension level at $0.1224.
• Ultimate Value Pocket: Momentum is pushing down into a deep-value territory. The final defensive structure rests between the 4.236 macro extension ($0.0977) and the absolute structural 4.618 floor ($0.0614), presenting a top-tier historical buying zone from $0.0614 to $0.0977.
💡 Trading Strategy:
Accumulation Plan: Layer defensive orders inside the $0.0614–$0.0977 region where macro buyers are expected to defend.Resistance Zone: Relief bounces will face immediate overhead resistance back near the $0.1224 structural breakdown line.
#ONUSDT #cryptotrading #TechnicalAnalysis #BinanceSquare #Fibonacci
The user-provided 4H chart shows $ON executing a massive, high-velocity liquidation flush, wiping out local support structures completely and descending directly toward its macro baseline boundaries.
📉 Technical Breakdown:
• Current Price: $0.1175
• Massive Deviations: Price experienced a violent spike and immediate rejection, slicing straight through the 1.618 Fib extension level at $0.1224.
• Ultimate Value Pocket: Momentum is pushing down into a deep-value territory. The final defensive structure rests between the 4.236 macro extension ($0.0977) and the absolute structural 4.618 floor ($0.0614), presenting a top-tier historical buying zone from $0.0614 to $0.0977.
💡 Trading Strategy:
Accumulation Plan: Layer defensive orders inside the $0.0614–$0.0977 region where macro buyers are expected to defend.Resistance Zone: Relief bounces will face immediate overhead resistance back near the $0.1224 structural breakdown line.
#ONUSDT #cryptotrading #TechnicalAnalysis #BinanceSquare #Fibonacci
1
1k
Log in to explore more content
Join global crypto users on Binance Square
⚡️ Get latest and useful information about crypto.
💬 Trusted by the world’s largest crypto exchange.
👍 Discover real insights from verified creators.
Email / Phone number
Trending Topics
WhatWillDriveCryptoandStocks’NextRebound?
55,989 views
787 Discussing
Bitcoin Slips Below $70,000 as Dollar Index Hits 19-Month High
Binance News
·17 Likes
·37.4k views
Anthropic’s6xIPODemandSignalsPotentialRecordRaise
18,059 views
367 Discussing
USCryptoETFsLose$1.48BInFiveDays
250 views
9 Discussing