

POETA
117 Posts

POETA
Report
Block User

BTC Holder
Occasional Trader
7.1 Years
6 Following
40 Followers
140 Liked
Posts
All
Quotes
Videos
·
--
Article
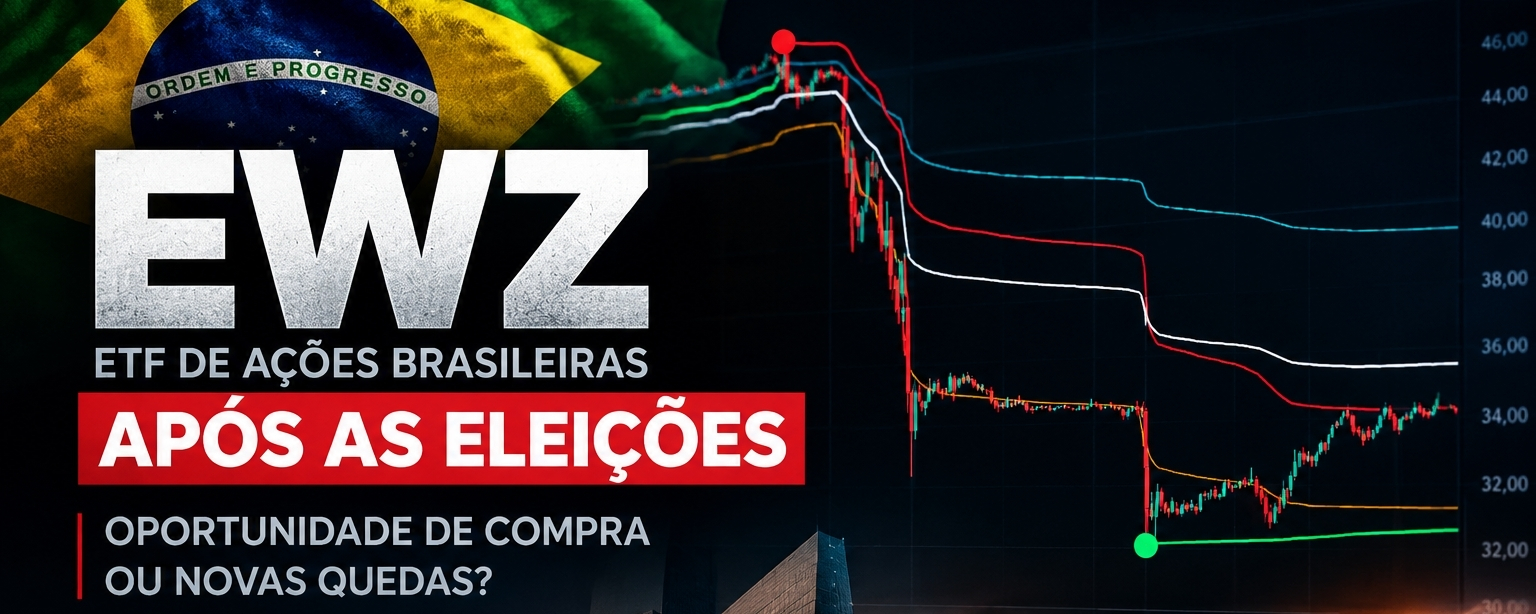
EWZ after the Brazilian election: a buying opportunity or the start of further declines?The Brazilian financial market is experiencing a period of intense volatility following the presidential election. The election results prompted investors to reassess their expectations, directly affecting the performance of Brazilian assets traded abroad, including EWZ, an ETF that holds shares in Brazilian companies and is traded in the United States.
The movement shown on the chart stands out for the severity of the decline. The price fell from around $46 to approximately $30, before partially recovering to around $34.22. This movement shows that, after intense selling pressure, buyers emerged who were willing to trade at lower levels. However, this reaction does not yet represent a confirmed trend reversal.
EWZ after the Brazilian election: a buying opportunity or the start of further declines?
The Brazilian financial market is experiencing a period of intense volatility following the presidential election. The election results prompted investors to reassess their expectations, directly affecting the performance of Brazilian assets traded abroad, including EWZ, an ETF that holds shares in Brazilian companies and is traded in the United States.
The movement shown on the chart stands out for the severity of the decline. The price fell from around $46 to approximately $30, before partially recovering to around $34.22. This movement shows that, after intense selling pressure, buyers emerged who were willing to trade at lower levels. However, this reaction does not yet represent a confirmed trend reversal.
The movement shown on the chart stands out for the severity of the decline. The price fell from around $46 to approximately $30, before partially recovering to around $34.22. This movement shows that, after intense selling pressure, buyers emerged who were willing to trade at lower levels. However, this reaction does not yet represent a confirmed trend reversal.
EWZETF-1.83%
1
441
·
--
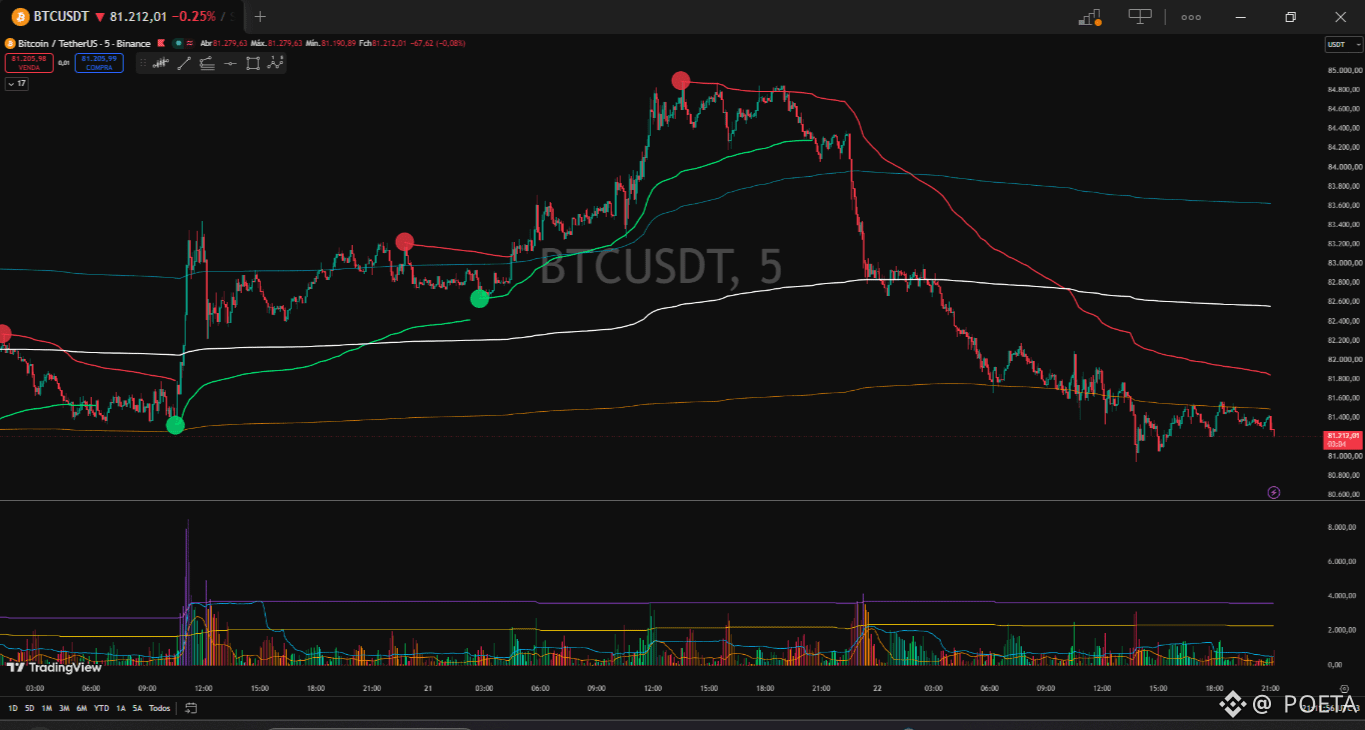
Analyzing the 5-minute Bitcoin chart, the move begins with a test of the orange line and an unusual volume spike at the bottom, confirming institutional absorption (Spring). The indicator activates the first green circle, and the fast micro-VWAP slopes upward. After breaking above the white line, the market pulls back on low volume and lights up the second green circle, triggering a rally to 84,800. At the top, the red circle and selling volume signal exhaustion. The micro-VWAP turns red, breaks below the white line, and slices through the orange support down to 81,200.
#btc
#indicadores
#vwaps
#btc
#indicadores
#vwaps
1
100
·
--
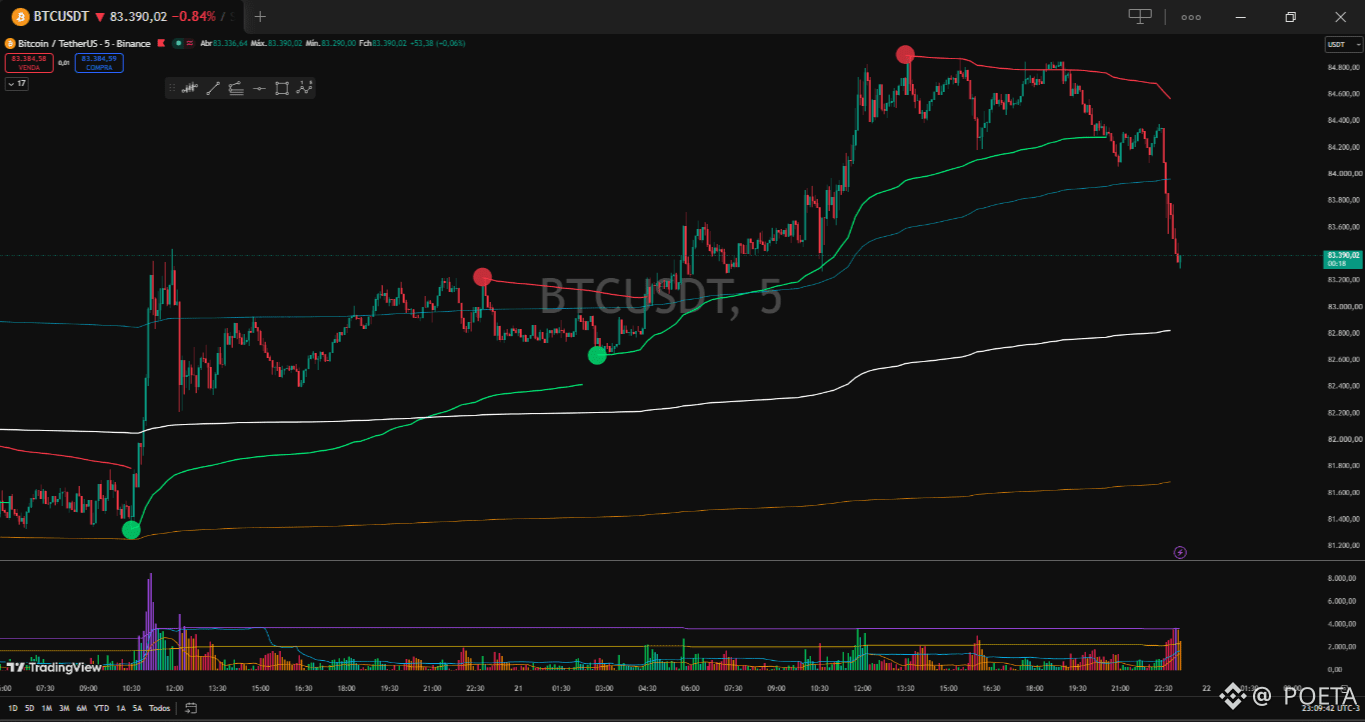
#🟢After the strong buying expansion that led Bitcoin to test the top region near $84,800, the market began a significant profit-taking move. At the peak of this move, our indicator lit up the red circle and changed the color of the fast trend line, clearly signaling the exhaustion of buying strength and the entry of high-volume selling flow.📊
💱After losing support from the shorter VWAPs, the price made a mean-reversion move, returning to test the support bands of the central VWAP, represented by the white line. This white line serves as the main dividing line and value axis for the medium-term trend.
↕️At this point, as the price approaches this central VWAP, the indicator enters a strategic monitoring phase: if buyers defend this area around the white line, the algorithm may validate a continuation pullback to resume the uptrend; otherwise, a break below this band will open the way to test deeper liquidity zones near the orange line anchored at the base.
#btc
#vwaps
#indicadorvwap
#vwapdinamica
#scalping
2
150
·
--
See how to use the indicator to identify the complete Bitcoin uptrend (5m)!🚀
Learn to spot the liquidity sweep (Spring) at $81,300 and the order-flow confirmation from anchored and fast VWAPs. I also show how the algorithm signaled the pullback at $82,950 for a perfect re-entry toward the $84,800 target (more than 3,300 points up)!
🔥 Subscribe to the channel and turn on notifications! #Bitcoin #Trading #VWAP #DayTrade #Wyckoff
1
820
·
--
🙇🏻📊📉The Ahr999 Index is a logarithmic tool for long-term Bitcoin accumulation, comparing the price with block height and the 200-day average. It divides readings into three ranges: below 0.45 indicates buying at a low price; between 0.45 and 1.2 indicates regular investing; above 1.2 signals a high price. Historically, BTC spent about 51% of the time in the regular-investing zone and only 13% in the deepest-discount zone.🟢🔴
🙇🏻📊📉The Ahr999 Index is a logarithmic tool for long-term Bitcoin accumulation, comparing the price with block height and the 200-day average. It divides readings into three ranges: below 0.45 indicates buying at a low price; between 0.45 and 1.2 indicates regular investing; above 1.2 signals a high price. Historically, BTC spent about 51% of the time in the regular-investing zone and only 13% in the deepest-discount zone.🟢🔴
1
543
·
--
🛗The formation of a range represents the operational base of big players, where institutions use consolidation to accumulate or distribute large positions without causing slippage. In these supply and demand zones, the sharks absorb market liquidity and trigger🔴retail stop-losses in false breakouts. The range stores the energy needed for the next move, and understanding it allows traders to manage their risk and move with the flow as the trend expands.🟢
🛗The formation of a range represents the operational base of big players, where institutions use consolidation to accumulate or distribute large positions without causing slippage. In these supply and demand zones, the sharks absorb market liquidity and trigger🔴retail stop-losses in false breakouts. The range stores the energy needed for the next move, and understanding it allows traders to manage their risk and move with the flow as the trend expands.🟢
1
414
·
--
Bitcoin's move began at an extreme low of approximately 81,100 USDT (green dot), where a selling climax triggered strong absorption and an explosive reversal that quickly cut through the shorter VWAPs. With sustained buying volume, the price easily crossed the Central VWAP, forcing short positions to close and establishing a healthy structure of higher pivots toward 84,000 USDT. As the market approached the 84,200–84,300 USDT region (red dot), buying strength showed signs of exhaustion and massive profit-taking followed.
Bitcoin's move began at an extreme low of approximately 81,100 USDT (green dot), where a selling climax triggered strong absorption and an explosive reversal that quickly cut through the shorter VWAPs. With sustained buying volume, the price easily crossed the Central VWAP, forcing short positions to close and establishing a healthy structure of higher pivots toward 84,000 USDT. As the market approached the 84,200–84,300 USDT region (red dot), buying strength showed signs of exhaustion and massive profit-taking followed.
1
440
·
--
An analysis of Bitcoin’s monthly returns from 2013 to 2026 shows that statistical seasonality provides useful context, but is insufficient as a standalone trading signal, since historical averages are often skewed by explosive past returns (such as in 2013 and 2017) and the median is needed to reflect actual market behavior.
Watch the full video.
Watch the full video.
2
358
·
--
📉 We mapped Bitcoin’s trajectory from the strong buying exhaustion at the resistance of the upper purple box (84,400–87,100 USDT) 🎯. The move culminated in an aggressive dump that broke through intermediate support levels and triggered a deep stop-loss sweep down to the 80,400 USDT range 📊. Now, the asset is trading in a decisive zone on the chart, opening the door to a short-term retest of the white VWAP at 83,926 USDT or another test of the lower levels—all in line with a highly promising seasonality cycle that we’ll discuss soon! 🚀✨
📉 We mapped Bitcoin’s trajectory from the strong buying exhaustion at the resistance of the upper purple box (84,400–87,100 USDT) 🎯. The move culminated in an aggressive dump that broke through intermediate support levels and triggered a deep stop-loss sweep down to the 80,400 USDT range 📊. Now, the asset is trading in a decisive zone on the chart, opening the door to a short-term retest of the white VWAP at 83,926 USDT or another test of the lower levels—all in line with a highly promising seasonality cycle that we’ll discuss soon! 🚀✨
3
797
·
--
In this video, we’ll analyze BTCUSDT and explore Bitcoin’s possible next moves by looking at support and resistance areas, liquidity zones, price behavior, and potential signs of accumulation or a breakout. Is the market gearing up for a new move, or is there a surprise hidden in this area? 📊₿ Follow this technical analysis to understand the possible scenarios and key points on the chart. Please remember that this content is for educational purposes only, focused on studying price behavior, and does not constitute investment advice. 🚀📉
In this video, we’ll analyze BTCUSDT and explore Bitcoin’s possible next moves by looking at support and resistance areas, liquidity zones, price behavior, and potential signs of accumulation or a breakout. Is the market gearing up for a new move, or is there a surprise hidden in this area? 📊₿ Follow this technical analysis to understand the possible scenarios and key points on the chart. Please remember that this content is for educational purposes only, focused on studying price behavior, and does not constitute investment advice. 🚀📉
1
1
263
·
--
👀✨We observe support and resistance regions, consolidation zones, possible liquidity areas, buyer and seller reactions, indicator curves, and trading volume. 🙂📈📊📉The goal is to understand how potential false breakouts, rejections, and reversals can create traps for traders, distinguishing natural market behavior from possible price manipulation.
👀✨We observe support and resistance regions, consolidation zones, possible liquidity areas, buyer and seller reactions, indicator curves, and trading volume. 🙂📈📊📉The goal is to understand how potential false breakouts, rejections, and reversals can create traps for traders, distinguishing natural market behavior from possible price manipulation.
2
2
757
·
--
🙇🏻❓What comes next after this crushing Bitcoin drop, which broke through all support levels, liquidated positions around 80,400 USDT, and is now rebounding with impressive buying strength? 👀 The move looks frightening at first glance, but it reveals a true institutional liquidity grab that fits precisely into an advanced chart pattern—and a highly promising seasonal cycle we haven’t discussed yet. 🫡If you want to understand why this current zone could be a turning point and the most strategic opportunity of the year.
🙇🏻❓What comes next after this crushing Bitcoin drop, which broke through all support levels, liquidated positions around 80,400 USDT, and is now rebounding with impressive buying strength? 👀 The move looks frightening at first glance, but it reveals a true institutional liquidity grab that fits precisely into an advanced chart pattern—and a highly promising seasonal cycle we haven’t discussed yet. 🫡If you want to understand why this current zone could be a turning point and the most strategic opportunity of the year.
2
836
·
--
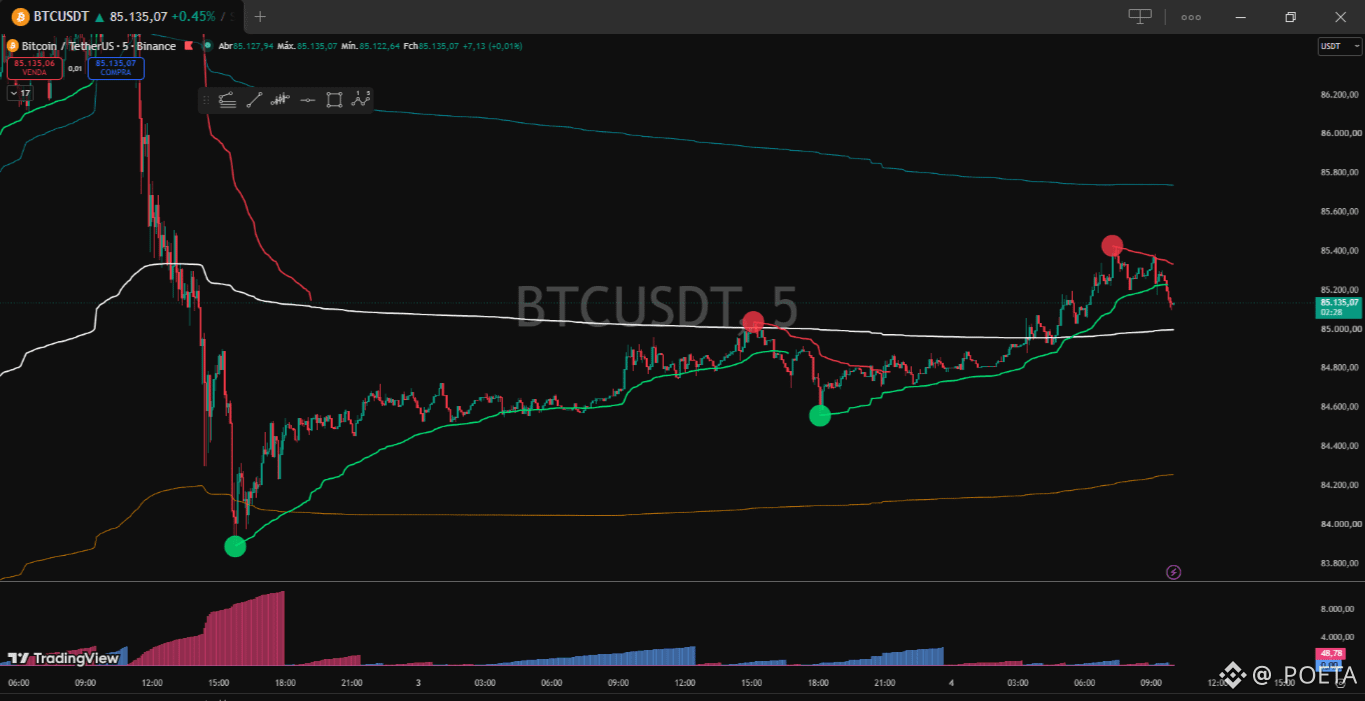
🔴The appearance of this new red signal at the top of the move marks a crucial technical inflection point on the 5-minute chart of BTCUSDT:
Rejection at the Top and Offer Entry: After the strong bullish leg that swept the previous signal and pushed the price above 85,400, the market found significant resistance in that high region. The red signal printed indicates the presence of sellers defending this level and taking profits.⤵️
Loss of Impulse in the Weis Wave: The lower panel shows that the buyer volume (blue bars) started to shrink and make room for red bars in the wave indicator, signaling the exhaustion of the bullish move and a loss of buying strength.📊
Moving Average Crossover: The price has already turned downward, breaking the fast green moving average and starting a correction toward the dynamic support of the central VWAP (white line).🔀
Attention Scenario: The current move suggests an immediate corrective pullback. It’s important to watch whether the price will find support again at the central white VWAP to attempt a reacumulation, or if selling pressure will be strong enough to break this level and seek lower supports.💹
1
168
·
--
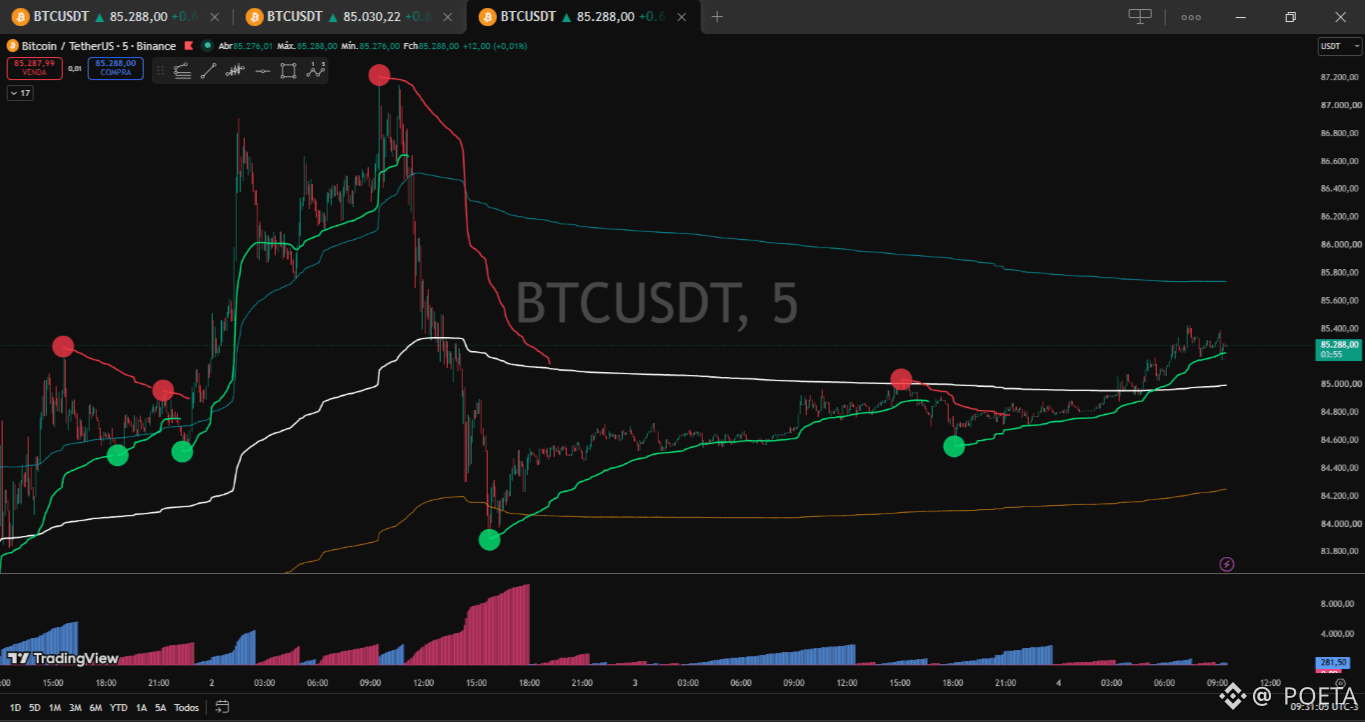
After the consolidation phase with the central VWAP, the price initially met resistance and triggered a red signal.🔴 However, this selling pressure was quickly swept away by the market. Soon after a brief pullback to the green support signal on the lower moving average, the bulls fought firmly to push the price back up, absorbing all the supply.🟢
📊 With the resumption of bullish control, BTCUSDT broke the central VWAP with conviction and kicked off a consistent uptrend, supported by the gradual increase of the blue volume bars in the Weis Wave. The price surpassed the 85,000 level and moved toward 85,400, confirming the buyers’ victory on the 5-minute chart.🔝
As of the time of this publication, the indicator is still showing a green-signal trend. 🟢
2
503
·
--
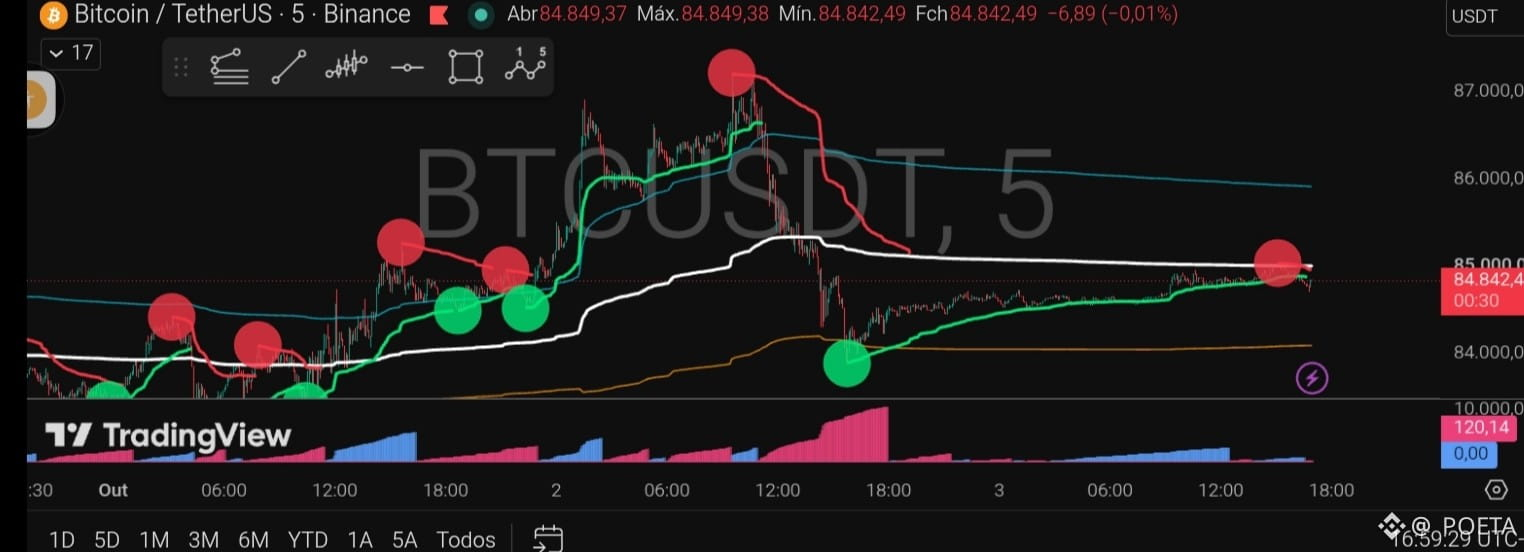
Red signal activated 🔴
Well, this is the trap for Bulls. 🙂✨
Red signal activated 🔴
Well, this is the trap for Bulls. 🙂✨
Well, this is the trap for Bulls. 🙂✨
2
2
129
Log in to explore more content
Join global crypto users on Binance Square
⚡️ Get latest and useful information about crypto.
💬 Trusted by the world’s largest crypto exchange.
👍 Discover real insights from verified creators.
Email / Phone number
Trending Topics
BinanceReports80%Recoveryof$6.3BillioninLossesfromHackIncident
1,605 views
43 Discussing
Binance News Update | Binance Co-CEOs Say 80% of the $6.3 Billion Loss Is Already Covered, With Withdrawals Restarting in Phases and Proof of Reserves Due Monday
Binance News
·190 Likes
·168k views
HeYiSaysWithdrawalsExpectedtoResumeWithin42Hours
1,694 views
73 Discussing
CZSaysCompensationIsinPlaceUsersAreProtected
1,060 views
46 Discussing