

洪洪洪-
402 Posts

洪洪洪-
Report
Block User
13 Following
264 Followers
2.0K+ Liked
Posts
All
Quotes
·
--
Only price and volume moving together makes a signal meaningful; an unusual move in a single candlestick doesn’t tell you much.
For example: $HOT rose 3.11% in 5 minutes to 0.000393. Keep your position size small so you can sleep well and think more clearly.
#HOT
Just my personal opinion—don’t take it too seriously.
Only price and volume moving together makes a signal meaningful; an unusual move in a single candlestick doesn’t tell you much.
For example: $HOT rose 3.11% in 5 minutes to 0.000393. Keep your position size small so you can sleep well and think more clearly.
#HOT
Just my personal opinion—don’t take it too seriously.
For example: $HOT rose 3.11% in 5 minutes to 0.000393. Keep your position size small so you can sleep well and think more clearly.
#HOT
Just my personal opinion—don’t take it too seriously.
5
·
--
⏱ 23:30|On-chain researcher: An exchange uses MPC to split private keys, making it harder for hackers to strike
As of publication, $BTC 78069.99, 1h +0.039%, 24h +0.73%.
Key point to watch: Has the market already priced this in?
Monitoring continues.
#BTC
This is not a recommendation to buy or sell in any form. Proceed at your own risk.
⏱ 23:30|On-chain researcher: An exchange uses MPC to split private keys, making it harder for hackers to strike
As of publication, $BTC 78069.99, 1h +0.039%, 24h +0.73%.
Key point to watch: Has the market already priced this in?
Monitoring continues.
#BTC
This is not a recommendation to buy or sell in any form. Proceed at your own risk.
As of publication, $BTC 78069.99, 1h +0.039%, 24h +0.73%.
Key point to watch: Has the market already priced this in?
Monitoring continues.
#BTC
This is not a recommendation to buy or sell in any form. Proceed at your own risk.
1
·
--
Why can two long/short ratios for the same contract sometimes point in opposite directions?
Definitions: Binance’s official contract statistics include the account long/short ratio and the top trader positions long/short ratio. They are calculated at intervals as short as 5 minutes and cover Binance USDⓈ-M perpetual contracts.
How they work: The account long/short ratio counts traders, so it better reflects the sentiment of retail traders. The top trader positions long/short ratio looks at position sizes, showing which side larger investors are betting on.
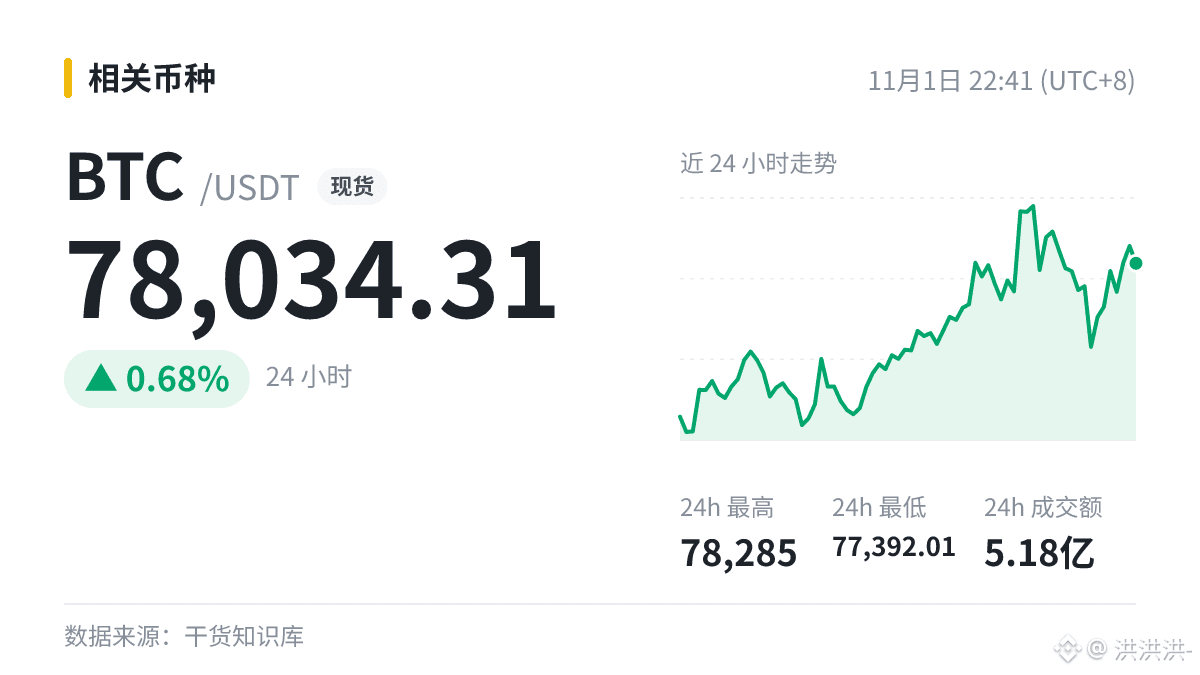
Related coin: $BTC is quoted at 78034.31 (24h +0.68%).
Understand the rules before taking action; don’t make decisions based on gut feeling.
This is a compilation of publicly available information. Please verify it yourself.
Why can two long/short ratios for the same contract sometimes point in opposite directions?
Definitions: Binance’s official contract statistics include the account long/short ratio and the top trader positions long/short ratio. They are calculated at intervals as short as 5 minutes and cover Binance USDⓈ-M perpetual contracts.
How they work: The account long/short ratio counts traders, so it better reflects the sentiment of retail traders. The top trader positions long/short ratio looks at position sizes, showing which side larger investors are betting on.
Related coin: $BTC is quoted at 78034.31 (24h +0.68%).
Understand the rules before taking action; don’t make decisions based on gut feeling.
This is a compilation of publicly available information. Please verify it yourself.
Definitions: Binance’s official contract statistics include the account long/short ratio and the top trader positions long/short ratio. They are calculated at intervals as short as 5 minutes and cover Binance USDⓈ-M perpetual contracts.
How they work: The account long/short ratio counts traders, so it better reflects the sentiment of retail traders. The top trader positions long/short ratio looks at position sizes, showing which side larger investors are betting on.
Related coin: $BTC is quoted at 78034.31 (24h +0.68%).
Understand the rules before taking action; don’t make decisions based on gut feeling.
This is a compilation of publicly available information. Please verify it yourself.
7
·
--
$AIOT 1-hour sharp surge of 3.99%, now at 0.08913, with a 24-hour range of 0.08279 ~ 0.095.
Technically, this move should be assessed alongside the daily chart structure; short-term anomalies can easily be reversed.
The first pullback after a rally is crucial: a pullback on lower volume is relatively healthy, while a high-volume decline calls for caution.
This is just for discussion; you are responsible for your own gains and losses.
$AIOT 1-hour sharp surge of 3.99%, now at 0.08913, with a 24-hour range of 0.08279 ~ 0.095.
Technically, this move should be assessed alongside the daily chart structure; short-term anomalies can easily be reversed.
The first pullback after a rally is crucial: a pullback on lower volume is relatively healthy, while a high-volume decline calls for caution.
This is just for discussion; you are responsible for your own gains and losses.
Technically, this move should be assessed alongside the daily chart structure; short-term anomalies can easily be reversed.
The first pullback after a rally is crucial: a pullback on lower volume is relatively healthy, while a high-volume decline calls for caution.
This is just for discussion; you are responsible for your own gains and losses.
2
·
--
Binance futures liquidations totaled $4.77 million over the past hour | Long positions accounted for 91% | $ETH ranked first
What are liquidations? A forced liquidation (also called a liquidation) occurs when unrealized losses on a leveraged position reduce its margin below the maintenance margin requirement, causing the system to close the position according to its rules.
Don’t use leverage to try to recover losses; this often marks the beginning of a series of liquidations.
Several data points that corroborate one another are more reliable than looking at just one, but even more signals cannot provide a definitive conclusion.
For recording purposes only; not trading advice.
Binance futures liquidations totaled $4.77 million over the past hour | Long positions accounted for 91% | $ETH ranked first
What are liquidations? A forced liquidation (also called a liquidation) occurs when unrealized losses on a leveraged position reduce its margin below the maintenance margin requirement, causing the system to close the position according to its rules.
Don’t use leverage to try to recover losses; this often marks the beginning of a series of liquidations.
Several data points that corroborate one another are more reliable than looking at just one, but even more signals cannot provide a definitive conclusion.
For recording purposes only; not trading advice.
What are liquidations? A forced liquidation (also called a liquidation) occurs when unrealized losses on a leveraged position reduce its margin below the maintenance margin requirement, causing the system to close the position according to its rules.
Don’t use leverage to try to recover losses; this often marks the beginning of a series of liquidations.
Several data points that corroborate one another are more reliable than looking at just one, but even more signals cannot provide a definitive conclusion.
For recording purposes only; not trading advice.
4
·
--
📌 #美国现货ETHETF连续23日净流出 |Views 20K
$BTC |77999.98|+0.49%
Numbers have no stance, and hype can easily mislead, so look at the data first.
#BTC
For record-keeping and sharing only; this is not investment advice.
📌 #美国现货ETHETF连续23日净流出 |Views 20K
$BTC |77999.98|+0.49%
Numbers have no stance, and hype can easily mislead, so look at the data first.
#BTC
For record-keeping and sharing only; this is not investment advice.
$BTC |77999.98|+0.49%
Numbers have no stance, and hype can easily mislead, so look at the data first.
#BTC
For record-keeping and sharing only; this is not investment advice.
·
--
$IDOL 1 hours +11.85%⬆️
Such a large short-term gain will intensify disagreements.
Current price: 0.02325. As long as the pullback holds above the breakout level, the structure remains intact. Like this, and check back in a few days to see how the trend plays out.
#IDOL
Do your research before placing an order.
$IDOL 1 hours +11.85%⬆️
Such a large short-term gain will intensify disagreements.
Current price: 0.02325. As long as the pullback holds above the breakout level, the structure remains intact. Like this, and check back in a few days to see how the trend plays out.
#IDOL
Do your research before placing an order.
Such a large short-term gain will intensify disagreements.
Current price: 0.02325. As long as the pullback holds above the breakout level, the structure remains intact. Like this, and check back in a few days to see how the trend plays out.
#IDOL
Do your research before placing an order.
2
·
--
📌 Binance is gradually resuming withdrawals: major assets such as BTC, ETH, and BNB are now available
$BTC , up 0.82% on the day.
Compare it with other projects in the same sector to see whether this is an isolated move or part of a broader market trend. Pick a side in the comments: type 1 if you're bullish, 2 if you're bearish.
Just my personal observation, not investment advice.
📌 Binance is gradually resuming withdrawals: major assets such as BTC, ETH, and BNB are now available
$BTC , up 0.82% on the day.
Compare it with other projects in the same sector to see whether this is an isolated move or part of a broader market trend. Pick a side in the comments: type 1 if you're bullish, 2 if you're bearish.
Just my personal observation, not investment advice.
$BTC , up 0.82% on the day.
Compare it with other projects in the same sector to see whether this is an isolated move or part of a broader market trend. Pick a side in the comments: type 1 if you're bullish, 2 if you're bearish.
Just my personal observation, not investment advice.
2
·
--
🗂️ Data summary: $BTC 78227.81|1h +0.4%|4h +0.51%|24h +1.17%|Trading volume 469 million
Background: Bitcoin has recovered to above $78,000
Prices are relatively stable, and investors are still waiting on the sidelines.
What’s your take right now? Share it in one sentence.
#BTC
For reference only. Make your own decisions.
🗂️ Data summary: $BTC 78227.81|1h +0.4%|4h +0.51%|24h +1.17%|Trading volume 469 million
Background: Bitcoin has recovered to above $78,000
Prices are relatively stable, and investors are still waiting on the sidelines.
What’s your take right now? Share it in one sentence.
#BTC
For reference only. Make your own decisions.
Background: Bitcoin has recovered to above $78,000
Prices are relatively stable, and investors are still waiting on the sidelines.
What’s your take right now? Share it in one sentence.
#BTC
For reference only. Make your own decisions.
·
--
🐋 Traders watching the money flow: for $EVAA , this 4-hour MACD golden cross (above the zero line) is best viewed alongside two things:
· Futures open interest: If open interest rises after the golden cross, it mostly likely means new long positions are entering; if it falls, the rebound is mostly likely driven by shorts closing their positions.
· Funding rate: A sudden spike in the rate means longs are getting crowded, so watch out for a sharp reversal wick.
What kind of signal are you waiting for before making a move?
#EVAA
Just my personal opinion—don’t take it too seriously.
🐋 Traders watching the money flow: for $EVAA , this 4-hour MACD golden cross (above the zero line) is best viewed alongside two things:
· Futures open interest: If open interest rises after the golden cross, it mostly likely means new long positions are entering; if it falls, the rebound is mostly likely driven by shorts closing their positions.
· Funding rate: A sudden spike in the rate means longs are getting crowded, so watch out for a sharp reversal wick.
What kind of signal are you waiting for before making a move?
#EVAA
Just my personal opinion—don’t take it too seriously.
· Futures open interest: If open interest rises after the golden cross, it mostly likely means new long positions are entering; if it falls, the rebound is mostly likely driven by shorts closing their positions.
· Funding rate: A sudden spike in the rate means longs are getting crowded, so watch out for a sharp reversal wick.
What kind of signal are you waiting for before making a move?
#EVAA
Just my personal opinion—don’t take it too seriously.
·
--
$Niu Lai | Lost the 0.07 level | Current price: 0.06857 | 24h: +28.82%
I’ll treat this price level as the line between bulls and bears: reclaiming it would be bullish, while staying below it would be bearish.
Please do your own research before placing an order.
$Niu Lai | Lost the 0.07 level | Current price: 0.06857 | 24h: +28.82%
I’ll treat this price level as the line between bulls and bears: reclaiming it would be bullish, while staying below it would be bearish.
Please do your own research before placing an order.
I’ll treat this price level as the line between bulls and bears: reclaiming it would be bullish, while staying below it would be bearish.
Please do your own research before placing an order.
2
·
--
📰 Bitcoin miners’ holdings rose to 1.1941 million coins, marking the largest weekly increase in six weeks
$BTC is currently at 77846.25 (+0.73% over 24h). This is better suited to understanding what’s happening in the industry, with limited relevance to current market conditions.
I’m more interested in whether there will be any follow-up. This news flash is only the initial report; more details may emerge later.
#BTC
Stay level-headed and don’t get carried away.
📰 Bitcoin miners’ holdings rose to 1.1941 million coins, marking the largest weekly increase in six weeks
$BTC is currently at 77846.25 (+0.73% over 24h). This is better suited to understanding what’s happening in the industry, with limited relevance to current market conditions.
I’m more interested in whether there will be any follow-up. This news flash is only the initial report; more details may emerge later.
#BTC
Stay level-headed and don’t get carried away.
$BTC is currently at 77846.25 (+0.73% over 24h). This is better suited to understanding what’s happening in the industry, with limited relevance to current market conditions.
I’m more interested in whether there will be any follow-up. This news flash is only the initial report; more details may emerge later.
#BTC
Stay level-headed and don’t get carried away.
·
--
🐋 From a market-flow perspective: ETH has heavier near-term selling pressure, with $49.1554 million in sell orders on Binance perpetuals—$1.7016 million more than buy orders.
There’s nothing major in the news, but those who care about this direction may want to keep an eye on it. Whether capital is flowing into major coins or spreading to altcoins can reveal the market’s appetite.
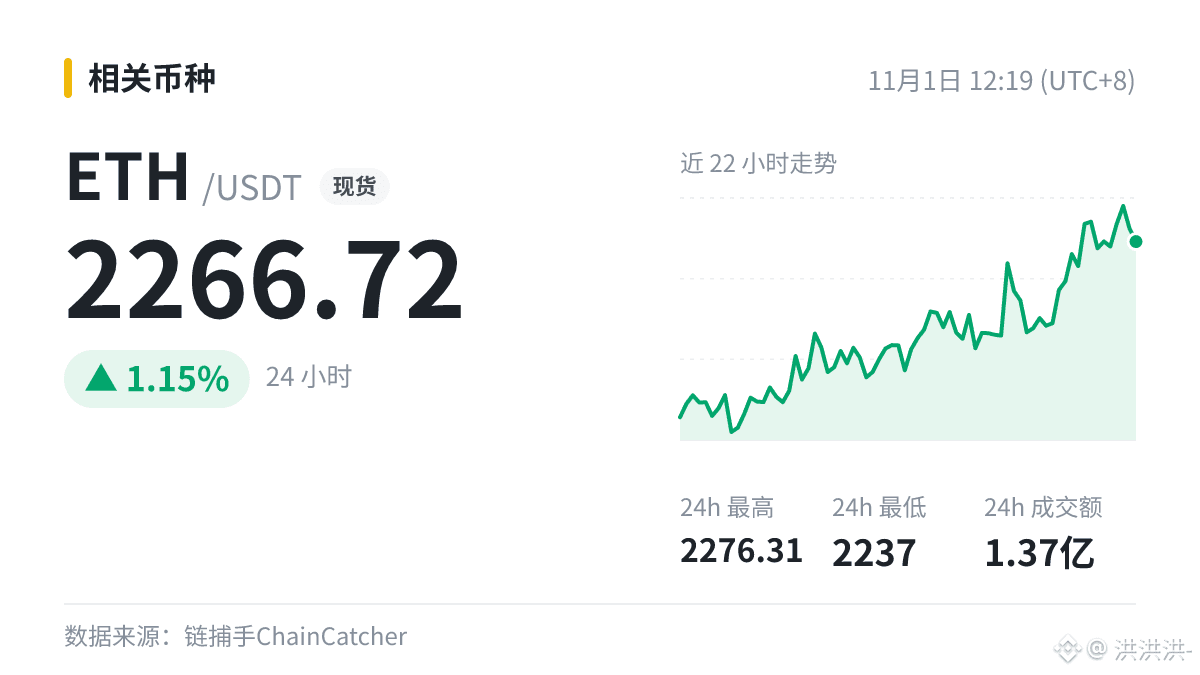
$ETH Intraday: +1.15%.
Be mindful of the risks and make your own decisions.
🐋 From a market-flow perspective: ETH has heavier near-term selling pressure, with $49.1554 million in sell orders on Binance perpetuals—$1.7016 million more than buy orders.
There’s nothing major in the news, but those who care about this direction may want to keep an eye on it. Whether capital is flowing into major coins or spreading to altcoins can reveal the market’s appetite.
$ETH Intraday: +1.15%.
Be mindful of the risks and make your own decisions.
There’s nothing major in the news, but those who care about this direction may want to keep an eye on it. Whether capital is flowing into major coins or spreading to altcoins can reveal the market’s appetite.
$ETH Intraday: +1.15%.
Be mindful of the risks and make your own decisions.
26
·
--
🐋 $AIN breaks through the 0.25 level.
Once it moves above that level, short sellers closing their positions can sometimes push the price even higher.
Capital is what really matters. No matter how lively the comments get, they can't compare with actual trading volume.
This is just an opinion; you are responsible for your own profits and losses.
🐋 $AIN breaks through the 0.25 level.
Once it moves above that level, short sellers closing their positions can sometimes push the price even higher.
Capital is what really matters. No matter how lively the comments get, they can't compare with actual trading volume.
This is just an opinion; you are responsible for your own profits and losses.
Once it moves above that level, short sellers closing their positions can sometimes push the price even higher.
Capital is what really matters. No matter how lively the comments get, they can't compare with actual trading volume.
This is just an opinion; you are responsible for your own profits and losses.
26
·
--
Binance: Has covered the $6 billion losses from this theft
The amount involved is one piece of information; the extent of the funds affected is more important. The original is more detailed; here, I’ve only excerpted a relatively important sentence.
$BNB
This is for informational purposes only and does not constitute investment advice.
Binance: Has covered the $6 billion losses from this theft
The amount involved is one piece of information; the extent of the funds affected is more important. The original is more detailed; here, I’ve only excerpted a relatively important sentence.
$BNB
This is for informational purposes only and does not constitute investment advice.
The amount involved is one piece of information; the extent of the funds affected is more important. The original is more detailed; here, I’ve only excerpted a relatively important sentence.
$BNB
This is for informational purposes only and does not constitute investment advice.
38
·
--
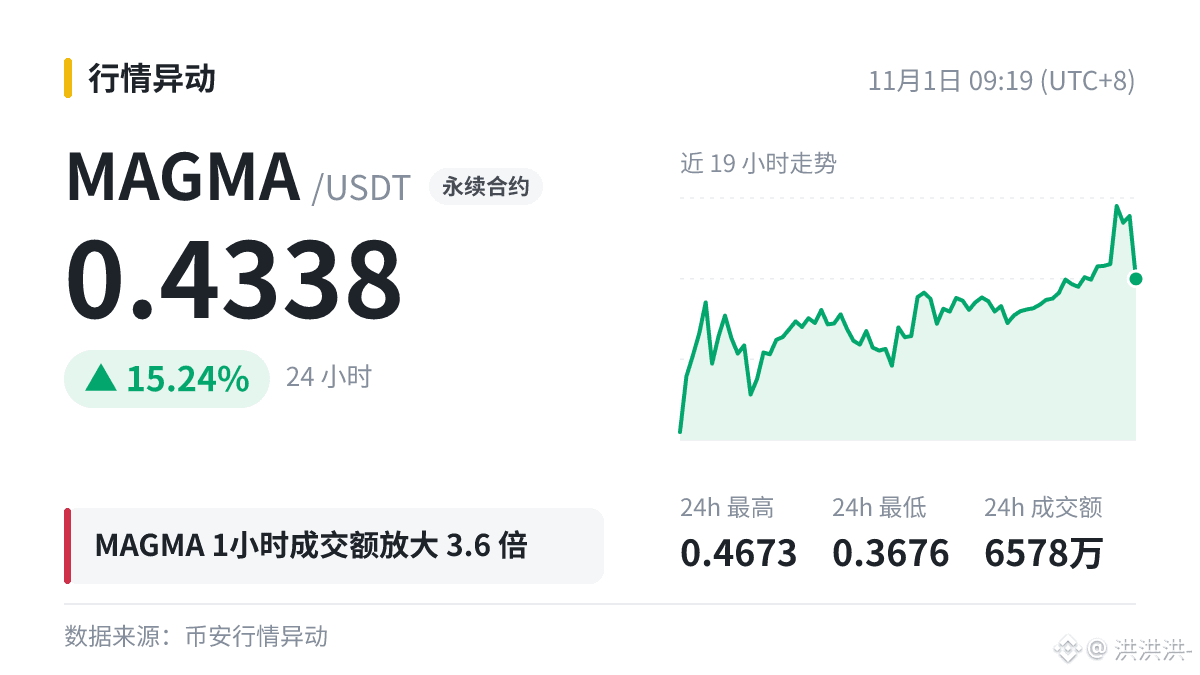
$MAGMA 1 The hourly trading volume was approximately $8.95 million, 3.6 times the previous average; the price fell 0.98% over the same period.
Let’s use this figure to break down what a surge in trading volume means.
Multiples are relative: for a coin that usually sees little trading, a several-fold increase may come from just one or two larger trades. The same multiple for a top coin is much rarer.
A rise on high volume is often interpreted as an advance backed by trading activity, while a drop on high volume is often seen as genuine selling pressure—but these are only rules of thumb.
Indicators can be inaccurate, so risk management must not be neglected: thinking in advance about what to do if you’re wrong matters more than trying to guess right.
#MAGMA
Stay calm and manage your position size.
$MAGMA 1 The hourly trading volume was approximately $8.95 million, 3.6 times the previous average; the price fell 0.98% over the same period.
Let’s use this figure to break down what a surge in trading volume means.
Multiples are relative: for a coin that usually sees little trading, a several-fold increase may come from just one or two larger trades. The same multiple for a top coin is much rarer.
A rise on high volume is often interpreted as an advance backed by trading activity, while a drop on high volume is often seen as genuine selling pressure—but these are only rules of thumb.
Indicators can be inaccurate, so risk management must not be neglected: thinking in advance about what to do if you’re wrong matters more than trying to guess right.
#MAGMA
Stay calm and manage your position size.
Let’s use this figure to break down what a surge in trading volume means.
Multiples are relative: for a coin that usually sees little trading, a several-fold increase may come from just one or two larger trades. The same multiple for a top coin is much rarer.
A rise on high volume is often interpreted as an advance backed by trading activity, while a drop on high volume is often seen as genuine selling pressure—but these are only rules of thumb.
Indicators can be inaccurate, so risk management must not be neglected: thinking in advance about what to do if you’re wrong matters more than trying to guess right.
#MAGMA
Stay calm and manage your position size.
52
·
--
$IDOL broke through the 0.018 level.
This level has capped the price more than once before. Whether it can truly break through this time depends on trading volume.
Wait for the candlestick to close before deciding; an intraday spike doesn't count.
This is not investment advice. You are responsible for any gains or losses.
$IDOL broke through the 0.018 level.
This level has capped the price more than once before. Whether it can truly break through this time depends on trading volume.
Wait for the candlestick to close before deciding; an intraday spike doesn't count.
This is not investment advice. You are responsible for any gains or losses.
This level has capped the price more than once before. Whether it can truly break through this time depends on trading volume.
Wait for the candlestick to close before deciding; an intraday spike doesn't count.
This is not investment advice. You are responsible for any gains or losses.
68
·
--
🐳 Where’s the money going?
“AI assistant now available for travel at this year’s CIIE” has been trending, and $WLD in the AI concept sector has climbed along with it.
Trending topics usually attract short-term capital: it comes in fast and leaves just as quickly. To see whether real money is coming in, watch two things: whether trading volume continues to rise over several hours (currently $19.89 million over 24h), and whether active buy orders increase noticeably.
#WLD
Just my personal observation, not a recommendation to buy or sell.
🐳 Where’s the money going?
“AI assistant now available for travel at this year’s CIIE” has been trending, and $WLD in the AI concept sector has climbed along with it.
Trending topics usually attract short-term capital: it comes in fast and leaves just as quickly. To see whether real money is coming in, watch two things: whether trading volume continues to rise over several hours (currently $19.89 million over 24h), and whether active buy orders increase noticeably.
#WLD
Just my personal observation, not a recommendation to buy or sell.
“AI assistant now available for travel at this year’s CIIE” has been trending, and $WLD in the AI concept sector has climbed along with it.
Trending topics usually attract short-term capital: it comes in fast and leaves just as quickly. To see whether real money is coming in, watch two things: whether trading volume continues to rise over several hours (currently $19.89 million over 24h), and whether active buy orders increase noticeably.
#WLD
Just my personal observation, not a recommendation to buy or sell.
2
·
--
First, a question: What makes Solana produce blocks so quickly?
Solana's base fee is 5,000 lamports per signature, half of which is burned and half goes to the validator; priority fees go entirely to the validator.
1 SOL equals 1 billion lamports, and fees are usually calculated in lamports.
When transferring SOL or tokens to a Solana address, make sure the selected network is Solana, and don't confuse it with other networks.
$SOL is Solana's native coin, while $BNSOL is a liquid staking token for SOL launched by Binance.
In highly volatile markets, risk management comes first.
First, a question: What makes Solana produce blocks so quickly?
Solana's base fee is 5,000 lamports per signature, half of which is burned and half goes to the validator; priority fees go entirely to the validator.
1 SOL equals 1 billion lamports, and fees are usually calculated in lamports.
When transferring SOL or tokens to a Solana address, make sure the selected network is Solana, and don't confuse it with other networks.
$SOL is Solana's native coin, while $BNSOL is a liquid staking token for SOL launched by Binance.
In highly volatile markets, risk management comes first.
Solana's base fee is 5,000 lamports per signature, half of which is burned and half goes to the validator; priority fees go entirely to the validator.
1 SOL equals 1 billion lamports, and fees are usually calculated in lamports.
When transferring SOL or tokens to a Solana address, make sure the selected network is Solana, and don't confuse it with other networks.
$SOL is Solana's native coin, while $BNSOL is a liquid staking token for SOL launched by Binance.
In highly volatile markets, risk management comes first.
2
·
--
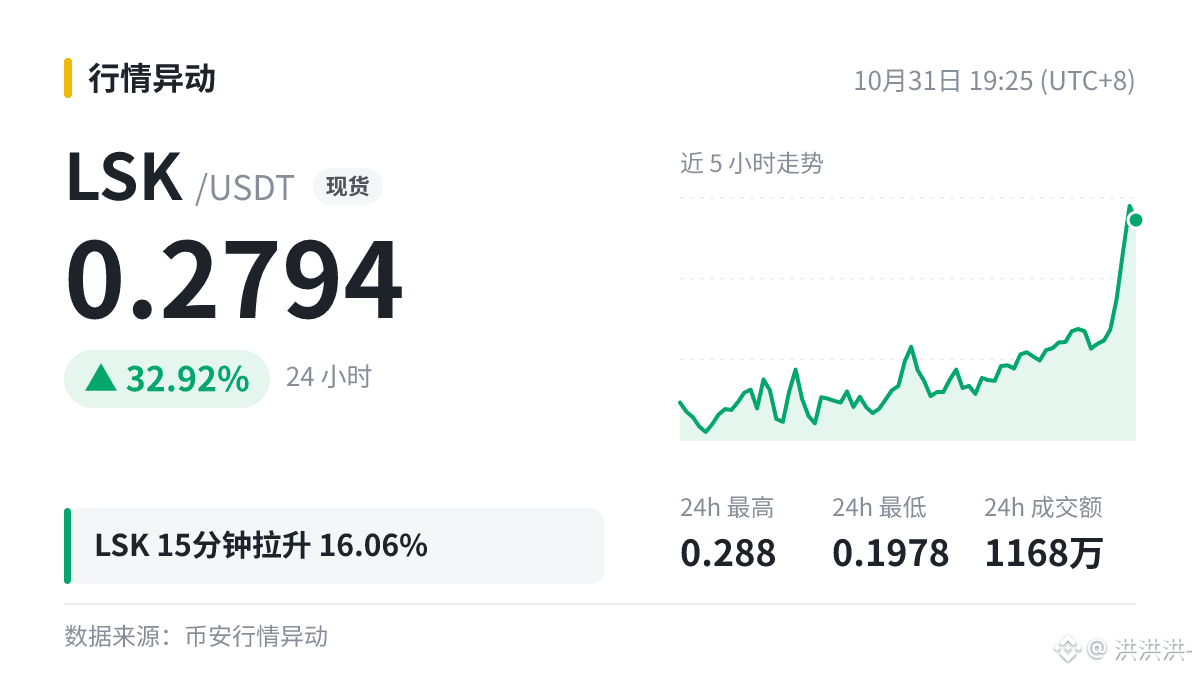
$LSK |15 minutes +16.06%|Current price 0.2794|24h +32.92%
Share your take in the comments.
#LSK
For reference only, not trading advice.
$LSK |15 minutes +16.06%|Current price 0.2794|24h +32.92%
Share your take in the comments.
#LSK
For reference only, not trading advice.
Share your take in the comments.
#LSK
For reference only, not trading advice.
3
Log in to explore more content
Join global crypto users on Binance Square
⚡️ Get latest and useful information about crypto.
💬 Trusted by the world’s largest crypto exchange.
👍 Discover real insights from verified creators.
Email / Phone number
Trending Topics
BinanceProcesses$4.65BWithdrawals
2,336 views
49 Discussing
Binance Processes $4.65 Billion in Withdrawals After Reopening, Net Outflow of $3.64 Billion Equals 2.1% of Its $171 Billion in Assets
Binance News
·25 Likes
·6.4k views
WithdrawalsBack: 15 networks live
4,093 views
98 Discussing
BinanceUpdatesProofofReservesAddresses
80,622 views
1,263 Discussing