
Luis Costa77
5k Posts

Luis Costa77
Report
Block User
SNR
11 Following
497 Followers
5.0K+ Liked
Posts
All
Quotes
Videos
·
--
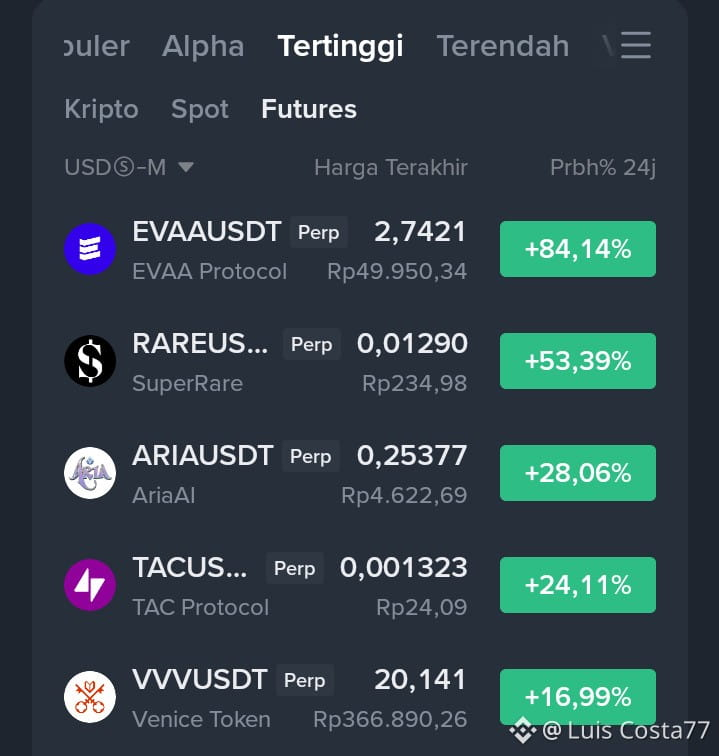
Top Gainers Futures - $EVAA Still the strongest, $RARE Still below the peak
$ARIA ready to chase!
Today's strongest gainers are still dominated by coins that have just been pumped. This isn't a broad-based market rally; it's a market that's picking and choosing which coins to pump.
#EVAAUSDT - Price 2,7421, up 84,14 percent
Still number one, and the strongest. The price has climbed back up near the peak at 2,8550 after a correction. #EVAA It's still strong, but it has failed to break through the peak twice now. Levels: Resistance 2,8550, Support 2,4631. Don't chase a Long at 2,7421; wait for a break above 2,8550 before joining in.
{future}(EVAAUSDT)
#RAREUSDT - Price 0,01290, up 53,39 percent
Still up a lot, but it has fallen from the peak at 0,01570. That means the initial pump is starting to be distributed. It's now correcting below the peak. #RARE Levels: Resistance 0,01570, Support 0,01280. Don't chase a Long here; wait for it to return to 0,01280 and bounce—that's a better entry.
{future}(RAREUSDT)
#ARIAUSDT - Price 0,25377, up 28,06 percent
The healthiest rise of the bunch. After breaking out of the range, it's now testing the peak at 0,27200. It hasn't broken through yet, but it hasn't been dumped either. Levels: Resistance 0,27200, Support 0,23171. Wait for a break above 0,27200 before going Long.
{future}(ARIAUSDT)
Top Gainers Futures - $EVAA Still the strongest, $RARE Still below the peak
$ARIA ready to chase!
Today's strongest gainers are still dominated by coins that have just been pumped. This isn't a broad-based market rally; it's a market that's picking and choosing which coins to pump.
#EVAAUSDT - Price 2,7421, up 84,14 percent
Still number one, and the strongest. The price has climbed back up near the peak at 2,8550 after a correction. #EVAA It's still strong, but it has failed to break through the peak twice now. Levels: Resistance 2,8550, Support 2,4631. Don't chase a Long at 2,7421; wait for a break above 2,8550 before joining in.
#RAREUSDT - Price 0,01290, up 53,39 percent
Still up a lot, but it has fallen from the peak at 0,01570. That means the initial pump is starting to be distributed. It's now correcting below the peak. #RARE Levels: Resistance 0,01570, Support 0,01280. Don't chase a Long here; wait for it to return to 0,01280 and bounce—that's a better entry.
#ARIAUSDT - Price 0,25377, up 28,06 percent
The healthiest rise of the bunch. After breaking out of the range, it's now testing the peak at 0,27200. It hasn't broken through yet, but it hasn't been dumped either. Levels: Resistance 0,27200, Support 0,23171. Wait for a break above 0,27200 before going Long.
$ARIA ready to chase!
Today's strongest gainers are still dominated by coins that have just been pumped. This isn't a broad-based market rally; it's a market that's picking and choosing which coins to pump.
#EVAAUSDT - Price 2,7421, up 84,14 percent
Still number one, and the strongest. The price has climbed back up near the peak at 2,8550 after a correction. #EVAA It's still strong, but it has failed to break through the peak twice now. Levels: Resistance 2,8550, Support 2,4631. Don't chase a Long at 2,7421; wait for a break above 2,8550 before joining in.
#RAREUSDT - Price 0,01290, up 53,39 percent
Still up a lot, but it has fallen from the peak at 0,01570. That means the initial pump is starting to be distributed. It's now correcting below the peak. #RARE Levels: Resistance 0,01570, Support 0,01280. Don't chase a Long here; wait for it to return to 0,01280 and bounce—that's a better entry.
#ARIAUSDT - Price 0,25377, up 28,06 percent
The healthiest rise of the bunch. After breaking out of the range, it's now testing the peak at 0,27200. It hasn't broken through yet, but it hasn't been dumped either. Levels: Resistance 0,27200, Support 0,23171. Wait for a break above 0,27200 before going Long.
1
2
1.4k
·
--
$ZEC ZECUSDT - Bids Are Still Winning, But Sell Walls Are Piling Up Above #ZEC.每日智能策略
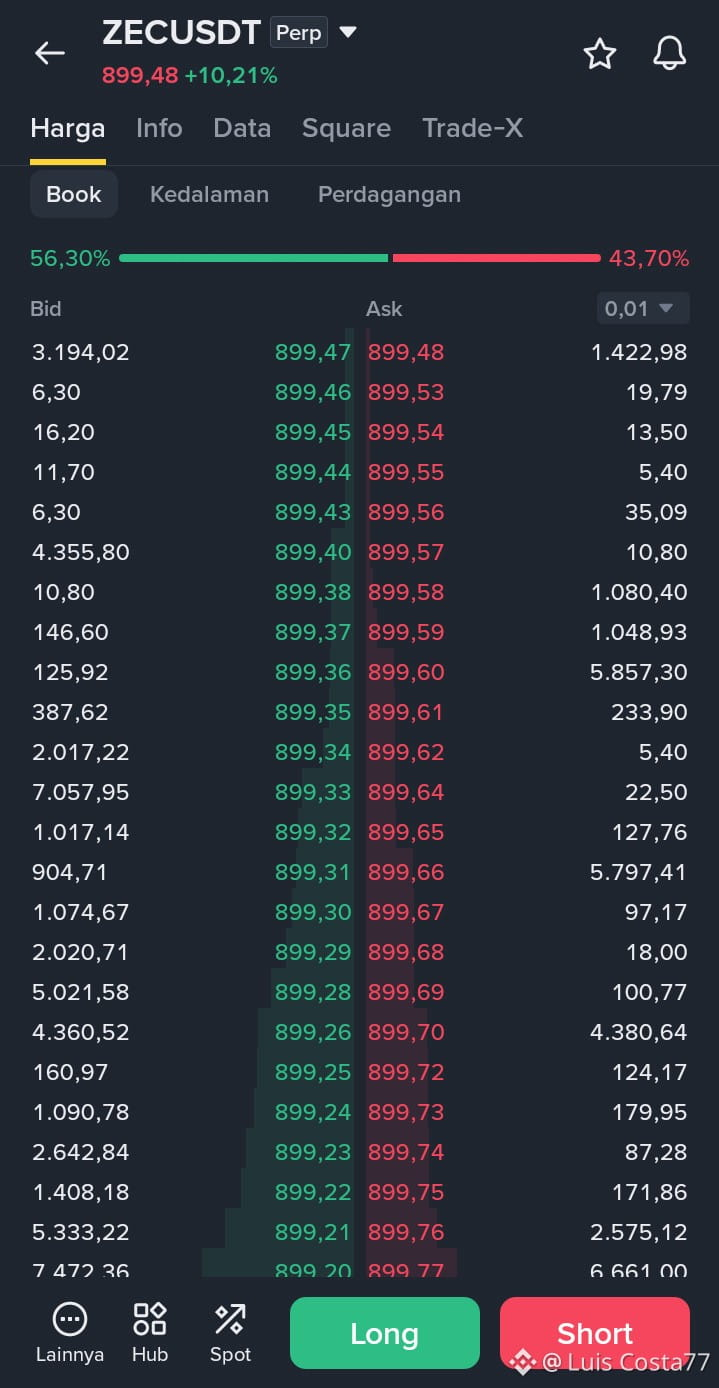
The current price is 899.48, up 10.21 percent.
Order Book: Bids 56.30 percent, asks 43.70 percent. Buyers are still winning, by about 12 percent. #ZECUSDT This means buyers are still in control, but not as dominant as during the initial pump. The market is still busy, not quiet.
#ZEC.24小时交易策略
Bids - Buy Walls: The biggest walls are at 899.33, totaling 7,057.95, and at 899.20, totaling 7,472.36. Above those, there are also walls at 899.21 totaling 5,333.22, at 899.28 totaling 5,021.58, and at 899.26 totaling 4,360.52. This means there’s a thick, layered buy floor from 899.20 to 899.33. If the price drops, there’s strong support there.
$ZEC
Asks - Sell Walls: Sell walls are more concentrated above. At 899.60 there are 5,857.30, at 899.66 there are 5,797.41, at 899.70 there are 4,380.64, at 899.77 there are 6,661.00, and at 899.76 there are 2,575.12. This means the sell walls from 899.60 to 899.77 are layered and thicker than the buy walls. It’ll be hard for the price to rise unless a large amount of money eats through those walls. #ZEC.24小时交易策略
The spread is very tight: bids at 899.47 and asks at 899.48. Liquidity is still solid, making it easy to get in and out quickly.
Levels $ZEC
Resistance 899.60 - 899.77
Support 899.33 - 899.20
#ZECUSDT Don’t chase a Long at 899.48. There are layered sell walls just above. Wait for a break above 899.77 and for the price to hold above it before joining in, or wait for a pullback to 899.20 and a bounce. If 899.20 breaks, don’t force a Long.
{future}(ZECUSDT)
$ZEC ZECUSDT - Bids Are Still Winning, But Sell Walls Are Piling Up Above #ZEC.每日智能策略
The current price is 899.48, up 10.21 percent.
Order Book: Bids 56.30 percent, asks 43.70 percent. Buyers are still winning, by about 12 percent. #ZECUSDT This means buyers are still in control, but not as dominant as during the initial pump. The market is still busy, not quiet.
#ZEC.24小时交易策略
Bids - Buy Walls: The biggest walls are at 899.33, totaling 7,057.95, and at 899.20, totaling 7,472.36. Above those, there are also walls at 899.21 totaling 5,333.22, at 899.28 totaling 5,021.58, and at 899.26 totaling 4,360.52. This means there’s a thick, layered buy floor from 899.20 to 899.33. If the price drops, there’s strong support there.
$ZEC
Asks - Sell Walls: Sell walls are more concentrated above. At 899.60 there are 5,857.30, at 899.66 there are 5,797.41, at 899.70 there are 4,380.64, at 899.77 there are 6,661.00, and at 899.76 there are 2,575.12. This means the sell walls from 899.60 to 899.77 are layered and thicker than the buy walls. It’ll be hard for the price to rise unless a large amount of money eats through those walls. #ZEC.24小时交易策略
The spread is very tight: bids at 899.47 and asks at 899.48. Liquidity is still solid, making it easy to get in and out quickly.
Levels $ZEC
Resistance 899.60 - 899.77
Support 899.33 - 899.20
#ZECUSDT Don’t chase a Long at 899.48. There are layered sell walls just above. Wait for a break above 899.77 and for the price to hold above it before joining in, or wait for a pullback to 899.20 and a bounce. If 899.20 breaks, don’t force a Long.
The current price is 899.48, up 10.21 percent.
Order Book: Bids 56.30 percent, asks 43.70 percent. Buyers are still winning, by about 12 percent. #ZECUSDT This means buyers are still in control, but not as dominant as during the initial pump. The market is still busy, not quiet.
#ZEC.24小时交易策略
Bids - Buy Walls: The biggest walls are at 899.33, totaling 7,057.95, and at 899.20, totaling 7,472.36. Above those, there are also walls at 899.21 totaling 5,333.22, at 899.28 totaling 5,021.58, and at 899.26 totaling 4,360.52. This means there’s a thick, layered buy floor from 899.20 to 899.33. If the price drops, there’s strong support there.
$ZEC
Asks - Sell Walls: Sell walls are more concentrated above. At 899.60 there are 5,857.30, at 899.66 there are 5,797.41, at 899.70 there are 4,380.64, at 899.77 there are 6,661.00, and at 899.76 there are 2,575.12. This means the sell walls from 899.60 to 899.77 are layered and thicker than the buy walls. It’ll be hard for the price to rise unless a large amount of money eats through those walls. #ZEC.24小时交易策略
The spread is very tight: bids at 899.47 and asks at 899.48. Liquidity is still solid, making it easy to get in and out quickly.
Levels $ZEC
Resistance 899.60 - 899.77
Support 899.33 - 899.20
#ZECUSDT Don’t chase a Long at 899.48. There are layered sell walls just above. Wait for a break above 899.77 and for the price to hold above it before joining in, or wait for a pullback to 899.20 and a bounce. If 899.20 breaks, don’t force a Long.
1
475
·
--
$ETH ETHUSDT perp - Open Interest Rises Again, Whales Get More Long #ETH大涨
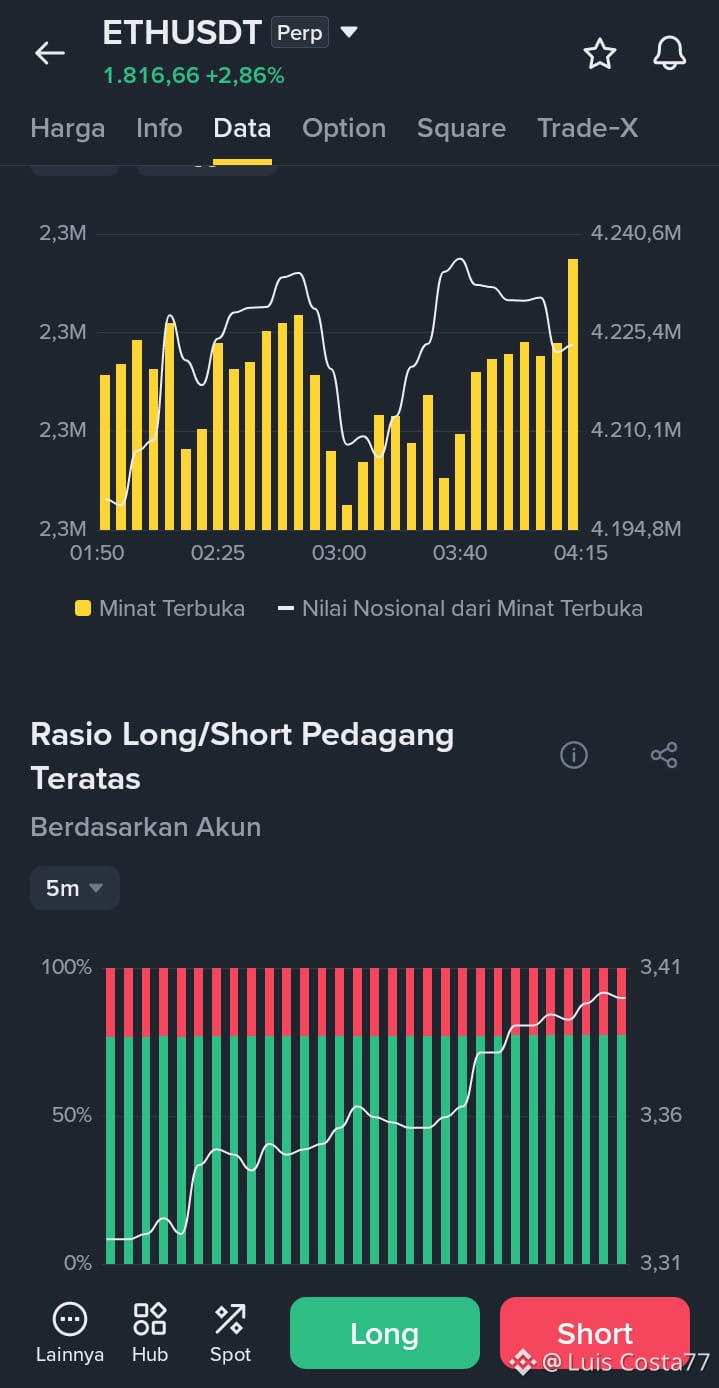
Current price: 1,816.66, up 2.86 percent.
Top Chart #ETHUSDT - Open Interest: Notional value briefly rose from 4,194.8M to 4,240.6M, then fell back to around 4,225.4M. Open interest bars fluctuated, dropped sharply for a while, then rose again, with the latest bar being the highest. This means money briefly flowed out, then came pouring back in toward the end. The price is rising alongside open interest, which is healthy—not just an empty pump.
Bottom Chart #ETHUSDT - Top Trader Ratio: Longs are around 75 percent, while Shorts are only 25 percent. The ratio has climbed steadily from 3.31 to 3.41. This means big traders are growing more confident in Longs; nobody is bailing. The rise is gradual, so this is accumulation, not sudden euphoria.
Levels $ETH
Risk: Longs are already piling up, so a slight correction is possible if the price fails to rise
Ratio Support: 3.31. If this breaks, whales may start reducing their Long positions
Open Interest Support: 4,194.8M. If this breaks, money may start flowing out
#ETH大涨 Don't chase Longs at 1,816.66. Wait for open interest to rise again along with the price before joining in, or wait for the ratio to hold above 3.36. If open interest falls while the price is still rising, don't force a Long.
{future}(ETHUSDT)
$ETH ETHUSDT perp - Open Interest Rises Again, Whales Get More Long #ETH大涨
Current price: 1,816.66, up 2.86 percent.
Top Chart #ETHUSDT - Open Interest: Notional value briefly rose from 4,194.8M to 4,240.6M, then fell back to around 4,225.4M. Open interest bars fluctuated, dropped sharply for a while, then rose again, with the latest bar being the highest. This means money briefly flowed out, then came pouring back in toward the end. The price is rising alongside open interest, which is healthy—not just an empty pump.
Bottom Chart #ETHUSDT - Top Trader Ratio: Longs are around 75 percent, while Shorts are only 25 percent. The ratio has climbed steadily from 3.31 to 3.41. This means big traders are growing more confident in Longs; nobody is bailing. The rise is gradual, so this is accumulation, not sudden euphoria.
Levels $ETH
Risk: Longs are already piling up, so a slight correction is possible if the price fails to rise
Ratio Support: 3.31. If this breaks, whales may start reducing their Long positions
Open Interest Support: 4,194.8M. If this breaks, money may start flowing out
#ETH大涨 Don't chase Longs at 1,816.66. Wait for open interest to rise again along with the price before joining in, or wait for the ratio to hold above 3.36. If open interest falls while the price is still rising, don't force a Long.
Current price: 1,816.66, up 2.86 percent.
Top Chart #ETHUSDT - Open Interest: Notional value briefly rose from 4,194.8M to 4,240.6M, then fell back to around 4,225.4M. Open interest bars fluctuated, dropped sharply for a while, then rose again, with the latest bar being the highest. This means money briefly flowed out, then came pouring back in toward the end. The price is rising alongside open interest, which is healthy—not just an empty pump.
Bottom Chart #ETHUSDT - Top Trader Ratio: Longs are around 75 percent, while Shorts are only 25 percent. The ratio has climbed steadily from 3.31 to 3.41. This means big traders are growing more confident in Longs; nobody is bailing. The rise is gradual, so this is accumulation, not sudden euphoria.
Levels $ETH
Risk: Longs are already piling up, so a slight correction is possible if the price fails to rise
Ratio Support: 3.31. If this breaks, whales may start reducing their Long positions
Open Interest Support: 4,194.8M. If this breaks, money may start flowing out
#ETH大涨 Don't chase Longs at 1,816.66. Wait for open interest to rise again along with the price before joining in, or wait for the ratio to hold above 3.36. If open interest falls while the price is still rising, don't force a Long.
1
61
·
--
$BTC BTCUSDT - Retail Traders Are Going Long, but Whales Are Cutting Back on Longs #BTC走势分析
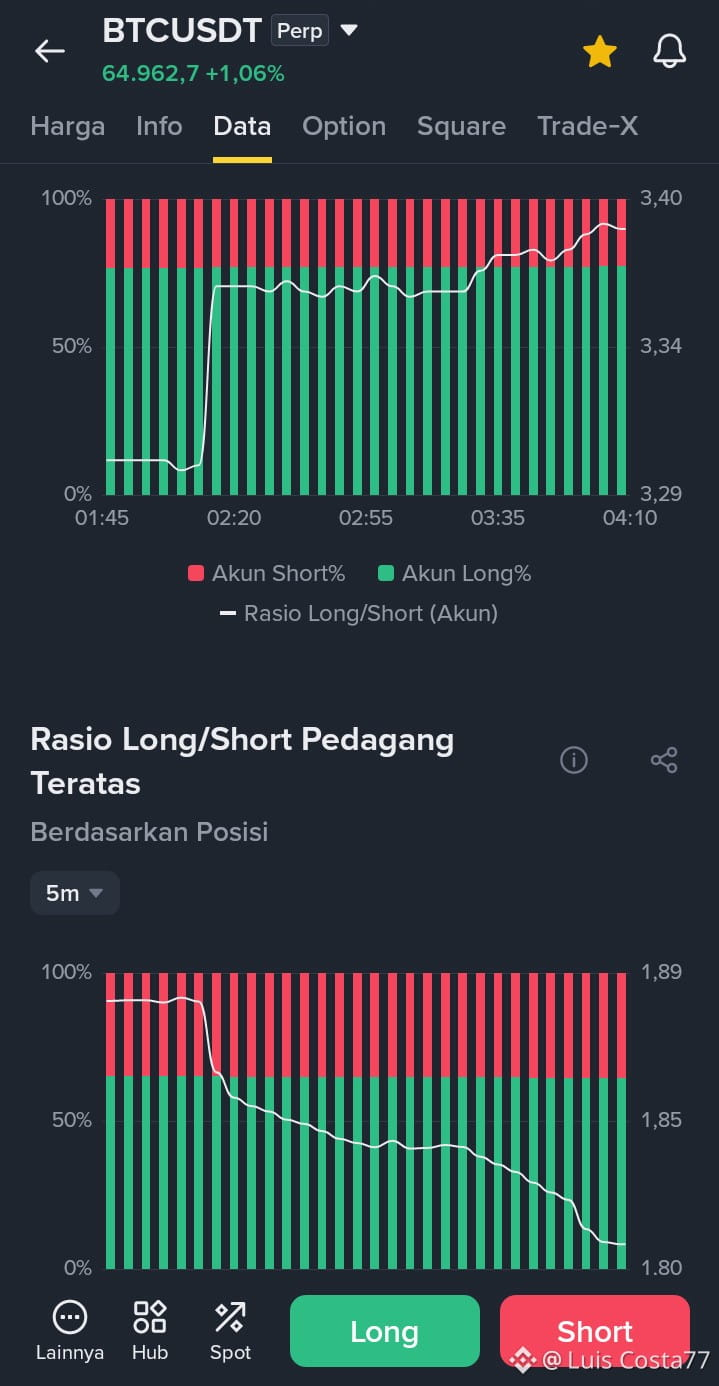
Current price: 64,962.7, up 1.06 percent.
Top Chart #BTC走势分析 - Account Ratio: Longs were already piling up at the start, with Long at around 70 percent and Short at just 30 percent. The ratio held steady at 3.29. Then it climbed quickly to 3.40 and stayed above that level. This means retail accounts are getting more confident about going Long and chasing the rising price. Longs are overcrowded.
#BTC突破7万大关
Bottom Chart - Top Trader Ratio: A different story here. At the start, Long was around 60 percent and Short 40 percent. The ratio held steady at 1.89. Then it gradually but steadily fell to 1.80. This means large traders are starting to cut back on Longs, rather than joining the retail euphoria. They may be taking profits or starting to put on small Short positions.
Levels $BTC
Risk: High, retail Long positions are overcrowded
Top Ratio Support: 3.29. If it breaks below this level, retail traders may start bailing
Bottom Ratio Support: 1.80. If it breaks below this level, whales will cut back on Longs even more
$BTC Don't chase Long at 64,962.7. Retail traders have already piled into Longs at 3.40, while whales are starting to exit. This is vulnerable to a sharp drop that flushes out overcrowded Long positions. Wait for the top ratio to fall and stabilize before considering a Long. If the bottom ratio breaks below 1.80, don't force a Long.
{future}(BTCUSDT)
$BTC BTCUSDT - Retail Traders Are Going Long, but Whales Are Cutting Back on Longs #BTC走势分析
Current price: 64,962.7, up 1.06 percent.
Top Chart #BTC走势分析 - Account Ratio: Longs were already piling up at the start, with Long at around 70 percent and Short at just 30 percent. The ratio held steady at 3.29. Then it climbed quickly to 3.40 and stayed above that level. This means retail accounts are getting more confident about going Long and chasing the rising price. Longs are overcrowded.
#BTC突破7万大关
Bottom Chart - Top Trader Ratio: A different story here. At the start, Long was around 60 percent and Short 40 percent. The ratio held steady at 1.89. Then it gradually but steadily fell to 1.80. This means large traders are starting to cut back on Longs, rather than joining the retail euphoria. They may be taking profits or starting to put on small Short positions.
Levels $BTC
Risk: High, retail Long positions are overcrowded
Top Ratio Support: 3.29. If it breaks below this level, retail traders may start bailing
Bottom Ratio Support: 1.80. If it breaks below this level, whales will cut back on Longs even more
$BTC Don't chase Long at 64,962.7. Retail traders have already piled into Longs at 3.40, while whales are starting to exit. This is vulnerable to a sharp drop that flushes out overcrowded Long positions. Wait for the top ratio to fall and stabilize before considering a Long. If the bottom ratio breaks below 1.80, don't force a Long.
Current price: 64,962.7, up 1.06 percent.
Top Chart #BTC走势分析 - Account Ratio: Longs were already piling up at the start, with Long at around 70 percent and Short at just 30 percent. The ratio held steady at 3.29. Then it climbed quickly to 3.40 and stayed above that level. This means retail accounts are getting more confident about going Long and chasing the rising price. Longs are overcrowded.
#BTC突破7万大关
Bottom Chart - Top Trader Ratio: A different story here. At the start, Long was around 60 percent and Short 40 percent. The ratio held steady at 1.89. Then it gradually but steadily fell to 1.80. This means large traders are starting to cut back on Longs, rather than joining the retail euphoria. They may be taking profits or starting to put on small Short positions.
Levels $BTC
Risk: High, retail Long positions are overcrowded
Top Ratio Support: 3.29. If it breaks below this level, retail traders may start bailing
Bottom Ratio Support: 1.80. If it breaks below this level, whales will cut back on Longs even more
$BTC Don't chase Long at 64,962.7. Retail traders have already piled into Longs at 3.40, while whales are starting to exit. This is vulnerable to a sharp drop that flushes out overcrowded Long positions. Wait for the top ratio to fall and stabilize before considering a Long. If the bottom ratio breaks below 1.80, don't force a Long.
1
138
·
--
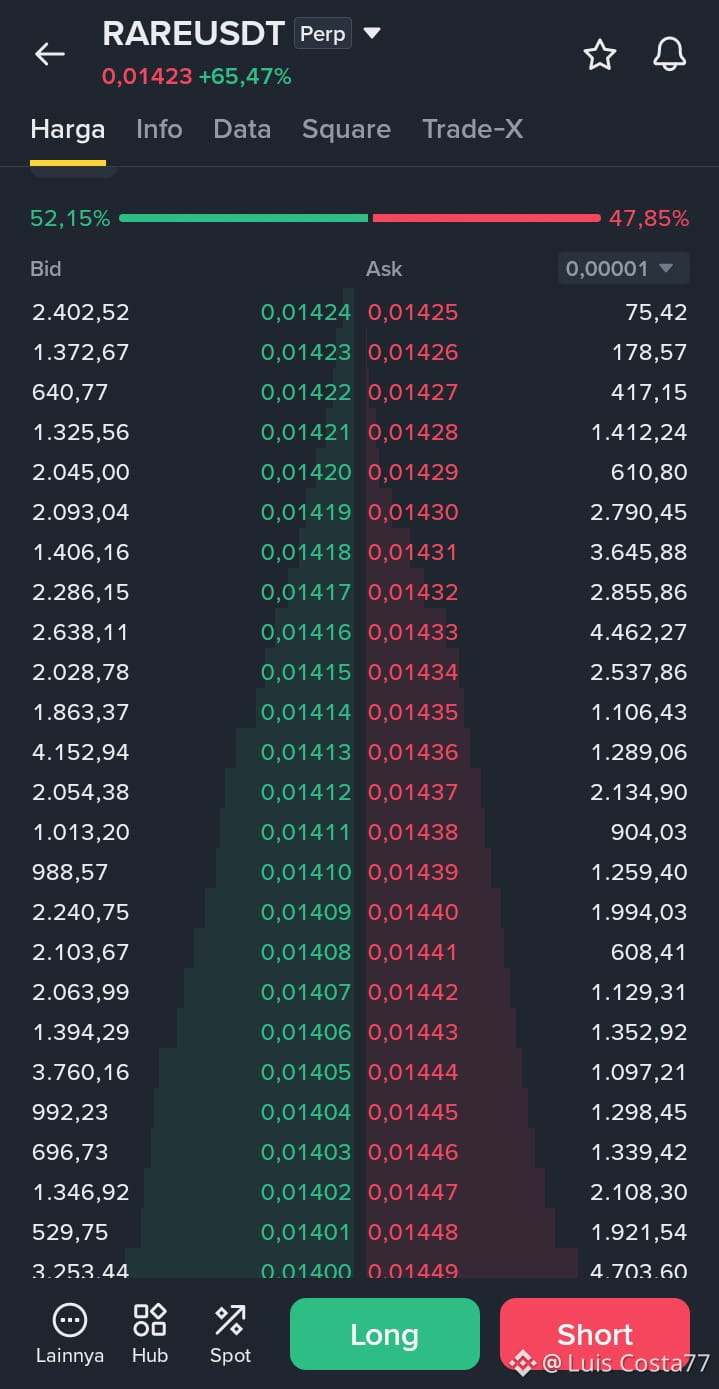
$RARE RAREUSDT perp - Bids Still Barely Ahead, But Sell Walls Are Piled Up Above #RARE/USDT
The current price is 0.01423, up 65.47 percent.
Order Book: Bids 52.15 percent, Asks 47.85 percent. Buyers are still narrowly ahead, but not by much. The gap is only 4 percent, meaning the market is balanced—not scrambling to buy like during the initial pump.
#RARE/USDT
Bid - Buy Walls: The biggest wall is at 0.01413, totaling 4,152.94. Below that, there are more at 0.01405 totaling 3,760.16, and at 0.01400 totaling 3,253.44. This means there is support at those three levels if the price drops. But the walls aren't all that thick; they could easily break if sellers pile in.
#RARE/USDT
Ask - Sell Walls: Sell walls are more heavily stacked above. At 0.01430 there are 2,790.45, at 0.01431 there are 3,645.88, at 0.01433 there are 4,462.27, and the biggest is at 0.01449, totaling 4,703.60. This means there are layers of sell walls from 0.01430 to 0.01449. The price will struggle to rise unless a lot of money comes in to absorb those walls.
The spread is very tight: Bid 0.01424 and Ask 0.01425. Liquidity is still good, making it easy to get in and out quickly.
Levels:$RARE
Resistance 0.01430 - 0.01449
Support 0.01413 - 0.01400
Don't chase a Long at 0.01423. There's a layer of sell walls right above. Wait for a break above 0.01449 and for the price to hold above it before joining in, or wait for a pullback to 0.01400 and a bounce. If 0.01400 breaks, don't force a Long.
{future}(RAREUSDT)
$RARE RAREUSDT perp - Bids Still Barely Ahead, But Sell Walls Are Piled Up Above #RARE/USDT
The current price is 0.01423, up 65.47 percent.
Order Book: Bids 52.15 percent, Asks 47.85 percent. Buyers are still narrowly ahead, but not by much. The gap is only 4 percent, meaning the market is balanced—not scrambling to buy like during the initial pump.
#RARE/USDT
Bid - Buy Walls: The biggest wall is at 0.01413, totaling 4,152.94. Below that, there are more at 0.01405 totaling 3,760.16, and at 0.01400 totaling 3,253.44. This means there is support at those three levels if the price drops. But the walls aren't all that thick; they could easily break if sellers pile in.
#RARE/USDT
Ask - Sell Walls: Sell walls are more heavily stacked above. At 0.01430 there are 2,790.45, at 0.01431 there are 3,645.88, at 0.01433 there are 4,462.27, and the biggest is at 0.01449, totaling 4,703.60. This means there are layers of sell walls from 0.01430 to 0.01449. The price will struggle to rise unless a lot of money comes in to absorb those walls.
The spread is very tight: Bid 0.01424 and Ask 0.01425. Liquidity is still good, making it easy to get in and out quickly.
Levels:$RARE
Resistance 0.01430 - 0.01449
Support 0.01413 - 0.01400
Don't chase a Long at 0.01423. There's a layer of sell walls right above. Wait for a break above 0.01449 and for the price to hold above it before joining in, or wait for a pullback to 0.01400 and a bounce. If 0.01400 breaks, don't force a Long.
The current price is 0.01423, up 65.47 percent.
Order Book: Bids 52.15 percent, Asks 47.85 percent. Buyers are still narrowly ahead, but not by much. The gap is only 4 percent, meaning the market is balanced—not scrambling to buy like during the initial pump.
#RARE/USDT
Bid - Buy Walls: The biggest wall is at 0.01413, totaling 4,152.94. Below that, there are more at 0.01405 totaling 3,760.16, and at 0.01400 totaling 3,253.44. This means there is support at those three levels if the price drops. But the walls aren't all that thick; they could easily break if sellers pile in.
#RARE/USDT
Ask - Sell Walls: Sell walls are more heavily stacked above. At 0.01430 there are 2,790.45, at 0.01431 there are 3,645.88, at 0.01433 there are 4,462.27, and the biggest is at 0.01449, totaling 4,703.60. This means there are layers of sell walls from 0.01430 to 0.01449. The price will struggle to rise unless a lot of money comes in to absorb those walls.
The spread is very tight: Bid 0.01424 and Ask 0.01425. Liquidity is still good, making it easy to get in and out quickly.
Levels:$RARE
Resistance 0.01430 - 0.01449
Support 0.01413 - 0.01400
Don't chase a Long at 0.01423. There's a layer of sell walls right above. Wait for a break above 0.01449 and for the price to hold above it before joining in, or wait for a pullback to 0.01400 and a bounce. If 0.01400 breaks, don't force a Long.
1
478
·
--
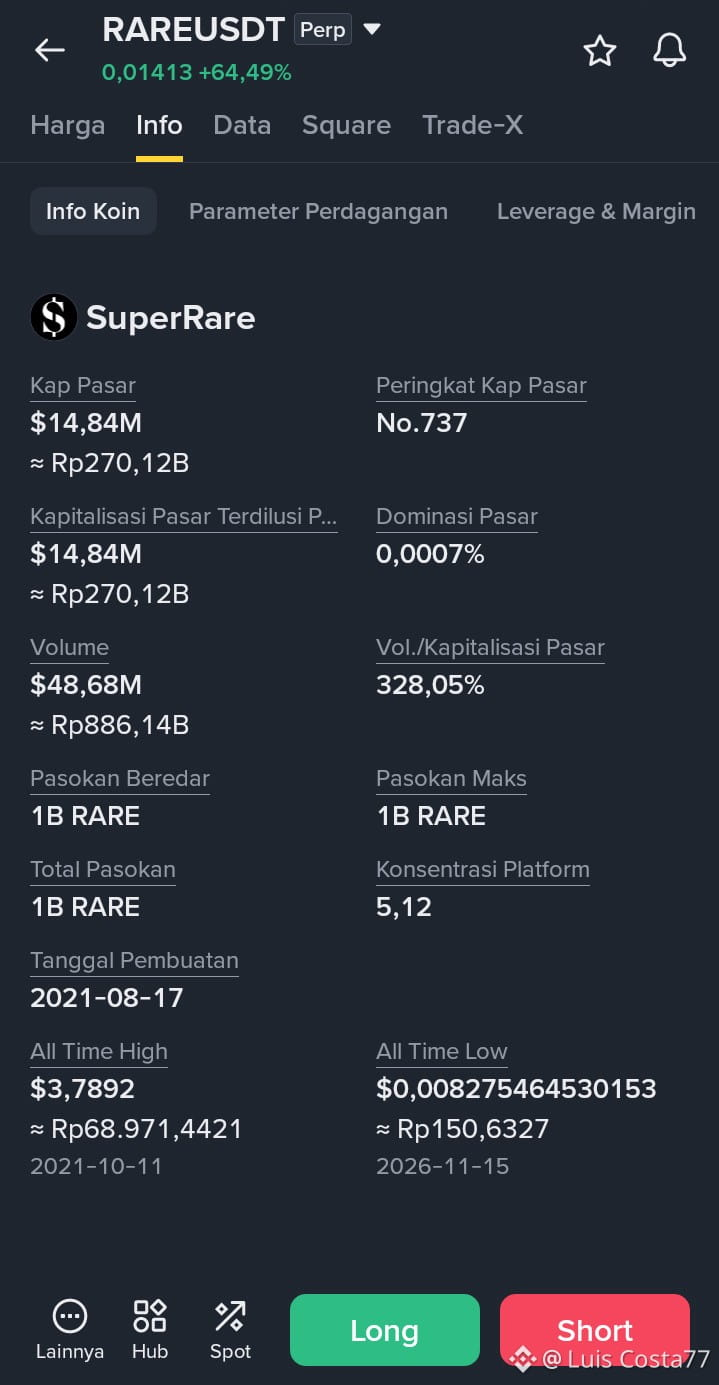
$RARE RAREUSDT - Small Market Cap, Volume 3x Higher
Current price: $0.01413, up 64.49%.
Coin Info - SuperRare: Market cap is only $14.84M, ranked No. 737. Market dominance is only 0.0007%. This is a very small coin, so it can easily be pumped up or dumped.
Volume is $48.68M, with a volume-to-market-cap ratio of 328.05%. That means today's volume is already 3 times its total market cap. This isn't healthy volume; it's pump volume. Money is moving very fast in a short time.
Circulating Supply: 1B RARE, Max Supply: 1B RARE, Total Supply: 1B RARE. That means all the supply is already circulating, with no new coins left to hold the price back. Price movements are driven purely by market buying and selling.
All-Time High: $3.7892, All-Time Low: $0.00827. The current price of $0.01413 is still very far from its ATH, down around 99.6% from the peak. But it's already up around 70% from the ATL, which it hit just yesterday.
Levels:
Risk: Very high—small market cap plus massive volume
Fundamental Support: None; price action is purely speculative
Don't chase a Long at $0.01413 just because it's up 64%. A coin this small can be dumped at any time once the volume dries up. Wait for volume to drop and the price to stabilize before getting in. If volume is still this huge but the price stops rising, don't force a Long.
{future}(RAREUSDT)
$RARE RAREUSDT - Small Market Cap, Volume 3x Higher
Current price: $0.01413, up 64.49%.
Coin Info - SuperRare: Market cap is only $14.84M, ranked No. 737. Market dominance is only 0.0007%. This is a very small coin, so it can easily be pumped up or dumped.
Volume is $48.68M, with a volume-to-market-cap ratio of 328.05%. That means today's volume is already 3 times its total market cap. This isn't healthy volume; it's pump volume. Money is moving very fast in a short time.
Circulating Supply: 1B RARE, Max Supply: 1B RARE, Total Supply: 1B RARE. That means all the supply is already circulating, with no new coins left to hold the price back. Price movements are driven purely by market buying and selling.
All-Time High: $3.7892, All-Time Low: $0.00827. The current price of $0.01413 is still very far from its ATH, down around 99.6% from the peak. But it's already up around 70% from the ATL, which it hit just yesterday.
Levels:
Risk: Very high—small market cap plus massive volume
Fundamental Support: None; price action is purely speculative
Don't chase a Long at $0.01413 just because it's up 64%. A coin this small can be dumped at any time once the volume dries up. Wait for volume to drop and the price to stabilize before getting in. If volume is still this huge but the price stops rising, don't force a Long.
Current price: $0.01413, up 64.49%.
Coin Info - SuperRare: Market cap is only $14.84M, ranked No. 737. Market dominance is only 0.0007%. This is a very small coin, so it can easily be pumped up or dumped.
Volume is $48.68M, with a volume-to-market-cap ratio of 328.05%. That means today's volume is already 3 times its total market cap. This isn't healthy volume; it's pump volume. Money is moving very fast in a short time.
Circulating Supply: 1B RARE, Max Supply: 1B RARE, Total Supply: 1B RARE. That means all the supply is already circulating, with no new coins left to hold the price back. Price movements are driven purely by market buying and selling.
All-Time High: $3.7892, All-Time Low: $0.00827. The current price of $0.01413 is still very far from its ATH, down around 99.6% from the peak. But it's already up around 70% from the ATL, which it hit just yesterday.
Levels:
Risk: Very high—small market cap plus massive volume
Fundamental Support: None; price action is purely speculative
Don't chase a Long at $0.01413 just because it's up 64%. A coin this small can be dumped at any time once the volume dries up. Wait for volume to drop and the price to stabilize before getting in. If volume is still this huge but the price stops rising, don't force a Long.
1
505
·
--
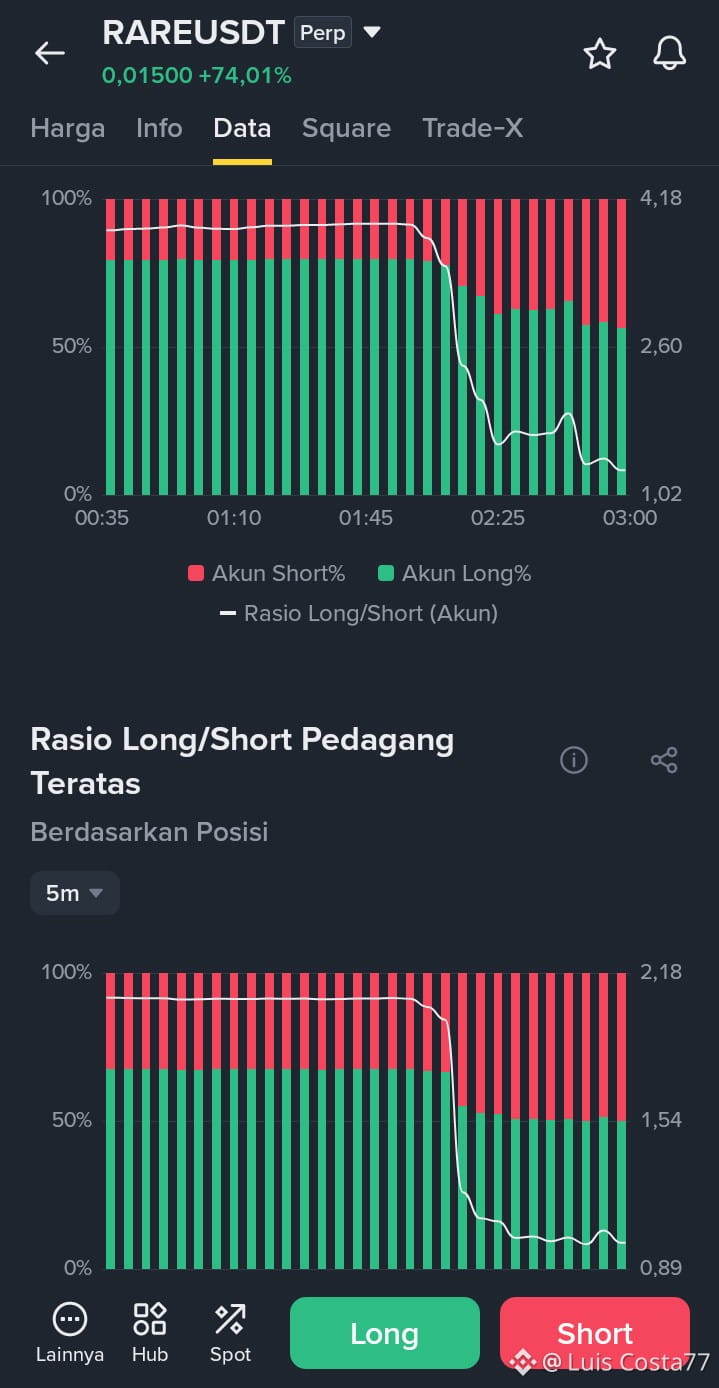
$RARE RAREUSDT - Retail Is Starting to Flee, Whales Are Strong #RAREBULLISH
Price $RARE now is 0.01500, up 74.01 percent.
Top Chart - Account Ratio: At first, Long positions were heavily stacked, with Long at around 70 percent and Short at just 30 percent. The ratio held steady above 3.90. This means retail accounts were very confident going Long after the pump.
Then the ratio plunged vertically to 1.02. Long dropped to around 50 percent, while Short rose to around 50 percent. This means retail immediately dumped their Long positions en masse and started opening Shorts at the top. Their confidence vanished instantly.
Bottom Chart #RAREUSDT - Top Trader Ratio: At first, they were also Long, with Long at around 60 percent and Short at 40 percent. The ratio held steady at 1.90. Large traders were still confident going Long.
#RARE Then the ratio plunged even harder to 0.89. Long fell below 50 percent, while Short rose above 50 percent. This means large traders have completely reversed course; now more of them are Short. This is no longer just a little profit-taking—they've reversed their positions.
$RARE Levels
Risk: Extremely high, whales are already Short
Top Ratio Support: 1.02. If this breaks below 1.00, retail will all go Short
Bottom Ratio Support: 0.89. If this rises back above 1.00, then the whales will have gone Long again
Don't chase Long at 0.01500. Retail has already fled, and whales are already Short. Wait for the bottom ratio to rise back above 1.00 before going Long. If the top ratio breaks below 1.00, don't force a Long.
{future}(RAREUSDT)
$RARE RAREUSDT - Retail Is Starting to Flee, Whales Are Strong #RAREBULLISH
Price $RARE now is 0.01500, up 74.01 percent.
Top Chart - Account Ratio: At first, Long positions were heavily stacked, with Long at around 70 percent and Short at just 30 percent. The ratio held steady above 3.90. This means retail accounts were very confident going Long after the pump.
Then the ratio plunged vertically to 1.02. Long dropped to around 50 percent, while Short rose to around 50 percent. This means retail immediately dumped their Long positions en masse and started opening Shorts at the top. Their confidence vanished instantly.
Bottom Chart #RAREUSDT - Top Trader Ratio: At first, they were also Long, with Long at around 60 percent and Short at 40 percent. The ratio held steady at 1.90. Large traders were still confident going Long.
#RARE Then the ratio plunged even harder to 0.89. Long fell below 50 percent, while Short rose above 50 percent. This means large traders have completely reversed course; now more of them are Short. This is no longer just a little profit-taking—they've reversed their positions.
$RARE Levels
Risk: Extremely high, whales are already Short
Top Ratio Support: 1.02. If this breaks below 1.00, retail will all go Short
Bottom Ratio Support: 0.89. If this rises back above 1.00, then the whales will have gone Long again
Don't chase Long at 0.01500. Retail has already fled, and whales are already Short. Wait for the bottom ratio to rise back above 1.00 before going Long. If the top ratio breaks below 1.00, don't force a Long.
Price $RARE now is 0.01500, up 74.01 percent.
Top Chart - Account Ratio: At first, Long positions were heavily stacked, with Long at around 70 percent and Short at just 30 percent. The ratio held steady above 3.90. This means retail accounts were very confident going Long after the pump.
Then the ratio plunged vertically to 1.02. Long dropped to around 50 percent, while Short rose to around 50 percent. This means retail immediately dumped their Long positions en masse and started opening Shorts at the top. Their confidence vanished instantly.
Bottom Chart #RAREUSDT - Top Trader Ratio: At first, they were also Long, with Long at around 60 percent and Short at 40 percent. The ratio held steady at 1.90. Large traders were still confident going Long.
#RARE Then the ratio plunged even harder to 0.89. Long fell below 50 percent, while Short rose above 50 percent. This means large traders have completely reversed course; now more of them are Short. This is no longer just a little profit-taking—they've reversed their positions.
$RARE Levels
Risk: Extremely high, whales are already Short
Top Ratio Support: 1.02. If this breaks below 1.00, retail will all go Short
Bottom Ratio Support: 0.89. If this rises back above 1.00, then the whales will have gone Long again
Don't chase Long at 0.01500. Retail has already fled, and whales are already Short. Wait for the bottom ratio to rise back above 1.00 before going Long. If the top ratio breaks below 1.00, don't force a Long.
3
396
·
--
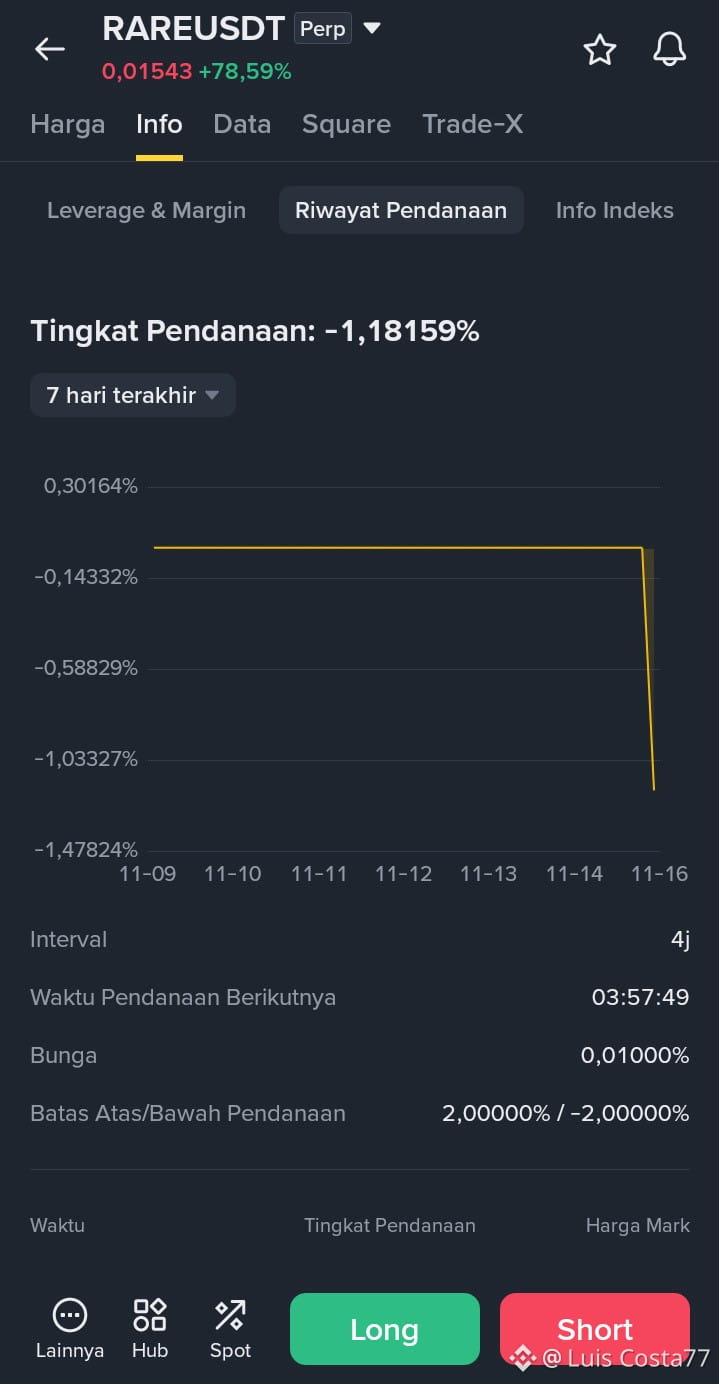
$RARE RAREUSDT - Funding Crashes Deep into Negative Territory, Shorts Pile Up #RAREBULLISH
Current price: $RARE 0.01543, up 78.59%.
Top Chart #RARE/USDT - Funding Rate: Flat for a long time around minus 0.14%, staying steady. Then suddenly plunged vertically to minus 1.18159%. A very deep drop, straight down.
This means Shorts are now paying a very high price to Longs. Shorts have piled up badly, daring to Short at the top after a vertical pump. This is an extreme condition, not normal.
If the price doesn't drop quickly, these Shorts could get trapped and be forced to buy back. That's what makes an upward Short Squeeze a real risk.
Level $RARE
Short Squeeze risk: Very high, funding is already at minus 1.18%
Funding support: Minus 0.14%. If it returns there, Shorts will have started to flee
Don't jump into a Short here just because the price has already risen a lot. Funding this negative means Shorts are overcrowded. Wait for funding to move back above minus 0.14% before considering a Short. If the price breaks higher again, don't force a Short.
{future}(RAREUSDT)
$RARE RAREUSDT - Funding Crashes Deep into Negative Territory, Shorts Pile Up #RAREBULLISH
Current price: $RARE 0.01543, up 78.59%.
Top Chart #RARE/USDT - Funding Rate: Flat for a long time around minus 0.14%, staying steady. Then suddenly plunged vertically to minus 1.18159%. A very deep drop, straight down.
This means Shorts are now paying a very high price to Longs. Shorts have piled up badly, daring to Short at the top after a vertical pump. This is an extreme condition, not normal.
If the price doesn't drop quickly, these Shorts could get trapped and be forced to buy back. That's what makes an upward Short Squeeze a real risk.
Level $RARE
Short Squeeze risk: Very high, funding is already at minus 1.18%
Funding support: Minus 0.14%. If it returns there, Shorts will have started to flee
Don't jump into a Short here just because the price has already risen a lot. Funding this negative means Shorts are overcrowded. Wait for funding to move back above minus 0.14% before considering a Short. If the price breaks higher again, don't force a Short.
Current price: $RARE 0.01543, up 78.59%.
Top Chart #RARE/USDT - Funding Rate: Flat for a long time around minus 0.14%, staying steady. Then suddenly plunged vertically to minus 1.18159%. A very deep drop, straight down.
This means Shorts are now paying a very high price to Longs. Shorts have piled up badly, daring to Short at the top after a vertical pump. This is an extreme condition, not normal.
If the price doesn't drop quickly, these Shorts could get trapped and be forced to buy back. That's what makes an upward Short Squeeze a real risk.
Level $RARE
Short Squeeze risk: Very high, funding is already at minus 1.18%
Funding support: Minus 0.14%. If it returns there, Shorts will have started to flee
Don't jump into a Short here just because the price has already risen a lot. Funding this negative means Shorts are overcrowded. Wait for funding to move back above minus 0.14% before considering a Short. If the price breaks higher again, don't force a Short.
1
323
·
--
$RARE RAREUSDT perp - Vertical Pump #RARE/USDT
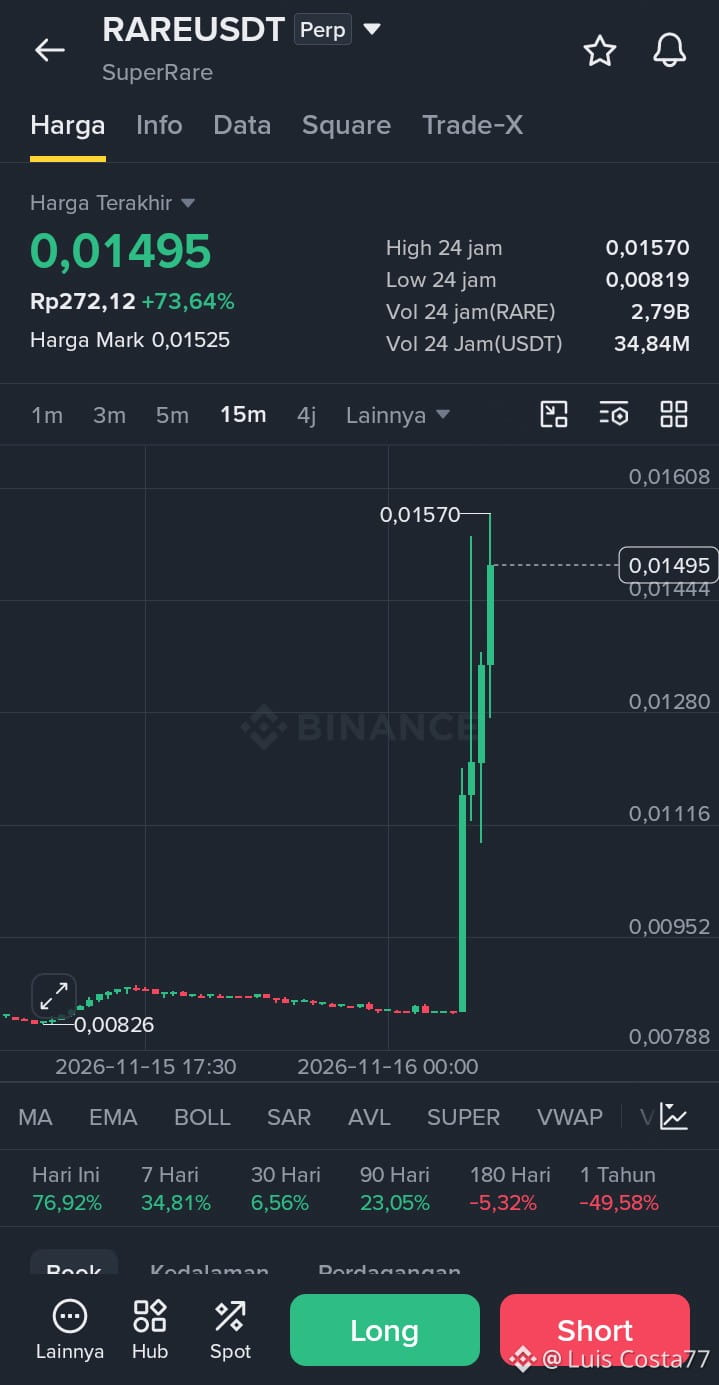
Current price 0.01495, up 73.64 percent. High 0.01570, Low 0.00819. Vol 34.84M USDT, pretty high.
15-Minute Chart: Price stayed flat at 0.00826 for a long time, without moving at all. Then suddenly it exploded vertically in one huge candle to 0.01570. It nearly doubled in a single move.
The price is now at 0.01495, taking a slight breather below the peak. There hasn't been a deep correction or any sign of selling off. But candles like this are usually at risk of a quick dump if buyers are late to enter.
Today's performance is up 76.92 percent, 7 days up 34.81 percent, 30 days up 6.56 percent. This is a sudden pump, not a long-term uptrend. 180 days is still down 5.32 percent, 1 year down 49.58 percent.
Levels:
Resistance 0.01570 - 0.01608
Support 0.01280 - 0.01116
Don't chase a Long at 0.01495. Wait for it to break above 0.01570 and hold there before joining, or wait for a correction to 0.01280 and a bounce. If 0.01280 breaks, don't force a Long.
{future}(RAREUSDT)
$RARE RAREUSDT perp - Vertical Pump #RARE/USDT
Current price 0.01495, up 73.64 percent. High 0.01570, Low 0.00819. Vol 34.84M USDT, pretty high.
15-Minute Chart: Price stayed flat at 0.00826 for a long time, without moving at all. Then suddenly it exploded vertically in one huge candle to 0.01570. It nearly doubled in a single move.
The price is now at 0.01495, taking a slight breather below the peak. There hasn't been a deep correction or any sign of selling off. But candles like this are usually at risk of a quick dump if buyers are late to enter.
Today's performance is up 76.92 percent, 7 days up 34.81 percent, 30 days up 6.56 percent. This is a sudden pump, not a long-term uptrend. 180 days is still down 5.32 percent, 1 year down 49.58 percent.
Levels:
Resistance 0.01570 - 0.01608
Support 0.01280 - 0.01116
Don't chase a Long at 0.01495. Wait for it to break above 0.01570 and hold there before joining, or wait for a correction to 0.01280 and a bounce. If 0.01280 breaks, don't force a Long.
Current price 0.01495, up 73.64 percent. High 0.01570, Low 0.00819. Vol 34.84M USDT, pretty high.
15-Minute Chart: Price stayed flat at 0.00826 for a long time, without moving at all. Then suddenly it exploded vertically in one huge candle to 0.01570. It nearly doubled in a single move.
The price is now at 0.01495, taking a slight breather below the peak. There hasn't been a deep correction or any sign of selling off. But candles like this are usually at risk of a quick dump if buyers are late to enter.
Today's performance is up 76.92 percent, 7 days up 34.81 percent, 30 days up 6.56 percent. This is a sudden pump, not a long-term uptrend. 180 days is still down 5.32 percent, 1 year down 49.58 percent.
Levels:
Resistance 0.01570 - 0.01608
Support 0.01280 - 0.01116
Don't chase a Long at 0.01495. Wait for it to break above 0.01570 and hold there before joining, or wait for a correction to 0.01280 and a bounce. If 0.01280 breaks, don't force a Long.
2
349
·
--
$ARIA ARIAUSDT - Breaks Out of the Box, Now Testing the Day's High #AriaAI爆拉
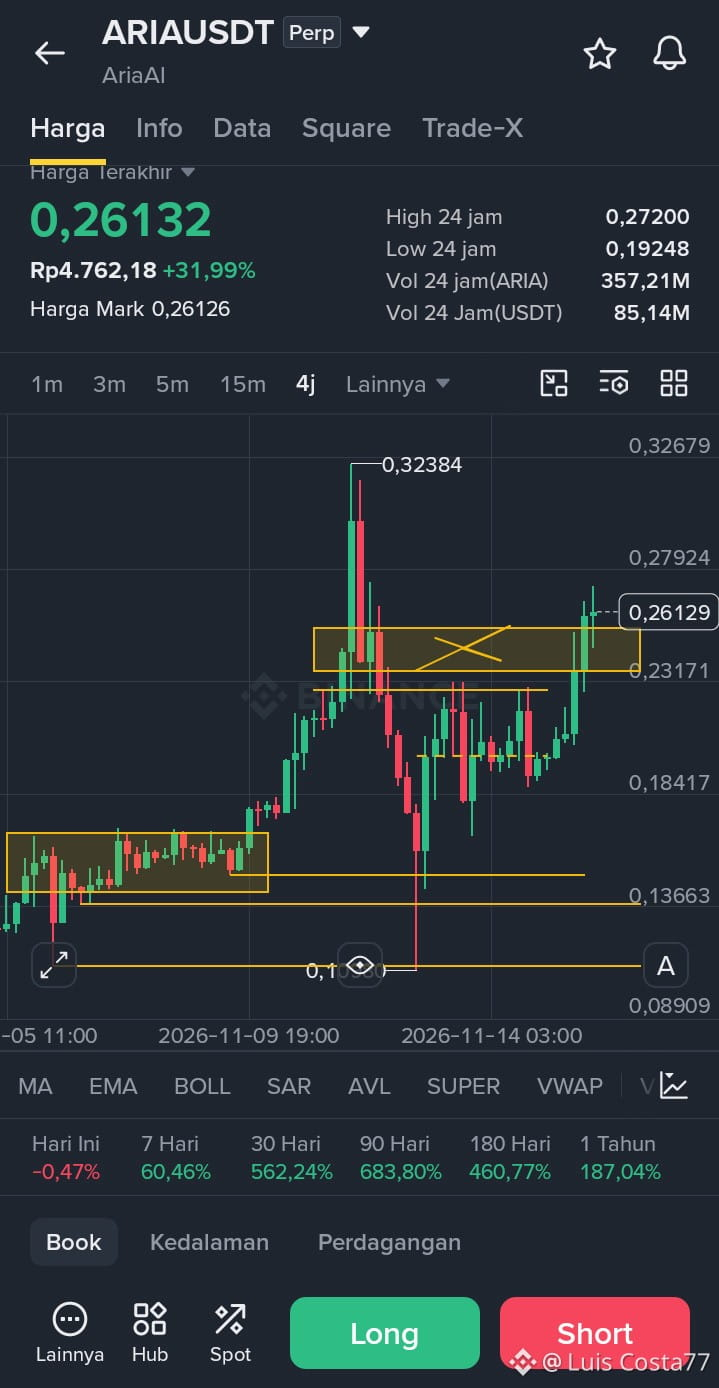
Current price is 0,26132, up 31,99 percent. High 0,27200, Low 0,19248. Volume 85,14M USDT, huge.
4-Hour Chart $ARIA : Price once surged to 0,32384, then got slammed back down to 0,10980. After that, it moved sideways for a long time in the lower box.
Then it gradually climbed to the 0,23171 - 0,24036 box, where it stayed capped for a long time. It has just broken out of the box to the upside, reaching 0,26129. This is a genuine breakout.
Price is now #AriaAI爆拉 right below the High of 0,27200. If it breaks through, the path to 0,32384 opens up again. If it fails, it could fall back into the box.
Performance is still strong. Up 60,46 percent over 7 days, up 562,24 percent over 30 days, and up 683,80 percent over 90 days. Today it's down 0,47 percent, taking a short breather.
Levels $ARIA :
Resistance 0,27200 - 0,32384
Support 0,23171 - 0,18417
#AriaAI爆拉 Don't chase a Long at 0,26132. Wait for it to break 0,27200 and hold above it before joining in, or wait for it to pull back to 0,23171 and bounce. If it breaks below 0,23171, don't force a Long.
{future}(ARIAUSDT)
$ARIA ARIAUSDT - Breaks Out of the Box, Now Testing the Day's High #AriaAI爆拉
Current price is 0,26132, up 31,99 percent. High 0,27200, Low 0,19248. Volume 85,14M USDT, huge.
4-Hour Chart $ARIA : Price once surged to 0,32384, then got slammed back down to 0,10980. After that, it moved sideways for a long time in the lower box.
Then it gradually climbed to the 0,23171 - 0,24036 box, where it stayed capped for a long time. It has just broken out of the box to the upside, reaching 0,26129. This is a genuine breakout.
Price is now #AriaAI爆拉 right below the High of 0,27200. If it breaks through, the path to 0,32384 opens up again. If it fails, it could fall back into the box.
Performance is still strong. Up 60,46 percent over 7 days, up 562,24 percent over 30 days, and up 683,80 percent over 90 days. Today it's down 0,47 percent, taking a short breather.
Levels $ARIA :
Resistance 0,27200 - 0,32384
Support 0,23171 - 0,18417
#AriaAI爆拉 Don't chase a Long at 0,26132. Wait for it to break 0,27200 and hold above it before joining in, or wait for it to pull back to 0,23171 and bounce. If it breaks below 0,23171, don't force a Long.
Current price is 0,26132, up 31,99 percent. High 0,27200, Low 0,19248. Volume 85,14M USDT, huge.
4-Hour Chart $ARIA : Price once surged to 0,32384, then got slammed back down to 0,10980. After that, it moved sideways for a long time in the lower box.
Then it gradually climbed to the 0,23171 - 0,24036 box, where it stayed capped for a long time. It has just broken out of the box to the upside, reaching 0,26129. This is a genuine breakout.
Price is now #AriaAI爆拉 right below the High of 0,27200. If it breaks through, the path to 0,32384 opens up again. If it fails, it could fall back into the box.
Performance is still strong. Up 60,46 percent over 7 days, up 562,24 percent over 30 days, and up 683,80 percent over 90 days. Today it's down 0,47 percent, taking a short breather.
Levels $ARIA :
Resistance 0,27200 - 0,32384
Support 0,23171 - 0,18417
#AriaAI爆拉 Don't chase a Long at 0,26132. Wait for it to break 0,27200 and hold above it before joining in, or wait for it to pull back to 0,23171 and bounce. If it breaks below 0,23171, don't force a Long.
1
75
·
--
$EVAA EVAAUSDT - Testing the Peak for the Second Time, Still No Breakout
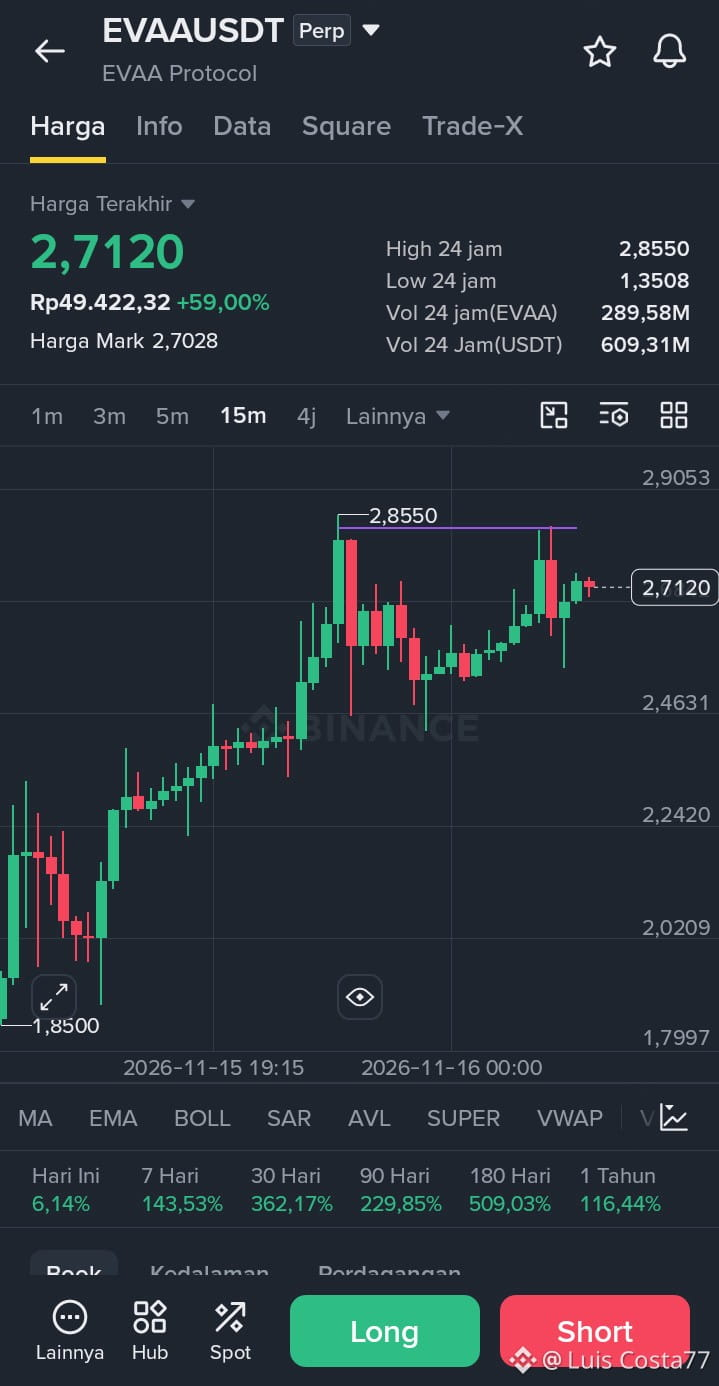
Current price: 2.7120, up 59.00%. High: 2.8550, low: 1.3508. Volume: 609.31M USDT, still very high.
15-minute chart: From a low of 1.85, the price surged to 2.8550. Then it got slammed down to 2.4631, before climbing back to 2.8550. It has now tested the peak twice, and been rejected both times.
The price is now at 2.7120, taking a breather below the peak. Red and green candles are alternating, with buyers and sellers evenly matched. This is a decisive moment: will it break through, or fail again?
Performance is still wild. Up 6.14% today, 143.53% over 7 days, 362.17% over 30 days, and 509.03% over 180 days. The broader uptrend is strong, with no sign of a complete reversal yet.
Levels:
Resistance: 2.8550 - 2.9053
Support: 2.4631 - 2.2420
Don’t go Long at 2.7120. Wait for a break above 2.8550 and for the price to hold above it before joining in, or wait for a pullback to 2.4631 and a bounce. If 2.4631 breaks, don’t force a Long.
{future}(EVAAUSDT)
$EVAA EVAAUSDT - Testing the Peak for the Second Time, Still No Breakout
Current price: 2.7120, up 59.00%. High: 2.8550, low: 1.3508. Volume: 609.31M USDT, still very high.
15-minute chart: From a low of 1.85, the price surged to 2.8550. Then it got slammed down to 2.4631, before climbing back to 2.8550. It has now tested the peak twice, and been rejected both times.
The price is now at 2.7120, taking a breather below the peak. Red and green candles are alternating, with buyers and sellers evenly matched. This is a decisive moment: will it break through, or fail again?
Performance is still wild. Up 6.14% today, 143.53% over 7 days, 362.17% over 30 days, and 509.03% over 180 days. The broader uptrend is strong, with no sign of a complete reversal yet.
Levels:
Resistance: 2.8550 - 2.9053
Support: 2.4631 - 2.2420
Don’t go Long at 2.7120. Wait for a break above 2.8550 and for the price to hold above it before joining in, or wait for a pullback to 2.4631 and a bounce. If 2.4631 breaks, don’t force a Long.
Current price: 2.7120, up 59.00%. High: 2.8550, low: 1.3508. Volume: 609.31M USDT, still very high.
15-minute chart: From a low of 1.85, the price surged to 2.8550. Then it got slammed down to 2.4631, before climbing back to 2.8550. It has now tested the peak twice, and been rejected both times.
The price is now at 2.7120, taking a breather below the peak. Red and green candles are alternating, with buyers and sellers evenly matched. This is a decisive moment: will it break through, or fail again?
Performance is still wild. Up 6.14% today, 143.53% over 7 days, 362.17% over 30 days, and 509.03% over 180 days. The broader uptrend is strong, with no sign of a complete reversal yet.
Levels:
Resistance: 2.8550 - 2.9053
Support: 2.4631 - 2.2420
Don’t go Long at 2.7120. Wait for a break above 2.8550 and for the price to hold above it before joining in, or wait for a pullback to 2.4631 and a bounce. If 2.4631 breaks, don’t force a Long.
1
47
·
--
$RARE RAREUSDT - Crazy Pump, Whales Have Already Fled #RAREUSDT榜首仍在
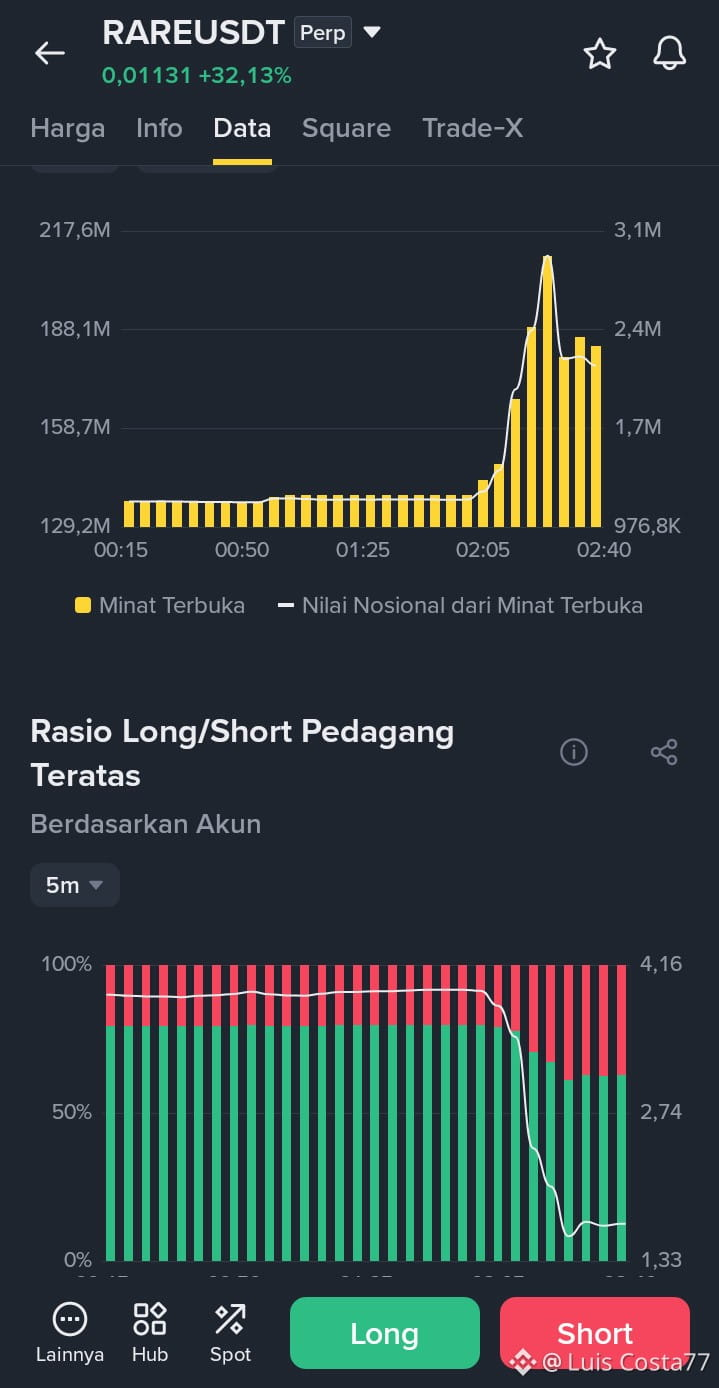
Current price: 0.01131, up 32.13 percent.
Top Chart #RAREUSDT - Open Interest: It stayed flat at 129.2M for a long time, then shot vertically up to 217.6M. Notional value also exploded from 976.8K to 3.1M, then fell back to 2.4M. This means money poured in during the pump, but immediately flowed back out at the top. This is a sign that the pump is already starting to get dumped.
Bottom Chart $RARE - Top Trader Ratio: Initially, Long was at 80 percent, while Short was only 20 percent. The ratio stayed steady at 4.16, with Long positions heavily stacked.
Then the ratio plunged vertically to 1.33. Long fell to 60 percent, while Short rose to 40 percent. This means the big traders immediately dumped their Long positions and started going Short at the top. This is a danger signal.
Levels $RARE :
Risk: Extremely high; whales are starting to go Short
Ratio support: 1.33. If this breaks again, Long positions will thin out further.
#RAREUSDT Don't chase Long at 0.01131. It's already too late; the whales have left. Wait for open interest to rise again, followed by the price. If the ratio is still plunging below 1.33, don't force a Long.
{future}(RAREUSDT)
$RARE RAREUSDT - Crazy Pump, Whales Have Already Fled #RAREUSDT榜首仍在
Current price: 0.01131, up 32.13 percent.
Top Chart #RAREUSDT - Open Interest: It stayed flat at 129.2M for a long time, then shot vertically up to 217.6M. Notional value also exploded from 976.8K to 3.1M, then fell back to 2.4M. This means money poured in during the pump, but immediately flowed back out at the top. This is a sign that the pump is already starting to get dumped.
Bottom Chart $RARE - Top Trader Ratio: Initially, Long was at 80 percent, while Short was only 20 percent. The ratio stayed steady at 4.16, with Long positions heavily stacked.
Then the ratio plunged vertically to 1.33. Long fell to 60 percent, while Short rose to 40 percent. This means the big traders immediately dumped their Long positions and started going Short at the top. This is a danger signal.
Levels $RARE :
Risk: Extremely high; whales are starting to go Short
Ratio support: 1.33. If this breaks again, Long positions will thin out further.
#RAREUSDT Don't chase Long at 0.01131. It's already too late; the whales have left. Wait for open interest to rise again, followed by the price. If the ratio is still plunging below 1.33, don't force a Long.
Current price: 0.01131, up 32.13 percent.
Top Chart #RAREUSDT - Open Interest: It stayed flat at 129.2M for a long time, then shot vertically up to 217.6M. Notional value also exploded from 976.8K to 3.1M, then fell back to 2.4M. This means money poured in during the pump, but immediately flowed back out at the top. This is a sign that the pump is already starting to get dumped.
Bottom Chart $RARE - Top Trader Ratio: Initially, Long was at 80 percent, while Short was only 20 percent. The ratio stayed steady at 4.16, with Long positions heavily stacked.
Then the ratio plunged vertically to 1.33. Long fell to 60 percent, while Short rose to 40 percent. This means the big traders immediately dumped their Long positions and started going Short at the top. This is a danger signal.
Levels $RARE :
Risk: Extremely high; whales are starting to go Short
Ratio support: 1.33. If this breaks again, Long positions will thin out further.
#RAREUSDT Don't chase Long at 0.01131. It's already too late; the whales have left. Wait for open interest to rise again, followed by the price. If the ratio is still plunging below 1.33, don't force a Long.
2
649
·
--
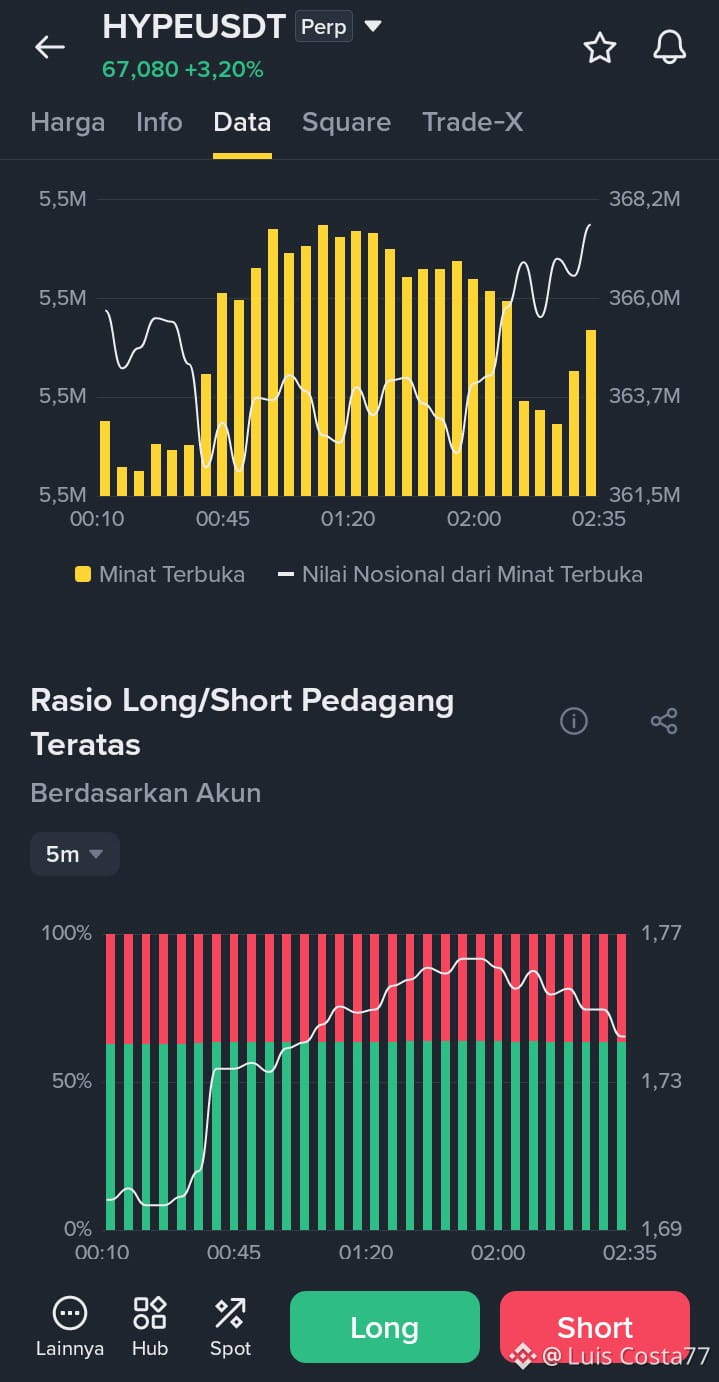
$HYPE HYPEUSDT perp - New Money Coming In, Whales Still Long
Price #Hyperliquid now 67,080, up 3.20 percent.
Top Chart $HYPE - Open Interest: Notional value rose from 361.5M to 368.2M. Open interest bars also climbed sharply in the middle, dipped briefly, then rose again at the end. This means new money is flowing back into the market. Price rising alongside open interest is healthy—it’s not just an empty pump.
Bottom Chart $HYPE - Top Trader Ratio: Long 60 percent, Short 40 percent. The ratio rose from 1.69 to 1.77, then dipped slightly to 1.73. This means big traders added a lot of Long positions for a while, then started taking a little profit near the top. But it’s still well above 1.00, so they haven’t bailed.
Levels #Hyperliquid :
Risk: If open interest breaks back below 361.5M, the money is leaving.
Ratio support: 1.73. If this breaks, the whales may start reversing direction.
Don’t chase Long at 67,080. Wait for open interest to rise again along with price, or wait for the ratio to return to 1.77. If open interest falls while price is still rising, don’t force a Long.
{future}(HYPEUSDT)
$HYPE HYPEUSDT perp - New Money Coming In, Whales Still Long
Price #Hyperliquid now 67,080, up 3.20 percent.
Top Chart $HYPE - Open Interest: Notional value rose from 361.5M to 368.2M. Open interest bars also climbed sharply in the middle, dipped briefly, then rose again at the end. This means new money is flowing back into the market. Price rising alongside open interest is healthy—it’s not just an empty pump.
Bottom Chart $HYPE - Top Trader Ratio: Long 60 percent, Short 40 percent. The ratio rose from 1.69 to 1.77, then dipped slightly to 1.73. This means big traders added a lot of Long positions for a while, then started taking a little profit near the top. But it’s still well above 1.00, so they haven’t bailed.
Levels #Hyperliquid :
Risk: If open interest breaks back below 361.5M, the money is leaving.
Ratio support: 1.73. If this breaks, the whales may start reversing direction.
Don’t chase Long at 67,080. Wait for open interest to rise again along with price, or wait for the ratio to return to 1.77. If open interest falls while price is still rising, don’t force a Long.
Price #Hyperliquid now 67,080, up 3.20 percent.
Top Chart $HYPE - Open Interest: Notional value rose from 361.5M to 368.2M. Open interest bars also climbed sharply in the middle, dipped briefly, then rose again at the end. This means new money is flowing back into the market. Price rising alongside open interest is healthy—it’s not just an empty pump.
Bottom Chart $HYPE - Top Trader Ratio: Long 60 percent, Short 40 percent. The ratio rose from 1.69 to 1.77, then dipped slightly to 1.73. This means big traders added a lot of Long positions for a while, then started taking a little profit near the top. But it’s still well above 1.00, so they haven’t bailed.
Levels #Hyperliquid :
Risk: If open interest breaks back below 361.5M, the money is leaving.
Ratio support: 1.73. If this breaks, the whales may start reversing direction.
Don’t chase Long at 67,080. Wait for open interest to rise again along with price, or wait for the ratio to return to 1.77. If open interest falls while price is still rising, don’t force a Long.
1
488
·
--
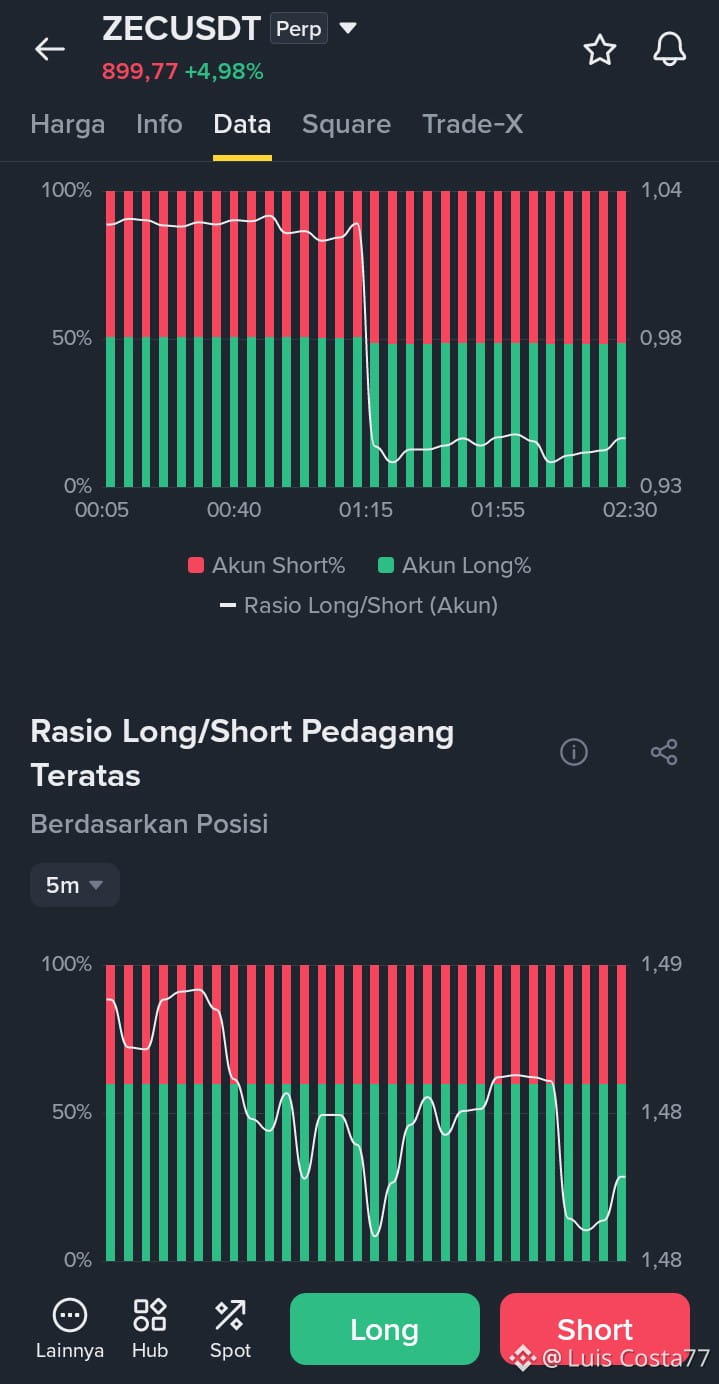
$ZEC ZECUSDT - Retail Short, Whales Still Long
Price #ZECUSDT now 899.77, up 4.98 percent.
Top Chart $ZEC - Account Ratio: It started out balanced, Long 50 percent, Short 50 percent, ratio 1.04. Then the ratio broke down to 0.93 and stayed there. This means retail accounts are now more heavily Short. They’re worried the price has gotten too high and want to ride the move down.
Bottom Chart #ZECUSDT - Top Trader Ratio: A different story here. Long is still at 60 percent, while Short is only 40 percent. The ratio has stayed steady at 1.48 to 1.49. This means large traders are still confident in Long and aren’t following retail into Short.
Level $ZEC
Short Squeeze Risk: High, because retail has piled into Short below
Ratio Support: 1.48. If it breaks below this level, only then will the whales start heading for the exits
Don’t go Short just because retail #ZECUSDT is piling into Short. As long as top traders are holding Long at 1.48, the price is at risk of being pulled upward to squeeze Shorts. Wait for the upper ratio to get back above 1.00 before going Long. If the lower ratio breaks below 1.48, don’t force a Long.
{future}(ZECUSDT)
$ZEC ZECUSDT - Retail Short, Whales Still Long
Price #ZECUSDT now 899.77, up 4.98 percent.
Top Chart $ZEC - Account Ratio: It started out balanced, Long 50 percent, Short 50 percent, ratio 1.04. Then the ratio broke down to 0.93 and stayed there. This means retail accounts are now more heavily Short. They’re worried the price has gotten too high and want to ride the move down.
Bottom Chart #ZECUSDT - Top Trader Ratio: A different story here. Long is still at 60 percent, while Short is only 40 percent. The ratio has stayed steady at 1.48 to 1.49. This means large traders are still confident in Long and aren’t following retail into Short.
Level $ZEC
Short Squeeze Risk: High, because retail has piled into Short below
Ratio Support: 1.48. If it breaks below this level, only then will the whales start heading for the exits
Don’t go Short just because retail #ZECUSDT is piling into Short. As long as top traders are holding Long at 1.48, the price is at risk of being pulled upward to squeeze Shorts. Wait for the upper ratio to get back above 1.00 before going Long. If the lower ratio breaks below 1.48, don’t force a Long.
Price #ZECUSDT now 899.77, up 4.98 percent.
Top Chart $ZEC - Account Ratio: It started out balanced, Long 50 percent, Short 50 percent, ratio 1.04. Then the ratio broke down to 0.93 and stayed there. This means retail accounts are now more heavily Short. They’re worried the price has gotten too high and want to ride the move down.
Bottom Chart #ZECUSDT - Top Trader Ratio: A different story here. Long is still at 60 percent, while Short is only 40 percent. The ratio has stayed steady at 1.48 to 1.49. This means large traders are still confident in Long and aren’t following retail into Short.
Level $ZEC
Short Squeeze Risk: High, because retail has piled into Short below
Ratio Support: 1.48. If it breaks below this level, only then will the whales start heading for the exits
Don’t go Short just because retail #ZECUSDT is piling into Short. As long as top traders are holding Long at 1.48, the price is at risk of being pulled upward to squeeze Shorts. Wait for the upper ratio to get back above 1.00 before going Long. If the lower ratio breaks below 1.48, don’t force a Long.
1
254
·
--
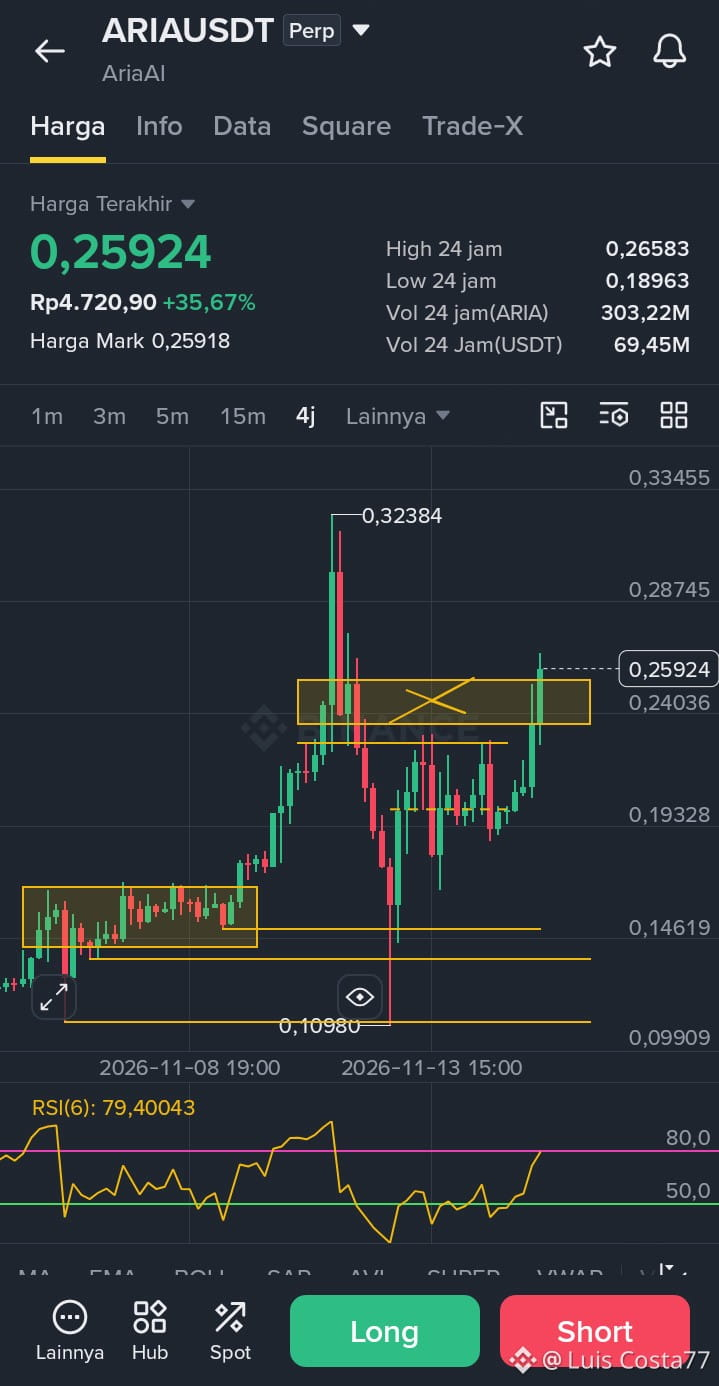
$ARIA ARIAUSDT perp - Breaking Out of the Box, But RSI Is Already Overheated
Price now 0.25924, up 35.67 percent. High 0.26583, Low 0.18963. Vol 69.45M USDT, huge.
4-Hour Chart #ARIAUSDT : From a low of 0.10980, price exploded to a peak of 0.32384. After that, it got slammed back down to 0.10980 again, then slowly climbed to the 0.24036 box.
Now price $ARIA has just broken out of the box to the upside at 0.25924. This is a real breakout, not a fakeout. But RSI is 79.40043, very overbought, so a slight correction first is a risk.
Levels $ARIA :
Resistance 0.26583 - 0.32384
Support 0.24036 - 0.19328
#ARIAUSDT Don't chase a Long at 0.25924. Wait for it to break 0.26583 before joining, or wait for it to pull back to 0.24036 and bounce. If it breaks below 0.24036, don't force a Long.
{future}(ARIAUSDT)
$ARIA ARIAUSDT perp - Breaking Out of the Box, But RSI Is Already Overheated
Price now 0.25924, up 35.67 percent. High 0.26583, Low 0.18963. Vol 69.45M USDT, huge.
4-Hour Chart #ARIAUSDT : From a low of 0.10980, price exploded to a peak of 0.32384. After that, it got slammed back down to 0.10980 again, then slowly climbed to the 0.24036 box.
Now price $ARIA has just broken out of the box to the upside at 0.25924. This is a real breakout, not a fakeout. But RSI is 79.40043, very overbought, so a slight correction first is a risk.
Levels $ARIA :
Resistance 0.26583 - 0.32384
Support 0.24036 - 0.19328
#ARIAUSDT Don't chase a Long at 0.25924. Wait for it to break 0.26583 before joining, or wait for it to pull back to 0.24036 and bounce. If it breaks below 0.24036, don't force a Long.
Price now 0.25924, up 35.67 percent. High 0.26583, Low 0.18963. Vol 69.45M USDT, huge.
4-Hour Chart #ARIAUSDT : From a low of 0.10980, price exploded to a peak of 0.32384. After that, it got slammed back down to 0.10980 again, then slowly climbed to the 0.24036 box.
Now price $ARIA has just broken out of the box to the upside at 0.25924. This is a real breakout, not a fakeout. But RSI is 79.40043, very overbought, so a slight correction first is a risk.
Levels $ARIA :
Resistance 0.26583 - 0.32384
Support 0.24036 - 0.19328
#ARIAUSDT Don't chase a Long at 0.25924. Wait for it to break 0.26583 before joining, or wait for it to pull back to 0.24036 and bounce. If it breaks below 0.24036, don't force a Long.
1
370
·
--
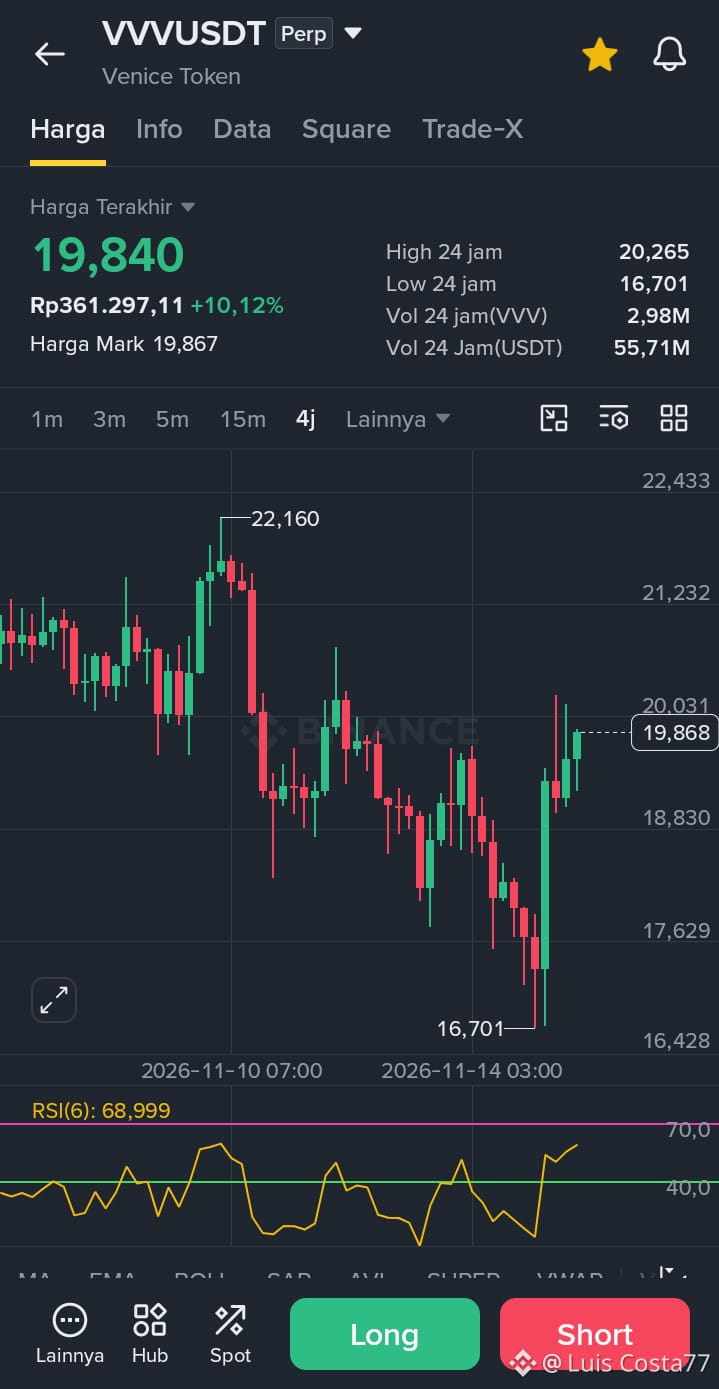
$VVV VVVUSDT perp - Strong Rebound, But Not Back at the Top Yet
Current price 19,840, up 10,12 percent. High 20,265, Low 16,701. Vol 55,71M USDT, pretty substantial.
4-Hour Chart $VVV : From the peak of 22,160, the price kept falling until it broke down to 16,701. That was the low. It fell about 24 percent from the peak.
After that, it immediately bounced strongly with 2 big green candles to 19,868. #VVVUSDT It rose about 18 percent from the low. Now it's hovering just below the High of 20,265. RSI 68,999, already close to overbought; buyers are starting to heat up.
Levels $VVV :
Resistance 20,265 - 20,031
Support 18,830 - 16,701
Don't chase a Long at 19,84. Wait for a break above 20,265 before joining in, or wait for a pullback to 18,830 and a bounce. If it breaks below 18,830, don't force a Long.
{future}(VVVUSDT)
$VVV VVVUSDT perp - Strong Rebound, But Not Back at the Top Yet
Current price 19,840, up 10,12 percent. High 20,265, Low 16,701. Vol 55,71M USDT, pretty substantial.
4-Hour Chart $VVV : From the peak of 22,160, the price kept falling until it broke down to 16,701. That was the low. It fell about 24 percent from the peak.
After that, it immediately bounced strongly with 2 big green candles to 19,868. #VVVUSDT It rose about 18 percent from the low. Now it's hovering just below the High of 20,265. RSI 68,999, already close to overbought; buyers are starting to heat up.
Levels $VVV :
Resistance 20,265 - 20,031
Support 18,830 - 16,701
Don't chase a Long at 19,84. Wait for a break above 20,265 before joining in, or wait for a pullback to 18,830 and a bounce. If it breaks below 18,830, don't force a Long.
Current price 19,840, up 10,12 percent. High 20,265, Low 16,701. Vol 55,71M USDT, pretty substantial.
4-Hour Chart $VVV : From the peak of 22,160, the price kept falling until it broke down to 16,701. That was the low. It fell about 24 percent from the peak.
After that, it immediately bounced strongly with 2 big green candles to 19,868. #VVVUSDT It rose about 18 percent from the low. Now it's hovering just below the High of 20,265. RSI 68,999, already close to overbought; buyers are starting to heat up.
Levels $VVV :
Resistance 20,265 - 20,031
Support 18,830 - 16,701
Don't chase a Long at 19,84. Wait for a break above 20,265 before joining in, or wait for a pullback to 18,830 and a bounce. If it breaks below 18,830, don't force a Long.
1
2
180
·
--
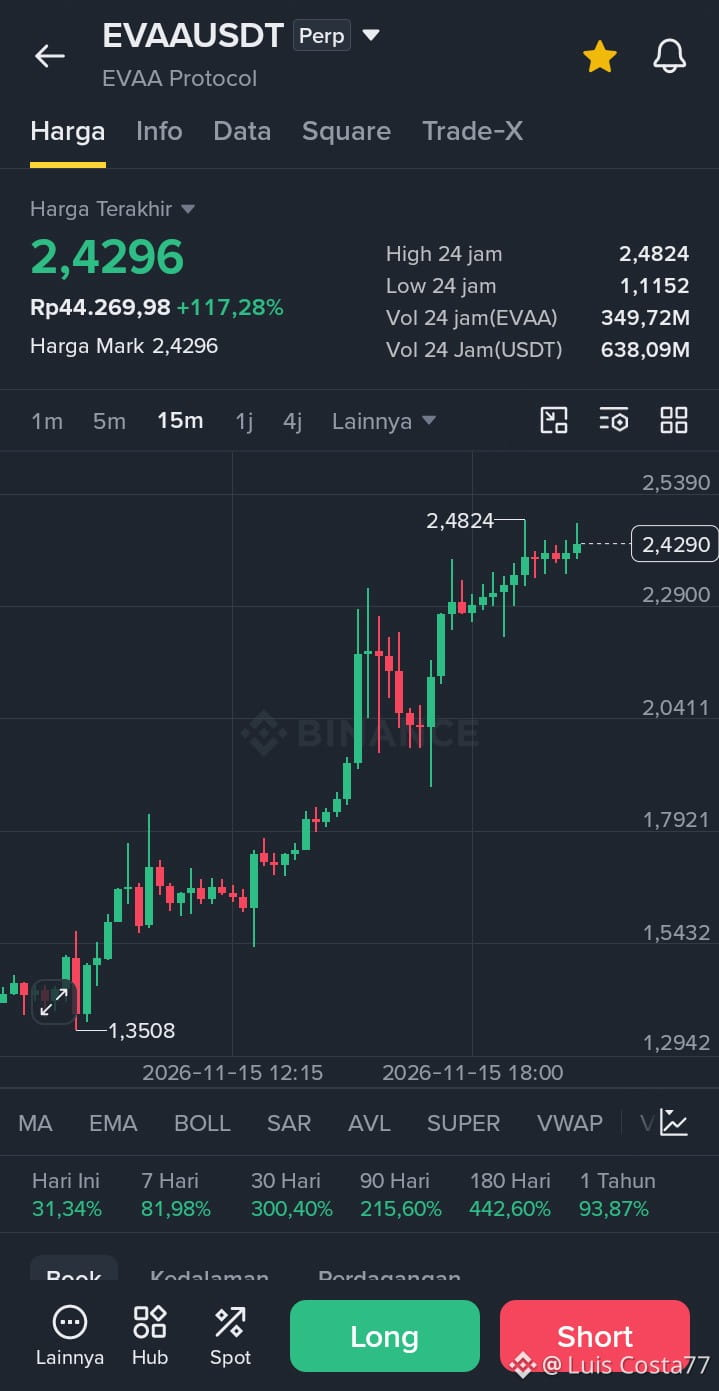
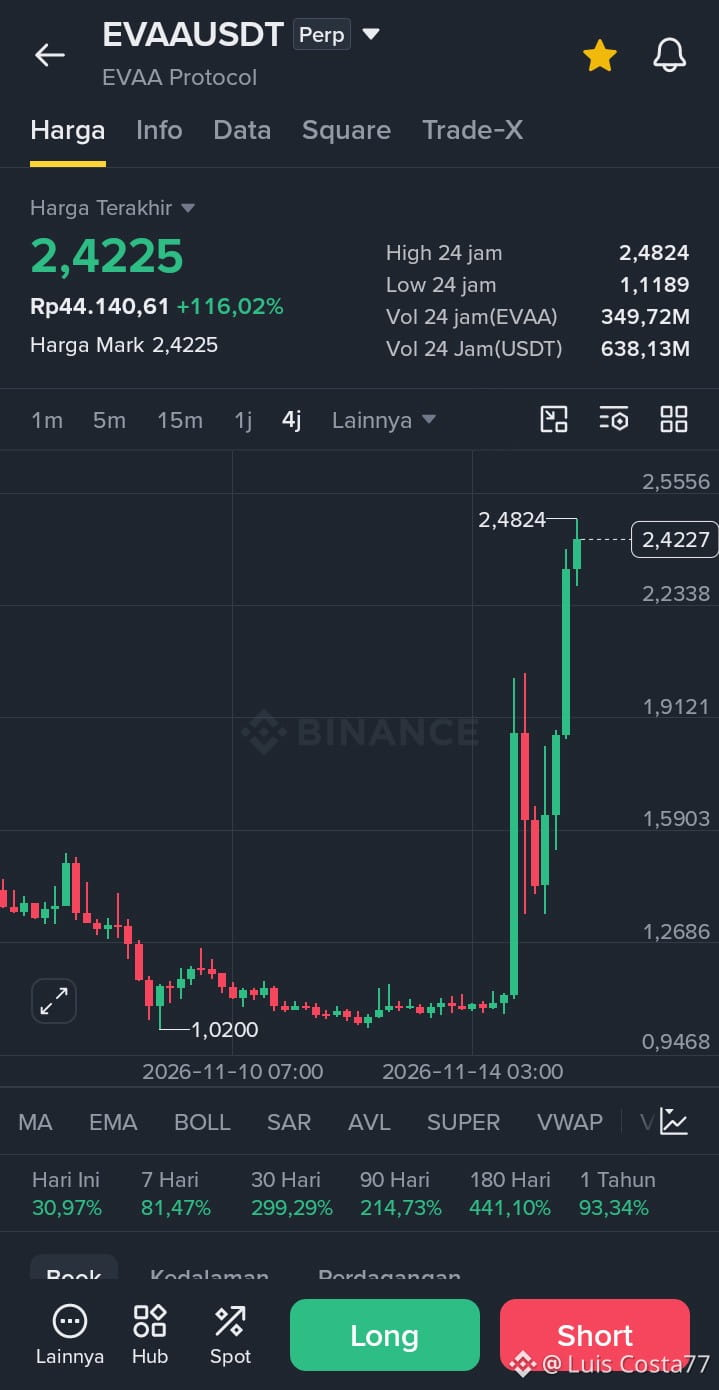
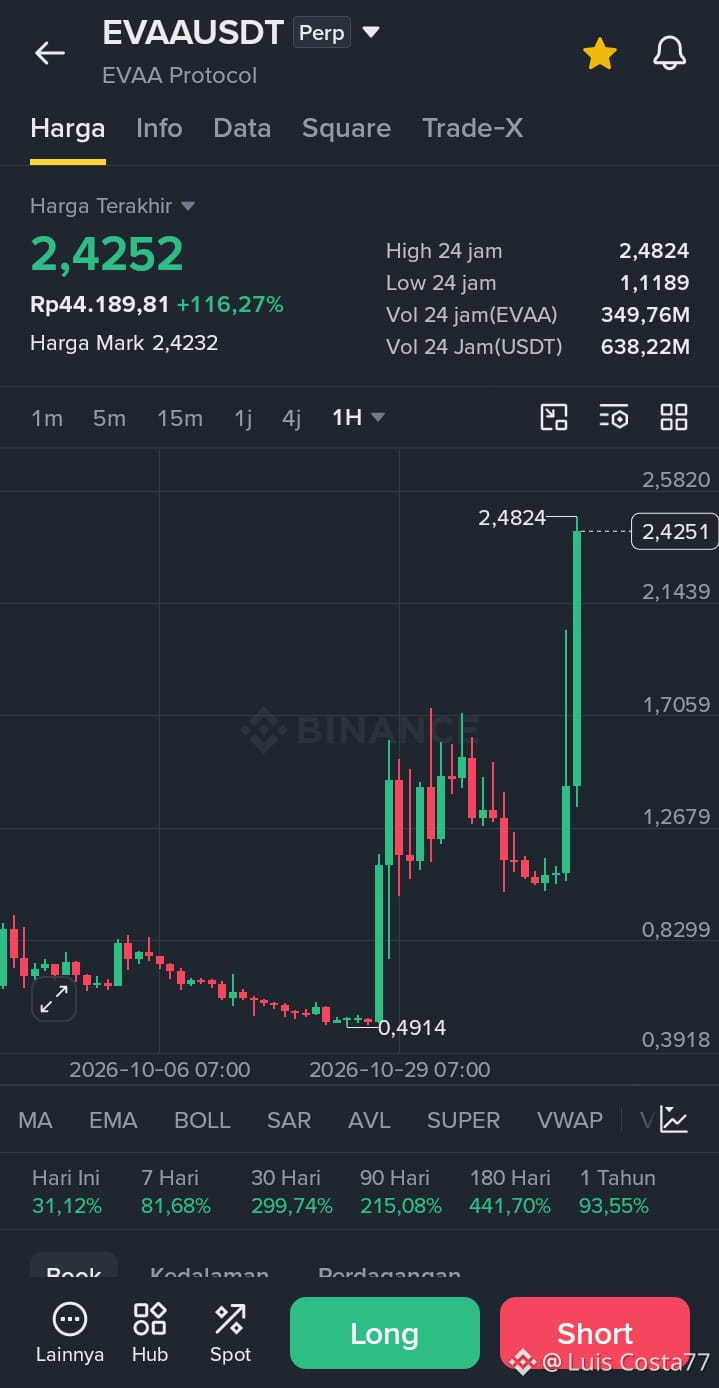
$EVAA EVAAUSDT - Already at the Top, Don't Chase It
Current price: 2.42, up 116 percent. High: 2.4824, low: 1.11. Volume: 638M USDT, extremely high.
$EVAA 15-Minute Chart: Rose from 1.35 to 2.48, briefly corrected to 2.0, then buyers stepped in again. Now hovering at 2.42, with smaller candles. Buyers are starting to tire.
$EVAA 4-Hour Chart: This is the second pump. It bottomed at 1.02, then surged to 2.48. More than doubled. Now consolidating at the top.
#EVAAUSDT 1-Day Chart: The old pattern is repeating. Before, it surged to 1.7, then fell to 1.0. Now it's surging again to 2.48, higher than before. 30-day performance is up 300 percent, and 180-day performance is up 442 percent. A strong uptrend.
Levels:
Resistance: 2.4824
Support: 2.29 - 2.04
Don't go Long at 2.42. Wait for a break above 2.4824 before joining, or wait for a correction to 2.04 and a bounce. If it breaks below 2.29, don't force a Long.
{future}(EVAAUSDT)
$EVAA EVAAUSDT - Already at the Top, Don't Chase It
Current price: 2.42, up 116 percent. High: 2.4824, low: 1.11. Volume: 638M USDT, extremely high.
$EVAA 15-Minute Chart: Rose from 1.35 to 2.48, briefly corrected to 2.0, then buyers stepped in again. Now hovering at 2.42, with smaller candles. Buyers are starting to tire.
$EVAA 4-Hour Chart: This is the second pump. It bottomed at 1.02, then surged to 2.48. More than doubled. Now consolidating at the top.
#EVAAUSDT 1-Day Chart: The old pattern is repeating. Before, it surged to 1.7, then fell to 1.0. Now it's surging again to 2.48, higher than before. 30-day performance is up 300 percent, and 180-day performance is up 442 percent. A strong uptrend.
Levels:
Resistance: 2.4824
Support: 2.29 - 2.04
Don't go Long at 2.42. Wait for a break above 2.4824 before joining, or wait for a correction to 2.04 and a bounce. If it breaks below 2.29, don't force a Long.
Current price: 2.42, up 116 percent. High: 2.4824, low: 1.11. Volume: 638M USDT, extremely high.
$EVAA 15-Minute Chart: Rose from 1.35 to 2.48, briefly corrected to 2.0, then buyers stepped in again. Now hovering at 2.42, with smaller candles. Buyers are starting to tire.
$EVAA 4-Hour Chart: This is the second pump. It bottomed at 1.02, then surged to 2.48. More than doubled. Now consolidating at the top.
#EVAAUSDT 1-Day Chart: The old pattern is repeating. Before, it surged to 1.7, then fell to 1.0. Now it's surging again to 2.48, higher than before. 30-day performance is up 300 percent, and 180-day performance is up 442 percent. A strong uptrend.
Levels:
Resistance: 2.4824
Support: 2.29 - 2.04
Don't go Long at 2.42. Wait for a break above 2.4824 before joining, or wait for a correction to 2.04 and a bounce. If it breaks below 2.29, don't force a Long.
1
218
·
--
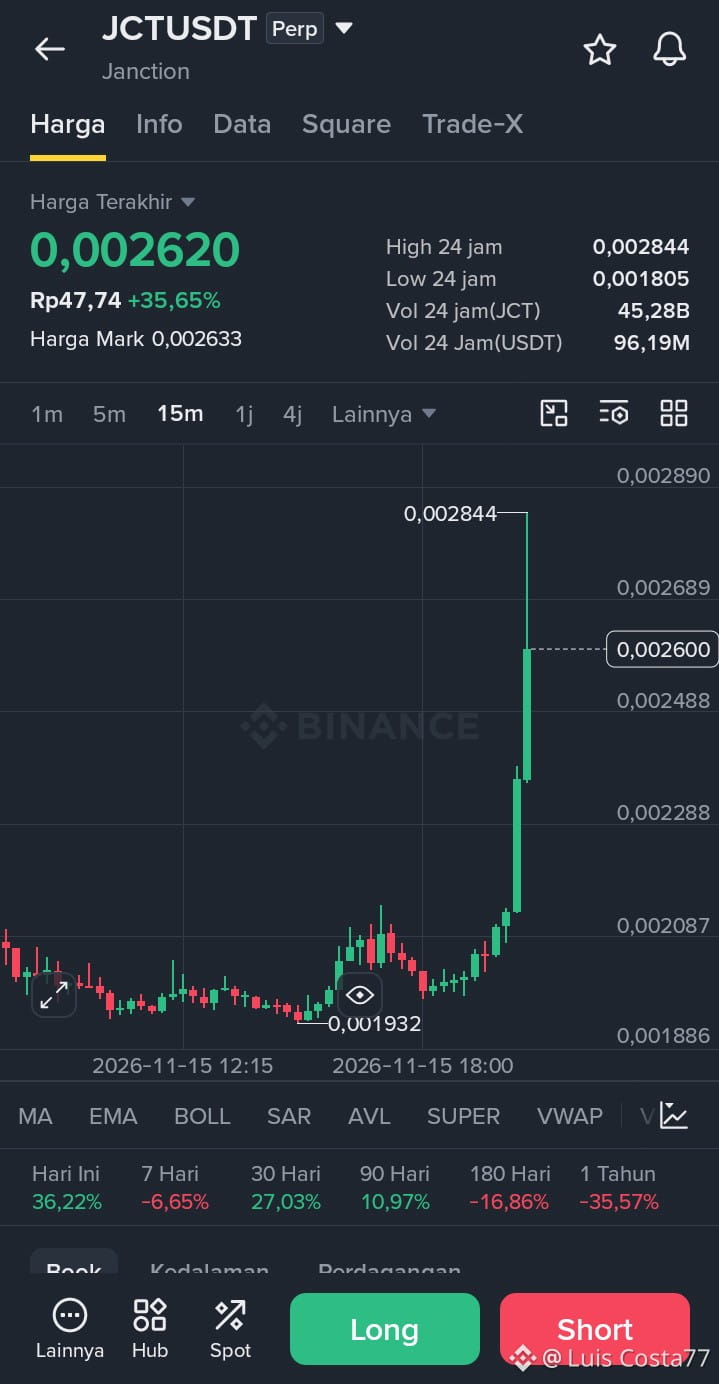
$JCT JCTUSDT - 15m - Long Sideways, Then Suddenly Explodes to the Top
1. Price Structure $JCT
Current price is 0.002620, up 35.65 percent. Daily high is 0.002844, daily low is 0.001805.
From the start of the chart through the middle, the price just moved sideways near the bottom, in the 0.0019 to 0.0020 area. Small ups and downs, with no direction.
Then it suddenly exploded with one huge vertical green candle to 0.002844. That was the daily peak. Now it’s dipping slightly to 0.002620, still holding near the top.
The rise was #JCTUSDT about 45 percent from the sideways area, in a very short time.
2. Volume and Momentum
Daily volume is 96.19M USDT, with JCT volume at 45.28B. That’s huge for a small coin like this.
This means the pump was backed by real money coming in all at once, not just a low-volume candle.
But because the rise was vertical, it’s vulnerable to profit-taking. Those who bought lower are already sitting on big gains; it’s just a matter of time before they sell.
3. Key Levels
- Resistance: 0.002844 - 0.002890. This is the daily peak; it needs to break through again for the price to continue higher.
- Support: 0.002600 - 0.002488. If 0.002600 breaks, the next level is 0.002488. If that breaks too, the price could return to the sideways area at 0.002087.
$JCT
{future}(JCTUSDT)
$JCT JCTUSDT - 15m - Long Sideways, Then Suddenly Explodes to the Top
1. Price Structure $JCT
Current price is 0.002620, up 35.65 percent. Daily high is 0.002844, daily low is 0.001805.
From the start of the chart through the middle, the price just moved sideways near the bottom, in the 0.0019 to 0.0020 area. Small ups and downs, with no direction.
Then it suddenly exploded with one huge vertical green candle to 0.002844. That was the daily peak. Now it’s dipping slightly to 0.002620, still holding near the top.
The rise was #JCTUSDT about 45 percent from the sideways area, in a very short time.
2. Volume and Momentum
Daily volume is 96.19M USDT, with JCT volume at 45.28B. That’s huge for a small coin like this.
This means the pump was backed by real money coming in all at once, not just a low-volume candle.
But because the rise was vertical, it’s vulnerable to profit-taking. Those who bought lower are already sitting on big gains; it’s just a matter of time before they sell.
3. Key Levels
- Resistance: 0.002844 - 0.002890. This is the daily peak; it needs to break through again for the price to continue higher.
- Support: 0.002600 - 0.002488. If 0.002600 breaks, the next level is 0.002488. If that breaks too, the price could return to the sideways area at 0.002087.
$JCT
1. Price Structure $JCT
Current price is 0.002620, up 35.65 percent. Daily high is 0.002844, daily low is 0.001805.
From the start of the chart through the middle, the price just moved sideways near the bottom, in the 0.0019 to 0.0020 area. Small ups and downs, with no direction.
Then it suddenly exploded with one huge vertical green candle to 0.002844. That was the daily peak. Now it’s dipping slightly to 0.002620, still holding near the top.
The rise was #JCTUSDT about 45 percent from the sideways area, in a very short time.
2. Volume and Momentum
Daily volume is 96.19M USDT, with JCT volume at 45.28B. That’s huge for a small coin like this.
This means the pump was backed by real money coming in all at once, not just a low-volume candle.
But because the rise was vertical, it’s vulnerable to profit-taking. Those who bought lower are already sitting on big gains; it’s just a matter of time before they sell.
3. Key Levels
- Resistance: 0.002844 - 0.002890. This is the daily peak; it needs to break through again for the price to continue higher.
- Support: 0.002600 - 0.002488. If 0.002600 breaks, the next level is 0.002488. If that breaks too, the price could return to the sideways area at 0.002087.
$JCT
1
383
·
--
$EVAA EVAAUSDT - Data - Price Up 117 Percent, But Everyone Is Still Short
1. Open Interest #EVAA
From 18:05 to 20:30, OI kept rising without dropping. It went from 14.6M to 15.4M.
Notional value also rose alongside it, from 33.0M to 37.3M. This means new money is still coming in, not just old positions being rotated.
This confirms that traders are still chasing the pump; it’s not just leftovers.
2. Top Trader Account Long/Short Ratio
This is the dangerous part. From 18:05 to 18:40, the ratio stayed at 0.52–0.53. Longs were around 34 percent versus 66 percent Shorts. Shorts had dominated from the start.
From 18:40 onward, it immediately broke down. The ratio kept falling without bouncing, reaching 0.46 at 20:30. Longs are now only around 31 percent versus 69 percent Shorts.
This means the higher the price goes, the more people are shorting. They think it has topped and want to short it.
$EVAA Conclusion:
Price: 2.4188, up 117.22 percent. OI rising + Shorts becoming more dominant = this is a classic short squeeze setup.
The growing pile of Shorts is what keeps pushing the price up, because they’re getting squeezed and have to buy back.
Don’t join the Shorts here; there’s a risk of another squeeze. If you want to join in, wait for the ratio to climb back above 0.52 before going Long. If the ratio breaks below 0.46, get ready for a big drop because Shorts have become too crowded.
$EVAA
{future}(EVAAUSDT)
$EVAA EVAAUSDT - Data - Price Up 117 Percent, But Everyone Is Still Short
1. Open Interest #EVAA
From 18:05 to 20:30, OI kept rising without dropping. It went from 14.6M to 15.4M.
Notional value also rose alongside it, from 33.0M to 37.3M. This means new money is still coming in, not just old positions being rotated.
This confirms that traders are still chasing the pump; it’s not just leftovers.
2. Top Trader Account Long/Short Ratio
This is the dangerous part. From 18:05 to 18:40, the ratio stayed at 0.52–0.53. Longs were around 34 percent versus 66 percent Shorts. Shorts had dominated from the start.
From 18:40 onward, it immediately broke down. The ratio kept falling without bouncing, reaching 0.46 at 20:30. Longs are now only around 31 percent versus 69 percent Shorts.
This means the higher the price goes, the more people are shorting. They think it has topped and want to short it.
$EVAA Conclusion:
Price: 2.4188, up 117.22 percent. OI rising + Shorts becoming more dominant = this is a classic short squeeze setup.
The growing pile of Shorts is what keeps pushing the price up, because they’re getting squeezed and have to buy back.
Don’t join the Shorts here; there’s a risk of another squeeze. If you want to join in, wait for the ratio to climb back above 0.52 before going Long. If the ratio breaks below 0.46, get ready for a big drop because Shorts have become too crowded.
$EVAA
1. Open Interest #EVAA
From 18:05 to 20:30, OI kept rising without dropping. It went from 14.6M to 15.4M.
Notional value also rose alongside it, from 33.0M to 37.3M. This means new money is still coming in, not just old positions being rotated.
This confirms that traders are still chasing the pump; it’s not just leftovers.
2. Top Trader Account Long/Short Ratio
This is the dangerous part. From 18:05 to 18:40, the ratio stayed at 0.52–0.53. Longs were around 34 percent versus 66 percent Shorts. Shorts had dominated from the start.
From 18:40 onward, it immediately broke down. The ratio kept falling without bouncing, reaching 0.46 at 20:30. Longs are now only around 31 percent versus 69 percent Shorts.
This means the higher the price goes, the more people are shorting. They think it has topped and want to short it.
$EVAA Conclusion:
Price: 2.4188, up 117.22 percent. OI rising + Shorts becoming more dominant = this is a classic short squeeze setup.
The growing pile of Shorts is what keeps pushing the price up, because they’re getting squeezed and have to buy back.
Don’t join the Shorts here; there’s a risk of another squeeze. If you want to join in, wait for the ratio to climb back above 0.52 before going Long. If the ratio breaks below 0.46, get ready for a big drop because Shorts have become too crowded.
$EVAA
1
341
·
--
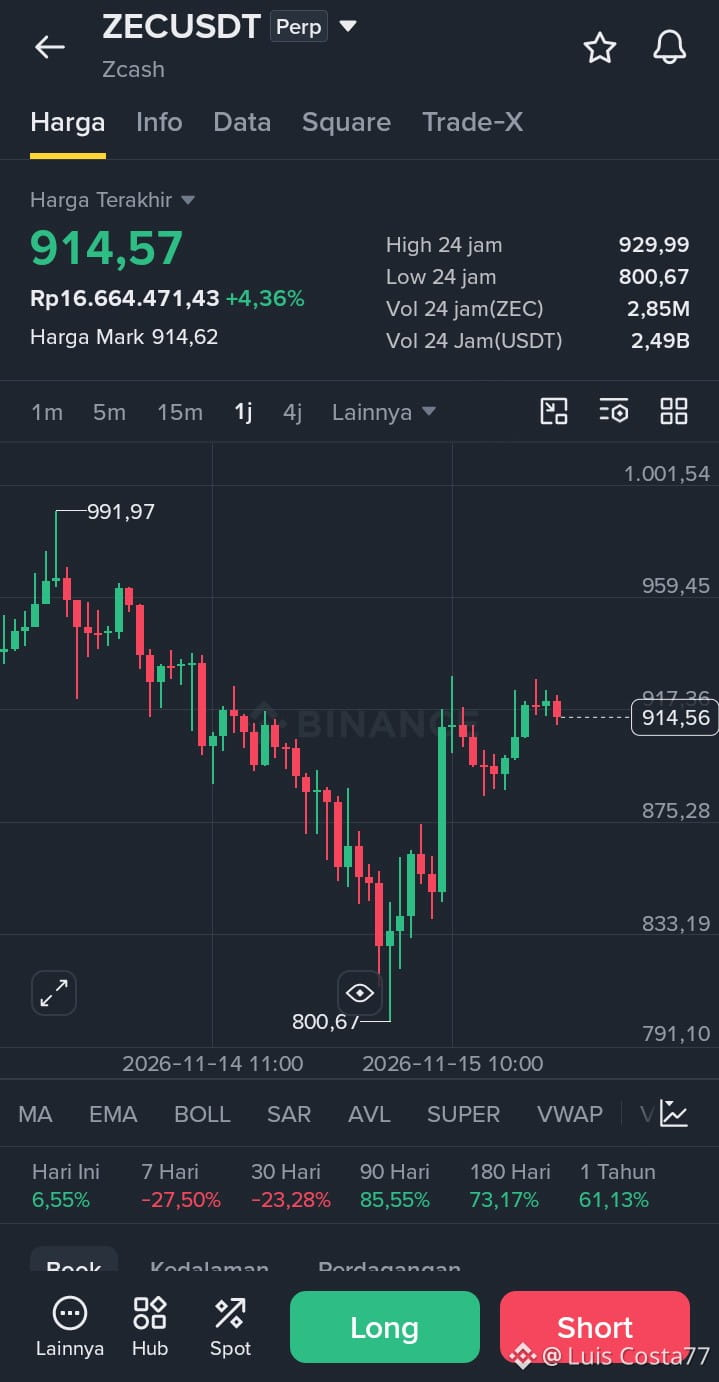
$ZEC *ZECUSDT - 1h - Crashed Through to 800, Now Rebounding to 914*
*1. Price Structure*
The current price is 914.57, +4.36%. High: 929.99, Low: 800.67.
Yesterday #ZECUSDT , it kept falling from 991.97 without any meaningful bounce, until it broke down to 800.67. That was the low, about 19% down from the peak.
After that, it bounced sharply in a V-shape. One big green candle surged up to around 917, and now it's hovering at 914.57. That's about a 14% rise from the low.
*2. Volume & Momentum #ZECUSDT *
Volume is 2.49B, huge for ZEC. This means the rebound is backed by real money, not just a slight bounce.
But the price is now being held below 929.99. That's the 24-hour high and the nearest resistance. It hasn't broken through yet, so buyers are still facing resistance there.
*3. Key Levels*
- *Resistance:* 929.99 - 959.45. It needs to break above 929.99 first before it can comfortably continue toward 959.
- *Support:* 875.28 - 833.19. If 875 breaks, the next level is 833.
*$ZEC Long-Term Performance*
Today it's +6.55%, but over 7 days it's -27.50%, and over 30 days it's -23.28%. It's still deeply in the red. But over 90 days it's +85.55%, over 180 days +73.17%, and over 1 year +61.13%. So this is still a long-term uptrend that's undergoing a deep correction.
* #ZECUSDT Conclusion:*
This is a rebound phase after a deep correction, not a new uptrend. Don't chase a Long at 914.
The safest approach is to wait for a break above 929.99, then enter.
$ZEC
{future}(ZECUSDT)
$ZEC *ZECUSDT - 1h - Crashed Through to 800, Now Rebounding to 914*
*1. Price Structure*
The current price is 914.57, +4.36%. High: 929.99, Low: 800.67.
Yesterday #ZECUSDT , it kept falling from 991.97 without any meaningful bounce, until it broke down to 800.67. That was the low, about 19% down from the peak.
After that, it bounced sharply in a V-shape. One big green candle surged up to around 917, and now it's hovering at 914.57. That's about a 14% rise from the low.
*2. Volume & Momentum #ZECUSDT *
Volume is 2.49B, huge for ZEC. This means the rebound is backed by real money, not just a slight bounce.
But the price is now being held below 929.99. That's the 24-hour high and the nearest resistance. It hasn't broken through yet, so buyers are still facing resistance there.
*3. Key Levels*
- *Resistance:* 929.99 - 959.45. It needs to break above 929.99 first before it can comfortably continue toward 959.
- *Support:* 875.28 - 833.19. If 875 breaks, the next level is 833.
*$ZEC Long-Term Performance*
Today it's +6.55%, but over 7 days it's -27.50%, and over 30 days it's -23.28%. It's still deeply in the red. But over 90 days it's +85.55%, over 180 days +73.17%, and over 1 year +61.13%. So this is still a long-term uptrend that's undergoing a deep correction.
* #ZECUSDT Conclusion:*
This is a rebound phase after a deep correction, not a new uptrend. Don't chase a Long at 914.
The safest approach is to wait for a break above 929.99, then enter.
$ZEC
*1. Price Structure*
The current price is 914.57, +4.36%. High: 929.99, Low: 800.67.
Yesterday #ZECUSDT , it kept falling from 991.97 without any meaningful bounce, until it broke down to 800.67. That was the low, about 19% down from the peak.
After that, it bounced sharply in a V-shape. One big green candle surged up to around 917, and now it's hovering at 914.57. That's about a 14% rise from the low.
*2. Volume & Momentum #ZECUSDT *
Volume is 2.49B, huge for ZEC. This means the rebound is backed by real money, not just a slight bounce.
But the price is now being held below 929.99. That's the 24-hour high and the nearest resistance. It hasn't broken through yet, so buyers are still facing resistance there.
*3. Key Levels*
- *Resistance:* 929.99 - 959.45. It needs to break above 929.99 first before it can comfortably continue toward 959.
- *Support:* 875.28 - 833.19. If 875 breaks, the next level is 833.
*$ZEC Long-Term Performance*
Today it's +6.55%, but over 7 days it's -27.50%, and over 30 days it's -23.28%. It's still deeply in the red. But over 90 days it's +85.55%, over 180 days +73.17%, and over 1 year +61.13%. So this is still a long-term uptrend that's undergoing a deep correction.
* #ZECUSDT Conclusion:*
This is a rebound phase after a deep correction, not a new uptrend. Don't chase a Long at 914.
The safest approach is to wait for a break above 929.99, then enter.
$ZEC
1
218
Log in to explore more content
Join global crypto users on Binance Square
⚡️ Get latest and useful information about crypto.
💬 Trusted by the world’s largest crypto exchange.
👍 Discover real insights from verified creators.
Email / Phone number
Trending Topics
AnthropicIPOTestsInvestorAppetiteForAI
56 views
10 Discussing
🚨 ANTHROPIC'S IPO COULD BE THE NEXT BIG TEST FOR AI STOCKS — IS WALL STREET READY? 🤖🔥
Investor appetite for AI is facing a major test as Anthropic's anticipated IPO draws attention and capital.
$NVDA, $MSFT and AI-related stocks are in focus. Will fresh demand fuel another AI rally, or will investors rotate capital away from existing positions?
📊 TRADING SETUP — AI SECTOR:
🟢 Bullish: Strong IPO demand + continued AI spending.
🔴 Bearish: Valuation concerns + capital rotation + profit-taking.
⚠️ No confirmed IPO pricing or guaranteed capital inflows yet.
IS ANTHROPIC THE NEXT AI CATALYST — OR THE NEXT BUY-THE-RUMOR, SELL-THE-NEWS EVENT? 👀
$NVDA $MSFT $ANTHROPIC
#anthropicipotestsinvestorappetiteforai #A Packed Week of Earnings and Data Tests Markets #HuangReportedlyConsidersReturnToNvidia #CryptoSelloffTriggersMultipleWhaleLiquidations #AnthropicIPO
KimHotbae
·0 Likes
·125 views
A Packed Week of Earnings and Data Tests Markets
2,688 views
48 Discussing
HuangReportedlyConsidersReturnToNvidia
15,934 views
253 Discussing