

Usagi_
30 Posts

Usagi_
Report
Block User
On my way to 100,000 USDT 💫🥺https://xhslink.cn/m/9ZtMmarYODw
4 Following
18 Followers
48 Liked
Posts
·
--
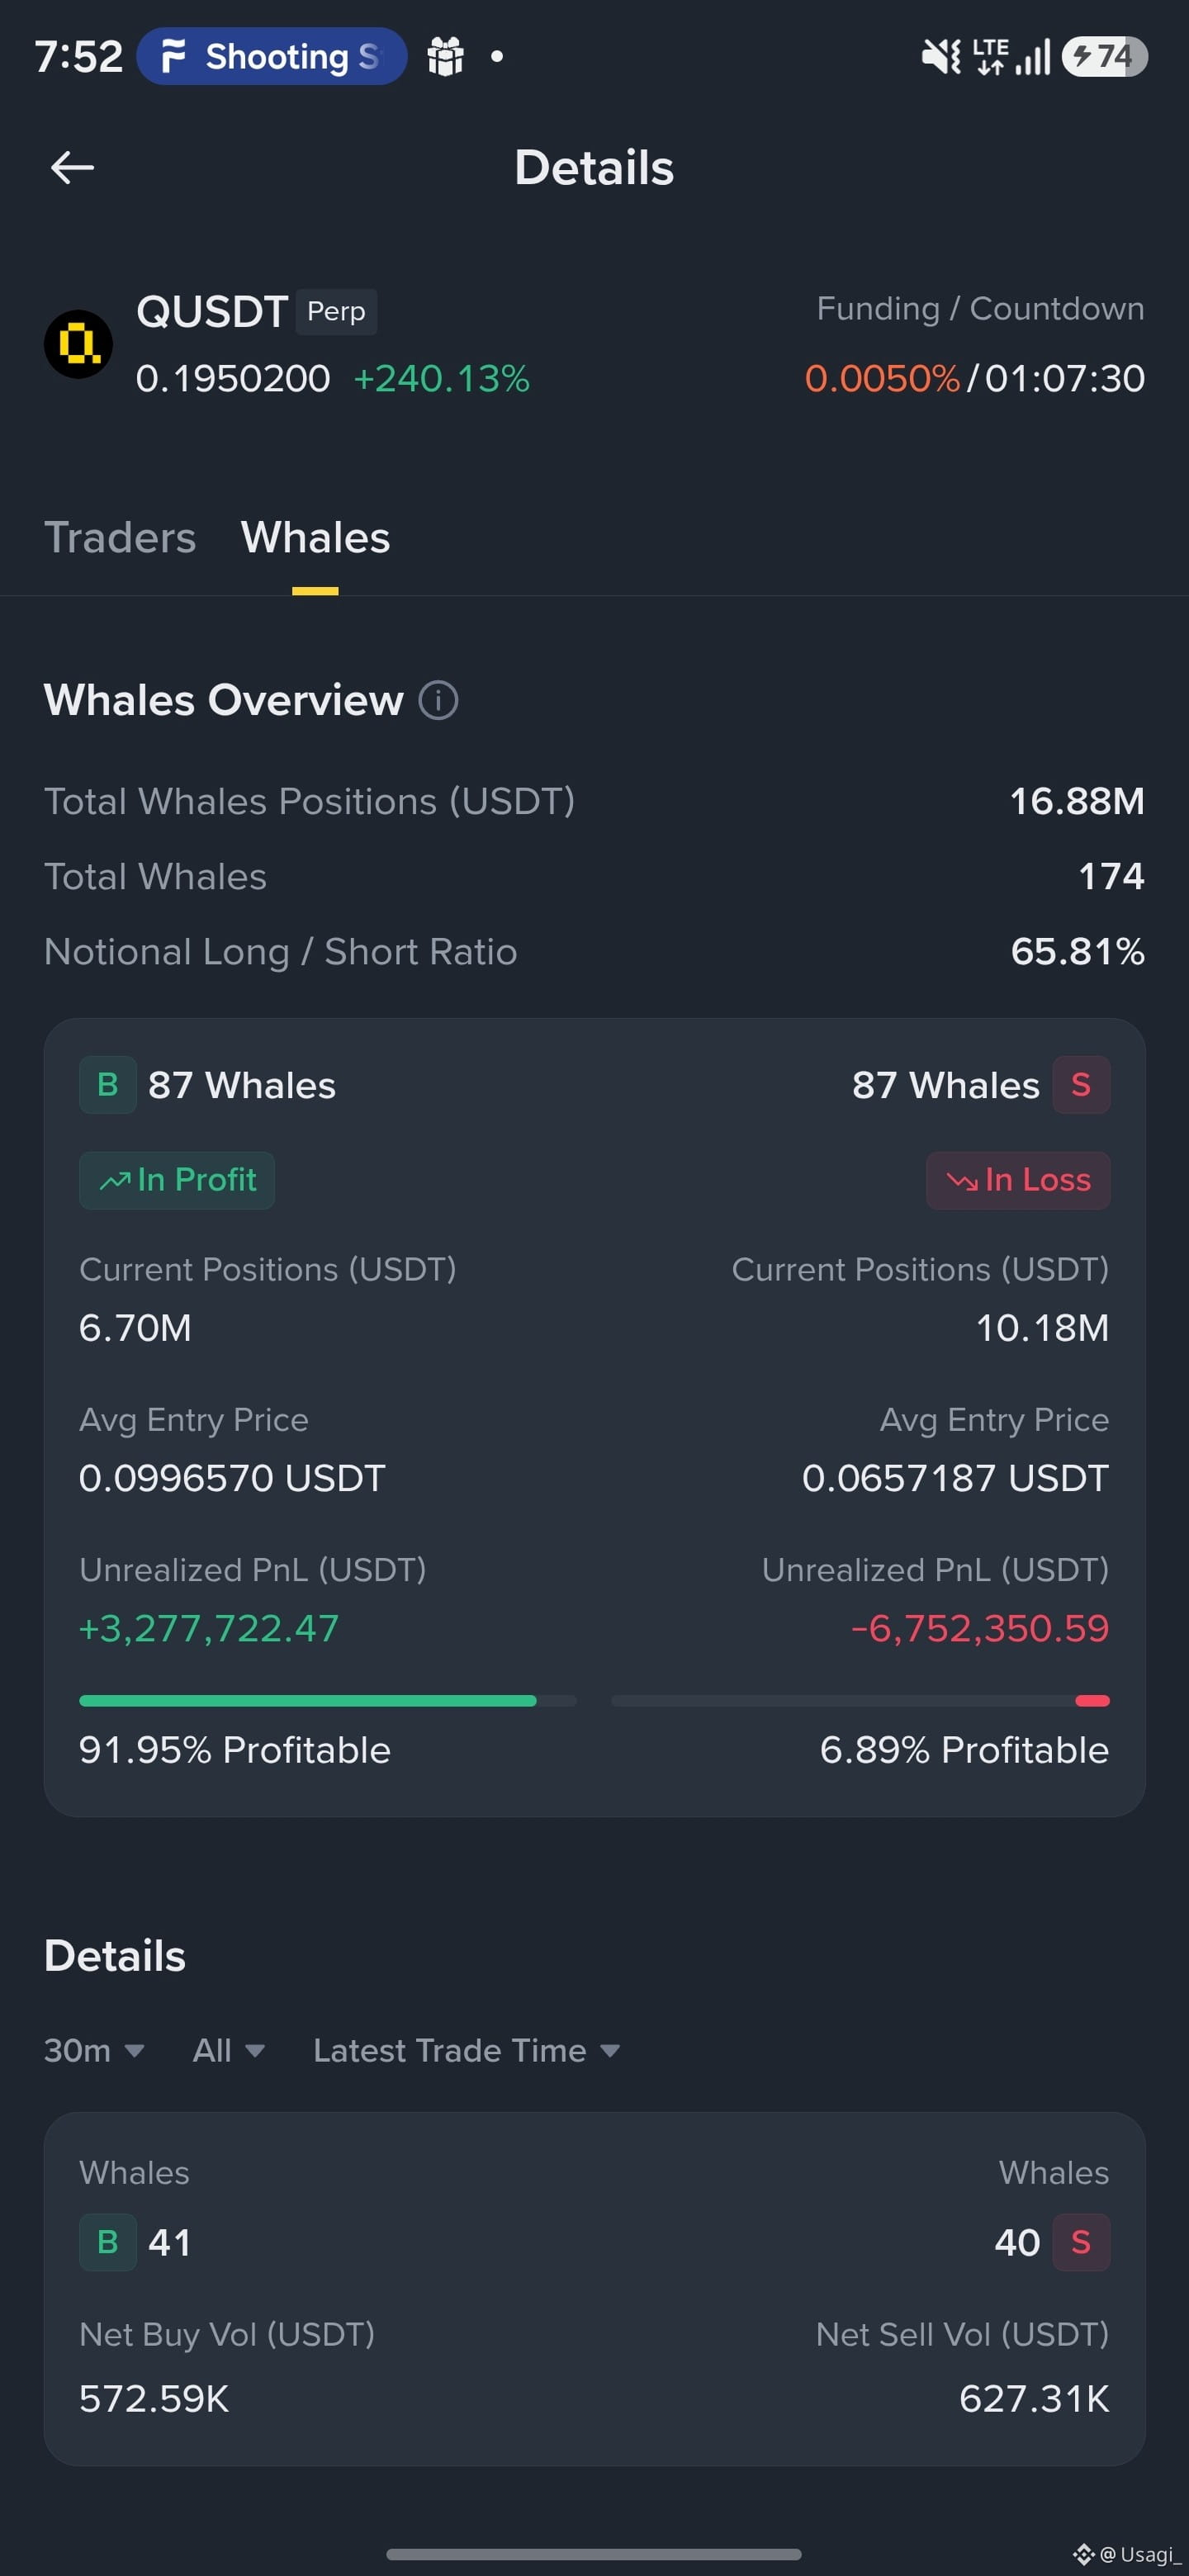
30D trade $Q 34.8K USDT
$Q
I'm so afraid of what kind of scenario will unfold. Will there be a large sell-off after the sharp rise?
$Q
I'm so afraid of what kind of scenario will unfold. Will there be a large sell-off after the sharp rise?
I'm so afraid of what kind of scenario will unfold. Will there be a large sell-off after the sharp rise?
1
2.2k
·
--
$PENDLE
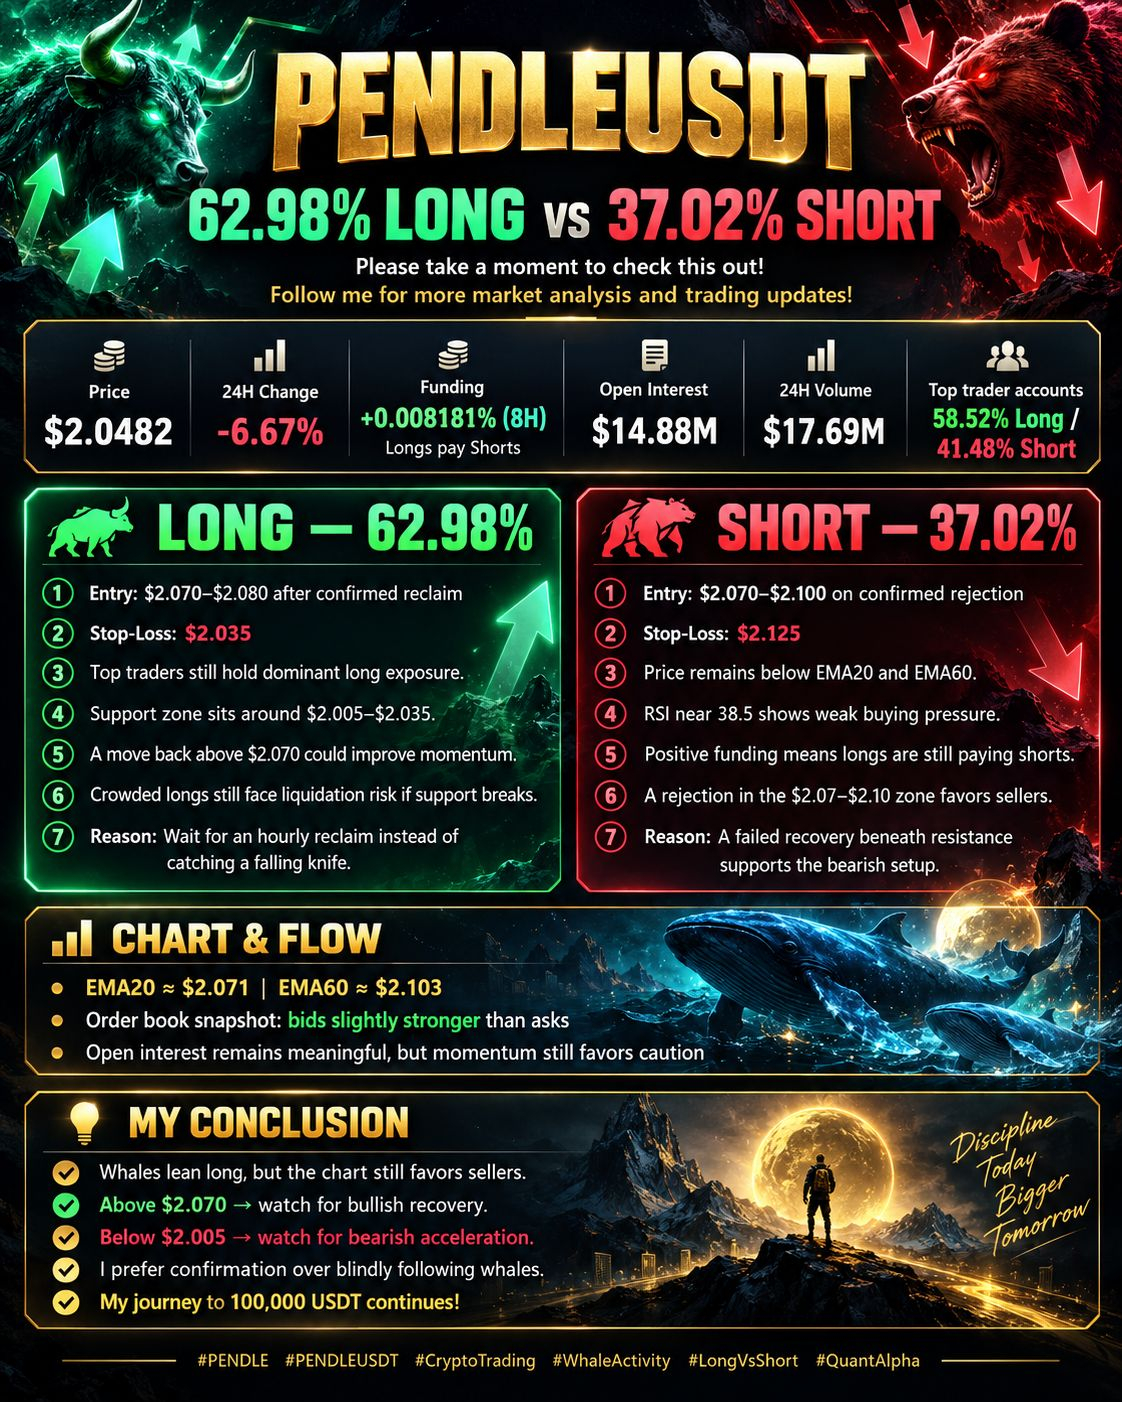
🐋 PENDLEUSDT — 62.98% Long vs 37.02% Short!
Please take a moment to check this out!
🤍 Follow me for more whale and market analysis!
📊 MARKET DATA
Price: $2.0482 (-6.67%)
Whale Long: 62.98% | Short: 37.02%
Funding: +0.008181% (last settled)
Open Interest: $14.88M
24H Volume: $17.69M
🟢 LONG — 62.98%
Entry: $2.070–$2.080 (confirmed reclaim)
Stop-Loss: $2.035
• Top traders favor long exposure.
• Support: $2.005–$2.035.
• A reclaim of $2.07 could trigger recovery.
• Rising volume would confirm strength.
• Watch for a move toward $2.10.
• Support failure risks long liquidations.
🔴 SHORT — 37.02%
Entry: $2.070–$2.100 (rejection)
Stop-Loss: $2.125
• Price trades below EMA20 and EMA60.
• RSI near 38.5 signals weakness.
• Positive funding favors short holders.
• Sellers control short-term momentum.
• Resistance remains near $2.07–$2.10.
• Breaking $2.005 risks further downside.
⚠️ KEY SIGNALS
EMA20: $2.071 | EMA60: $2.103
Order book: Bids slightly exceed asks.
Volume confirms active selling pressure.
🐋 Whales lean LONG, but the trend remains bearish!
📈 Above $2.070 → Bullish recovery.
📉 Below $2.005 → Bearish continuation.
Trade the confirmation, not the emotion.
💛 Road to 100,000 USDT!
#whales? #QuantAlpha
219
·
--
$DOOD
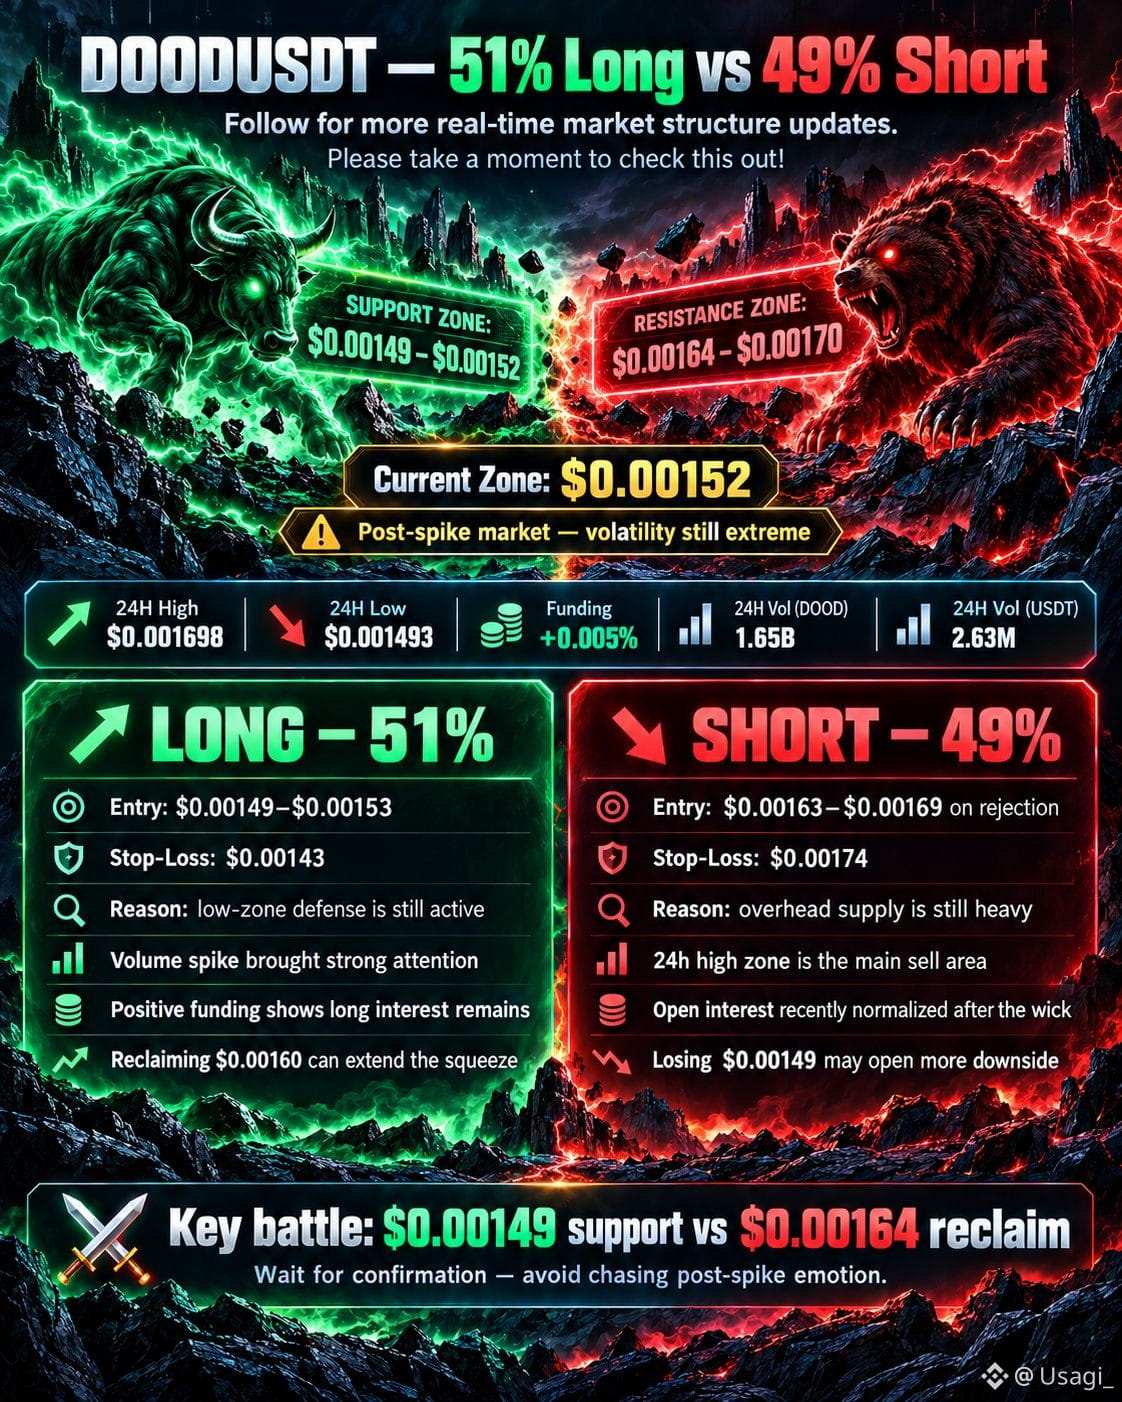
DOODUSDT — Long vs Short Battle Setup ⚔️
Follow for more trade ideas and market breakdowns 👀
Please take a moment to check this out!
🟢 LONG
Entry: Watch the support reclaim zone
Stop-loss: Below the recent breakdown level
Long is valid only if buyers defend support and volume returns.
Order book support near the current base is important.
If buy walls hold and resistance is reclaimed, upside momentum may continue.
Rising volume with bullish candles would strengthen the long setup. 📈
🔴 SHORT
Entry: Rejection near resistance / weak bounce zone
Stop-loss: Above the recent rejection high
Short is valid if the rebound stays weak and sellers remain active.
Sell walls near resistance could limit further upside.
If volume fades during the bounce, downside pressure may return quickly.
Weak MACD and RSI recovery would support another rejection. 📉
⚠️ This is a clear battle zone between buyers and sellers.
Watch the order book, volume reaction, and resistance breakout carefully.
No clean breakout = patience.
Clear confirmation = follow the stronger side. 🔥
366
·
--
$$Q
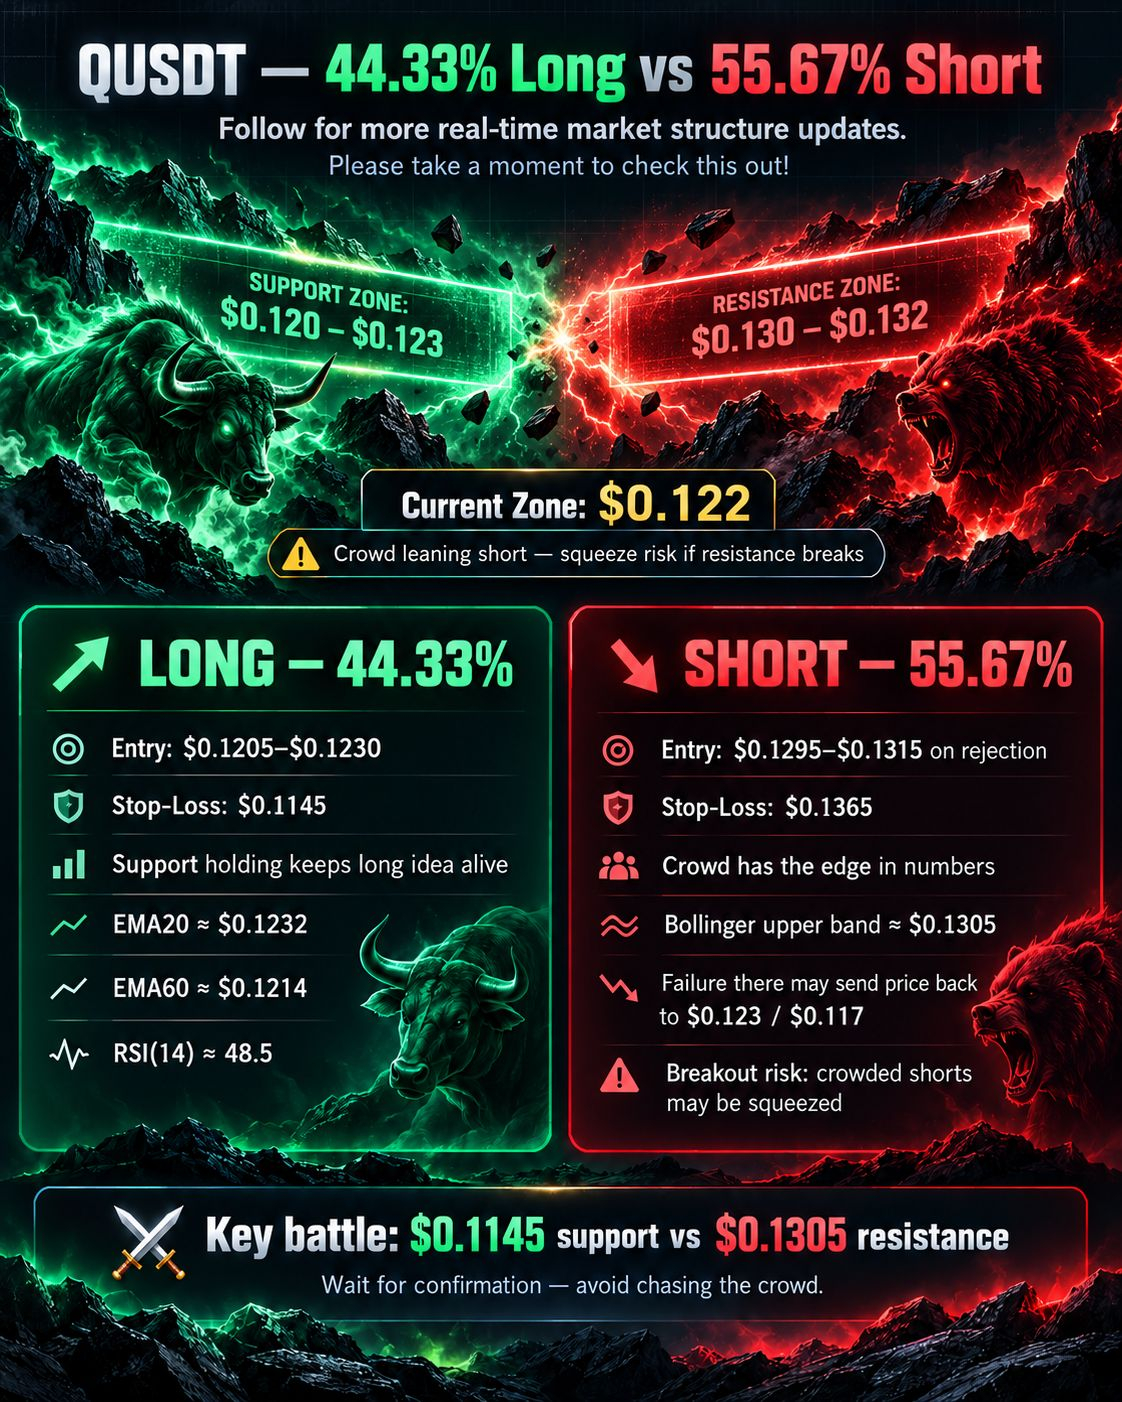
⚠️ QUSDT: 44.33% Long vs 55.67% Short — The Crowd Is Leaning Short. Is That the Trap?
Follow me for more real-time market structure updates. 🤍
Please take a moment to check this out!
QUSDT is sitting near $0.122, while more accounts are positioned short. 👀
But price is still holding above the 60H EMA, so blindly following the majority could be dangerous.
🟢 LONG — 44.33%
Entry: $0.1205–$0.1230
Stop-Loss: $0.1145
The long setup remains valid while the recent support zone continues to hold.
EMA20 ≈ $0.1232 and EMA60 ≈ $0.1214 — price is sitting directly around this decision zone.
Bollinger midline ≈ $0.1236, while the lower band near $0.1166 provides the next major support area.
RSI(14) ≈ 48.5, so momentum is neutral rather than overheated. 📈
🔴 SHORT — 55.67%
Entry: $0.1295–$0.1315 on rejection
Stop-Loss: $0.1365
Shorts have the numerical advantage, but that alone does not guarantee downside.
The Bollinger upper band is near $0.1305, making this the first meaningful rejection zone.
A failure around $0.130–$0.132 could push price back toward $0.123 and $0.117.
But a clean breakout above this area could force crowded shorts to cover quickly. 🔥
My focus: $0.1145 support vs $0.1305 resistance.
Until one of them breaks decisively, I’m watching confirmation rather than chasing. ⚠️
714
·
--
How do you manage your positions when your goal is to reach 100,000 USDT? 📈
I’m still learning and working hard toward my goal, one trade at a time. If you have any experience, strategies, or risk-management advice, I would truly appreciate it if you shared them with me. 🙏
Please help me move one step closer to my goal.
Road to 100,000 USDT ✨
I’m still learning and working hard toward my goal, one trade at a time. If you have any experience, strategies, or risk-management advice, I would truly appreciate it if you shared them with me. 🙏
Please help me move one step closer to my goal.
Road to 100,000 USDT ✨

50
·
--
$AKE $BANK There are signs similar to those of a bank.
$AKE $BANK There are signs similar to those of a bank.
340
·
--
$BANK
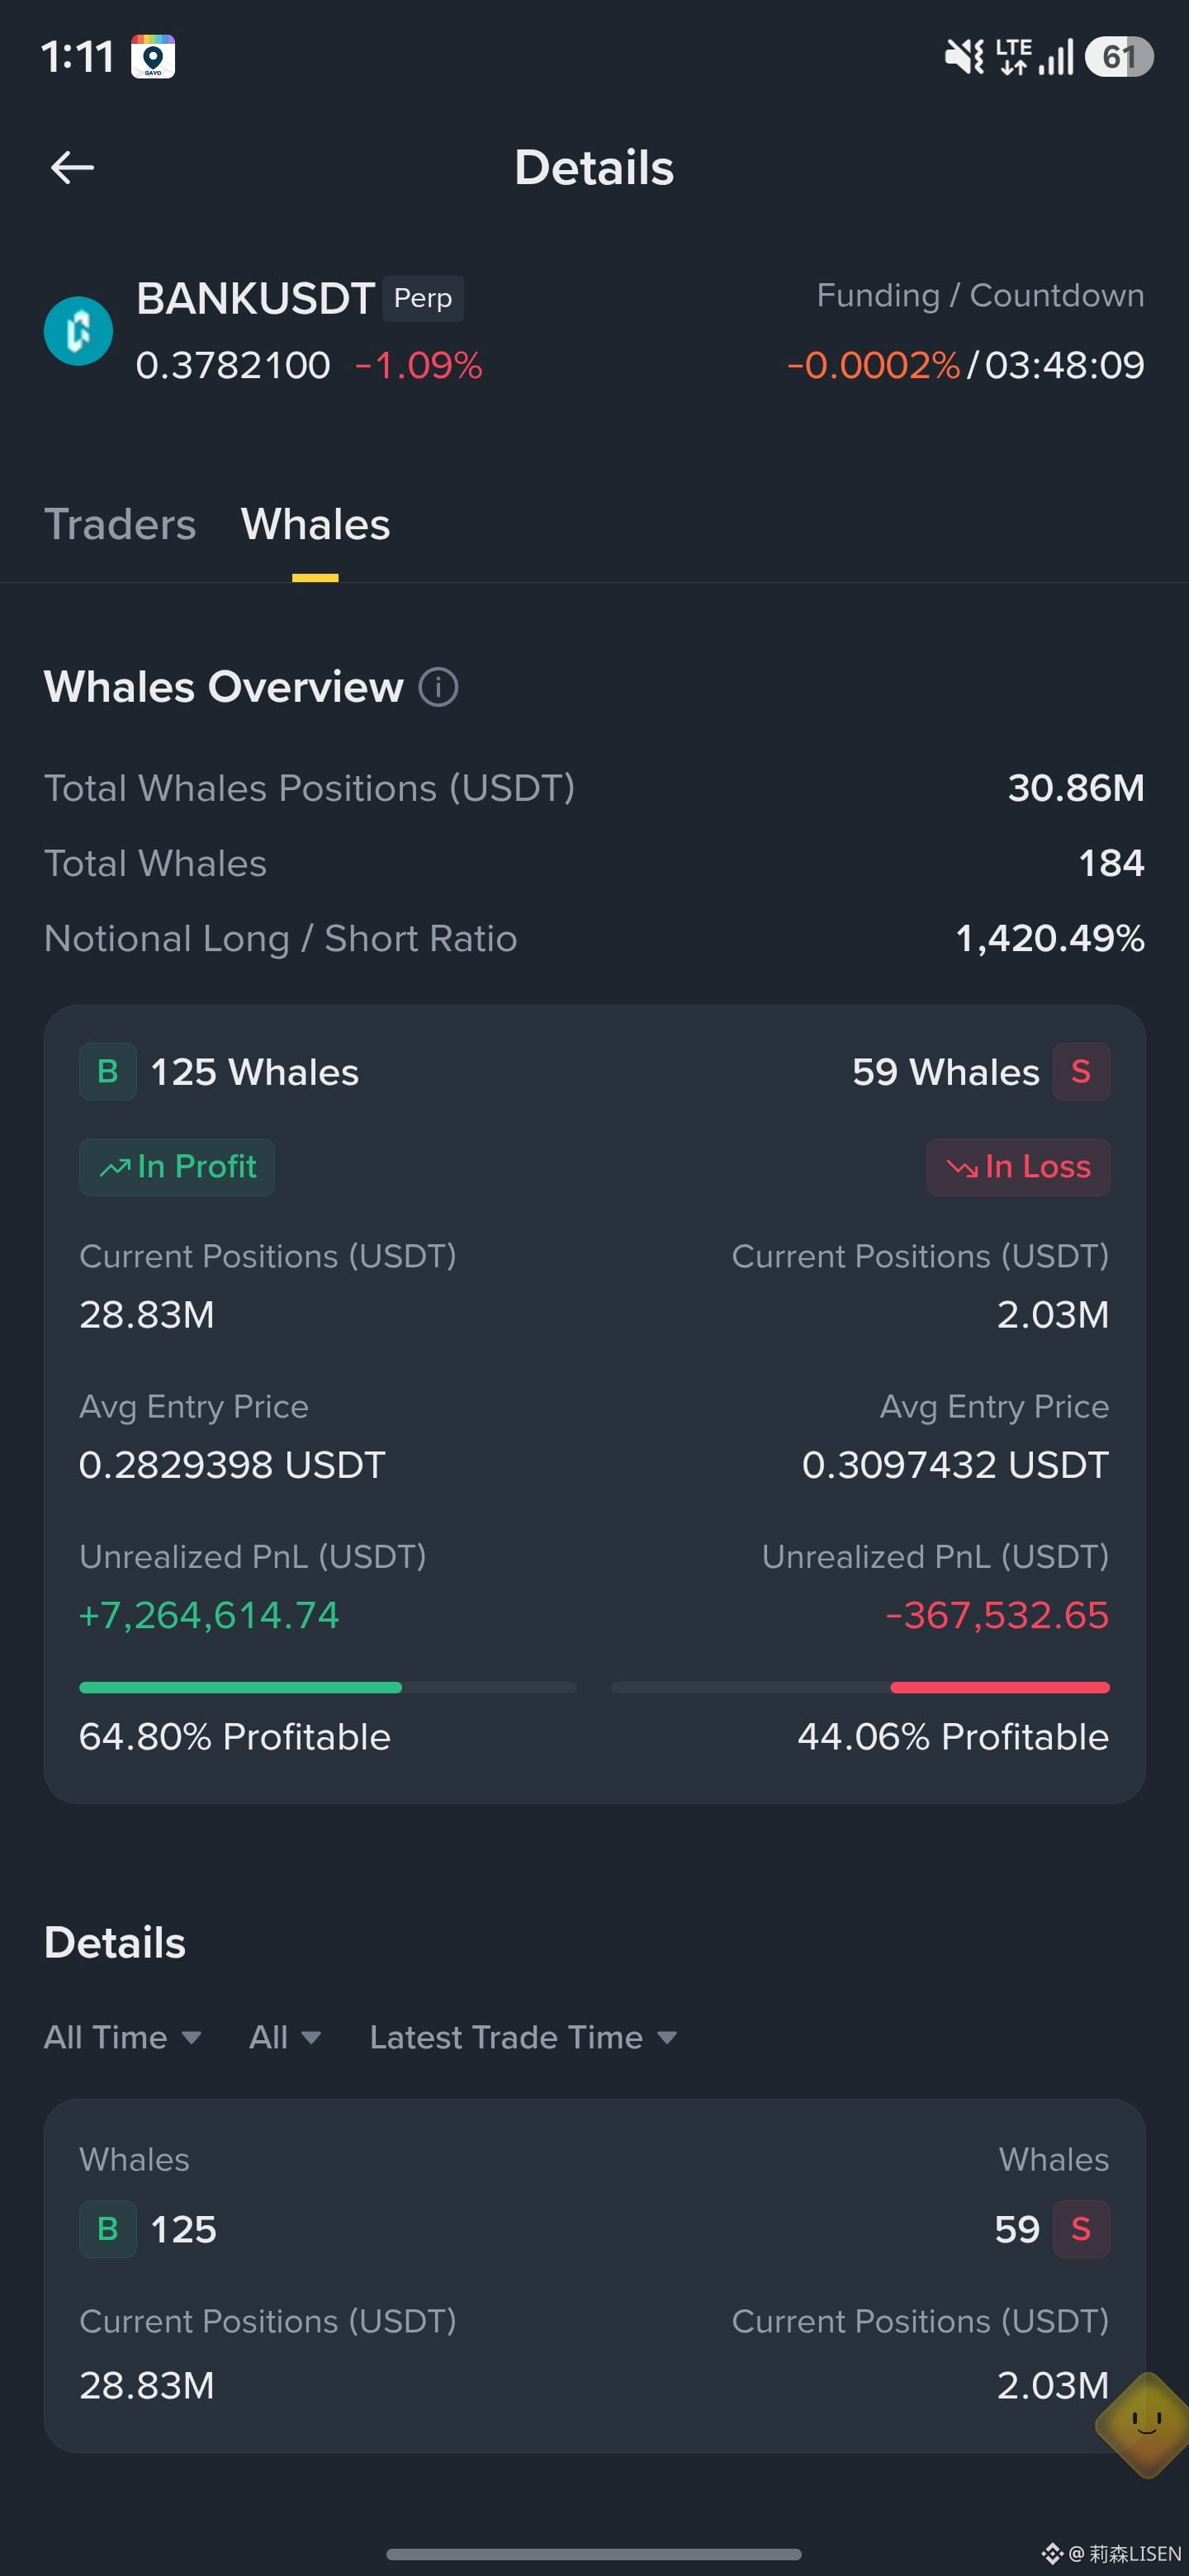
We’ve seen this same pattern time and time again… and as always, the whales moved first. 👀
BANK whale longs now total $28.83M, while shorts hold only $2.03M.
Long whales entered near $0.283 and are already sitting on more than $7.26M in unrealized profit. 📈
Funding remains slightly negative, which means bearish positions are still present. If the price continues to hold above support, those shorts could become fuel for another move higher. 🔥
Still, one-sided positioning can reverse quickly. I’m watching carefully and avoiding blind FOMO. ⚠️
The pattern is familiar. Now we wait for confirmation. 🤍
1
93
·
--
$ESP
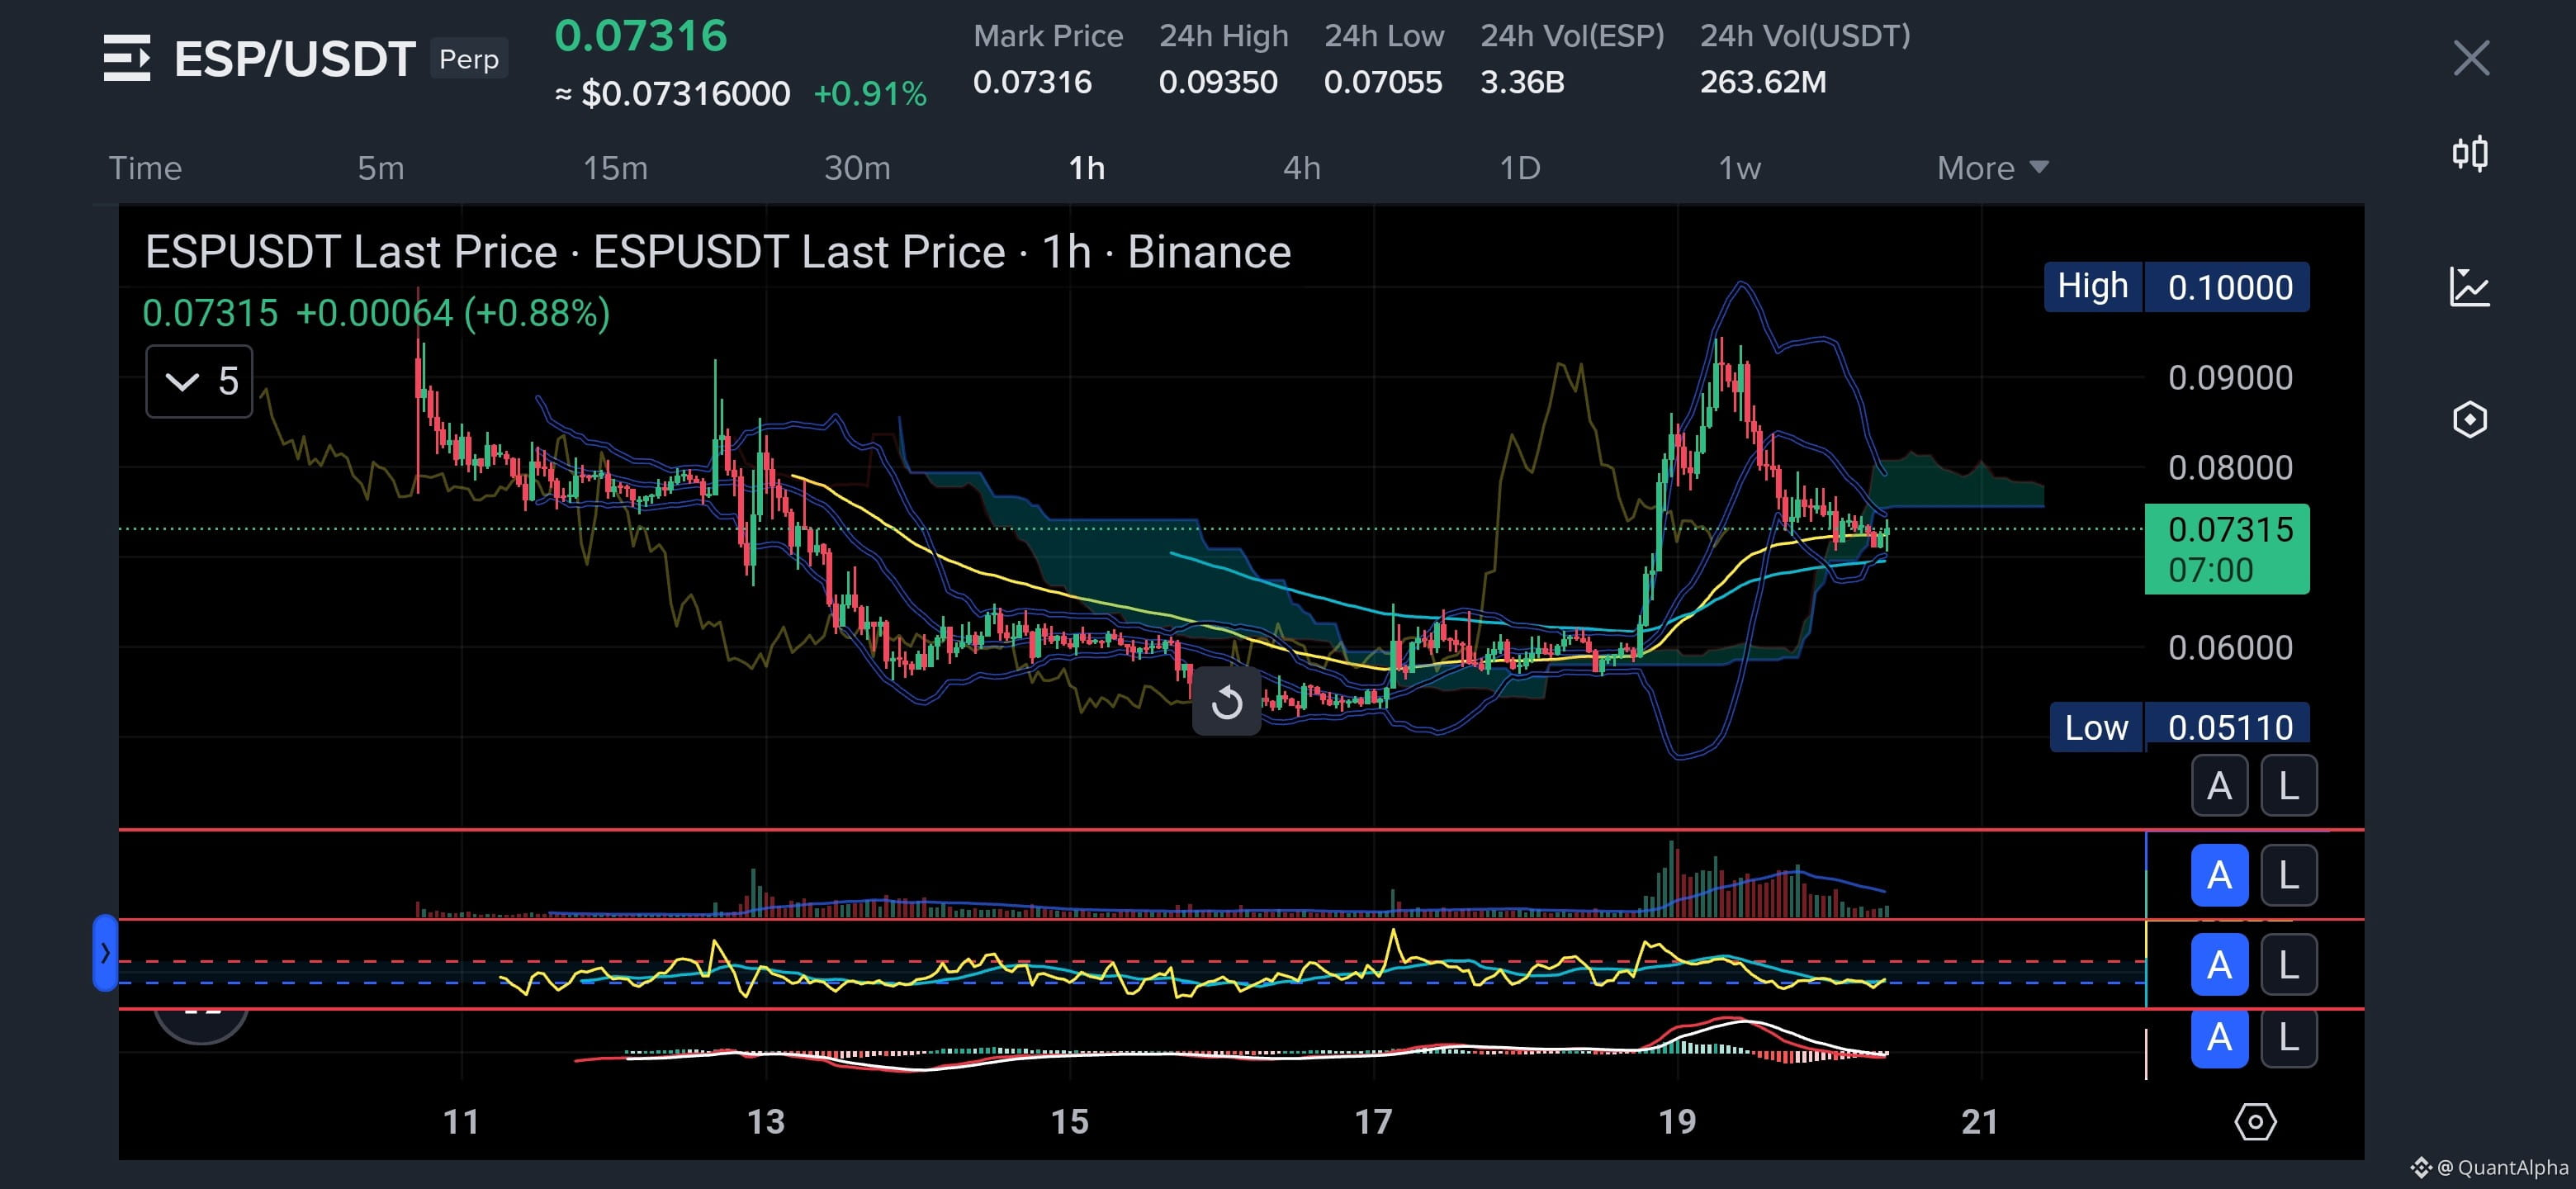
🔥 ESP Long 52% vs Short 48% — Compression before expansion
Follow for clean probability setups 📊
🟢 LONG
Entry: 0.071 ~ 0.073
Stop-loss: 0.067
Holding above key support and EMA zone
Price stabilizing above mid Bollinger
Cloud support forming on higher timeframe
MACD cooling but structure still bullish
🔴 SHORT
Entry: 0.085 ~ 0.090
Stop-loss: 0.095
Strong rejection area and liquidity zone
Upper Bollinger + previous supply
Momentum fading after impulse
Trapped longs above could fuel downside 😎📉
82
·
--
$POWER
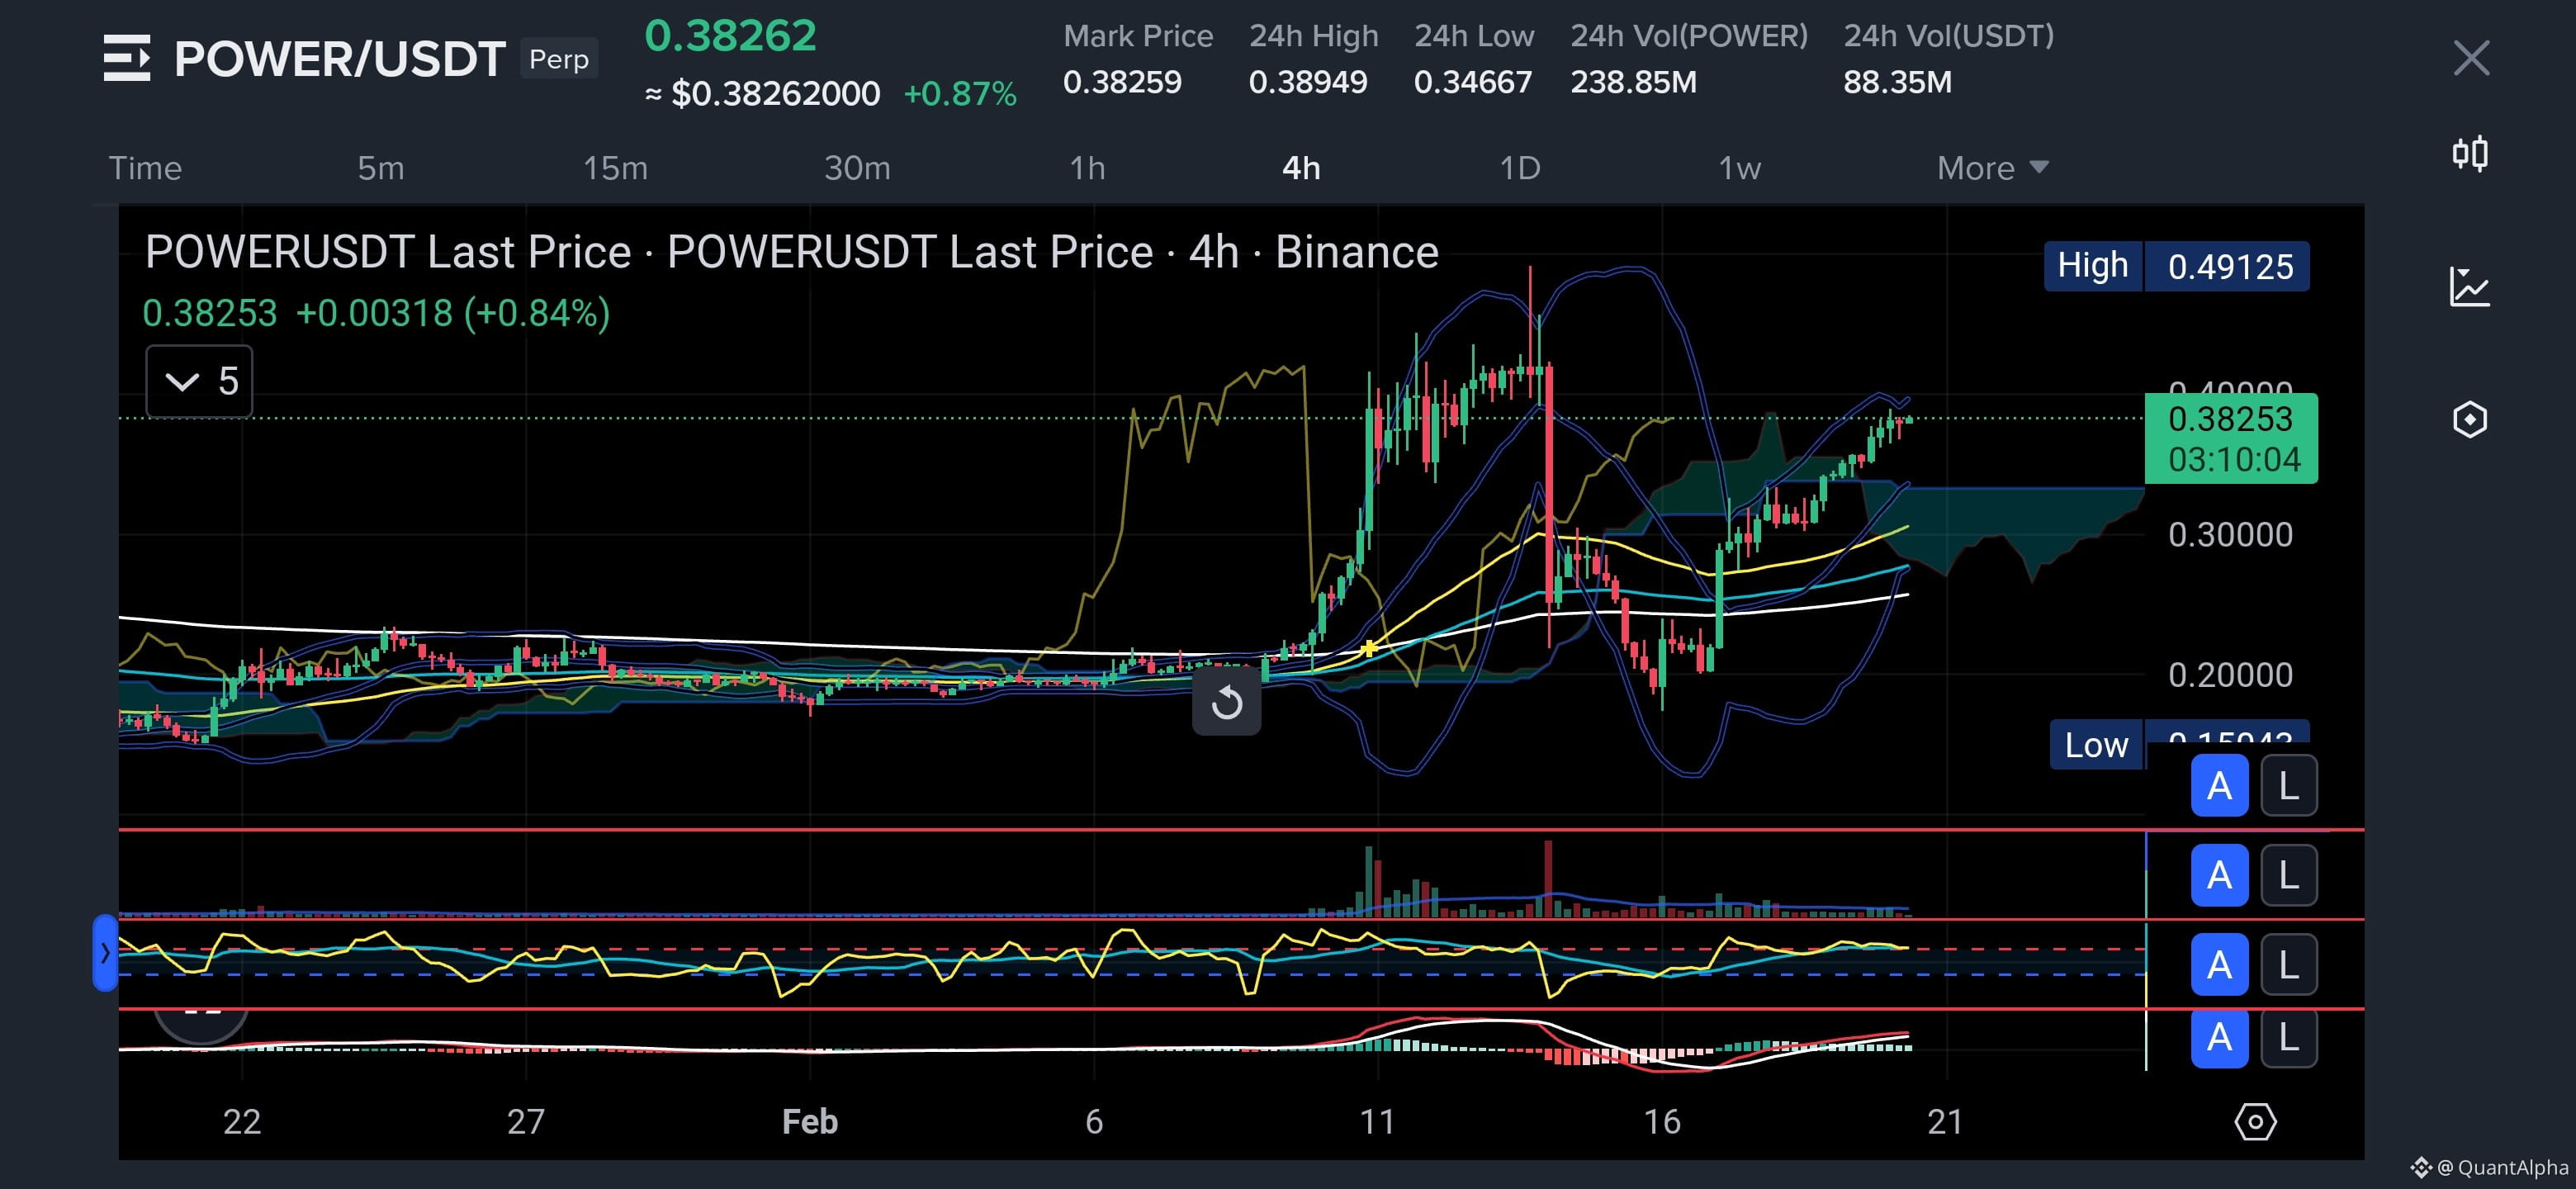
⚡ POWER Long 54% vs Short 46% — Momentum building again
Please take a moment and follow for high-probability setups 📊
🟢 LONG
Entry: 0.35 ~ 0.37
Stop-loss: 0.32
Pullback into strong support zone
Price holding above EMA structure
Bollinger mid acting as dynamic support
MACD turning positive, momentum recovering
🔴 SHORT
Entry: 0.41 ~ 0.44
Stop-loss: 0.47
Previous supply + resistance area
Upper Bollinger band rejection likely
Liquidity stacked above recent highs
Trend still vulnerable if breakout fails 😎📉
1
104
·
--
$SUI
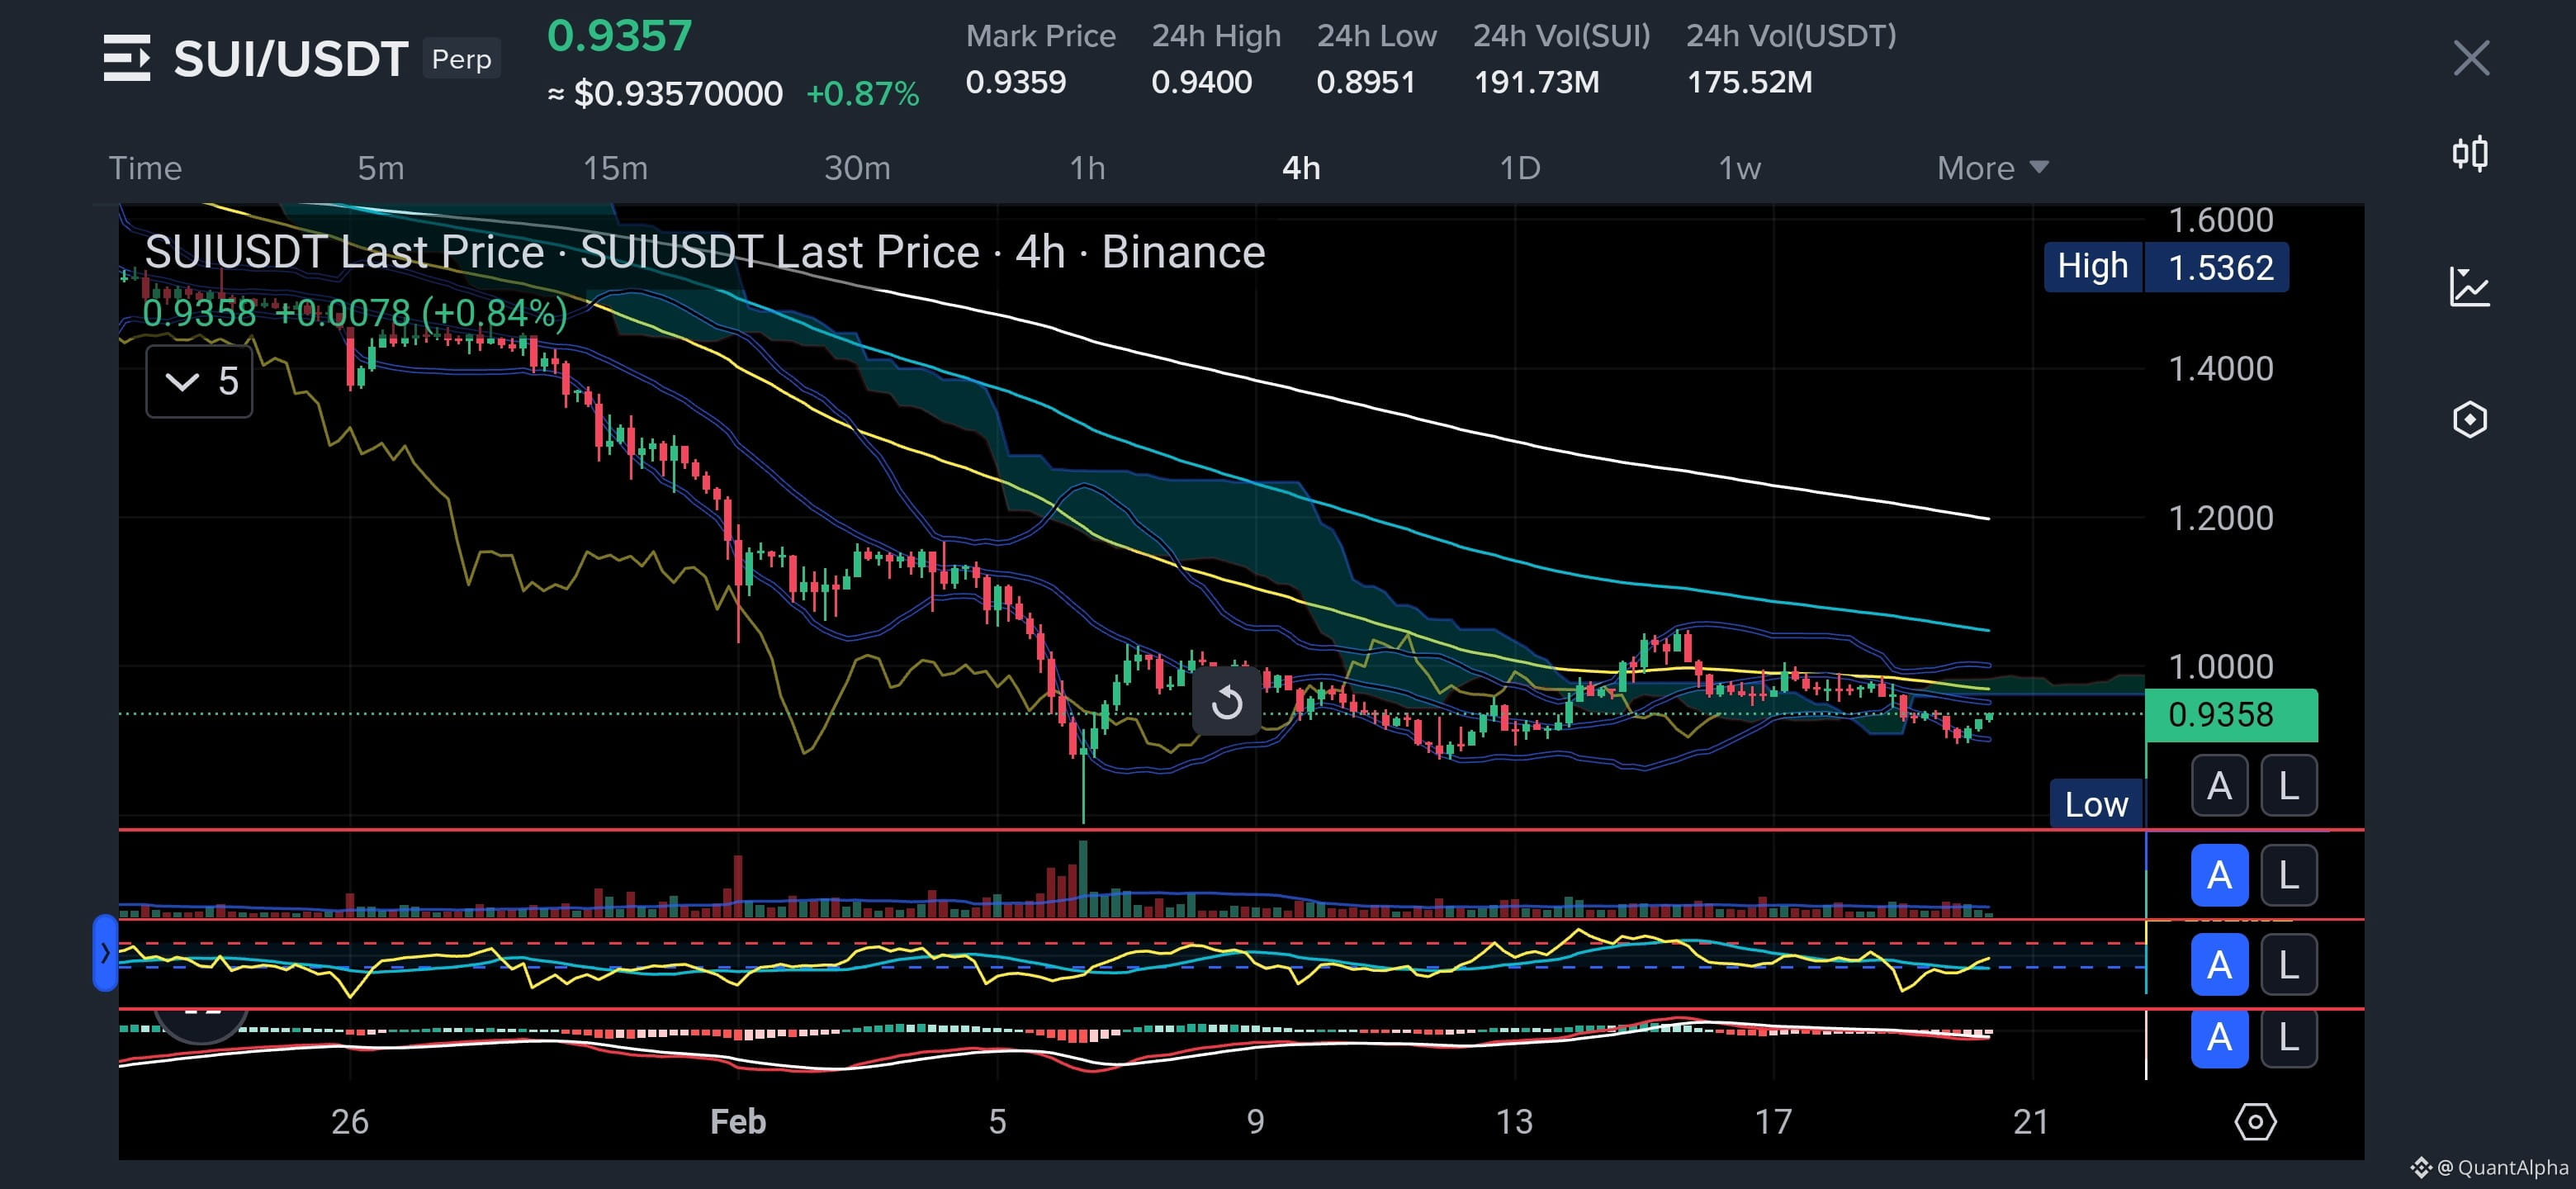
🔥 SUI Long 52% vs Short 48% — A breakout is coming
Please take a moment and follow for real-time setups 📊
🟢 LONG
Entry: 0.90 ~ 0.92
Stop-loss: 0.87
Strong support retest zone
Price holding near Bollinger lower band
CCI showing oversold → rebound potential
MACD momentum slowing, reversal possible
🔴 SHORT
Entry: 0.98 ~ 1.02
Stop-loss: 1.05
Cloud + EMA resistance area
Sell liquidity stacked above
Repeated rejection at Bollinger mid
Overall structure still bearish 😎📉
1
65
·
--
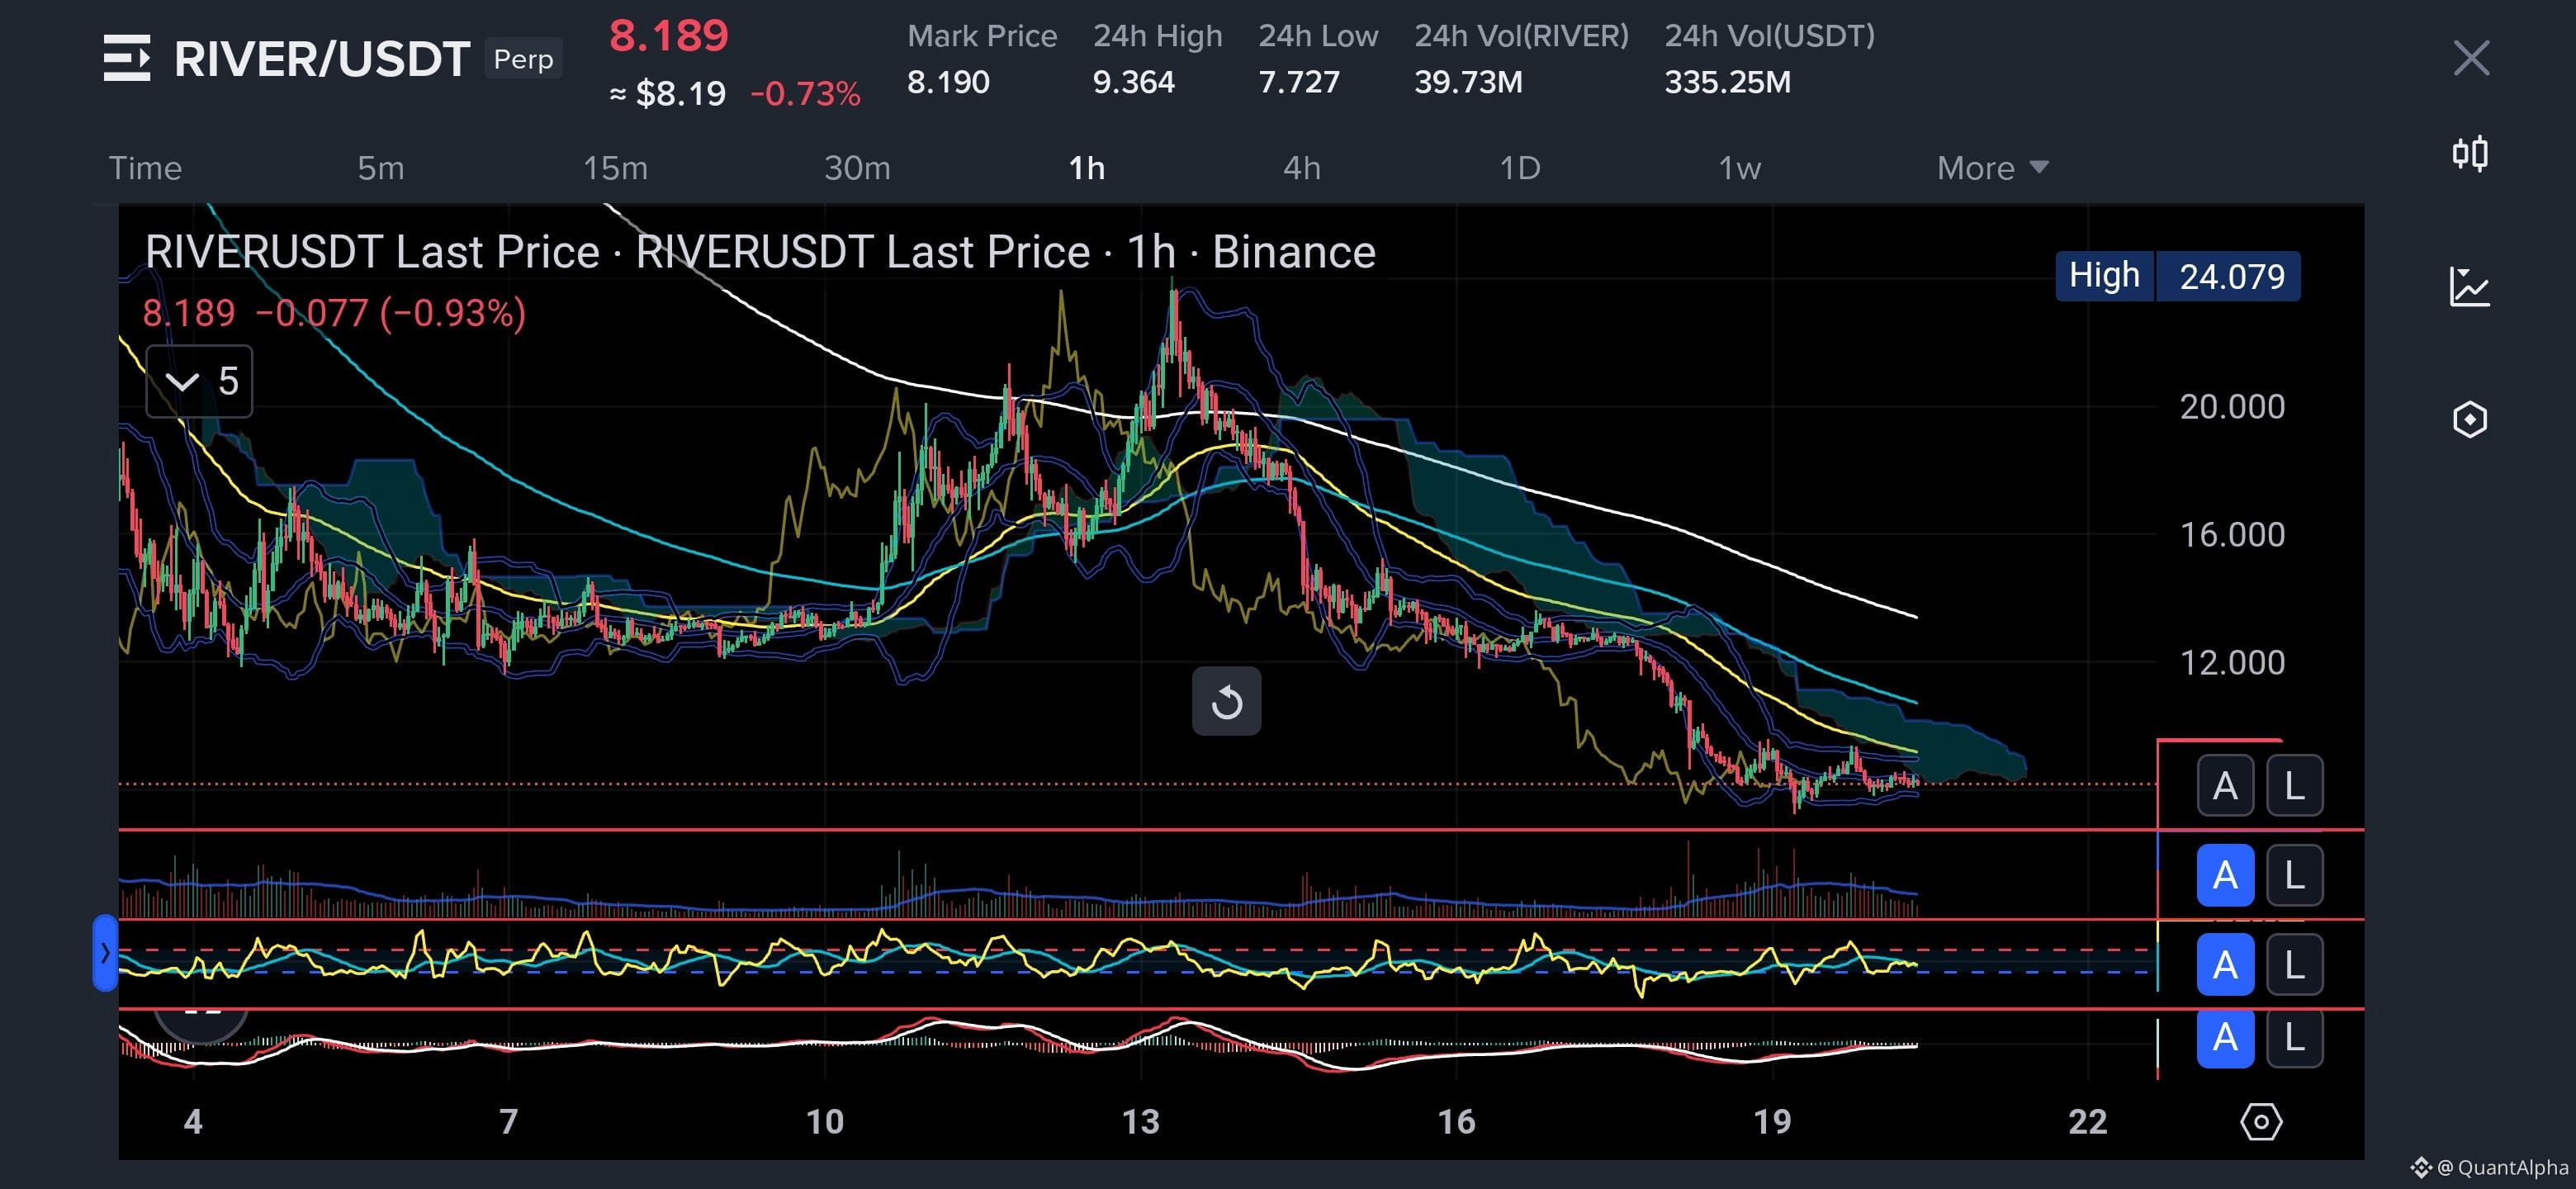
$RIVER
🔥 62% Long vs 38% Short – The Silent Accumulation Before the Break?
Don’t scroll. Follow and stay ahead of the crowd.
🟢 Long 62%
Entry: 8.05 – 8.20
Stop-loss: 7.65
Support zone is holding after a long downtrend.
Bollinger Bands squeeze + price stabilizing near lower range.
Ichimoku cloud flattening and EMA 60 trying to turn.
Volume slowly increasing → early accumulation signal.
MACD momentum weakening on downside, potential reversal.
Market sentiment is extremely pessimistic → smart money tends to buy here.
Short crowd fatigue is building, setting up a possible squeeze.
🔴 Short 38%
Entry: 8.70 – 9.10
Stop-loss: 9.65
Still under cloud and long-term trend remains bearish.
Lower highs structure not yet broken.
EMA 120 and 240 acting as strong resistance above.
CCI staying weak → momentum still fragile.
Funding likely turns negative if bounce continues.
Late longs may become liquidity if resistance holds.
Fake breakout risk remains in this compressed range.
1
195
·
--
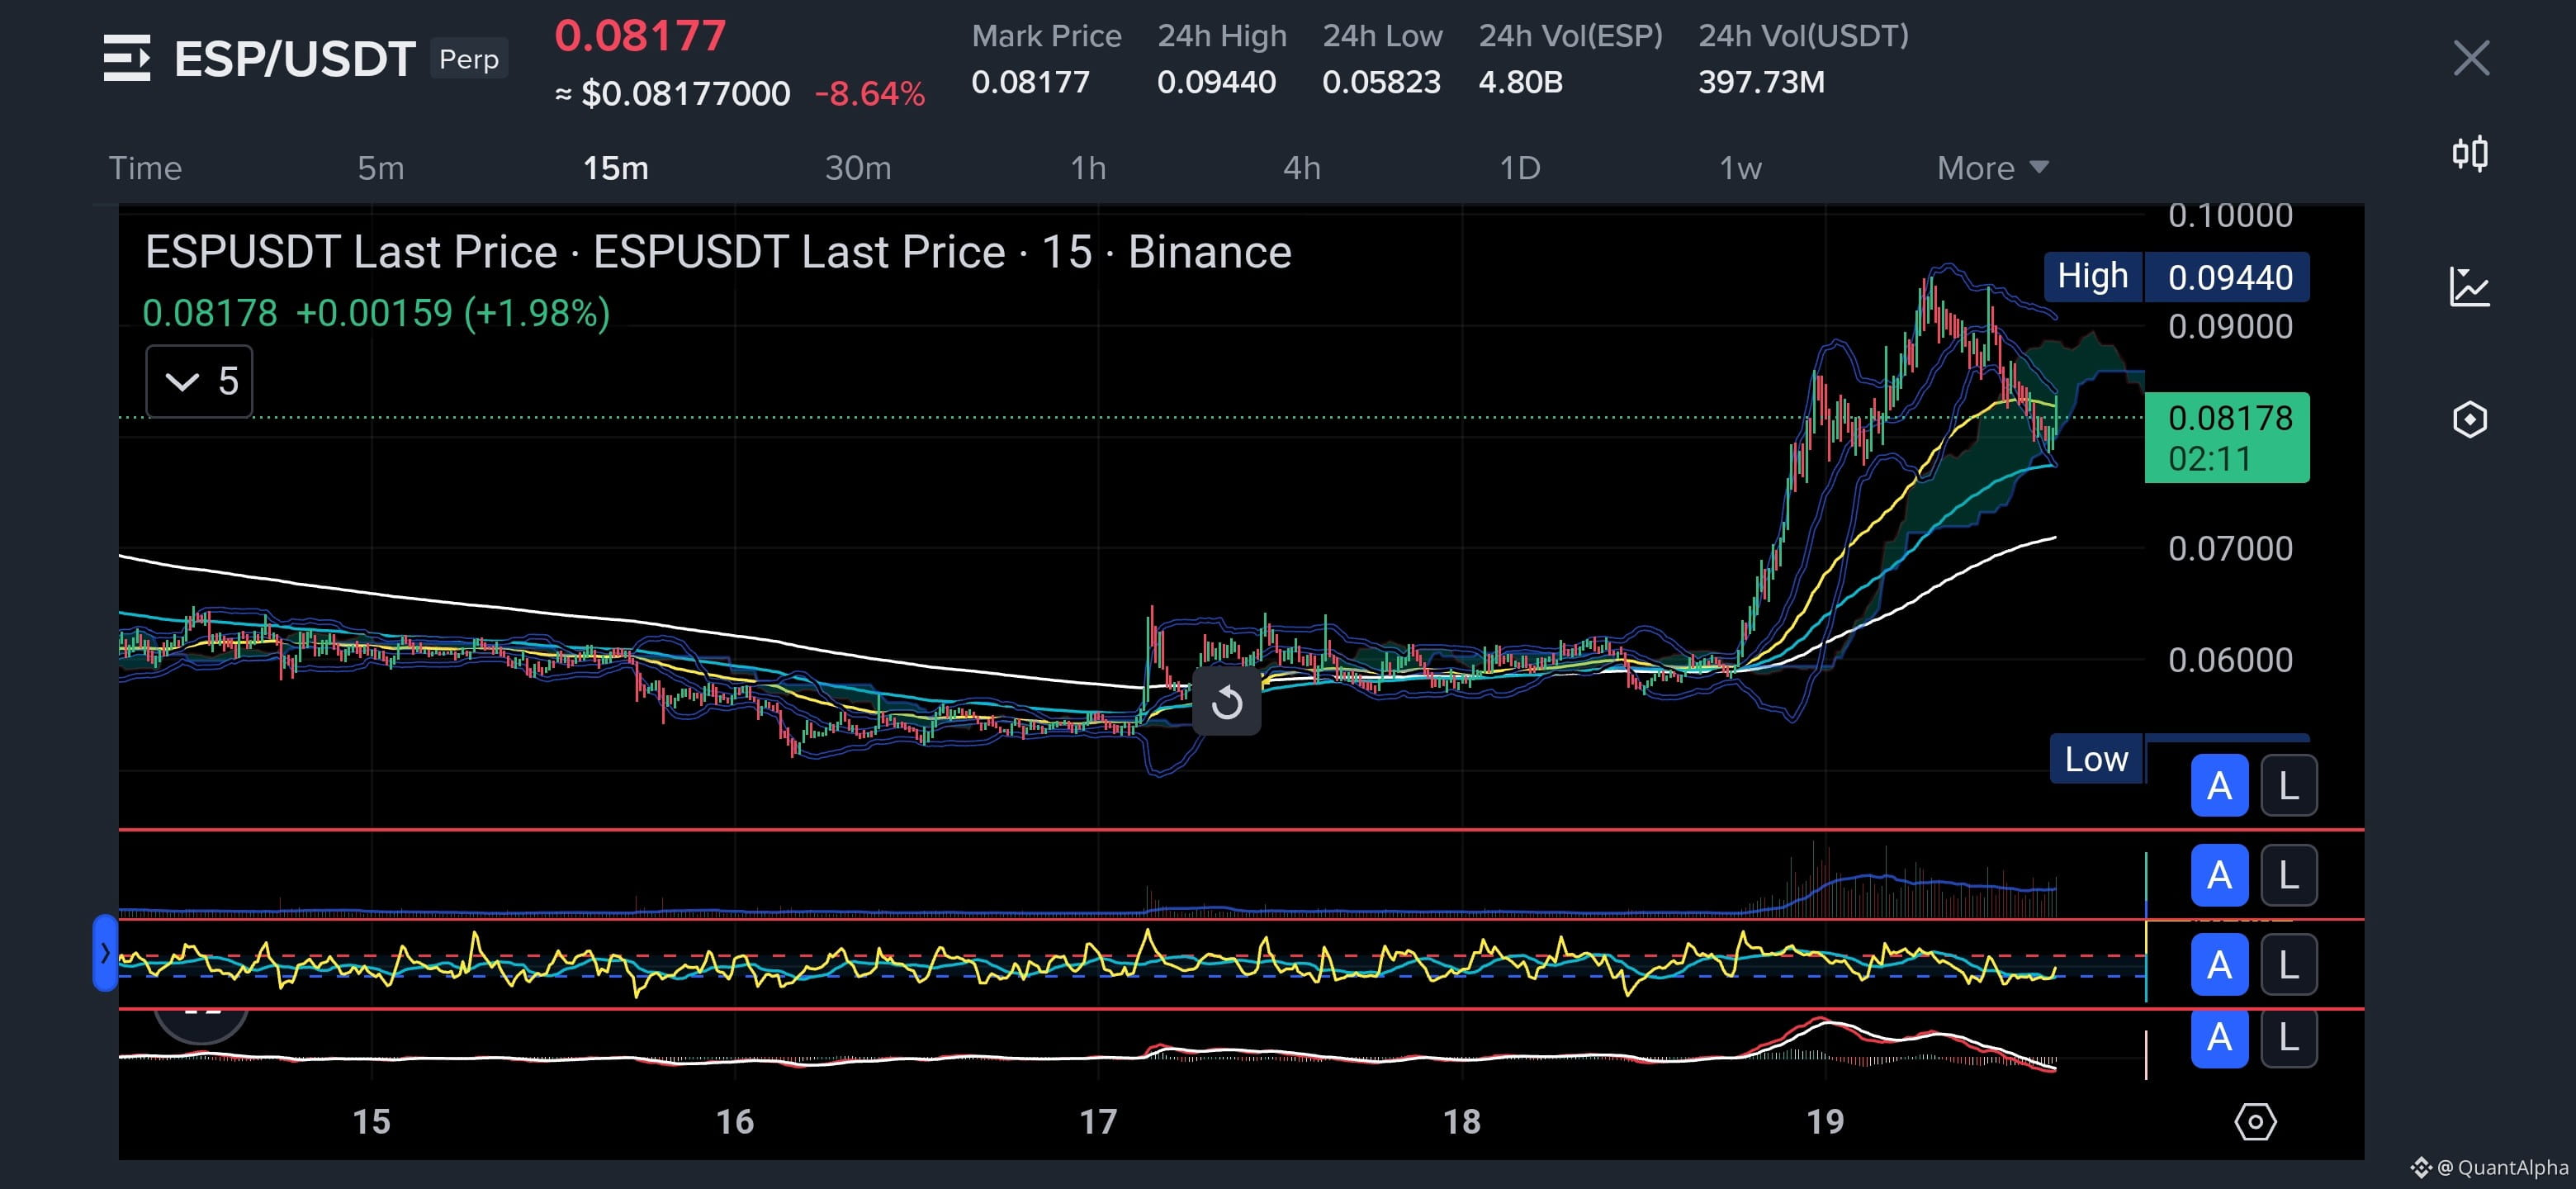
$ESP
🔥 62% Long vs 38% Short — Pullback or Trap Before Expansion?
Follow me and let’s ride the real probability together. 🚀
---
🟢 LONG
Entry: 0.0800 – 0.0810
Stop-loss: 0.0755
Strong structure after impulsive breakout and retest above previous resistance.
Price holding above Ichimoku cloud and EMA 120 support.
Bollinger squeeze after expansion suggests continuation phase.
Volume remains elevated, indicating real participation.
Market sentiment still favors dip buying in trending assets.
---
🔴 SHORT
Entry: 0.0865 – 0.0880
Stop-loss: 0.0920
Possible liquidity sweep near recent highs before rejection.
CCI divergence and MACD momentum slowing on lower timeframes.
Upper Bollinger resistance acting as dynamic supply.
Failure to reclaim 0.0880 could trigger fast downside.
Trapped longs may fuel a sharp correction.
---
Not financial advice. Focus on structure, liquidity, and probability. 😎
73
·
--
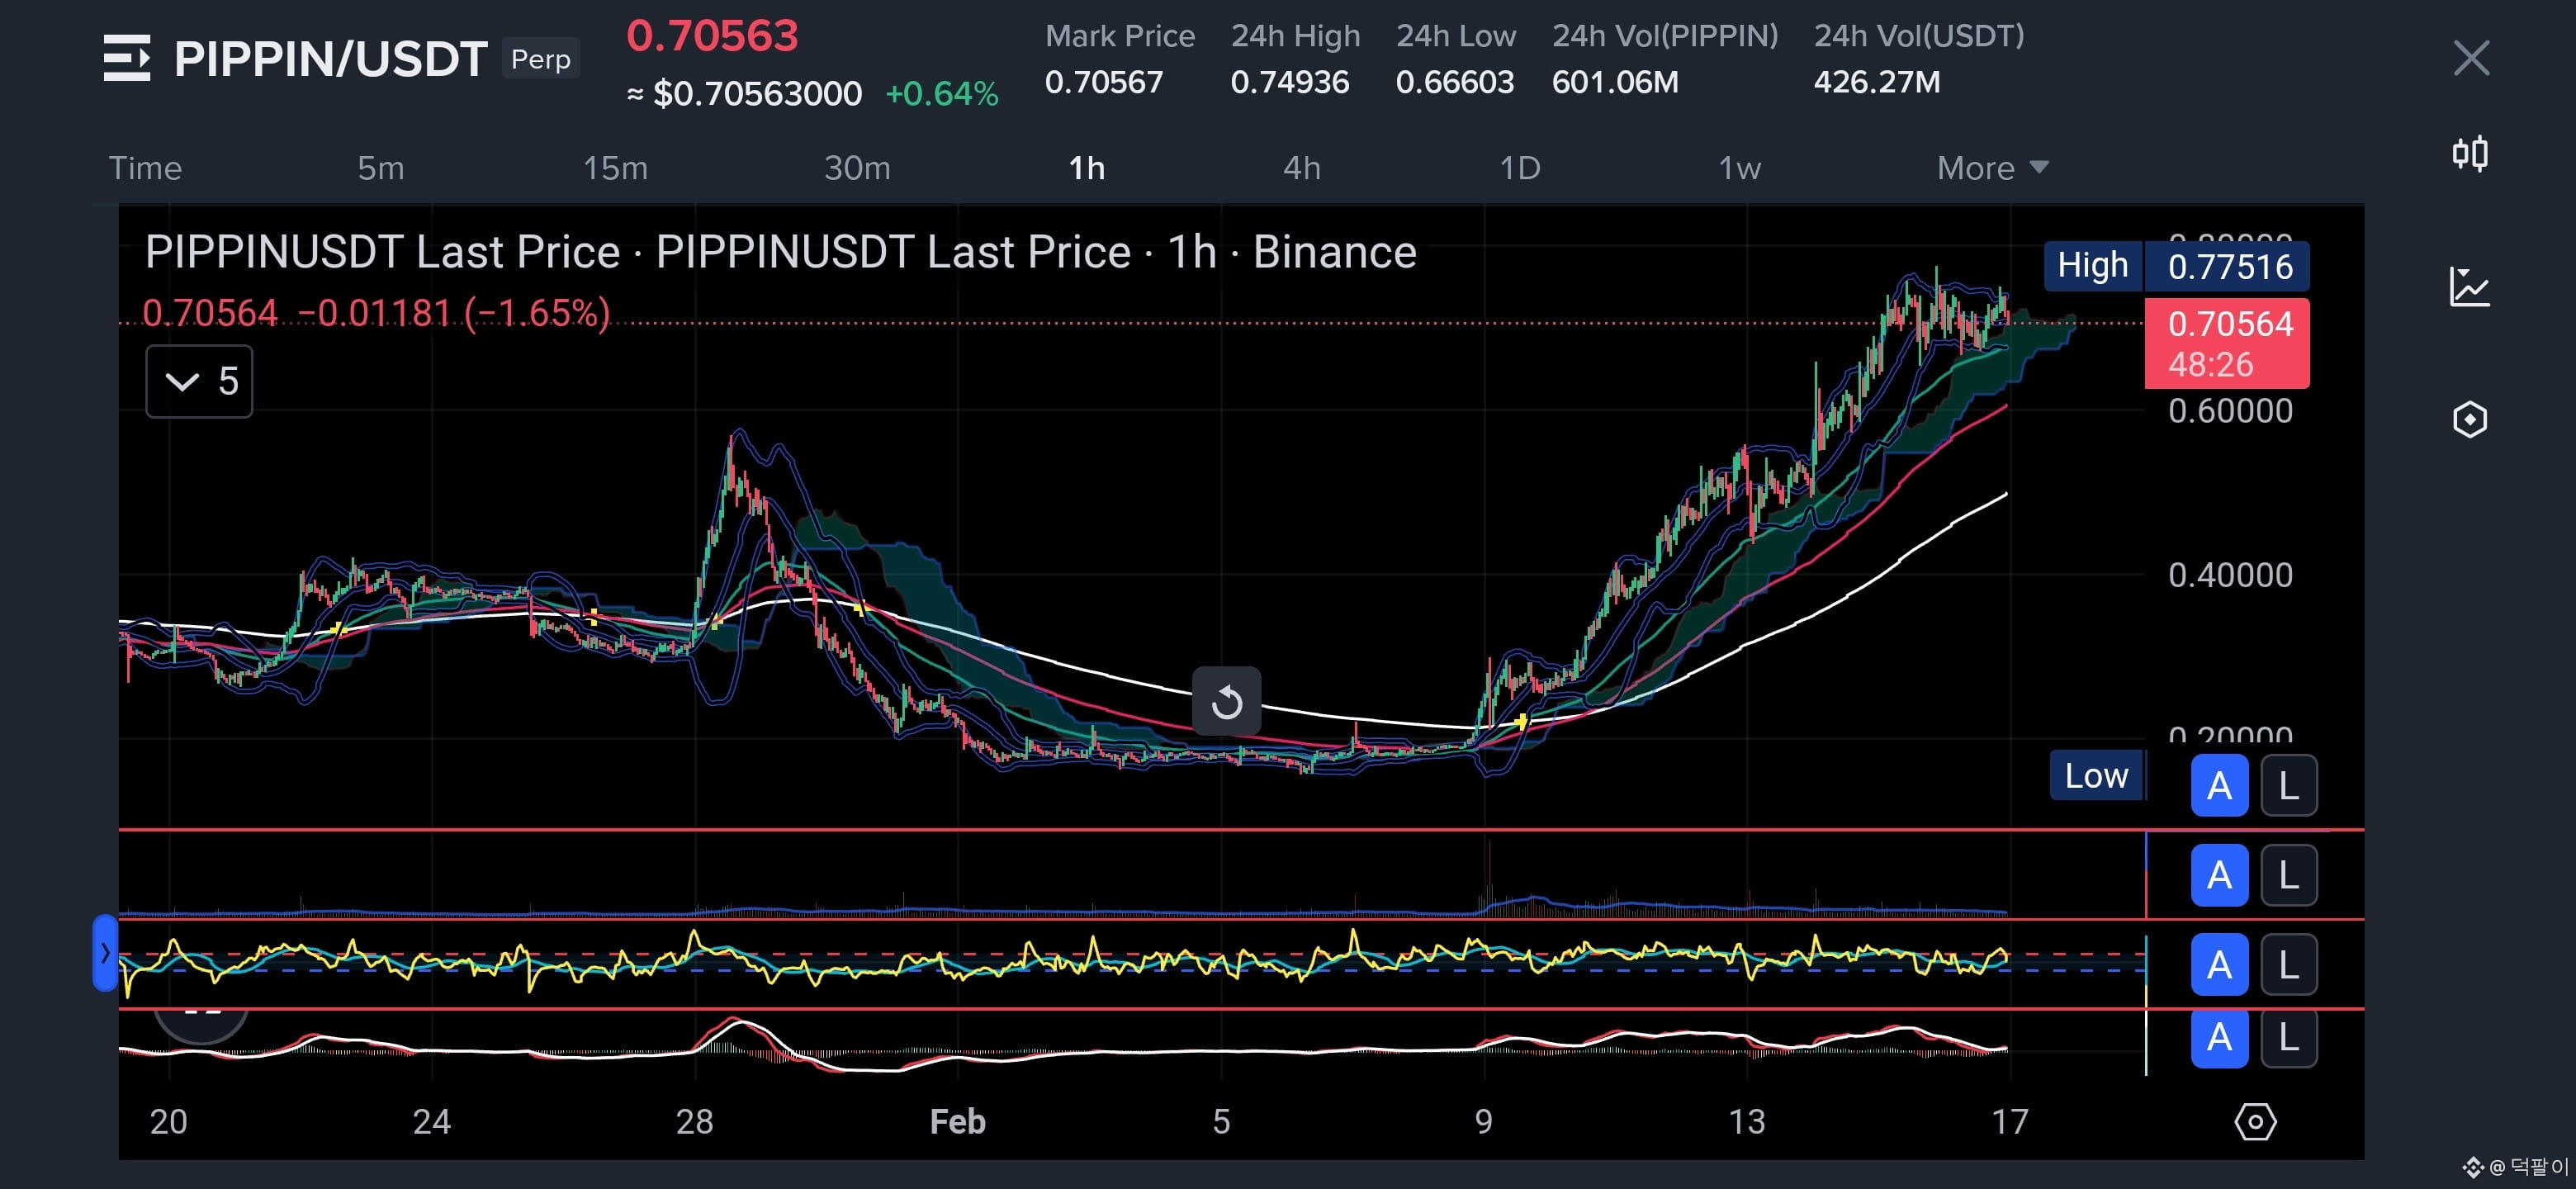
$PIPPIN
📊 PIPPINUSDT Long 65% vs Short 35% — Strong Trend or Late Long Trap?
Please take a moment to check this out! Follow to stay ahead of the market 🚀
🟢 Long (65%)
🎯 Entry: 0.66–0.69 support and cloud retest zone.
🛑 Stop-loss: Below 0.62, under EMA and structure support.
Reason: Price holds above trend and support, confirming bullish control.
📈 EMA alignment and cloud support show strong continuation structure.
📊 MACD remains positive and CCI stays above midline, supporting momentum.
💧 Volume decreased during consolidation, suggesting accumulation.
🔴 Short (35%)
🎯 Entry: 0.75–0.78 resistance rejection zone.
🛑 Stop-loss: Above 0.82, invalidating bearish rejection.
Reason: Extended trend increases probability of liquidity sweep.
📉 Bollinger Bands expanding and upper wicks signal volatility risk.
📊 Momentum slowing near highs hints at possible exhaustion.
⚠️ If support breaks, long liquidations could accelerate downside.
1
186
·
--
Bullish
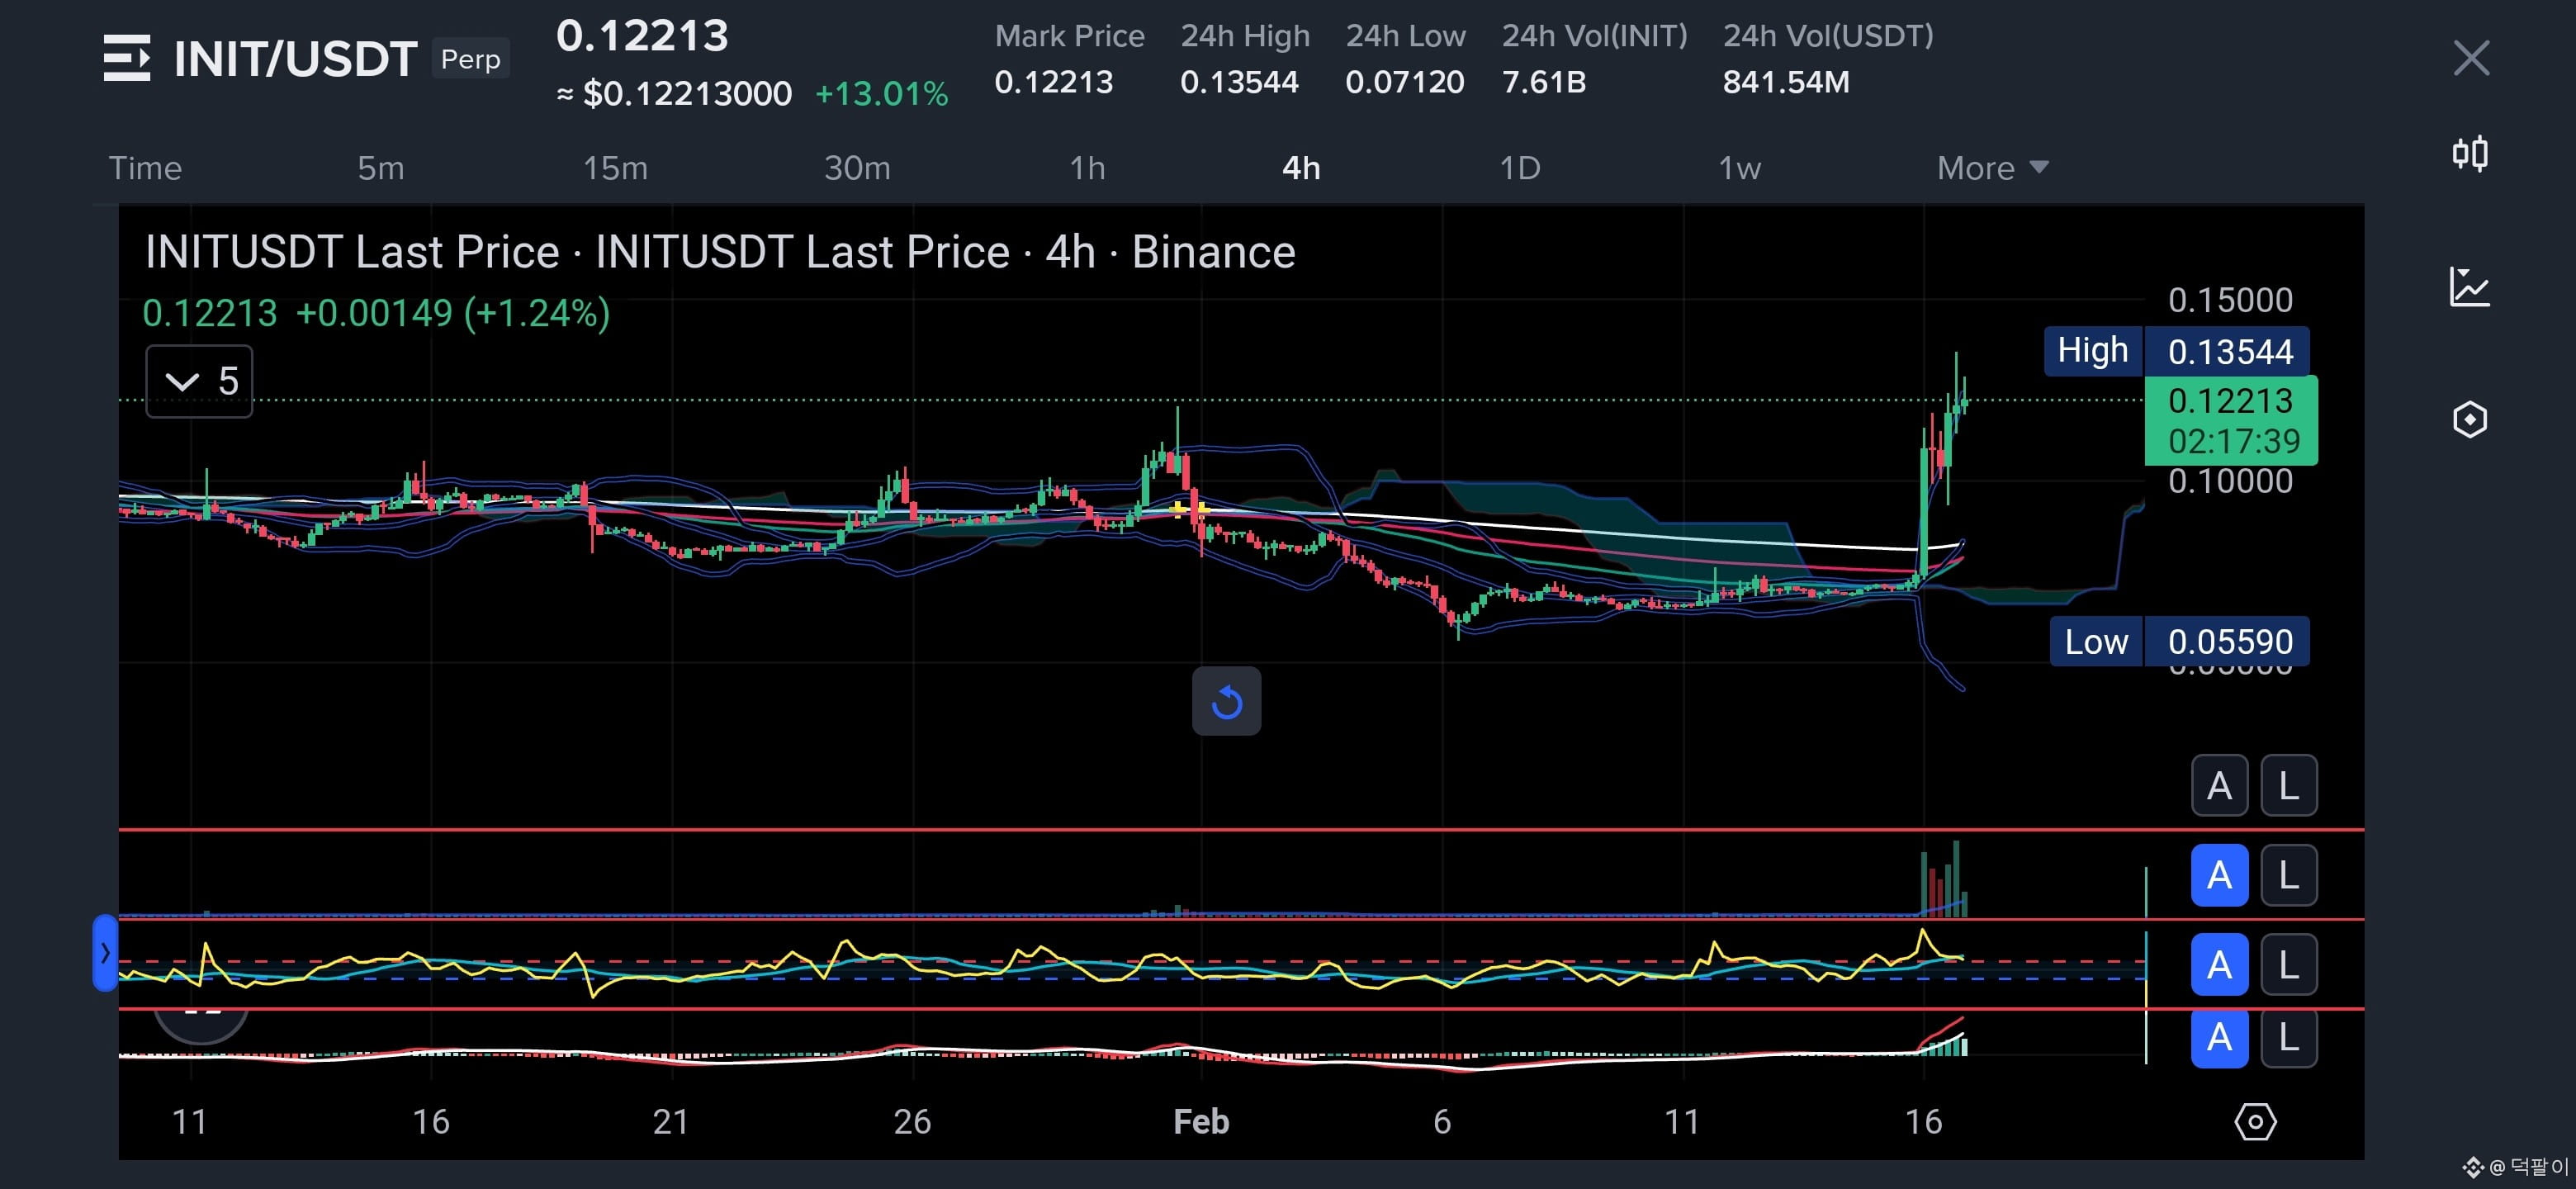
$INIT
📊 INITUSDT Long 62% vs Short 38% — Breakout Strength or Liquidity Trap?
Please take a moment to check this out! Follow to stay ahead of the market 🚀
🟢 Long (62%)
🎯 Entry: 0.115–0.120 support retest zone.
🛑 Stop-loss: Below 0.105, under the breakout base.
Reason: Price reclaimed structure and flipped resistance into support.
📈 Cloud and EMA alignment show a confirmed short-term trend shift.
📊 MACD expansion and rising CCI support momentum continuation.
💧 Volume increased during breakout and cooled on pullback, suggesting accumulation.
🔴 Short (38%)
🎯 Entry: 0.130–0.135 resistance rejection zone.
🛑 Stop-loss: Above 0.140, invalidating bearish rejection.
Reason: Sharp expansion often leads to volatility and liquidity sweeps.
📉 Bollinger Band expansion signals possible exhaustion near highs.
📊 Overbought momentum and slowing candles hint at weakening push.
⚠️ Failure to hold above support could trigger long liquidations quickly.
30
·
--
Bullish
$SIREN
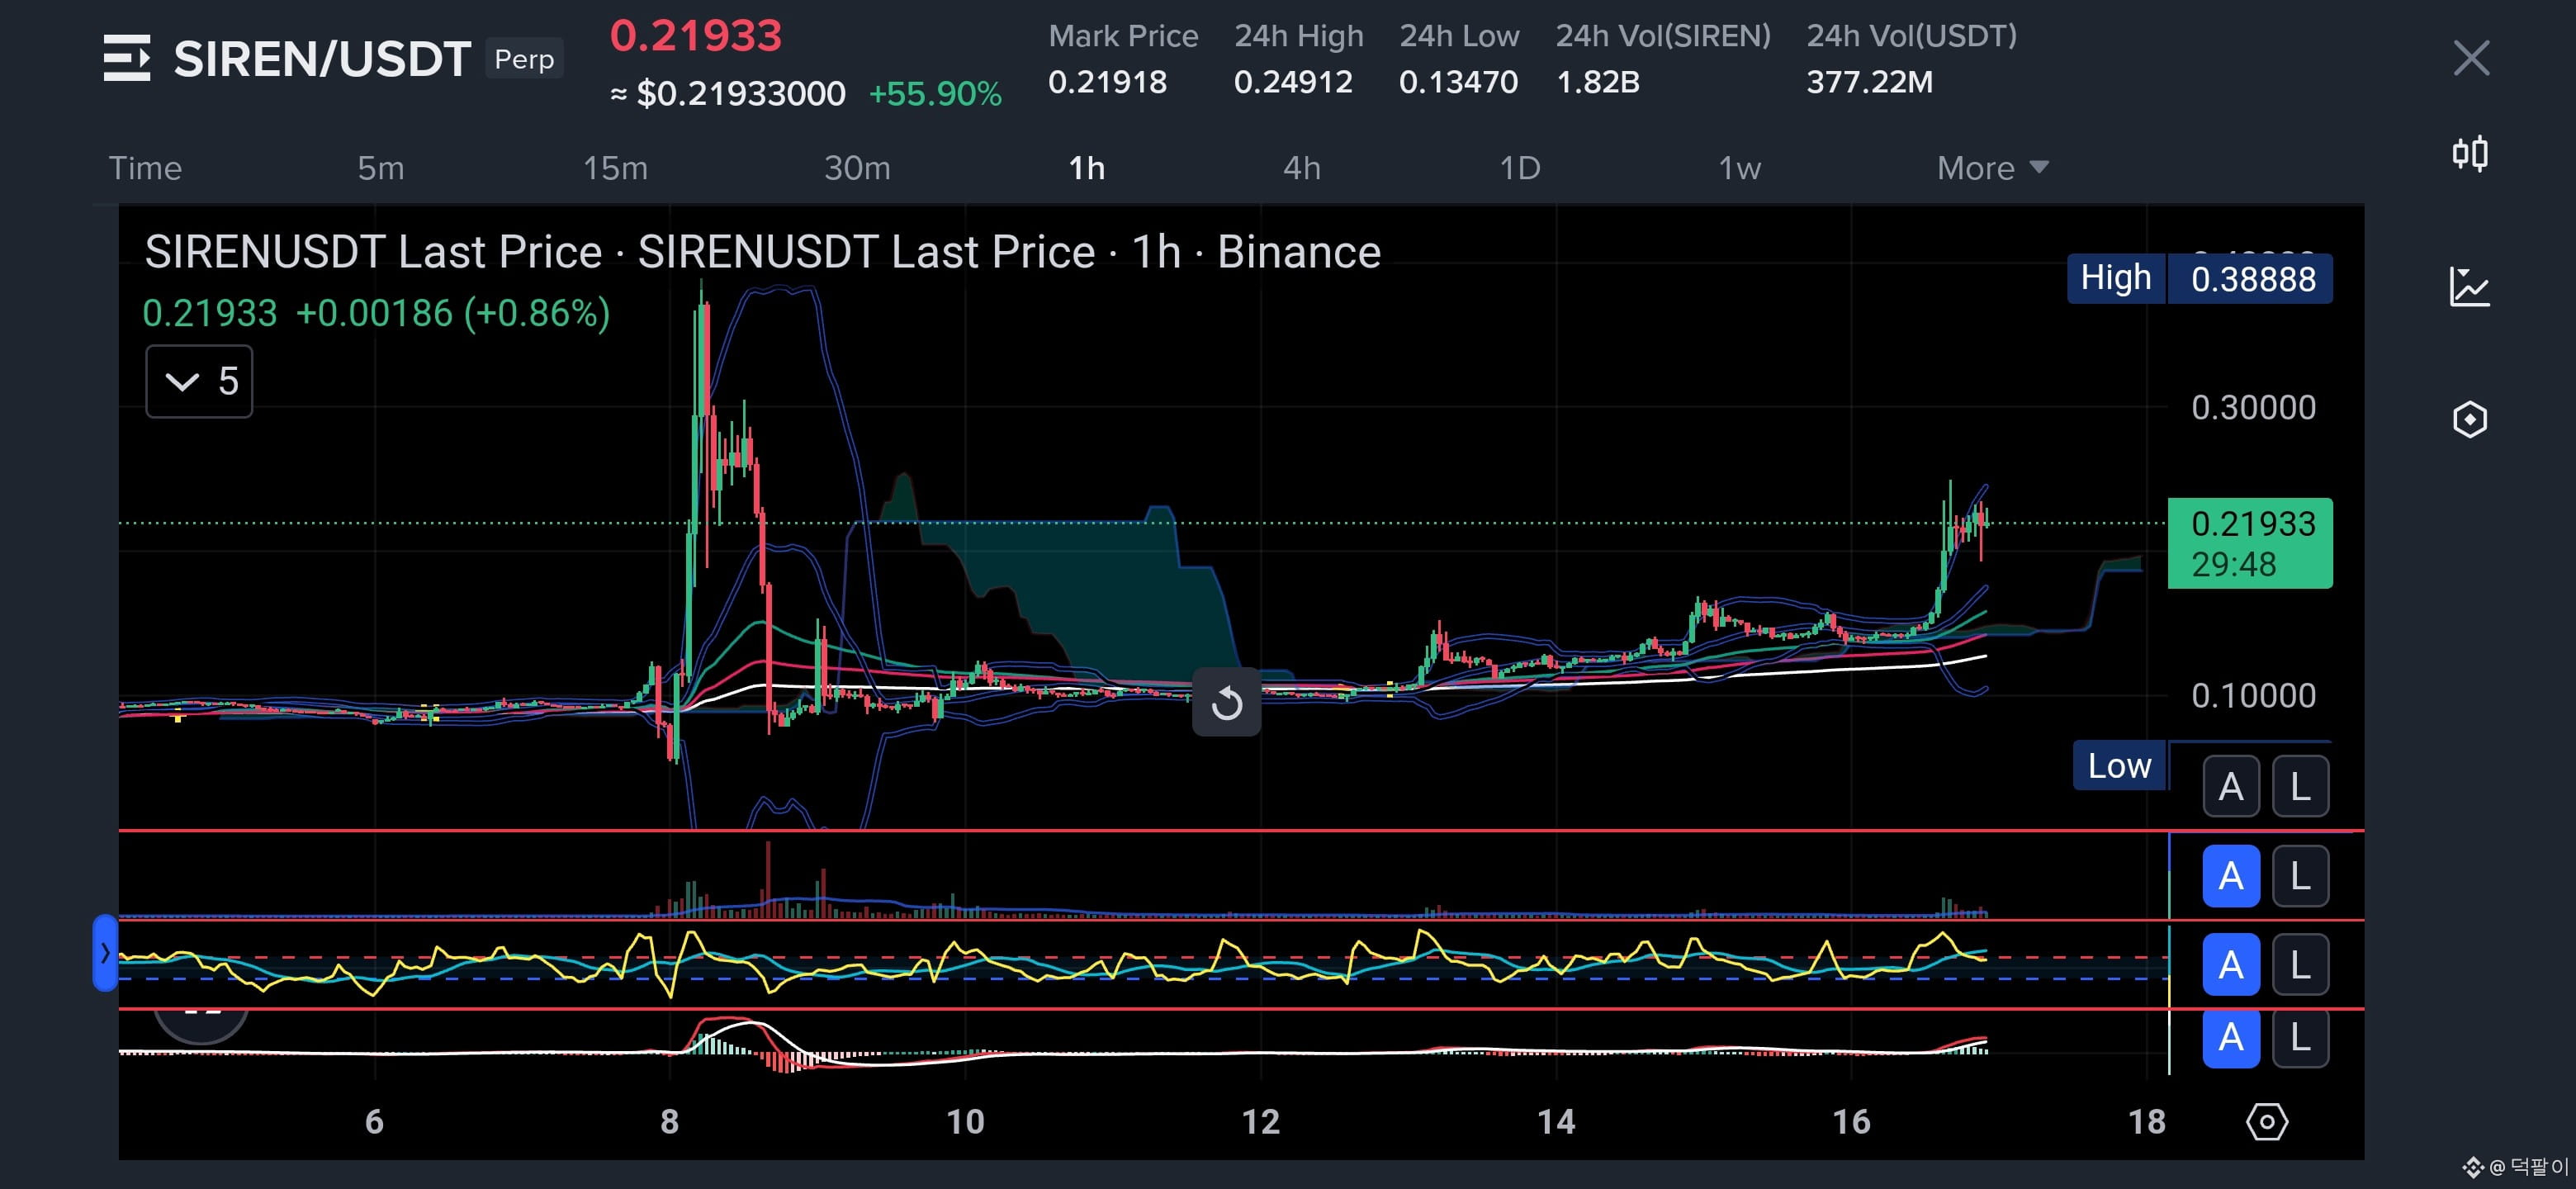
📊 SIRENUSDT Long 59% vs Short 41% — Momentum Building After Expansion
Please take a moment to check this out! Follow to stay ahead together.
🟢 Long (59%)
📈 Price reclaimed key moving averages and is holding above the cloud support.
🧠 Higher lows structure after the impulse suggests accumulation rather than distribution.
💧 Volume expanded during the breakout and cooled during consolidation, supporting trend continuation.
⚡ As long as support holds, upside liquidity remains the primary target.
📊 CCI is holding above the midline, showing sustained bullish momentum.
📈 MACD histogram is expanding again, signaling strengthening upside pressure.
🔴 Short (41%)
👀 Strong upper wick near recent highs shows sellers still defending resistance.
📉 Failure to maintain current structure could trigger fast long liquidations.
⚠️ Shorts gain control only if price loses the cloud and forms lower highs.
📊 Bollinger Bands are widening, increasing volatility and rejection risk.
📉 Momentum divergence may appear if price stalls while indicators weaken.
1
69
·
--
$AXS
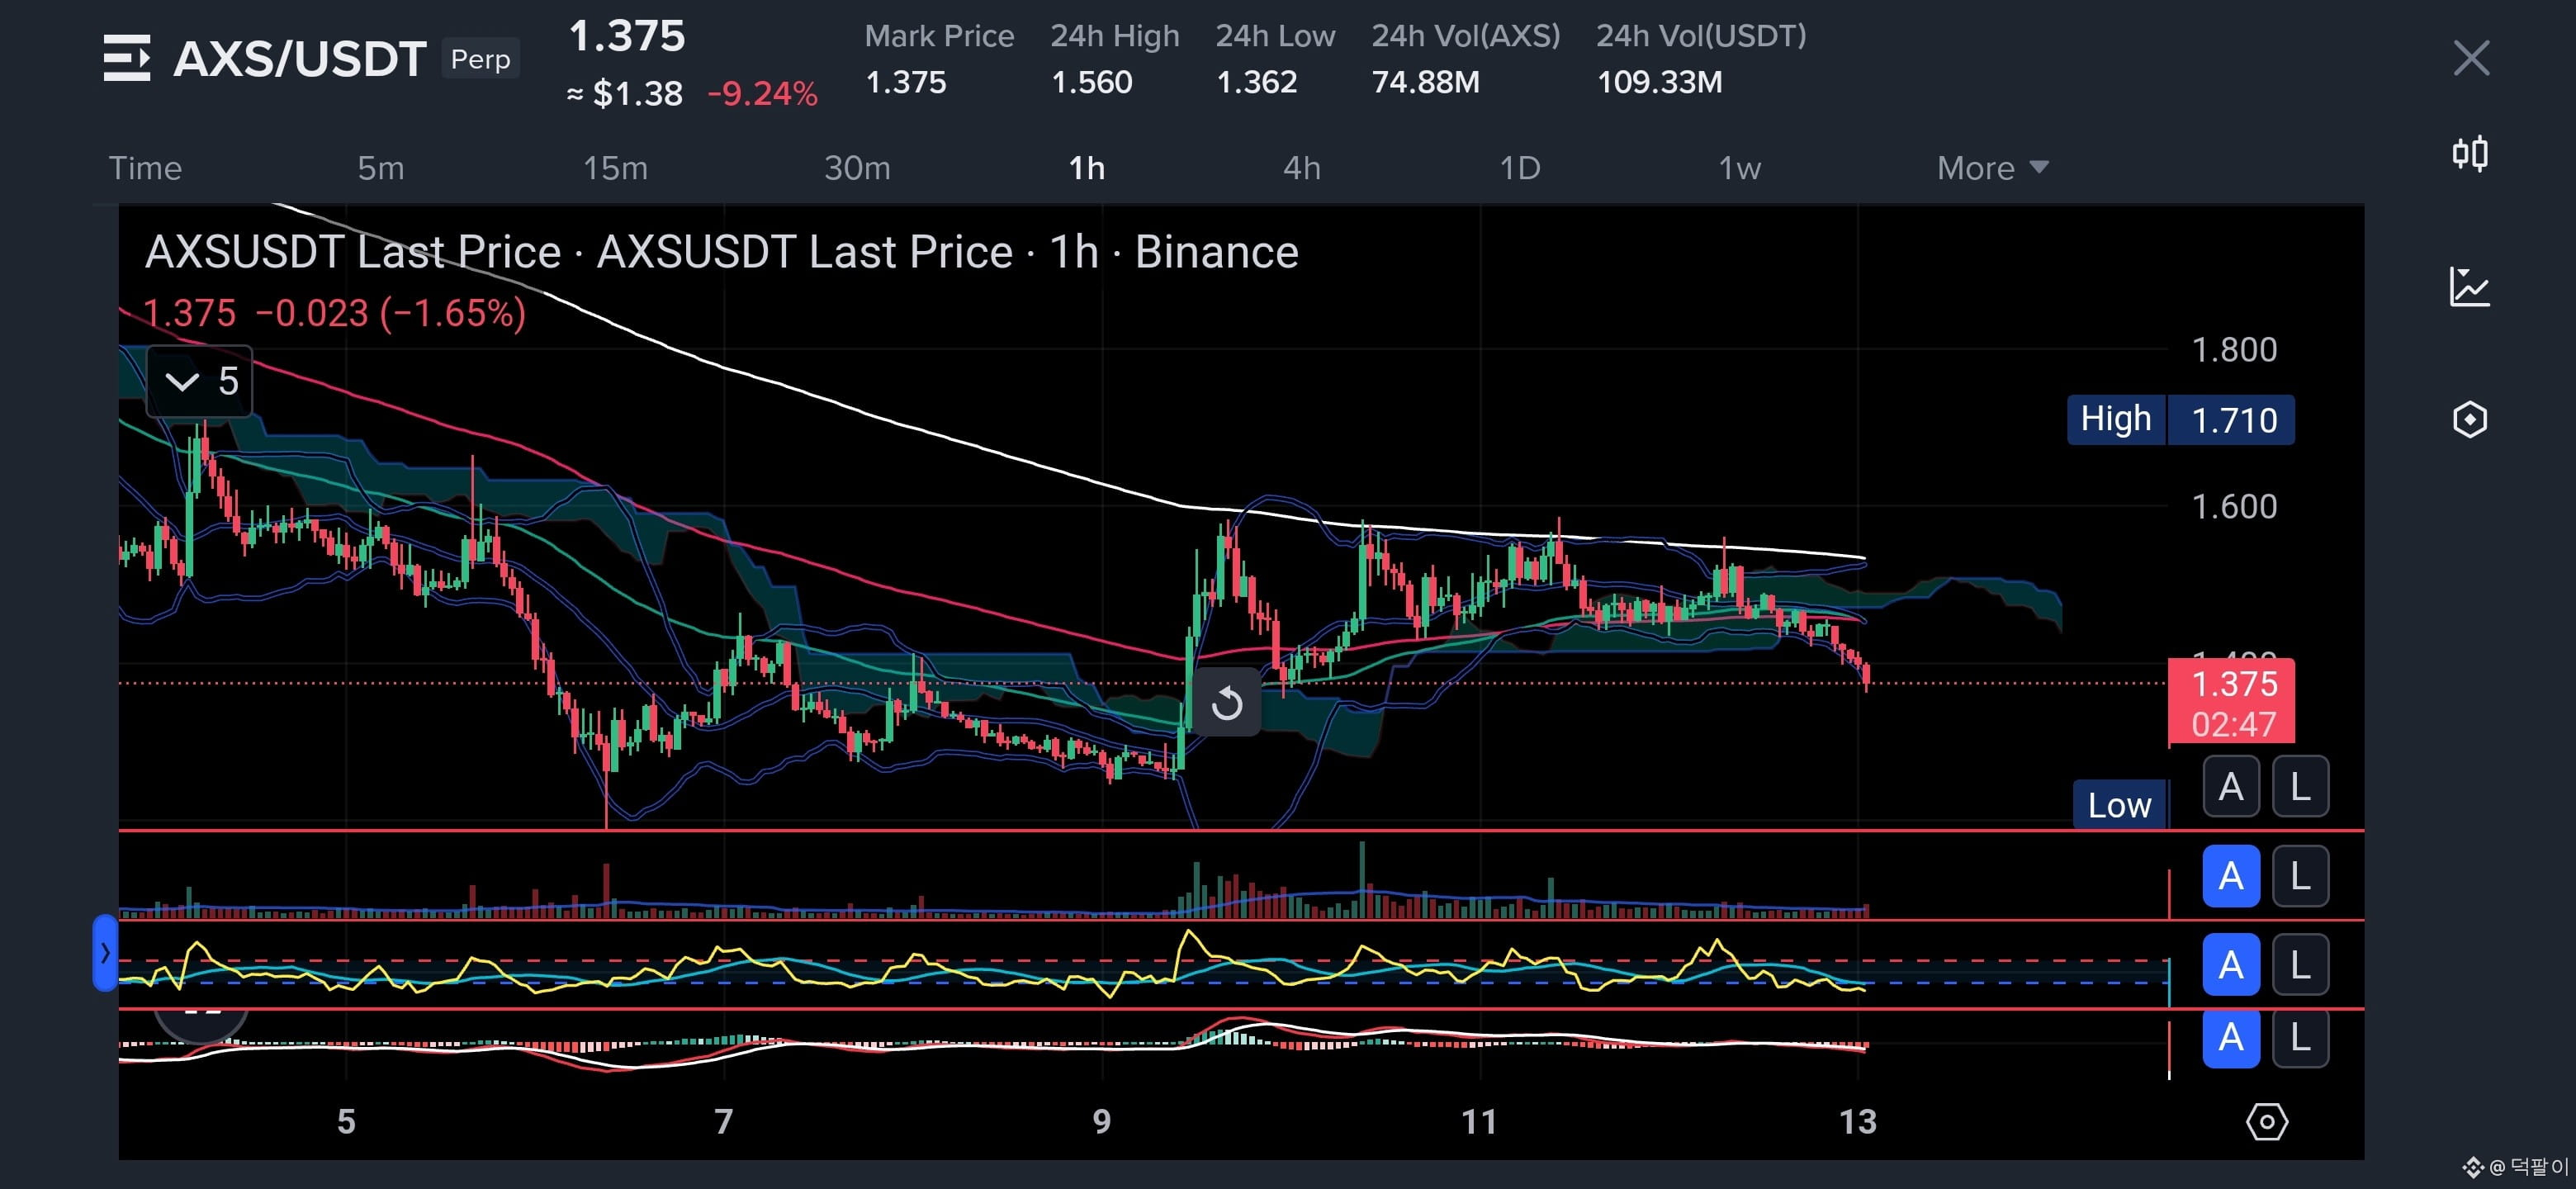
📊 AXSUSDT Long 38% vs Short 62% — This Downtrend Still Has Pressure
Please take a moment to check this out!
🔴 Short (62%)
📉 Price continues to trade below major moving averages and inside a clear descending structure.
🧠 Repeated rejections at the cloud and trendline confirm sellers defending every rally.
📊 Momentum indicators remain weak with no strong bullish divergence forming.
💧 As long as resistance holds, downside liquidity remains the primary target.
🟢 Long (38%)
👀 Oversold conditions are attracting dip buyers near historical support.
⚠️ However, without a clean reclaim of the cloud and EMAs, upside moves risk being relief bounces.
📈 Bulls need a confirmed structure shift, not just short-term reactions.
1
256
·
--
Bullish
$BERA
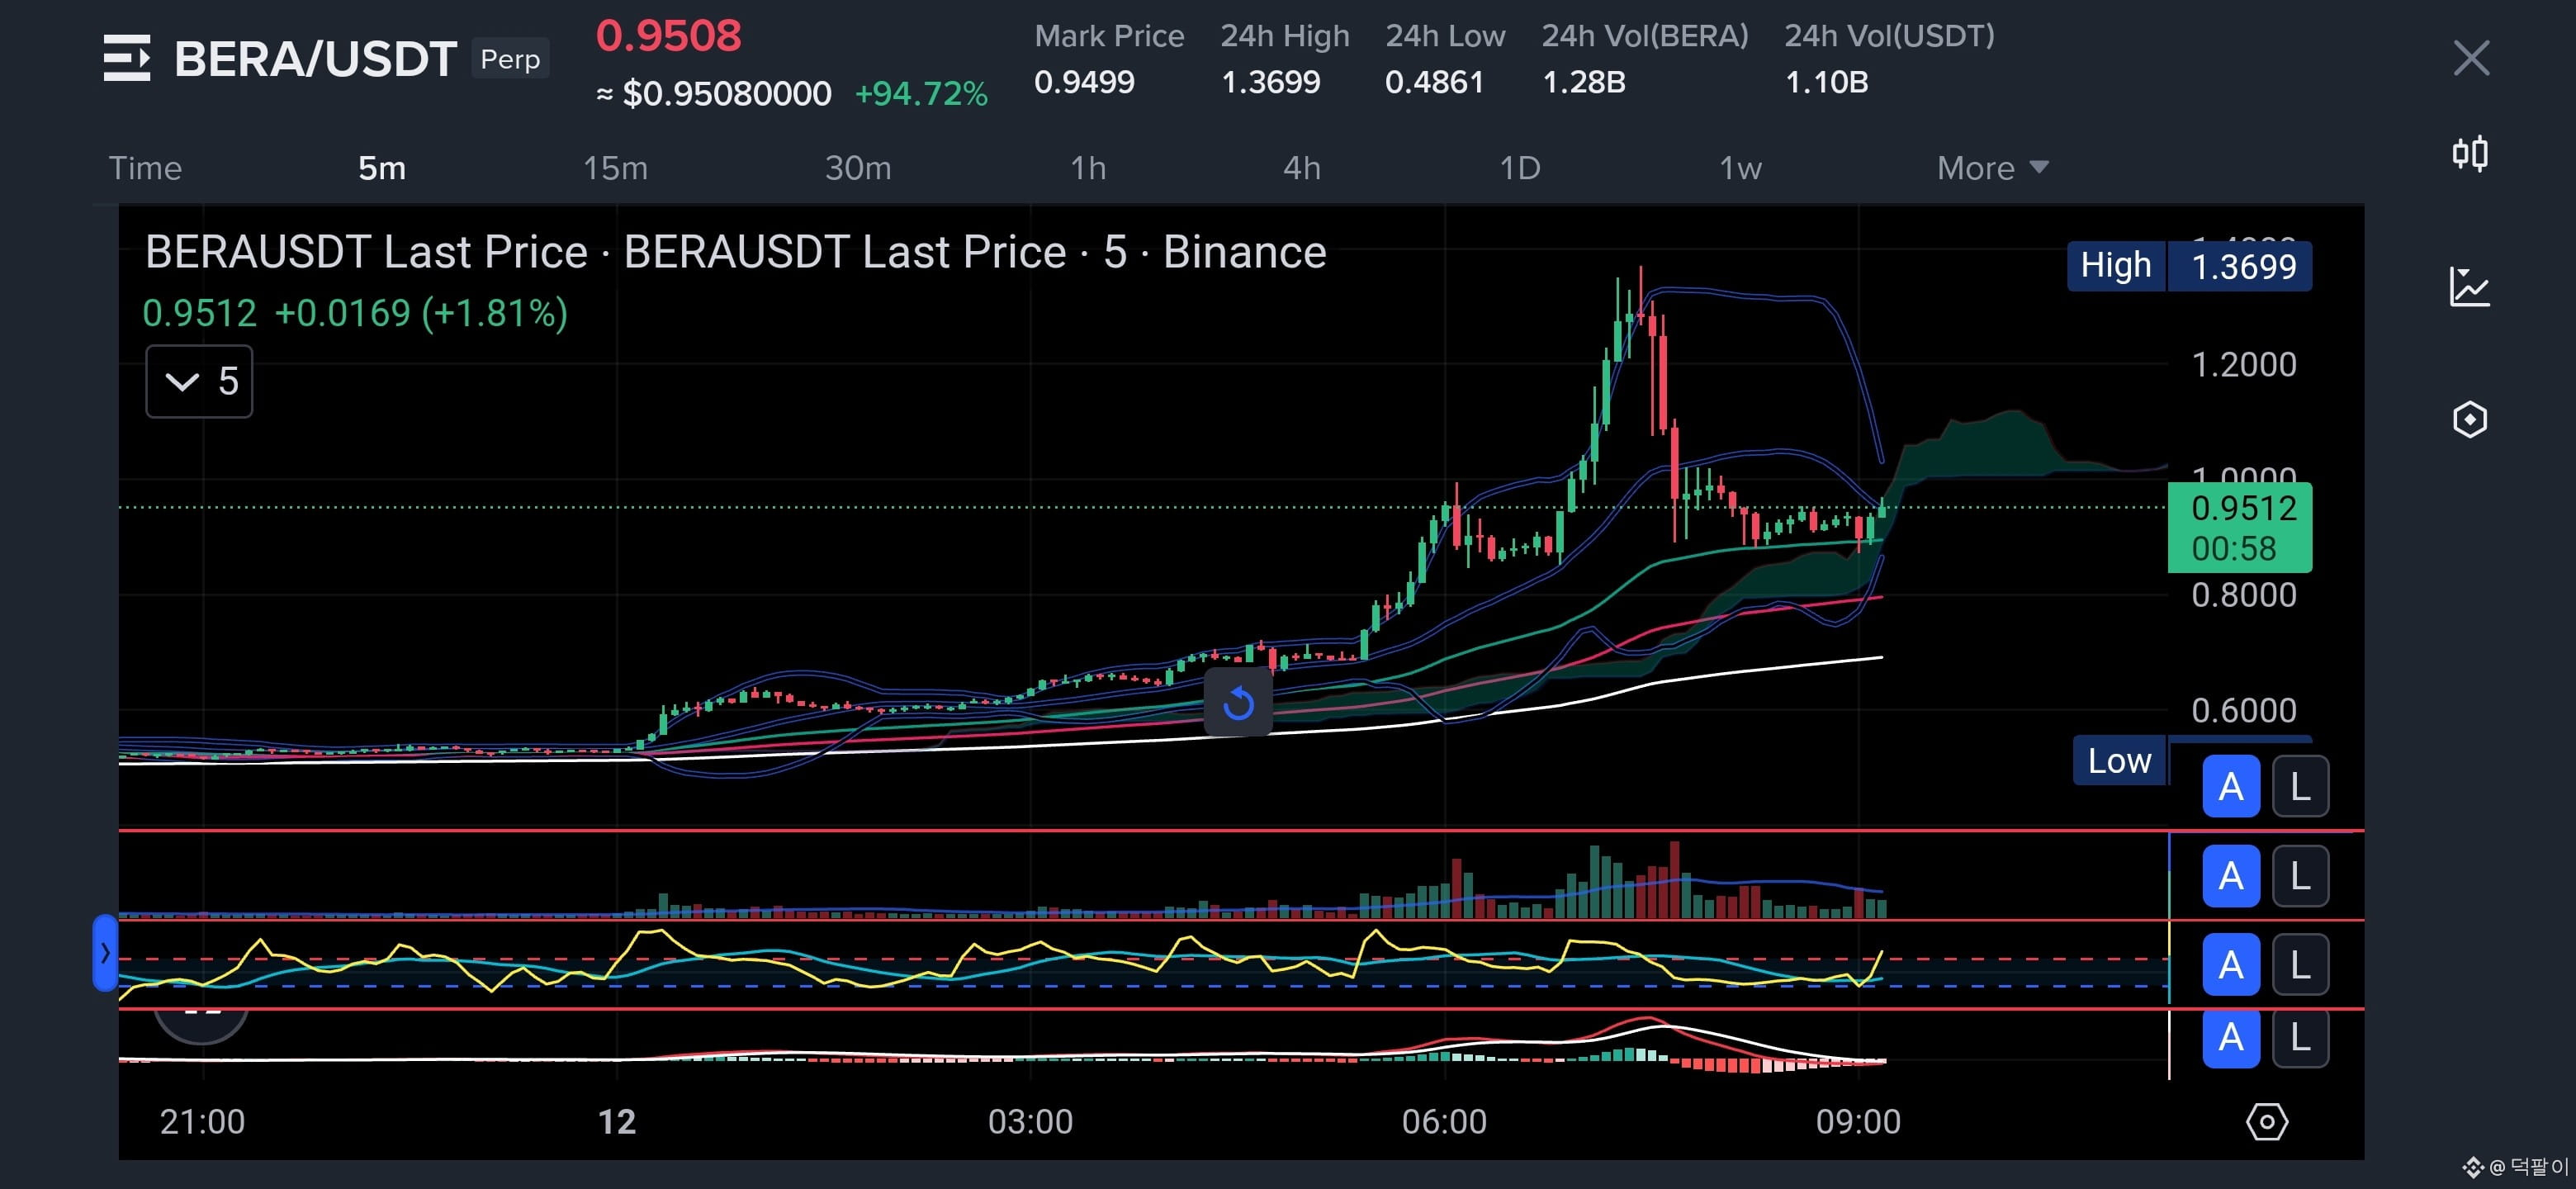
📊 BERAUSDT Long 64% vs Short 36% — This Pump Isn’t Stable Yet
Please take a moment to check this out!
🟢 Long (64%)
⚠️ Price exploded with expansion candles but immediately showed heavy upper rejection.
📈 Although still above key moving averages, momentum is cooling after the spike.
💧 Volume peaked during the breakout and is now fading during consolidation.
🧠 As long as price holds above the cloud support, bulls maintain short-term control.
🔴 Short (36%)
👀 The sharp rejection from the high signals active distribution at the top.
📉 If price loses the current support band, long liquidation could accelerate quickly.
⚡ Shorts gain momentum only on a confirmed breakdown, not during sideways chop.
1
478
Log in to explore more content
Join global crypto users on Binance Square
⚡️ Get latest and useful information about crypto.
💬 Trusted by the world’s largest crypto exchange.
👍 Discover real insights from verified creators.
Email / Phone number