

last_wz
346 Posts

last_wz
Report
Block User
Daily Red Packets Quiz 🎁🧧🧧🧧🎁🎁🤝. Exploring crypto markets 🌐. Sharing my journey, chart ideas, and market insights💡.
Frequent Trader
1.7 Years
126 Following
392 Followers
192 Liked
Posts
All
Quotes
Videos
Live
·
--
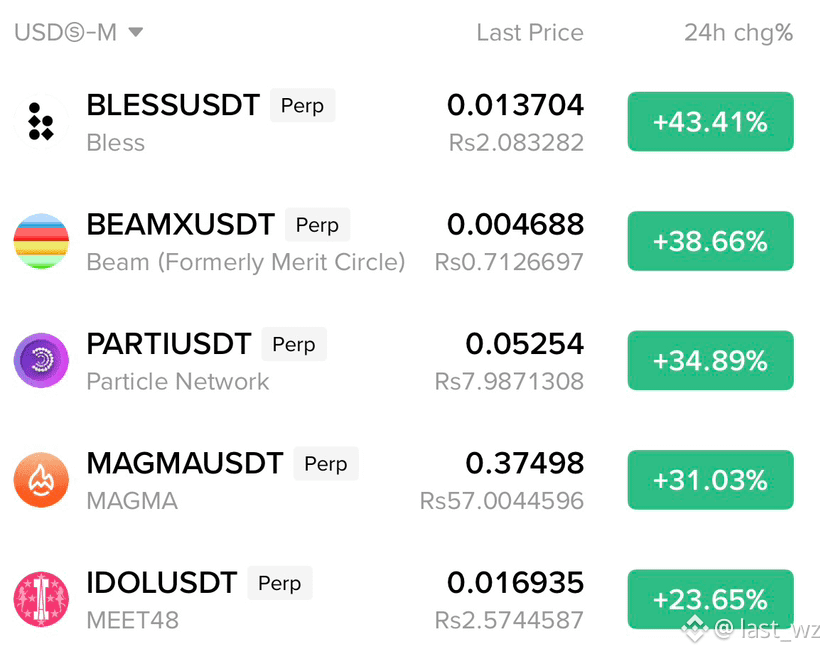
Green candles only! 🟢🔥 Look at these absolute movers on the charts today:
• $BLESS +43.41%
• $BEAMX +38.66%
• $PARTI +34.89%
• $magma +31.03%
• $idol +23.65%
The market is showing serious strength. Which one are you riding, and which one is pulling back next? Drop your bags below! 👇💬
#crypto #Altcoins #TradingCommunity #BİNANCE
{future}(BLESSUSDT)
{future}(BEAMXUSDT)
{future}(PARTIUSDT)
Green candles only! 🟢🔥 Look at these absolute movers on the charts today:
• $BLESS +43.41%
• $BEAMX +38.66%
• $PARTI +34.89%
• $magma +31.03%
• $idol +23.65%
The market is showing serious strength. Which one are you riding, and which one is pulling back next? Drop your bags below! 👇💬
#crypto #Altcoins #TradingCommunity #BİNANCE
• $BLESS +43.41%
• $BEAMX +38.66%
• $PARTI +34.89%
• $magma +31.03%
• $idol +23.65%
The market is showing serious strength. Which one are you riding, and which one is pulling back next? Drop your bags below! 👇💬
#crypto #Altcoins #TradingCommunity #BİNANCE
362
·
--
Article
ETHEREUM: Major
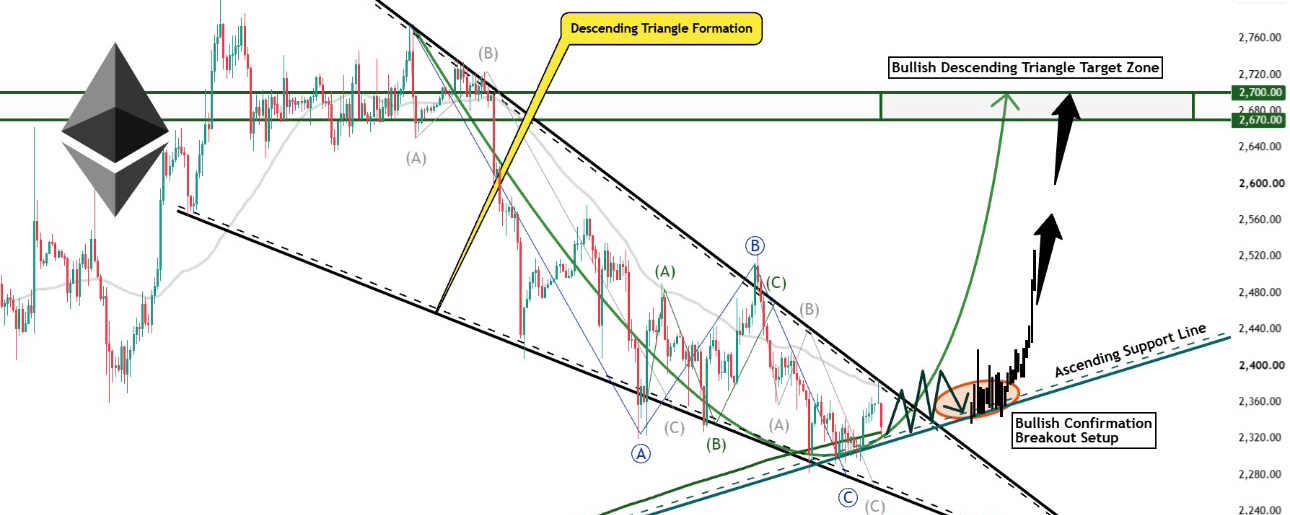
Descending Triangle-Formation, Reversal Setup!Welcome to my new analysis of Ethereum from a 4-hour timeframe perspective. In my recent analysis, I detected important signs within ETHEREUM which will determine the upcoming directions profoundly. Therefore, I am considering all the underlying factors that will drive the upcoming price action in a profound way.
When looking at my chart, we can see how ETHEREUM is forming this massive descending triangle formation. Within this formation, it completed the wave count and bounced within the lower boundary, now primed for a final bullish breakout and completion of the descending triangle formation. Once the breakout settled the further bullish momentum developments will be activated.
As seen in my chart, ETHEREUM will activate the upper descending triangle target zones once the bullish breakout has been finalized.
Also, the settlement above the MAs will indicate this direction in a profound way. At the moment, ETHEREUM has substantial support on which it will capitalize once the breakout has been formed. Interesting to see how the momentum moves on from there.In this manner, thank you a lot for watching! Support is highly appreciated.
Disclaimer: The information and publications are not meant to be, and do not constitute, financial, investment, trading, or other types of advice or recommendations. #EarningsSeason #BinanceWillListPredictPREDICT $ETH
{future}(ETHUSDT)
ETHEREUM: Major Descending Triangle-Formation, Reversal Setup!
Welcome to my new analysis of Ethereum from a 4-hour timeframe perspective. In my recent analysis, I detected important signs within ETHEREUM which will determine the upcoming directions profoundly. Therefore, I am considering all the underlying factors that will drive the upcoming price action in a profound way.
When looking at my chart, we can see how ETHEREUM is forming this massive descending triangle formation. Within this formation, it completed the wave count and bounced within the lower boundary, now primed for a final bullish breakout and completion of the descending triangle formation. Once the breakout settled the further bullish momentum developments will be activated.
As seen in my chart, ETHEREUM will activate the upper descending triangle target zones once the bullish breakout has been finalized.
Also, the settlement above the MAs will indicate this direction in a profound way. At the moment, ETHEREUM has substantial support on which it will capitalize once the breakout has been formed. Interesting to see how the momentum moves on from there.In this manner, thank you a lot for watching! Support is highly appreciated.
Disclaimer: The information and publications are not meant to be, and do not constitute, financial, investment, trading, or other types of advice or recommendations. #EarningsSeason #BinanceWillListPredictPREDICT $ETH
22
4
114


·
--
Article
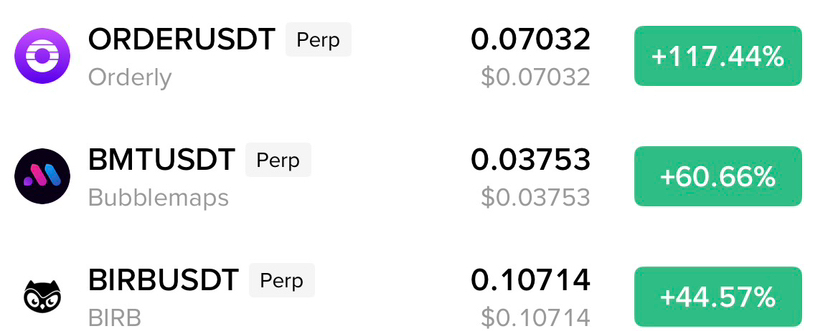
These are pumping high. 🔥📈Trade before the time 👍 $ORDER
{future}(ORDERUSDT)
These are pumping high. 🔥📈
Trade before the time 👍 $ORDER
388
·
--
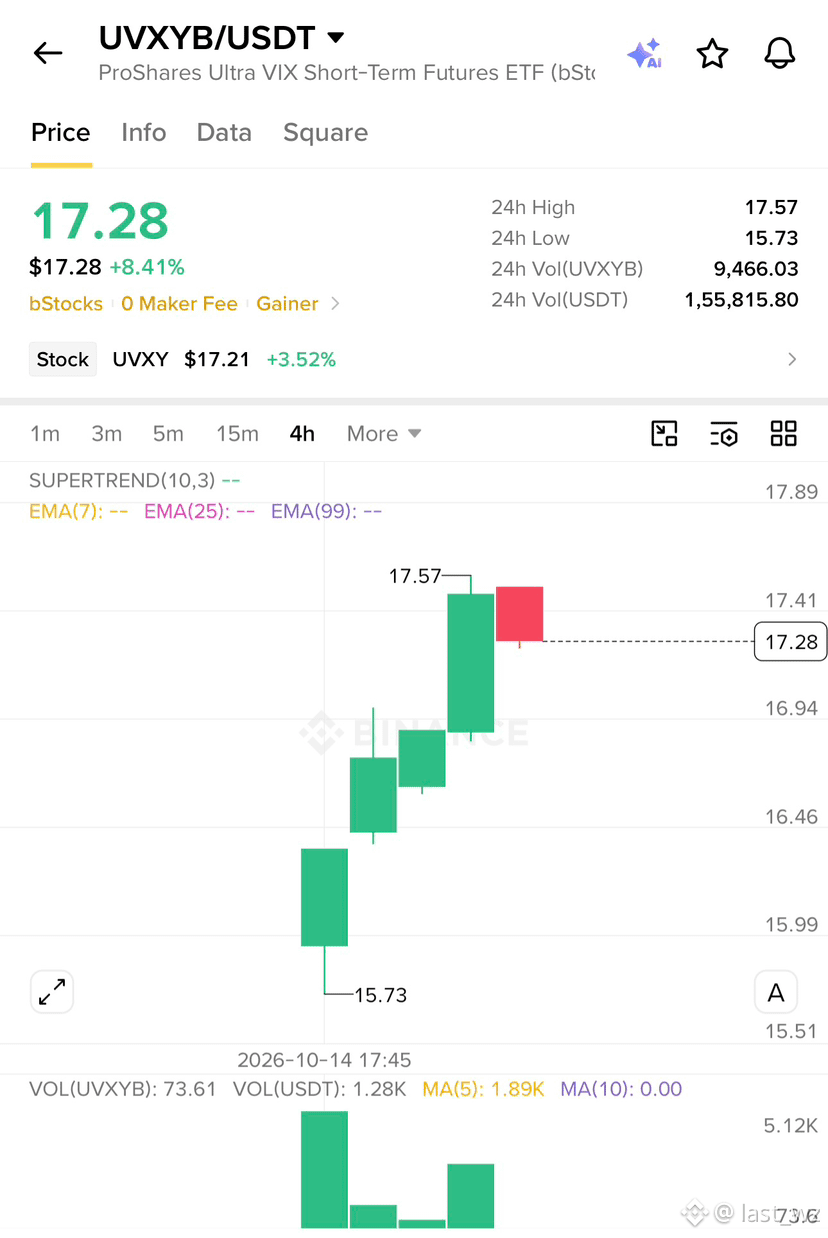
Firstly it goes up when it's new, And then 📉😂 $UVXYB
{spot}(UVXYBUSDT)
Firstly it goes up when it's new, And then 📉😂 $UVXYB
12
81
·
--
Article
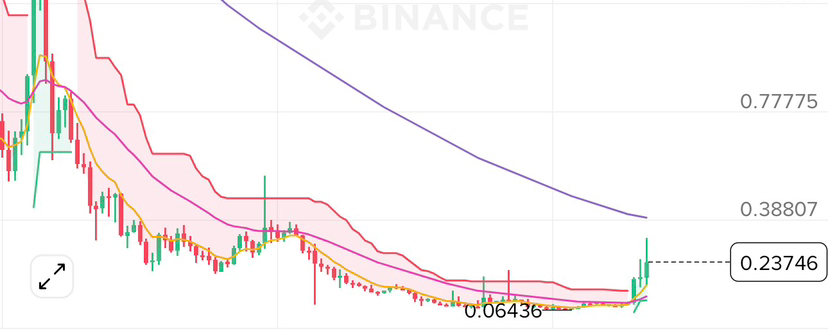
This is pumping💹💹💹$GTC this week GTCusdt is pumping out🔥🔥🔥 Trade it now 💹💹💹💹💹💹💹
This is pumping💹💹💹
$GTC this week GTCusdt is pumping out🔥🔥🔥 Trade it now 💹💹💹💹💹💹💹
1
219
·
--
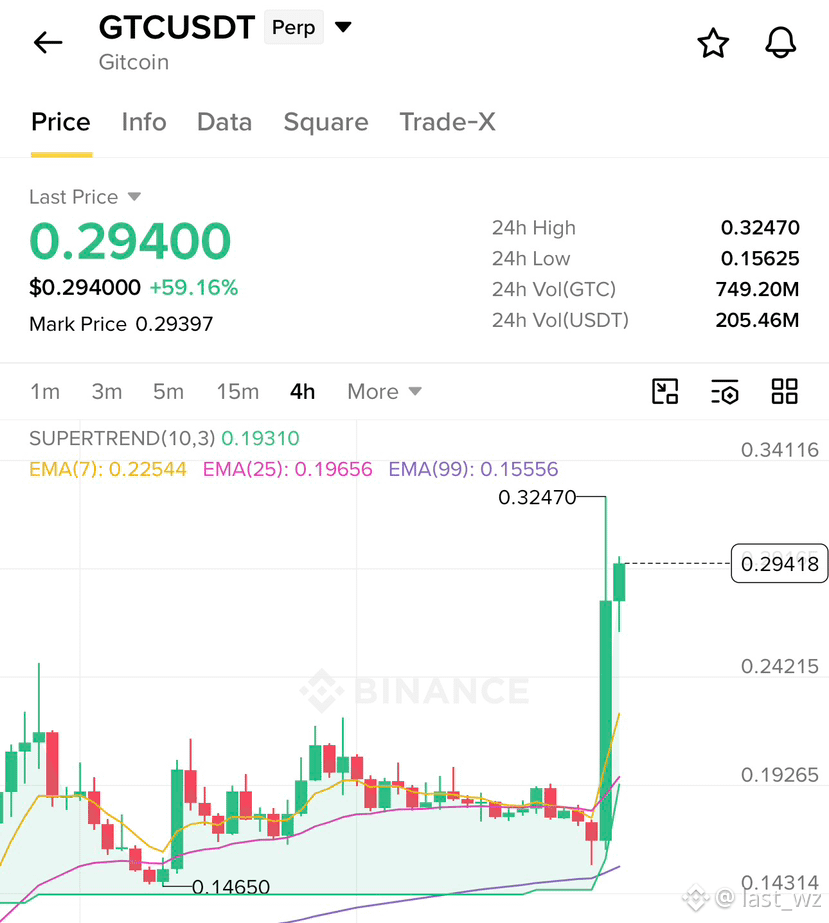
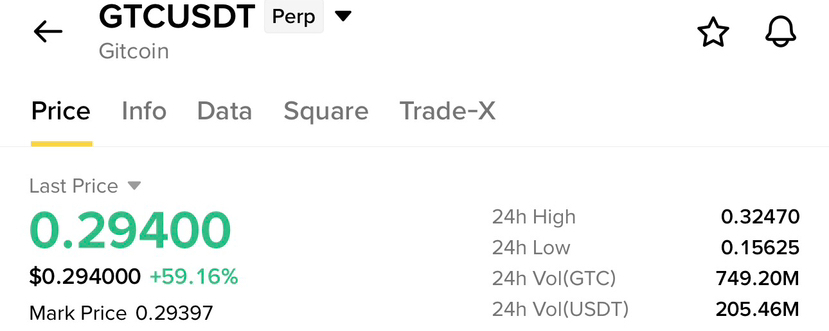
$GTC is pumping 🔥💹💹💹 like bouncing ball. How high it goes, it makes short money high 🔥🔥
{future}(GTCUSDT)
$GTC is pumping 🔥💹💹💹 like bouncing ball. How high it goes, it makes short money high 🔥🔥

2
103
·
--
Article
250
·
--
Looking at the trending topic #EthereumSurpasses2500USDT alongside data showing persistent spot ETF outflows, treating $2,500 as a definitive breakout is naive. A spot price hovering right at a psychological round number is often a precarious inflection point, not a guaranteed floor.
If macro headwinds or outflows persist, that $2,500 level can flip from resistance-turned-support back into a breakdown zone. What invalidates your thesis here if selling pressure accelerates? $ETH
{future}(ETHUSDT)
Looking at the trending topic #EthereumSurpasses2500USDT alongside data showing persistent spot ETF outflows, treating $2,500 as a definitive breakout is naive. A spot price hovering right at a psychological round number is often a precarious inflection point, not a guaranteed floor.
If macro headwinds or outflows persist, that $2,500 level can flip from resistance-turned-support back into a breakdown zone. What invalidates your thesis here if selling pressure accelerates? $ETH
If macro headwinds or outflows persist, that $2,500 level can flip from resistance-turned-support back into a breakdown zone. What invalidates your thesis here if selling pressure accelerates? $ETH

88
·
--
Bullish
Is pumping🔥💹
Is pumping🔥💹
last_wz
·
--
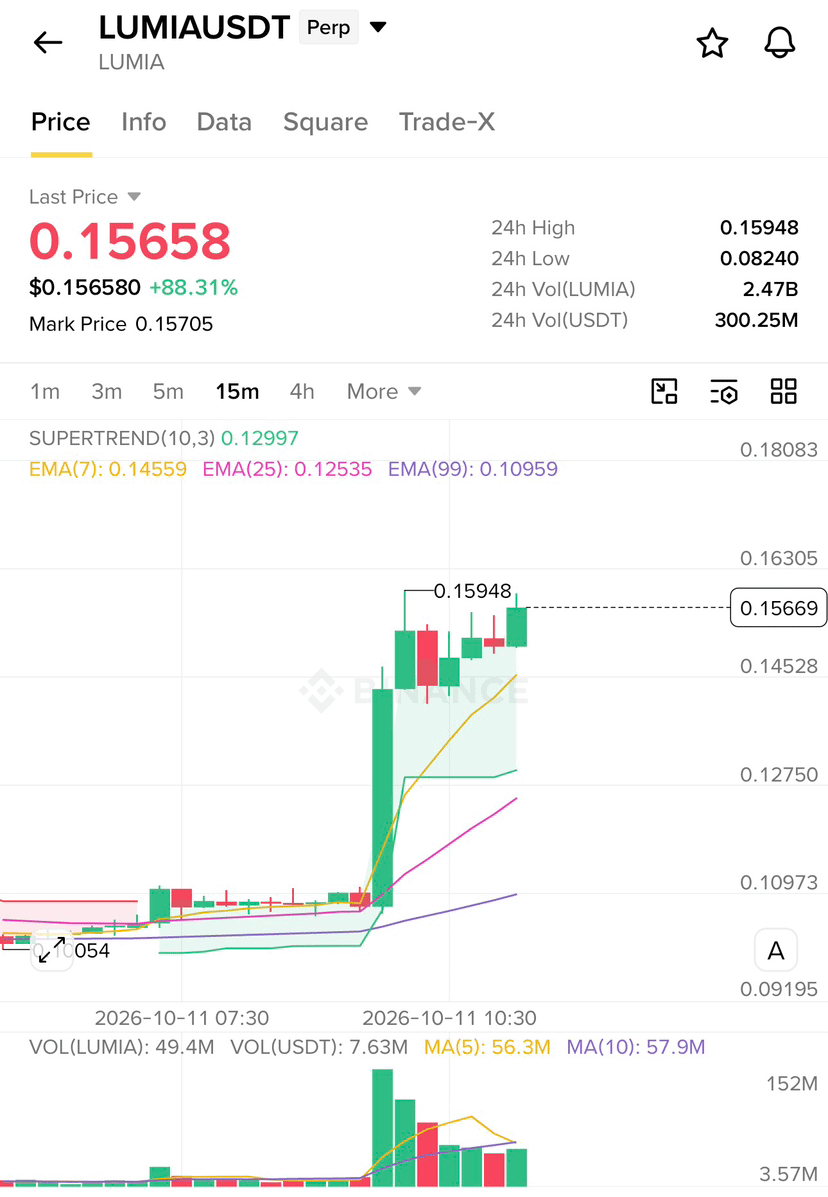
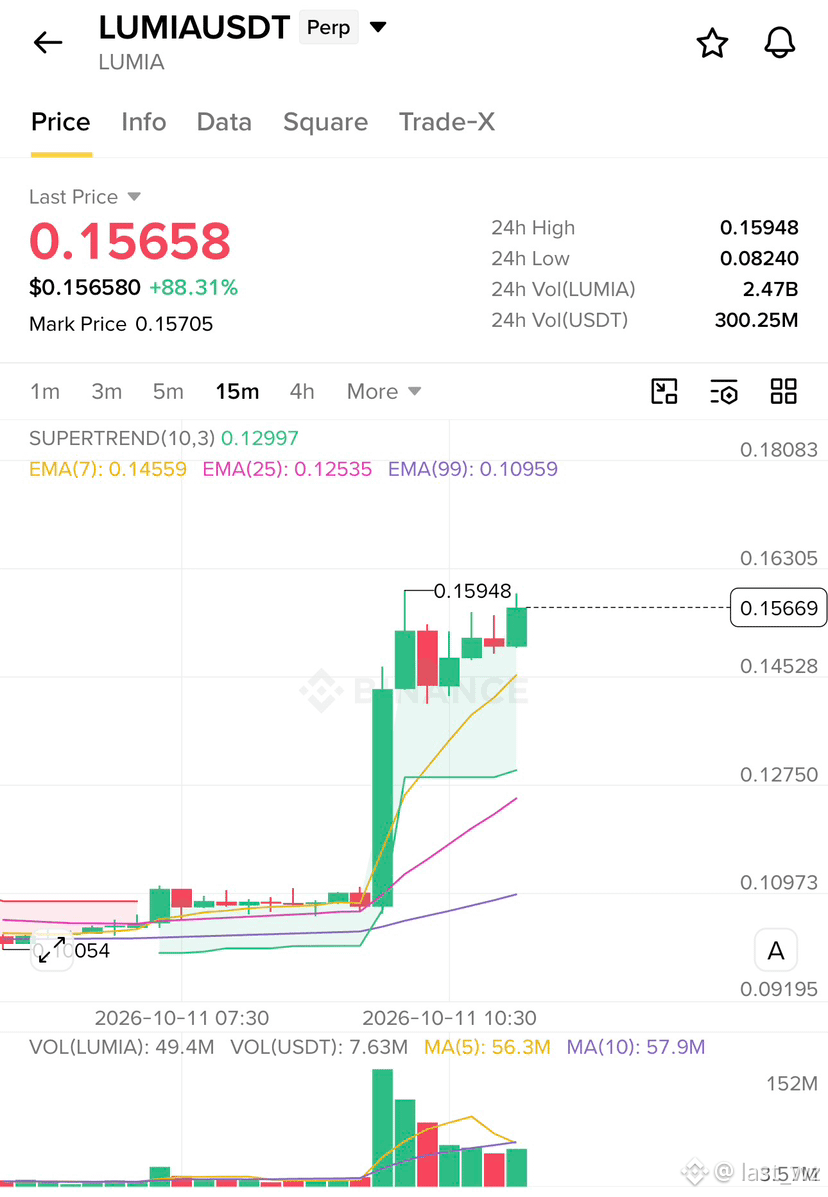
Bullish$LUMIA is pumping🔥🔥 you can now wait and take a good short position.
Note: analyze again before you trade.
Note: analyze again before you trade.
18
·
--
Bullish
$LUMIA is pumping🔥🔥 you can now wait and take a good short position.
Note: analyze again before you trade.
$LUMIA is pumping🔥🔥 you can now wait and take a good short position.
Note: analyze again before you trade.
Note: analyze again before you trade.
2
249
·
--
Article
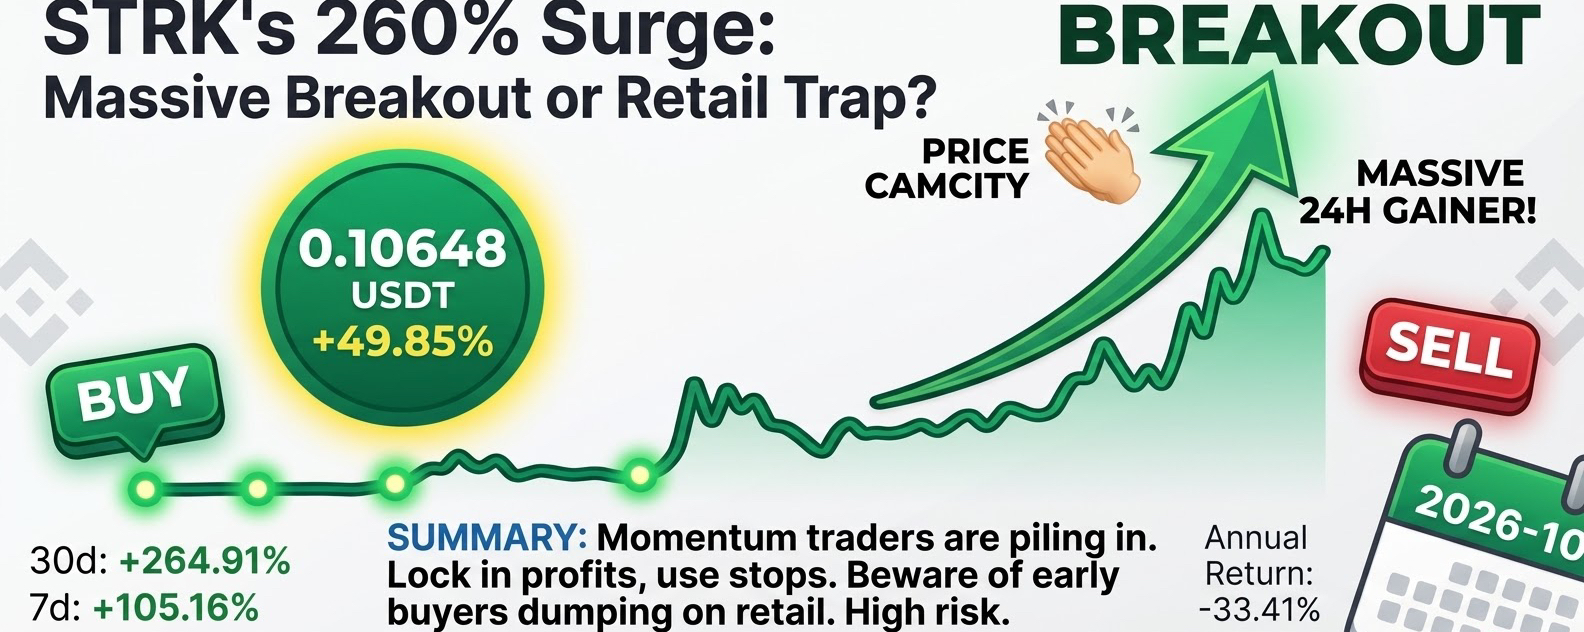
STRK's 260% Surge: Massive Breakout or Retail Trap?Starknet (STRK) is exploding, surging 49.85% today to 0.10648 USDT with $107M in volume. It’s up 264% over 30 days, driven by sudden breakout momentum. Don't let FOMO blind you. Zoom out: STRK is still down -33.41% over the last year. This isn't necessarily a long-term trend reversal—it’s a violent relief rally where early buyers at 0.024 are waiting to take profits on late chasing retail.
The Play: Protect your gains, tighten stop-losses, and expect a pullback. Don't buy the top.
STRK's 260% Surge: Massive Breakout or Retail Trap?
Starknet (STRK) is exploding, surging 49.85% today to 0.10648 USDT with $107M in volume. It’s up 264% over 30 days, driven by sudden breakout momentum. Don't let FOMO blind you. Zoom out: STRK is still down -33.41% over the last year. This isn't necessarily a long-term trend reversal—it’s a violent relief rally where early buyers at 0.024 are waiting to take profits on late chasing retail.
The Play: Protect your gains, tighten stop-losses, and expect a pullback. Don't buy the top.
The Play: Protect your gains, tighten stop-losses, and expect a pullback. Don't buy the top.
17
2
3
188
·
--

Article
BNB/USDT Technical Analysis: 4-Hour Recovery Attempt & Resistance ReviewThis 4-hour BNB/USDT chart shows a modest recovery, trading at 753.16 (+1.58%). After dropping to a local low of 717.07, price is attempting a rebound but faces strong dynamic overhead resistance around 758.75 - 763.90 from the Supertrend and EMA 99. #BNB_Market_Update #EthereumSurpasses2500USDT $BNB
{future}(BNBUSDT)
BNB/USDT Technical Analysis: 4-Hour Recovery Attempt & Resistance Review
This 4-hour BNB/USDT chart shows a modest recovery, trading at 753.16 (+1.58%). After dropping to a local low of 717.07, price is attempting a rebound but faces strong dynamic overhead resistance around 758.75 - 763.90 from the Supertrend and EMA 99. #BNB_Market_Update #EthereumSurpasses2500USDT $BNB
19
2
61
·
--
Article
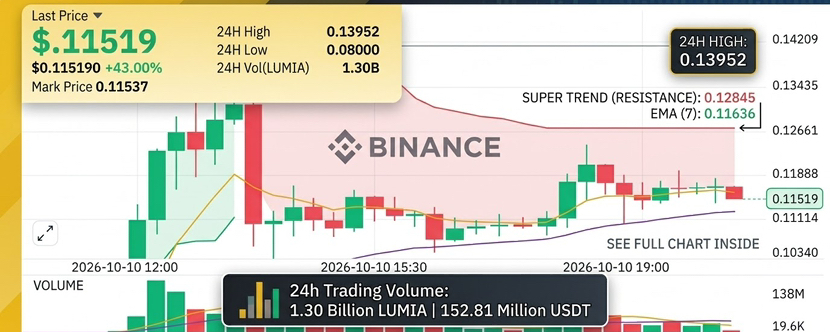
LUMIAUSDT Technical Analysis: 15-Minute Chart ReviewThe 15-minute LUMIAUSDT Perp chart shows a classic pump-and-dump structure. After spiking to a high of 0.13952, price crashed sharply. It currently trades at 0.11519 (+43.00%), pinned below the Supertrend resistance (0.12845) and EMA 7 (0.11636) with declining volume, indicating waning momentum. #Lumia $LUMIA
{future}(LUMIAUSDT)
LUMIAUSDT Technical Analysis: 15-Minute Chart Review
The 15-minute LUMIAUSDT Perp chart shows a classic pump-and-dump structure. After spiking to a high of 0.13952, price crashed sharply. It currently trades at 0.11519 (+43.00%), pinned below the Supertrend resistance (0.12845) and EMA 7 (0.11636) with declining volume, indicating waning momentum. #Lumia $LUMIA
23
160
·
--
shh
shh

crypto-MS
·
--
🚀 BTC is still leading the crypto market, and today I’m bringing a little surprise for the community.
🎁 Binance Red Packet is ready with BTC!
Bitcoin continues to be the heart of the market, and moments like this are a great way to share the excitement with fellow crypto users.
Stay active, keep watching the market, and don’t miss the opportunity.
Good luck everyone! 🍀#Crypto_Jobs🎯 #btc70k $BTC
🎁 Binance Red Packet is ready with BTC!
Bitcoin continues to be the heart of the market, and moments like this are a great way to share the excitement with fellow crypto users.
Stay active, keep watching the market, and don’t miss the opportunity.
Good luck everyone! 🍀#Crypto_Jobs🎯 #btc70k $BTC

36
Log in to explore more content
Join global crypto users on Binance Square
⚡️ Get latest and useful information about crypto.
💬 Trusted by the world’s largest crypto exchange.
👍 Discover real insights from verified creators.
Email / Phone number
Trending Topics
BinanceReports80%Recoveryof$6.3BillioninLossesfromHackIncident
3,757 views
53 Discussing
Binance News Update | Binance Co-CEOs Say 80% of the $6.3 Billion Loss Is Already Covered, With Withdrawals Restarting in Phases and Proof of Reserves Due Monday
Binance News
·198 Likes
·175.9k views
HeYiSaysWithdrawalsExpectedtoResumeWithin42Hours
4,471 views
134 Discussing
CZSaysCompensationIsinPlaceUsersAreProtected
3,289 views
109 Discussing