
jimwilldoit积木
17.6k Posts

jimwilldoit积木
听说点关注的都赚麻了! 币安钱包专属邀请码:jimwilldoit X:@jimwilldoitnow 合作私我 爱你们!祝打赏的家人们发发发!全网同名:jimwilldoit

BNB Holder
Frequent Trader
3.9 Years
243 Following
7.8K+ Followers
17.2K+ Liked
Posts
All
Quotes
Videos
Live
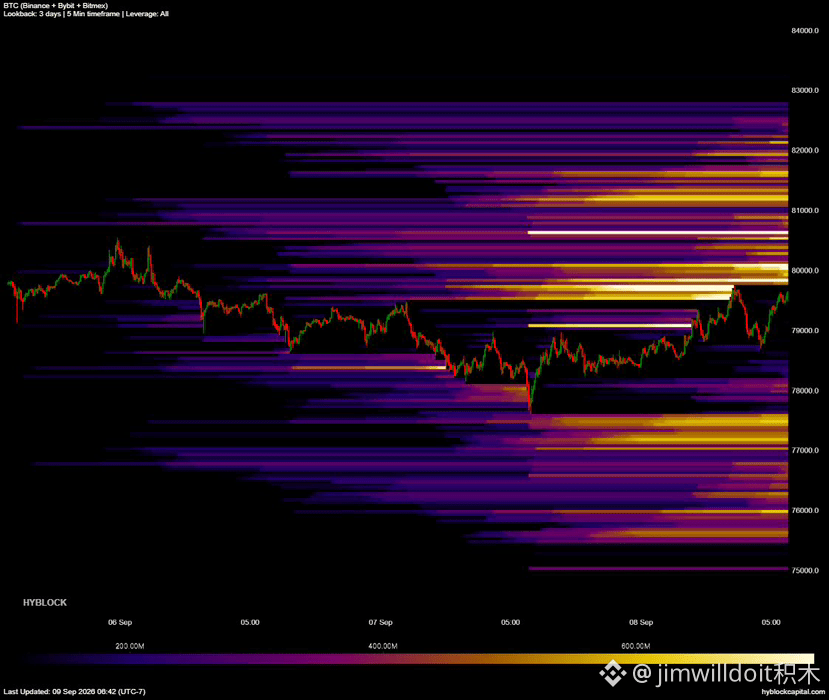
$BTC This 80K—82K move has already thoroughly filled the short fuel tank!
In the 3-day liquidation chart, the liquidity above is very thick.
Around 78K, the longs’ support is still holding.
As long as price continues to get squeezed upward.
80K—82K can very easily turn into the next magnet!
From the 3-day liquidation structure, above BTC, there is a clearly defined short liquidation zone clustered at 80K—82K, while around 78K is still an important short-term support zone. As long as price holds 78K and then reclaims with increased volume, that batch of leveraged positions above is likely to be triggered continuously.
But a liquidation hotspot only represents potential liquidity draw— it doesn’t mean price is definitely going to sweep it. Next, watch whether 80K can regain and hold. Once it breaks through and spot trading keeps up, the short covering around 82K could likely amplify volatility even further.
If 78K holds, longs still have the “right” to sweep liquidity upward.
If 80K—82K really gets ignited, this squeeze can happen insanely fast!
Click the card below—go straight in!👇
$ETH $ZEC #比特币突破79000美元
In the 3-day liquidation chart, the liquidity above is very thick.
Around 78K, the longs’ support is still holding.
As long as price continues to get squeezed upward.
80K—82K can very easily turn into the next magnet!
From the 3-day liquidation structure, above BTC, there is a clearly defined short liquidation zone clustered at 80K—82K, while around 78K is still an important short-term support zone. As long as price holds 78K and then reclaims with increased volume, that batch of leveraged positions above is likely to be triggered continuously.
But a liquidation hotspot only represents potential liquidity draw— it doesn’t mean price is definitely going to sweep it. Next, watch whether 80K can regain and hold. Once it breaks through and spot trading keeps up, the short covering around 82K could likely amplify volatility even further.
If 78K holds, longs still have the “right” to sweep liquidity upward.
If 80K—82K really gets ignited, this squeeze can happen insanely fast!
Click the card below—go straight in!👇
$ETH $ZEC #比特币突破79000美元
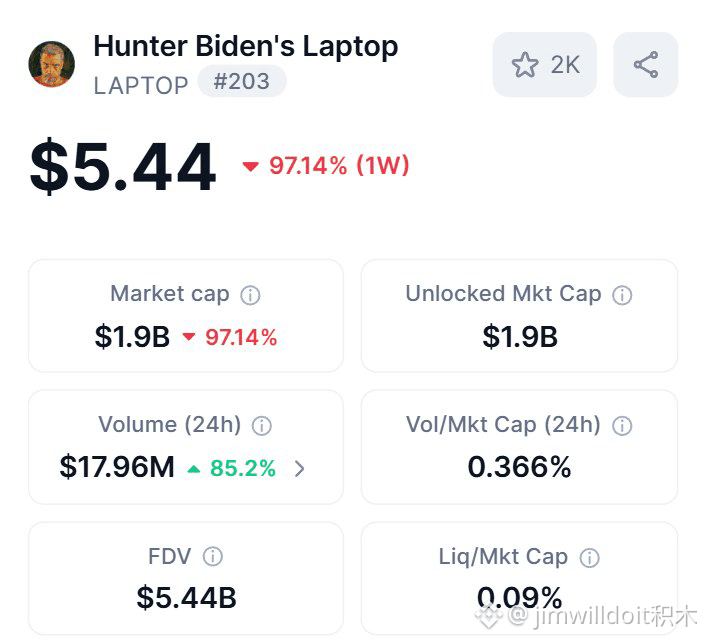
The LAPTOP token was live for only a short time before it got brutally wrecked—down 97%!
Political Meme hype instantly turned into a bloody wipeout.
Earlier, they were even using TRUMP to short and profit off the supposedly losing users as an “airdrop gimmick”!
But they ended up becoming the loss case themselves first.
This time, it went from a traffic-carnival frenzy straight into a liquidity crash!
After the LAPTOP connected to Hunter Biden launched, the price has already plunged more than 97% from its peak. All the traffic narrative that was built around political topics, community airdrops, and TRUMP’s “losing users” just couldn’t hold up the secondary market price. The biggest fear for a Meme coin is that once the first wave of heat dies down, there isn’t enough new demand to absorb it. If the supply gets concentrated and liquidity is thin, once it starts falling there’s basically no buffer.
This time, they also laid the risks of high-hype political Memes bare: a story being explosive doesn’t mean the buy-side is strong. Airdrops, celebrities, and trending topics can only pull in the first wave of attention—what truly determines the price afterward is sustained trading volume and the structure of the token holdings. After a 97% retracement, the market will reassess whether this project has real ongoing support.
Earlier they grabbed attention by chasing narratives—later they got taught a lesson directly by the candlestick chart.
The cruelest part about Memes is never how much they pump, but when the heat dissipates, liquidity can evaporate in an instant!
Click the card below—go straight in! 👇$BTC $ETH
Political Meme hype instantly turned into a bloody wipeout.
Earlier, they were even using TRUMP to short and profit off the supposedly losing users as an “airdrop gimmick”!
But they ended up becoming the loss case themselves first.
This time, it went from a traffic-carnival frenzy straight into a liquidity crash!
After the LAPTOP connected to Hunter Biden launched, the price has already plunged more than 97% from its peak. All the traffic narrative that was built around political topics, community airdrops, and TRUMP’s “losing users” just couldn’t hold up the secondary market price. The biggest fear for a Meme coin is that once the first wave of heat dies down, there isn’t enough new demand to absorb it. If the supply gets concentrated and liquidity is thin, once it starts falling there’s basically no buffer.
This time, they also laid the risks of high-hype political Memes bare: a story being explosive doesn’t mean the buy-side is strong. Airdrops, celebrities, and trending topics can only pull in the first wave of attention—what truly determines the price afterward is sustained trading volume and the structure of the token holdings. After a 97% retracement, the market will reassess whether this project has real ongoing support.
Earlier they grabbed attention by chasing narratives—later they got taught a lesson directly by the candlestick chart.
The cruelest part about Memes is never how much they pump, but when the heat dissipates, liquidity can evaporate in an instant!
Click the card below—go straight in! 👇$BTC $ETH
Verified
$牛来 This time, it’s really going to Binance spot!
The new ticker is officially here.
Binance confirms it’s bullish!
And it also comes with a Seed Tag.
This Chinese meme is about to go in hard and capture another wave of traffic!
Binance’s latest announcement says it will list bullish coin and add a Seed Tag to it. Previously, bullish coin was the first to land on Binance Futures, and now the spot trading entry has also been opened—meaning trading depth, exposure, and reach to new users may be further amplified.
A Seed Tag also indicates the project is still a high-volatility, high-risk asset. After listing, the price elasticity is usually very large. Next, keep an eye on the opening trading volume, the concentration of order book/float, and the contract funding rate. If the spot market funds can truly absorb the first wave of sell pressure, then this burst of heat may have a chance to keep extending.
Contracts go first, and spot is following now.
Can this Chinese meme really drive out the next leg of the rally? Bullish coin is about to prove its mettle!
Click the card below and go straight in!👇
$BTC $ETH
The new ticker is officially here.
Binance confirms it’s bullish!
And it also comes with a Seed Tag.
This Chinese meme is about to go in hard and capture another wave of traffic!
Binance’s latest announcement says it will list bullish coin and add a Seed Tag to it. Previously, bullish coin was the first to land on Binance Futures, and now the spot trading entry has also been opened—meaning trading depth, exposure, and reach to new users may be further amplified.
A Seed Tag also indicates the project is still a high-volatility, high-risk asset. After listing, the price elasticity is usually very large. Next, keep an eye on the opening trading volume, the concentration of order book/float, and the contract funding rate. If the spot market funds can truly absorb the first wave of sell pressure, then this burst of heat may have a chance to keep extending.
Contracts go first, and spot is following now.
Can this Chinese meme really drive out the next leg of the rally? Bullish coin is about to prove its mettle!
Click the card below and go straight in!👇
$BTC $ETH

$XRP Ripple has gone straight into action this time, lobbying for the CLARITY Act!
Stuart Alderoty has started knocking on senators’ offices one by one.
The target is those who haven’t taken a position yet or are preparing to vote against it!
He is asking them to meet real crypto holders before voting.
This regulatory battle has already escalated all the way to the final lobbying phase!
Ripple’s chief legal officer, Stuart Alderoty, said he has proactively contacted senator offices that have not yet decided their stance—or are planning to oppose the CLARITY Act—asking them to speak face-to-face with real American crypto holders before the vote. Regulatory lobbying has expanded from industry associations and corporate executives to directly advocating for the interests of ordinary coin holders.
The key is the last few votes. For the CLARITY Act to keep moving forward, it needs cross-party support, but issues like ethics provisions and conflicts of interest are still being contested. If big companies like Ripple can bring industry users into the lobbying arena together, the final vote count battle could continue to shift.
What’s at stake now isn’t just the bill text anymore—it’s who can win back the last few votes.
Ripple has even come to the doorstep itself—this tough fight for the CLARITY Act is far from over!
Click the card below and go straight at it!👇
$BTC $ETH #Ripple游说推进CLARITY法案投票 👍
Stuart Alderoty has started knocking on senators’ offices one by one.
The target is those who haven’t taken a position yet or are preparing to vote against it!
He is asking them to meet real crypto holders before voting.
This regulatory battle has already escalated all the way to the final lobbying phase!
Ripple’s chief legal officer, Stuart Alderoty, said he has proactively contacted senator offices that have not yet decided their stance—or are planning to oppose the CLARITY Act—asking them to speak face-to-face with real American crypto holders before the vote. Regulatory lobbying has expanded from industry associations and corporate executives to directly advocating for the interests of ordinary coin holders.
The key is the last few votes. For the CLARITY Act to keep moving forward, it needs cross-party support, but issues like ethics provisions and conflicts of interest are still being contested. If big companies like Ripple can bring industry users into the lobbying arena together, the final vote count battle could continue to shift.
What’s at stake now isn’t just the bill text anymore—it’s who can win back the last few votes.
Ripple has even come to the doorstep itself—this tough fight for the CLARITY Act is far from over!
Click the card below and go straight at it!👇
$BTC $ETH #Ripple游说推进CLARITY法案投票 👍

So strong, teacher! 👍
Verified
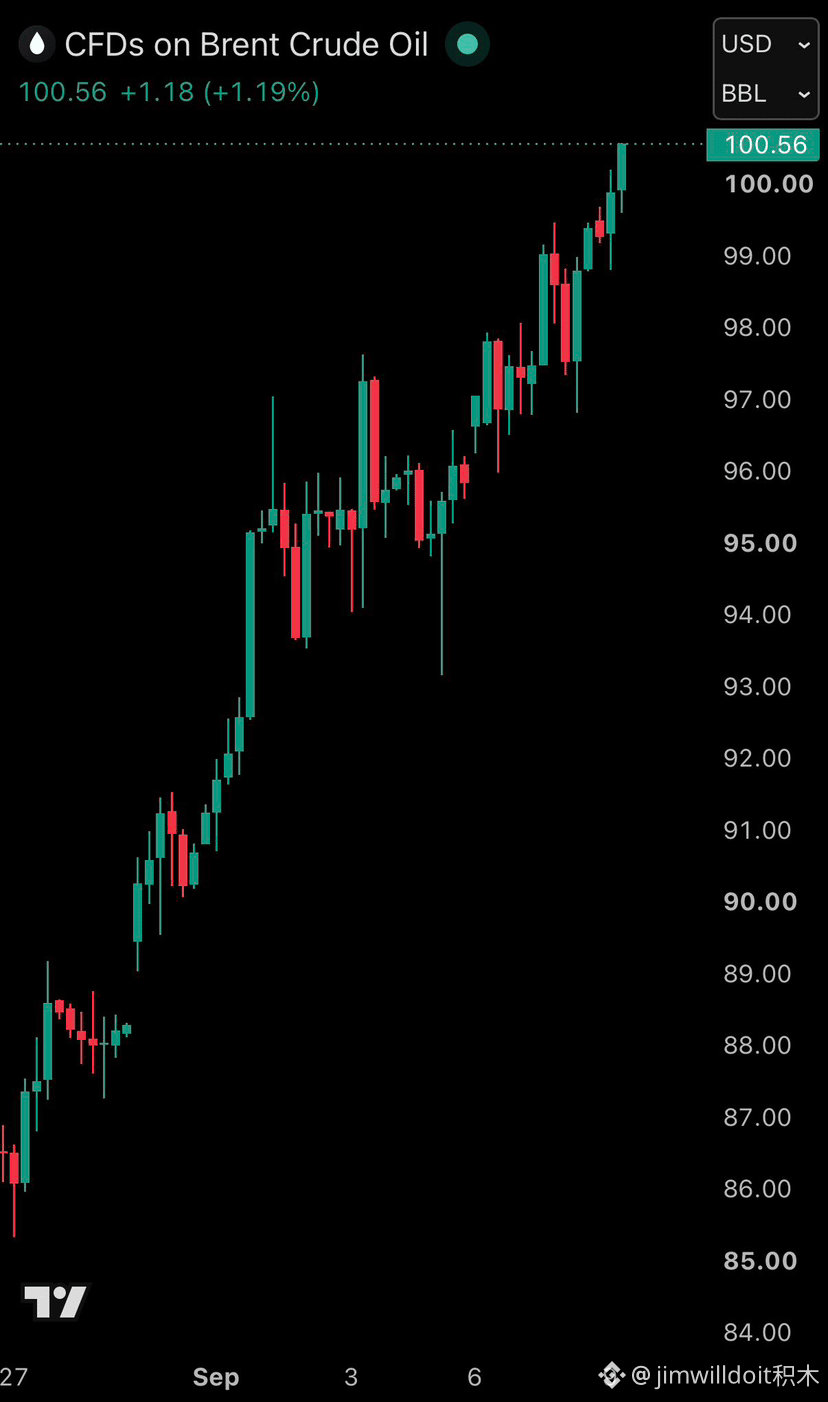
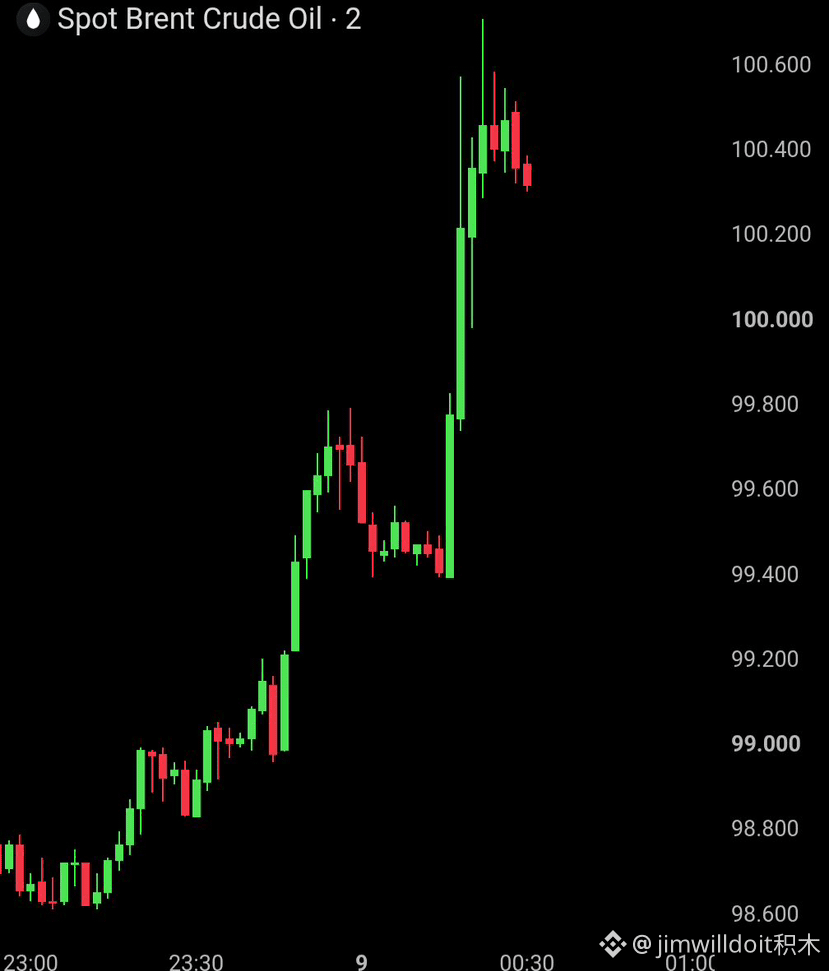
$CL Brent crude oil directly attacks through the $100 mark!
This is the first time it has returned to three digits since July.
After U.S. strikes on Iranian oil tankers, the risk premium surged again!
Concerns over Hormuz supply continue to heat up.
This energy-market fire has already spread to global inflation!
Brent crude oil rose to around $100.19 per barrel at its latest, breaking back above the $100 integer threshold; WTI also moved in tandem toward $95. The U.S. strikes on Iranian oil tankers, combined with ongoing restrictions on crude transport through the Strait of Hormuz, are causing the market to reprice the Middle East supply chain.
What’s more troublesome is that oil prices have risen by about 25% since early August. If prices keep holding above $100, higher energy costs can easily push inflation expectations and U.S. Treasury yields higher again. The Federal Reserve’s policy room will also be further squeezed, and both crypto and tech stocks will have to keep bearing macro headwinds.
This time, $100 is not just a psychological level—it’s a warning line for renewed global inflation.
If something big happens again in the Strait of Hormuz, the next leg of the crude rally accelerating is likely to transmit to all risk assets!
Click the card below and go straight at it!👇
$BTC $ETH #原油涨至7月来最高
This is the first time it has returned to three digits since July.
After U.S. strikes on Iranian oil tankers, the risk premium surged again!
Concerns over Hormuz supply continue to heat up.
This energy-market fire has already spread to global inflation!
Brent crude oil rose to around $100.19 per barrel at its latest, breaking back above the $100 integer threshold; WTI also moved in tandem toward $95. The U.S. strikes on Iranian oil tankers, combined with ongoing restrictions on crude transport through the Strait of Hormuz, are causing the market to reprice the Middle East supply chain.
What’s more troublesome is that oil prices have risen by about 25% since early August. If prices keep holding above $100, higher energy costs can easily push inflation expectations and U.S. Treasury yields higher again. The Federal Reserve’s policy room will also be further squeezed, and both crypto and tech stocks will have to keep bearing macro headwinds.
This time, $100 is not just a psychological level—it’s a warning line for renewed global inflation.
If something big happens again in the Strait of Hormuz, the next leg of the crude rally accelerating is likely to transmit to all risk assets!
Click the card below and go straight at it!👇
$BTC $ETH #原油涨至7月来最高

Partly True
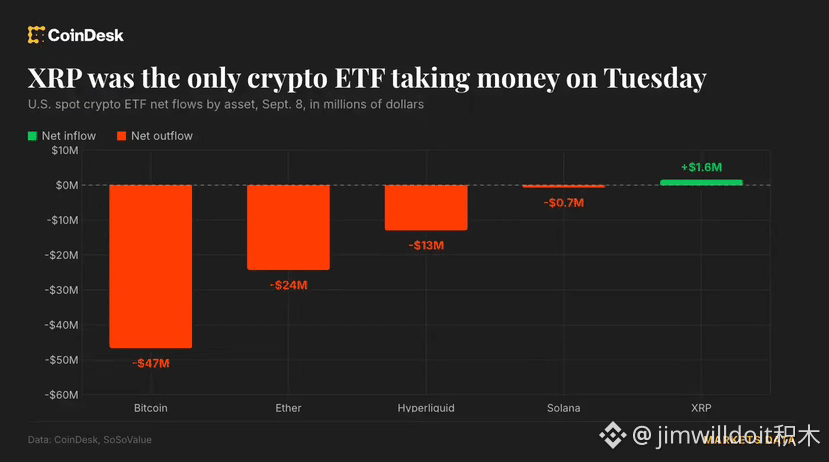
$XRP ETF Today, it surprisingly moved against the trend and aggressively pulled in funds!
On Tuesday, net inflows were close to $2 million.
But BTC, ETH, SOL, and HYPE all saw outflows!
The differentiation in capital has suddenly widened.
XRP’s relative strength is starting to show a certain flavor!
On Tuesday, there was clear differentiation in spot ETF flows: the XRP ETF recorded nearly $2 million in net inflows against the trend, while the BTC, ETH, SOL, and HYPE-related ETFs all posted net outflows over the same period. By absolute amount it isn’t huge, but against the backdrop of widespread outflows from major assets, XRP is still managing to hold positive inflows—its capital resilience stands out more clearly.
Next, the key is whether this counter-trend inflow can continue. If it can keep positive inflows for several consecutive days while broader market funds weaken, the market will likely start trading XRP’s relative strength. Conversely, if it’s only a one-day spike, it will need more continuous capital confirmation.
While the overall market ETFs are bleeding, XRP can still attract money.
If this counter-trend strength continues, capital rotation may very well start driving right toward XRP!
Click the card below—let’s go straight in!👇
$BTC $ETH
On Tuesday, net inflows were close to $2 million.
But BTC, ETH, SOL, and HYPE all saw outflows!
The differentiation in capital has suddenly widened.
XRP’s relative strength is starting to show a certain flavor!
On Tuesday, there was clear differentiation in spot ETF flows: the XRP ETF recorded nearly $2 million in net inflows against the trend, while the BTC, ETH, SOL, and HYPE-related ETFs all posted net outflows over the same period. By absolute amount it isn’t huge, but against the backdrop of widespread outflows from major assets, XRP is still managing to hold positive inflows—its capital resilience stands out more clearly.
Next, the key is whether this counter-trend inflow can continue. If it can keep positive inflows for several consecutive days while broader market funds weaken, the market will likely start trading XRP’s relative strength. Conversely, if it’s only a one-day spike, it will need more continuous capital confirmation.
While the overall market ETFs are bleeding, XRP can still attract money.
If this counter-trend strength continues, capital rotation may very well start driving right toward XRP!
Click the card below—let’s go straight in!👇
$BTC $ETH
$BTC ETF today once again took direct action into $46.65 million!
Spot funds continue to maintain net inflows.
The institutional buy orders haven’t completely stopped!
Even amid high-range volatility, there are still people picking up inventory.
This funding line is still propping up the bulls!
The latest U.S. spot Bitcoin ETF recorded a net inflow of $46.65 million. While the size isn’t particularly huge, during the phase where BTC repeatedly chops around at high levels, the capital still maintains a positive return. Compared with a single day of explosive volume, the more important point is that this institutional allocation line hasn’t been easily broken.
Next, we’ll see whether these modest net inflows can continue to accumulate. If it stays positive for several consecutive days, the supply released at high levels will be absorbed little by little. When the price once again challenges key resistance, the more stable the spot buying, the stronger the foundation for a breakout.
$46.65 million isn’t outrageous, but the advantage is that the funds are still moving in.
As long as this ETF buying momentum keeps coming, BTC will still have the confidence to surge hard!
Click the card below and get started!👇
$ETH $ZEC
Spot funds continue to maintain net inflows.
The institutional buy orders haven’t completely stopped!
Even amid high-range volatility, there are still people picking up inventory.
This funding line is still propping up the bulls!
The latest U.S. spot Bitcoin ETF recorded a net inflow of $46.65 million. While the size isn’t particularly huge, during the phase where BTC repeatedly chops around at high levels, the capital still maintains a positive return. Compared with a single day of explosive volume, the more important point is that this institutional allocation line hasn’t been easily broken.
Next, we’ll see whether these modest net inflows can continue to accumulate. If it stays positive for several consecutive days, the supply released at high levels will be absorbed little by little. When the price once again challenges key resistance, the more stable the spot buying, the stronger the foundation for a breakout.
$46.65 million isn’t outrageous, but the advantage is that the funds are still moving in.
As long as this ETF buying momentum keeps coming, BTC will still have the confidence to surge hard!
Click the card below and get started!👇
$ETH $ZEC


$BTC Iran begins doing it vigorously, shifting toward Crypto under sanctions pressure!
Foreign exchange controls are quietly being relaxed.
Tether and Bitcoin are being used to support cross-border trade!
The more blocked the traditional USD channels are, the more important on-chain settlement becomes.
This time, Crypto is truly starting to run into nation-level trade scenarios!
Against the backdrop of ongoing U.S. sanctions and increased maritime blockades, Iran’s central bank is easing some of its stricter foreign-exchange limits. It allows businesses to use digital assets such as USDT and Bitcoin more flexibly to complete cross-border settlements, and to pay for imported goods directly through export revenue—bypassing some parts of traditional finance and official exchange-rate restrictions.
These needs are completely different from ordinary speculation. The core is payments, settlement, and the cross-border movement of capital. The heavier the sanctions, the easier it is for Iran to deepen its reliance on stablecoins and on-chain assets—again pushing the Crypto narrative of “censorship resistance + global settlement” into a real-world scenario.
When traditional financial channels are effectively shut down, the on-chain network starts to act as backup financial infrastructure.
If this nation-level usage continues to spread, Crypto’s value won’t be limited to just price appreciation!
Click the card below and get started!👇
$ETH $SNDK
Foreign exchange controls are quietly being relaxed.
Tether and Bitcoin are being used to support cross-border trade!
The more blocked the traditional USD channels are, the more important on-chain settlement becomes.
This time, Crypto is truly starting to run into nation-level trade scenarios!
Against the backdrop of ongoing U.S. sanctions and increased maritime blockades, Iran’s central bank is easing some of its stricter foreign-exchange limits. It allows businesses to use digital assets such as USDT and Bitcoin more flexibly to complete cross-border settlements, and to pay for imported goods directly through export revenue—bypassing some parts of traditional finance and official exchange-rate restrictions.
These needs are completely different from ordinary speculation. The core is payments, settlement, and the cross-border movement of capital. The heavier the sanctions, the easier it is for Iran to deepen its reliance on stablecoins and on-chain assets—again pushing the Crypto narrative of “censorship resistance + global settlement” into a real-world scenario.
When traditional financial channels are effectively shut down, the on-chain network starts to act as backup financial infrastructure.
If this nation-level usage continues to spread, Crypto’s value won’t be limited to just price appreciation!
Click the card below and get started!👇
$ETH $SNDK


Verified
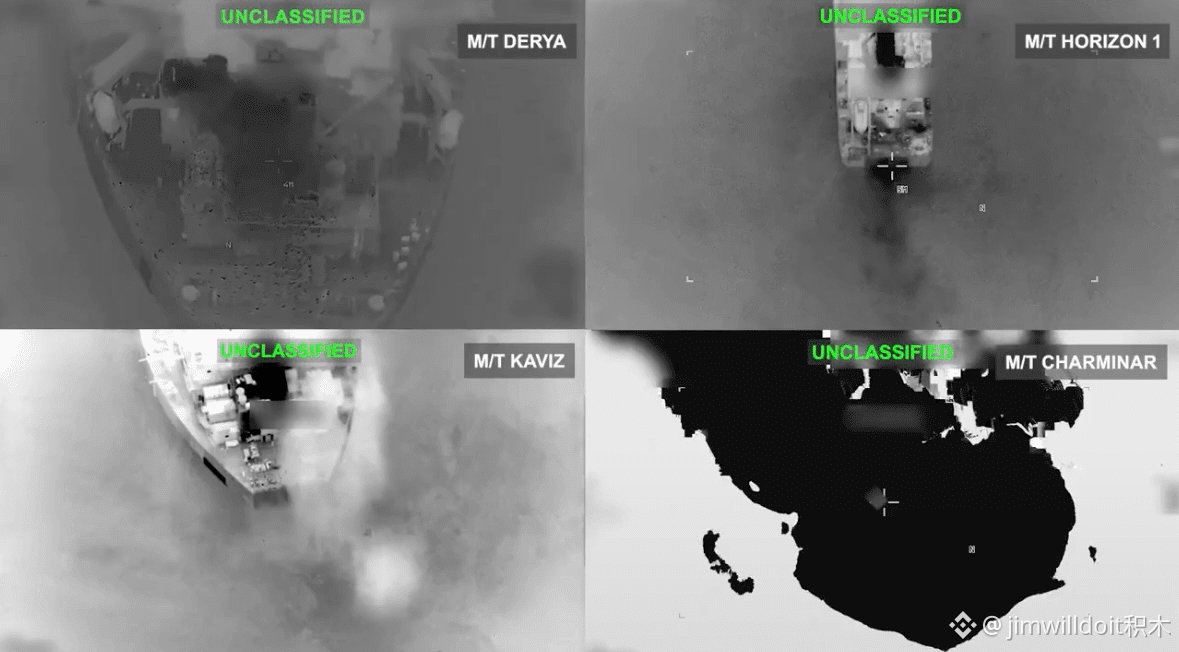
$CL US-Iran conflict: this time they went straight for the tankers!
The U.S. military hit and destroyed five Iranian crude oil tankers in one go.
Earlier, Iran fired ballistic missiles at U.S. warships for two consecutive days.
The U.S. said both attacks were successfully avoided.
The risk of war along the energy transportation chain has been raised another level!
The latest from the U.S.: after Iran fired ballistic missiles at U.S. warships two times across two days, the U.S. destroyed five Iranian crude oil tankers. At present, there are no U.S. personnel casualties. The U.S. also accuses these tankers of helping finance networks related to Iran’s Islamic Revolutionary Guard Corps (IRGC). Maritime energy assets are becoming increasingly directly entangled in the conflict.
More dangerous still, this round of confrontation has continued to escalate—from warship clashes to crude oil transport. As tanker losses keep mounting and Hormuz shipping gets further tightened, the market will keep adding a geopolitical premium to crude oil, which will then feed through to inflation, U.S. Treasury yields, and global risk assets.
Five tankers taken out—this conflict’s damage to the energy market is escalating.
If something else goes wrong with maritime transport, the next round of crude oil price swings is very likely to be harsher than the battlefield news itself! #美军击毁5艘伊朗油轮
Click the card below to get straight into it!👇$BTC $ETH
The U.S. military hit and destroyed five Iranian crude oil tankers in one go.
Earlier, Iran fired ballistic missiles at U.S. warships for two consecutive days.
The U.S. said both attacks were successfully avoided.
The risk of war along the energy transportation chain has been raised another level!
The latest from the U.S.: after Iran fired ballistic missiles at U.S. warships two times across two days, the U.S. destroyed five Iranian crude oil tankers. At present, there are no U.S. personnel casualties. The U.S. also accuses these tankers of helping finance networks related to Iran’s Islamic Revolutionary Guard Corps (IRGC). Maritime energy assets are becoming increasingly directly entangled in the conflict.
More dangerous still, this round of confrontation has continued to escalate—from warship clashes to crude oil transport. As tanker losses keep mounting and Hormuz shipping gets further tightened, the market will keep adding a geopolitical premium to crude oil, which will then feed through to inflation, U.S. Treasury yields, and global risk assets.
Five tankers taken out—this conflict’s damage to the energy market is escalating.
If something else goes wrong with maritime transport, the next round of crude oil price swings is very likely to be harsher than the battlefield news itself! #美军击毁5艘伊朗油轮
Click the card below to get straight into it!👇$BTC $ETH
Verified
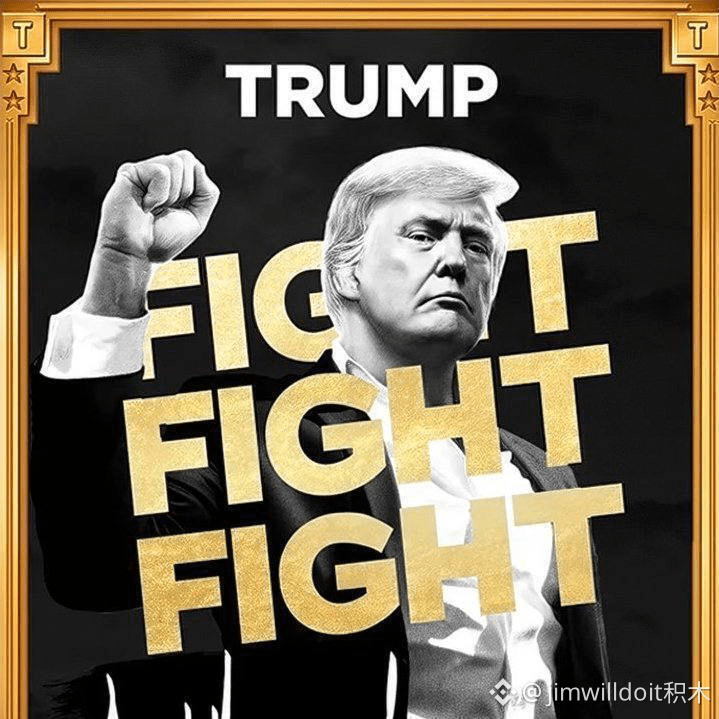
LAPTOP — This airdrop play is going straight at the TRUMP-loss users’ heads!
Hunter Biden personally stepped in to post a Meme.
20% of the supply is allocated for community airdrops.
Even wallets that lost money on TRUMP can claim it!
This political Meme is now starting to directly engage and trade attention head-on!
Hunter Biden’s new meme coin, LAPTOP, will be listed on Base. The total supply is 1 billion coins, with 20% reserved for a community airdrop. In the latest allocation plan, about 2% is set aside specifically for users who lost money on meme coins like TRUMP; 8% goes to eligible Substack subscribers; and another 10% is kept for future community airdrops.
Even more showy: the founding team holds 30%, with vesting and scheduled unlocks. The project also designed a token burn mechanism linked to political events and market performance. From the name to the airdrop targets, LAPTOP is taking a full-on swing at political hot topics. Short-term traffic could be huge, but ultimately this Meme still depends on the chip/holdings structure and whether the real liquidity can actually hold up.
Using TRUMP-loss users to funnel them into LAPTOP—this marketing really knows how to put on a show.
Political Memes have moved from playing separately to actually going at each other, competing for users now! 🫣
Click the card below—go straight for it!👇
$BTC $ETH
Hunter Biden personally stepped in to post a Meme.
20% of the supply is allocated for community airdrops.
Even wallets that lost money on TRUMP can claim it!
This political Meme is now starting to directly engage and trade attention head-on!
Hunter Biden’s new meme coin, LAPTOP, will be listed on Base. The total supply is 1 billion coins, with 20% reserved for a community airdrop. In the latest allocation plan, about 2% is set aside specifically for users who lost money on meme coins like TRUMP; 8% goes to eligible Substack subscribers; and another 10% is kept for future community airdrops.
Even more showy: the founding team holds 30%, with vesting and scheduled unlocks. The project also designed a token burn mechanism linked to political events and market performance. From the name to the airdrop targets, LAPTOP is taking a full-on swing at political hot topics. Short-term traffic could be huge, but ultimately this Meme still depends on the chip/holdings structure and whether the real liquidity can actually hold up.
Using TRUMP-loss users to funnel them into LAPTOP—this marketing really knows how to put on a show.
Political Memes have moved from playing separately to actually going at each other, competing for users now! 🫣
Click the card below—go straight for it!👇
$BTC $ETH

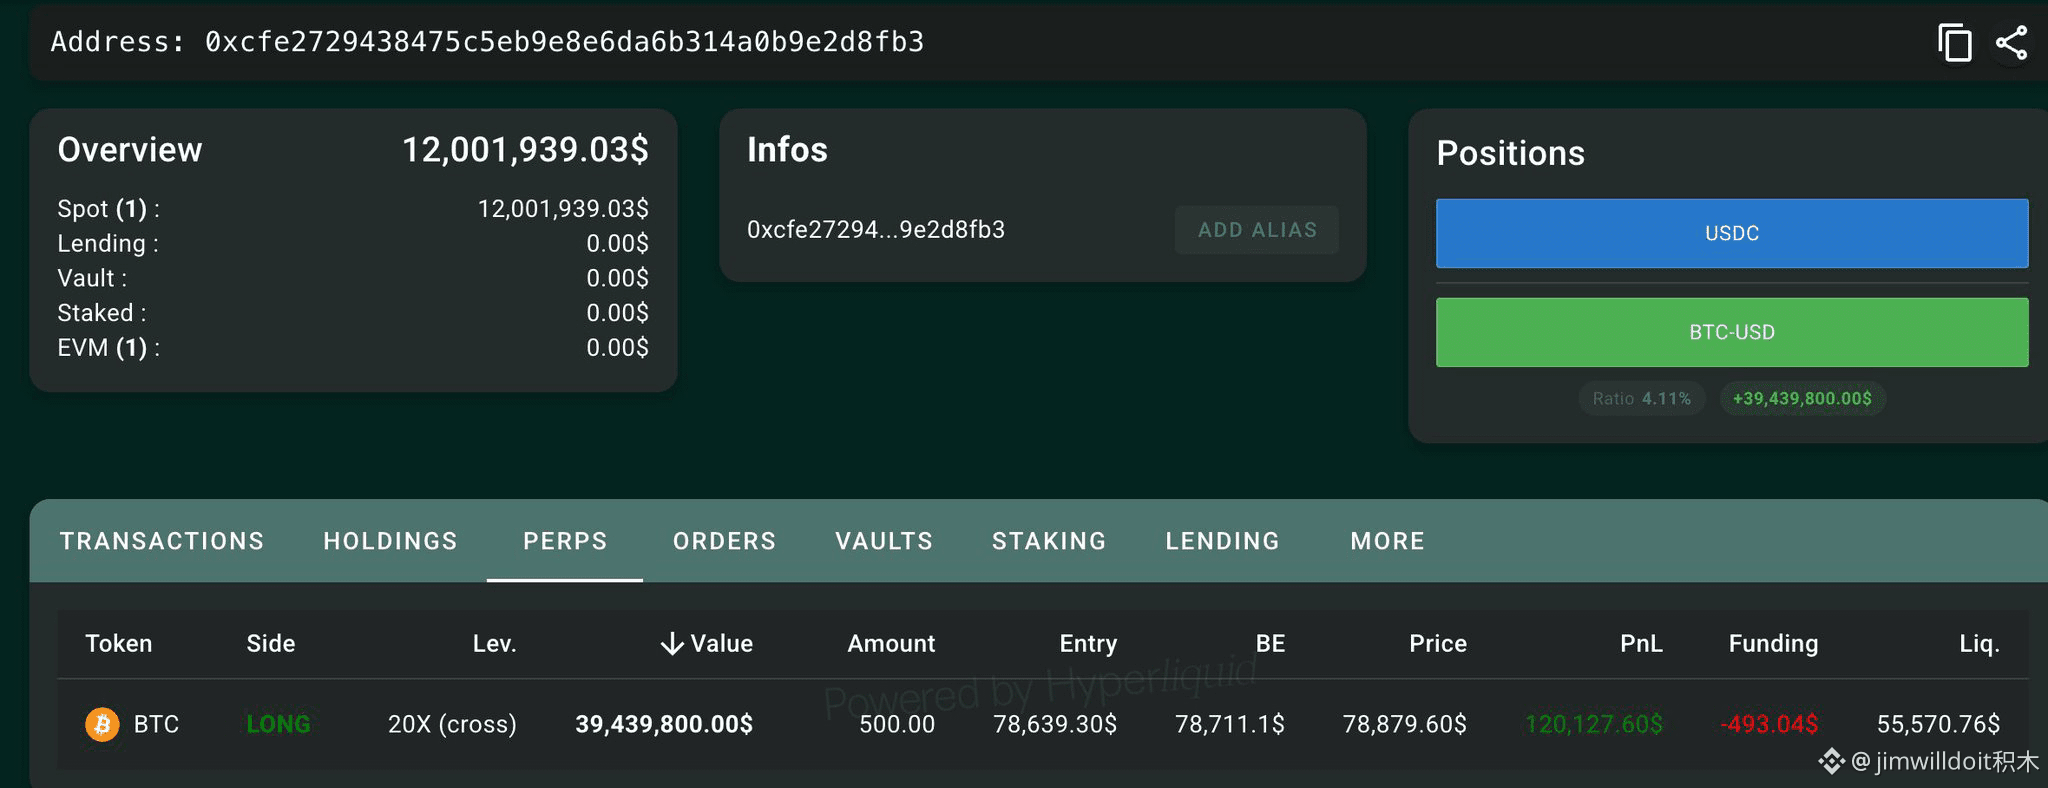
$BTC New wallet immediately went on a rampage with a $39.44 million long!
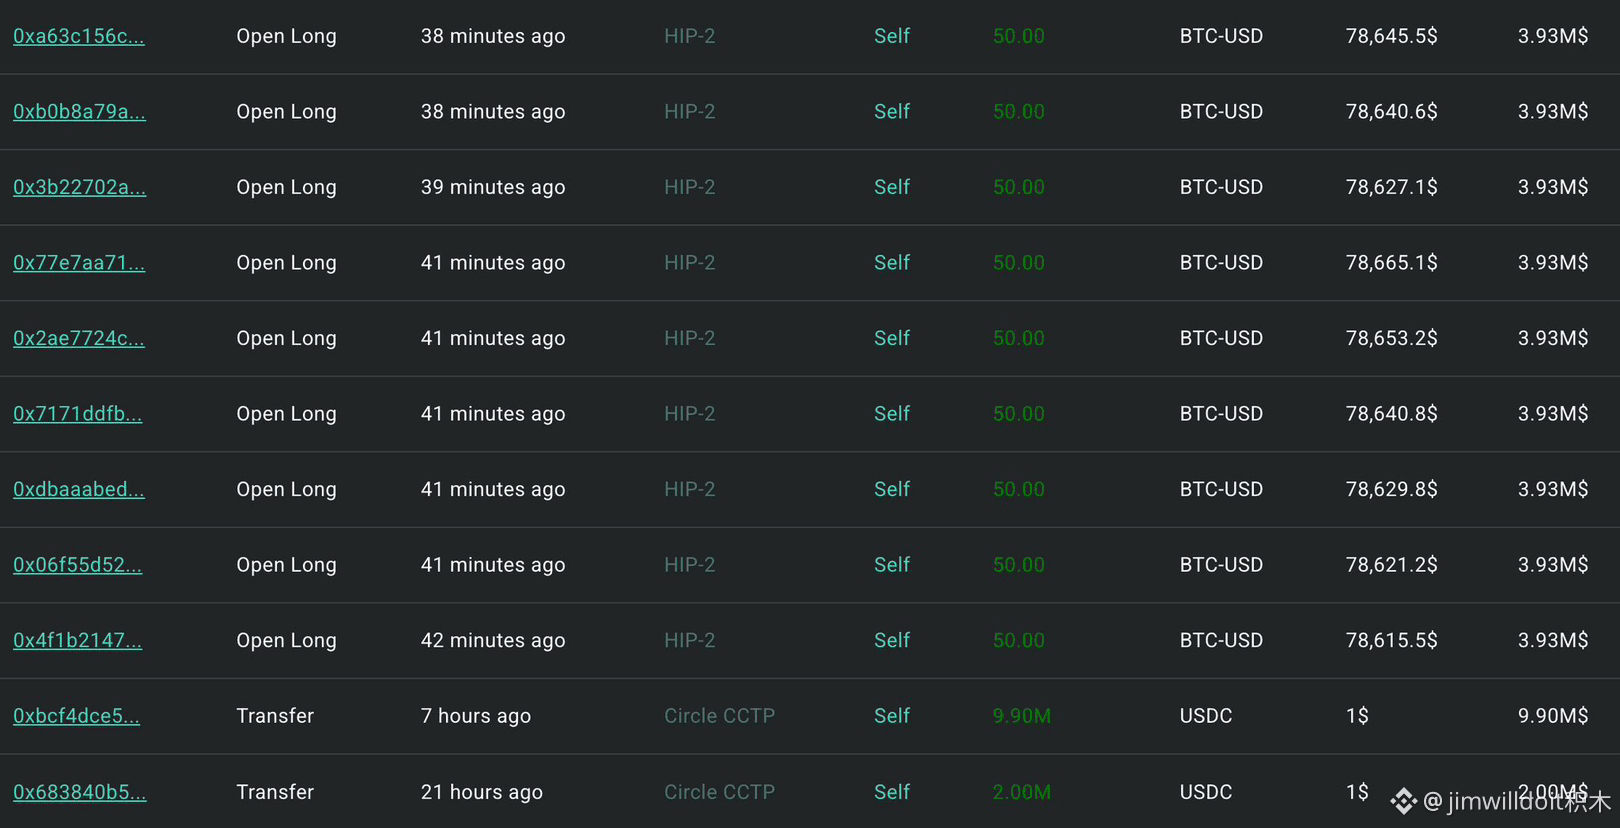
First, it deposited 11.9 million USDC into Hyperliquid.
Then it directly went 20x long on 500 BTC!
The liquidation price is pinned near $55,570.
This position is clearly betting on a major-level rebound!
A brand-new address 0xcfe2 was created not long ago, and it already deposited 11.9 million USDC into Hyperliquid and quickly opened a 20x long of 500 BTC, with a notional value of about $39.44 million. The liquidation price is $55,570.76, indicating that although it used high leverage, the position still has a relatively wide buffer before liquidation.
What’s even more worth watching is that the new wallet came in at this size right away—meaning the direction is extremely clear. But for now, you can’t determine the identity behind it based on on-chain actions alone. If it continues to add margin or expand the position later, this new whale is very likely to become a key focus in the short-term market.
A new wallet, 20x, $39.44 million—flipping the table from the opening move.
As long as BTC continues to hold the key support levels, this large long position still has room to keep surging!
Click the card below—go straight at it!👇
$ETH $ZEC
First, it deposited 11.9 million USDC into Hyperliquid.
Then it directly went 20x long on 500 BTC!
The liquidation price is pinned near $55,570.
This position is clearly betting on a major-level rebound!
A brand-new address 0xcfe2 was created not long ago, and it already deposited 11.9 million USDC into Hyperliquid and quickly opened a 20x long of 500 BTC, with a notional value of about $39.44 million. The liquidation price is $55,570.76, indicating that although it used high leverage, the position still has a relatively wide buffer before liquidation.
What’s even more worth watching is that the new wallet came in at this size right away—meaning the direction is extremely clear. But for now, you can’t determine the identity behind it based on on-chain actions alone. If it continues to add margin or expand the position later, this new whale is very likely to become a key focus in the short-term market.
A new wallet, 20x, $39.44 million—flipping the table from the opening move.
As long as BTC continues to hold the key support levels, this large long position still has room to keep surging!
Click the card below—go straight at it!👇
$ETH $ZEC
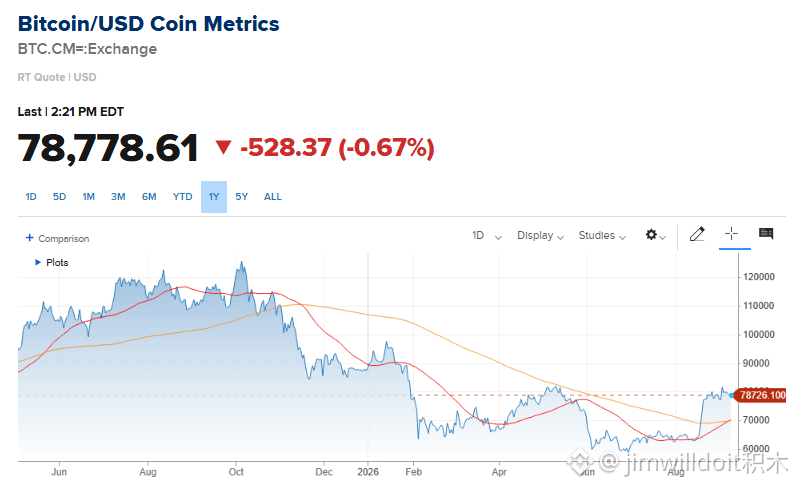
$BTC After 16 months, Bitcoin has once again delivered a Golden Cross!
This is the first time since May 2025.
The short-term moving average has crossed back above the long-term moving average!
The mid-term trend has started showing clear signs of repair.
This technical signal is finally back!
Bitcoin has just formed a Golden Cross: the short-term moving average has broken upward through the long-term moving average for the first time since May 2025. After the earlier drawdown from around the $120k area, BTC has recently begun to lift again from the lows, and the moving averages are starting to shift from a bearish alignment toward a repairing trend.
A Golden Cross by itself doesn’t necessarily mean the price will immediately take off, but it indicates that mid-term momentum has clearly improved. Next, we’ll see whether BTC can continue to hold around the 78K level, and then absorb the overhead resistance at 82K—83K; if price and volume cooperate together, this time the cross is more likely to turn the “signal” into a true trend confirmation.
The previous Golden Cross occurred 16 months ago.
If this time the price can also firmly take a stand above the key resistance, then BTC’s mid-term structure will truly start turning bullish!
Click the card below—go straight for it!👇
$ETH $ZEC
This is the first time since May 2025.
The short-term moving average has crossed back above the long-term moving average!
The mid-term trend has started showing clear signs of repair.
This technical signal is finally back!
Bitcoin has just formed a Golden Cross: the short-term moving average has broken upward through the long-term moving average for the first time since May 2025. After the earlier drawdown from around the $120k area, BTC has recently begun to lift again from the lows, and the moving averages are starting to shift from a bearish alignment toward a repairing trend.
A Golden Cross by itself doesn’t necessarily mean the price will immediately take off, but it indicates that mid-term momentum has clearly improved. Next, we’ll see whether BTC can continue to hold around the 78K level, and then absorb the overhead resistance at 82K—83K; if price and volume cooperate together, this time the cross is more likely to turn the “signal” into a true trend confirmation.
The previous Golden Cross occurred 16 months ago.
If this time the price can also firmly take a stand above the key resistance, then BTC’s mid-term structure will truly start turning bullish!
Click the card below—go straight for it!👇
$ETH $ZEC
$BTC U.S.-Iran conflict has now directly escalated to striking Jordan!
Iran fired ballistic missiles at U.S. military bases stationed in Jordan.
Jordan’s air defenses intercepted 18 out of 20 missiles!
Previously, the U.S. military had just taken down five Iranian oil tankers.
Now even Gulf oil tankers have been pulled into the retaliation target list!
The Iranian Revolutionary Guard announced missile retaliation against Jordan’s Al Azraq base, in response to the U.S. having previously destroyed five Iranian oil tankers. Jordan later confirmed it was hit by 20 ballistic missiles and said it successfully intercepted 18, with the rest falling into uninhabited areas. There are currently no reports of casualties.
Even more dangerous, Iran also warned crews on oil tankers docked near Kuwaiti and Bahraini ports to evacuate immediately, threatening that these ships could become targets. If the conflict continues spreading from military facilities to tankers and ports, the market will have to price in a fresh risk premium for shipping through the Strait of Hormuz, crude oil supply, and global inflation.
The fighting has already spread from warships to oil tankers—and then to regional U.S. military bases.
Next, as long as Gulf commercial shipping continues to shrink, oil prices, inflation, U.S. Treasury yields, and Crypto will all be pulled into this bout of volatility!
Click the card below—go straight for it!👇
$ETH $CL
Iran fired ballistic missiles at U.S. military bases stationed in Jordan.
Jordan’s air defenses intercepted 18 out of 20 missiles!
Previously, the U.S. military had just taken down five Iranian oil tankers.
Now even Gulf oil tankers have been pulled into the retaliation target list!
The Iranian Revolutionary Guard announced missile retaliation against Jordan’s Al Azraq base, in response to the U.S. having previously destroyed five Iranian oil tankers. Jordan later confirmed it was hit by 20 ballistic missiles and said it successfully intercepted 18, with the rest falling into uninhabited areas. There are currently no reports of casualties.
Even more dangerous, Iran also warned crews on oil tankers docked near Kuwaiti and Bahraini ports to evacuate immediately, threatening that these ships could become targets. If the conflict continues spreading from military facilities to tankers and ports, the market will have to price in a fresh risk premium for shipping through the Strait of Hormuz, crude oil supply, and global inflation.
The fighting has already spread from warships to oil tankers—and then to regional U.S. military bases.
Next, as long as Gulf commercial shipping continues to shrink, oil prices, inflation, U.S. Treasury yields, and Crypto will all be pulled into this bout of volatility!
Click the card below—go straight for it!👇
$ETH $CL


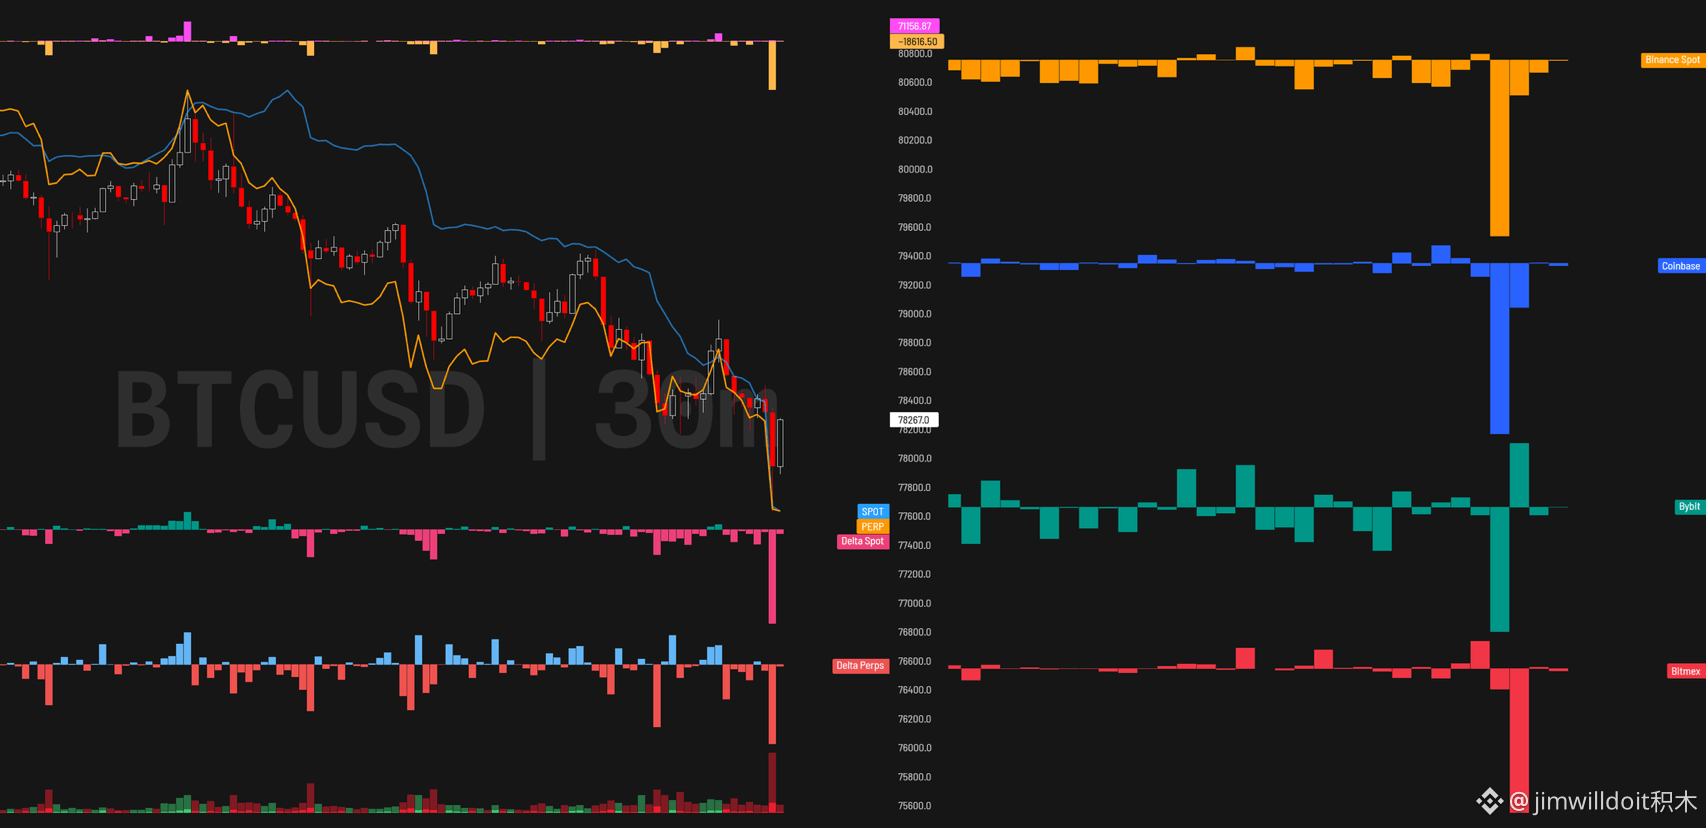
$BTC Many exchanges just simultaneously showed selling pressure!
The short-term rhythm was instantly disrupted by a brutal sell-off.
78K is back in view again!
This kind of synchronized liquidation sweep can easily trigger a chain of liquidity flows.
Now we just need to see whether the support below is hard enough!
Just now, multiple exchanges almost at the same time displayed clear sell orders. BTC weakened quickly, but synchronized selling alone isn’t enough to directly label it as “manipulation.” Based on the prior structure, around 78K there is both an FVG, and a certain amount of liquidation liquidity stacked up as well. This area still remains very likely to be the spot where price tests its next move.
If 78K gets swept and then quickly reclaimed—while spot buy orders step in again—it's more likely to be a liquidity cleaning event. If 78K breaks down and the rebound fails to reclaim it, then the downside space will continue to open up. The most important thing for the short term isn’t guessing the bottom anymore—it’s whether this downward push has real absorption.
78K is now the first checkpoint.
If the market can get driven down hard and still be bought back, then only the rebound is worth talking about again at 79.5K, or even higher!
Click the card below—go in directly!👇
$ETH $SOL
The short-term rhythm was instantly disrupted by a brutal sell-off.
78K is back in view again!
This kind of synchronized liquidation sweep can easily trigger a chain of liquidity flows.
Now we just need to see whether the support below is hard enough!
Just now, multiple exchanges almost at the same time displayed clear sell orders. BTC weakened quickly, but synchronized selling alone isn’t enough to directly label it as “manipulation.” Based on the prior structure, around 78K there is both an FVG, and a certain amount of liquidation liquidity stacked up as well. This area still remains very likely to be the spot where price tests its next move.
If 78K gets swept and then quickly reclaimed—while spot buy orders step in again—it's more likely to be a liquidity cleaning event. If 78K breaks down and the rebound fails to reclaim it, then the downside space will continue to open up. The most important thing for the short term isn’t guessing the bottom anymore—it’s whether this downward push has real absorption.
78K is now the first checkpoint.
If the market can get driven down hard and still be bought back, then only the rebound is worth talking about again at 79.5K, or even higher!
Click the card below—go in directly!👇
$ETH $SOL
$ETH BitMine is just one last step away from “absorbing 5% of the supply”!
So far, it has already secured about 4.9% across the entire network.
97% of the goal in 15 months!
This isn’t a small-scale allocation—it’s continuous accumulation.
ETH’s circulating supply is being tightened up by big players, piece by piece!
BitMine associated with Tom Lee currently holds about 4.9% of the total ETH supply, leaving only roughly 3% of progress to its 5% long-term target. In just 15 months, it pushed its position to this size—the consistency alone is enough to reshape the market’s perception of ETH’s supply side.
Even more interesting is that ETFs, corporate treasuries, and long-term holding funds are all absorbing ETH at the same time. As long as BitMine continues to top up this final chunk of its position, what the market will truly need to watch is how much circulating supply is left—and whether new buy demand will keep colliding head-on with limited supply.
It looks like only a 0.1% gap to 5%, but behind it lies massive spot demand.
Once this last bit is filled, the “enterprise-level hoarding” narrative for ETH will keep getting hotter!
Click the card below and get started!👇
$BTC $ZEC
So far, it has already secured about 4.9% across the entire network.
97% of the goal in 15 months!
This isn’t a small-scale allocation—it’s continuous accumulation.
ETH’s circulating supply is being tightened up by big players, piece by piece!
BitMine associated with Tom Lee currently holds about 4.9% of the total ETH supply, leaving only roughly 3% of progress to its 5% long-term target. In just 15 months, it pushed its position to this size—the consistency alone is enough to reshape the market’s perception of ETH’s supply side.
Even more interesting is that ETFs, corporate treasuries, and long-term holding funds are all absorbing ETH at the same time. As long as BitMine continues to top up this final chunk of its position, what the market will truly need to watch is how much circulating supply is left—and whether new buy demand will keep colliding head-on with limited supply.
It looks like only a 0.1% gap to 5%, but behind it lies massive spot demand.
Once this last bit is filled, the “enterprise-level hoarding” narrative for ETH will keep getting hotter!
Click the card below and get started!👇
$BTC $ZEC


Verified
$BTC Strategy didn’t buy a single BTC last week!
845,050 BTC holdings stayed put.
But the money went hard on repurchasing STRC!
The amount repurchased in a single week reached $176.3 million.
This time, Saylor is shifting his firepower to the balance sheet first!
Last week, Strategy made no purchases or sales of any BTC, keeping total holdings steady at 845,050 BTC. At the same time, the company spent about $176.3 million to repurchase STRC preferred shares, with the allocation clearly shifting temporarily from “continuing to stack sats” toward optimizing its capital structure.
This doesn’t mean Strategy’s Bitcoin route has changed. When STRC is below the target price, the buyback can reduce future preferred-share dividend burdens and strengthen the financing framework. The real thing worth watching is: once STRC and the cash reserves are adjusted, when will the company switch the funds back to BTC buying?
While Strategy didn’t buy BTC for a week, it hasn’t been idle—it’s been busy fine-tuning its funding machinery.
Once this machine flips back to a BTC-acquisition mode, the next BTC add could be much more compelling!
Click the card below and get started!👇
$ETH $ZEC
845,050 BTC holdings stayed put.
But the money went hard on repurchasing STRC!
The amount repurchased in a single week reached $176.3 million.
This time, Saylor is shifting his firepower to the balance sheet first!
Last week, Strategy made no purchases or sales of any BTC, keeping total holdings steady at 845,050 BTC. At the same time, the company spent about $176.3 million to repurchase STRC preferred shares, with the allocation clearly shifting temporarily from “continuing to stack sats” toward optimizing its capital structure.
This doesn’t mean Strategy’s Bitcoin route has changed. When STRC is below the target price, the buyback can reduce future preferred-share dividend burdens and strengthen the financing framework. The real thing worth watching is: once STRC and the cash reserves are adjusted, when will the company switch the funds back to BTC buying?
While Strategy didn’t buy BTC for a week, it hasn’t been idle—it’s been busy fine-tuning its funding machinery.
Once this machine flips back to a BTC-acquisition mode, the next BTC add could be much more compelling!
Click the card below and get started!👇
$ETH $ZEC


$BTC The US’s biggest crypto bill suddenly seems to be in trouble again!
Republican lawmakers have started issuing public warnings.
Ethics provisions are still stuck on the negotiation table!
A key vote next week is already approaching.
This time, the CLARITY Act may truly not be able to get through!
The latest warning from US Senate Republicans: the crypto market structure bill next week could fail to advance straight through due to disagreements over the ethics rules. The two sides have not yet resolved the restriction provisions related to the president and his family’s Crypto-related interests—provisions that are precisely an important condition for securing key votes from Democrats.
What’s more troublesome is that on September 15, the bill first has to clear the procedural threshold of 60 votes before it can continue to move forward to debate. The market’s already cut the chances of passage aggressively up front; if it can’t even get past this hurdle, the timeline for the US to clarify Crypto regulation will need to be pushed back again.
What’s missing now isn’t industry support—the missing piece is the last few votes in Congress.
If the ethics provisions can’t be agreed on again, this time the CLARITY Act could really fall right at the place closest to the finish line!
Click the card below to get started—right away!👇
$ETH $SOL
Republican lawmakers have started issuing public warnings.
Ethics provisions are still stuck on the negotiation table!
A key vote next week is already approaching.
This time, the CLARITY Act may truly not be able to get through!
The latest warning from US Senate Republicans: the crypto market structure bill next week could fail to advance straight through due to disagreements over the ethics rules. The two sides have not yet resolved the restriction provisions related to the president and his family’s Crypto-related interests—provisions that are precisely an important condition for securing key votes from Democrats.
What’s more troublesome is that on September 15, the bill first has to clear the procedural threshold of 60 votes before it can continue to move forward to debate. The market’s already cut the chances of passage aggressively up front; if it can’t even get past this hurdle, the timeline for the US to clarify Crypto regulation will need to be pushed back again.
What’s missing now isn’t industry support—the missing piece is the last few votes in Congress.
If the ethics provisions can’t be agreed on again, this time the CLARITY Act could really fall right at the place closest to the finish line!
Click the card below to get started—right away!👇
$ETH $SOL
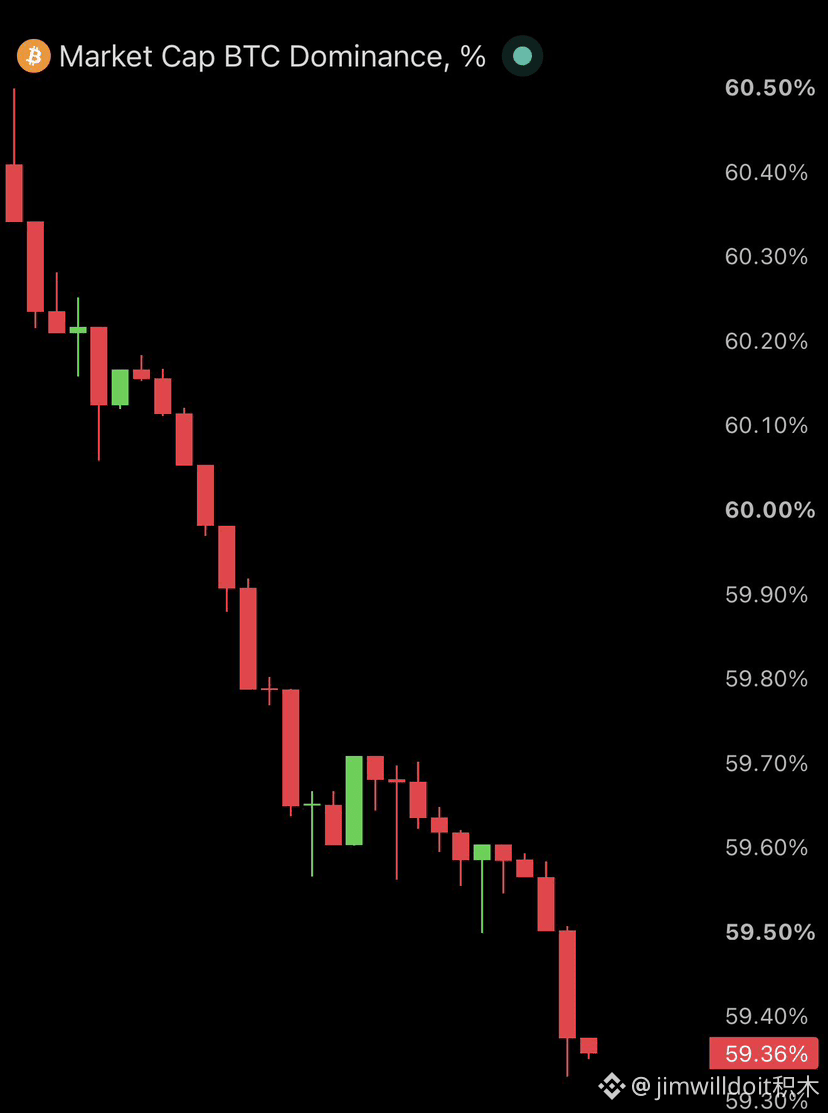
$BTC market share this round is being hammered to 59.36%!
The 60% integer threshold has already been breached.
Capital is clearly starting to spread into copycat coins.
High beta is rushing to reclaim market attention.
The altcoin rotation is finally starting to take shape this time!
BTC dominance has been squeezed all the way down from above 60.4% to 59.36%, and in the short term it’s showing a continuous weakening structure. BTC price hasn’t collapsed in sync, yet dominance keeps sliding—this usually means new capital is flowing more into ETH, SOL, and other altcoins.
Even more interesting: earlier, the OI share of the copycats also overtook BTC. Now market share keeps dropping further, and both spot and leveraged capital are beginning to rotate in the same direction. Next, watch whether 59% can hold. If it continues to break down, the relative strength of altcoins will very likely be amplified further.
BTC holds the line to stabilize the broader market, while altcoins start flexing their momentum.
If dominance gets smashed lower again, this altcoin rotation really could get the whole market lit up!
Click the card below and go straight in!👇
$ETH $牛来
The 60% integer threshold has already been breached.
Capital is clearly starting to spread into copycat coins.
High beta is rushing to reclaim market attention.
The altcoin rotation is finally starting to take shape this time!
BTC dominance has been squeezed all the way down from above 60.4% to 59.36%, and in the short term it’s showing a continuous weakening structure. BTC price hasn’t collapsed in sync, yet dominance keeps sliding—this usually means new capital is flowing more into ETH, SOL, and other altcoins.
Even more interesting: earlier, the OI share of the copycats also overtook BTC. Now market share keeps dropping further, and both spot and leveraged capital are beginning to rotate in the same direction. Next, watch whether 59% can hold. If it continues to break down, the relative strength of altcoins will very likely be amplified further.
BTC holds the line to stabilize the broader market, while altcoins start flexing their momentum.
If dominance gets smashed lower again, this altcoin rotation really could get the whole market lit up!
Click the card below and go straight in!👇
$ETH $牛来
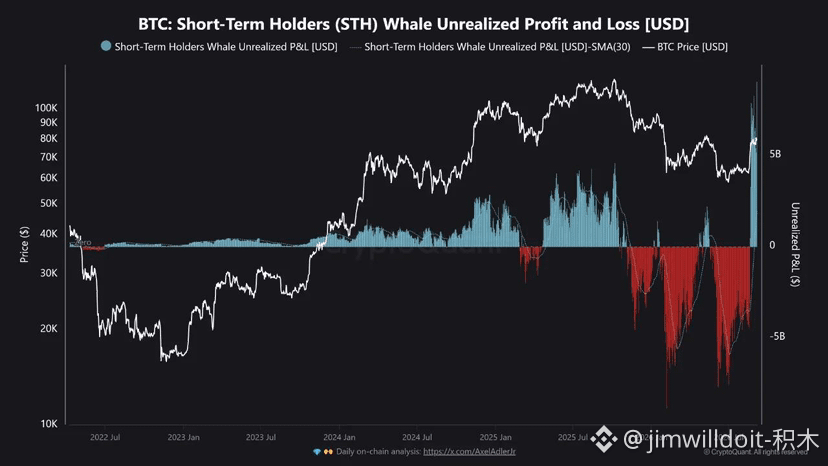
$BTC Short-term whale profits have already been pushed to a historical high!
The unrealized profit volume has surged to $9.07 billion.
The short-term profit-taking positions are starting to stack up too thick!
The higher the price goes, the easier it is for realization pressure to be amplified.
What you should focus on in this segment isn’t chasing a breakout anymore—it’s who will be the first to dump their chips!
Data shows that the current cumulative profit of Bitcoin’s short-term whales has risen to about $9.07 billion, setting a historical high. This indicates that this batch of large funds that entered recently has already accumulated a very considerable amount of unrealized gains. As soon as the price shows weakness, some of these positions could quickly shift from “profit” to real sell pressure.
This structure doesn’t necessarily mean BTC will top immediately, but high unrealized profits mean the market’s tolerance for adverse moves will clearly decline. Next, it all comes down to whether spot ETFs and new buying demand can continue to absorb these profitable positions. As long as the bids stay firm and strong, high profits don’t have to trigger an immediate sell-off. But once spot buying can’t keep up, volatility will rapidly expand.
$9.07 billion of unrealized profit, in itself, is a potential pool of sell pressure.
Can the bulls keep going at full force? First, let’s see whether the market has the ability to absorb these profits!
Click the card below and go all in!👇
$ETH $ZEC
The unrealized profit volume has surged to $9.07 billion.
The short-term profit-taking positions are starting to stack up too thick!
The higher the price goes, the easier it is for realization pressure to be amplified.
What you should focus on in this segment isn’t chasing a breakout anymore—it’s who will be the first to dump their chips!
Data shows that the current cumulative profit of Bitcoin’s short-term whales has risen to about $9.07 billion, setting a historical high. This indicates that this batch of large funds that entered recently has already accumulated a very considerable amount of unrealized gains. As soon as the price shows weakness, some of these positions could quickly shift from “profit” to real sell pressure.
This structure doesn’t necessarily mean BTC will top immediately, but high unrealized profits mean the market’s tolerance for adverse moves will clearly decline. Next, it all comes down to whether spot ETFs and new buying demand can continue to absorb these profitable positions. As long as the bids stay firm and strong, high profits don’t have to trigger an immediate sell-off. But once spot buying can’t keep up, volatility will rapidly expand.
$9.07 billion of unrealized profit, in itself, is a potential pool of sell pressure.
Can the bulls keep going at full force? First, let’s see whether the market has the ability to absorb these profits!
Click the card below and go all in!👇
$ETH $ZEC
Log in to explore more content