

Trend Finder
1.3k Posts

Trend Finder
Report
Block User
Self Dependent Trader - Growth and Alpha Tracker - Navigating Crypto Chaos - Sharing strategies and daily insights
Occasional Trader
6.6 Months
15 Following
65 Followers
1.1K+ Liked
Posts
·
--
Deconstructing XRP Escrow Dynamics: Why the 1 Billion Token Monthly Unlock Isn't What I...Deconstructing XRP Escrow Dynamics: Why the 1 Billion Token Monthly Unlock Isn't What It Seems
If you are watching $XRP hover around the 1.331 reference level, looking only at the 100 billion maximum supply cap misses the real mechanic driving market float. Every single month, 1 billion tokens unlock programmatically from Ripple escrows. On paper, that sounds like massive supply inflation capable of overwhelming order books. But the actual on-chain ledger tells a completely different story.
Over recent quarters, historical data shows that anywhere from 600 million to 800 million of those freshly unlocked tokens are regularly re-locked into brand new escrow contracts expiring years down the line. That leaves a net effective circulating inflow of only 200 million to 400 million tokens entering the market monthly. Combine this with the native XRP Ledger protocol fee burn mechanism, which permanently destroys tiny fractions of tokens on every transaction, and the net inflation rate drops significantly below surface-level estimates.
At the same time, whale custodial wallets and institutional liquidity pools have absorbed substantial portions of the net circulating float. Institutional escrow management acts as a controlled faucet rather than an open floodgate, preserving secondary market liquidity equilibrium. When high transaction volume pushes transaction burn rates higher, it creates an active counter-balance to the net unlocked tokens.
Understanding this balance between re-escrowed sinks, transaction burn velocity, and institutional custodial lockups is far more critical than reacting to headline unlock figures.
Are you keeping a close eye on the monthly escrow return percentage, or are you tracking overall circulating float changes?
#TokenUnlocks #Tokenomics
Deconstructing XRP Escrow Dynamics: Why the 1 Billion Token Monthly Unlock Isn't What I...
Deconstructing XRP Escrow Dynamics: Why the 1 Billion Token Monthly Unlock Isn't What It Seems
If you are watching $XRP hover around the 1.331 reference level, looking only at the 100 billion maximum supply cap misses the real mechanic driving market float. Every single month, 1 billion tokens unlock programmatically from Ripple escrows. On paper, that sounds like massive supply inflation capable of overwhelming order books. But the actual on-chain ledger tells a completely different story.
Over recent quarters, historical data shows that anywhere from 600 million to 800 million of those freshly unlocked tokens are regularly re-locked into brand new escrow contracts expiring years down the line. That leaves a net effective circulating inflow of only 200 million to 400 million tokens entering the market monthly. Combine this with the native XRP Ledger protocol fee burn mechanism, which permanently destroys tiny fractions of tokens on every transaction, and the net inflation rate drops significantly below surface-level estimates.
At the same time, whale custodial wallets and institutional liquidity pools have absorbed substantial portions of the net circulating float. Institutional escrow management acts as a controlled faucet rather than an open floodgate, preserving secondary market liquidity equilibrium. When high transaction volume pushes transaction burn rates higher, it creates an active counter-balance to the net unlocked tokens.
Understanding this balance between re-escrowed sinks, transaction burn velocity, and institutional custodial lockups is far more critical than reacting to headline unlock figures.
Are you keeping a close eye on the monthly escrow return percentage, or are you tracking overall circulating float changes?
#TokenUnlocks #Tokenomics

15
·
--
Institutional Ethereum Plumbing: What Desk Flows and Staking Dynamics Tell Us Above 2340Institutional Ethereum Plumbing: What Desk Flows and Staking Dynamics Tell Us Above 2340
The 06:12 AM screen glare hits differently when you look past the immediate price action into where institutional capital is actually positioning. While retail attention remains fragmented across local market volatility, liquidity metrics underneath $ETH tell a story of deliberate supply absorption.
Spot ETH is currently hovering around 2349.32, sitting right in a zone where institutional desks have quietly absorbed sell-side pressure over consecutive sessions. Unlike the frantic speculative surges of past cycles, current inflows into spot products backed by BlackRock and Fidelity show a structured transition from short-term trading toward balance-sheet reserves.
The real structural squeeze is brewing in the float dynamics. A substantial chunk of circulating supply remains locked inside institutional staking vaults and long-term yield protocols. This structural locking of token float creates a persistent supply sink, meaning even modest spot demand produces an outsized impact on available order book depth whenever macro sentiment stabilizes.
At the same time, regulatory tailwinds are intensifying. Europe's MiCA framework is forcing desks to standardize custody infrastructure, while Asian financial hubs are pushing forward with regulatory templates that mirror Western institutional standards. Aggregate AUM across major spot desks is steadily expanding, signaling that sovereign wealth desks and traditional asset managers are shifting from exploratory pilots to core allocation models.
The order books are being systematically scrubbed by players positioning for structural clarity rather than intraday noise. Are you noticing this quiet float constriction in your on-chain data, or do you think macro headwinds will keep institutional desks cautious a bit longer?
#BitcoinETF #CryptoNews
Institutional Ethereum Plumbing: What Desk Flows and Staking Dynamics Tell Us Above 2340
Institutional Ethereum Plumbing: What Desk Flows and Staking Dynamics Tell Us Above 2340
The 06:12 AM screen glare hits differently when you look past the immediate price action into where institutional capital is actually positioning. While retail attention remains fragmented across local market volatility, liquidity metrics underneath $ETH tell a story of deliberate supply absorption.
Spot ETH is currently hovering around 2349.32, sitting right in a zone where institutional desks have quietly absorbed sell-side pressure over consecutive sessions. Unlike the frantic speculative surges of past cycles, current inflows into spot products backed by BlackRock and Fidelity show a structured transition from short-term trading toward balance-sheet reserves.
The real structural squeeze is brewing in the float dynamics. A substantial chunk of circulating supply remains locked inside institutional staking vaults and long-term yield protocols. This structural locking of token float creates a persistent supply sink, meaning even modest spot demand produces an outsized impact on available order book depth whenever macro sentiment stabilizes.
At the same time, regulatory tailwinds are intensifying. Europe's MiCA framework is forcing desks to standardize custody infrastructure, while Asian financial hubs are pushing forward with regulatory templates that mirror Western institutional standards. Aggregate AUM across major spot desks is steadily expanding, signaling that sovereign wealth desks and traditional asset managers are shifting from exploratory pilots to core allocation models.
The order books are being systematically scrubbed by players positioning for structural clarity rather than intraday noise. Are you noticing this quiet float constriction in your on-chain data, or do you think macro headwinds will keep institutional desks cautious a bit longer?
#BitcoinETF #CryptoNews

47
·
--
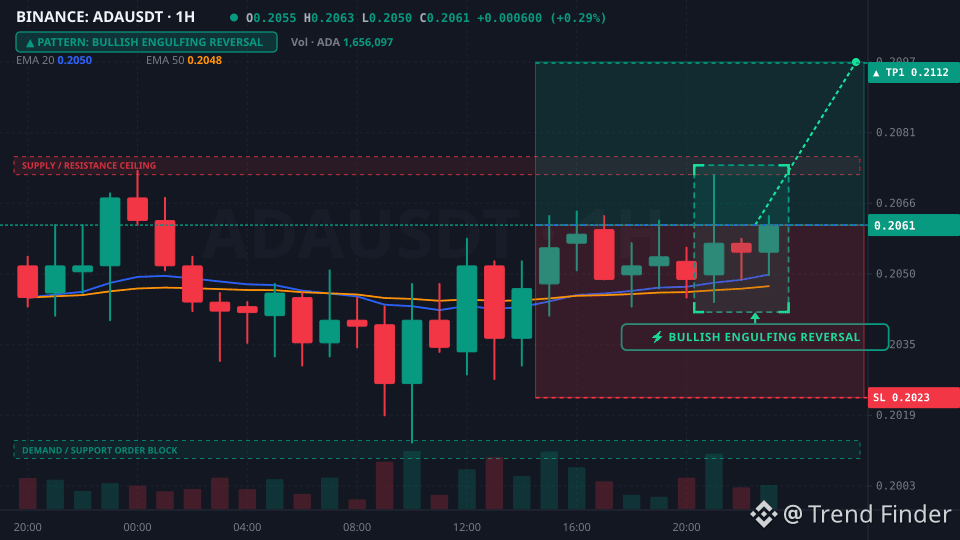
Overnight stops were cleanly swept on $ADA before a strong 1H bullish engulfing print confirmed institutional absorption. With $BTC consolidating, orderflow signals a swift push higher.
Entry: 0.2061
SL: 0.20229
TP1: 0.21124
TP2: 0.21467
#BinanceSquare #CryptoTrading #ADA
Overnight stops were cleanly swept on $ADA before a strong 1H bullish engulfing print confirmed institutional absorption. With $BTC consolidating, orderflow signals a swift push higher.
Entry: 0.2061
SL: 0.20229
TP1: 0.21124
TP2: 0.21467
#BinanceSquare #CryptoTrading #ADA
Entry: 0.2061
SL: 0.20229
TP1: 0.21124
TP2: 0.21467
#BinanceSquare #CryptoTrading #ADA
5
·
--
The NEAR Absorption Phase: Mapping the US Core PCE ImpactThe $NEAR Absorption Phase: Mapping the US Core PCE Impact
The pre-dawn hours always offer the most clarity before the US Bureau of Economic Analysis drops the hammer. Right now, all eyes are on the US Core PCE Price Index arriving at 12:30 UTC. With the market consensus fixed at 2.6 percent year-over-year, the real catalyst will likely be the Personal Spending print, currently expected to hit 0.4 percent month-over-year. For those of us watching NEAR, this is more than just a macro event; it is a test of the supply structure we have seen building over the last quarter.
At a spot reference near 4.702, the tokenomics tell a story of maturity that the typical volatility hunters are missing. We are no longer in the phase where early venture unlocks dictate the daily trend. Instead, on-chain data shows a significant migration of the circulating float from exchange order books into institutional cold storage. This absorption is effectively drying up the sell-side liquidity, creating a scenario where any positive macro surprise could lead to a rapid expansion because there simply is not enough liquid supply to blunt a sudden influx of demand.
The correlation between the DXY and risk assets is the primary anchor here. If the PCE data confirms the Federal Reserve’s cooling inflation narrative, the tight hold on the current NEAR supply will act as a floor rather than a liability. I am specifically watching the spread between the circulating supply and the 24-hour volume as we approach the 6:00 PM IST mark. The exhaustion of the sell-side is evident, and the way the price is holding steady despite the macro uncertainty suggests a very different buyer profile than what we saw six months ago. Are you expecting a volatility spike to shake out the weak hands, or is the institutional floor already too solid to break?
#NFP #MacroData
The NEAR Absorption Phase: Mapping the US Core PCE Impact
The $NEAR Absorption Phase: Mapping the US Core PCE Impact
The pre-dawn hours always offer the most clarity before the US Bureau of Economic Analysis drops the hammer. Right now, all eyes are on the US Core PCE Price Index arriving at 12:30 UTC. With the market consensus fixed at 2.6 percent year-over-year, the real catalyst will likely be the Personal Spending print, currently expected to hit 0.4 percent month-over-year. For those of us watching NEAR, this is more than just a macro event; it is a test of the supply structure we have seen building over the last quarter.
At a spot reference near 4.702, the tokenomics tell a story of maturity that the typical volatility hunters are missing. We are no longer in the phase where early venture unlocks dictate the daily trend. Instead, on-chain data shows a significant migration of the circulating float from exchange order books into institutional cold storage. This absorption is effectively drying up the sell-side liquidity, creating a scenario where any positive macro surprise could lead to a rapid expansion because there simply is not enough liquid supply to blunt a sudden influx of demand.
The correlation between the DXY and risk assets is the primary anchor here. If the PCE data confirms the Federal Reserve’s cooling inflation narrative, the tight hold on the current NEAR supply will act as a floor rather than a liability. I am specifically watching the spread between the circulating supply and the 24-hour volume as we approach the 6:00 PM IST mark. The exhaustion of the sell-side is evident, and the way the price is holding steady despite the macro uncertainty suggests a very different buyer profile than what we saw six months ago. Are you expecting a volatility spike to shake out the weak hands, or is the institutional floor already too solid to break?
#NFP #MacroData

5
·
--
Cardano On-Chain Valuation Disconnect: Whale Absorption Tightens Available FloatCardano On-Chain Valuation Disconnect: Whale Absorption Tightens Available Float
It is 03:31 AM and while the broader market stays distracted by quick-flip narratives, the raw chain data for $ADA is revealing a clear structural divergence. Looking past the range-bound spot reference near 0.2052, the 10k to 100k wallet cohort has been steadily net-adding to their balances over the past 72 hours. This steady absorption during a period of muted retail sentiment is a classic marker of deliberate smart money positioning.
The exchange reserve metrics tell an equally compelling story. Over the last 30 days, exchange-held balances have experienced a persistent downward drift as withdrawal velocity into cold storage accelerates. Mid-term sell-side pressure is being quietly absorbed without causing dramatic spikes in spot volatility. From a valuation standpoint, the MVRV Z-Score continues to sit well below the historical realized cap valuation, indicating that the token is priced far closer to fundamental re-accumulation than any speculative top.
Equally telling is the ratio between Long-Term Holders and Short-Term Holders. LTH addresses have shown zero appetite for panic selling into current liquidity gaps, maintaining their positions while short-term speculators exit. This creates a scenario where available spot float on exchanges is actively shrinking while realized valuation sits at deeply discounted levels. If exchange outflows maintain this pace, supply mechanics will likely dictate the next structural phase well before retail notices.
Are you seeing similar cold storage migration patterns in your on-chain tracking, or are you waiting for spot market momentum to catch up first?
#OnChainData #WhaleAlert
Cardano On-Chain Valuation Disconnect: Whale Absorption Tightens Available Float
Cardano On-Chain Valuation Disconnect: Whale Absorption Tightens Available Float
It is 03:31 AM and while the broader market stays distracted by quick-flip narratives, the raw chain data for $ADA is revealing a clear structural divergence. Looking past the range-bound spot reference near 0.2052, the 10k to 100k wallet cohort has been steadily net-adding to their balances over the past 72 hours. This steady absorption during a period of muted retail sentiment is a classic marker of deliberate smart money positioning.
The exchange reserve metrics tell an equally compelling story. Over the last 30 days, exchange-held balances have experienced a persistent downward drift as withdrawal velocity into cold storage accelerates. Mid-term sell-side pressure is being quietly absorbed without causing dramatic spikes in spot volatility. From a valuation standpoint, the MVRV Z-Score continues to sit well below the historical realized cap valuation, indicating that the token is priced far closer to fundamental re-accumulation than any speculative top.
Equally telling is the ratio between Long-Term Holders and Short-Term Holders. LTH addresses have shown zero appetite for panic selling into current liquidity gaps, maintaining their positions while short-term speculators exit. This creates a scenario where available spot float on exchanges is actively shrinking while realized valuation sits at deeply discounted levels. If exchange outflows maintain this pace, supply mechanics will likely dictate the next structural phase well before retail notices.
Are you seeing similar cold storage migration patterns in your on-chain tracking, or are you waiting for spot market momentum to catch up first?
#OnChainData #WhaleAlert

11
·
--
Tokenized Bullion is Silently Outperforming: The Macro Thesis Behind PAXGTokenized Bullion is Silently Outperforming: The Macro Thesis Behind PAXG
The quiet hours of the morning are when structural shifts become obvious while the rest of the market hunts high-beta volatility. Tracking the divergence in tokenized real-world assets shows a significant macro realignment underway. With the spot reference for $PAXG hovering near 4059.3, we are watching a major real-world stress test of London Good Delivery vault backing in real time.
Physical gold spot prices testing 4140 per ounce alongside silver holding near 60.27 per ounce has driven the Gold/Silver Ratio to 68.5. This consolidation indicates that large-scale institutional capital is opting for on-chain commodity liquidity over the traditional friction and storage costs of physical bullion. As the Dollar Index displays ongoing fluctuations, the appetite for hard-backed digital assets is accelerating.
The mechanics of PAXG offer a unique framework compared to standard crypto assets. Because every single token represents a specific allocated gold bar in a London vault, the circulating float is strictly inelastic and tied 1:1 to physical supply. This structural design eliminates the dilution risks inherent in inflationary governance models. Institutional whales are recognizing that holding tokenized gold on-chain provides immediate DeFi composability, settlement efficiency, and 24/7 liquidity that traditional vaults simply cannot match. If this strategic accumulation continues, the rotation into tokenized commodities could redefine how modern portfolios manage macro downside risks.
Are you allocating to tokenized commodities as a long-term hedge against macro uncertainty, or are you still sticking strictly to crypto-native assets?
#Gold #Silver
Tokenized Bullion is Silently Outperforming: The Macro Thesis Behind PAXG
Tokenized Bullion is Silently Outperforming: The Macro Thesis Behind PAXG
The quiet hours of the morning are when structural shifts become obvious while the rest of the market hunts high-beta volatility. Tracking the divergence in tokenized real-world assets shows a significant macro realignment underway. With the spot reference for $PAXG hovering near 4059.3, we are watching a major real-world stress test of London Good Delivery vault backing in real time.
Physical gold spot prices testing 4140 per ounce alongside silver holding near 60.27 per ounce has driven the Gold/Silver Ratio to 68.5. This consolidation indicates that large-scale institutional capital is opting for on-chain commodity liquidity over the traditional friction and storage costs of physical bullion. As the Dollar Index displays ongoing fluctuations, the appetite for hard-backed digital assets is accelerating.
The mechanics of PAXG offer a unique framework compared to standard crypto assets. Because every single token represents a specific allocated gold bar in a London vault, the circulating float is strictly inelastic and tied 1:1 to physical supply. This structural design eliminates the dilution risks inherent in inflationary governance models. Institutional whales are recognizing that holding tokenized gold on-chain provides immediate DeFi composability, settlement efficiency, and 24/7 liquidity that traditional vaults simply cannot match. If this strategic accumulation continues, the rotation into tokenized commodities could redefine how modern portfolios manage macro downside risks.
Are you allocating to tokenized commodities as a long-term hedge against macro uncertainty, or are you still sticking strictly to crypto-native assets?
#Gold #Silver

18
·
--
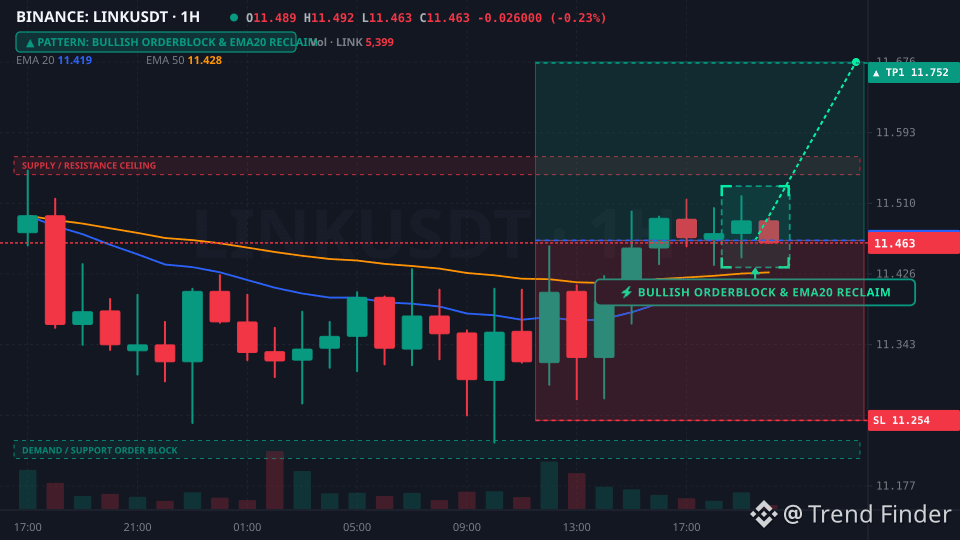
The silence of the early hours often exposes the cleanest footprints. Tracking a strategic shift in $LINK as the 1H Bullish Orderblock and EMA20 reclaim signal a clear trend flip. While $BTC remains stable, institutions are soaking up the lingering sell-side heat.
Entry: 11.466
SL: 11.254
TP1: 11.752
TP2: 11.943
#BinanceSquare #CryptoTrading #LINK
Entry: 11.466
SL: 11.254
TP1: 11.752
TP2: 11.943
#BinanceSquare #CryptoTrading #LINK
2
·
--
It is 1:03 AM and while the rest of the market is fixated on the latest narrative flips...It is 1:03 AM and while the rest of the market is fixated on the latest narrative flips, I am staring at the supply delta behind $SOL. At a spot reference near 101.05, the narrative around Solana has shifted from pure meme-coin casino back to fundamental infrastructure scaling. What caught my eye today is the specific calibration of the circulating float versus the total supply. We are seeing a mature distribution phase where the initial venture unlocks have largely been absorbed by the secondary market, shifting control from early private rounds to on-chain decentralized liquidity pools.
Looking at the tokenomics, the FDV-to-circulating supply ratio is currently tightening as ecosystem utility expands through Solana-native liquid staking and protocol-level fee burns. Unlike the flash-in-the-pan new listings hitting the Binance Launchpool, SOL has transitioned into a utility-heavy asset where staking yield acts as a primary buffer against inflationary pressure. On-chain data shows smart money is moving away from purely speculative tokens and consolidating into core L1 layers where transaction throughput and active address growth are hitting new local highs.
The whale flow is telling a specific story: large wallets are not dumping into current spot strength. Instead, they are positioning for upcoming mainnet roadmap catalysts that focus on Firedancer and continued validator decentralization. The lack of heavy vesting cliffs in the immediate horizon is a major signal for institutional stability. When you strip away the noise of the last few weeks, it is clear that the network is sustaining a higher base level of capital efficiency than it was this time last year. The liquidity provisioning on Binance for SOL is now deep enough to handle institutional-grade volume without the extreme volatility seen in previous cycles. Does the current staking yield strike you as attractive enough to hold through the next volatility expansion, or are you looking for more aggressive growth in smaller ecosystem plays?
#BinanceLaunchpool #NewCryptoLaunch
It is 1:03 AM and while the rest of the market is fixated on the latest narrative flips...
It is 1:03 AM and while the rest of the market is fixated on the latest narrative flips, I am staring at the supply delta behind $SOL . At a spot reference near 101.05, the narrative around Solana has shifted from pure meme-coin casino back to fundamental infrastructure scaling. What caught my eye today is the specific calibration of the circulating float versus the total supply. We are seeing a mature distribution phase where the initial venture unlocks have largely been absorbed by the secondary market, shifting control from early private rounds to on-chain decentralized liquidity pools.
Looking at the tokenomics, the FDV-to-circulating supply ratio is currently tightening as ecosystem utility expands through Solana-native liquid staking and protocol-level fee burns. Unlike the flash-in-the-pan new listings hitting the Binance Launchpool, SOL has transitioned into a utility-heavy asset where staking yield acts as a primary buffer against inflationary pressure. On-chain data shows smart money is moving away from purely speculative tokens and consolidating into core L1 layers where transaction throughput and active address growth are hitting new local highs.
The whale flow is telling a specific story: large wallets are not dumping into current spot strength. Instead, they are positioning for upcoming mainnet roadmap catalysts that focus on Firedancer and continued validator decentralization. The lack of heavy vesting cliffs in the immediate horizon is a major signal for institutional stability. When you strip away the noise of the last few weeks, it is clear that the network is sustaining a higher base level of capital efficiency than it was this time last year. The liquidity provisioning on Binance for SOL is now deep enough to handle institutional-grade volume without the extreme volatility seen in previous cycles. Does the current staking yield strike you as attractive enough to hold through the next volatility expansion, or are you looking for more aggressive growth in smaller ecosystem plays?
#BinanceLaunchpool #NewCryptoLaunch

2
·
--
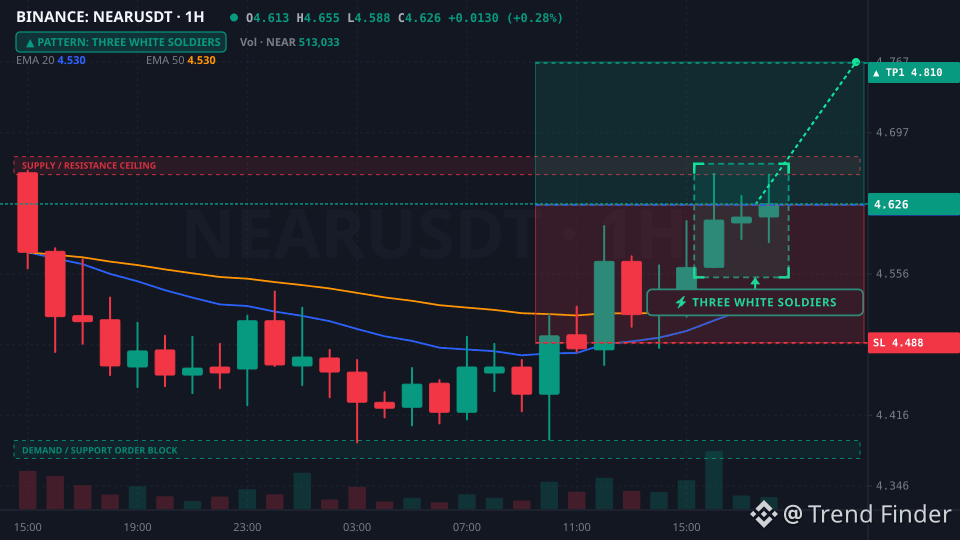
Heavy institutional bid walls are propping up $NEAR as a confirmed 1H Three White Soldiers breakout clears the EMA20. This 55-point move, paired with RSI 56 and $BTC stability, suggests a strong expansion phase. Spot absorption is evident as sell-side liquidity is exhausted.
Entry: 4.625 | SL: 4.488 | TP1: 4.81 | TP2: 4.933
#BinanceSquare #CryptoTrading #NEAR
Entry: 4.625 | SL: 4.488 | TP1: 4.81 | TP2: 4.933
#BinanceSquare #CryptoTrading #NEAR
2
·
--
Beyond Simple Rendering: How RENDER is Becoming the Backbone of the ZK-Scaling EraBeyond Simple Rendering: How $RENDER is Becoming the Backbone of the ZK-Scaling Era
While the broader market fixates on the 1.687 price level, a more profound architectural shift is occurring within the decentralized compute sector. We are witnessing the maturation of the Render Network from a simple marketplace for 3D artists into a critical infrastructure layer for the zero-knowledge (ZK) ecosystem. As ZK-rollups scale, the demand for massive, verifiable compute power is skyrocketing, and that is where the real value proposition for RENDER now lies.
Looking at the current circulating supply metrics, we see a significant reduction in sell-side pressure compared to previous cycles. The float has matured, and on-chain whale flows suggest that institutional players are quietly absorbing liquidity in anticipation of the burn-and-mint equilibrium shifts. Unlike traditional L2s that compete solely on transaction speed, the Render Network is positioning itself to solve the actual compute bottleneck required for ZK-proof generation. Ethereum L2 blob fees have optimized data storage, but they do not solve the raw hardware requirements for high-throughput proofs at scale.
The correlation between daily active addresses and compute demand shows that the network migration is more than just a technical update; it is a fundamental pivot toward modular data availability. By offloading heavy compute tasks from the primary settlement layers, the ecosystem gains a massive efficiency boost without sacrificing finality. The migration stats tell the story better than any hourly candle: the network is successfully transitioning into a heavy-duty engine room for the modular future. As RENDER integrates deeper into the ZK-compute layer, the utility shift becomes undeniable.
The real question for the coming months isn't about gas costs—it is about who provides the power to verify the next billion transactions. Will decentralized GPU networks eventually replace centralized cloud providers as the primary source for ZK-proof compute?
_
#Layer2 #BlockchainScaling
Beyond Simple Rendering: How RENDER is Becoming the Backbone of the ZK-Scaling Era
Beyond Simple Rendering: How $RENDER is Becoming the Backbone of the ZK-Scaling Era
While the broader market fixates on the 1.687 price level, a more profound architectural shift is occurring within the decentralized compute sector. We are witnessing the maturation of the Render Network from a simple marketplace for 3D artists into a critical infrastructure layer for the zero-knowledge (ZK) ecosystem. As ZK-rollups scale, the demand for massive, verifiable compute power is skyrocketing, and that is where the real value proposition for RENDER now lies.
Looking at the current circulating supply metrics, we see a significant reduction in sell-side pressure compared to previous cycles. The float has matured, and on-chain whale flows suggest that institutional players are quietly absorbing liquidity in anticipation of the burn-and-mint equilibrium shifts. Unlike traditional L2s that compete solely on transaction speed, the Render Network is positioning itself to solve the actual compute bottleneck required for ZK-proof generation. Ethereum L2 blob fees have optimized data storage, but they do not solve the raw hardware requirements for high-throughput proofs at scale.
The correlation between daily active addresses and compute demand shows that the network migration is more than just a technical update; it is a fundamental pivot toward modular data availability. By offloading heavy compute tasks from the primary settlement layers, the ecosystem gains a massive efficiency boost without sacrificing finality. The migration stats tell the story better than any hourly candle: the network is successfully transitioning into a heavy-duty engine room for the modular future. As RENDER integrates deeper into the ZK-compute layer, the utility shift becomes undeniable.
The real question for the coming months isn't about gas costs—it is about who provides the power to verify the next billion transactions. Will decentralized GPU networks eventually replace centralized cloud providers as the primary source for ZK-proof compute?
_
#Layer2 #BlockchainScaling
7
·
--
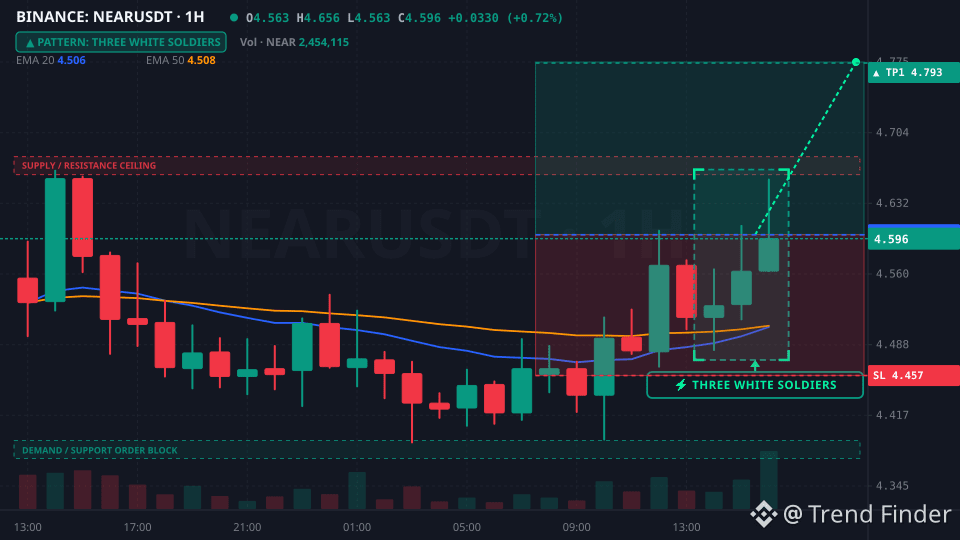
Smart money is aggressively clearing out the $NEAR sell-side depth as institutional flow triggers a 55-point 1H Three White Soldiers breakout above the EMA20. RSI 56 confirms strength as $BTC stabilizes.
Entry: 4.6
SL: 4.457
TP1: 4.793
TP2: 4.922
_
#BinanceSquare #CryptoTrading #NEAR
Smart money is aggressively clearing out the $NEAR sell-side depth as institutional flow triggers a 55-point 1H Three White Soldiers breakout above the EMA20. RSI 56 confirms strength as $BTC stabilizes.
Entry: 4.6
SL: 4.457
TP1: 4.793
TP2: 4.922
_
#BinanceSquare #CryptoTrading #NEAR
Entry: 4.6
SL: 4.457
TP1: 4.793
TP2: 4.922
_
#BinanceSquare #CryptoTrading #NEAR
1
7
·
--
DEX vs CEX Volume Shift & Liquid Restaking Expansion: Deep Dive Into On-Chain Capital E...DEX vs CEX Volume Shift & Liquid Restaking Expansion: Deep Dive Into On-Chain Capital Efficiency: My Honest Data Breakdown for $NEAR & BTC
While most of the timeline is reacting to every minor tick on NEAR near 4.597, I wanted to share the actual defi tvl, restaking, liquid staking & dex volume metrics I've been tracking on the desk today alongside BTC.
Here is the core context driving this sector right now:
Total Value Locked (TVL) Growth, DEX vs CEX Spot Volume Ratio, Liquid Staking/Restaking (LRT), Lending Utilization & Protocol Revenue. By comparing live orderflow and ecosystem retention against historical baselines, we get a much cleaner view of where institutional and smart-money capital is rotating.
Four key metrics I have on my screen today for NEAR:
• Chain & Protocol TVL Growth (7D / 30D %)
• DEX-to-CEX Volume Dominance & AMM Fee Generation
• Real Yield Protocol Revenue Distributed to Token Holders
• Liquid Staking & Restaking Capital Efficiency
The takeaway from the desk today is simple: follow where real liquidity and user retention are expanding around NEAR and BTC, and let the data confirm the trend.
What is the metric you are watching on NEAR right now? Drop a comment below 👇
#1 #BinanceSquare
DEX vs CEX Volume Shift & Liquid Restaking Expansion: Deep Dive Into On-Chain Capital E...
DEX vs CEX Volume Shift & Liquid Restaking Expansion: Deep Dive Into On-Chain Capital Efficiency: My Honest Data Breakdown for $NEAR & BTC
While most of the timeline is reacting to every minor tick on NEAR near 4.597, I wanted to share the actual defi tvl, restaking, liquid staking & dex volume metrics I've been tracking on the desk today alongside BTC.
Here is the core context driving this sector right now:
Total Value Locked (TVL) Growth, DEX vs CEX Spot Volume Ratio, Liquid Staking/Restaking (LRT), Lending Utilization & Protocol Revenue. By comparing live orderflow and ecosystem retention against historical baselines, we get a much cleaner view of where institutional and smart-money capital is rotating.
Four key metrics I have on my screen today for NEAR:
• Chain & Protocol TVL Growth (7D / 30D %)
• DEX-to-CEX Volume Dominance & AMM Fee Generation
• Real Yield Protocol Revenue Distributed to Token Holders
• Liquid Staking & Restaking Capital Efficiency
The takeaway from the desk today is simple: follow where real liquidity and user retention are expanding around NEAR and BTC, and let the data confirm the trend.
What is the metric you are watching on NEAR right now? Drop a comment below 👇
#1 #BinanceSquare

1
4
·
--
Gold & Silver Macro Intelligence: Central Bank Accumulation, DXY Inversion & Tokenized ...Gold & Silver Macro Intelligence: Central Bank Accumulation, DXY Inversion & Tokenized Bullion ($PAXG)
While crypto markets move fast, institutional capital continues to anchor itself in monetary metals. Today I sat down to review the macro data connecting physical bullion, the Dollar Index (DXY), and tokenized commodities like PAXG alongside BTC.
Here is where the key commodity metrics stand:
• Spot Bullion Reference: Spot Gold holding firm around 4,140/oz while Spot Silver trades near 60.27/oz.
• Tokenized Bullion on Binance: PAXG provides 1:1 London Good Delivery physical gold backing with instant 24/7 on-chain liquidity.
• Gold/Silver Ratio (GSR): Currently consolidating near 68.5, indicating sustained industrial demand for silver alongside monetary gold accumulation.
• Sovereign Reserves: Global central banks have maintained net monthly bullion purchases for consecutive quarters, treating hard assets as a balance-sheet anchor.
The correlation to watch closely is real interest rates and the US Dollar Index (DXY). Historically, sustained pullbacks in real yields unlock expansion cycles across both hard commodities and risk-on assets like BTC and BTC.
Do you keep physical gold/silver or PAXG as a macro hedge in your portfolio, or are you 100% crypto? Drop your thoughts below 👇
#BinanceSquare #Gold
Gold & Silver Macro Intelligence: Central Bank Accumulation, DXY Inversion & Tokenized ...
Gold & Silver Macro Intelligence: Central Bank Accumulation, DXY Inversion & Tokenized Bullion ($PAXG )
While crypto markets move fast, institutional capital continues to anchor itself in monetary metals. Today I sat down to review the macro data connecting physical bullion, the Dollar Index (DXY), and tokenized commodities like PAXG alongside BTC.
Here is where the key commodity metrics stand:
• Spot Bullion Reference: Spot Gold holding firm around 4,140/oz while Spot Silver trades near 60.27/oz.
• Tokenized Bullion on Binance: PAXG provides 1:1 London Good Delivery physical gold backing with instant 24/7 on-chain liquidity.
• Gold/Silver Ratio (GSR): Currently consolidating near 68.5, indicating sustained industrial demand for silver alongside monetary gold accumulation.
• Sovereign Reserves: Global central banks have maintained net monthly bullion purchases for consecutive quarters, treating hard assets as a balance-sheet anchor.
The correlation to watch closely is real interest rates and the US Dollar Index (DXY). Historically, sustained pullbacks in real yields unlock expansion cycles across both hard commodities and risk-on assets like BTC and BTC.
Do you keep physical gold/silver or PAXG as a macro hedge in your portfolio, or are you 100% crypto? Drop your thoughts below 👇
#BinanceSquare #Gold

1
10
·
--
Decoding the FET ASI Migration: Why Circulating Supply is the Only Metric That Matters ...Decoding the FET ASI Migration: Why Circulating Supply is the Only Metric That Matters Right Now
The transition into the Artificial Superintelligence Alliance has fundamentally rewritten the supply-side rules for $FET. While the market gets distracted by daily volatility, the real story is buried in the smart contract balance of the migration treasury. We are currently navigating a phase where approximately 2.6 billion tokens are in circulation, but that number is far more nuanced than a simple supply cap.
The aggressive vesting cliffs that used to haunt early investors have mostly been navigated, but the shift to the ASI token structure introduces fresh distribution milestones. What is particularly interesting right now is the institutional rotation. We are seeing large holders move away from speculative spot positions and into long-term infrastructure staking. With over 30 percent of the circulating supply currently locked in staking contracts, the immediate sell-side pressure from earlier venture rounds is being effectively neutralized by protocol utility.
Unlike chains that rely on a hard-coded burn, the FET model is tethered to network demand and developer grants. The net inflation rate is currently fighting against a rising staking ratio, which creates a fascinating tug-of-war for liquidity. We are approaching a structural decoupling where the emission rate is finally being outpaced by ecosystem adoption. This is exactly the kind of maturity you want to see before the next macro cycle kicks into gear.
The focus for any serious researcher should be on the migration treasury flow rather than the short-term noise. The legacy dilution concerns are fading, but the speed at which the remaining supply is absorbed by the ASI ecosystem will determine the next leg of this trend. Do you think the current staking lockup is enough to offset the remaining linear unlocks, or are you waiting for more aggressive burn mechanics to be implemented for FET?
#TokenUnlocks #Tokenomics
Decoding the FET ASI Migration: Why Circulating Supply is the Only Metric That Matters ...
Decoding the FET ASI Migration: Why Circulating Supply is the Only Metric That Matters Right Now
The transition into the Artificial Superintelligence Alliance has fundamentally rewritten the supply-side rules for $FET . While the market gets distracted by daily volatility, the real story is buried in the smart contract balance of the migration treasury. We are currently navigating a phase where approximately 2.6 billion tokens are in circulation, but that number is far more nuanced than a simple supply cap.
The aggressive vesting cliffs that used to haunt early investors have mostly been navigated, but the shift to the ASI token structure introduces fresh distribution milestones. What is particularly interesting right now is the institutional rotation. We are seeing large holders move away from speculative spot positions and into long-term infrastructure staking. With over 30 percent of the circulating supply currently locked in staking contracts, the immediate sell-side pressure from earlier venture rounds is being effectively neutralized by protocol utility.
Unlike chains that rely on a hard-coded burn, the FET model is tethered to network demand and developer grants. The net inflation rate is currently fighting against a rising staking ratio, which creates a fascinating tug-of-war for liquidity. We are approaching a structural decoupling where the emission rate is finally being outpaced by ecosystem adoption. This is exactly the kind of maturity you want to see before the next macro cycle kicks into gear.
The focus for any serious researcher should be on the migration treasury flow rather than the short-term noise. The legacy dilution concerns are fading, but the speed at which the remaining supply is absorbed by the ASI ecosystem will determine the next leg of this trend. Do you think the current staking lockup is enough to offset the remaining linear unlocks, or are you waiting for more aggressive burn mechanics to be implemented for FET?
#TokenUnlocks #Tokenomics

1
14
·
--
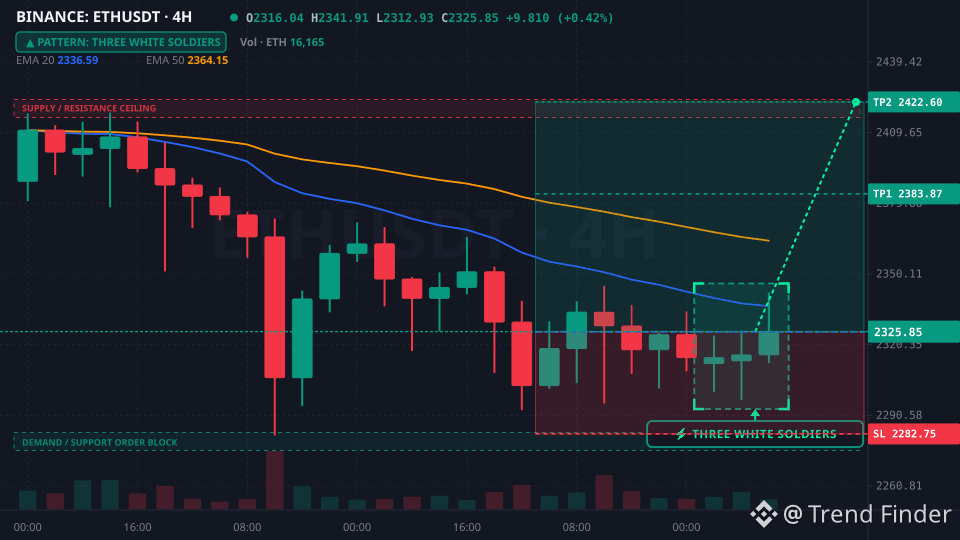
Aggressive spot absorption is lifting $ETH clean off the 2316 EMA20 floor while $BTC anchors market stability. The 4H Three White Soldiers breakout confirms institutional demand absorbing ask liquidity for a 55-point push with RSI at 56.
Entry: 2325.78 | SL: 2282.75 | TP1: 2383.87 | TP2: 2422.6
#BinanceSquare #CryptoTrading #ETH
Entry: 2325.78 | SL: 2282.75 | TP1: 2383.87 | TP2: 2422.6
#BinanceSquare #CryptoTrading #ETH
1
1
·
--
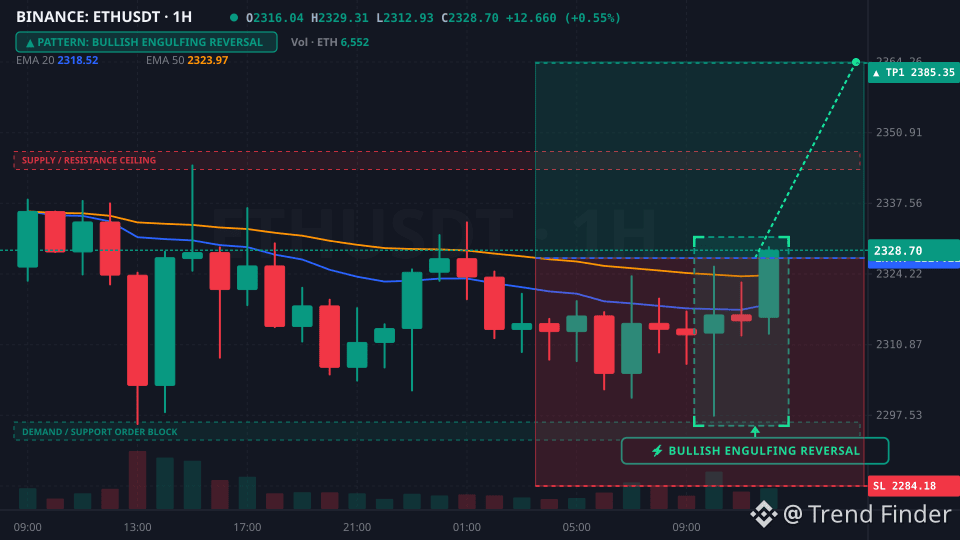
Aggressive bid-side pressure at the EMA20 just ignited a high-conviction 1H bullish engulfing for $ETH. With RSI at 56, smart money is front-running the next leg up as $BTC provides structural stability for this 55-point breakout.
Entry: 2327.23 | SL: 2284.18 | TP1: 2385.35 | TP2: 2424.09
_
#BinanceSquare #CryptoTrading #ETH
Aggressive bid-side pressure at the EMA20 just ignited a high-conviction 1H bullish engulfing for $ETH . With RSI at 56, smart money is front-running the next leg up as $BTC provides structural stability for this 55-point breakout.
Entry: 2327.23 | SL: 2284.18 | TP1: 2385.35 | TP2: 2424.09
_
#BinanceSquare #CryptoTrading #ETH
Entry: 2327.23 | SL: 2284.18 | TP1: 2385.35 | TP2: 2424.09
_
#BinanceSquare #CryptoTrading #ETH
1
2
·
--
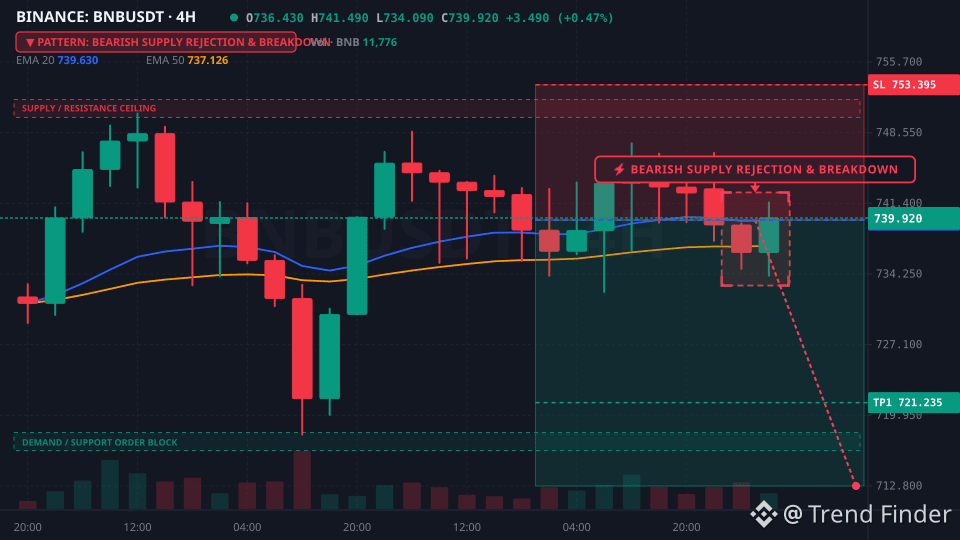
Liquidity exhaustion hits $BNB as attempts above 740 stall. Smart money is distributing into the sweep while $BTC dominance caps upside. The 4H structure confirms a sharp supply rejection playing out.
Entry: 739.71
SL: 753.395
TP1: 721.235
TP2: 708.919
#BinanceSquare #CryptoTrading #BNB
Liquidity exhaustion hits $BNB as attempts above 740 stall. Smart money is distributing into the sweep while $BTC dominance caps upside. The 4H structure confirms a sharp supply rejection playing out.
Entry: 739.71
SL: 753.395
TP1: 721.235
TP2: 708.919
#BinanceSquare #CryptoTrading #BNB
Entry: 739.71
SL: 753.395
TP1: 721.235
TP2: 708.919
#BinanceSquare #CryptoTrading #BNB
1
1
·
--
Solana Institutional Ledger Shift: Spot ETF Anticipation Meets Supply Absorption Around...Solana Institutional Ledger Shift: Spot ETF Anticipation Meets Supply Absorption Around 100.31
The silent rotation of institutional desks into the Solana ecosystem is reaching a critical inflection point that short-term momentum traders are completely overlooking. While the broader market stays glued to immediate volatility, on-chain metrics for $SOL show a massive migration of liquid supply into long-term validator staking, drastically tightening the active float while spot hovers near 100.31 USD.
Looking closely at ledger dynamics, large-scale entities are systematically soaking up unlock tranches off-exchange to prevent market slippage. Instead of taking liquidity exits into order books, institutional accounts are routing yield into decentralized settlement protocols and governance locks. This persistent supply absorption closely mirrors the structural accumulation phase we documented prior to the spot ETF approvals for BTC.
Regulatory tailwinds are accelerating this institutional desk migration. Standardized European frameworks under MiCA and updated custodial clarity across primary Asian financial hubs have cleared the compliance hurdles for major asset managers. As institutional treasuries seek high-throughput layer-one networks to complement their core allocation models, the push for a dedicated spot ETF is shifting from a speculative narrative into a calculated structural transition.
When off-exchange spot absorption accelerates while circulating float actively contracts, the order books become structurally illiquid on the ask side. The underlying metrics suggest long-term capital is building positions for the next macro expansion phase rather than playing short-term swings.
Are you seeing the same institutional accumulation patterns in on-chain validator data right now compared to earlier ETF approval cycles?
#BitcoinETF #CryptoNews
Solana Institutional Ledger Shift: Spot ETF Anticipation Meets Supply Absorption Around...
Solana Institutional Ledger Shift: Spot ETF Anticipation Meets Supply Absorption Around 100.31
The silent rotation of institutional desks into the Solana ecosystem is reaching a critical inflection point that short-term momentum traders are completely overlooking. While the broader market stays glued to immediate volatility, on-chain metrics for $SOL show a massive migration of liquid supply into long-term validator staking, drastically tightening the active float while spot hovers near 100.31 USD.
Looking closely at ledger dynamics, large-scale entities are systematically soaking up unlock tranches off-exchange to prevent market slippage. Instead of taking liquidity exits into order books, institutional accounts are routing yield into decentralized settlement protocols and governance locks. This persistent supply absorption closely mirrors the structural accumulation phase we documented prior to the spot ETF approvals for BTC.
Regulatory tailwinds are accelerating this institutional desk migration. Standardized European frameworks under MiCA and updated custodial clarity across primary Asian financial hubs have cleared the compliance hurdles for major asset managers. As institutional treasuries seek high-throughput layer-one networks to complement their core allocation models, the push for a dedicated spot ETF is shifting from a speculative narrative into a calculated structural transition.
When off-exchange spot absorption accelerates while circulating float actively contracts, the order books become structurally illiquid on the ask side. The underlying metrics suggest long-term capital is building positions for the next macro expansion phase rather than playing short-term swings.
Are you seeing the same institutional accumulation patterns in on-chain validator data right now compared to earlier ETF approval cycles?
#BitcoinETF #CryptoNews

1
1
·
--
SUI Structural Resilience Meets the Fed Preferred Inflation GaugeSUI Structural Resilience Meets the Fed Preferred Inflation Gauge
SUI is currently caught in a fascinating tug-of-war between its known emission schedule and a very specific type of institutional absorption. Right around the 0.9023 mark, we are seeing the market price in a delicate balance before the Bureau of Economic Analysis drops the PCE data at 12:30 UTC. While the headline consensus for Core PCE sits at 2.6 percent YoY, the real story for high-beta assets like $SUI is the personal spending forecast of 0.4 percent month over month.
The circulating supply for SUI has been a frequent topic of debate, especially as it approaches that 2.7 billion token milestone. Usually, these unlock phases create a predictable overhead resistance, but the on-chain data from the last 48 hours shows a shift. Large-scale wallets have been moving into a heavy accumulation phase, essentially front-running the potential for a risk-on shift if the inflation print comes in soft. Following the recent FOMC caution and the downward trend in CPI, a soft PCE reading would likely validate the narrative that the Fed has successfully threaded the needle, providing a massive green light for layer one liquidity.
The correlation with BTC is the highest it has been in weeks, indicating that SUI is no longer trading purely on its own ecosystem news but has become a macro proxy for decentralized infrastructure growth. If the spending data proves the consumer is still active without reigniting price growth, we will see a volatility expansion between 2.5 and 4 percent. I am closely watching the net flows out of centralized exchanges over the next few hours. If the current supply absorption holds through the PCE volatility, the structural bearishness from the early-year emissions might finally be behind us.
How are you adjusting your exposure before the 12:30 UTC data drop, or are you waiting for the initial reaction to clear first?
_
#NFP #MacroData
SUI Structural Resilience Meets the Fed Preferred Inflation Gauge
SUI Structural Resilience Meets the Fed Preferred Inflation Gauge
SUI is currently caught in a fascinating tug-of-war between its known emission schedule and a very specific type of institutional absorption. Right around the 0.9023 mark, we are seeing the market price in a delicate balance before the Bureau of Economic Analysis drops the PCE data at 12:30 UTC. While the headline consensus for Core PCE sits at 2.6 percent YoY, the real story for high-beta assets like $SUI is the personal spending forecast of 0.4 percent month over month.
The circulating supply for SUI has been a frequent topic of debate, especially as it approaches that 2.7 billion token milestone. Usually, these unlock phases create a predictable overhead resistance, but the on-chain data from the last 48 hours shows a shift. Large-scale wallets have been moving into a heavy accumulation phase, essentially front-running the potential for a risk-on shift if the inflation print comes in soft. Following the recent FOMC caution and the downward trend in CPI, a soft PCE reading would likely validate the narrative that the Fed has successfully threaded the needle, providing a massive green light for layer one liquidity.
The correlation with BTC is the highest it has been in weeks, indicating that SUI is no longer trading purely on its own ecosystem news but has become a macro proxy for decentralized infrastructure growth. If the spending data proves the consumer is still active without reigniting price growth, we will see a volatility expansion between 2.5 and 4 percent. I am closely watching the net flows out of centralized exchanges over the next few hours. If the current supply absorption holds through the PCE volatility, the structural bearishness from the early-year emissions might finally be behind us.
How are you adjusting your exposure before the 12:30 UTC data drop, or are you waiting for the initial reaction to clear first?
_
#NFP #MacroData

1
4
·
--
Quiet accumulation rarely makes the trending tabs on crypto Twitter, but my desk has be...Quiet accumulation rarely makes the trending tabs on crypto Twitter, but my desk has been tracking a compelling divergence in $LINK while spot hovers around 11.328. While retail sentiment remains distracted by short-term chop, the on-chain ledger tells an entirely different story of institutional positioning and structural supply absorption.
Digging into the smart money cohorts, wallets holding between 1,000 and 10,000 tokens have been steadily expanding their positions through every recent consolidation phase. This steady intake is mirrored by the 30-day centralized exchange netflows, which continue to register consistent outflows. Tokens are actively migrating away from exchange order books and moving directly into cold storage infrastructure, significantly reducing the immediate liquid float available for market makers to tap.
This behavior feeds directly into the broader shift between long-term holders and short-term speculators. The LTH versus STH supply ratio shows an expanding percentage of the circulating supply entering a dormant state, reflecting high conviction in the network's foundational role within decentralized oracle infrastructure and real-world asset tokenization. When exchange reserves dry up while intermediate wallets accumulate aggressively, the market quietly builds the preconditions for a classic supply shock once macro demand spikes.
Are you seeing similar structural accumulation patterns across other oracle and infrastructure assets right now, or is this behavior unique to LINK?
#OnChainData #WhaleAlert
Quiet accumulation rarely makes the trending tabs on crypto Twitter, but my desk has be...
Quiet accumulation rarely makes the trending tabs on crypto Twitter, but my desk has been tracking a compelling divergence in $LINK while spot hovers around 11.328. While retail sentiment remains distracted by short-term chop, the on-chain ledger tells an entirely different story of institutional positioning and structural supply absorption.
Digging into the smart money cohorts, wallets holding between 1,000 and 10,000 tokens have been steadily expanding their positions through every recent consolidation phase. This steady intake is mirrored by the 30-day centralized exchange netflows, which continue to register consistent outflows. Tokens are actively migrating away from exchange order books and moving directly into cold storage infrastructure, significantly reducing the immediate liquid float available for market makers to tap.
This behavior feeds directly into the broader shift between long-term holders and short-term speculators. The LTH versus STH supply ratio shows an expanding percentage of the circulating supply entering a dormant state, reflecting high conviction in the network's foundational role within decentralized oracle infrastructure and real-world asset tokenization. When exchange reserves dry up while intermediate wallets accumulate aggressively, the market quietly builds the preconditions for a classic supply shock once macro demand spikes.
Are you seeing similar structural accumulation patterns across other oracle and infrastructure assets right now, or is this behavior unique to LINK?
#OnChainData #WhaleAlert

1
1
Log in to explore more content
Join global crypto users on Binance Square
⚡️ Get latest and useful information about crypto.
💬 Trusted by the world’s largest crypto exchange.
👍 Discover real insights from verified creators.
Email / Phone number