
High Leverage Trader 9892
427 Posts

High Leverage Trader 9892
I am a pro trader sharing my technical analysis only this is not a financial advise
2 Following
38 Followers
692 Liked
Posts
All
Quotes
Videos
🚨 28% PUMP + $405M VOLUME — IS 牛来/USDT HEADING TO $0.15 OR SETTING A TRAP?
牛来/USDT has exploded nearly 28% in 24 hours, moving from $0.09028 to a high of $0.14208 with more than $405M in trading volume. But after this massive volatility, the next move could be even more important.
Price is now trading near $0.1238—directly between major support and resistance. This is where impatient traders usually get trapped.
The bullish scenario becomes stronger if price breaks and successfully retests $0.1333. That could open a move toward $0.1421, while a clean breakout above the visible high may target $0.1500 and $0.1600. Long stop-loss: below $0.1230.
The bearish scenario begins if price loses $0.1180 and retests it as resistance. In that case, sellers could push price toward $0.1105, $0.0991 and possibly $0.0903. Short stop-loss: above $0.1250.
The smartest move is not chasing the middle of this range. Wait for confirmation because the next breakout could be fast and aggressive.
🔥 Which level breaks first: $0.1421 or $0.1180? Drop your prediction below!
#Crypto #Binance #牛来USDT #Trading #FuturesTrading
牛来/USDT has exploded nearly 28% in 24 hours, moving from $0.09028 to a high of $0.14208 with more than $405M in trading volume. But after this massive volatility, the next move could be even more important.
Price is now trading near $0.1238—directly between major support and resistance. This is where impatient traders usually get trapped.
The bullish scenario becomes stronger if price breaks and successfully retests $0.1333. That could open a move toward $0.1421, while a clean breakout above the visible high may target $0.1500 and $0.1600. Long stop-loss: below $0.1230.
The bearish scenario begins if price loses $0.1180 and retests it as resistance. In that case, sellers could push price toward $0.1105, $0.0991 and possibly $0.0903. Short stop-loss: above $0.1250.
The smartest move is not chasing the middle of this range. Wait for confirmation because the next breakout could be fast and aggressive.
🔥 Which level breaks first: $0.1421 or $0.1180? Drop your prediction below!
#Crypto #Binance #牛来USDT #Trading #FuturesTrading

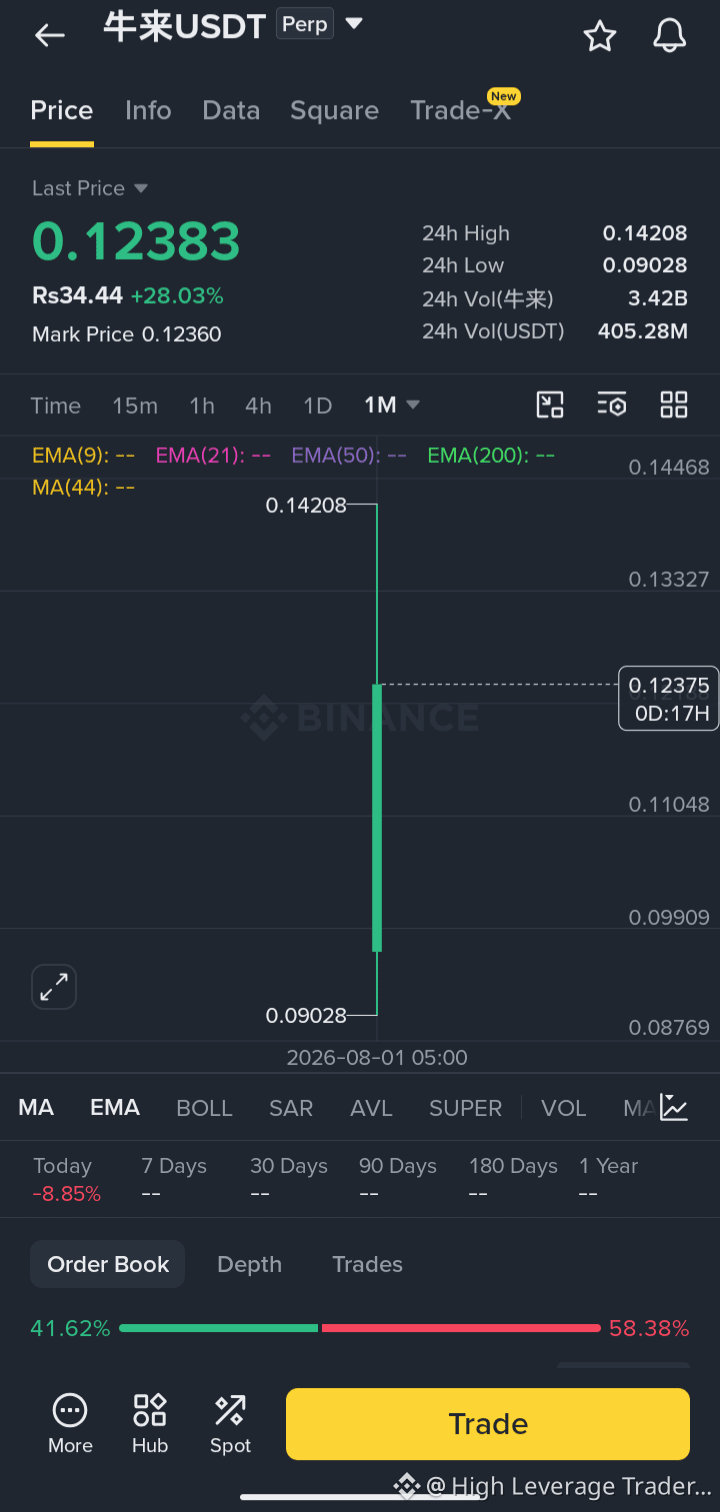
🚨 牛来/USDT – Monthly Range Breakout Setup
牛来/USDT is trading near $0.1238, up approximately 28% in 24 hours. The monthly chart currently contains only one candle, so there is not enough historical data to establish a reliable long-term trend or calculate moving-average signals. The visible trading range is between $0.09028 and $0.14208.
A confirmed breakout and successful retest above $0.1421 could activate a long setup targeting the psychological $0.1500 and $0.1600 levels. The long stop-loss should be placed below $0.1330 after breakout confirmation.
If price falls below $0.1105, bearish pressure could increase toward $0.0991 and $0.0903. A confirmed breakdown and retest below $0.0903 could activate a short setup targeting $0.0800, with stop-loss above $0.0991.
The current price is inside a wide range, so the monthly direction remains neutral until either $0.1421 or $0.0903 breaks. Due to extremely limited history and high volatility, low leverage and strict risk management are essential.
Visible Range High: $0.14208
Visible Range Low: $0.09028
#Crypto #Trading #Binance #牛来USDT #FuturesTrading
牛来/USDT is trading near $0.1238, up approximately 28% in 24 hours. The monthly chart currently contains only one candle, so there is not enough historical data to establish a reliable long-term trend or calculate moving-average signals. The visible trading range is between $0.09028 and $0.14208.
A confirmed breakout and successful retest above $0.1421 could activate a long setup targeting the psychological $0.1500 and $0.1600 levels. The long stop-loss should be placed below $0.1330 after breakout confirmation.
If price falls below $0.1105, bearish pressure could increase toward $0.0991 and $0.0903. A confirmed breakdown and retest below $0.0903 could activate a short setup targeting $0.0800, with stop-loss above $0.0991.
The current price is inside a wide range, so the monthly direction remains neutral until either $0.1421 or $0.0903 breaks. Due to extremely limited history and high volatility, low leverage and strict risk management are essential.
Visible Range High: $0.14208
Visible Range Low: $0.09028
#Crypto #Trading #Binance #牛来USDT #FuturesTrading
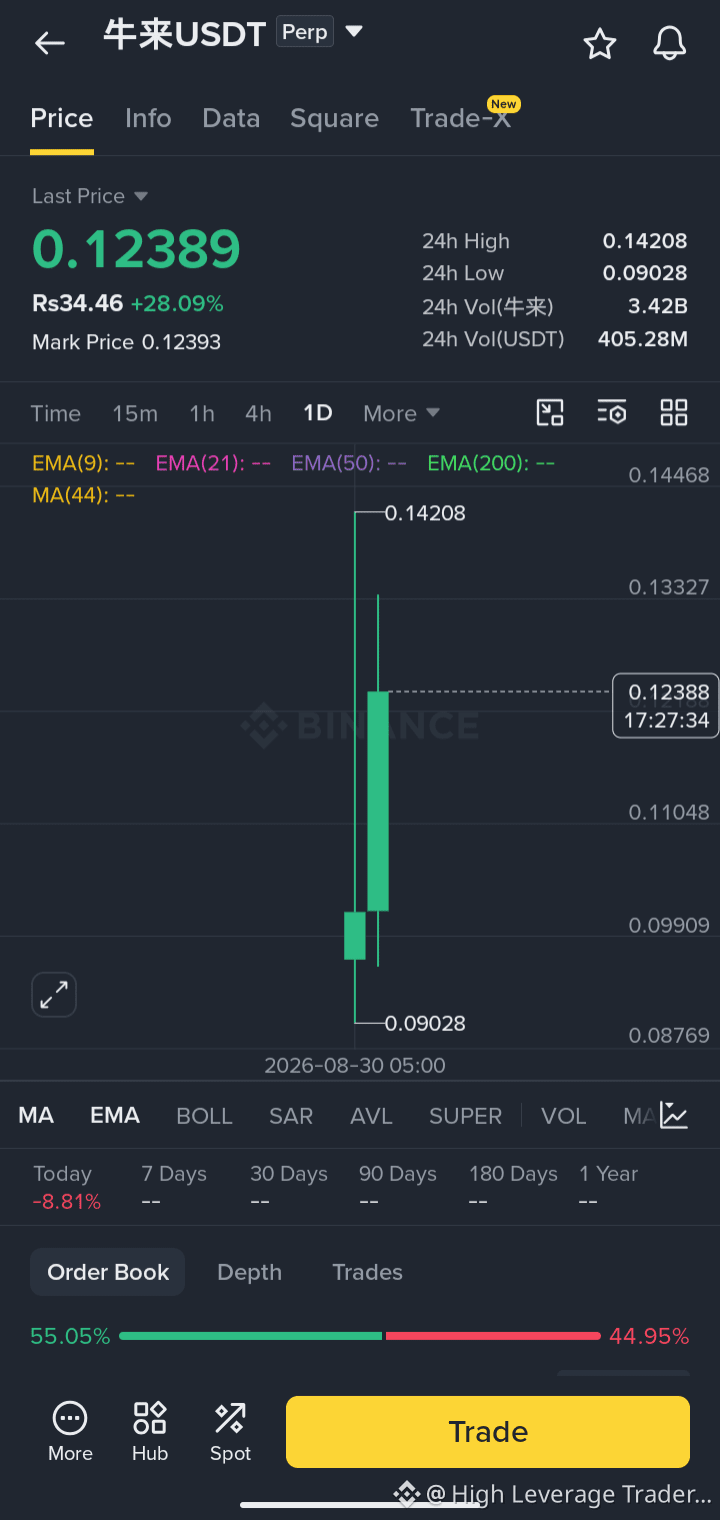
🚨 Bulls Coming/USDT – Daily Range Breakout Setup
Bulls Coming/USDT is trading near $0.1239, up more than 28% in 24 hours. The daily chart shows strong buying from $0.09028, but the rejection from $0.14208 has created a large upper wick, confirming heavy selling pressure near the high. The current daily candle still has several hours remaining, so its closing position will be critical.
A confirmed daily close above $0.1333 would strengthen the bullish structure and could push price toward $0.1421. A successful breakout and retest above $0.1421 could open price discovery toward the psychological $0.1500 and $0.1600 levels. The long stop-loss should be placed below $0.1230 after confirmation.
If price closes below $0.1105 and retests this level as resistance, a short setup could target $0.0991 and $0.0903. The short stop-loss should be placed above $0.1190.
The current price remains inside a wide high-volatility range. There is not enough daily history for reliable moving-average analysis, so waiting for a confirmed daily close is safer than entering during the unfinished candle.
24H High: $0.14208
24H Low: $0.09028
#Crypto #Trading #Binance #牛来USDT #FuturesTrading
Bulls Coming/USDT is trading near $0.1239, up more than 28% in 24 hours. The daily chart shows strong buying from $0.09028, but the rejection from $0.14208 has created a large upper wick, confirming heavy selling pressure near the high. The current daily candle still has several hours remaining, so its closing position will be critical.
A confirmed daily close above $0.1333 would strengthen the bullish structure and could push price toward $0.1421. A successful breakout and retest above $0.1421 could open price discovery toward the psychological $0.1500 and $0.1600 levels. The long stop-loss should be placed below $0.1230 after confirmation.
If price closes below $0.1105 and retests this level as resistance, a short setup could target $0.0991 and $0.0903. The short stop-loss should be placed above $0.1190.
The current price remains inside a wide high-volatility range. There is not enough daily history for reliable moving-average analysis, so waiting for a confirmed daily close is safer than entering during the unfinished candle.
24H High: $0.14208
24H Low: $0.09028
#Crypto #Trading #Binance #牛来USDT #FuturesTrading
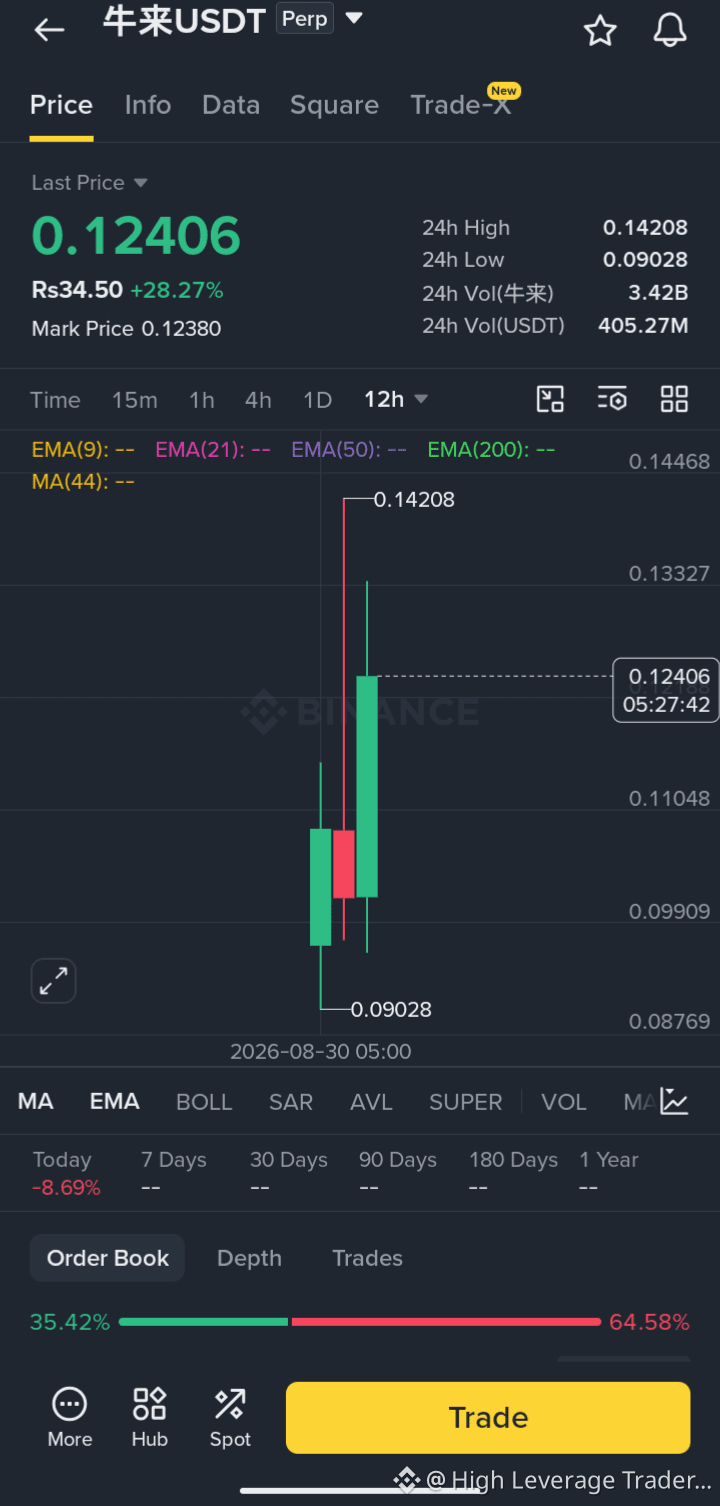
🚨 Bull Run/USDT – 12H Breakout Setup
Bull Run/USDT is trading near $0.1241, up more than 28% in 24 hours. The current 12-hour candle shows a strong recovery from the $0.096 area, but its upper wick near $0.1333 confirms that sellers remain active at higher levels. The candle is still open, so its final close will be important for confirming direction.
A confirmed 12-hour candle close above $0.1250 would support the bullish recovery, but the safer long entry requires a breakout and retest above $0.1333. Long targets are $0.1421 and the psychological $0.1500 level. The long stop-loss should be placed below $0.1230 after breakout confirmation.
If price is rejected and closes below $0.1105, the bullish recovery would weaken significantly. A confirmed breakdown and retest could activate a short setup targeting $0.0991 and $0.0903, with stop-loss above $0.1180.
The preferred direction is cautiously bullish, but entering before the 12-hour candle closes carries additional risk. Wait for confirmation because candle history is limited and volatility remains extremely high.
24H High: $0.14208
24H Low: $0.09028
#Crypto #Trading #Binance #牛来USDT #FuturesTrading
Bull Run/USDT is trading near $0.1241, up more than 28% in 24 hours. The current 12-hour candle shows a strong recovery from the $0.096 area, but its upper wick near $0.1333 confirms that sellers remain active at higher levels. The candle is still open, so its final close will be important for confirming direction.
A confirmed 12-hour candle close above $0.1250 would support the bullish recovery, but the safer long entry requires a breakout and retest above $0.1333. Long targets are $0.1421 and the psychological $0.1500 level. The long stop-loss should be placed below $0.1230 after breakout confirmation.
If price is rejected and closes below $0.1105, the bullish recovery would weaken significantly. A confirmed breakdown and retest could activate a short setup targeting $0.0991 and $0.0903, with stop-loss above $0.1180.
The preferred direction is cautiously bullish, but entering before the 12-hour candle closes carries additional risk. Wait for confirmation because candle history is limited and volatility remains extremely high.
24H High: $0.14208
24H Low: $0.09028
#Crypto #Trading #Binance #牛来USDT #FuturesTrading
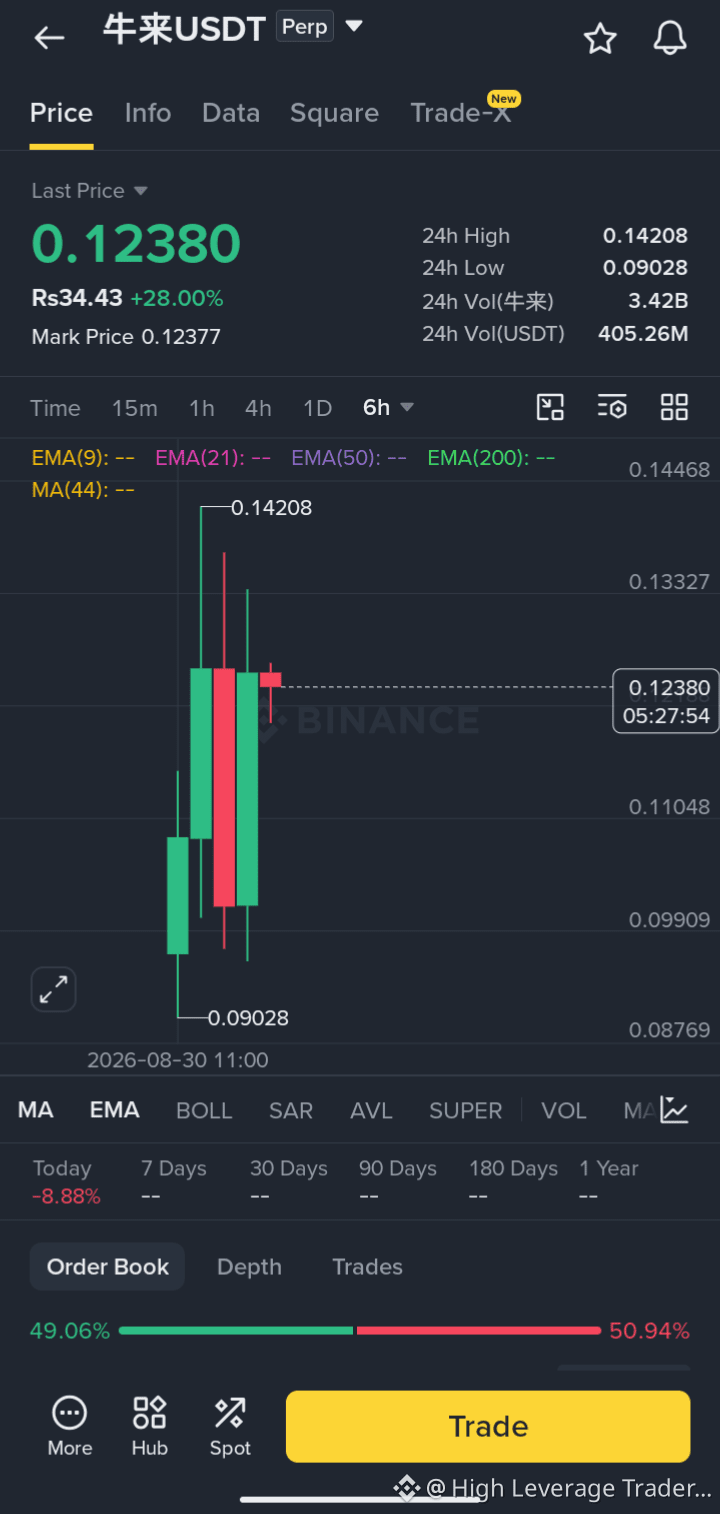
🚨 牛来/USDT – 6H High-Volatility Breakout Setup
牛来/USDT is trading near $0.1238, up 28% in 24 hours. The 6-hour chart shows a strong recovery from the $0.099 area after the initial rejection from $0.14208. However, the pair has very limited candle history, so price structure and confirmed candle closes are more reliable than indicators at this stage.
A confirmed 6-hour candle close above $0.1333 could activate a long setup targeting $0.1421. A successful breakout and retest above $0.1421 could open the way toward the psychological $0.1500 level. The long stop-loss should be placed below $0.1230.
If price closes below the $0.1180 support zone and retests it as resistance, a short setup could target $0.1105, $0.0991 and $0.0903. The short stop-loss should be placed above $0.1250.
The current price is between major support and resistance, making this a no-trade zone. Wait for confirmation above $0.1333 or below $0.1180 before entering. Low leverage and strict risk management are essential because volatility remains extremely high.
24H High: $0.14208
24H Low: $0.09028
#Crypto #Trading #Binance #牛来USDT #FuturesTrading
牛来/USDT is trading near $0.1238, up 28% in 24 hours. The 6-hour chart shows a strong recovery from the $0.099 area after the initial rejection from $0.14208. However, the pair has very limited candle history, so price structure and confirmed candle closes are more reliable than indicators at this stage.
A confirmed 6-hour candle close above $0.1333 could activate a long setup targeting $0.1421. A successful breakout and retest above $0.1421 could open the way toward the psychological $0.1500 level. The long stop-loss should be placed below $0.1230.
If price closes below the $0.1180 support zone and retests it as resistance, a short setup could target $0.1105, $0.0991 and $0.0903. The short stop-loss should be placed above $0.1250.
The current price is between major support and resistance, making this a no-trade zone. Wait for confirmation above $0.1333 or below $0.1180 before entering. Low leverage and strict risk management are essential because volatility remains extremely high.
24H High: $0.14208
24H Low: $0.09028
#Crypto #Trading #Binance #牛来USDT #FuturesTrading
🚨 Bull Run/USDT – 2H Breakout Setup
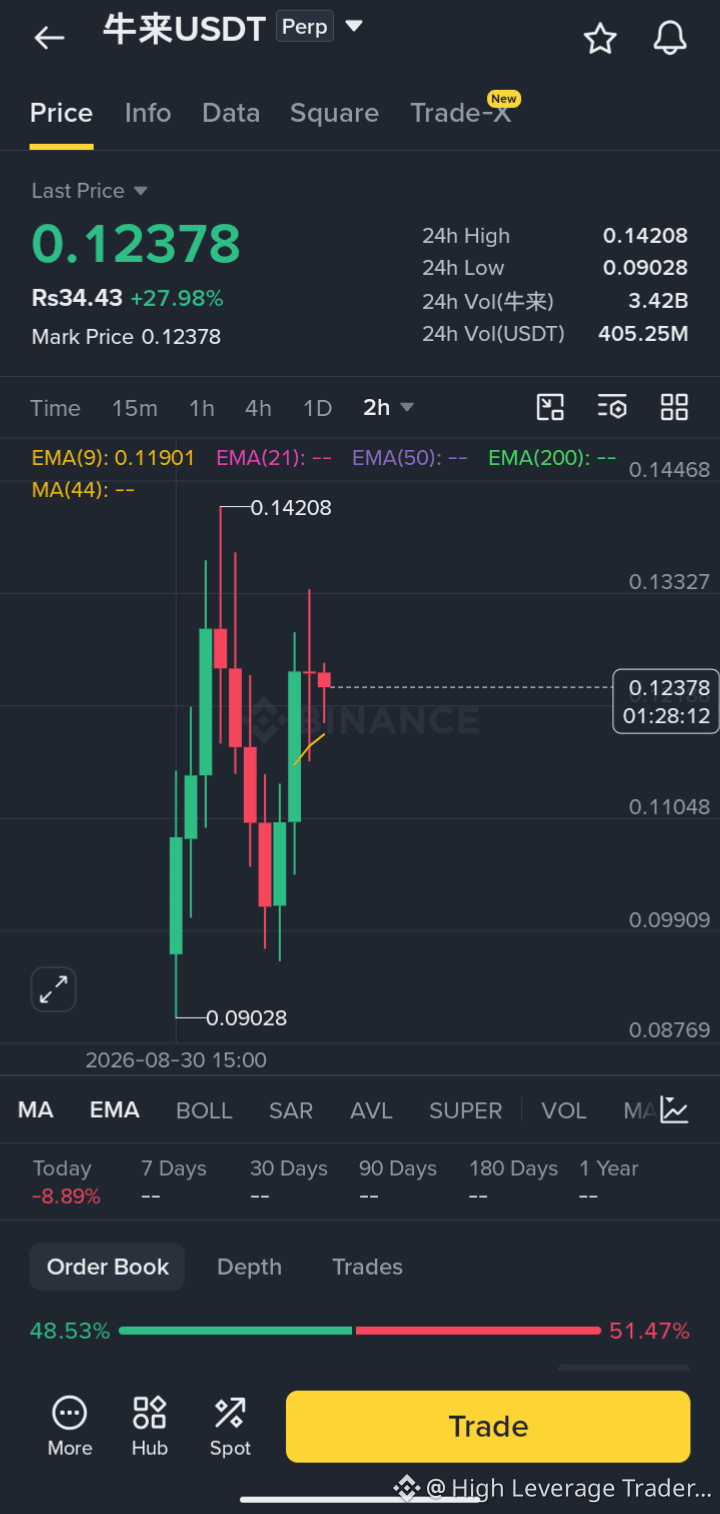
Bull Run/USDT is trading near $0.1238 after strongly recovering from the $0.097 area. Price remains above the 2-hour EMA9 at $0.11901, keeping the recovery structure bullish. However, rejection from the $0.1280–$0.1333 resistance zone shows that sellers are still active.
A confirmed 2-hour candle close above $0.1295 could activate a long setup targeting $0.1333 and $0.1421. A breakout above $0.1421 could pave the way for further price discovery. The long stop-loss should be placed below $0.1185.
If price closes below $0.1188 and retests this level as resistance, the bullish recovery would be invalidated. A short setup could then target $0.1105, $0.0991 and $0.0903, with a stop-loss above $0.1250.
The preferred direction remains bullish while price holds above $0.1190, but buyers must reclaim $0.1295 before a safer long entry. Due to limited candle history and high volatility, strict risk management is essential.
24H High: $0.14208
24H Low: $0.09028
#Crypto #Trading #Binance #牛来USDT #FuturesTrading
Bull Run/USDT is trading near $0.1238 after strongly recovering from the $0.097 area. Price remains above the 2-hour EMA9 at $0.11901, keeping the recovery structure bullish. However, rejection from the $0.1280–$0.1333 resistance zone shows that sellers are still active.
A confirmed 2-hour candle close above $0.1295 could activate a long setup targeting $0.1333 and $0.1421. A breakout above $0.1421 could pave the way for further price discovery. The long stop-loss should be placed below $0.1185.
If price closes below $0.1188 and retests this level as resistance, the bullish recovery would be invalidated. A short setup could then target $0.1105, $0.0991 and $0.0903, with a stop-loss above $0.1250.
The preferred direction remains bullish while price holds above $0.1190, but buyers must reclaim $0.1295 before a safer long entry. Due to limited candle history and high volatility, strict risk management is essential.
24H High: $0.14208
24H Low: $0.09028
#Crypto #Trading #Binance #牛来USDT #FuturesTrading
🚨牛来/USDT – 1H Bullish Recovery Setup
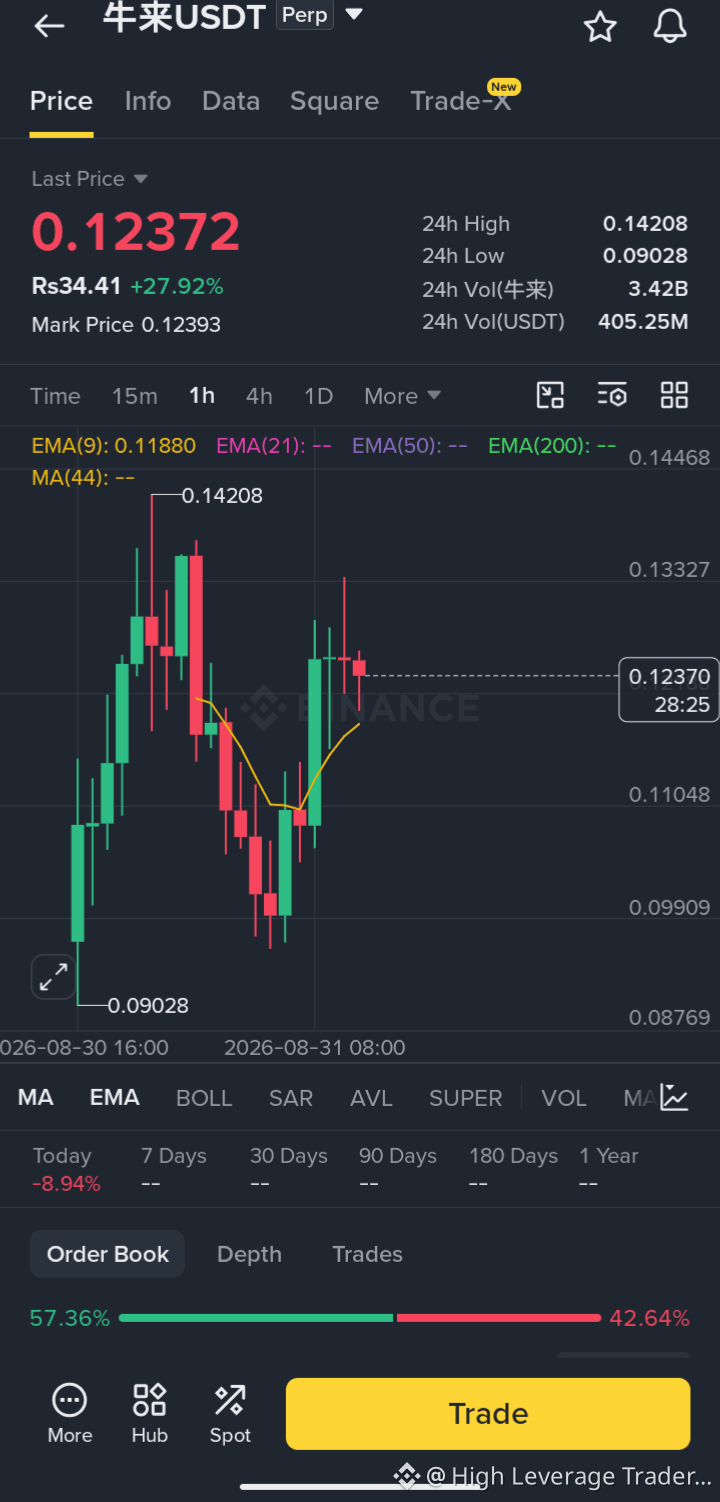
牛来/USDT is trading near $0.1237, up almost 28% in 24 hours. After falling from $0.14208 toward the $0.097 area, price produced a strong recovery and is now holding above the 1-hour EMA9 at $0.11880. This keeps the recovery structure bullish, although the latest candles show consolidation below resistance.
A confirmed 1-hour candle close above $0.1285 could activate a long setup targeting $0.1333 and $0.1421. If momentum remains strong above the 24-hour high, price could enter price-discovery territory. The long stop-loss should be placed below $0.1185.
If price closes below $0.1188 and retests this level as resistance, the recovery structure would weaken. A short setup could then target $0.1105, $0.0991 and $0.0903, with stop-loss above $0.1240.
The preferred direction remains bullish above $0.1188, but a clear breakout above $0.1285 is required for a safer long entry. This is a highly volatile new pair, so strict risk management is essential.
24H High: $0.14208
24H Low: $0.09028
#Crypto #Trading #Binance #牛来USDT #FuturesTrading
牛来/USDT is trading near $0.1237, up almost 28% in 24 hours. After falling from $0.14208 toward the $0.097 area, price produced a strong recovery and is now holding above the 1-hour EMA9 at $0.11880. This keeps the recovery structure bullish, although the latest candles show consolidation below resistance.
A confirmed 1-hour candle close above $0.1285 could activate a long setup targeting $0.1333 and $0.1421. If momentum remains strong above the 24-hour high, price could enter price-discovery territory. The long stop-loss should be placed below $0.1185.
If price closes below $0.1188 and retests this level as resistance, the recovery structure would weaken. A short setup could then target $0.1105, $0.0991 and $0.0903, with stop-loss above $0.1240.
The preferred direction remains bullish above $0.1188, but a clear breakout above $0.1285 is required for a safer long entry. This is a highly volatile new pair, so strict risk management is essential.
24H High: $0.14208
24H Low: $0.09028
#Crypto #Trading #Binance #牛来USDT #FuturesTrading
🚨 NYU 来/USDT – 30-Minute Bullish Recovery Setup
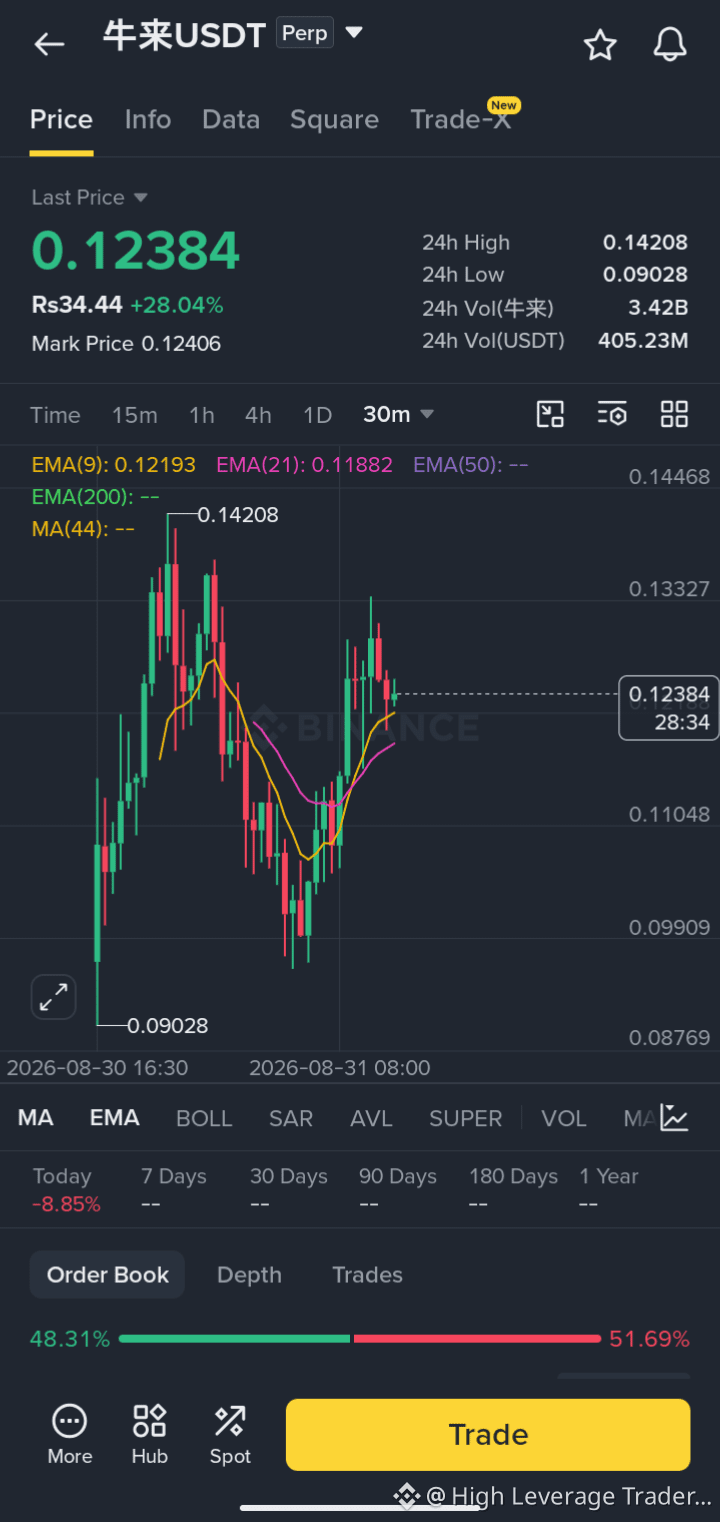
NYU 来/USDT is trading near $0.1238, up more than 28% in 24 hours. The 30-minute structure has turned bullish after a strong recovery from the $0.096 area. Price is holding above EMA9 at $0.12193 and EMA21 at $0.11882, showing that buyers still control the broader short-term trend.
A confirmed 30-minute candle close above $0.1280 could activate a long setup targeting $0.1333, $0.1380 and $0.1421. The long stop-loss should be placed below $0.1215. A bullish reaction from the $0.1219–$0.1188 support zone could also offer a pullback opportunity, but confirmation is necessary.
If price closes below $0.1188 and retests this level as resistance, the bullish recovery would be invalidated. A short setup could then target $0.1140, $0.1105 and $0.0991, with stop-loss above $0.1222.
The preferred direction remains bullish above $0.1188, while $0.1280 is the key breakout level for the next strong upward move.
24H High: $0.14208
24H Low: $0.09028
#Crypto #Trading #Binance #牛来USDT #FuturesTrading
NYU 来/USDT is trading near $0.1238, up more than 28% in 24 hours. The 30-minute structure has turned bullish after a strong recovery from the $0.096 area. Price is holding above EMA9 at $0.12193 and EMA21 at $0.11882, showing that buyers still control the broader short-term trend.
A confirmed 30-minute candle close above $0.1280 could activate a long setup targeting $0.1333, $0.1380 and $0.1421. The long stop-loss should be placed below $0.1215. A bullish reaction from the $0.1219–$0.1188 support zone could also offer a pullback opportunity, but confirmation is necessary.
If price closes below $0.1188 and retests this level as resistance, the bullish recovery would be invalidated. A short setup could then target $0.1140, $0.1105 and $0.0991, with stop-loss above $0.1222.
The preferred direction remains bullish above $0.1188, while $0.1280 is the key breakout level for the next strong upward move.
24H High: $0.14208
24H Low: $0.09028
#Crypto #Trading #Binance #牛来USDT #FuturesTrading
🚨 Niu Lai/USDT – Bullish Continuation Setup
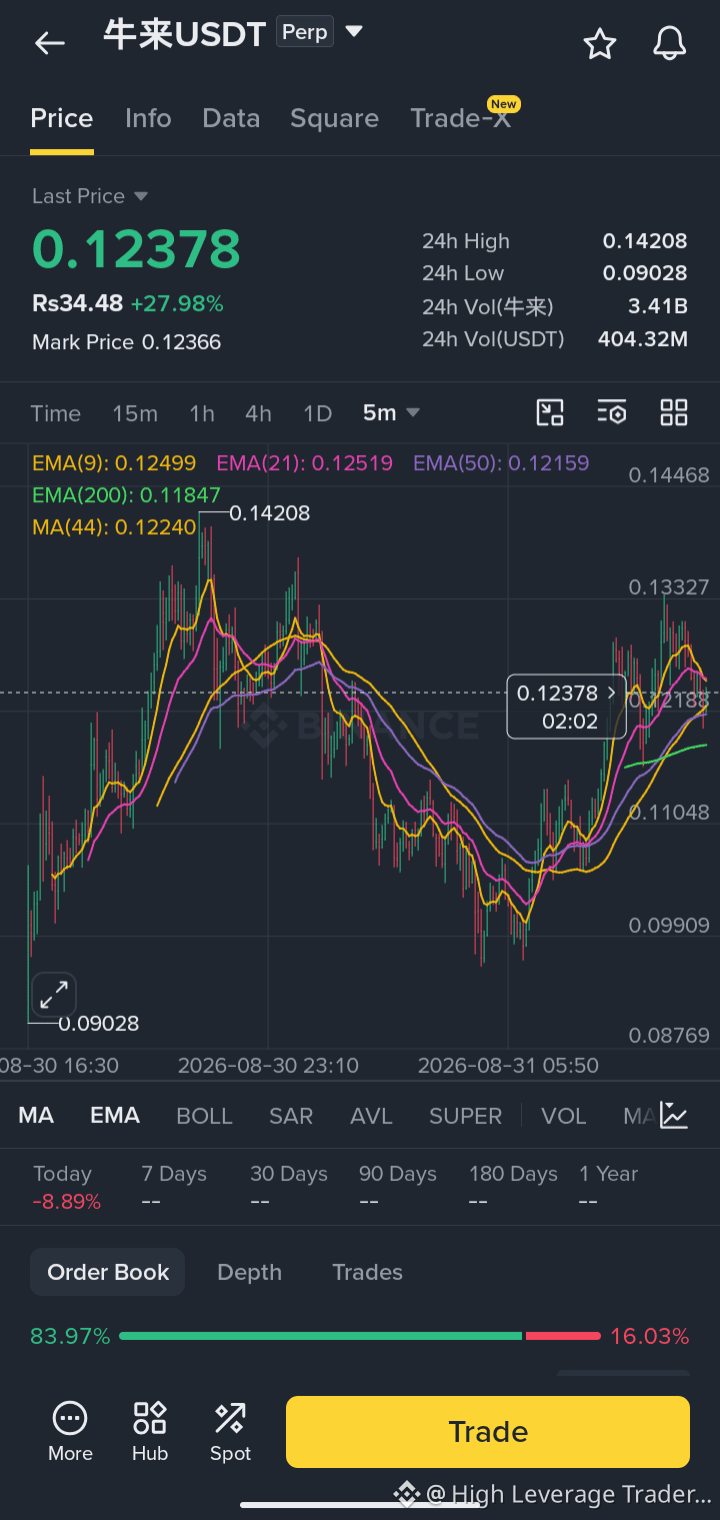
Niu Lai/USDT is trading near $0.1238, up almost 28% in 24 hours. On the 5-minute chart, price remains above EMA50 at $0.12159, MA44 at $0.12240 and EMA200 at $0.11847, confirming that the broader recovery structure is still bullish. However, price is below EMA9 and EMA21, showing a short-term pullback.
A confirmed 5-minute candle close above $0.1252, followed by a successful retest, could activate a long setup targeting $0.1300, $0.1333 and $0.1421. The long stop-loss should be placed below $0.1215.
If price closes below $0.1215 and retests this level as resistance, the bullish structure would weaken. A short setup could then target $0.1185, $0.1105 and $0.0991, with stop-loss above $0.1252.
The preferred direction remains bullish while price holds above $0.1215, but confirmation above $0.1252 is required before entry.
24H High: $0.14208
24H Low: $0.09028
#Crypto #Trading #Binance #牛来USDT #FuturesTrading
Niu Lai/USDT is trading near $0.1238, up almost 28% in 24 hours. On the 5-minute chart, price remains above EMA50 at $0.12159, MA44 at $0.12240 and EMA200 at $0.11847, confirming that the broader recovery structure is still bullish. However, price is below EMA9 and EMA21, showing a short-term pullback.
A confirmed 5-minute candle close above $0.1252, followed by a successful retest, could activate a long setup targeting $0.1300, $0.1333 and $0.1421. The long stop-loss should be placed below $0.1215.
If price closes below $0.1215 and retests this level as resistance, the bullish structure would weaken. A short setup could then target $0.1185, $0.1105 and $0.0991, with stop-loss above $0.1252.
The preferred direction remains bullish while price holds above $0.1215, but confirmation above $0.1252 is required before entry.
24H High: $0.14208
24H Low: $0.09028
#Crypto #Trading #Binance #牛来USDT #FuturesTrading
🚨 Bull Run/USDT – Major Breakout Setup
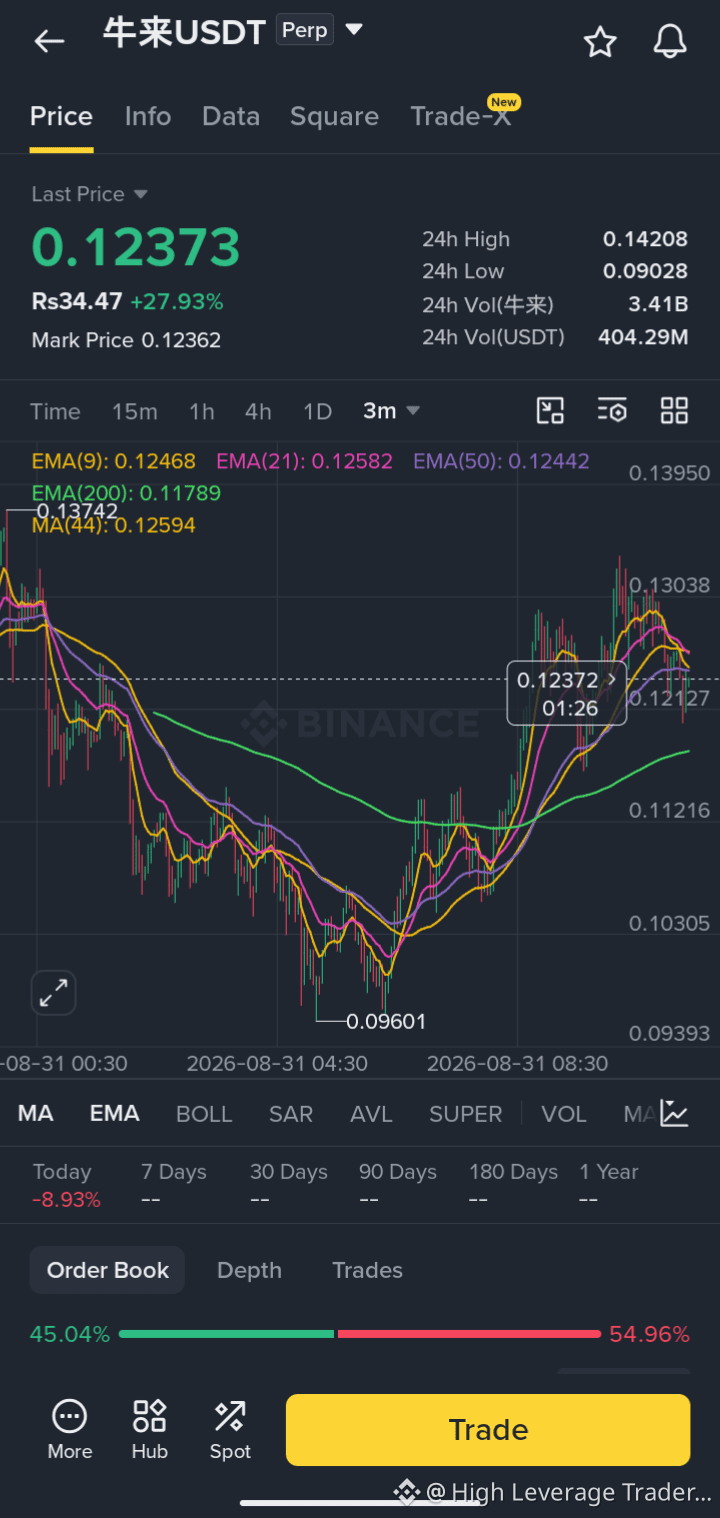
Bull Run/USDT is trading near $0.1237 after recovering strongly from $0.09601 and reaching $0.13038. The broader recovery remains intact above EMA200 at $0.11789, but price is currently below EMA9, EMA21, EMA50 and MA44, indicating a short-term bearish correction.
A confirmed 3-minute candle close and successful retest above $0.1260 could activate a long setup targeting $0.1304, $0.1374 and $0.1420. The long stop-loss should be placed below $0.1212.
If price breaks below $0.1212 and retests this level as resistance, the short setup could target $0.1179, $0.1122 and $0.1031. The short stop-loss should remain above $0.1260.
Current direction is neutral-to-bearish below $0.1260. Avoid entering in the middle and wait for a confirmed breakout or breakdown.
24H High: $0.14208
24H Low: $0.09028
#Crypto #Trading #Binance #牛来USDT #FuturesTrading
Bull Run/USDT is trading near $0.1237 after recovering strongly from $0.09601 and reaching $0.13038. The broader recovery remains intact above EMA200 at $0.11789, but price is currently below EMA9, EMA21, EMA50 and MA44, indicating a short-term bearish correction.
A confirmed 3-minute candle close and successful retest above $0.1260 could activate a long setup targeting $0.1304, $0.1374 and $0.1420. The long stop-loss should be placed below $0.1212.
If price breaks below $0.1212 and retests this level as resistance, the short setup could target $0.1179, $0.1122 and $0.1031. The short stop-loss should remain above $0.1260.
Current direction is neutral-to-bearish below $0.1260. Avoid entering in the middle and wait for a confirmed breakout or breakdown.
24H High: $0.14208
24H Low: $0.09028
#Crypto #Trading #Binance #牛来USDT #FuturesTrading
🚨 牛来/USDT – Breakout or Breakdown Setup
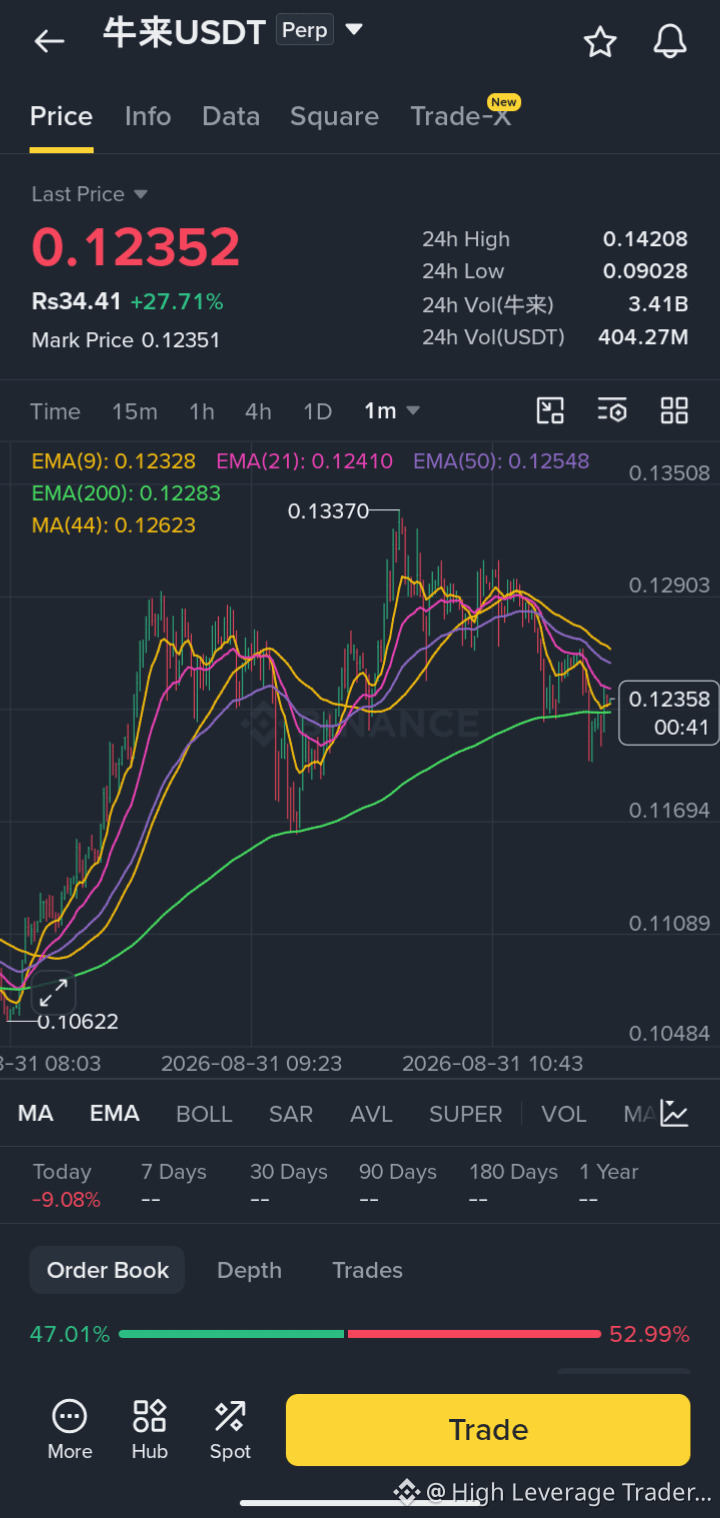
牛来/USDT is trading near $0.1235, up 27.71% in 24 hours. After reaching $0.13370, the price entered a correction and is now testing the EMA200 support near $0.12283. Price remains below EMA21, EMA50 and MA44, showing short-term selling pressure.
A confirmed breakout above $0.1263 could open a long opportunity toward $0.1290, $0.1337 and $0.1420. The long stop-loss should be placed below $0.1225. If price breaks below $0.1225 and retests it as resistance, a short setup could target $0.1200, $0.1169 and $0.1109, with stop-loss above $0.1263.
The current zone is choppy, so waiting for clear confirmation is safer than entering immediately.
24H High: $0.14208
24H Low: $0.09028
#Crypto #Trading #Binance #牛来USDT #FuturesTrading
牛来/USDT is trading near $0.1235, up 27.71% in 24 hours. After reaching $0.13370, the price entered a correction and is now testing the EMA200 support near $0.12283. Price remains below EMA21, EMA50 and MA44, showing short-term selling pressure.
A confirmed breakout above $0.1263 could open a long opportunity toward $0.1290, $0.1337 and $0.1420. The long stop-loss should be placed below $0.1225. If price breaks below $0.1225 and retests it as resistance, a short setup could target $0.1200, $0.1169 and $0.1109, with stop-loss above $0.1263.
The current zone is choppy, so waiting for clear confirmation is safer than entering immediately.
24H High: $0.14208
24H Low: $0.09028
#Crypto #Trading #Binance #牛来USDT #FuturesTrading
🚀 $UAI Surges 15% — Bulls Are Preparing Another Breakout!
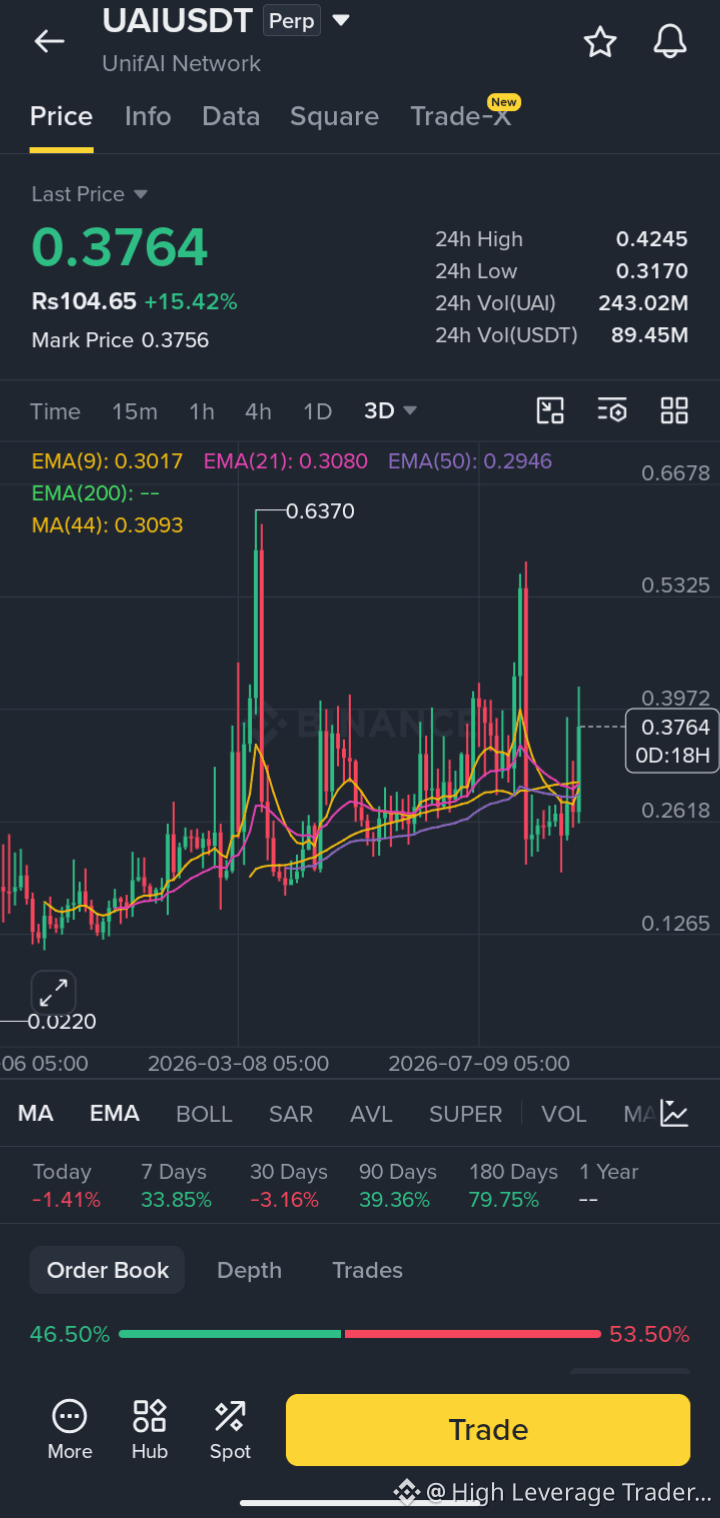
UAI is trading near $0.3764 after gaining 15.42%, supported by an impressive $89.45M in 24-hour Futures volume. On the 3-day chart, price has reclaimed EMA 9, EMA 21, EMA 50 and MA 44, confirming strong recovery momentum. However, EMA 9 remains slightly below EMA 21, so the bullish alignment is not fully complete. Binance records the spot ATH near $0.612, while the Futures chart shows a peak around $0.637.
Long Setup: A controlled pullback and bullish hold between $0.333–$0.350 could provide an entry with stop-loss below $0.316 and targets at $0.3972, $0.4245, $0.5325 and $0.6120. Alternatively, a confirmed breakout and successful retest above $0.4245 could provide a continuation entry with stop-loss below $0.3920.
Short Setup: A bearish rejection from the $0.3972–$0.4245 resistance zone followed by a breakdown below $0.3170 would confirm weakness. Entry can be considered around $0.312–$0.318 after a failed reclaim, with stop-loss above $0.340 and targets at $0.3093, $0.2946 and $0.2618.
The structure is bullish above the EMA cluster, but UAI remains highly volatile and the current 3-day candle has not closed. Avoid chasing the wick and wait for a pullback or confirmed breakout.
#UAI #UAIUSDT #UnifAI #AI #BinanceFutures
UAI is trading near $0.3764 after gaining 15.42%, supported by an impressive $89.45M in 24-hour Futures volume. On the 3-day chart, price has reclaimed EMA 9, EMA 21, EMA 50 and MA 44, confirming strong recovery momentum. However, EMA 9 remains slightly below EMA 21, so the bullish alignment is not fully complete. Binance records the spot ATH near $0.612, while the Futures chart shows a peak around $0.637.
Long Setup: A controlled pullback and bullish hold between $0.333–$0.350 could provide an entry with stop-loss below $0.316 and targets at $0.3972, $0.4245, $0.5325 and $0.6120. Alternatively, a confirmed breakout and successful retest above $0.4245 could provide a continuation entry with stop-loss below $0.3920.
Short Setup: A bearish rejection from the $0.3972–$0.4245 resistance zone followed by a breakdown below $0.3170 would confirm weakness. Entry can be considered around $0.312–$0.318 after a failed reclaim, with stop-loss above $0.340 and targets at $0.3093, $0.2946 and $0.2618.
The structure is bullish above the EMA cluster, but UAI remains highly volatile and the current 3-day candle has not closed. Avoid chasing the wick and wait for a pullback or confirmed breakout.
#UAI #UAIUSDT #UnifAI #AI #BinanceFutures
🚀 $0G Jumps 18% — Bottoming Attempt or Another Relief Rally?
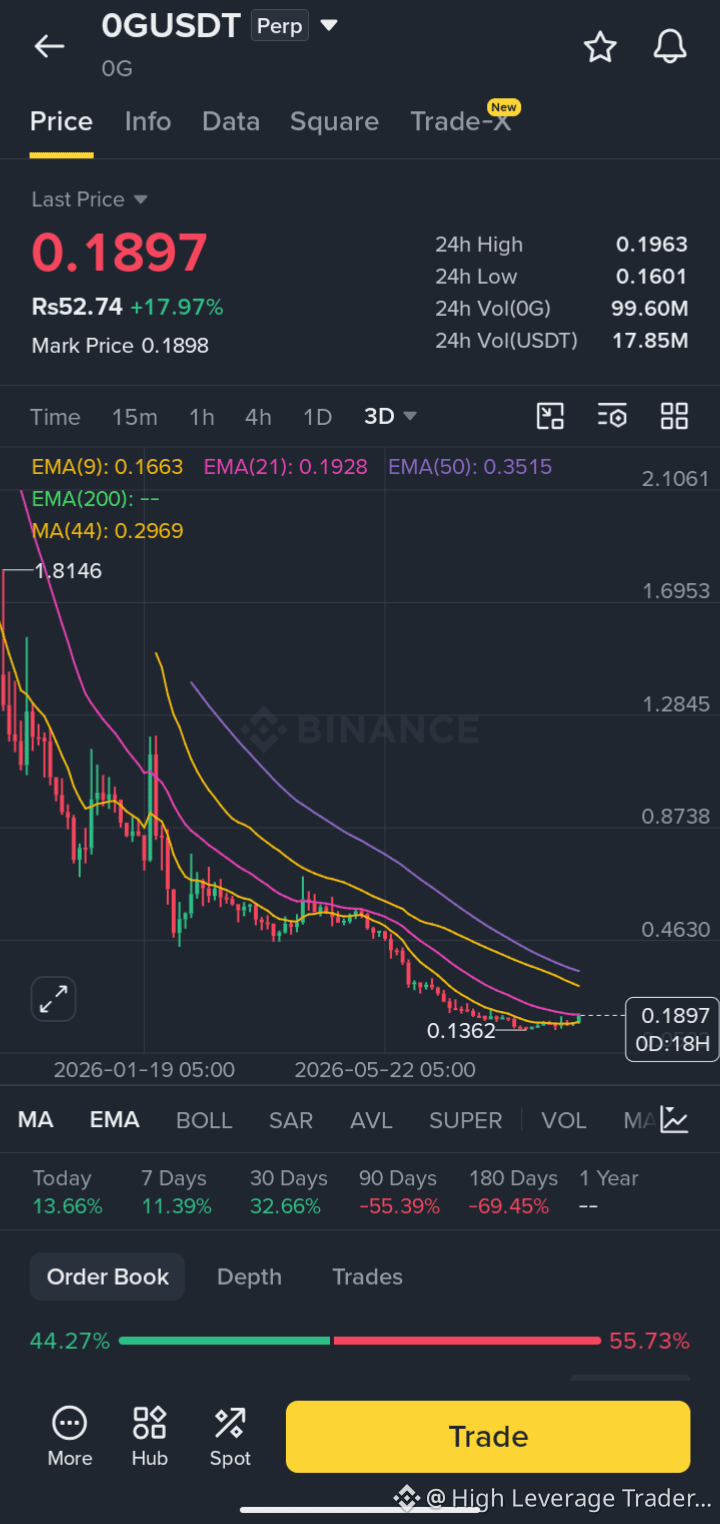
0G is trading near $0.1897 after gaining 17.97%, supported by $17.85M in 24-hour volume. On the 3-day chart, price has reclaimed EMA 9 at $0.1663, showing improving short-term momentum. However, it remains below EMA 21, MA 44 and EMA 50, meaning the larger trend is still bearish. Binance records the historical ATH near $7.31, while the chart shows a recent major bottom at $0.1362.
Long Setup: A pullback and bullish hold between $0.1660–$0.1720 could provide an early entry with stop-loss below $0.1580 and targets at $0.1928, $0.1963, $0.2200 and $0.2500. The safer continuation setup requires a confirmed breakout and successful retest above $0.1965, with MA 44 at $0.2969 as the next major objective.
Short Setup: A bearish rejection from the $0.1928–$0.1963 resistance zone followed by a breakdown below $0.1660 would confirm weakness. Entry can be considered around $0.1640–$0.1670 after a failed reclaim, with stop-loss above $0.1790 and targets at $0.1500, $0.1362 and $0.1200.
This remains a relief rally until EMA 21 is reclaimed and held. Sell-side pressure is still visible, so avoid chasing directly below resistance and wait for confirmation.
#0G #0GUSDT #ZeroGravity #AI #BinanceFutures
0G is trading near $0.1897 after gaining 17.97%, supported by $17.85M in 24-hour volume. On the 3-day chart, price has reclaimed EMA 9 at $0.1663, showing improving short-term momentum. However, it remains below EMA 21, MA 44 and EMA 50, meaning the larger trend is still bearish. Binance records the historical ATH near $7.31, while the chart shows a recent major bottom at $0.1362.
Long Setup: A pullback and bullish hold between $0.1660–$0.1720 could provide an early entry with stop-loss below $0.1580 and targets at $0.1928, $0.1963, $0.2200 and $0.2500. The safer continuation setup requires a confirmed breakout and successful retest above $0.1965, with MA 44 at $0.2969 as the next major objective.
Short Setup: A bearish rejection from the $0.1928–$0.1963 resistance zone followed by a breakdown below $0.1660 would confirm weakness. Entry can be considered around $0.1640–$0.1670 after a failed reclaim, with stop-loss above $0.1790 and targets at $0.1500, $0.1362 and $0.1200.
This remains a relief rally until EMA 21 is reclaimed and held. Sell-side pressure is still visible, so avoid chasing directly below resistance and wait for confirmation.
#0G #0GUSDT #ZeroGravity #AI #BinanceFutures
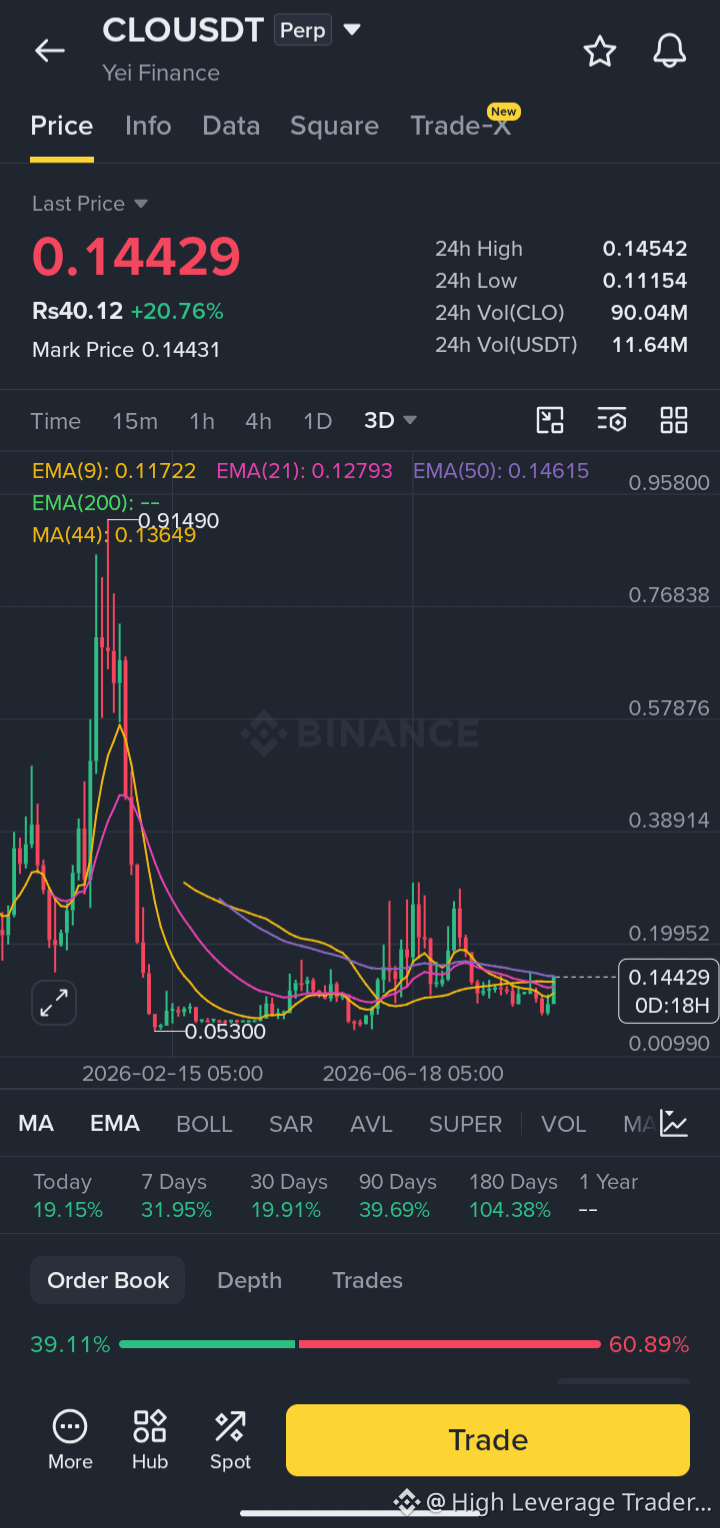
🚀 $CLO Surges 20% — EMA 50 Breakout Could Confirm a Major Reversal!
CLO is trading near $0.14429 after gaining 20.76%, with $11.64M in 24-hour volume. On the 3-day chart, price has reclaimed EMA 9, EMA 21 and MA 44, confirming improving bullish momentum. However, EMA 50 at $0.14615 and the 24-hour high at $0.14542 create a decisive resistance cluster. EMA 9 also remains below EMA 21, so the larger reversal is not fully confirmed. The visible chart shows a historical high near $0.91490 and a major low at $0.05300.
Long Setup: A pullback and bullish hold between $0.1330–$0.1370 could provide an entry with stop-loss below $0.1260 and targets at $0.1462, $0.1600, $0.1800 and $0.1995. The safer continuation setup requires a confirmed breakout and successful retest above $0.1465 before entering.
Short Setup: A short becomes valid if CLO faces rejection from $0.1454–$0.1462 and then loses MA 44 at $0.1365. Entry can be considered around $0.1350–$0.1370 after a failed reclaim, with stop-loss above $0.1455 and targets at $0.1279, $0.1172 and $0.1115.
CLO is showing early reversal strength, but price is directly below EMA 50 and the order book currently shows heavy sell-side pressure. Avoid chasing until the $0.1465 breakout is confirmed.
#CLO #CLOUSDT #YeiFinance #DeFi #BinanceFutures
CLO is trading near $0.14429 after gaining 20.76%, with $11.64M in 24-hour volume. On the 3-day chart, price has reclaimed EMA 9, EMA 21 and MA 44, confirming improving bullish momentum. However, EMA 50 at $0.14615 and the 24-hour high at $0.14542 create a decisive resistance cluster. EMA 9 also remains below EMA 21, so the larger reversal is not fully confirmed. The visible chart shows a historical high near $0.91490 and a major low at $0.05300.
Long Setup: A pullback and bullish hold between $0.1330–$0.1370 could provide an entry with stop-loss below $0.1260 and targets at $0.1462, $0.1600, $0.1800 and $0.1995. The safer continuation setup requires a confirmed breakout and successful retest above $0.1465 before entering.
Short Setup: A short becomes valid if CLO faces rejection from $0.1454–$0.1462 and then loses MA 44 at $0.1365. Entry can be considered around $0.1350–$0.1370 after a failed reclaim, with stop-loss above $0.1455 and targets at $0.1279, $0.1172 and $0.1115.
CLO is showing early reversal strength, but price is directly below EMA 50 and the order book currently shows heavy sell-side pressure. Avoid chasing until the $0.1465 breakout is confirmed.
#CLO #CLOUSDT #YeiFinance #DeFi #BinanceFutures
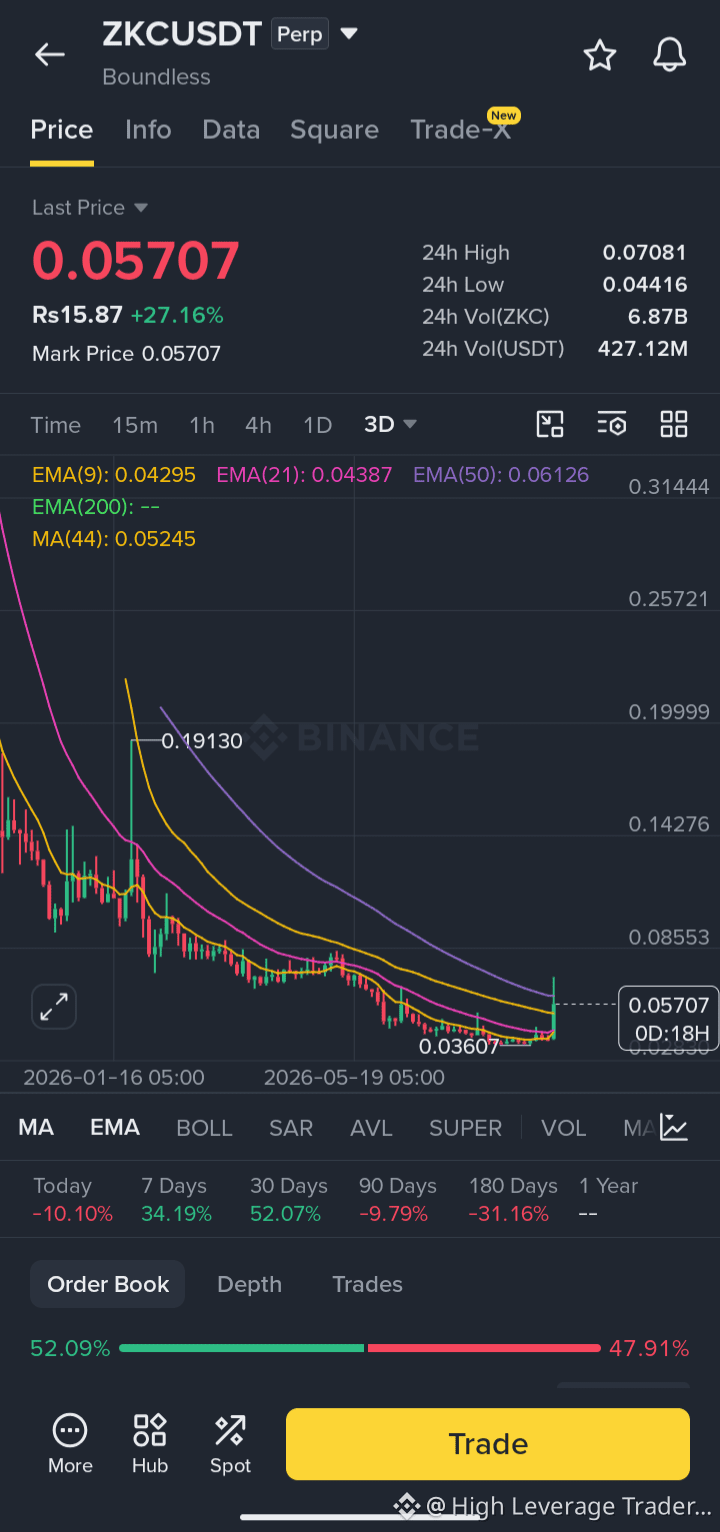
🚀 $ZKC Surges 27% — EMA 50 Will Decide the Next Major Move!
ZKC is trading near $0.05707 after gaining 27.16%, backed by massive $427M 24-hour volume. On the 3-day chart, price has reclaimed EMA 9, EMA 21 and MA 44, indicating an early bullish reversal. However, EMA 50 at $0.06126 remains the decisive resistance, while EMA 9 is still below EMA 21. The chart shows a recent major bottom at $0.03607, while Binance records the historical ATH near $2.13.
Long Setup: A bullish pullback and hold between $0.0520–$0.0540 could provide an entry with stop-loss below $0.0485 and targets at $0.0613, $0.0708 and $0.0855. The safer continuation entry requires a confirmed breakout and successful retest above $0.0613, with stop-loss below $0.0570.
Short Setup: A short becomes valid only if ZKC faces rejection from EMA 50 and then loses $0.0520. Entry can be considered around $0.0515–$0.0525 after a failed reclaim, with stop-loss above $0.0565 and targets at $0.0442, $0.0430 and $0.0361.
The recovery is strong, but the 3-day candle remains open and price already faced rejection from $0.07081. Avoid chasing and wait for either an EMA 50 breakout or a confirmed breakdown below MA 44.
#ZKC #ZKCUSDT #Boundless #ZK #BinanceFutures
ZKC is trading near $0.05707 after gaining 27.16%, backed by massive $427M 24-hour volume. On the 3-day chart, price has reclaimed EMA 9, EMA 21 and MA 44, indicating an early bullish reversal. However, EMA 50 at $0.06126 remains the decisive resistance, while EMA 9 is still below EMA 21. The chart shows a recent major bottom at $0.03607, while Binance records the historical ATH near $2.13.
Long Setup: A bullish pullback and hold between $0.0520–$0.0540 could provide an entry with stop-loss below $0.0485 and targets at $0.0613, $0.0708 and $0.0855. The safer continuation entry requires a confirmed breakout and successful retest above $0.0613, with stop-loss below $0.0570.
Short Setup: A short becomes valid only if ZKC faces rejection from EMA 50 and then loses $0.0520. Entry can be considered around $0.0515–$0.0525 after a failed reclaim, with stop-loss above $0.0565 and targets at $0.0442, $0.0430 and $0.0361.
The recovery is strong, but the 3-day candle remains open and price already faced rejection from $0.07081. Avoid chasing and wait for either an EMA 50 breakout or a confirmed breakdown below MA 44.
#ZKC #ZKCUSDT #Boundless #ZK #BinanceFutures
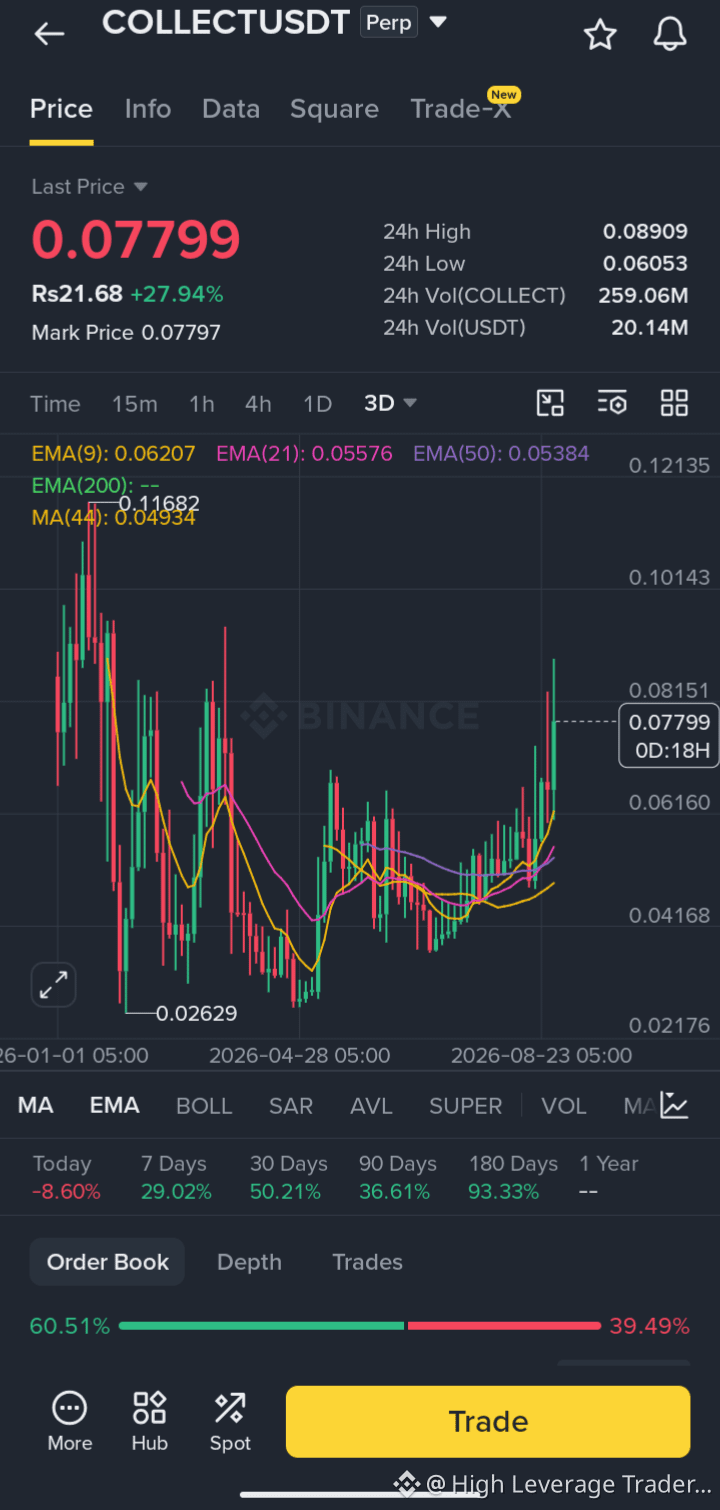
🚀 $COLLECT Breaks Out 28% — Bulls Now Eye the All-Time High!
COLLECT is trading near $0.07799 after gaining 27.94%, supported by $20.14M in 24-hour volume. The 3-day chart shows a strongly bullish EMA alignment, with price holding above EMA 9, EMA 21, EMA 50 and MA 44. The chart’s major low is $0.02629, while the ATH zone sits near $0.11682–$0.12135.
Long Setup: A controlled pullback and bullish hold between $0.0690–$0.0730 could provide an entry with stop-loss below $0.0650 and targets at $0.0815, $0.0891, $0.1014 and $0.1168. Alternatively, wait for a confirmed breakout and successful retest above $0.0891 before targeting the ATH zone.
Short Setup: A short becomes valid only if COLLECT loses $0.0616 and fails to reclaim it. Entry can be considered around $0.0605–$0.0615 with stop-loss above $0.0655 and targets at $0.0558, $0.0538, $0.0493 and $0.0417.
The overall structure remains bullish, and buyers currently dominate the order book. However, rejection from the $0.0815–$0.0891 zone could produce a sharp pullback, so avoid chasing the extended candle and wait for confirmation.
#COLLECT #COLLECTUSDT #CryptoTrading #Altcoins #BinanceFutures
COLLECT is trading near $0.07799 after gaining 27.94%, supported by $20.14M in 24-hour volume. The 3-day chart shows a strongly bullish EMA alignment, with price holding above EMA 9, EMA 21, EMA 50 and MA 44. The chart’s major low is $0.02629, while the ATH zone sits near $0.11682–$0.12135.
Long Setup: A controlled pullback and bullish hold between $0.0690–$0.0730 could provide an entry with stop-loss below $0.0650 and targets at $0.0815, $0.0891, $0.1014 and $0.1168. Alternatively, wait for a confirmed breakout and successful retest above $0.0891 before targeting the ATH zone.
Short Setup: A short becomes valid only if COLLECT loses $0.0616 and fails to reclaim it. Entry can be considered around $0.0605–$0.0615 with stop-loss above $0.0655 and targets at $0.0558, $0.0538, $0.0493 and $0.0417.
The overall structure remains bullish, and buyers currently dominate the order book. However, rejection from the $0.0815–$0.0891 zone could produce a sharp pullback, so avoid chasing the extended candle and wait for confirmation.
#COLLECT #COLLECTUSDT #CryptoTrading #Altcoins #BinanceFutures
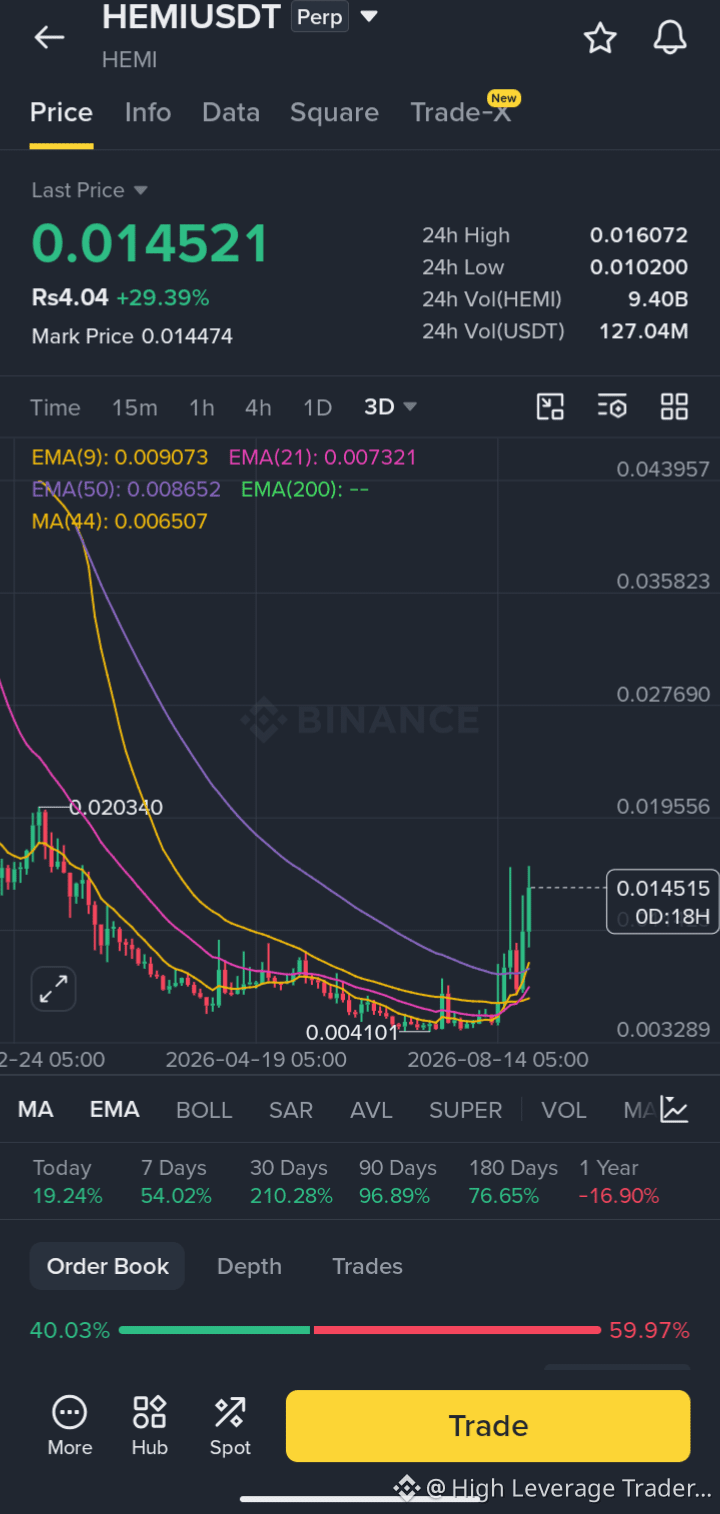
🚀 $HEMI Breaks Out 29% — Major Trend Reversal Is Developing!
HEMI is trading near $0.01452 after gaining 29.39%, supported by an impressive $127M in 24-hour volume. On the 3-day chart, price has broken strongly above EMA 9, EMA 21, EMA 50 and MA 44. EMA 9 has also moved above EMA 50, confirming a significant bullish momentum shift. The visible chart shows a major bottom at $0.004101 and an important previous swing high near $0.02034.
Long Setup: A controlled pullback and bullish hold between $0.0120–$0.0130 could provide an entry with stop-loss below $0.0107 and targets at $0.01607, $0.01956, $0.02034 and $0.02769. Alternatively, a confirmed breakout and successful retest above $0.0161 could offer a continuation entry with stop-loss below $0.0142.
Short Setup: A short becomes valid only if HEMI loses $0.0118 and fails to reclaim it. Entry can be considered around $0.0115–$0.0120 with stop-loss above $0.0133 and targets at $0.0102, $0.0091, $0.00865 and $0.00732.
The structure is strongly bullish, but price is already extended and the order book shows noticeable sell-side pressure. Avoid chasing the vertical candle; wait for a retest or confirmed breakout and use low leverage.
#HEMI #HEMIUSDT #Bitcoin #Ethereum #BinanceFutures
HEMI is trading near $0.01452 after gaining 29.39%, supported by an impressive $127M in 24-hour volume. On the 3-day chart, price has broken strongly above EMA 9, EMA 21, EMA 50 and MA 44. EMA 9 has also moved above EMA 50, confirming a significant bullish momentum shift. The visible chart shows a major bottom at $0.004101 and an important previous swing high near $0.02034.
Long Setup: A controlled pullback and bullish hold between $0.0120–$0.0130 could provide an entry with stop-loss below $0.0107 and targets at $0.01607, $0.01956, $0.02034 and $0.02769. Alternatively, a confirmed breakout and successful retest above $0.0161 could offer a continuation entry with stop-loss below $0.0142.
Short Setup: A short becomes valid only if HEMI loses $0.0118 and fails to reclaim it. Entry can be considered around $0.0115–$0.0120 with stop-loss above $0.0133 and targets at $0.0102, $0.0091, $0.00865 and $0.00732.
The structure is strongly bullish, but price is already extended and the order book shows noticeable sell-side pressure. Avoid chasing the vertical candle; wait for a retest or confirmed breakout and use low leverage.
#HEMI #HEMIUSDT #Bitcoin #Ethereum #BinanceFutures
🚀 $FLOCK Surges 28% — Major Reversal or Just a Relief Rally?
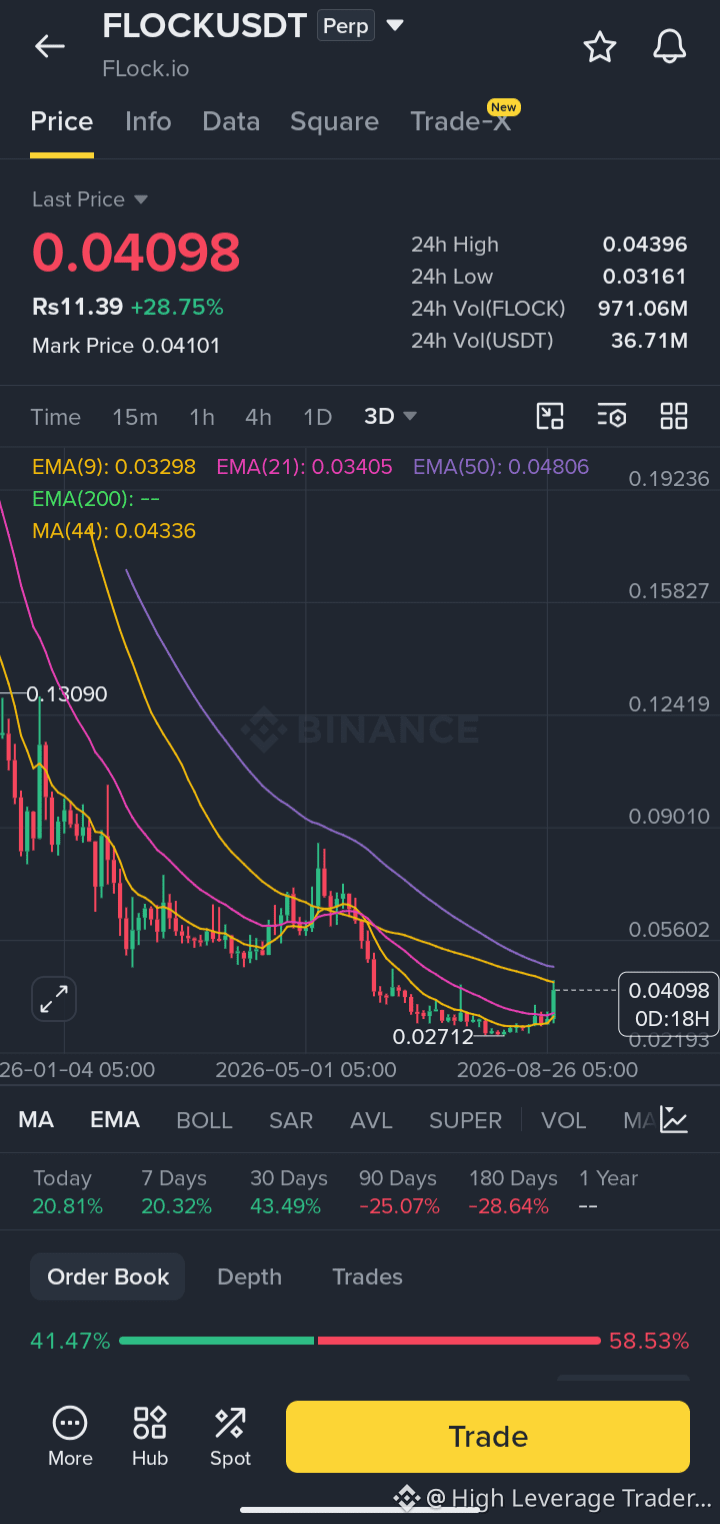
FLOCK is trading near $0.04098 after gaining 28.75%, with $36.71M in 24-hour volume. On the 3-day chart, price has reclaimed EMA 9 and EMA 21, showing improving momentum. However, MA 44 at $0.04336 and EMA 50 at $0.04806 form a major resistance zone, while EMA 9 has not yet crossed above EMA 21. Therefore, the larger trend reversal remains unconfirmed. The chart shows an ATH near $0.13090 and an ATL at $0.02712.
Long Setup: A pullback and bullish hold between $0.0360–$0.0380 could provide an early entry with stop-loss below $0.0330 and targets at $0.04336, $0.04806 and $0.0560. The safer long setup requires a confirmed breakout and successful retest above $0.0481, targeting $0.0560, $0.0700 and $0.0901.
Short Setup: A bearish rejection from the $0.0433–$0.0481 resistance zone followed by a breakdown below $0.0375 would confirm weakness. Entry can be considered near $0.0370–$0.0380 after a failed reclaim, with stop-loss above $0.0415 and targets at $0.0340, $0.0316 and $0.0271.
FLOCK is showing early recovery signs, but the move remains a relief rally until EMA 50 is reclaimed. Avoid chasing directly below major resistance and wait for confirmation.
#FLOCK #FLOCKUSDT #Aİ #cryptotrading #cryptotrading
FLOCK is trading near $0.04098 after gaining 28.75%, with $36.71M in 24-hour volume. On the 3-day chart, price has reclaimed EMA 9 and EMA 21, showing improving momentum. However, MA 44 at $0.04336 and EMA 50 at $0.04806 form a major resistance zone, while EMA 9 has not yet crossed above EMA 21. Therefore, the larger trend reversal remains unconfirmed. The chart shows an ATH near $0.13090 and an ATL at $0.02712.
Long Setup: A pullback and bullish hold between $0.0360–$0.0380 could provide an early entry with stop-loss below $0.0330 and targets at $0.04336, $0.04806 and $0.0560. The safer long setup requires a confirmed breakout and successful retest above $0.0481, targeting $0.0560, $0.0700 and $0.0901.
Short Setup: A bearish rejection from the $0.0433–$0.0481 resistance zone followed by a breakdown below $0.0375 would confirm weakness. Entry can be considered near $0.0370–$0.0380 after a failed reclaim, with stop-loss above $0.0415 and targets at $0.0340, $0.0316 and $0.0271.
FLOCK is showing early recovery signs, but the move remains a relief rally until EMA 50 is reclaimed. Avoid chasing directly below major resistance and wait for confirmation.
#FLOCK #FLOCKUSDT #Aİ #cryptotrading #cryptotrading
🔥 $牛来 Rebounds 33% — Bulls Targeting the Launch High!
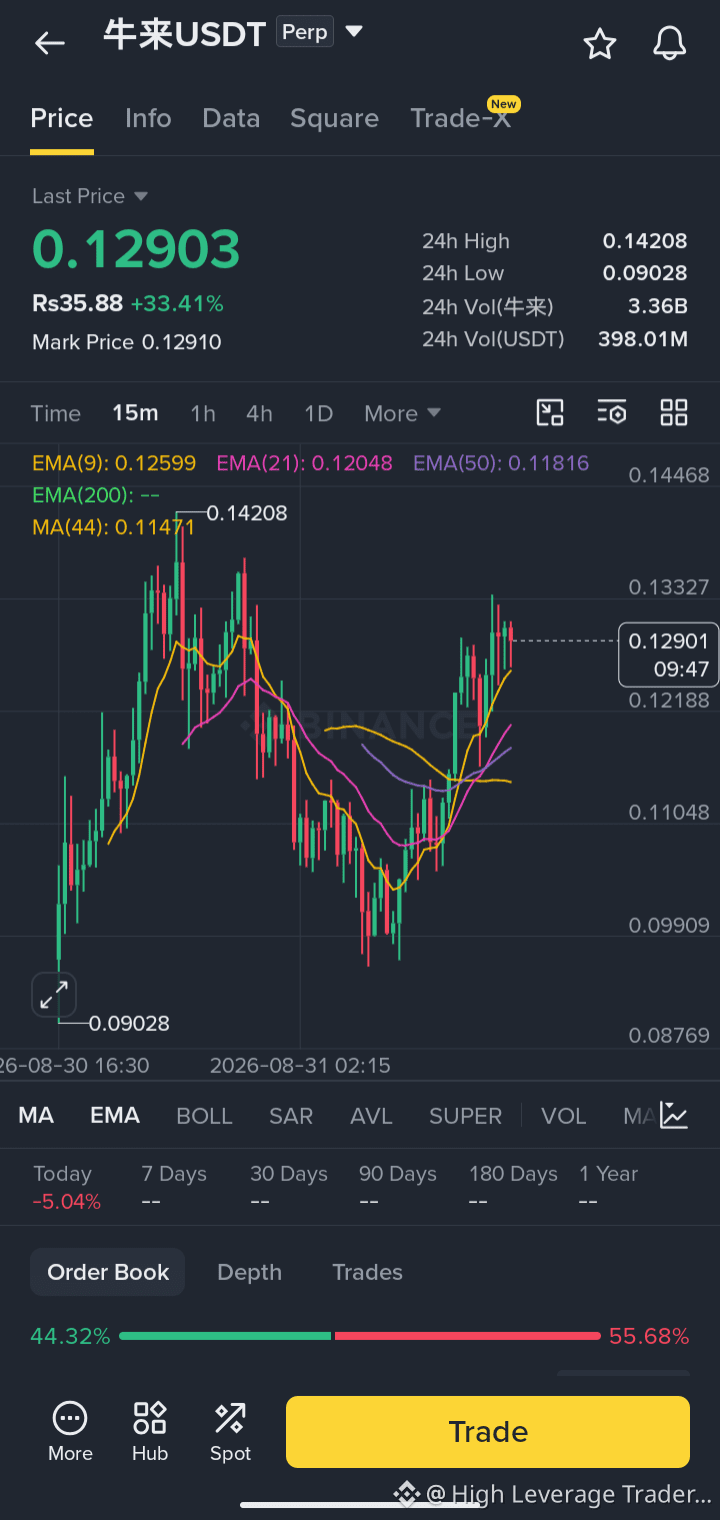
Niu Lai is trading near $0.1290 after gaining 33.41% in 24 hours, backed by approximately $398M trading volume. On the 15-minute chart, price is above EMA 9, EMA 21, EMA 50 and MA 44, while the bullish EMA alignment confirms strong short-term momentum. The current Binance Futures trading range is $0.09028–$0.14208.
Long Setup: A bullish hold between $0.1245–$0.1265 could provide a pullback entry with stop-loss below $0.1200 and targets at $0.1333, $0.1421 and $0.1500. A breakout entry is safer only after a confirmed 15-minute close above $0.1333 followed by a successful retest.
Short Setup: A short becomes valid only if price loses $0.1200 and fails to reclaim it. Entry can be considered around $0.1190–$0.1200 with stop-loss above $0.1235 and targets at $0.1147, $0.1105 and $0.0991.
The structure remains bullish above $0.1200, but this is a newly launched meme-coin contract with extreme volatility and visible sell-side pressure. Avoid chasing green candles and use low leverage with a strict stop-loss.
#牛来 #NIULAI #牛来USDT
Niu Lai is trading near $0.1290 after gaining 33.41% in 24 hours, backed by approximately $398M trading volume. On the 15-minute chart, price is above EMA 9, EMA 21, EMA 50 and MA 44, while the bullish EMA alignment confirms strong short-term momentum. The current Binance Futures trading range is $0.09028–$0.14208.
Long Setup: A bullish hold between $0.1245–$0.1265 could provide a pullback entry with stop-loss below $0.1200 and targets at $0.1333, $0.1421 and $0.1500. A breakout entry is safer only after a confirmed 15-minute close above $0.1333 followed by a successful retest.
Short Setup: A short becomes valid only if price loses $0.1200 and fails to reclaim it. Entry can be considered around $0.1190–$0.1200 with stop-loss above $0.1235 and targets at $0.1147, $0.1105 and $0.0991.
The structure remains bullish above $0.1200, but this is a newly launched meme-coin contract with extreme volatility and visible sell-side pressure. Avoid chasing green candles and use low leverage with a strict stop-loss.
#牛来 #NIULAI #牛来USDT
🚀 $ZORA Jumps 62% — Reversal Started, but One Major Resistance Remains!
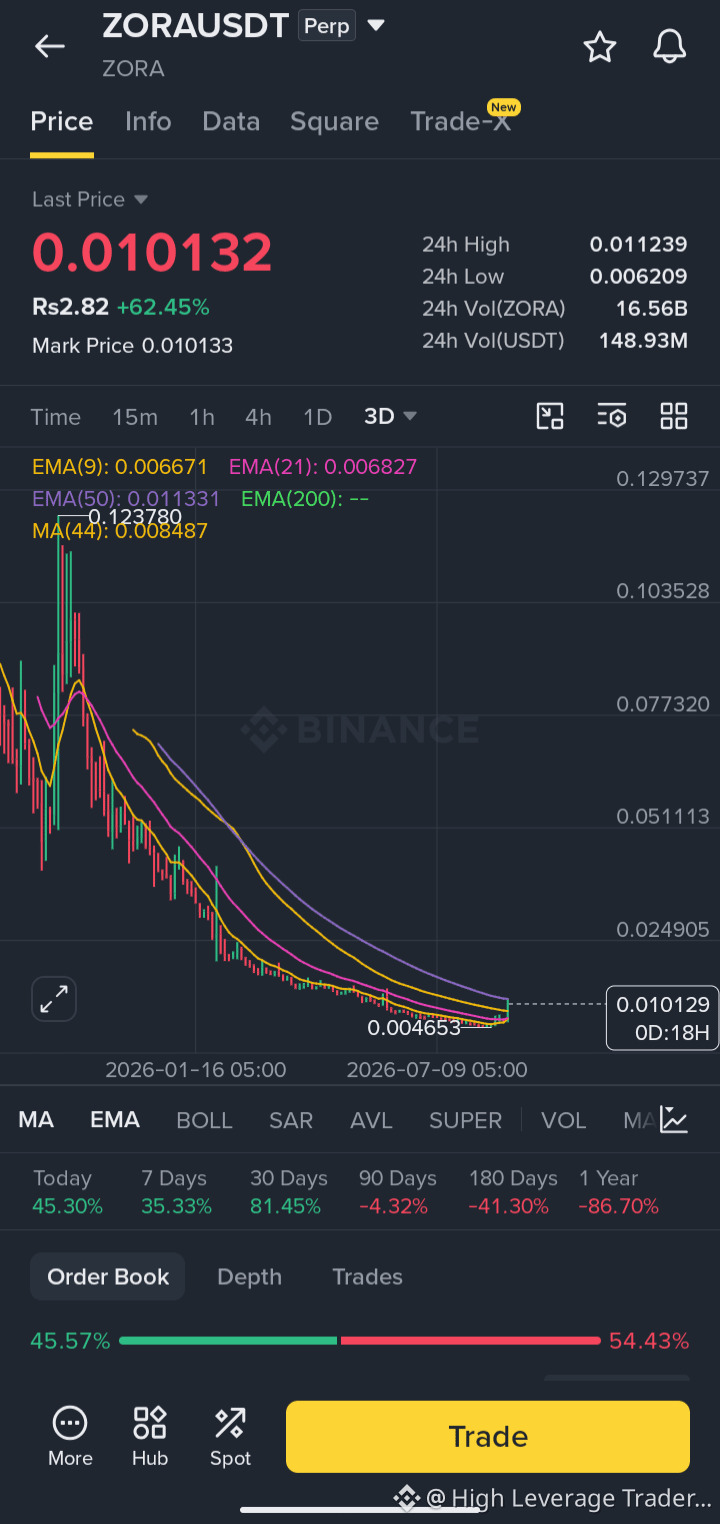
ZORA is trading around $0.01013 after gaining 62.45%, supported by $148.93M in 24-hour volume. The 3-day price has reclaimed EMA 9, EMA 21 and MA 44, indicating a strong short-term momentum shift. However, EMA 50 at $0.01133 remains the crucial resistance, so the larger bullish reversal is not confirmed yet. The chart shows an ATH near $0.12378 and an ATL at $0.004653.
Long Setup: A bullish hold between $0.0088–$0.0094 could provide a pullback entry with stop-loss below $0.0081 and targets at $0.01133, $0.0145, $0.0180 and $0.0249. Alternatively, wait for a confirmed breakout and successful retest above $0.01135 before entering.
Short Setup: A short becomes valid only if ZORA faces rejection from EMA 50 and then closes below $0.0084. Entry can be considered on a failed reclaim of $0.0084–$0.0087, with stop-loss above $0.0097 and targets at $0.0068, $0.0062 and $0.00465.
Momentum is bullish, but price is directly below major resistance. Avoid chasing the pump and wait for either a pullback confirmation or a clean EMA 50 breakout.
#ZORA #ZORAUSDT #CryptoTrading #BinanceFutures
ZORA is trading around $0.01013 after gaining 62.45%, supported by $148.93M in 24-hour volume. The 3-day price has reclaimed EMA 9, EMA 21 and MA 44, indicating a strong short-term momentum shift. However, EMA 50 at $0.01133 remains the crucial resistance, so the larger bullish reversal is not confirmed yet. The chart shows an ATH near $0.12378 and an ATL at $0.004653.
Long Setup: A bullish hold between $0.0088–$0.0094 could provide a pullback entry with stop-loss below $0.0081 and targets at $0.01133, $0.0145, $0.0180 and $0.0249. Alternatively, wait for a confirmed breakout and successful retest above $0.01135 before entering.
Short Setup: A short becomes valid only if ZORA faces rejection from EMA 50 and then closes below $0.0084. Entry can be considered on a failed reclaim of $0.0084–$0.0087, with stop-loss above $0.0097 and targets at $0.0068, $0.0062 and $0.00465.
Momentum is bullish, but price is directly below major resistance. Avoid chasing the pump and wait for either a pullback confirmation or a clean EMA 50 breakout.
#ZORA #ZORAUSDT #CryptoTrading #BinanceFutures
Log in to explore more content