

Evgenia Crypto
26.2k Posts

Evgenia Crypto
Report
Block User
Оперативные торговые сигналы, важные криптоновости и отслеживание крупных движений средств в реальном времени..аналитика креативно и просто.
Open Trade
Frequent Trader
10.9 Months
7 Following
8.1K+ Followers
42.1K+ Liked
Posts
Portfolio
All
Quotes
Live
·
--
The $NEAR coin was simply buried back then: its drop from $20.56 to $1.60 wiped out 92% of its value and erased an entire market cycle.
But something else caught my attention: buyers have defended the $1–2 zone time and again since 2021, and now the asset is breaking away from this base with force.
Its all-time high is an obvious magnet, but if a full-blown altseason takes off, I’m not stopping at $20.
I’m targeting around $25+—about +1,500% from the bottom. Everyone loves NEAR when it’s soaring to new highs; I prefer buying when the crowd thinks the asset is dead.
The $NEAR coin was simply buried back then: its drop from $20.56 to $1.60 wiped out 92% of its value and erased an entire market cycle.
But something else caught my attention: buyers have defended the $1–2 zone time and again since 2021, and now the asset is breaking away from this base with force.
Its all-time high is an obvious magnet, but if a full-blown altseason takes off, I’m not stopping at $20.
I’m targeting around $25+—about +1,500% from the bottom. Everyone loves NEAR when it’s soaring to new highs; I prefer buying when the crowd thinks the asset is dead.
But something else caught my attention: buyers have defended the $1–2 zone time and again since 2021, and now the asset is breaking away from this base with force.
Its all-time high is an obvious magnet, but if a full-blown altseason takes off, I’m not stopping at $20.
I’m targeting around $25+—about +1,500% from the bottom. Everyone loves NEAR when it’s soaring to new highs; I prefer buying when the crowd thinks the asset is dead.
102
·
--
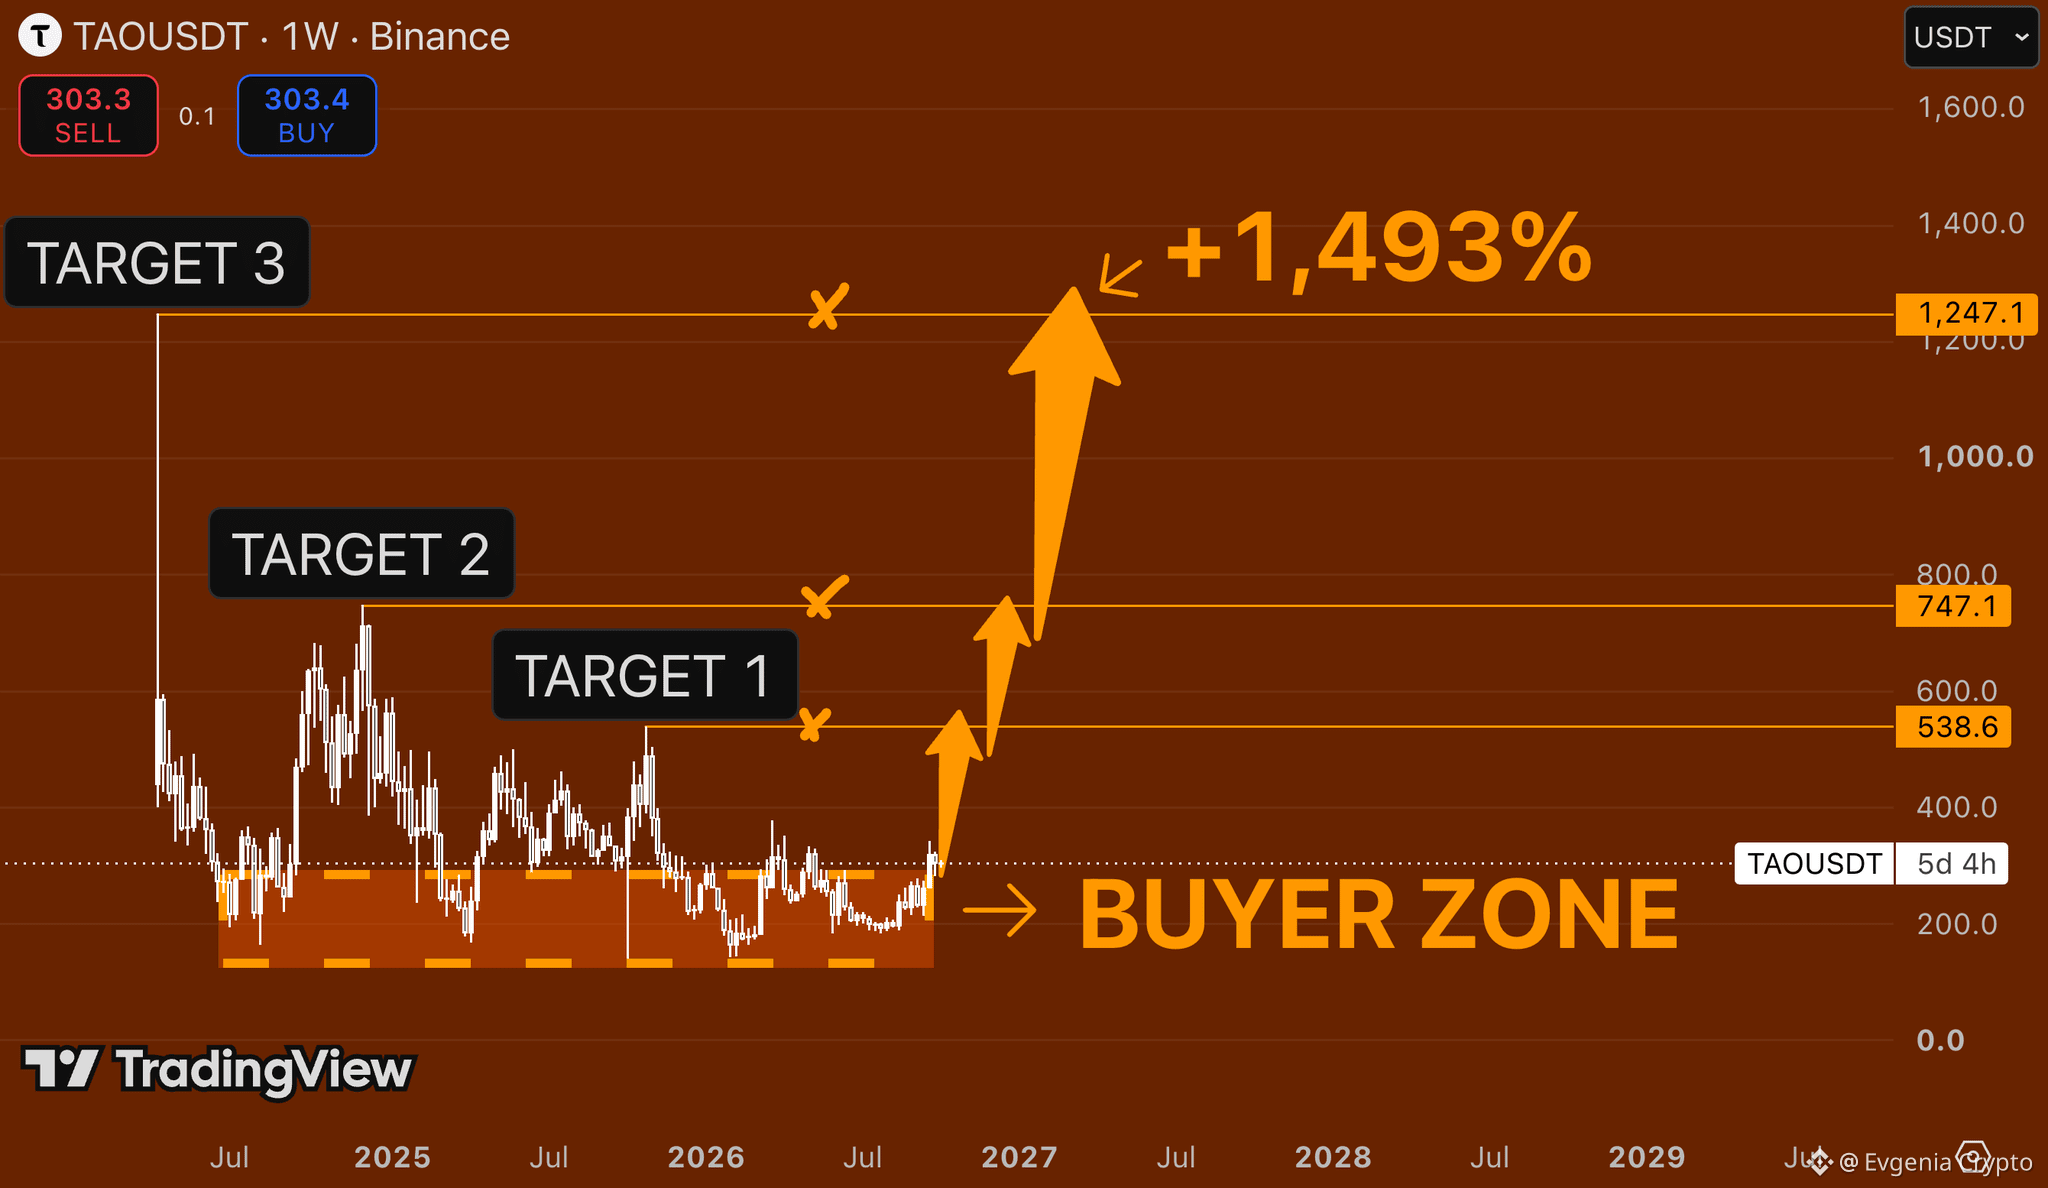
A year of consolidation for $TAO has come to an end, and the market is preparing to punish those who dumped their positions out of fear.
The $150–300 range held like a rock-solid foundation, absorbing all the negativity.
Buyers are pushing the price higher, building momentum for a future breakout.
The first technical milestones are $538, then $747, with a long-term target of $1,247—up 1,500% from the lows.
At current levels around $300, that sounds bold, but in the next wave of AI hype, altcoins in this sector will soar faster than the rest. Consider getting in early.
A year of consolidation for $TAO has come to an end, and the market is preparing to punish those who dumped their positions out of fear.
The $150–300 range held like a rock-solid foundation, absorbing all the negativity.
Buyers are pushing the price higher, building momentum for a future breakout.
The first technical milestones are $538, then $747, with a long-term target of $1,247—up 1,500% from the lows.
At current levels around $300, that sounds bold, but in the next wave of AI hype, altcoins in this sector will soar faster than the rest. Consider getting in early.
The $150–300 range held like a rock-solid foundation, absorbing all the negativity.
Buyers are pushing the price higher, building momentum for a future breakout.
The first technical milestones are $538, then $747, with a long-term target of $1,247—up 1,500% from the lows.
At current levels around $300, that sounds bold, but in the next wave of AI hype, altcoins in this sector will soar faster than the rest. Consider getting in early.
57
·
--
In this game with $ZEC , bears are packed into the subway while bulls collect rent
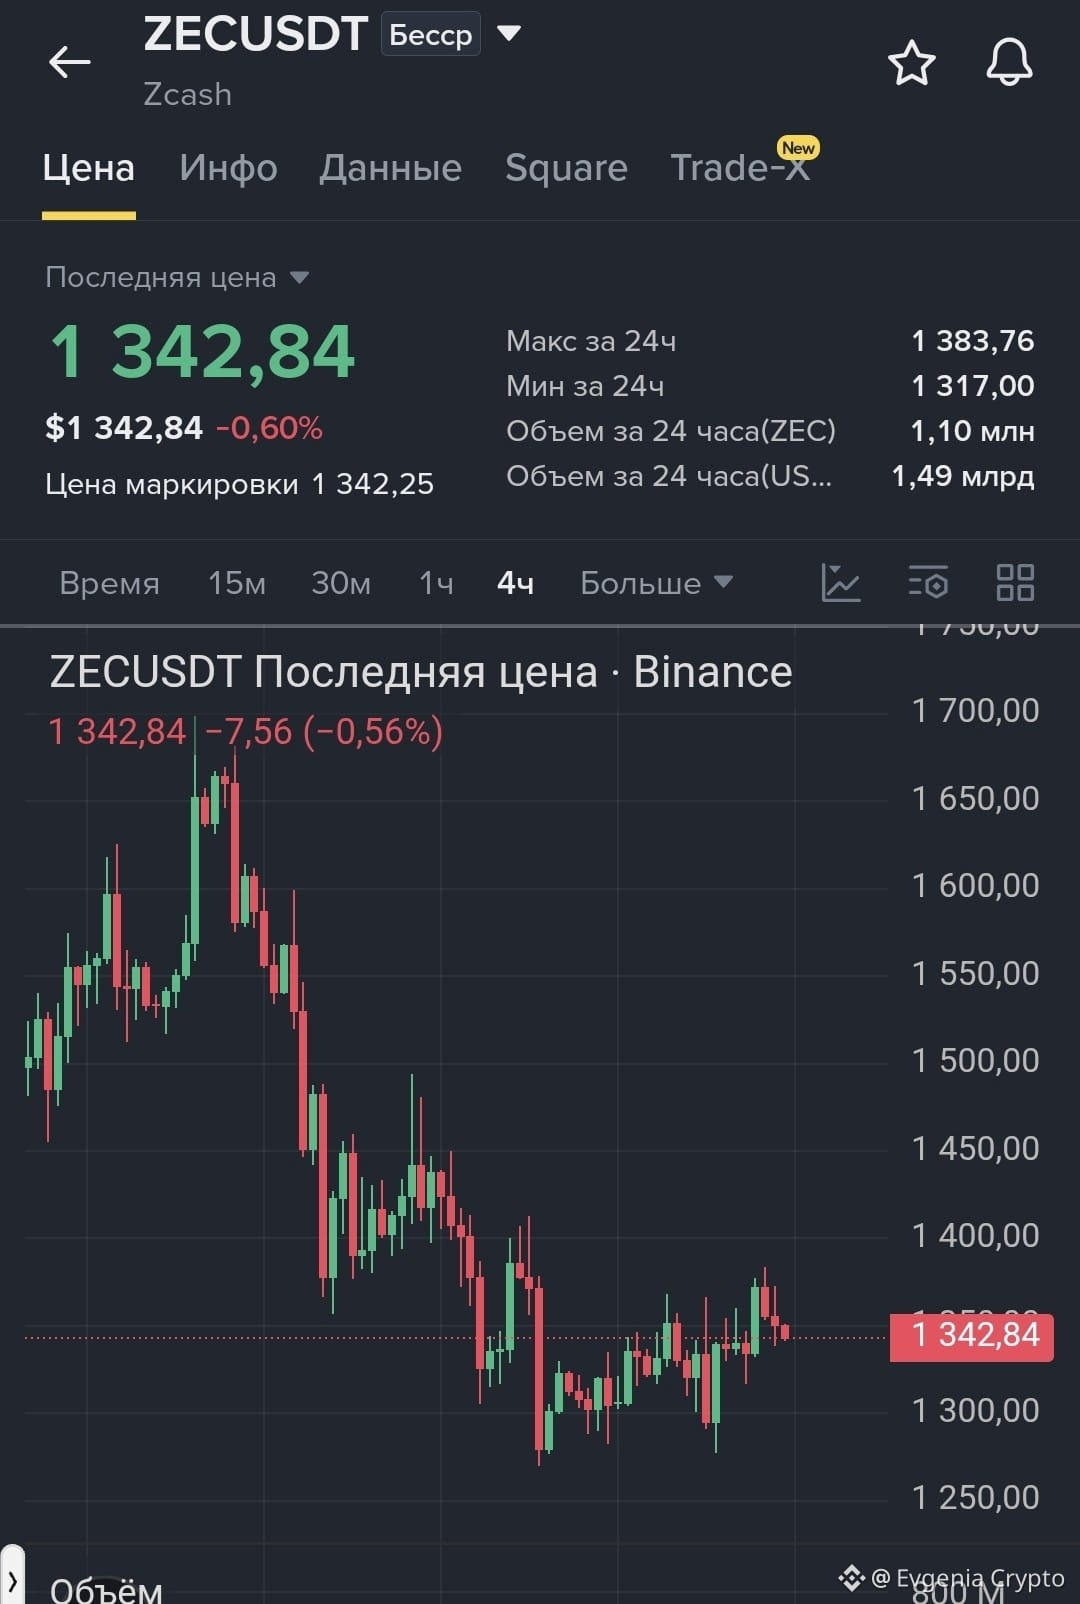
The ZEC chart looks like a showdown between bulls and bears. There’s barely room for the bears, like on a crowded rush-hour train, while the bulls calmly count their money at the top.
The whale is at it again, continuing to build up short positions in ZEC: around 15,000 coins worth nearly $19.84 million, opened at $1,340.9, with current profits of about $50,000. A small profit, but the position was taken early.
The top five positions: four shorts and one long, with all the shorts in profit. But looking at the overall picture, the bulls have made about $70 million, while the bears have lost around $6 million. The bears are fighting over bonuses; the bulls are collecting rent.
The whale is adding to short positions, and more and more bears are gathering overhead. Is ZEC trying to make a comeback?
First, let’s see whether the price can hold above $1,700. There won’t be a market until the bears get squeezed; once they do, that’s when the market will take off.
The macro picture isn’t encouraging either: the Fed meeting minutes are due out this week, the Strait of Hormuz is still closed, and OPEC+ is keeping November oil production unchanged. There are a lot of variables, so don’t rush to conclusions.
In this game with $ZEC , bears are packed into the subway while bulls collect rent
The ZEC chart looks like a showdown between bulls and bears. There’s barely room for the bears, like on a crowded rush-hour train, while the bulls calmly count their money at the top.
The whale is at it again, continuing to build up short positions in ZEC: around 15,000 coins worth nearly $19.84 million, opened at $1,340.9, with current profits of about $50,000. A small profit, but the position was taken early.
The top five positions: four shorts and one long, with all the shorts in profit. But looking at the overall picture, the bulls have made about $70 million, while the bears have lost around $6 million. The bears are fighting over bonuses; the bulls are collecting rent.
The whale is adding to short positions, and more and more bears are gathering overhead. Is ZEC trying to make a comeback?
First, let’s see whether the price can hold above $1,700. There won’t be a market until the bears get squeezed; once they do, that’s when the market will take off.
The macro picture isn’t encouraging either: the Fed meeting minutes are due out this week, the Strait of Hormuz is still closed, and OPEC+ is keeping November oil production unchanged. There are a lot of variables, so don’t rush to conclusions.
The ZEC chart looks like a showdown between bulls and bears. There’s barely room for the bears, like on a crowded rush-hour train, while the bulls calmly count their money at the top.
The whale is at it again, continuing to build up short positions in ZEC: around 15,000 coins worth nearly $19.84 million, opened at $1,340.9, with current profits of about $50,000. A small profit, but the position was taken early.
The top five positions: four shorts and one long, with all the shorts in profit. But looking at the overall picture, the bulls have made about $70 million, while the bears have lost around $6 million. The bears are fighting over bonuses; the bulls are collecting rent.
The whale is adding to short positions, and more and more bears are gathering overhead. Is ZEC trying to make a comeback?
First, let’s see whether the price can hold above $1,700. There won’t be a market until the bears get squeezed; once they do, that’s when the market will take off.
The macro picture isn’t encouraging either: the Fed meeting minutes are due out this week, the Strait of Hormuz is still closed, and OPEC+ is keeping November oil production unchanged. There are a lot of variables, so don’t rush to conclusions.
101
·
--
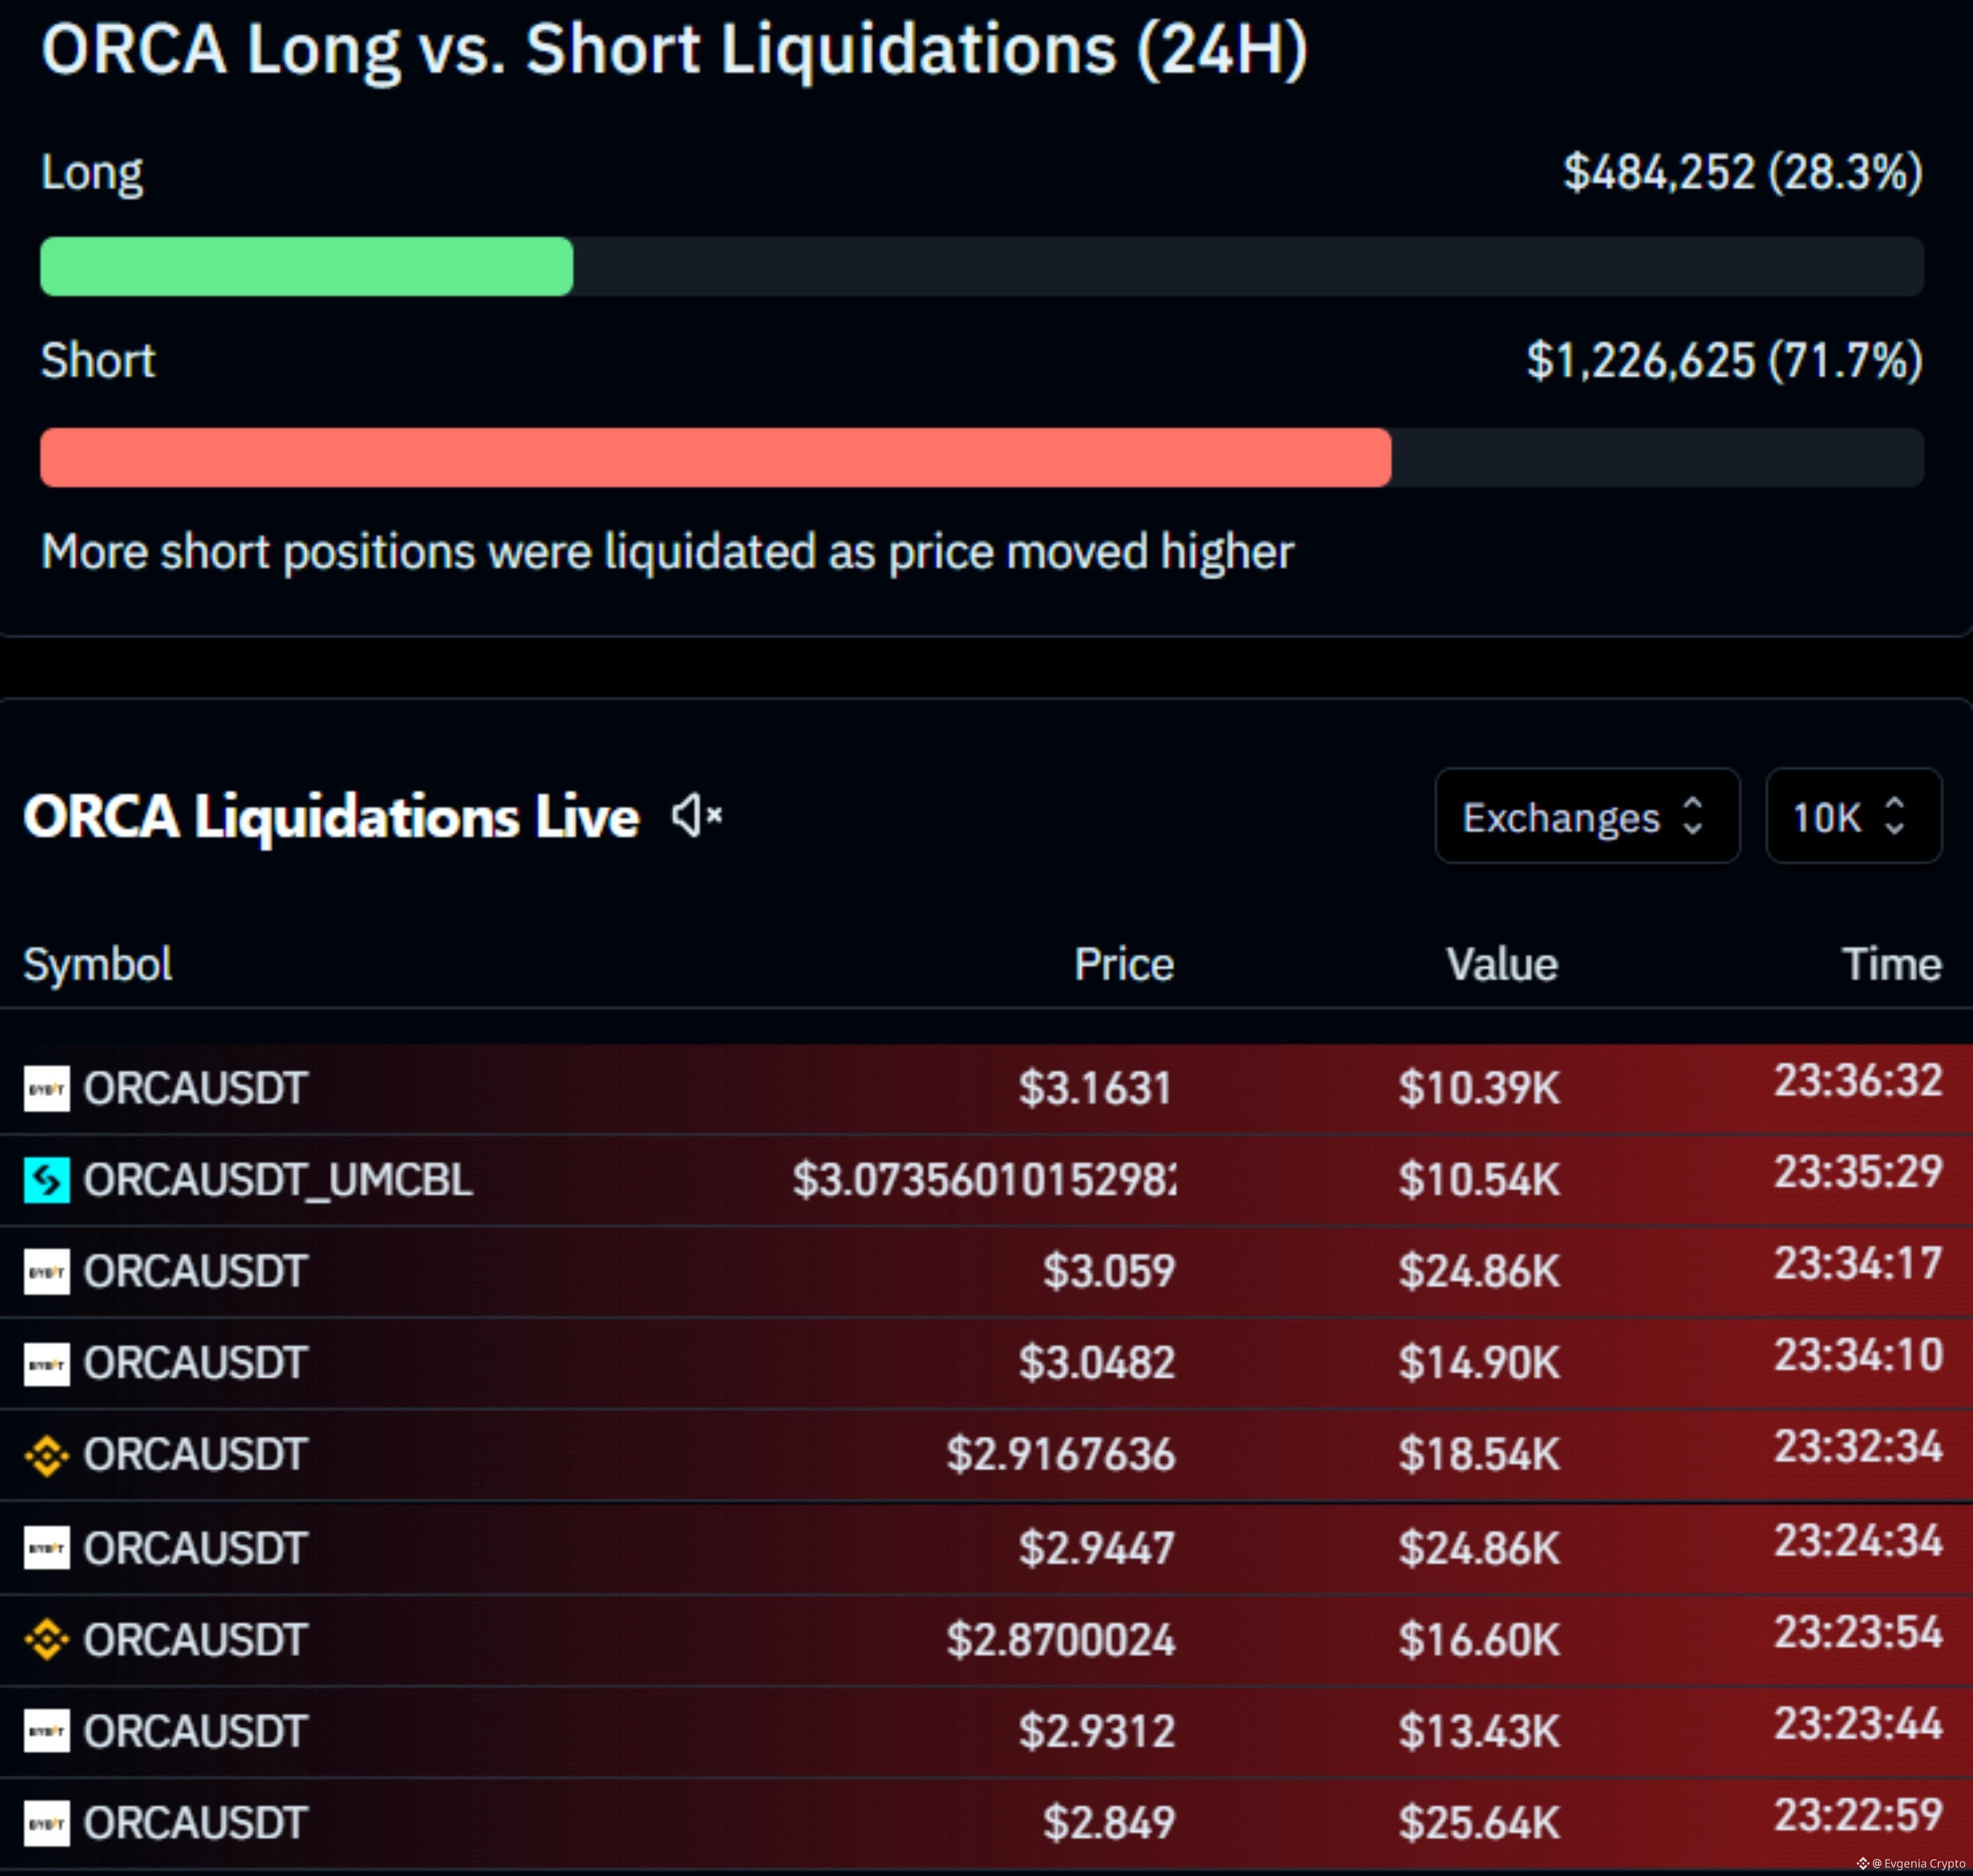
ORCA short sellers are getting absolutely crushed right now, with liquidations coming in hard.
Over the past 24 hours, shorts accounted for 72% of all liquidated positions—that’s more than $1.2 million.
Take a look at the 15-minute or hourly chart—you can already see an interesting pattern emerging. Zoom out to the higher timeframes, and the scale is truly impressive.
The market is punishing anyone who goes against the crowd, but be careful with your risk all the same. Stop-losses are there for a reason.
$ORCA
{future}(ORCAUSDT)
ORCA short sellers are getting absolutely crushed right now, with liquidations coming in hard.
Over the past 24 hours, shorts accounted for 72% of all liquidated positions—that’s more than $1.2 million.
Take a look at the 15-minute or hourly chart—you can already see an interesting pattern emerging. Zoom out to the higher timeframes, and the scale is truly impressive.
The market is punishing anyone who goes against the crowd, but be careful with your risk all the same. Stop-losses are there for a reason.
$ORCA
Over the past 24 hours, shorts accounted for 72% of all liquidated positions—that’s more than $1.2 million.
Take a look at the 15-minute or hourly chart—you can already see an interesting pattern emerging. Zoom out to the higher timeframes, and the scale is truly impressive.
The market is punishing anyone who goes against the crowd, but be careful with your risk all the same. Stop-losses are there for a reason.
$ORCA
1
189
·
--
All their lives, bankers have whined that blockchain lacks the trust needed for large sums, and that you could be left holding the bag.
Solana and J.P. Morgan have put that concern to rest with the DvP settlement standard.
Now tokenized assets and payments are tightly linked through segregated escrow accounts.
The risk of a counterparty cheating you is zero.
And it all happens in seconds, directly on an open network—not in closed corporate sandboxes.
$SOL
{future}(SOLUSDT)
All their lives, bankers have whined that blockchain lacks the trust needed for large sums, and that you could be left holding the bag.
Solana and J.P. Morgan have put that concern to rest with the DvP settlement standard.
Now tokenized assets and payments are tightly linked through segregated escrow accounts.
The risk of a counterparty cheating you is zero.
And it all happens in seconds, directly on an open network—not in closed corporate sandboxes.
$SOL
Solana and J.P. Morgan have put that concern to rest with the DvP settlement standard.
Now tokenized assets and payments are tightly linked through segregated escrow accounts.
The risk of a counterparty cheating you is zero.
And it all happens in seconds, directly on an open network—not in closed corporate sandboxes.
$SOL


1
125
·
--
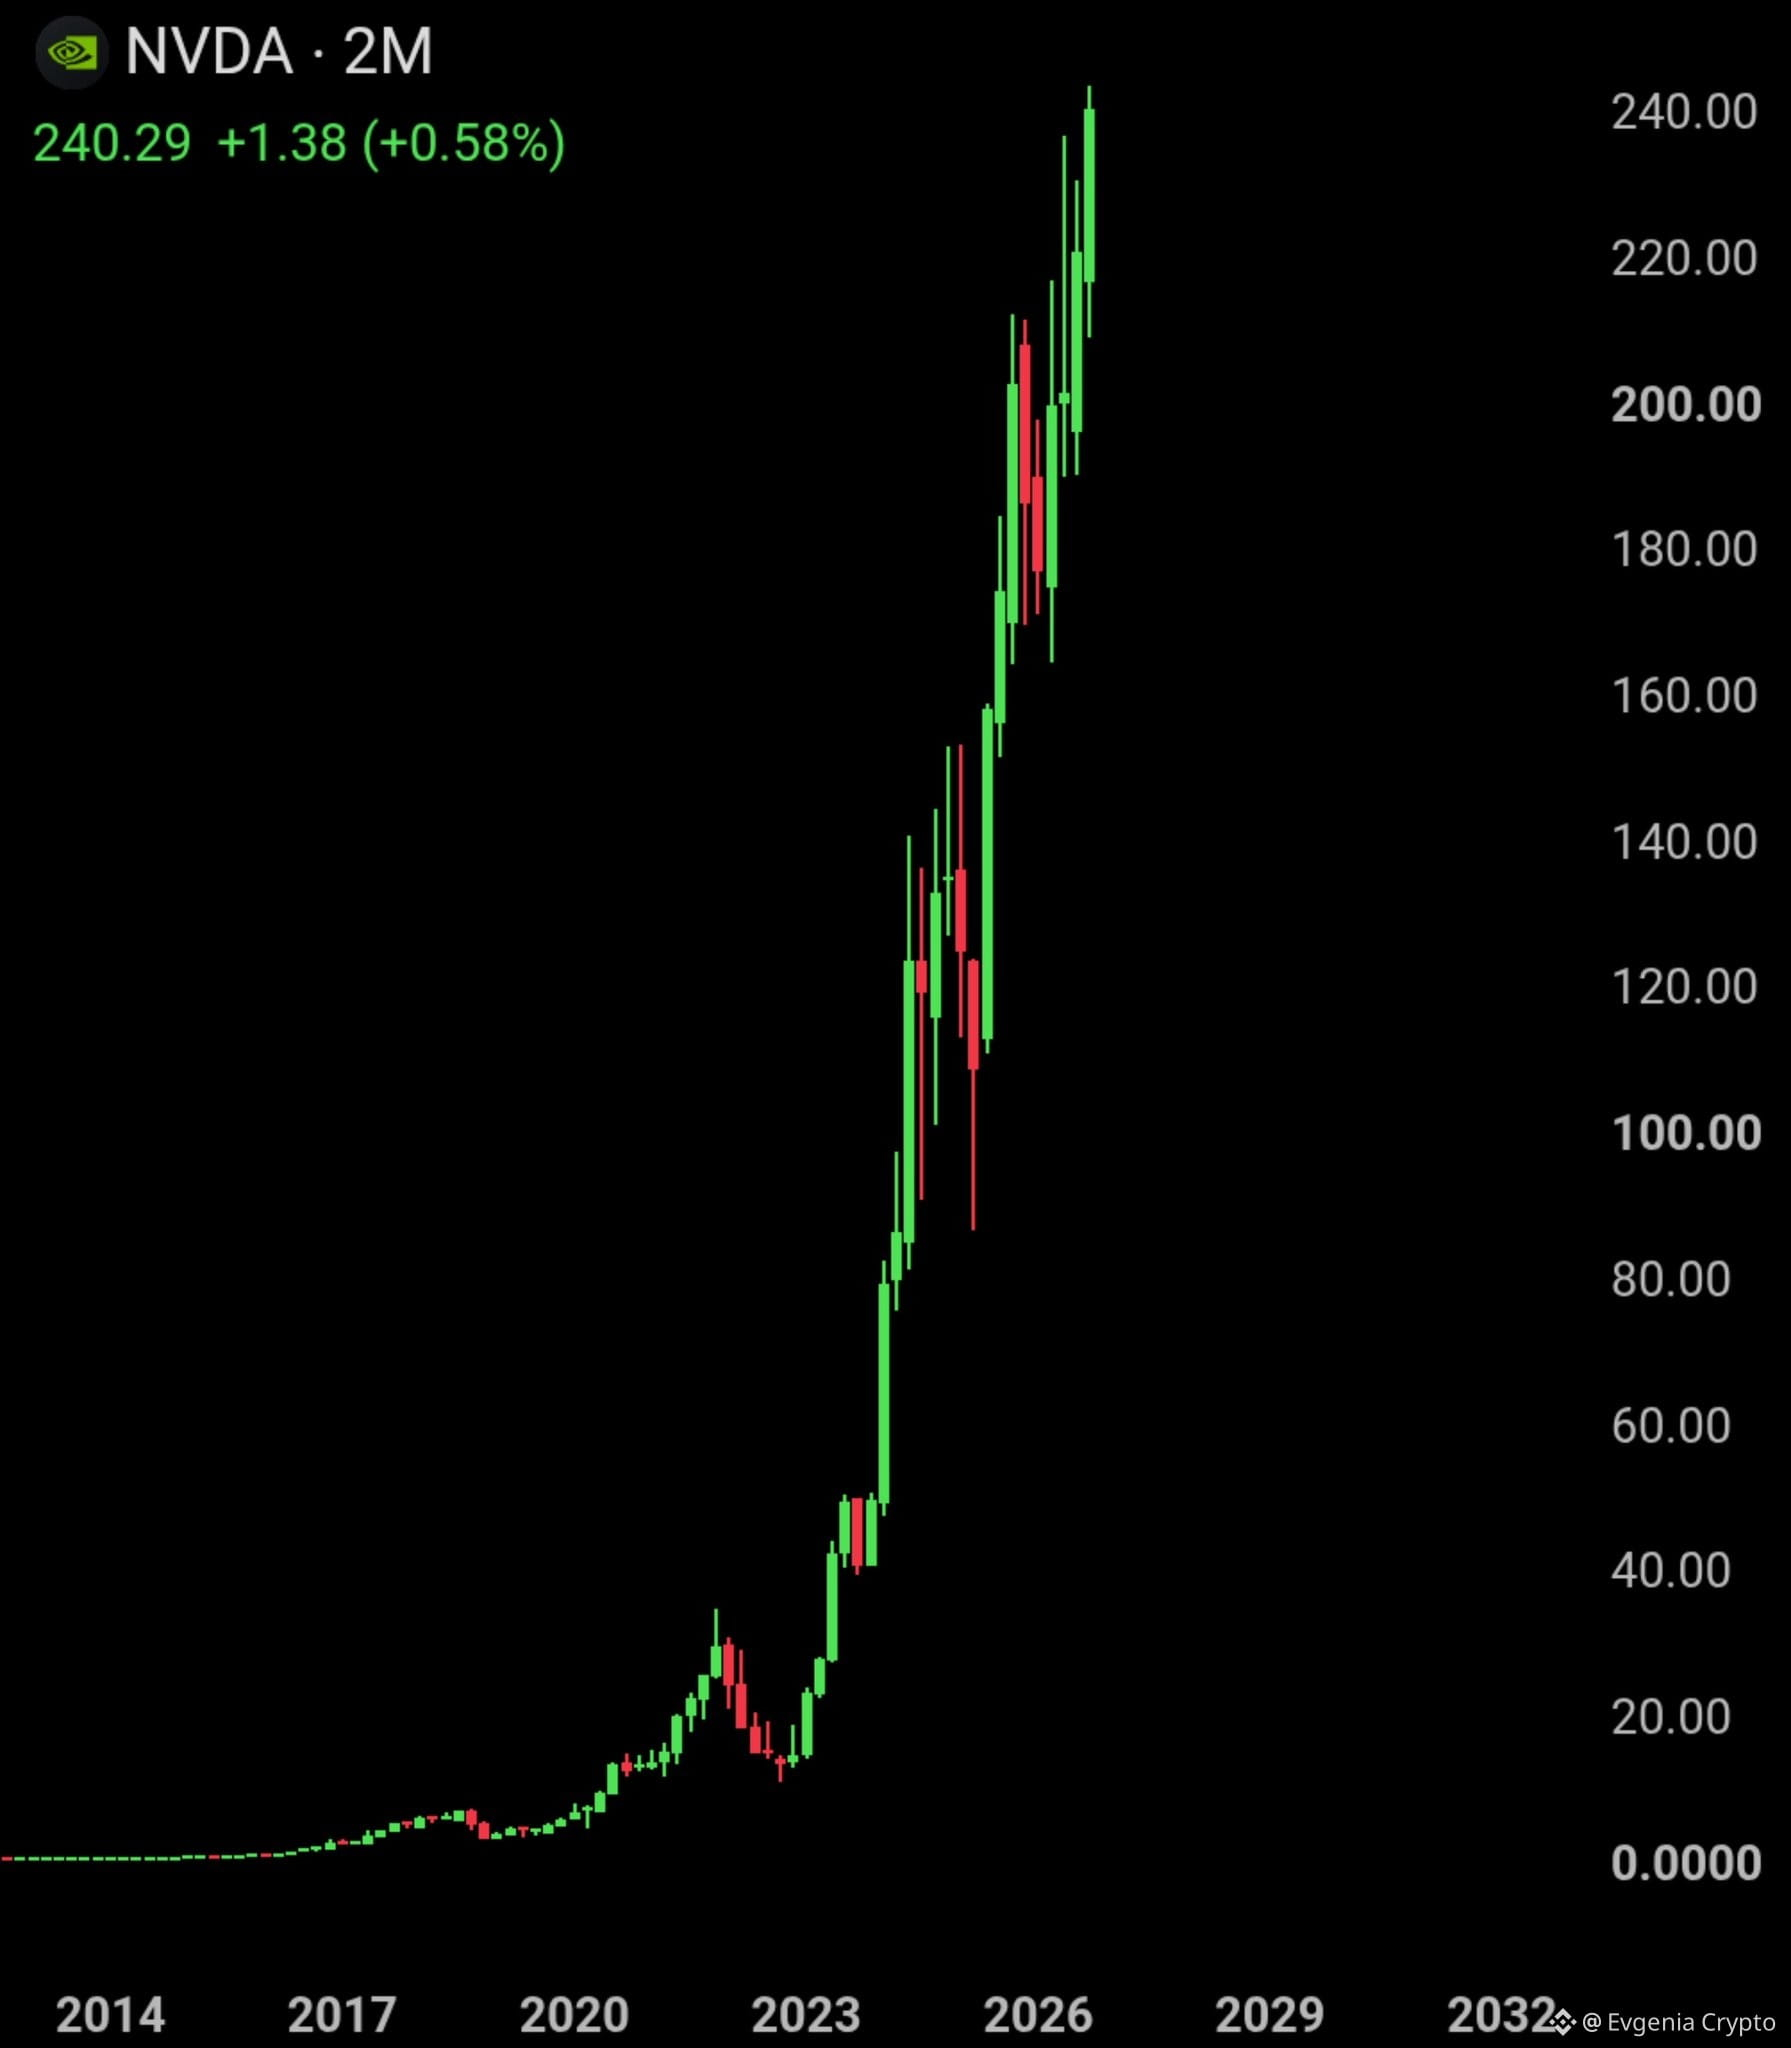
Nvidia is breaking through the ceiling again: $NVDA has hit an all-time high for the first time in its history, reaching $243. The numbers are out of this world—if you had invested just $10,000 in the company’s stock at the bottom of the crisis in 2002, your investment would be worth around $43 million today. That’s the power of long-term compounding and a technological monopoly in action.
Nvidia is breaking through the ceiling again: $NVDA has hit an all-time high for the first time in its history, reaching $243. The numbers are out of this world—if you had invested just $10,000 in the company’s stock at the bottom of the crisis in 2002, your investment would be worth around $43 million today. That’s the power of long-term compounding and a technological monopoly in action.

131
·
--
Network $SEI is upgrading to version v6.7.0 today at block height 236,450,000, making it a great opportunity to take a look under the hood. The upgrade introduces fast LittDB receipt storage, clears out old network clutter and legacy RPC modules, and adds a robust shield against DDoS attacks. Developers are steadily refining the transaction execution engine, making the infrastructure even more reliable.
Network $SEI is upgrading to version v6.7.0 today at block height 236,450,000, making it a great opportunity to take a look under the hood. The upgrade introduces fast LittDB receipt storage, clears out old network clutter and legacy RPC modules, and adds a robust shield against DDoS attacks. Developers are steadily refining the transaction execution engine, making the infrastructure even more reliable.

2
188
·
--
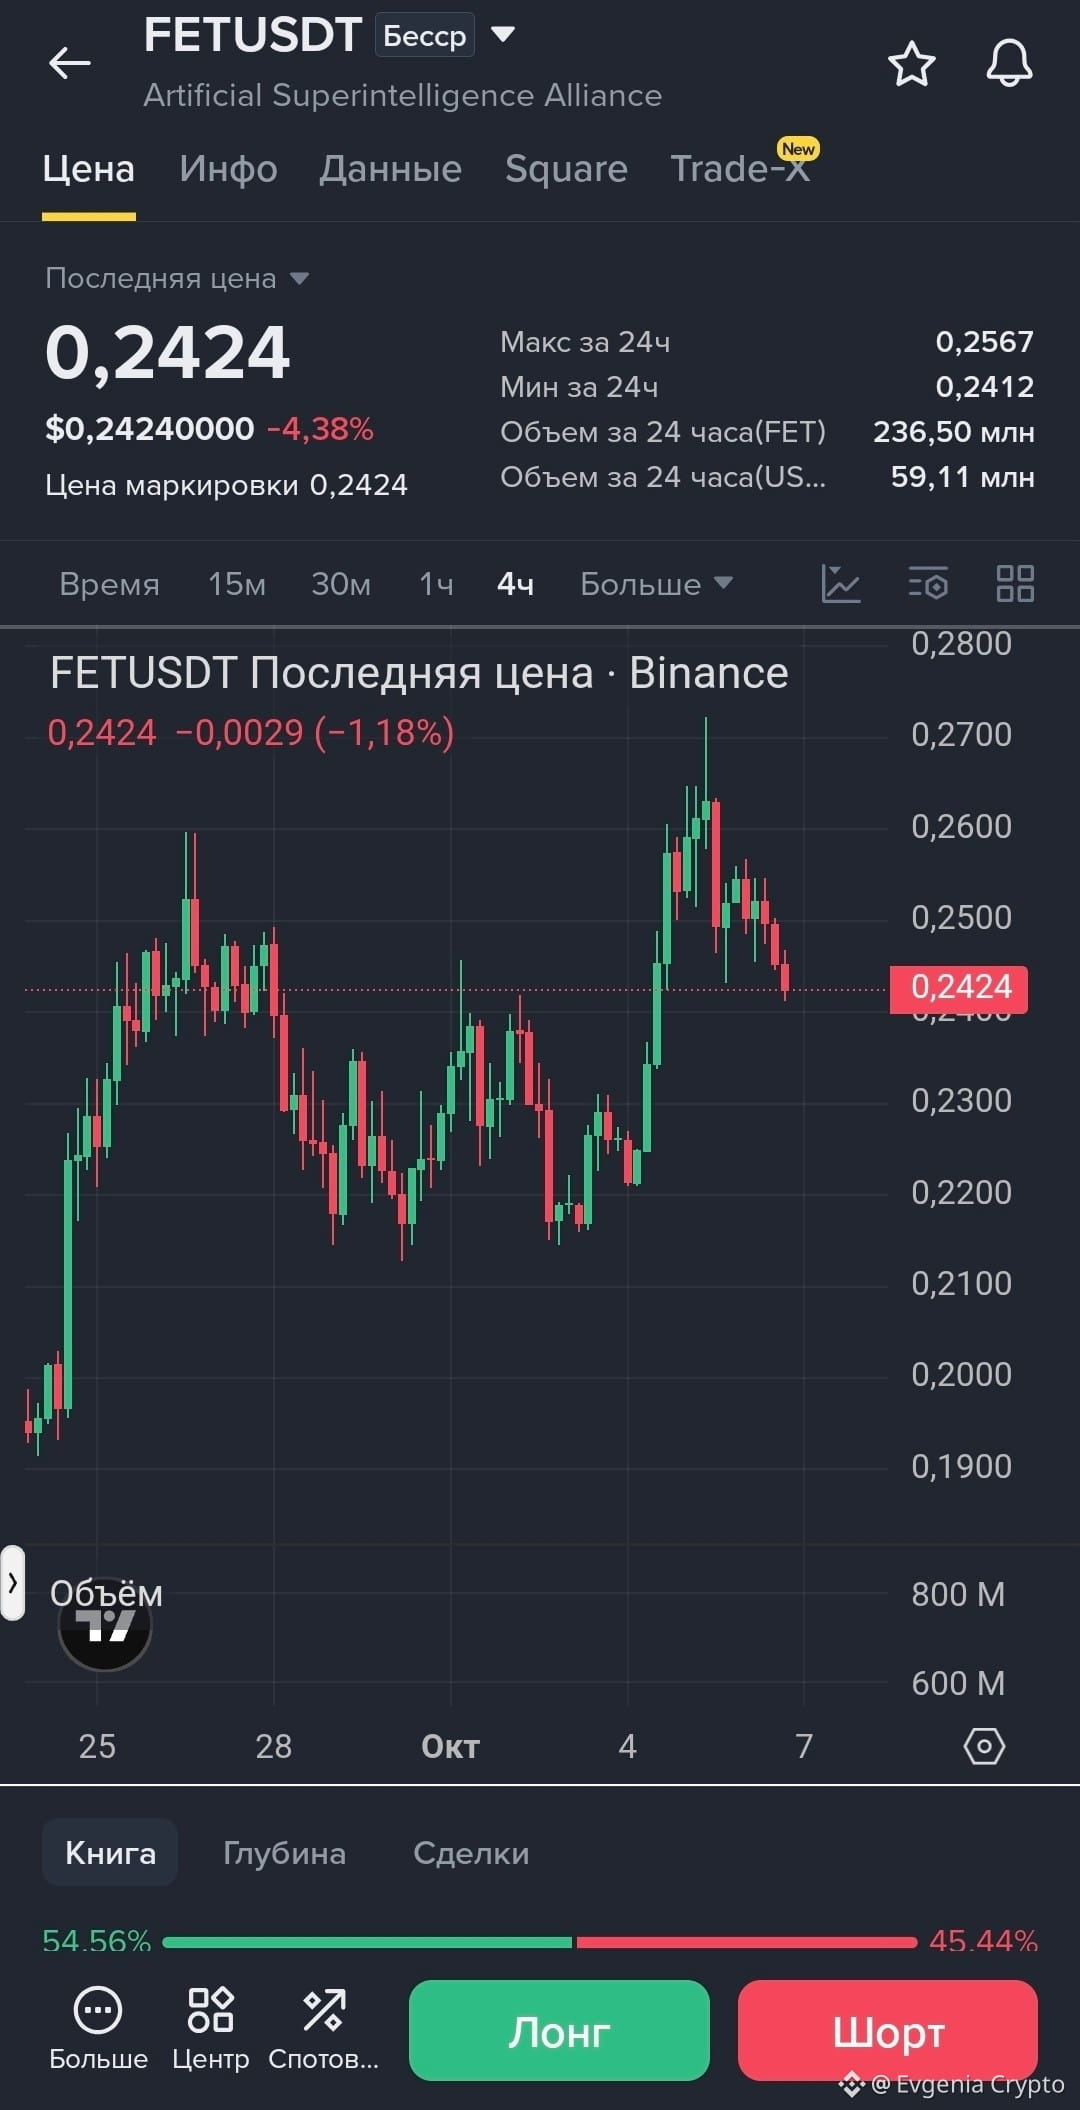
The countertrend short at $FET requires utmost discipline.
Globally, the market and Bitcoin are bullish, but the local hourly structure is clearly pointing down amid buyer passivity.
The ideal entry point is a failed recovery attempt in the 0.2435–0.2478 zone.
We’re watching the order book reaction and waiting for a reversal pattern.
Take profit at 0.2323, 0.2211, and 0.2142. The idea is invalidated if a candle closes above 0.2547.
The countertrend short at $FET requires utmost discipline.
Globally, the market and Bitcoin are bullish, but the local hourly structure is clearly pointing down amid buyer passivity.
The ideal entry point is a failed recovery attempt in the 0.2435–0.2478 zone.
We’re watching the order book reaction and waiting for a reversal pattern.
Take profit at 0.2323, 0.2211, and 0.2142. The idea is invalidated if a candle closes above 0.2547.
Globally, the market and Bitcoin are bullish, but the local hourly structure is clearly pointing down amid buyer passivity.
The ideal entry point is a failed recovery attempt in the 0.2435–0.2478 zone.
We’re watching the order book reaction and waiting for a reversal pattern.
Take profit at 0.2323, 0.2211, and 0.2142. The idea is invalidated if a candle closes above 0.2547.
1
102
·
--
San Francisco Federal Reserve's Daly made it very clear this evening: if the pressure on price growth from AI, tariffs, and energy doesn't ease, the Fed may have to continue raising rates.
Those working with leverage shouldn't ignore this.
Positions in $BTC and $ETH have been sitting unchanged for a week. Many think they're holding firm, but they're not. What really allows you to hold on is this chain: war pushes oil prices up, oil restrains inflation, inflation forces rates higher, risk-free money becomes more expensive, and risky assets lose confidence in their growth.
So if a conflict breaks out in the Middle East, don't automatically shout, “Buy crypto as a hedge.” As long as expectations of rate hikes haven't eased, this is more of a burden for the bulls. Until the trend breaks, I'm in no hurry to act..
$CL
San Francisco Federal Reserve's Daly made it very clear this evening: if the pressure on price growth from AI, tariffs, and energy doesn't ease, the Fed may have to continue raising rates.
Those working with leverage shouldn't ignore this.
Positions in $BTC and $ETH have been sitting unchanged for a week. Many think they're holding firm, but they're not. What really allows you to hold on is this chain: war pushes oil prices up, oil restrains inflation, inflation forces rates higher, risk-free money becomes more expensive, and risky assets lose confidence in their growth.
So if a conflict breaks out in the Middle East, don't automatically shout, “Buy crypto as a hedge.” As long as expectations of rate hikes haven't eased, this is more of a burden for the bulls. Until the trend breaks, I'm in no hurry to act..
$CL
Those working with leverage shouldn't ignore this.
Positions in $BTC and $ETH have been sitting unchanged for a week. Many think they're holding firm, but they're not. What really allows you to hold on is this chain: war pushes oil prices up, oil restrains inflation, inflation forces rates higher, risk-free money becomes more expensive, and risky assets lose confidence in their growth.
So if a conflict breaks out in the Middle East, don't automatically shout, “Buy crypto as a hedge.” As long as expectations of rate hikes haven't eased, this is more of a burden for the bulls. Until the trend breaks, I'm in no hurry to act..
$CL
87
·
--
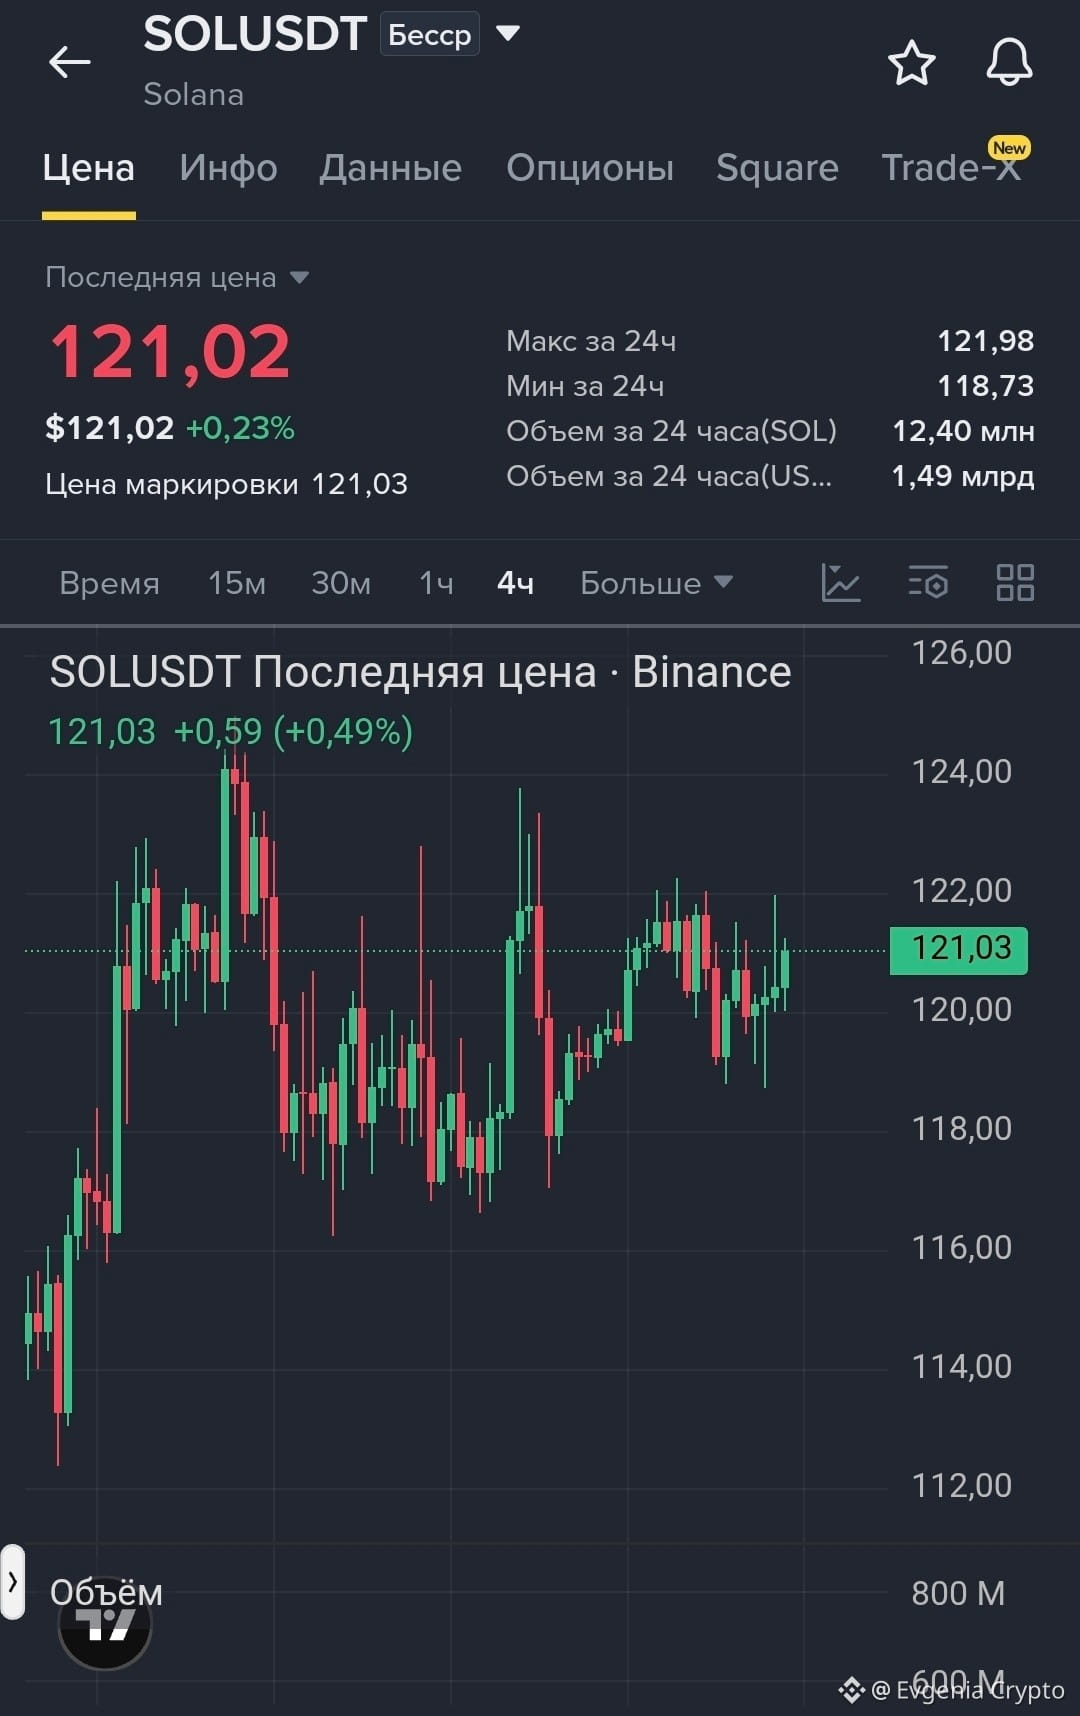
Solana has bounced decisively off the key zone around $120.20, and buyers are taking the initiative again. Momentum looks strong, so I expect the uptrend to continue.
I’m building a long position in the 120.80–121.25 range. I’ve staggered the targets: TP1 at 121.80, TP2 at 122.40, and final TP3 at 123.00. Keep protection below 120.10. Risk is under tight control; we’re trading with the trend.
$SOL
{future}(SOLUSDT)
Solana has bounced decisively off the key zone around $120.20, and buyers are taking the initiative again. Momentum looks strong, so I expect the uptrend to continue.
I’m building a long position in the 120.80–121.25 range. I’ve staggered the targets: TP1 at 121.80, TP2 at 122.40, and final TP3 at 123.00. Keep protection below 120.10. Risk is under tight control; we’re trading with the trend.
$SOL
I’m building a long position in the 120.80–121.25 range. I’ve staggered the targets: TP1 at 121.80, TP2 at 122.40, and final TP3 at 123.00. Keep protection below 120.10. Risk is under tight control; we’re trading with the trend.
$SOL
119
·
--
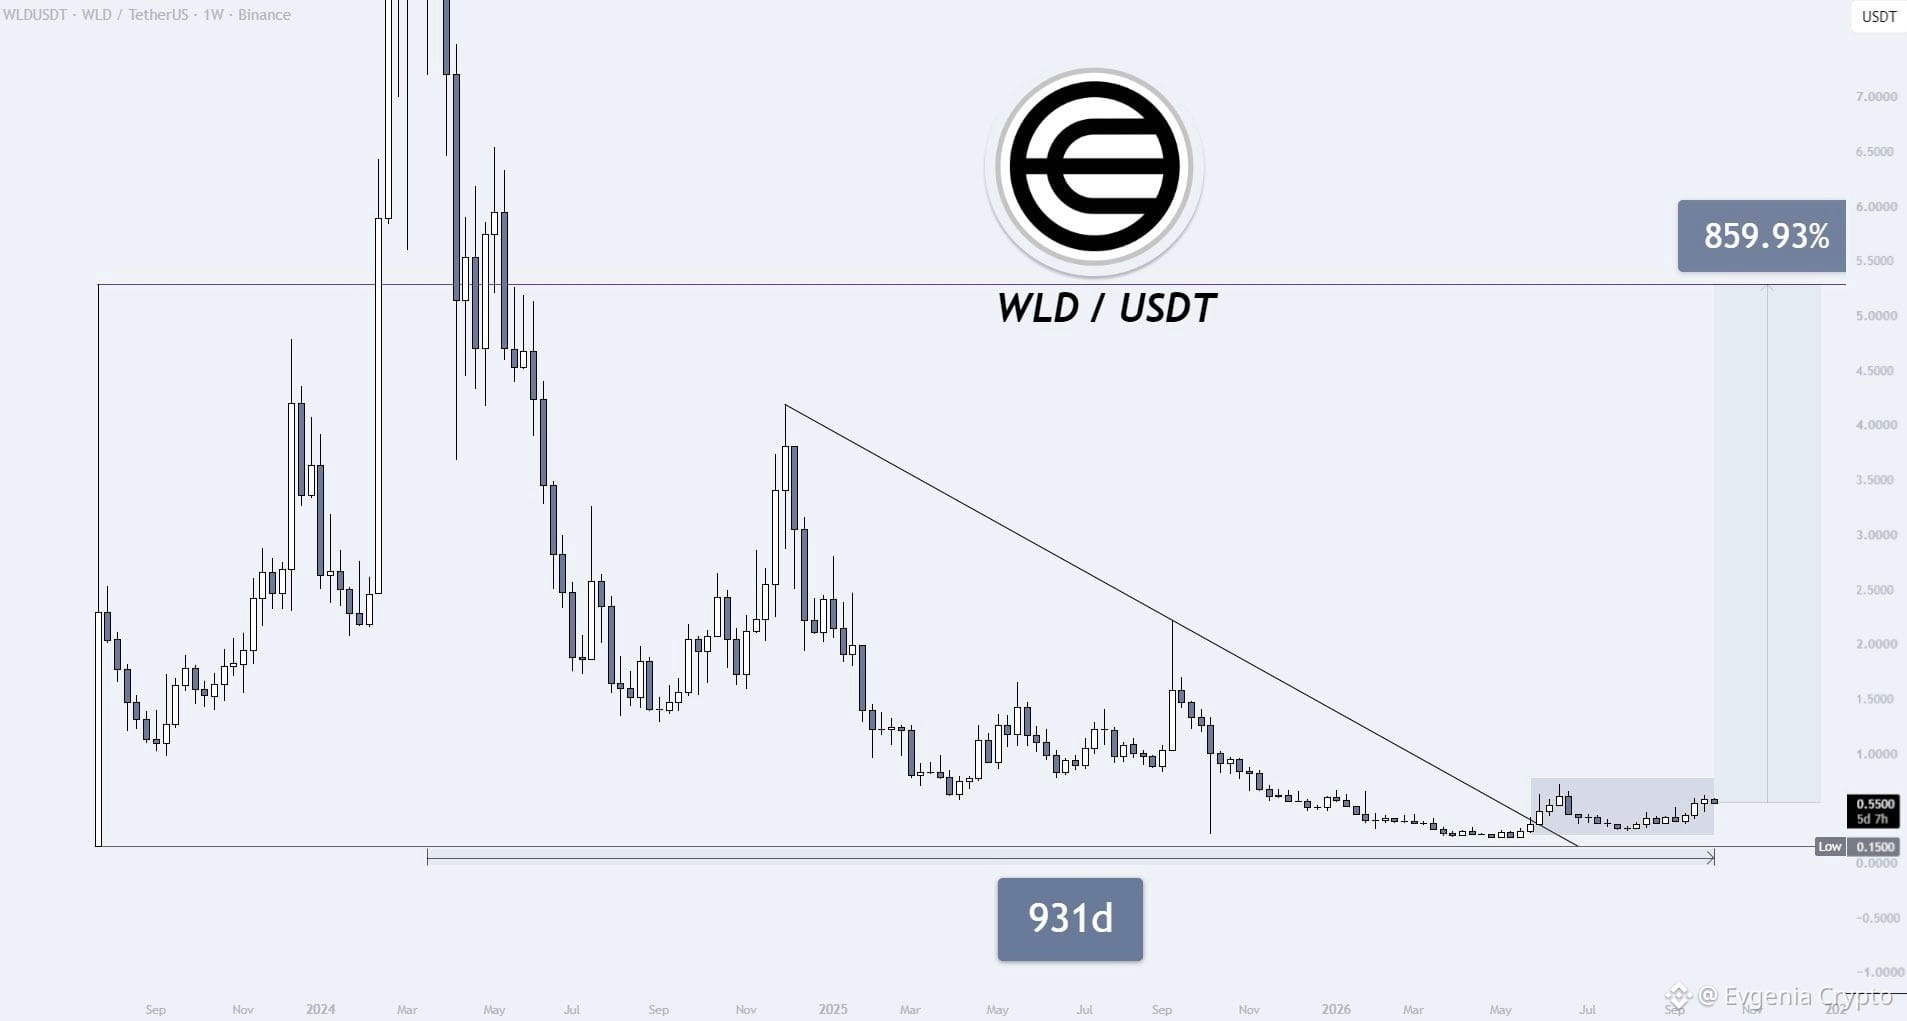
$WLD has been in a correction for 930 days.
During that time, the price managed to set a new all-time low, and now it’s starting to break through the monthly trendline for the first time.
To me, this no longer looks like an ordinary bounce—more like an attempt by the market to break free from years of pressure.
While most people continue to call $WLD a scam, the chart is gradually building a base.
My levels:
$2.25 → $4.00 → $5.42 → $6.63
There’s no guarantee the market will follow this scenario. But if accumulation really is complete, the upside potential here looks very different.
{future}(WLDUSDT)
$WLD has been in a correction for 930 days.
During that time, the price managed to set a new all-time low, and now it’s starting to break through the monthly trendline for the first time.
To me, this no longer looks like an ordinary bounce—more like an attempt by the market to break free from years of pressure.
While most people continue to call $WLD a scam, the chart is gradually building a base.
My levels:
$2.25 → $4.00 → $5.42 → $6.63
There’s no guarantee the market will follow this scenario. But if accumulation really is complete, the upside potential here looks very different.
During that time, the price managed to set a new all-time low, and now it’s starting to break through the monthly trendline for the first time.
To me, this no longer looks like an ordinary bounce—more like an attempt by the market to break free from years of pressure.
While most people continue to call $WLD a scam, the chart is gradually building a base.
My levels:
$2.25 → $4.00 → $5.42 → $6.63
There’s no guarantee the market will follow this scenario. But if accumulation really is complete, the upside potential here looks very different.
1
134
·
--
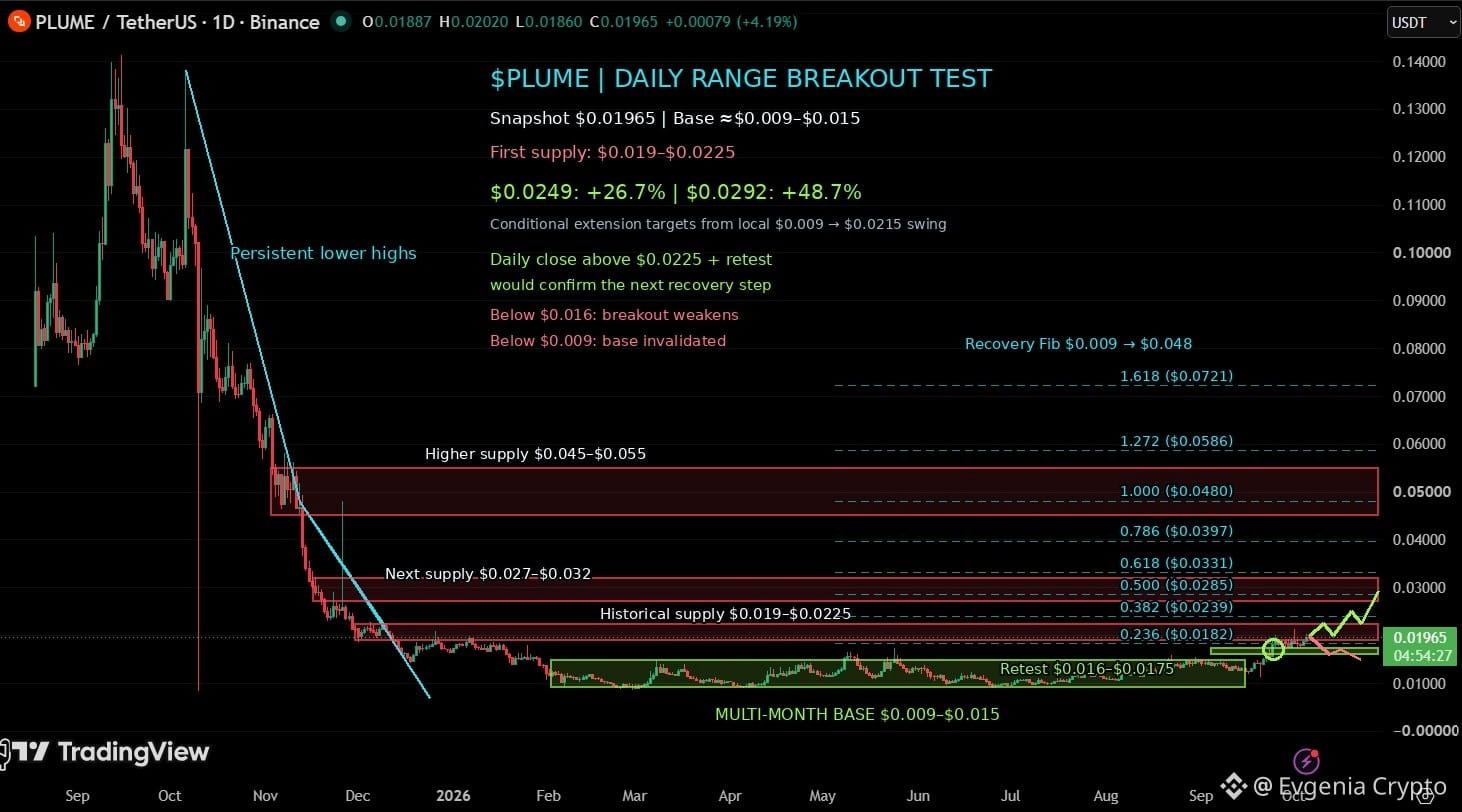
$PLUME is now sitting literally between the old base and the new trend.
Below is $0.016–$0.0175, the level that needs to prove buyers have really taken control.
Above is $0.019–$0.0225, a historical supply zone where sellers already know the price.
If $PLUME breaks through $0.0225, closes the day above it, and then calmly comes back to retest it, I’d be looking for a continuation toward $0.0249 and $0.027–$0.032.
And $0.0292 lands almost perfectly on the local 1.618.
That’s when the first recovery push could turn into more than just a bounce—it could become a full-fledged series of higher lows.
For now, though, the key level for me is $0.016. Losing it would significantly damage the whole setup.
$PLUME is now sitting literally between the old base and the new trend.
Below is $0.016–$0.0175, the level that needs to prove buyers have really taken control.
Above is $0.019–$0.0225, a historical supply zone where sellers already know the price.
If $PLUME breaks through $0.0225, closes the day above it, and then calmly comes back to retest it, I’d be looking for a continuation toward $0.0249 and $0.027–$0.032.
And $0.0292 lands almost perfectly on the local 1.618.
That’s when the first recovery push could turn into more than just a bounce—it could become a full-fledged series of higher lows.
For now, though, the key level for me is $0.016. Losing it would significantly damage the whole setup.
Below is $0.016–$0.0175, the level that needs to prove buyers have really taken control.
Above is $0.019–$0.0225, a historical supply zone where sellers already know the price.
If $PLUME breaks through $0.0225, closes the day above it, and then calmly comes back to retest it, I’d be looking for a continuation toward $0.0249 and $0.027–$0.032.
And $0.0292 lands almost perfectly on the local 1.618.
That’s when the first recovery push could turn into more than just a bounce—it could become a full-fledged series of higher lows.
For now, though, the key level for me is $0.016. Losing it would significantly damage the whole setup.
90
·
--
Father$BTC has been holding around 86,000 for a whole week now. Intraday volatility has narrowed to two percent, and the market is unusually calm.
Someone asks whether it’s hard to hold short positions at a time like this, but I feel the opposite.
What scares me most is when the price keeps jumping around and throwing me off. A sideways market, on the other hand, lets me sleep peacefully.
Volatility this compressed can’t last forever; sooner or later, the market will pick a direction.
My reasoning is that in this wave, all risk assets are rising except the crypto market, and such a divergence doesn’t happen without a reason.
As long as $ETH , this high-beta asset, hasn’t broken through the level, I’ll keep holding my position unchanged.
What do you think—should we wait for a breakout, or is it time to get in?
Father$BTC has been holding around 86,000 for a whole week now. Intraday volatility has narrowed to two percent, and the market is unusually calm.
Someone asks whether it’s hard to hold short positions at a time like this, but I feel the opposite.
What scares me most is when the price keeps jumping around and throwing me off. A sideways market, on the other hand, lets me sleep peacefully.
Volatility this compressed can’t last forever; sooner or later, the market will pick a direction.
My reasoning is that in this wave, all risk assets are rising except the crypto market, and such a divergence doesn’t happen without a reason.
As long as $ETH , this high-beta asset, hasn’t broken through the level, I’ll keep holding my position unchanged.
What do you think—should we wait for a breakout, or is it time to get in?
Someone asks whether it’s hard to hold short positions at a time like this, but I feel the opposite.
What scares me most is when the price keeps jumping around and throwing me off. A sideways market, on the other hand, lets me sleep peacefully.
Volatility this compressed can’t last forever; sooner or later, the market will pick a direction.
My reasoning is that in this wave, all risk assets are rising except the crypto market, and such a divergence doesn’t happen without a reason.
As long as $ETH , this high-beta asset, hasn’t broken through the level, I’ll keep holding my position unchanged.
What do you think—should we wait for a breakout, or is it time to get in?
72
·
--
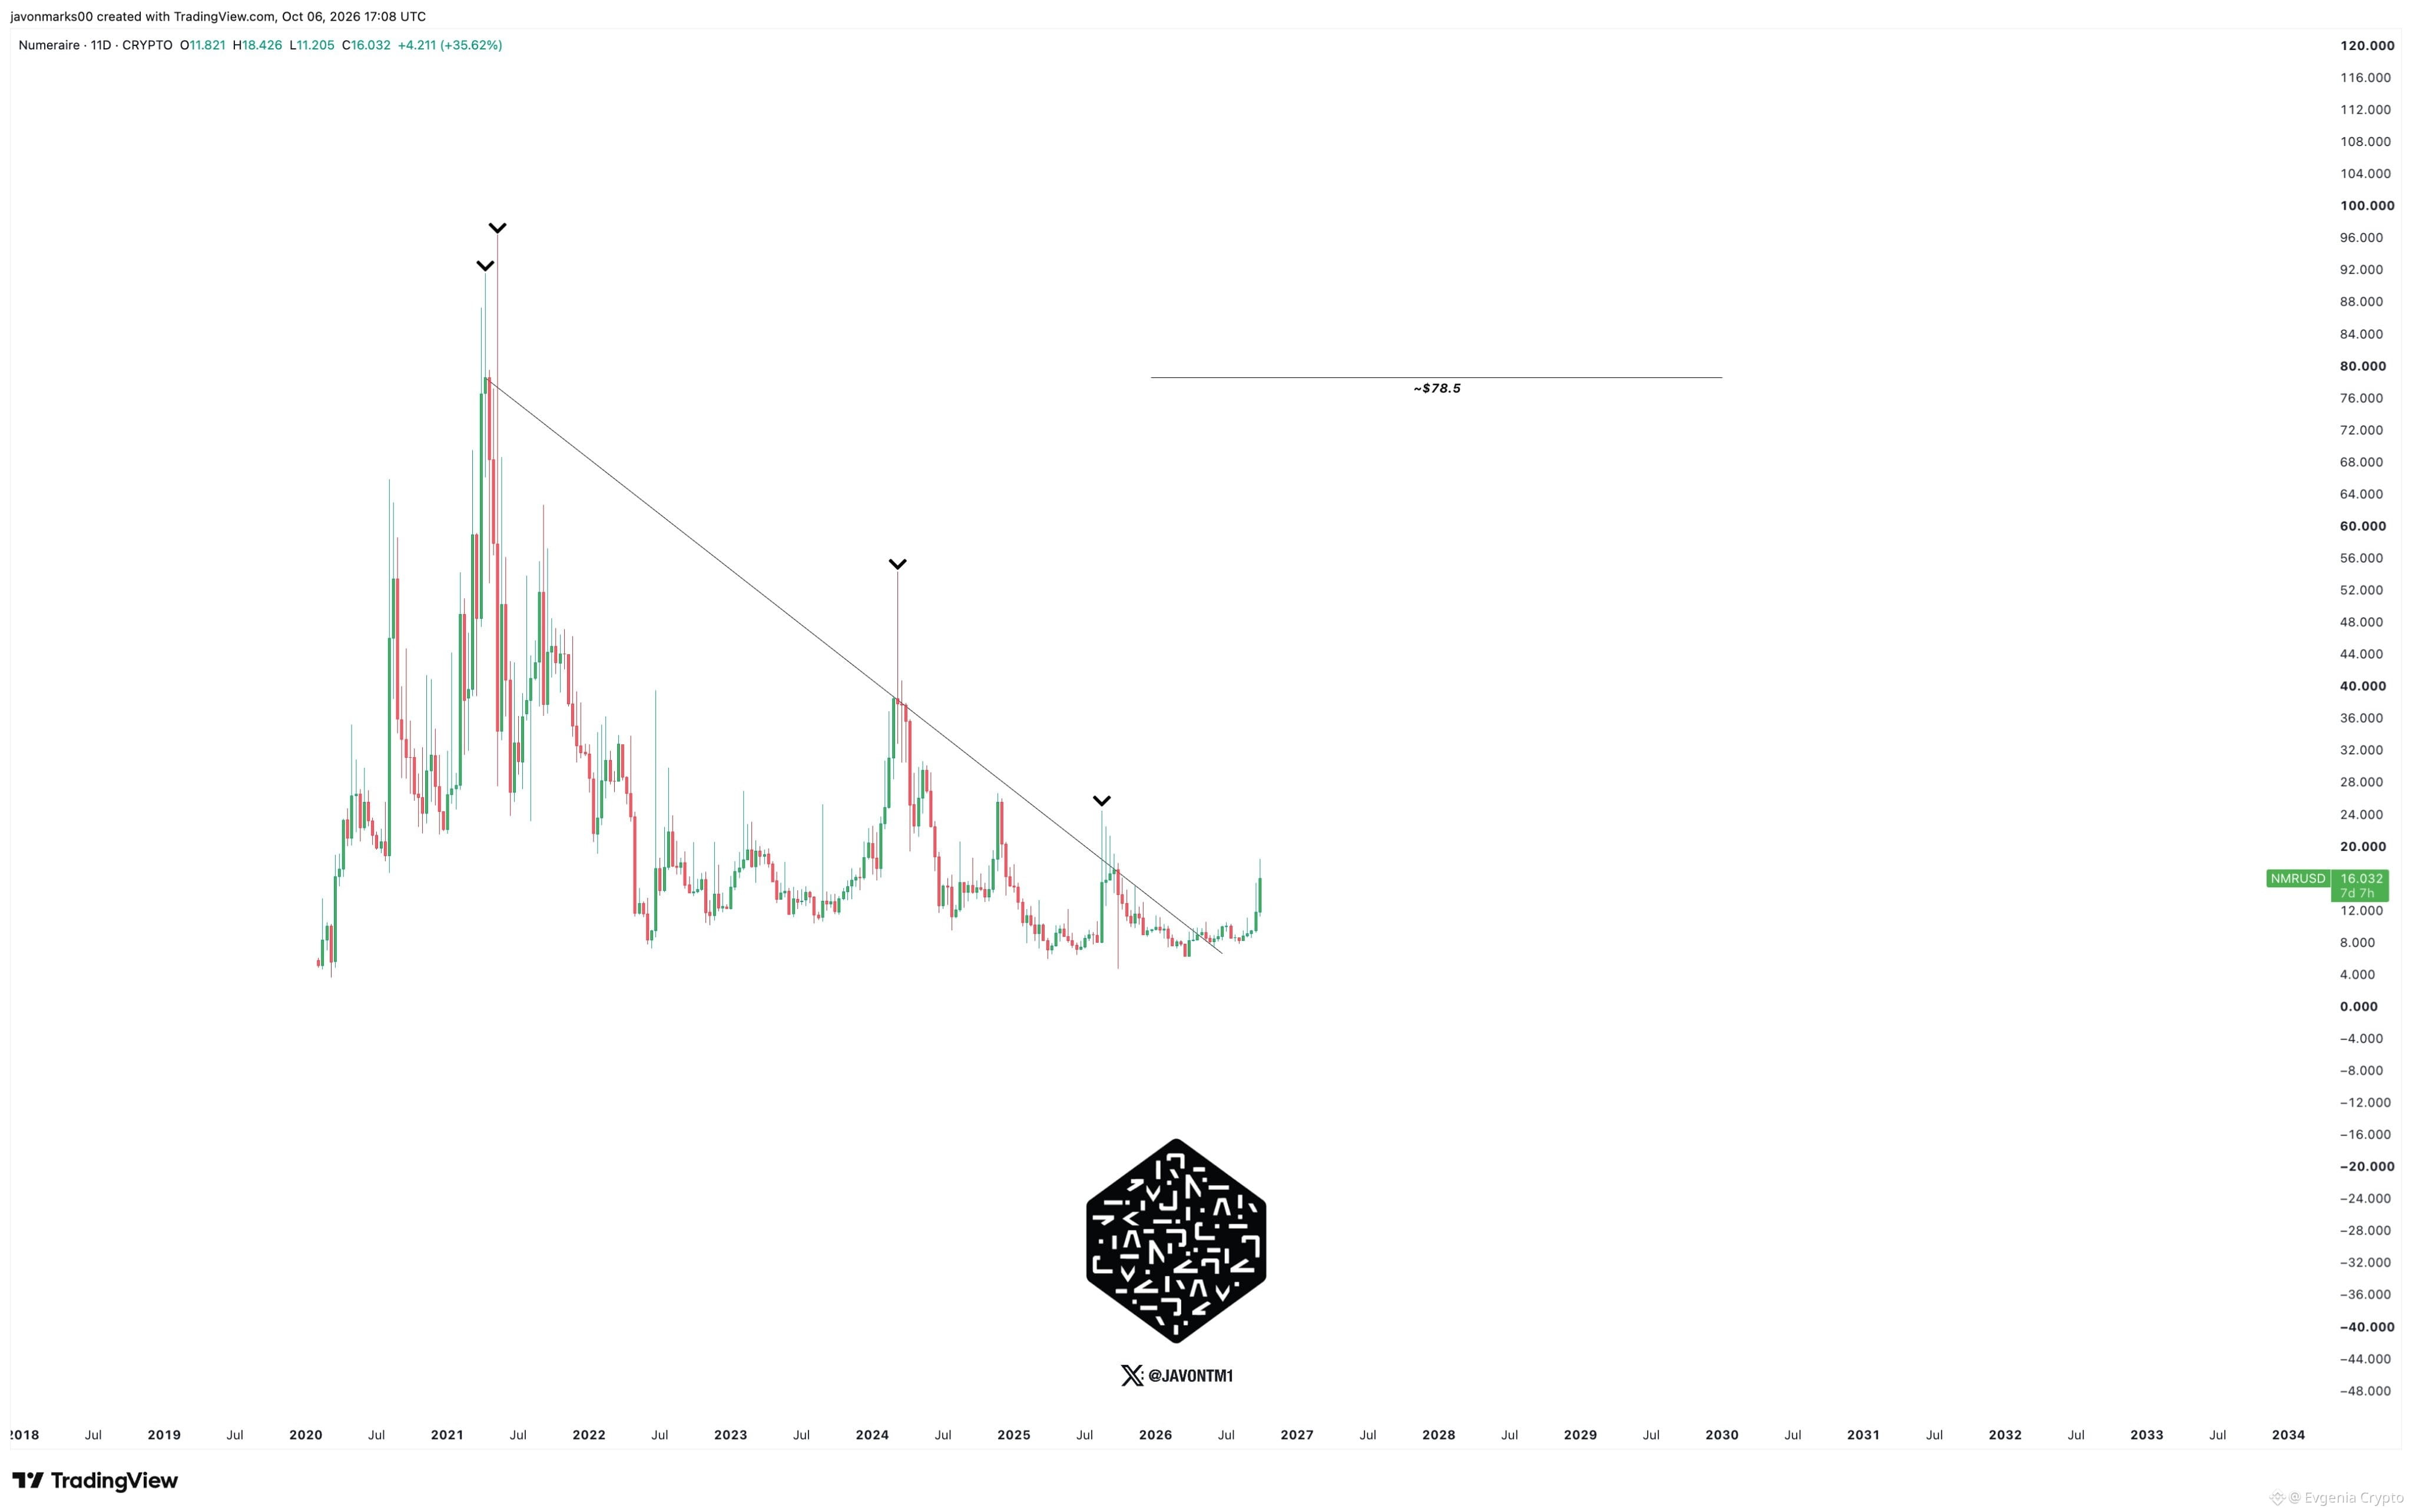
$NMR woke up exactly where it should have.
After the recent breakout, the price continues to move higher, and attention is now shifting to the $78.5 target.
That’s still about +371% from current levels.
I wouldn’t take this as a prediction that the price has to get there, but if the breakout proves genuine, there really is room for a very strong continuation.
$NMR woke up exactly where it should have.
After the recent breakout, the price continues to move higher, and attention is now shifting to the $78.5 target.
That’s still about +371% from current levels.
I wouldn’t take this as a prediction that the price has to get there, but if the breakout proves genuine, there really is room for a very strong continuation.
After the recent breakout, the price continues to move higher, and attention is now shifting to the $78.5 target.
That’s still about +371% from current levels.
I wouldn’t take this as a prediction that the price has to get there, but if the breakout proves genuine, there really is room for a very strong continuation.
1
168
·
--
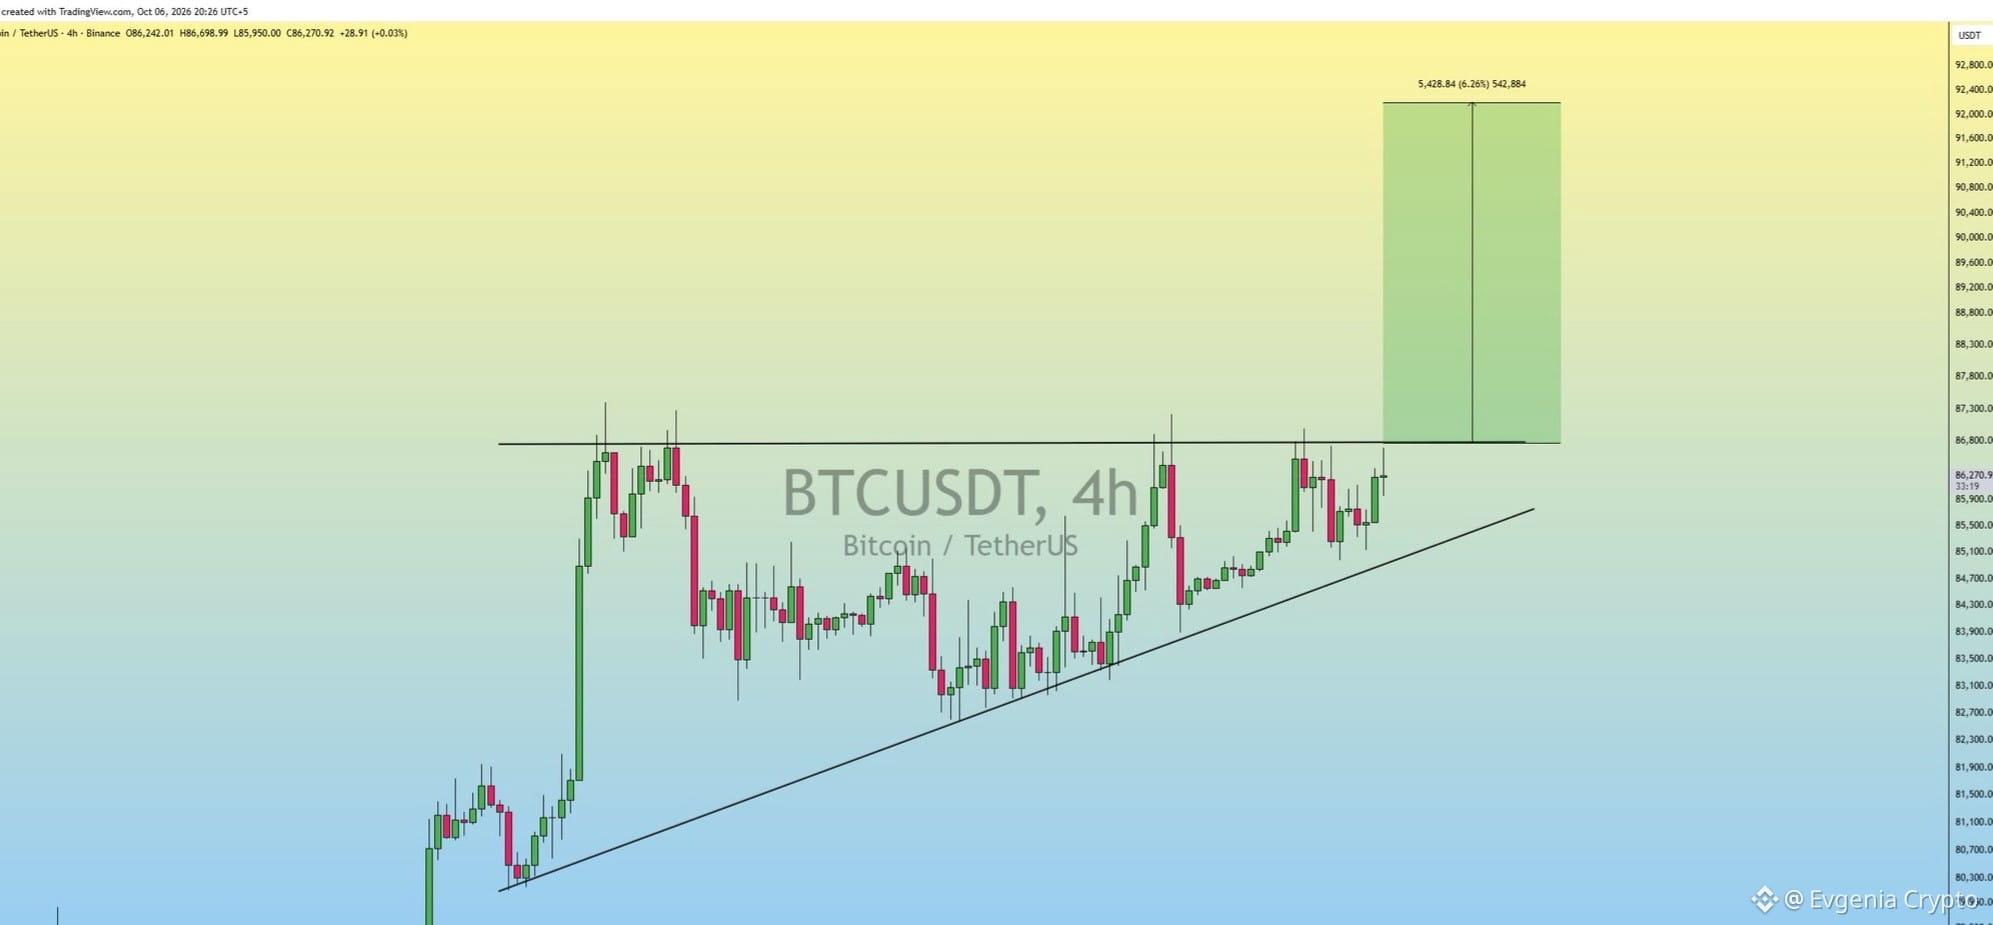
Bitcoin is on the verge of a bullish breakout from the ascending triangle on the chart.
Market conditions look highly favorable, with buyers pressing against the upper resistance boundary.
If this level breaks with momentum, the path opens straight to our main interim target — the 92k level.
I’m waiting for volume confirmation before setting new local highs.
The bulls are ready to take the initiative.
$BTC
{future}(BTCUSDT)
Bitcoin is on the verge of a bullish breakout from the ascending triangle on the chart.
Market conditions look highly favorable, with buyers pressing against the upper resistance boundary.
If this level breaks with momentum, the path opens straight to our main interim target — the 92k level.
I’m waiting for volume confirmation before setting new local highs.
The bulls are ready to take the initiative.
$BTC
Market conditions look highly favorable, with buyers pressing against the upper resistance boundary.
If this level breaks with momentum, the path opens straight to our main interim target — the 92k level.
I’m waiting for volume confirmation before setting new local highs.
The bulls are ready to take the initiative.
$BTC
2
163
·
--
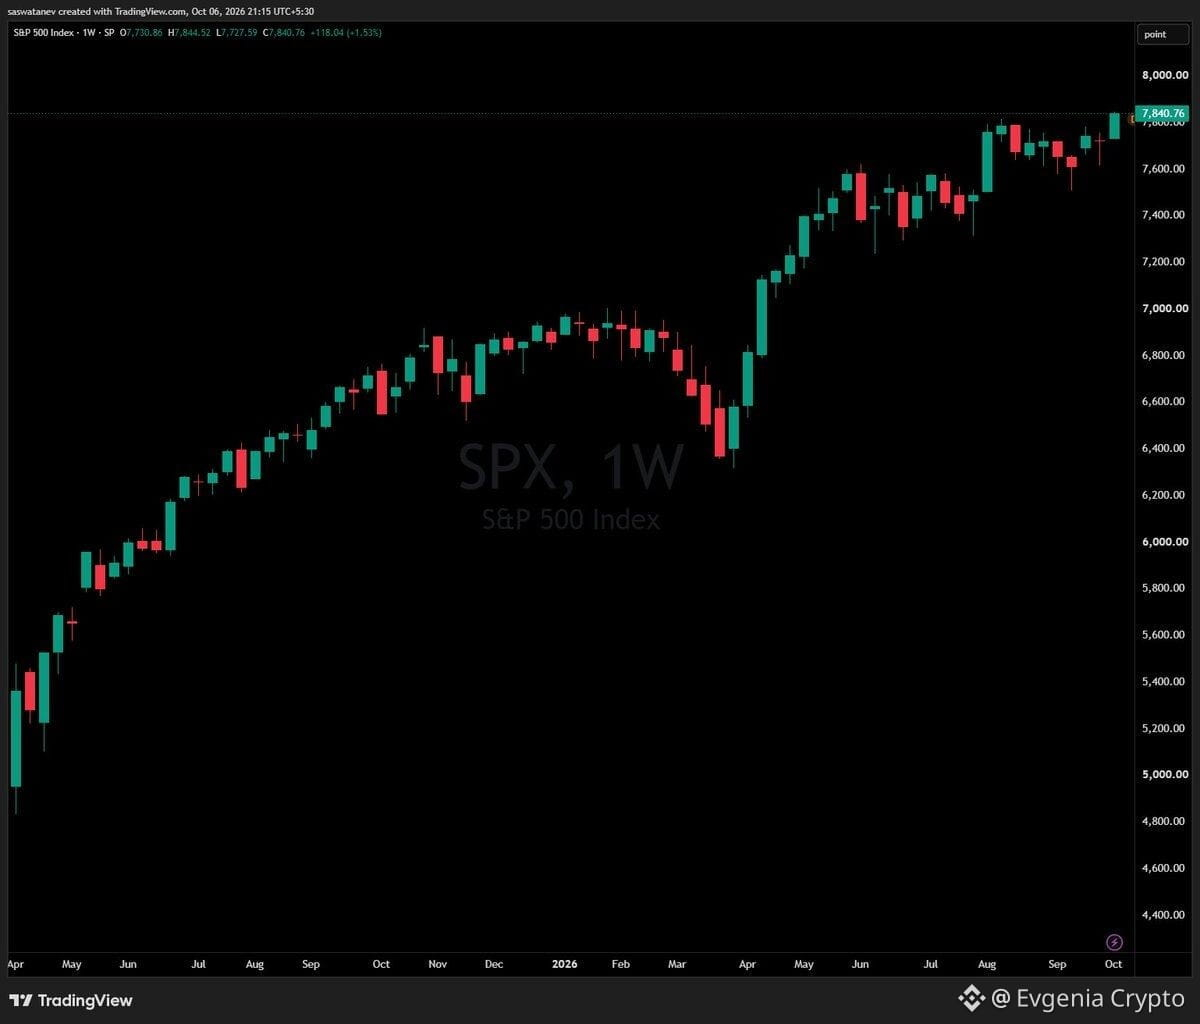
The S&P 500 is at all-time highs. I believe the real downturn is still ahead.
Everyone is watching the highs.
I’m watching the 200 EMA, which is MUCH lower.
And history keeps pointing to the same outcome.
In 16 of the last 17 midterm election years, the market eventually came back to test the 200 EMA.
Every rally before that test seemed safe.
Until it wasn’t.
This time, a similar move would mean roughly a 25% correction from the highs.
That’s the move I’m preparing for.
$SPY
The S&P 500 is at all-time highs. I believe the real downturn is still ahead.
Everyone is watching the highs.
I’m watching the 200 EMA, which is MUCH lower.
And history keeps pointing to the same outcome.
In 16 of the last 17 midterm election years, the market eventually came back to test the 200 EMA.
Every rally before that test seemed safe.
Until it wasn’t.
This time, a similar move would mean roughly a 25% correction from the highs.
That’s the move I’m preparing for.
$SPY
Everyone is watching the highs.
I’m watching the 200 EMA, which is MUCH lower.
And history keeps pointing to the same outcome.
In 16 of the last 17 midterm election years, the market eventually came back to test the 200 EMA.
Every rally before that test seemed safe.
Until it wasn’t.
This time, a similar move would mean roughly a 25% correction from the highs.
That’s the move I’m preparing for.
$SPY
144
·
--
Bullish momentum on $RAVE looks strong: open interest is high, and Bitcoin is helping the buyers.
But the RSI is already overheated, so I’m not chasing the price.
The strategy is simple: I’m waiting for a pullback into the 0.1927–0.1950 range—this is our FVG and the zone of the previous breakout.
There, I’ll wait for a pin bar or a strong reaction from buyers.
I’m scaling out of take-profits at 0.1970, 0.2034, and a final target at 0.2175. A move below 0.1841 immediately invalidates the setup.
{future}(RAVEUSDT)
Bullish momentum on $RAVE looks strong: open interest is high, and Bitcoin is helping the buyers.
But the RSI is already overheated, so I’m not chasing the price.
The strategy is simple: I’m waiting for a pullback into the 0.1927–0.1950 range—this is our FVG and the zone of the previous breakout.
There, I’ll wait for a pin bar or a strong reaction from buyers.
I’m scaling out of take-profits at 0.1970, 0.2034, and a final target at 0.2175. A move below 0.1841 immediately invalidates the setup.
But the RSI is already overheated, so I’m not chasing the price.
The strategy is simple: I’m waiting for a pullback into the 0.1927–0.1950 range—this is our FVG and the zone of the previous breakout.
There, I’ll wait for a pin bar or a strong reaction from buyers.
I’m scaling out of take-profits at 0.1970, 0.2034, and a final target at 0.2175. A move below 0.1841 immediately invalidates the setup.
1
144
·
--
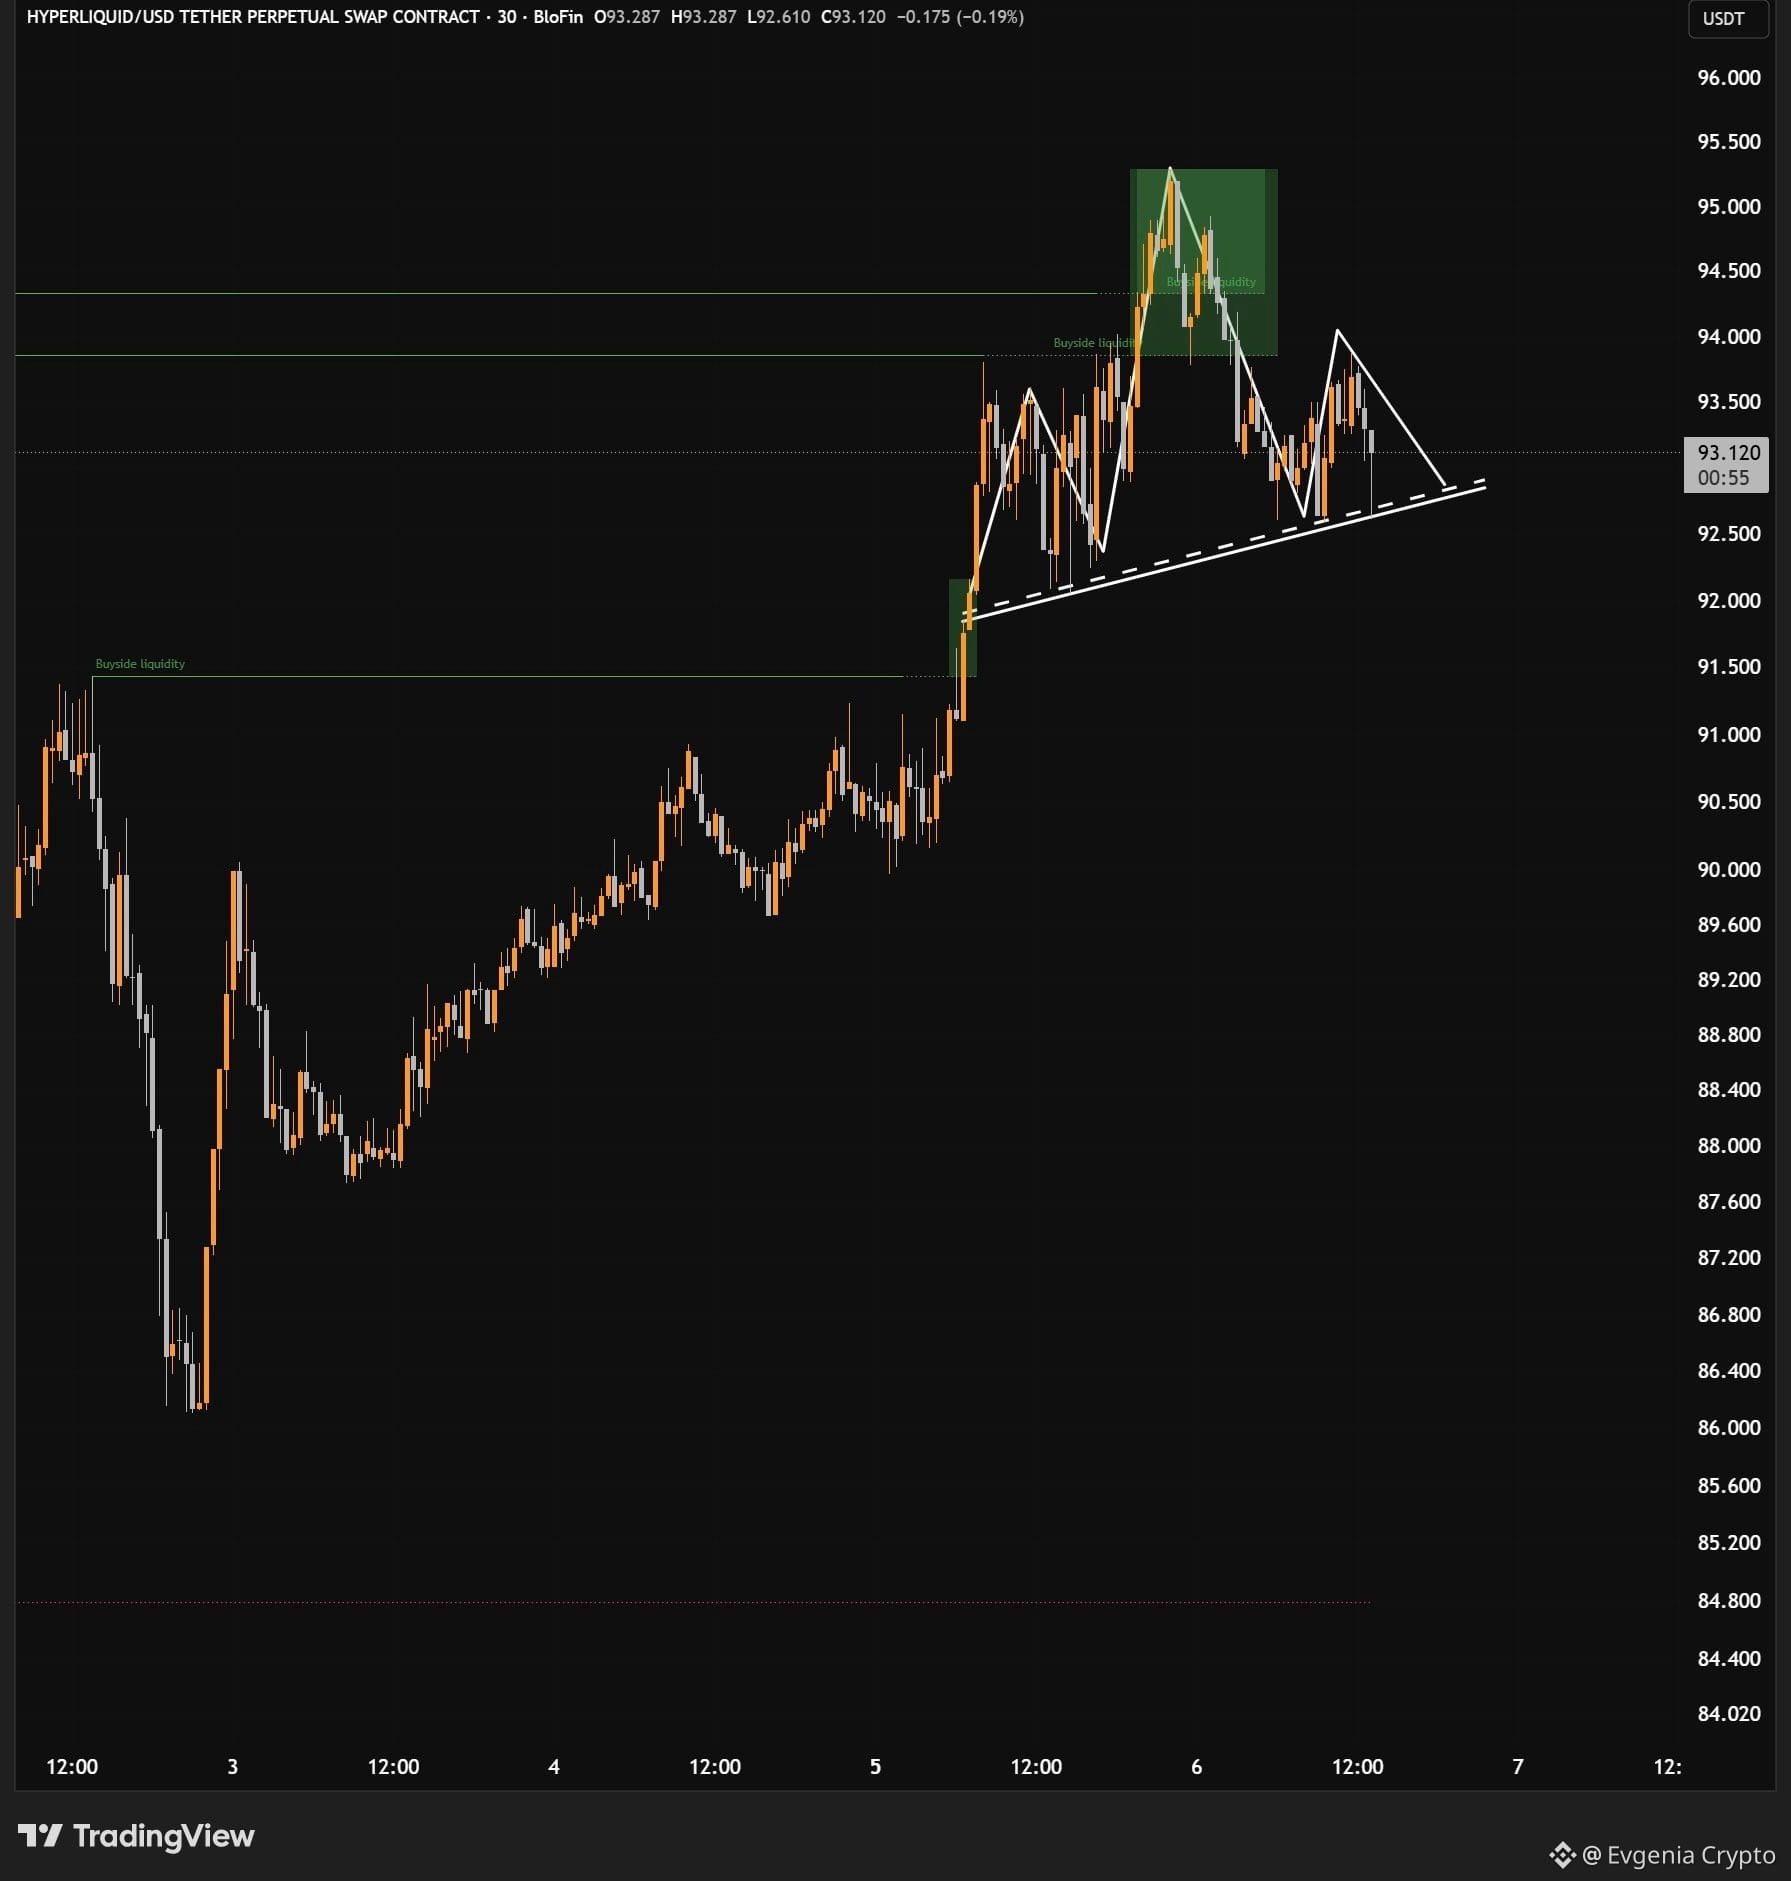
A triangle above rising support at $HYPE hints at an imminent breakout.
Momentum after the recent liquidity sweep at 94.0–94.3 has faded, and the price is treading water at 93.00.
The outcome now hinges on whether the 92.6–92.8 zone holds. A break above resistance at 93.6 would give buyers the green light to return to the highs, with a target of 95.3.
If the bulls weaken and the price plunges below 92.6, sellers will immediately take the initiative.
A triangle above rising support at $HYPE hints at an imminent breakout.
Momentum after the recent liquidity sweep at 94.0–94.3 has faded, and the price is treading water at 93.00.
The outcome now hinges on whether the 92.6–92.8 zone holds. A break above resistance at 93.6 would give buyers the green light to return to the highs, with a target of 95.3.
If the bulls weaken and the price plunges below 92.6, sellers will immediately take the initiative.
Momentum after the recent liquidity sweep at 94.0–94.3 has faded, and the price is treading water at 93.00.
The outcome now hinges on whether the 92.6–92.8 zone holds. A break above resistance at 93.6 would give buyers the green light to return to the highs, with a target of 95.3.
If the bulls weaken and the price plunges below 92.6, sellers will immediately take the initiative.
168
·
--
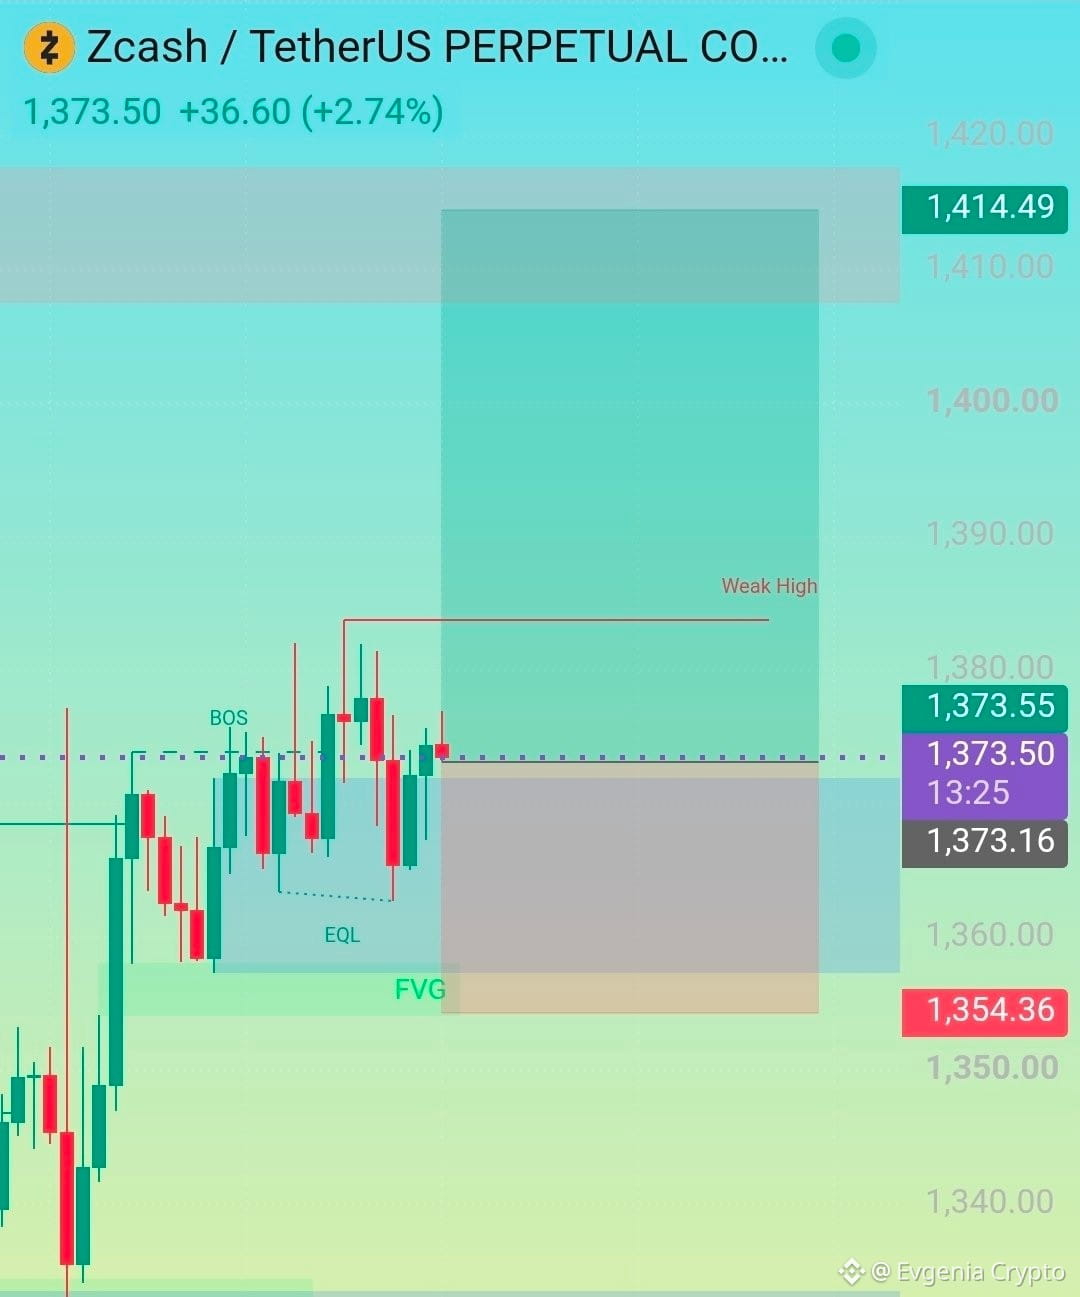
$ZEC confirms buyer strength: the clean breakout followed by a retest of the FVG worked perfectly.
If the zone holds, we can expect a new local high and a powerful move upward.
The ideal entry point for a long position is in the 1,370.00–1,373.50 range.
We’ll set the stop at 1,354.00 to limit losses, and plan to take profit at 1,414.00.
An excellent trend-following setup.
{future}(ZECUSDT)
$ZEC confirms buyer strength: the clean breakout followed by a retest of the FVG worked perfectly.
If the zone holds, we can expect a new local high and a powerful move upward.
The ideal entry point for a long position is in the 1,370.00–1,373.50 range.
We’ll set the stop at 1,354.00 to limit losses, and plan to take profit at 1,414.00.
An excellent trend-following setup.
If the zone holds, we can expect a new local high and a powerful move upward.
The ideal entry point for a long position is in the 1,370.00–1,373.50 range.
We’ll set the stop at 1,354.00 to limit losses, and plan to take profit at 1,414.00.
An excellent trend-following setup.
1
256
·
--
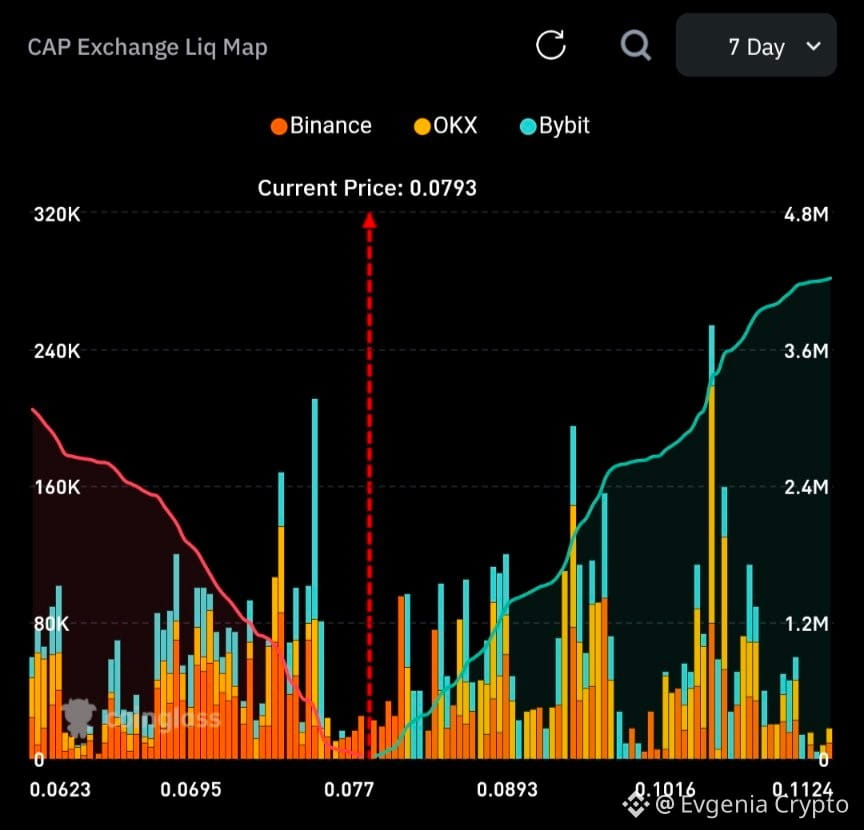
Looking at the liquidation map for $CAP , there’s a clear imbalance — a huge volume of shorts is sitting above.
The price is currently holding around $0.0793, while the main clusters of sellers’ stop-losses have moved into the $0.094–$0.105 range, with more extending above $0.11.
If buyers push a little harder and break through the current resistance, a chain reaction of liquidations could begin.
I’ll be watching closely to see how this move develops.
Looking at the liquidation map for $CAP , there’s a clear imbalance — a huge volume of shorts is sitting above.
The price is currently holding around $0.0793, while the main clusters of sellers’ stop-losses have moved into the $0.094–$0.105 range, with more extending above $0.11.
If buyers push a little harder and break through the current resistance, a chain reaction of liquidations could begin.
I’ll be watching closely to see how this move develops.
The price is currently holding around $0.0793, while the main clusters of sellers’ stop-losses have moved into the $0.094–$0.105 range, with more extending above $0.11.
If buyers push a little harder and break through the current resistance, a chain reaction of liquidations could begin.
I’ll be watching closely to see how this move develops.
127
Log in to explore more content
Join global crypto users on Binance Square
⚡️ Get latest and useful information about crypto.
💬 Trusted by the world’s largest crypto exchange.
👍 Discover real insights from verified creators.
Email / Phone number
Trending Topics
BinanceLaunchesBinanceIntelligence
505,259 views
3,383 Discussing
Binance Intelligence is Binance's suite of AI-powered tools and infrastructure integrated directly into the Binance ecosystem. It is designed to assist traders and investors by automating market analysis, risk monitoring, and decision-making tools
#BinanceLaunchesBinanceIntelligence
CryptofactswithFARAZ
·1 Likes
·166 views
BitcoinTargets2026OpenAt$87570
3,626 views
96 Discussing
BitcoinRejectedAt$87KThirdTime
3,239 views
76 Discussing