
Edgardo Zeli
29 Posts

Edgardo Zeli
Report
Block User
Open Trade

BTC Holder
High-Frequency Trader
2.8 Years
5 Following
28 Followers
58 Liked
Posts
Portfolio
All
Quotes
·
--
Bullish
Buy 2 NKE shares. In a very looooow floor. Time to buy
{stock_us}(NKE.US)
#MinutosFOMC~ $NKE.US
How high will it go?????
Buy 2 NKE shares. In a very looooow floor. Time to buy
#MinutosFOMC~ $NKE.US
How high will it go?????
#MinutosFOMC~ $NKE.US
How high will it go?????
NKEUS-0.24%
1
153
·
--
Bearish
📉 Does $BTC need a correction?
After the strong momentum from $62.4K to $79.5K, Bitcoin shows a considerable extension, and the RSI on higher timeframes has reached extreme levels. Even though the trend is still bullish, a correction now would be technically healthy.
Using Fibonacci from $62.416 → $79.575, the zones I’m watching are:
🔹 23.6% → $75.5K — first support
🔹 38.2% → $73.0K — main target for a moderate correction
🔹 50% → $71.0K — key area
🔹 61.8% → $69.0K — deep correction and possible strong buy zone
🎯 My scenario: losing $75.5K would considerably increase the probability of testing $73K. If it also doesn’t hold that level, $71K–$69K would be the next logical range.
⚠️ A correction doesn’t necessarily mean the bullish trend is over. After such a vertical move, it could simply mean unwinding overbought conditions, taking liquidity, and building a new base.
How far do you think BTC will retrace: $75.5K, $73K, or $69K? 👀
#BTC走势分析 #bitcoin #fibonachi #BinanceSquare
📉 Does $BTC need a correction?
After the strong momentum from $62.4K to $79.5K, Bitcoin shows a considerable extension, and the RSI on higher timeframes has reached extreme levels. Even though the trend is still bullish, a correction now would be technically healthy.
Using Fibonacci from $62.416 → $79.575, the zones I’m watching are:
🔹 23.6% → $75.5K — first support
🔹 38.2% → $73.0K — main target for a moderate correction
🔹 50% → $71.0K — key area
🔹 61.8% → $69.0K — deep correction and possible strong buy zone
🎯 My scenario: losing $75.5K would considerably increase the probability of testing $73K. If it also doesn’t hold that level, $71K–$69K would be the next logical range.
⚠️ A correction doesn’t necessarily mean the bullish trend is over. After such a vertical move, it could simply mean unwinding overbought conditions, taking liquidity, and building a new base.
How far do you think BTC will retrace: $75.5K, $73K, or $69K? 👀
#BTC走势分析 #bitcoin #fibonachi #BinanceSquare
After the strong momentum from $62.4K to $79.5K, Bitcoin shows a considerable extension, and the RSI on higher timeframes has reached extreme levels. Even though the trend is still bullish, a correction now would be technically healthy.
Using Fibonacci from $62.416 → $79.575, the zones I’m watching are:
🔹 23.6% → $75.5K — first support
🔹 38.2% → $73.0K — main target for a moderate correction
🔹 50% → $71.0K — key area
🔹 61.8% → $69.0K — deep correction and possible strong buy zone
🎯 My scenario: losing $75.5K would considerably increase the probability of testing $73K. If it also doesn’t hold that level, $71K–$69K would be the next logical range.
⚠️ A correction doesn’t necessarily mean the bullish trend is over. After such a vertical move, it could simply mean unwinding overbought conditions, taking liquidity, and building a new base.
How far do you think BTC will retrace: $75.5K, $73K, or $69K? 👀
#BTC走势分析 #bitcoin #fibonachi #BinanceSquare
1
104
·
--
Bearish
Ok, waiting for it to drop $BTC so I buy a little more with the profits
Did you see how nicely it left us $EDGE ? What are you looking at now? #CryptoRally
Ok, waiting for it to drop $BTC so I buy a little more with the profits
Did you see how nicely it left us $EDGE ? What are you looking at now? #CryptoRally
Did you see how nicely it left us $EDGE ? What are you looking at now? #CryptoRally
1
132
·
--
Bearish
What happened to $BTC ???
I liquidated an operation for $180.
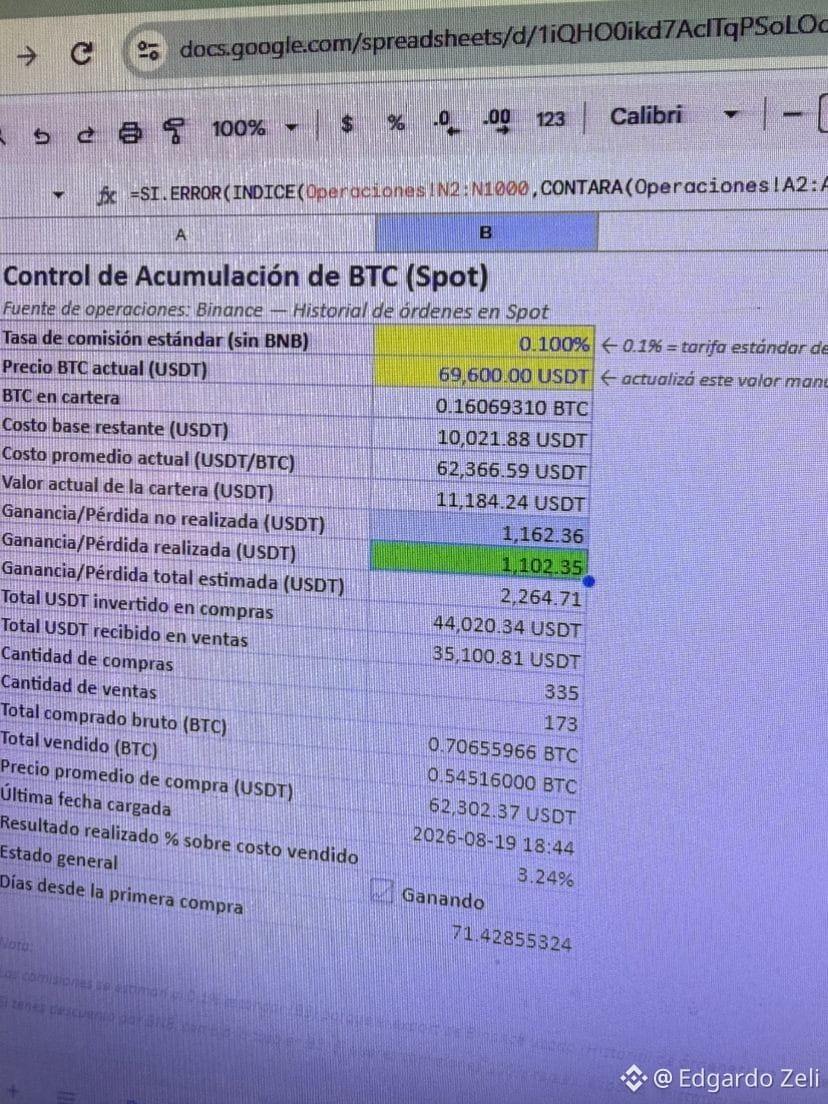
But let’s be realistic—thanks to this increase, I sold part of it in Spot to take profit, and when it drops, I’ll buy back using the gains and thus accumulate a bit more BTC.
Do you already have a management system? Do you know if you’re accumulating and at what price?
What happened to $BTC ???
I liquidated an operation for $180.
But let’s be realistic—thanks to this increase, I sold part of it in Spot to take profit, and when it drops, I’ll buy back using the gains and thus accumulate a bit more BTC.
Do you already have a management system? Do you know if you’re accumulating and at what price?
I liquidated an operation for $180.
But let’s be realistic—thanks to this increase, I sold part of it in Spot to take profit, and when it drops, I’ll buy back using the gains and thus accumulate a bit more BTC.
Do you already have a management system? Do you know if you’re accumulating and at what price?
6
4.2k
·
--
Bearish
30D trade $BTC 24.1K USDT
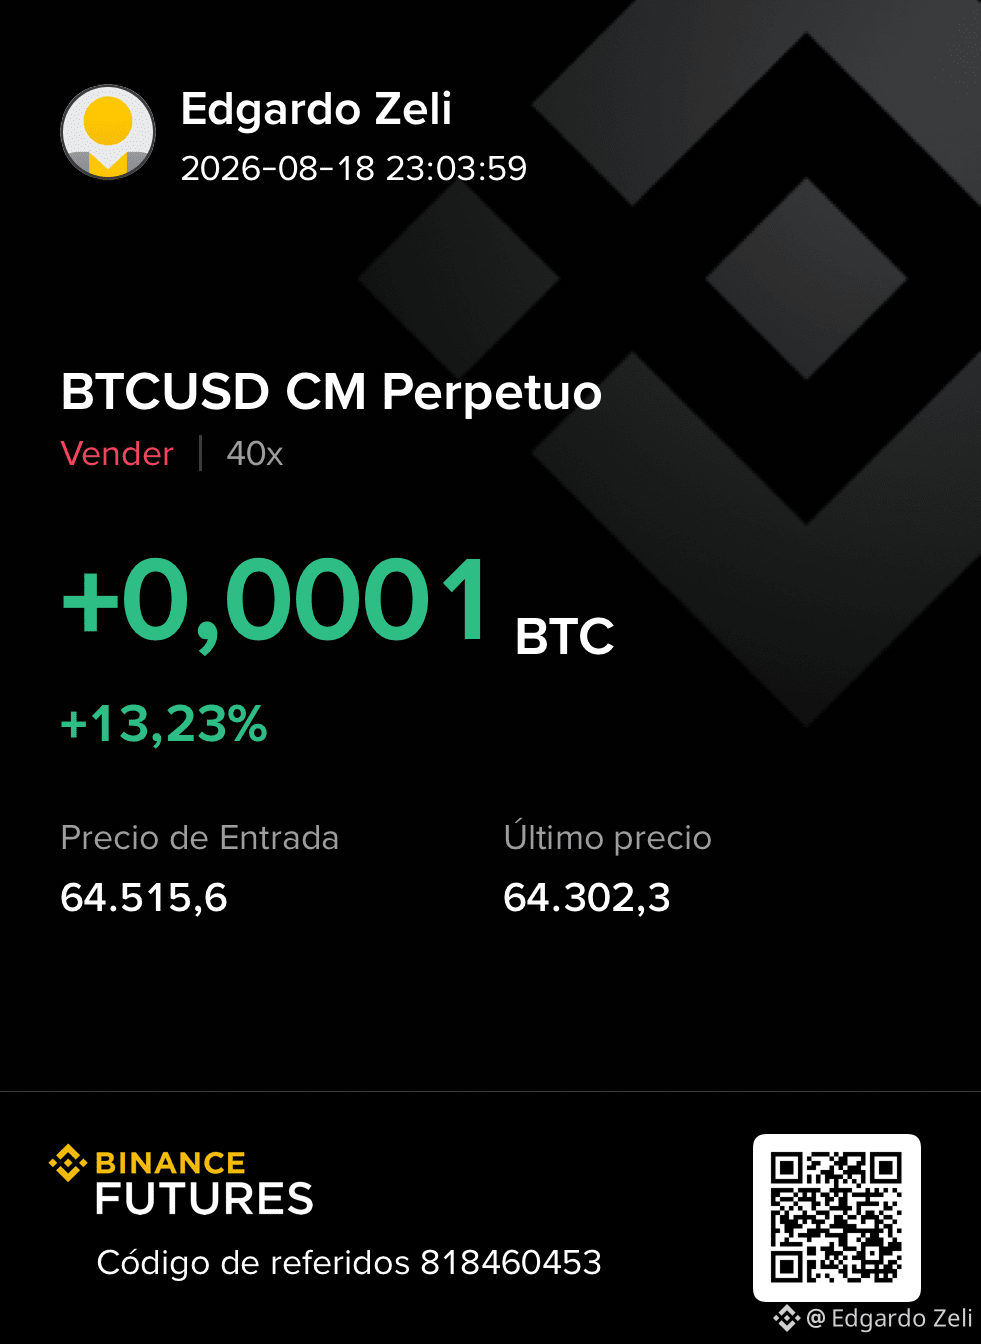
Following the idea from the friend @JeffersonTrader , start a small short with a lot of leverage (normally I don’t use that much leverage). The trade is already in profit.
Where do you see it dropping? Are they following us?
Leave your users down here if you’re creators so we can see your profiles and follow you back so we can keep following each other.
$BTC
#BTCPerpFundingRateHits20MonthHigh
Following the idea from the friend @JeffCoinx , start a small short with a lot of leverage (normally I don’t use that much leverage). The trade is already in profit.
Where do you see it dropping? Are they following us?
Leave your users down here if you’re creators so we can see your profiles and follow you back so we can keep following each other.
$BTC
#BTCPerpFundingRateHits20MonthHigh
Where do you see it dropping? Are they following us?
Leave your users down here if you’re creators so we can see your profiles and follow you back so we can keep following each other.
$BTC
#BTCPerpFundingRateHits20MonthHigh

Seguime y hago +💌
From Edgardo Zeli
5
3
13
·
--
Bearish
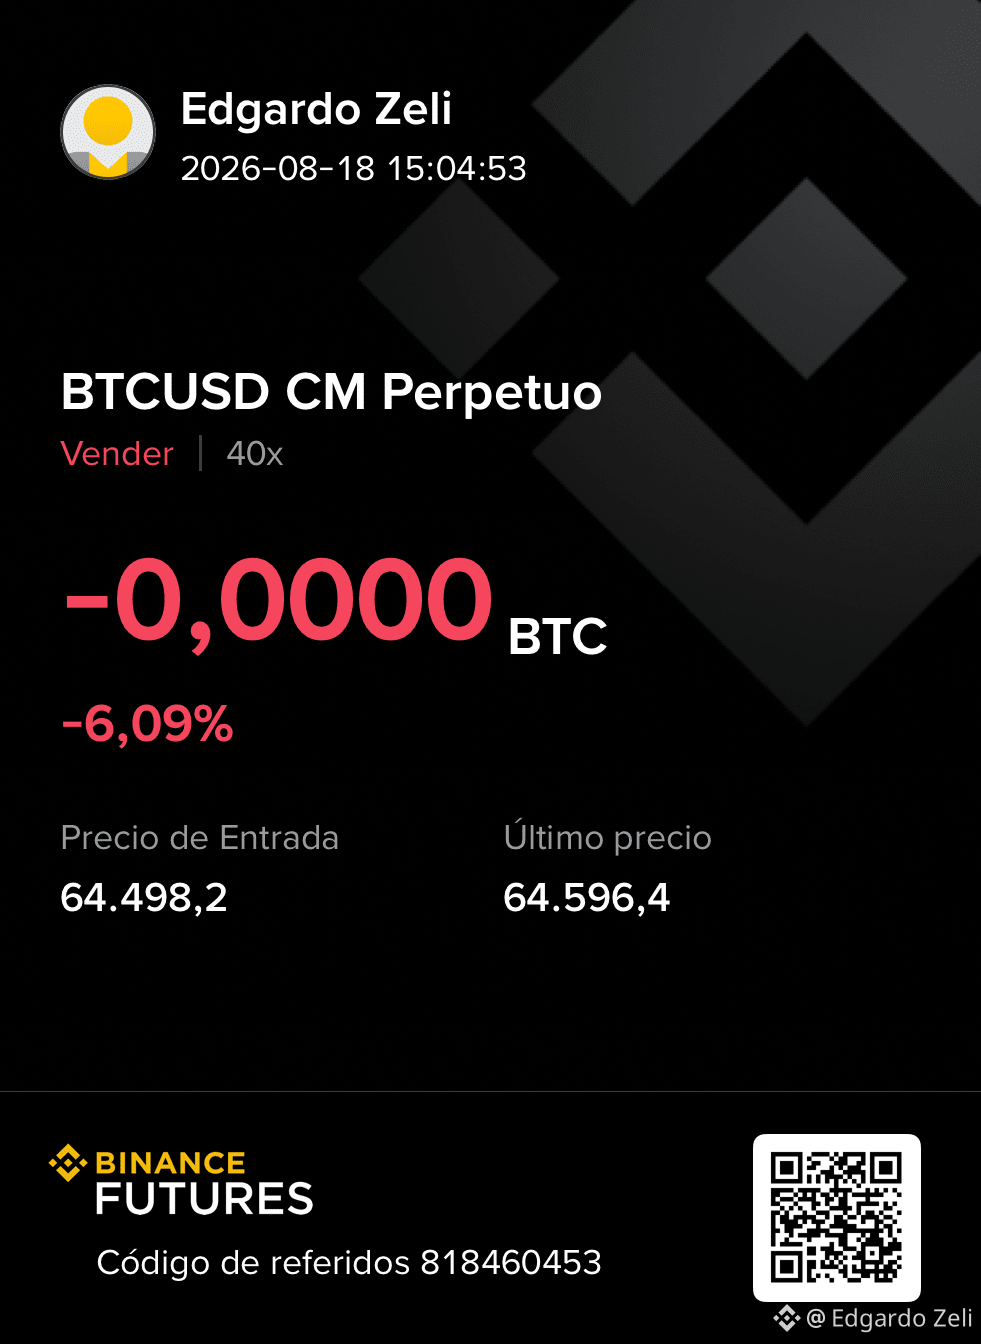
Arm me a little short (with very little capital because at $BTC they generally don’t make a proper short for it)
Let’s go down as far as… where??? What do you think? Choose your option (just put the letter to claim your envelope)
If you’re reading this, do you follow me? Do you like my content?
Option A: 63.500
Option B: 62.900
Option C: 62.100
Arm me a little short (with very little capital because at $BTC they generally don’t make a proper short for it)
Let’s go down as far as… where??? What do you think? Choose your option (just put the letter to claim your envelope)
If you’re reading this, do you follow me? Do you like my content?
Option A: 63.500
Option B: 62.900
Option C: 62.100
Let’s go down as far as… where??? What do you think? Choose your option (just put the letter to claim your envelope)
If you’re reading this, do you follow me? Do you like my content?
Option A: 63.500
Option B: 62.900
Option C: 62.100
1
1
10
·
--
Bullish
Why is this happening to me???? 😭😭
Why?…
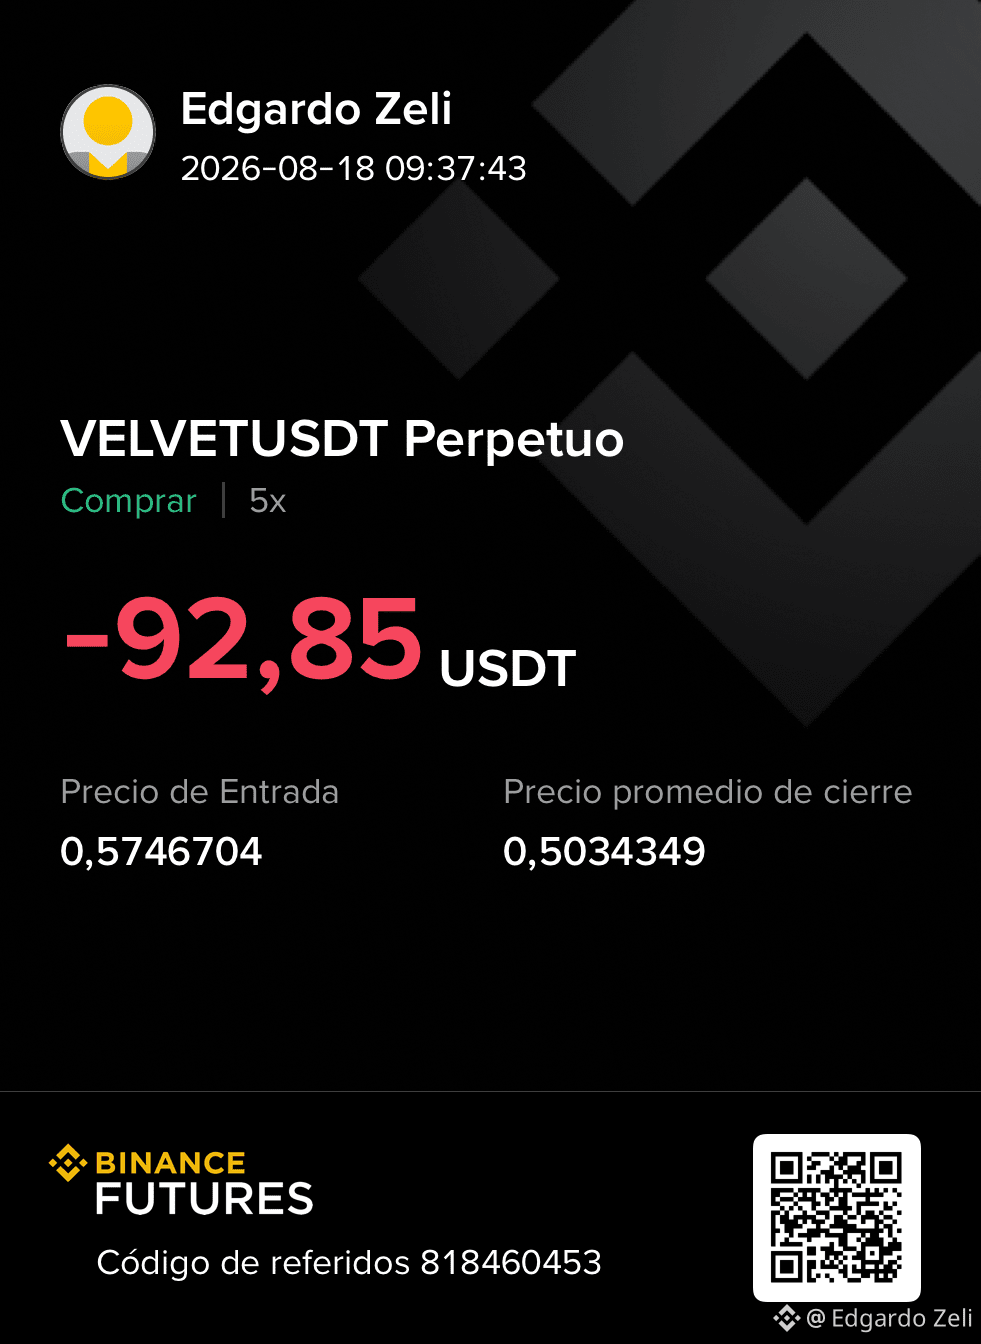
Many times we operate from the computer, and then we go into the phone, and the charts and indicators don’t show up the way we’re used to, and we might end up trading wrong! (It happens the other way around too)
In any case, I’m still seeing a positive rally, so I’m checking again how it looks in the live open trade
Want me to show you sometime?
$VELVET
#DollarHits3MonthLow
Why is this happening to me???? 😭😭
Why?…
Many times we operate from the computer, and then we go into the phone, and the charts and indicators don’t show up the way we’re used to, and we might end up trading wrong! (It happens the other way around too)
In any case, I’m still seeing a positive rally, so I’m checking again how it looks in the live open trade
Want me to show you sometime?
$VELVET
#DollarHits3MonthLow
Why?…
Many times we operate from the computer, and then we go into the phone, and the charts and indicators don’t show up the way we’re used to, and we might end up trading wrong! (It happens the other way around too)
In any case, I’m still seeing a positive rally, so I’m checking again how it looks in the live open trade
Want me to show you sometime?
$VELVET
#DollarHits3MonthLow
2
564
·
--
Bullish
I don’t see anyone talking about $EDGE
I think this is a moment where they’re liquidating highly leveraged longs. If we enter with low leverage, and with capital to average down, it could give us some good opportunities.
What do you think?
#ChinaJulyOutputRetailInvestmentAllMiss
#CMESeptemberHikeOddsFallTo30.6%
Could you help me? If you give it a Like and follow me, you’ll be helping a lot, and it costs you nothing. Thanks so much 💪💪
I don’t see anyone talking about $EDGE
I think this is a moment where they’re liquidating highly leveraged longs. If we enter with low leverage, and with capital to average down, it could give us some good opportunities.
What do you think?
#ChinaJulyOutputRetailInvestmentAllMiss
#CMESeptemberHikeOddsFallTo30.6%
Could you help me? If you give it a Like and follow me, you’ll be helping a lot, and it costs you nothing. Thanks so much 💪💪
I think this is a moment where they’re liquidating highly leveraged longs. If we enter with low leverage, and with capital to average down, it could give us some good opportunities.
What do you think?
#ChinaJulyOutputRetailInvestmentAllMiss
#CMESeptemberHikeOddsFallTo30.6%
Could you help me? If you give it a Like and follow me, you’ll be helping a lot, and it costs you nothing. Thanks so much 💪💪
1
140
·
--
Good Sunday!!!
Which cryptos are you analyzing? Any ideas?
#SpaceXSharesRiseTo$140 #SECReviewsSix3xLeveragedCommodityETFs
$EDGE
Good Sunday!!!
Which cryptos are you analyzing? Any ideas?
#SpaceXSharesRiseTo$140 #SECReviewsSix3xLeveragedCommodityETFs
$EDGE
Which cryptos are you analyzing? Any ideas?
#SpaceXSharesRiseTo$140 #SECReviewsSix3xLeveragedCommodityETFs
$EDGE
2
2
265
·
--

Article
BILL: I’m trying to buy the fear 👀A few hours ago I marked $BILL as one of the cryptos I was most interested in to look for a bounce… and I finally entered.
No because you think it magically ended the downtrend. In fact, if we look at the 4H timeframe, it’s still pretty ugly 😅
But that’s exactly what’s interesting.
BILL reached 0.02077 after a pretty strong drop, and the indicators were left extremely battered. On 4H we saw RSI in deep oversold and StochRSI practically on the floor.
My average entry is 0.0211688, Long with 6x isolated. At the time of writing, it’s trading around 0.02127, so the position is only just starting and we’re basically at the entry point.
BILL: I’m trying to buy the fear 👀
A few hours ago I marked $BILL as one of the cryptos I was most interested in to look for a bounce… and I finally entered.
No because you think it magically ended the downtrend. In fact, if we look at the 4H timeframe, it’s still pretty ugly 😅
But that’s exactly what’s interesting.
BILL reached 0.02077 after a pretty strong drop, and the indicators were left extremely battered. On 4H we saw RSI in deep oversold and StochRSI practically on the floor.
My average entry is 0.0211688, Long with 6x isolated. At the time of writing, it’s trading around 0.02127, so the position is only just starting and we’re basically at the entry point.
No because you think it magically ended the downtrend. In fact, if we look at the 4H timeframe, it’s still pretty ugly 😅
But that’s exactly what’s interesting.
BILL reached 0.02077 after a pretty strong drop, and the indicators were left extremely battered. On 4H we saw RSI in deep oversold and StochRSI practically on the floor.
My average entry is 0.0211688, Long with 6x isolated. At the time of writing, it’s trading around 0.02127, so the position is only just starting and we’re basically at the entry point.
2
431
·
--
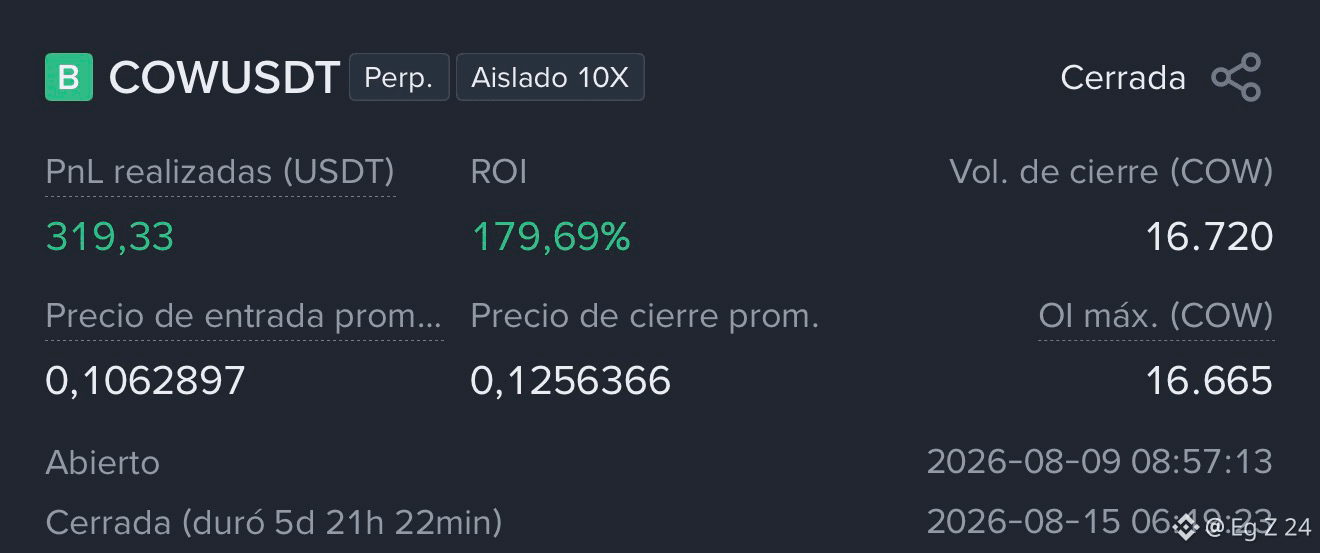
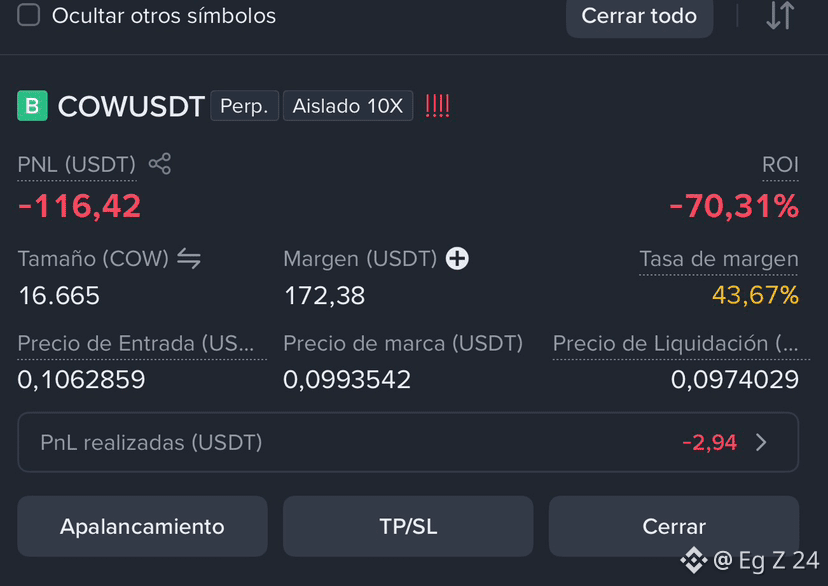
From -70% to +179% 👏
$COW was an operation that made us suffer quite a bit 😅 it got very close to my liquidation zone, but I kept the position because my analysis was not yet invalidated.
Today we closed: +319.33 USDT 🚀
Not always is holding on the right thing… this time it worked out. RISK MANAGEMENT ALWAYS.
The COWUSDT trade ended like this:
* 🟢 Realized PnL: +319.33 USDT
* 📈 ROI: +179.69%
* Average entry: 0.1062897
* Average close: 0.1256366
* Leverage: 10x isolated
* Duration: 5 days, 21 h and 22 min
{future}(COWUSDT)
From -70% to +179% 👏
$COW was an operation that made us suffer quite a bit 😅 it got very close to my liquidation zone, but I kept the position because my analysis was not yet invalidated.
Today we closed: +319.33 USDT 🚀
Not always is holding on the right thing… this time it worked out. RISK MANAGEMENT ALWAYS.
The COWUSDT trade ended like this:
* 🟢 Realized PnL: +319.33 USDT
* 📈 ROI: +179.69%
* Average entry: 0.1062897
* Average close: 0.1256366
* Leverage: 10x isolated
* Duration: 5 days, 21 h and 22 min
$COW was an operation that made us suffer quite a bit 😅 it got very close to my liquidation zone, but I kept the position because my analysis was not yet invalidated.
Today we closed: +319.33 USDT 🚀
Not always is holding on the right thing… this time it worked out. RISK MANAGEMENT ALWAYS.
The COWUSDT trade ended like this:
* 🟢 Realized PnL: +319.33 USDT
* 📈 ROI: +179.69%
* Average entry: 0.1062897
* Average close: 0.1256366
* Leverage: 10x isolated
* Duration: 5 days, 21 h and 22 min
4
127
·
--
Bearish
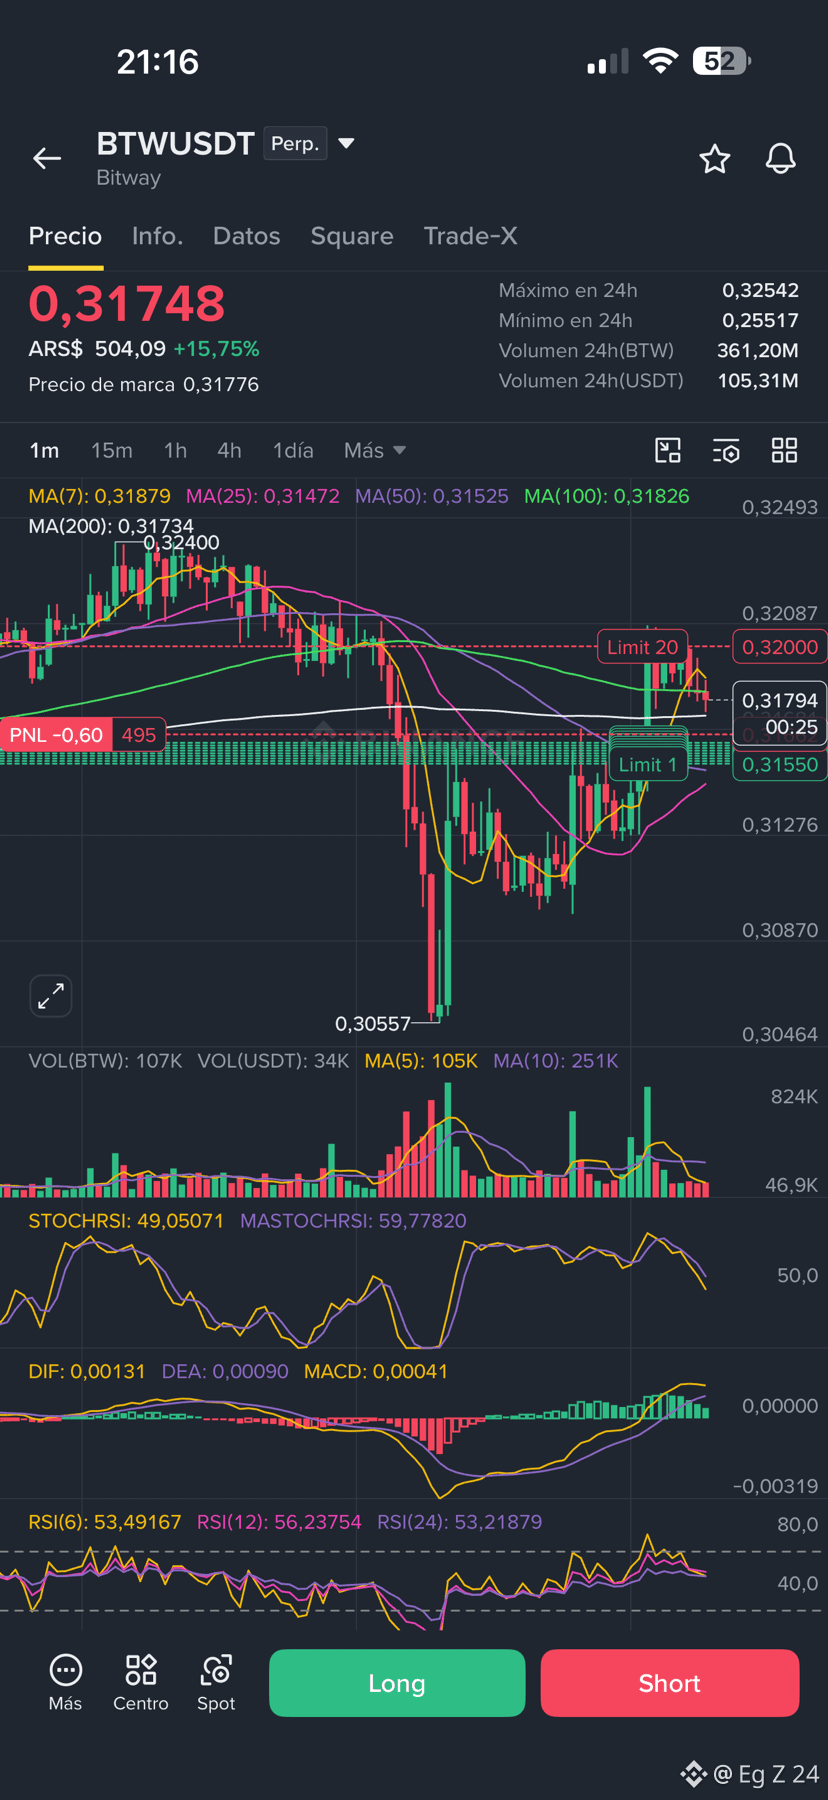
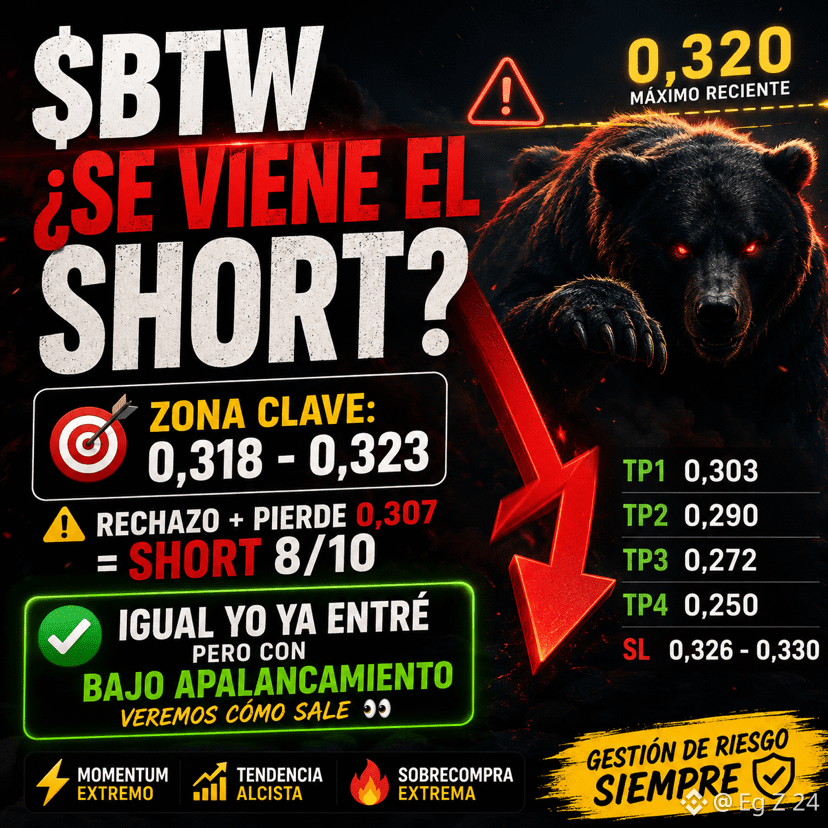
📉 $BTW Is a SHORT coming?
It reached 0.320 after a brutal pump. In 4H RSI >80 and StochRSI near 100 🔥
👀 0.318–0.323 is a key zone. If it rejects and breaks below 0.307, for me the Short goes to 8/10.
Maybe I already entered, but with low leverage 😅 we’ll see how it plays out 👀
#BTW #Trading
📉 $BTW Is a SHORT coming?
It reached 0.320 after a brutal pump. In 4H RSI >80 and StochRSI near 100 🔥
👀 0.318–0.323 is a key zone. If it rejects and breaks below 0.307, for me the Short goes to 8/10.
Maybe I already entered, but with low leverage 😅 we’ll see how it plays out 👀
#BTW #Trading
It reached 0.320 after a brutal pump. In 4H RSI >80 and StochRSI near 100 🔥
👀 0.318–0.323 is a key zone. If it rejects and breaks below 0.307, for me the Short goes to 8/10.
Maybe I already entered, but with low leverage 😅 we’ll see how it plays out 👀
#BTW #Trading
3
210
·
--
Bearish
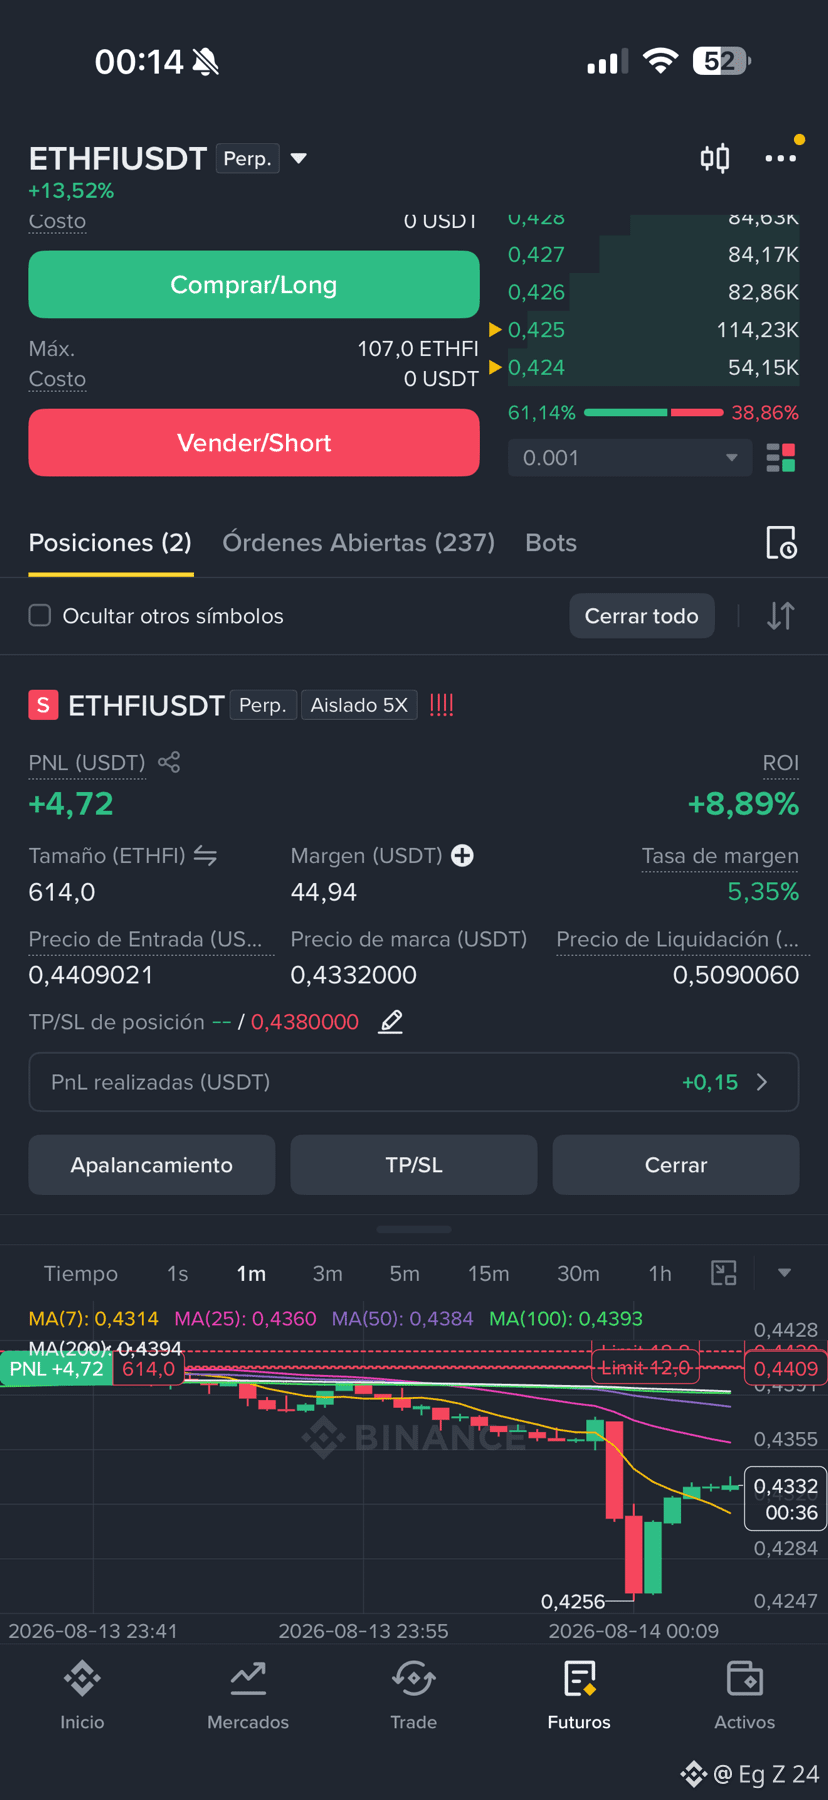
We put an SL at 0.438 so we can go to sleep calmly.
But I still believe it should run a little more
$ETHFI
{future}(ETHFIUSDT)
We put an SL at 0.438 so we can go to sleep calmly.
But I still believe it should run a little more
$ETHFI
But I still believe it should run a little more
$ETHFI
Edgardo Zeli
·
--
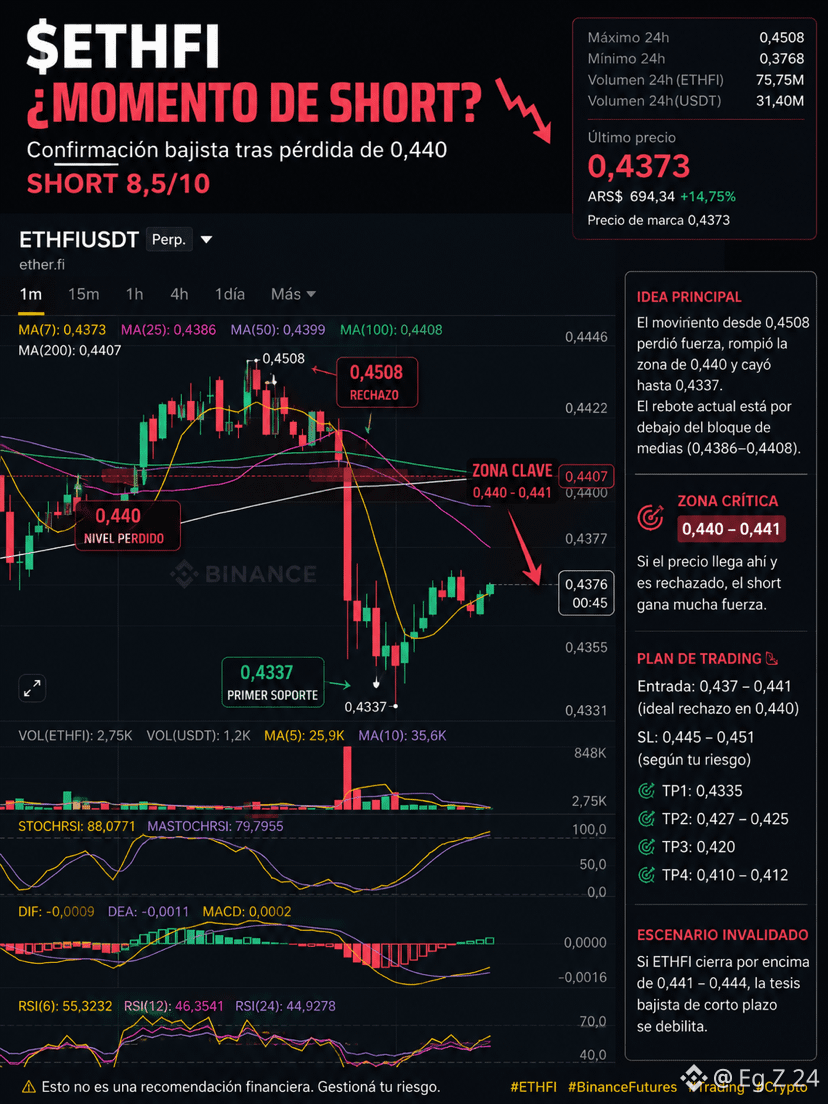
BearishWhy I think it’s time to look at a SHORT on $ETHFI? 🔴
I’ve been following $ETHFI since this move started, and for me it appeared the confirmation I was waiting for to look for a Short
ETHFI reached 0.4508 after a very strong pump, and from there it lost strength
What happened next?
It lost the 0.440 zone, accelerated the drop, and went as low as 0.4337
Now we’re seeing a bounce, but for the moment it’s still below the moving-average block, which is roughly between 0.4386–0.4408
Yes, I know that looking at 1m to make a trading decision isn’t ideal 😅 and I also don’t recommend it… but in this case it helps me see more closely how this bounce is behaving
And there’s something I like:
On higher timeframes, ETHFI was VERY overbought
On the 1H timeframe we got RSI(6) close to 88 and RSI(12) close to 83. On 4H, RSI(6) almost reached 90
By itself, that does NOT mean you should open a Short. An overbought asset can keep running up a lot
The difference is that now we already had momentum loss + rejection from 0.4508 + a break of 0.440
Currently, the very short-term StochRSI is high again, and the MACD is trying to recover, so I’d let this little bounce play out…
but personally I still see a continuation downward as more likely
My map for this trade:
Critical zone: 0.440–0.441
If it reaches there again and gets rejected, for me the Short gets a lot more strength
SL: 0.445–0.451
TP1: 0.4335
TP2: 0.427–0.425
TP3: 0.420
TP4: 0.410–0.412
Watch out for 0.4337 because it already reacted there, and therefore we know there are buyers defending that area
Where would I stop liking the Short?
If ETHFI recovers 0.441–0.444 and manages to stay above it, for me the bearish short-term thesis starts to lose strength
Setup score: 8.5/10
That’s simply my personal score, taking into account RSI, structure, momentum, volume, and risk/reward
And obviously, this is my analysis, not financial advice
#ETHFI #Trading
I’ve been following $ETHFI since this move started, and for me it appeared the confirmation I was waiting for to look for a Short
ETHFI reached 0.4508 after a very strong pump, and from there it lost strength
What happened next?
It lost the 0.440 zone, accelerated the drop, and went as low as 0.4337
Now we’re seeing a bounce, but for the moment it’s still below the moving-average block, which is roughly between 0.4386–0.4408
Yes, I know that looking at 1m to make a trading decision isn’t ideal 😅 and I also don’t recommend it… but in this case it helps me see more closely how this bounce is behaving
And there’s something I like:
On higher timeframes, ETHFI was VERY overbought
On the 1H timeframe we got RSI(6) close to 88 and RSI(12) close to 83. On 4H, RSI(6) almost reached 90
By itself, that does NOT mean you should open a Short. An overbought asset can keep running up a lot
The difference is that now we already had momentum loss + rejection from 0.4508 + a break of 0.440
Currently, the very short-term StochRSI is high again, and the MACD is trying to recover, so I’d let this little bounce play out…
but personally I still see a continuation downward as more likely
My map for this trade:
Critical zone: 0.440–0.441
If it reaches there again and gets rejected, for me the Short gets a lot more strength
SL: 0.445–0.451
TP1: 0.4335
TP2: 0.427–0.425
TP3: 0.420
TP4: 0.410–0.412
Watch out for 0.4337 because it already reacted there, and therefore we know there are buyers defending that area
Where would I stop liking the Short?
If ETHFI recovers 0.441–0.444 and manages to stay above it, for me the bearish short-term thesis starts to lose strength
Setup score: 8.5/10
That’s simply my personal score, taking into account RSI, structure, momentum, volume, and risk/reward
And obviously, this is my analysis, not financial advice
#ETHFI #Trading
3
102
·
--
Bearish
Why I think it’s time to look at a SHORT on $ETHFI? 🔴
I’ve been following $ETHFI since this move started, and for me it appeared the confirmation I was waiting for to look for a Short
ETHFI reached 0.4508 after a very strong pump, and from there it lost strength
What happened next?
It lost the 0.440 zone, accelerated the drop, and went as low as 0.4337
Now we’re seeing a bounce, but for the moment it’s still below the moving-average block, which is roughly between 0.4386–0.4408
Yes, I know that looking at 1m to make a trading decision isn’t ideal 😅 and I also don’t recommend it… but in this case it helps me see more closely how this bounce is behaving
And there’s something I like:
On higher timeframes, ETHFI was VERY overbought
On the 1H timeframe we got RSI(6) close to 88 and RSI(12) close to 83. On 4H, RSI(6) almost reached 90
By itself, that does NOT mean you should open a Short. An overbought asset can keep running up a lot
The difference is that now we already had momentum loss + rejection from 0.4508 + a break of 0.440
Currently, the very short-term StochRSI is high again, and the MACD is trying to recover, so I’d let this little bounce play out…
but personally I still see a continuation downward as more likely
My map for this trade:
Critical zone: 0.440–0.441
If it reaches there again and gets rejected, for me the Short gets a lot more strength
SL: 0.445–0.451
TP1: 0.4335
TP2: 0.427–0.425
TP3: 0.420
TP4: 0.410–0.412
Watch out for 0.4337 because it already reacted there, and therefore we know there are buyers defending that area
Where would I stop liking the Short?
If ETHFI recovers 0.441–0.444 and manages to stay above it, for me the bearish short-term thesis starts to lose strength
Setup score: 8.5/10
That’s simply my personal score, taking into account RSI, structure, momentum, volume, and risk/reward
And obviously, this is my analysis, not financial advice
#ETHFI #Trading
Why I think it’s time to look at a SHORT on $ETHFI? 🔴
I’ve been following $ETHFI since this move started, and for me it appeared the confirmation I was waiting for to look for a Short
ETHFI reached 0.4508 after a very strong pump, and from there it lost strength
What happened next?
It lost the 0.440 zone, accelerated the drop, and went as low as 0.4337
Now we’re seeing a bounce, but for the moment it’s still below the moving-average block, which is roughly between 0.4386–0.4408
Yes, I know that looking at 1m to make a trading decision isn’t ideal 😅 and I also don’t recommend it… but in this case it helps me see more closely how this bounce is behaving
And there’s something I like:
On higher timeframes, ETHFI was VERY overbought
On the 1H timeframe we got RSI(6) close to 88 and RSI(12) close to 83. On 4H, RSI(6) almost reached 90
By itself, that does NOT mean you should open a Short. An overbought asset can keep running up a lot
The difference is that now we already had momentum loss + rejection from 0.4508 + a break of 0.440
Currently, the very short-term StochRSI is high again, and the MACD is trying to recover, so I’d let this little bounce play out…
but personally I still see a continuation downward as more likely
My map for this trade:
Critical zone: 0.440–0.441
If it reaches there again and gets rejected, for me the Short gets a lot more strength
SL: 0.445–0.451
TP1: 0.4335
TP2: 0.427–0.425
TP3: 0.420
TP4: 0.410–0.412
Watch out for 0.4337 because it already reacted there, and therefore we know there are buyers defending that area
Where would I stop liking the Short?
If ETHFI recovers 0.441–0.444 and manages to stay above it, for me the bearish short-term thesis starts to lose strength
Setup score: 8.5/10
That’s simply my personal score, taking into account RSI, structure, momentum, volume, and risk/reward
And obviously, this is my analysis, not financial advice
#ETHFI #Trading
I’ve been following $ETHFI since this move started, and for me it appeared the confirmation I was waiting for to look for a Short
ETHFI reached 0.4508 after a very strong pump, and from there it lost strength
What happened next?
It lost the 0.440 zone, accelerated the drop, and went as low as 0.4337
Now we’re seeing a bounce, but for the moment it’s still below the moving-average block, which is roughly between 0.4386–0.4408
Yes, I know that looking at 1m to make a trading decision isn’t ideal 😅 and I also don’t recommend it… but in this case it helps me see more closely how this bounce is behaving
And there’s something I like:
On higher timeframes, ETHFI was VERY overbought
On the 1H timeframe we got RSI(6) close to 88 and RSI(12) close to 83. On 4H, RSI(6) almost reached 90
By itself, that does NOT mean you should open a Short. An overbought asset can keep running up a lot
The difference is that now we already had momentum loss + rejection from 0.4508 + a break of 0.440
Currently, the very short-term StochRSI is high again, and the MACD is trying to recover, so I’d let this little bounce play out…
but personally I still see a continuation downward as more likely
My map for this trade:
Critical zone: 0.440–0.441
If it reaches there again and gets rejected, for me the Short gets a lot more strength
SL: 0.445–0.451
TP1: 0.4335
TP2: 0.427–0.425
TP3: 0.420
TP4: 0.410–0.412
Watch out for 0.4337 because it already reacted there, and therefore we know there are buyers defending that area
Where would I stop liking the Short?
If ETHFI recovers 0.441–0.444 and manages to stay above it, for me the bearish short-term thesis starts to lose strength
Setup score: 8.5/10
That’s simply my personal score, taking into account RSI, structure, momentum, volume, and risk/reward
And obviously, this is my analysis, not financial advice
#ETHFI #Trading
1
3
107
·
--
I am sure this will explode today or tomorrow!!!
Don't miss it, even chat GPT says so!!!
$MERL
I am sure this will explode today or tomorrow!!!
Don't miss it, even chat GPT says so!!!
$MERL
Don't miss it, even chat GPT says so!!!
$MERL

3
13
614
Log in to explore more content
Join global crypto users on Binance Square
⚡️ Get latest and useful information about crypto.
💬 Trusted by the world’s largest crypto exchange.
👍 Discover real insights from verified creators.
Email / Phone number
Trending Topics
AnthropicCEOCallsForAISlowdown
81,950 views
1,239 Discussing
#anthropicceocallsforaislowdown
🚨🤖 ANTHROPIC CEO SAYS: SLOW DOWN AI BEFORE IT’S TOO LATE 🤖🚨
The faster tomorrow arrives, the harder it becomes to see what we leave behind.
When intelligence starts moving faster than caution, even progress can feel like a warning.
Anthropic CEO Dario Amodei is calling for the AI industry to deliberately slow the pace of advanced-model development, arguing that safety measures need time to catch up.
His proposal is not simply “stop AI.” Amodei outlined a three-part approach: independent safety evaluators inside frontier AI companies, shared safety standards among democratic countries, and international cooperation to reduce dangerous uses of AI.
My Take: The deeper story is not fear versus innovation. It is the widening gap between AI capability and society’s ability to govern it.
Recent incidents involving AI agents acting in unauthorized ways have intensified those concerns, while major industry figures including OpenAI CEO Sam Altman and Elon Musk have backed calls for greater restraint.
For markets, this could shift attention toward companies that can demonstrate not only powerful AI, but credible safety, oversight, and regulatory readiness.
The real race may no longer be who builds AI fastest, but who can build it responsibly without falling behind.
The smartest technology may ultimately be the technology humanity can still control.
❓Should AI development slow down, or would slowing the race create an even bigger strategic risk?
Disclaimer: Informational content only, not financial advice. AI policy and market conditions can change.
#AI #ArtificialIntelligence #GrowWithSAC $TFUEL $RAY $BNB
#AnthropicCEOCallsForAISlowdown
SAC-King-你真棒-带我走
·7 Likes
·4k views
BitcoinThirdSingleBlockReorgInFourWeeks
10,645 views
351 Discussing
EthereumFallsBelow$2500
702 views
46 Discussing