
小智若愚
96 Posts

小智若愚
Report
Block User
小智若愚本愚
大白话想到什么发什么!
小仓位也有很多话要说!!!
Open Trade

PEPE Holder
High-Frequency Trader
4.4 Years
33 Following
94 Followers
61 Liked
Posts
Portfolio
·
--
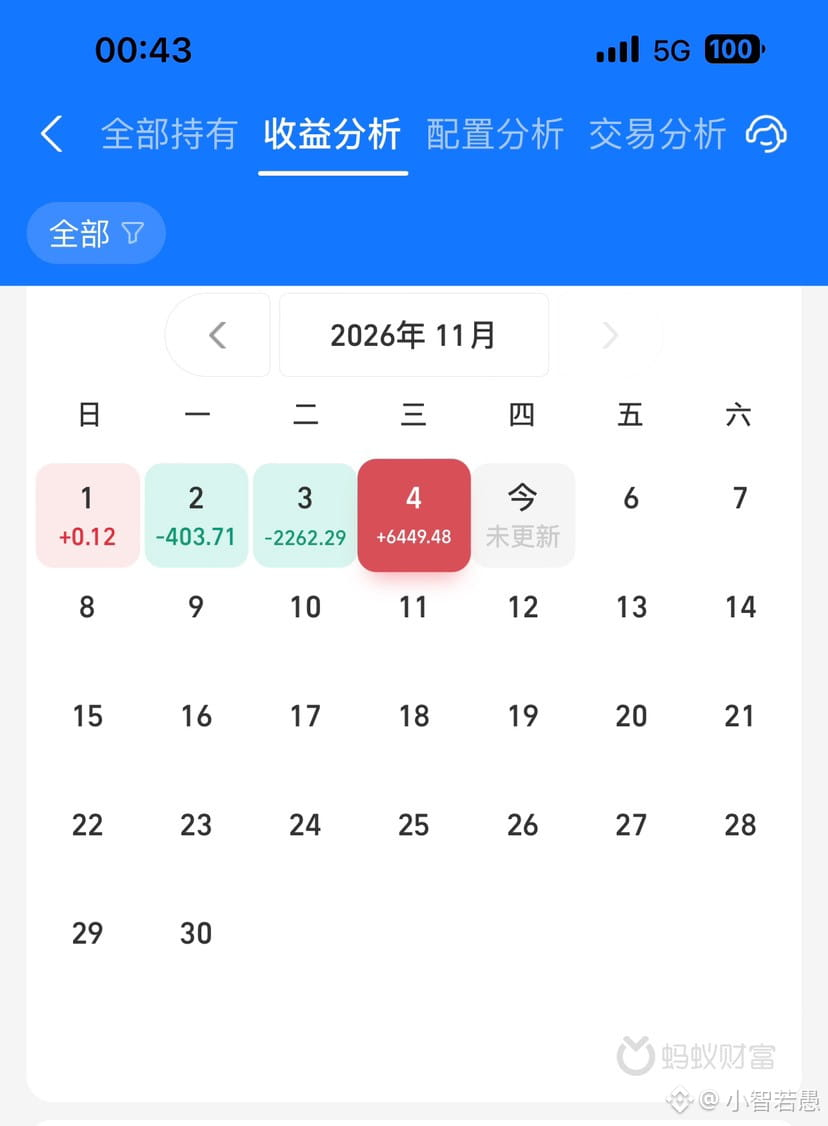
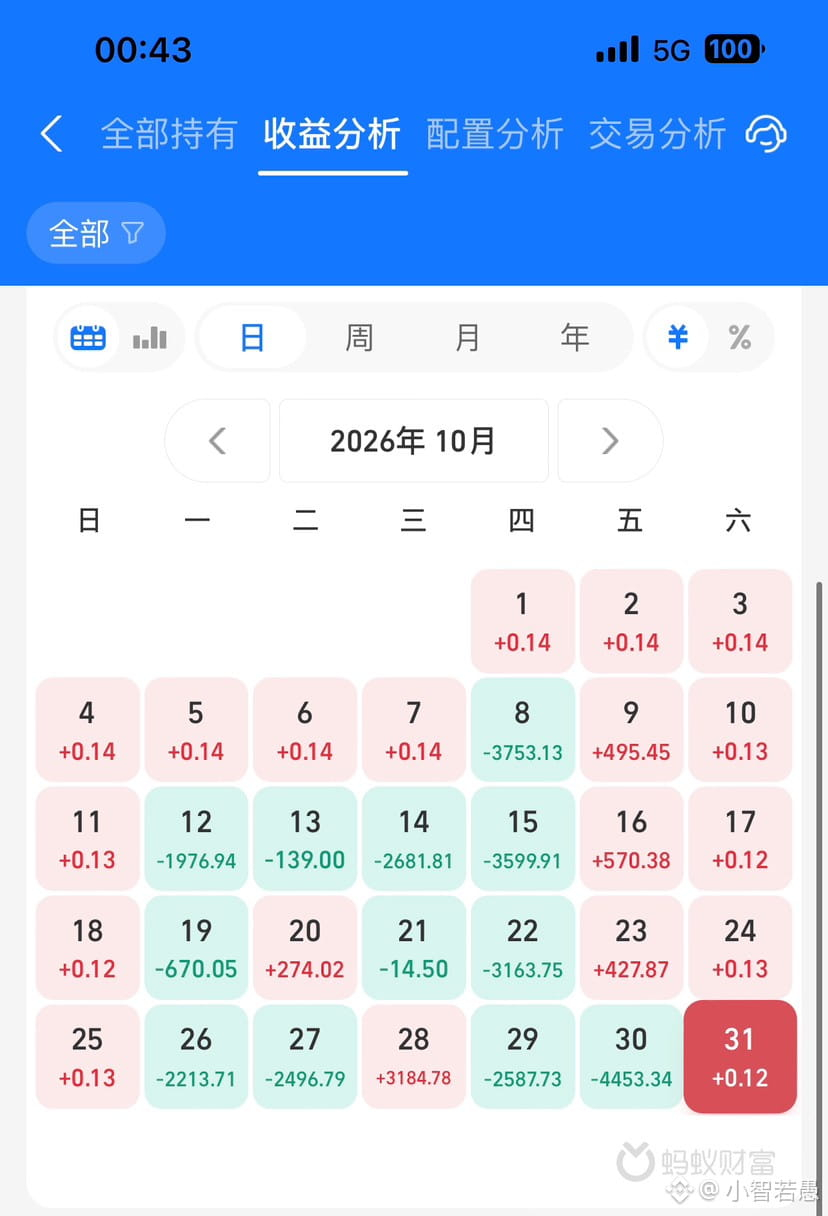
I haven’t checked my ZFB fund account in a long time. Why not? Because everything you see says the market is falling, falling, falling!
I checked it today, and the losses are still within what I can handle. Maybe after investing in funds for so long, through both gains and losses, I’ve trained myself to take the ups and downs in stride!
As for cryptocurrencies, I’m still just trying them out with a small position, but I’ve failed every time. I don’t consider myself a gambler, but so far I’ve had no discipline when it comes to taking profits or cutting losses. I keep making small gains and taking big losses, and that’s really disheartening!
Learn from the experience and keep moving forward!
I haven’t checked my ZFB fund account in a long time. Why not? Because everything you see says the market is falling, falling, falling!
I checked it today, and the losses are still within what I can handle. Maybe after investing in funds for so long, through both gains and losses, I’ve trained myself to take the ups and downs in stride!
As for cryptocurrencies, I’m still just trying them out with a small position, but I’ve failed every time. I don’t consider myself a gambler, but so far I’ve had no discipline when it comes to taking profits or cutting losses. I keep making small gains and taking big losses, and that’s really disheartening!
Learn from the experience and keep moving forward!
I checked it today, and the losses are still within what I can handle. Maybe after investing in funds for so long, through both gains and losses, I’ve trained myself to take the ups and downs in stride!
As for cryptocurrencies, I’m still just trying them out with a small position, but I’ve failed every time. I don’t consider myself a gambler, but so far I’ve had no discipline when it comes to taking profits or cutting losses. I keep making small gains and taking big losses, and that’s really disheartening!
Learn from the experience and keep moving forward!
1
180
·
--
Bullish
The direction of my candlestick analysis was right, but I failed to take profit on the pullback, which ultimately led to a loss.
Today I traded ETH and XRP, both intraday shorts.
The market first plunged from 2,300 to 2,220, then quickly rebounded to 2,300 and held steady there. At that point, I’d already spotted the pattern on the candlestick chart: strong upward moves on high volume and small pullbacks. It was very likely accumulation before an upward breakout. I don’t know why I didn’t stop out. I entered at 2,300, and spotted the accumulation at 2,320.
I got home from work in the afternoon and went to sleep. When I woke up, it was at 2,430, so I hurriedly grabbed my phone and closed the positions!
I don’t regret failing to stop out in time as much as I regret being too subjective. The books and videos have said it countless times: trust the trend! I still have a lot to learn, and I will improve!
The direction of my candlestick analysis was right, but I failed to take profit on the pullback, which ultimately led to a loss.
Today I traded ETH and XRP, both intraday shorts.
The market first plunged from 2,300 to 2,220, then quickly rebounded to 2,300 and held steady there. At that point, I’d already spotted the pattern on the candlestick chart: strong upward moves on high volume and small pullbacks. It was very likely accumulation before an upward breakout. I don’t know why I didn’t stop out. I entered at 2,300, and spotted the accumulation at 2,320.
I got home from work in the afternoon and went to sleep. When I woke up, it was at 2,430, so I hurriedly grabbed my phone and closed the positions!
I don’t regret failing to stop out in time as much as I regret being too subjective. The books and videos have said it countless times: trust the trend! I still have a lot to learn, and I will improve!
Today I traded ETH and XRP, both intraday shorts.
The market first plunged from 2,300 to 2,220, then quickly rebounded to 2,300 and held steady there. At that point, I’d already spotted the pattern on the candlestick chart: strong upward moves on high volume and small pullbacks. It was very likely accumulation before an upward breakout. I don’t know why I didn’t stop out. I entered at 2,300, and spotted the accumulation at 2,320.
I got home from work in the afternoon and went to sleep. When I woke up, it was at 2,430, so I hurriedly grabbed my phone and closed the positions!
I don’t regret failing to stop out in time as much as I regret being too subjective. The books and videos have said it countless times: trust the trend! I still have a lot to learn, and I will improve!
2
769
·
--
Bearish
ETH$ETH
Is this rally going to squeeze the shorts?
{future}(ETHUSDT)
ETH$ETH
Is this rally going to squeeze the shorts?
Is this rally going to squeeze the shorts?
366
·
--
Bearish
$ETH
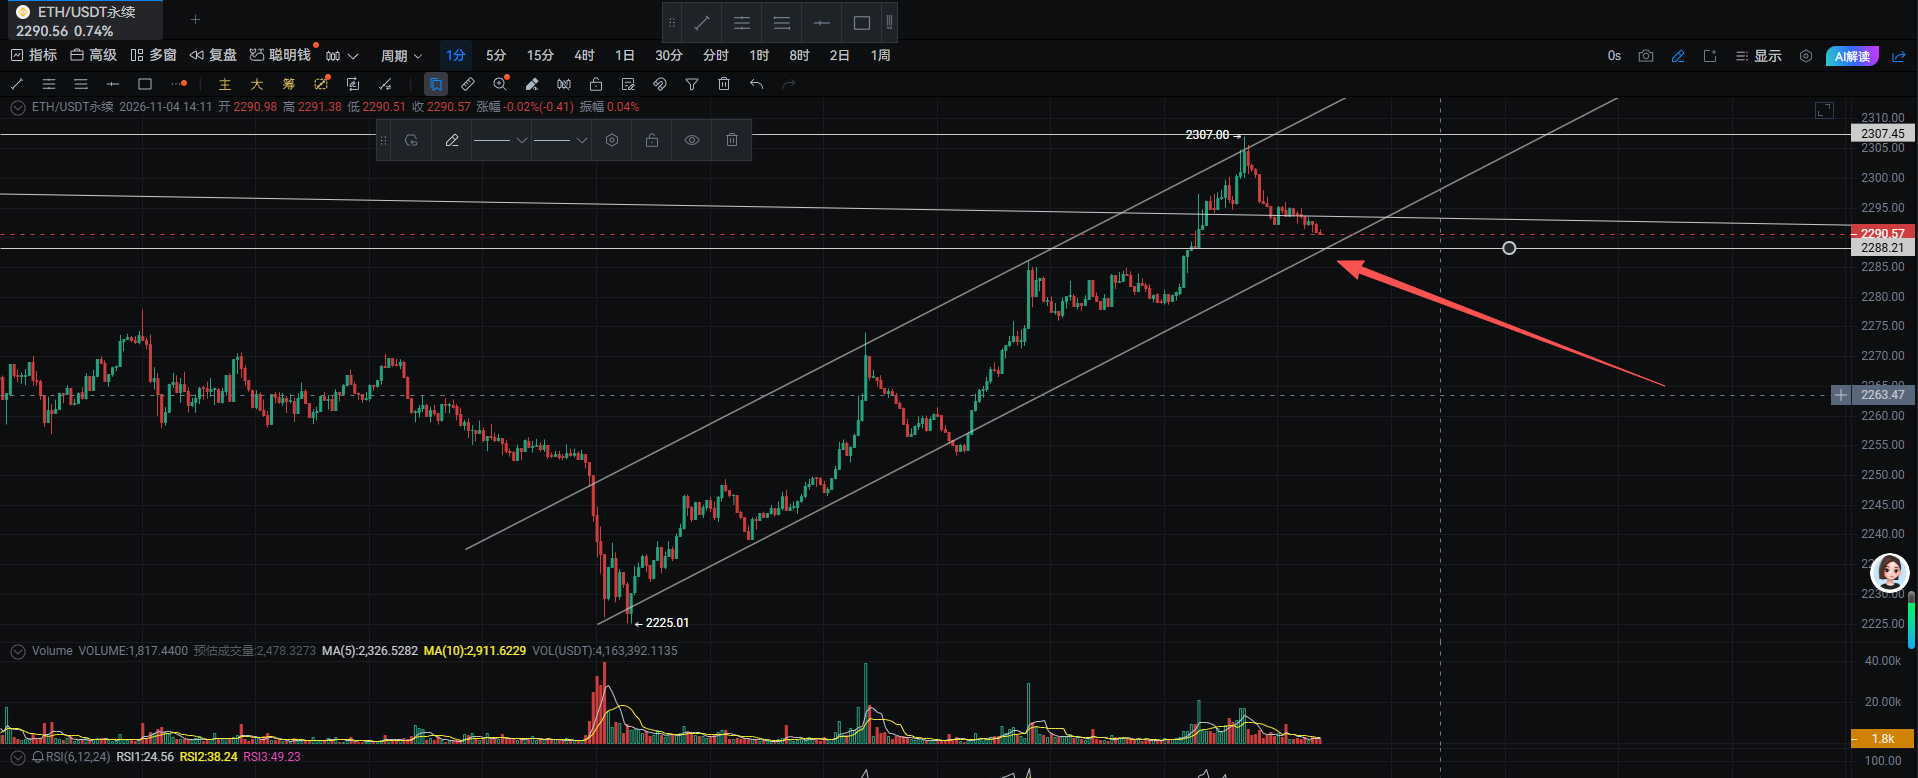
ETH: 2285 is a key level intraday. A break below it would accelerate the downward move.
If it can hold, the trend is still upward.
I'm bearish!
{future}(ETHUSDT)
$ETH
ETH: 2285 is a key level intraday. A break below it would accelerate the downward move.
If it can hold, the trend is still upward.
I'm bearish!
ETH: 2285 is a key level intraday. A break below it would accelerate the downward move.
If it can hold, the trend is still upward.
I'm bearish!
3
1.6k
·
--
Bullish
#XAU $XAU
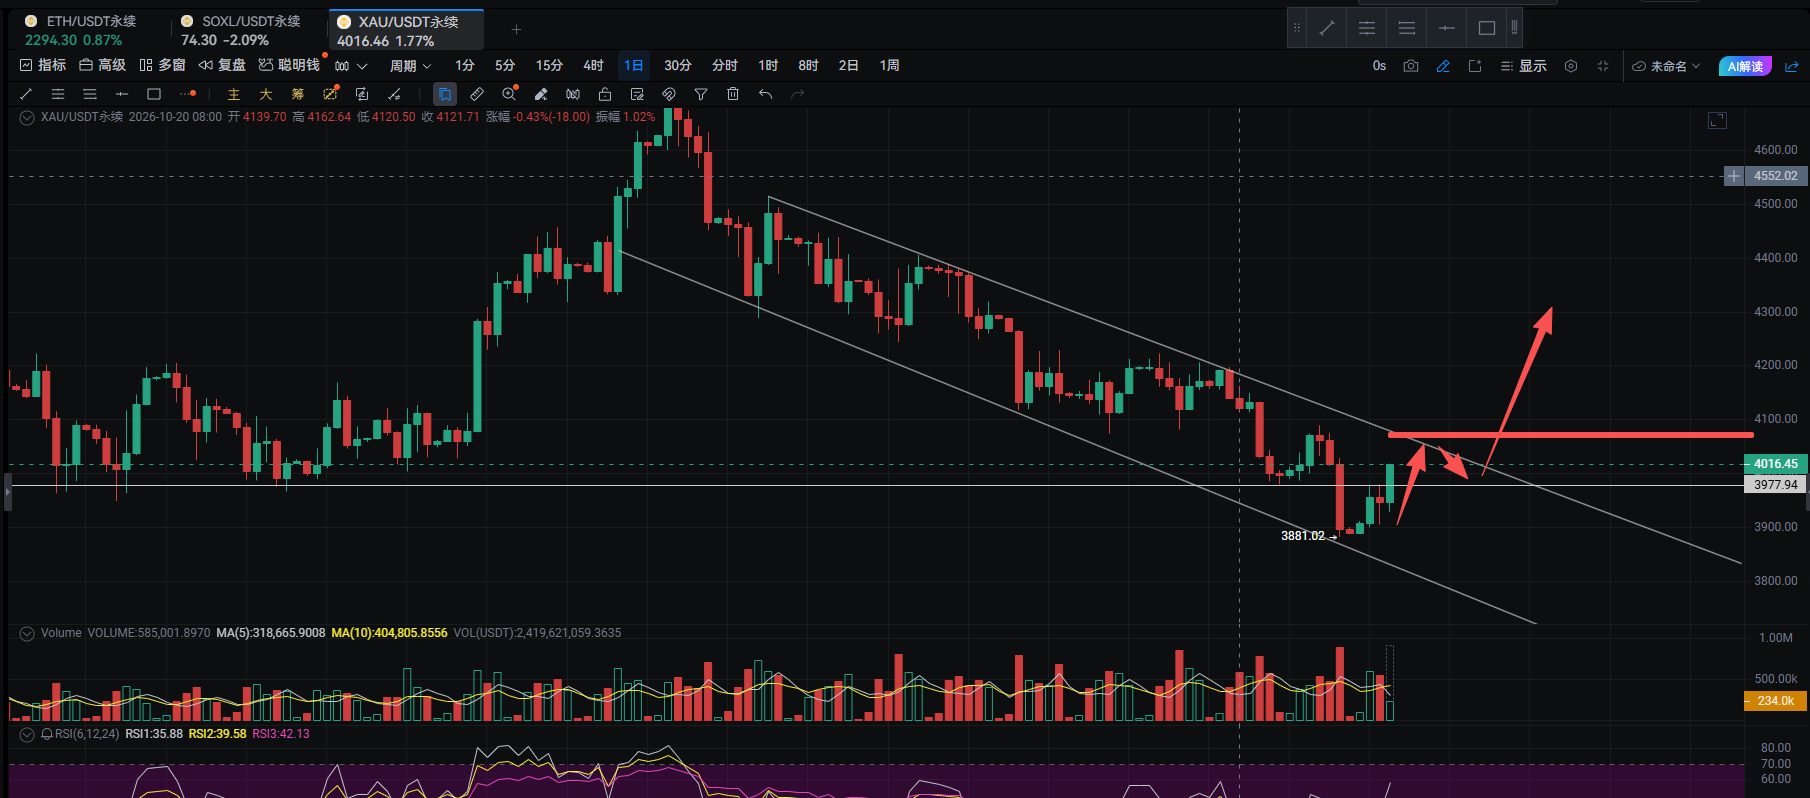
Gold is also pulling back today.
The daily chart shows it is still within a downward trend channel.
We can't be fully bullish; 4050 is a key level.
If it holds above 4050, the downtrend will likely come to an end.
{future}(XAUUSDT)
#XAU $XAU
Gold is also pulling back today.
The daily chart shows it is still within a downward trend channel.
We can't be fully bullish; 4050 is a key level.
If it holds above 4050, the downtrend will likely come to an end.
Gold is also pulling back today.
The daily chart shows it is still within a downward trend channel.
We can't be fully bullish; 4050 is a key level.
If it holds above 4050, the downtrend will likely come to an end.
282
·
--
Bearish
#ETH $ETH
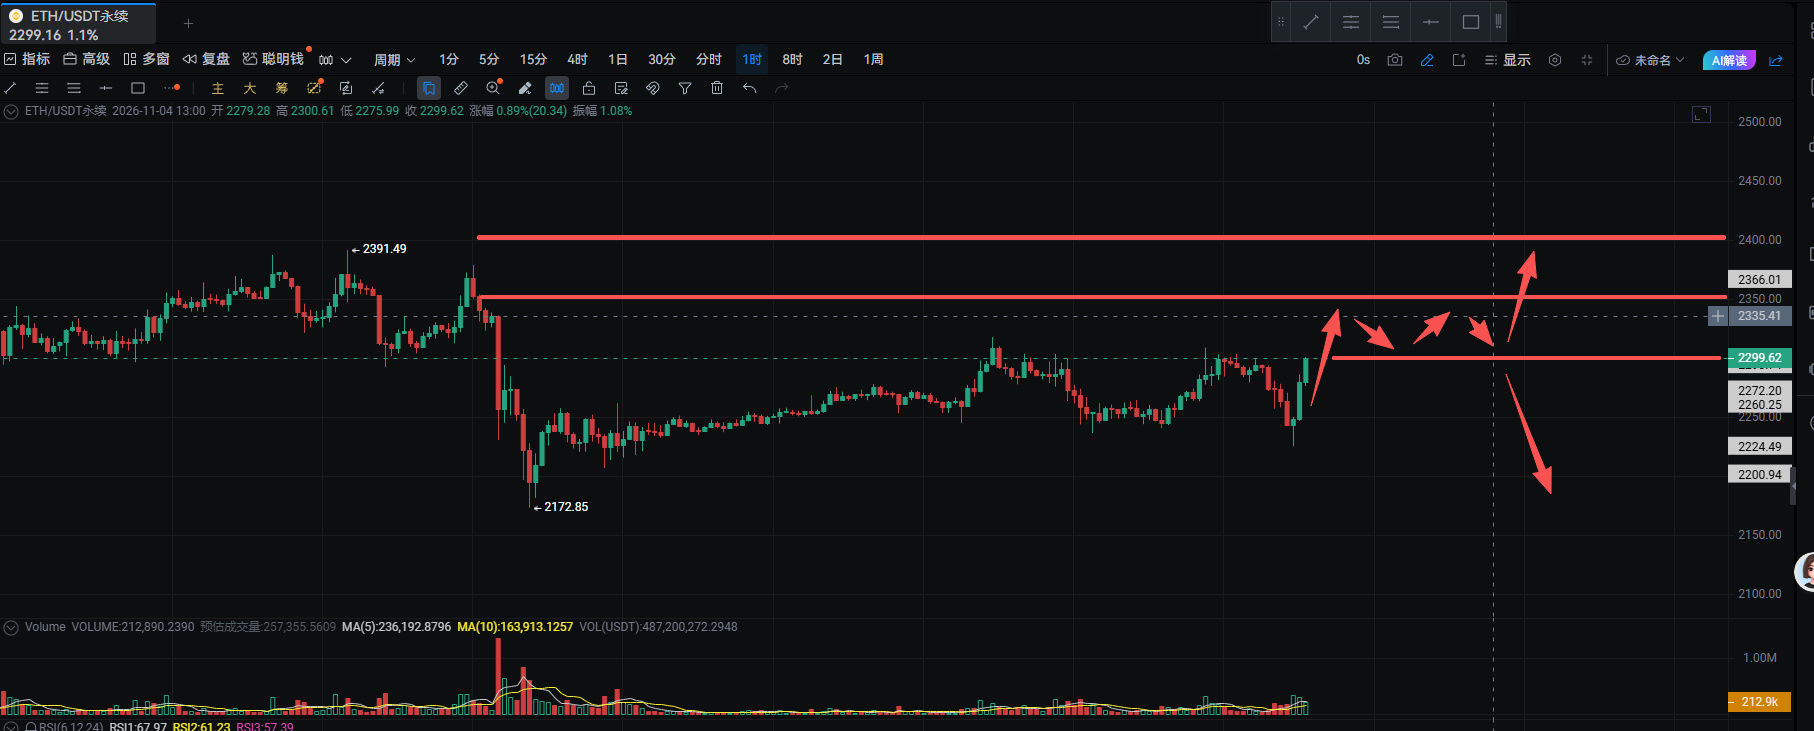
ETH is seeing fierce volatility between bulls and bears today.
After a decline, the rebound has been strong, surging straight to 2300.
After reaching 2300, trading volume weakened.
Consider opening a short with a small position; enter in batches and set a stop-loss at 2340.
2300 is a key level. If ETH can hold above 2300, it will likely stop falling and begin consolidating.
{future}(ETHUSDT)
#ETH $ETH
ETH is seeing fierce volatility between bulls and bears today.
After a decline, the rebound has been strong, surging straight to 2300.
After reaching 2300, trading volume weakened.
Consider opening a short with a small position; enter in batches and set a stop-loss at 2340.
2300 is a key level. If ETH can hold above 2300, it will likely stop falling and begin consolidating.
ETH is seeing fierce volatility between bulls and bears today.
After a decline, the rebound has been strong, surging straight to 2300.
After reaching 2300, trading volume weakened.
Consider opening a short with a small position; enter in batches and set a stop-loss at 2340.
2300 is a key level. If ETH can hold above 2300, it will likely stop falling and begin consolidating.
1.5k
·
--
Bullish
#INTC $INTC
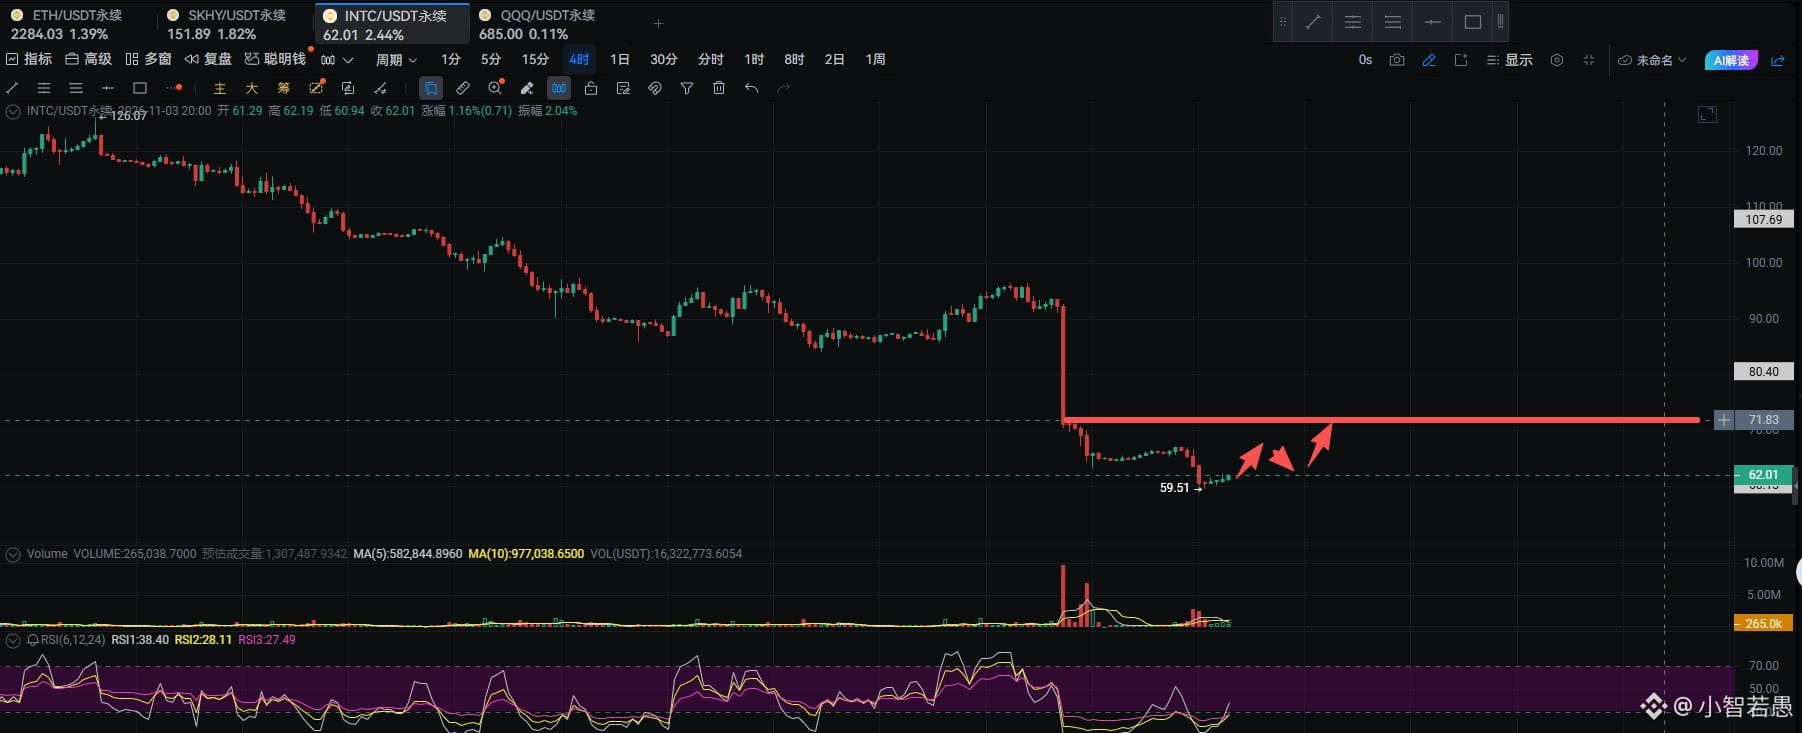
INTC's decline has been cut in half. It's fallen enough and should rebound.
Bullish. Open a small long position on dips.
Stop-loss: 55–56. Take-profit: 65/70.
{future}(INTCUSDT)
#INTC $INTC
INTC's decline has been cut in half. It's fallen enough and should rebound.
Bullish. Open a small long position on dips.
Stop-loss: 55–56. Take-profit: 65/70.
INTC's decline has been cut in half. It's fallen enough and should rebound.
Bullish. Open a small long position on dips.
Stop-loss: 55–56. Take-profit: 65/70.
400
·
--
204
·
--
Bullish
#HYPE $HYPE
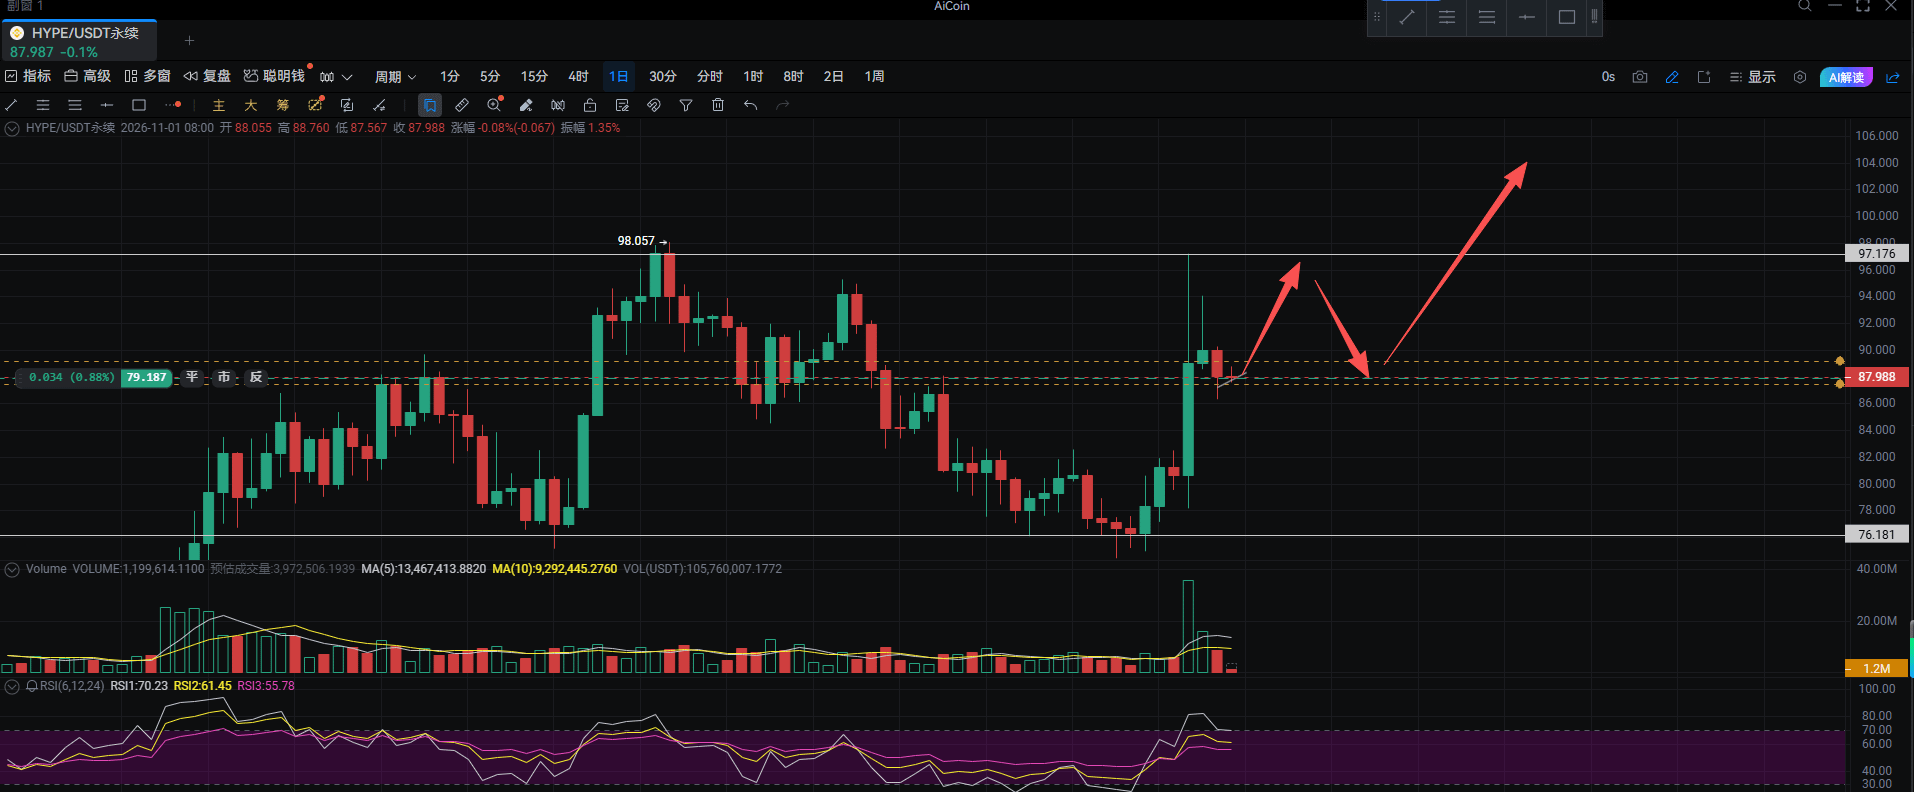
HYPE is bullish intraday
The daily chart suggests a rebound. It will likely continue fluctuating in the 99–75 range for a few more days before accelerating upward.
{future}(HYPEUSDT)
#HYPE $HYPE
HYPE is bullish intraday
The daily chart suggests a rebound. It will likely continue fluctuating in the 99–75 range for a few more days before accelerating upward.
HYPE is bullish intraday
The daily chart suggests a rebound. It will likely continue fluctuating in the 99–75 range for a few more days before accelerating upward.
262
·
--
Bearish
#ETH $ETH
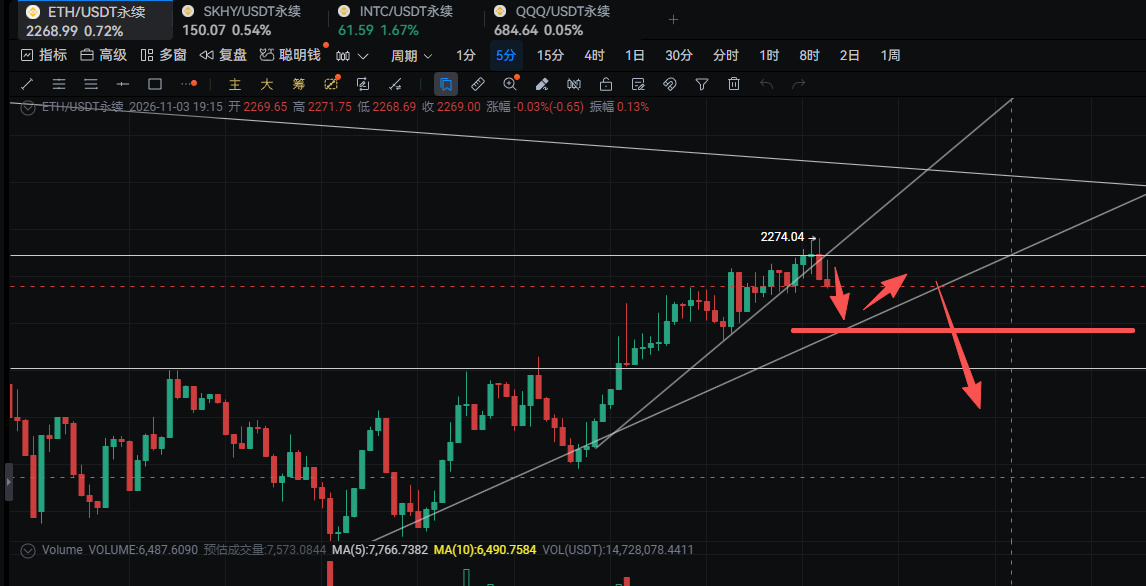
ETH's intraday volume is still very weak
Intraday bullish resistance: 2280–2295
Most likely to hit 2295/2300 and then rebound downward
{future}(ETHUSDT)
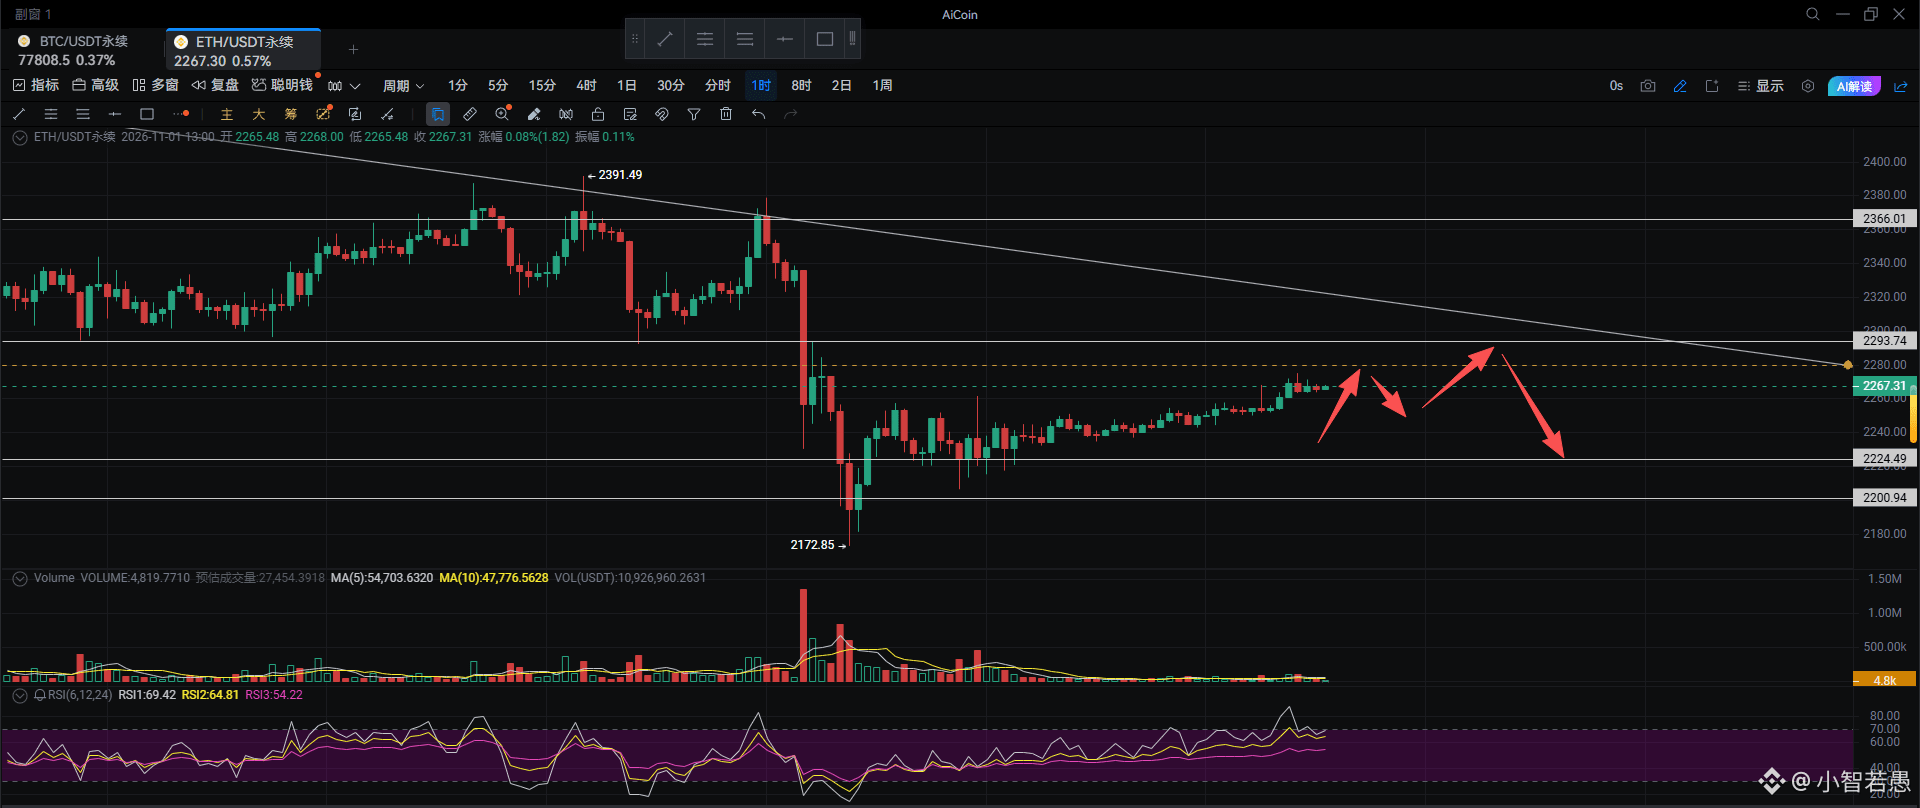
#ETH $ETH
ETH's intraday volume is still very weak
Intraday bullish resistance: 2280–2295
Most likely to hit 2295/2300 and then rebound downward
ETH's intraday volume is still very weak
Intraday bullish resistance: 2280–2295
Most likely to hit 2295/2300 and then rebound downward
172
·
--
Bearish
#ETH $ETH
ETH: Opening a position is currently not recommended (trading volume is too weak, and the intraday direction is unclear).
2300 remains strong intraday resistance.
The daily chart remains bearish.
{future}(ETHUSDT)
#ETH $ETH
ETH: Opening a position is currently not recommended (trading volume is too weak, and the intraday direction is unclear).
2300 remains strong intraday resistance.
The daily chart remains bearish.
ETH: Opening a position is currently not recommended (trading volume is too weak, and the intraday direction is unclear).
2300 remains strong intraday resistance.
The daily chart remains bearish.
193
·
--
Bearish
#ETH $ETH
ETH is currently fluctuating within the 2205–2250–2300 range
Trading is very weak, with little to no volume
It has been moving upward within the 2200–2250 range, but the trend is weak
It is expected to break above 2250 and test higher levels, but not reach 2300 before accelerating downward again
{future}(ETHUSDT)
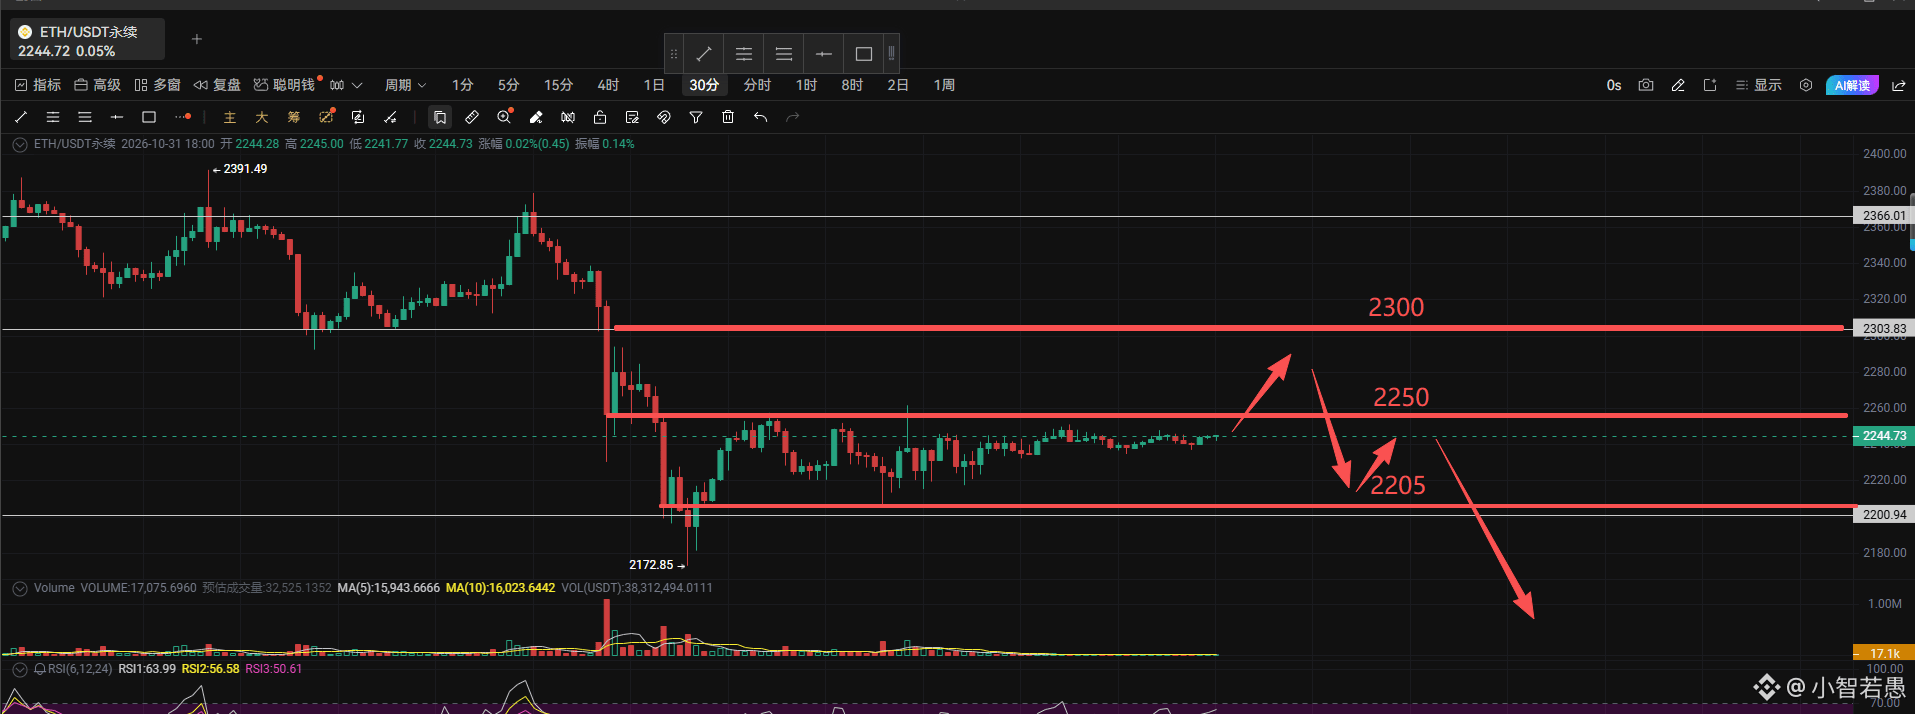
#ETH $ETH
ETH is currently fluctuating within the 2205–2250–2300 range
Trading is very weak, with little to no volume
It has been moving upward within the 2200–2250 range, but the trend is weak
It is expected to break above 2250 and test higher levels, but not reach 2300 before accelerating downward again
ETH is currently fluctuating within the 2205–2250–2300 range
Trading is very weak, with little to no volume
It has been moving upward within the 2200–2250 range, but the trend is weak
It is expected to break above 2250 and test higher levels, but not reach 2300 before accelerating downward again
1
1.2k
·
--
Bearish
#ETH $ETH
ETH's decline was expected (at least, a decline was highly likely); the daily chart reflects this.
Intraday, look for a pullback and consolidation in the 2200–2300 range.
Small positions can trade both sides of the range.
For larger positions, favor shorts; the long-term outlook is bearish, with a target of 2000–2050.
{future}(ETHUSDT)
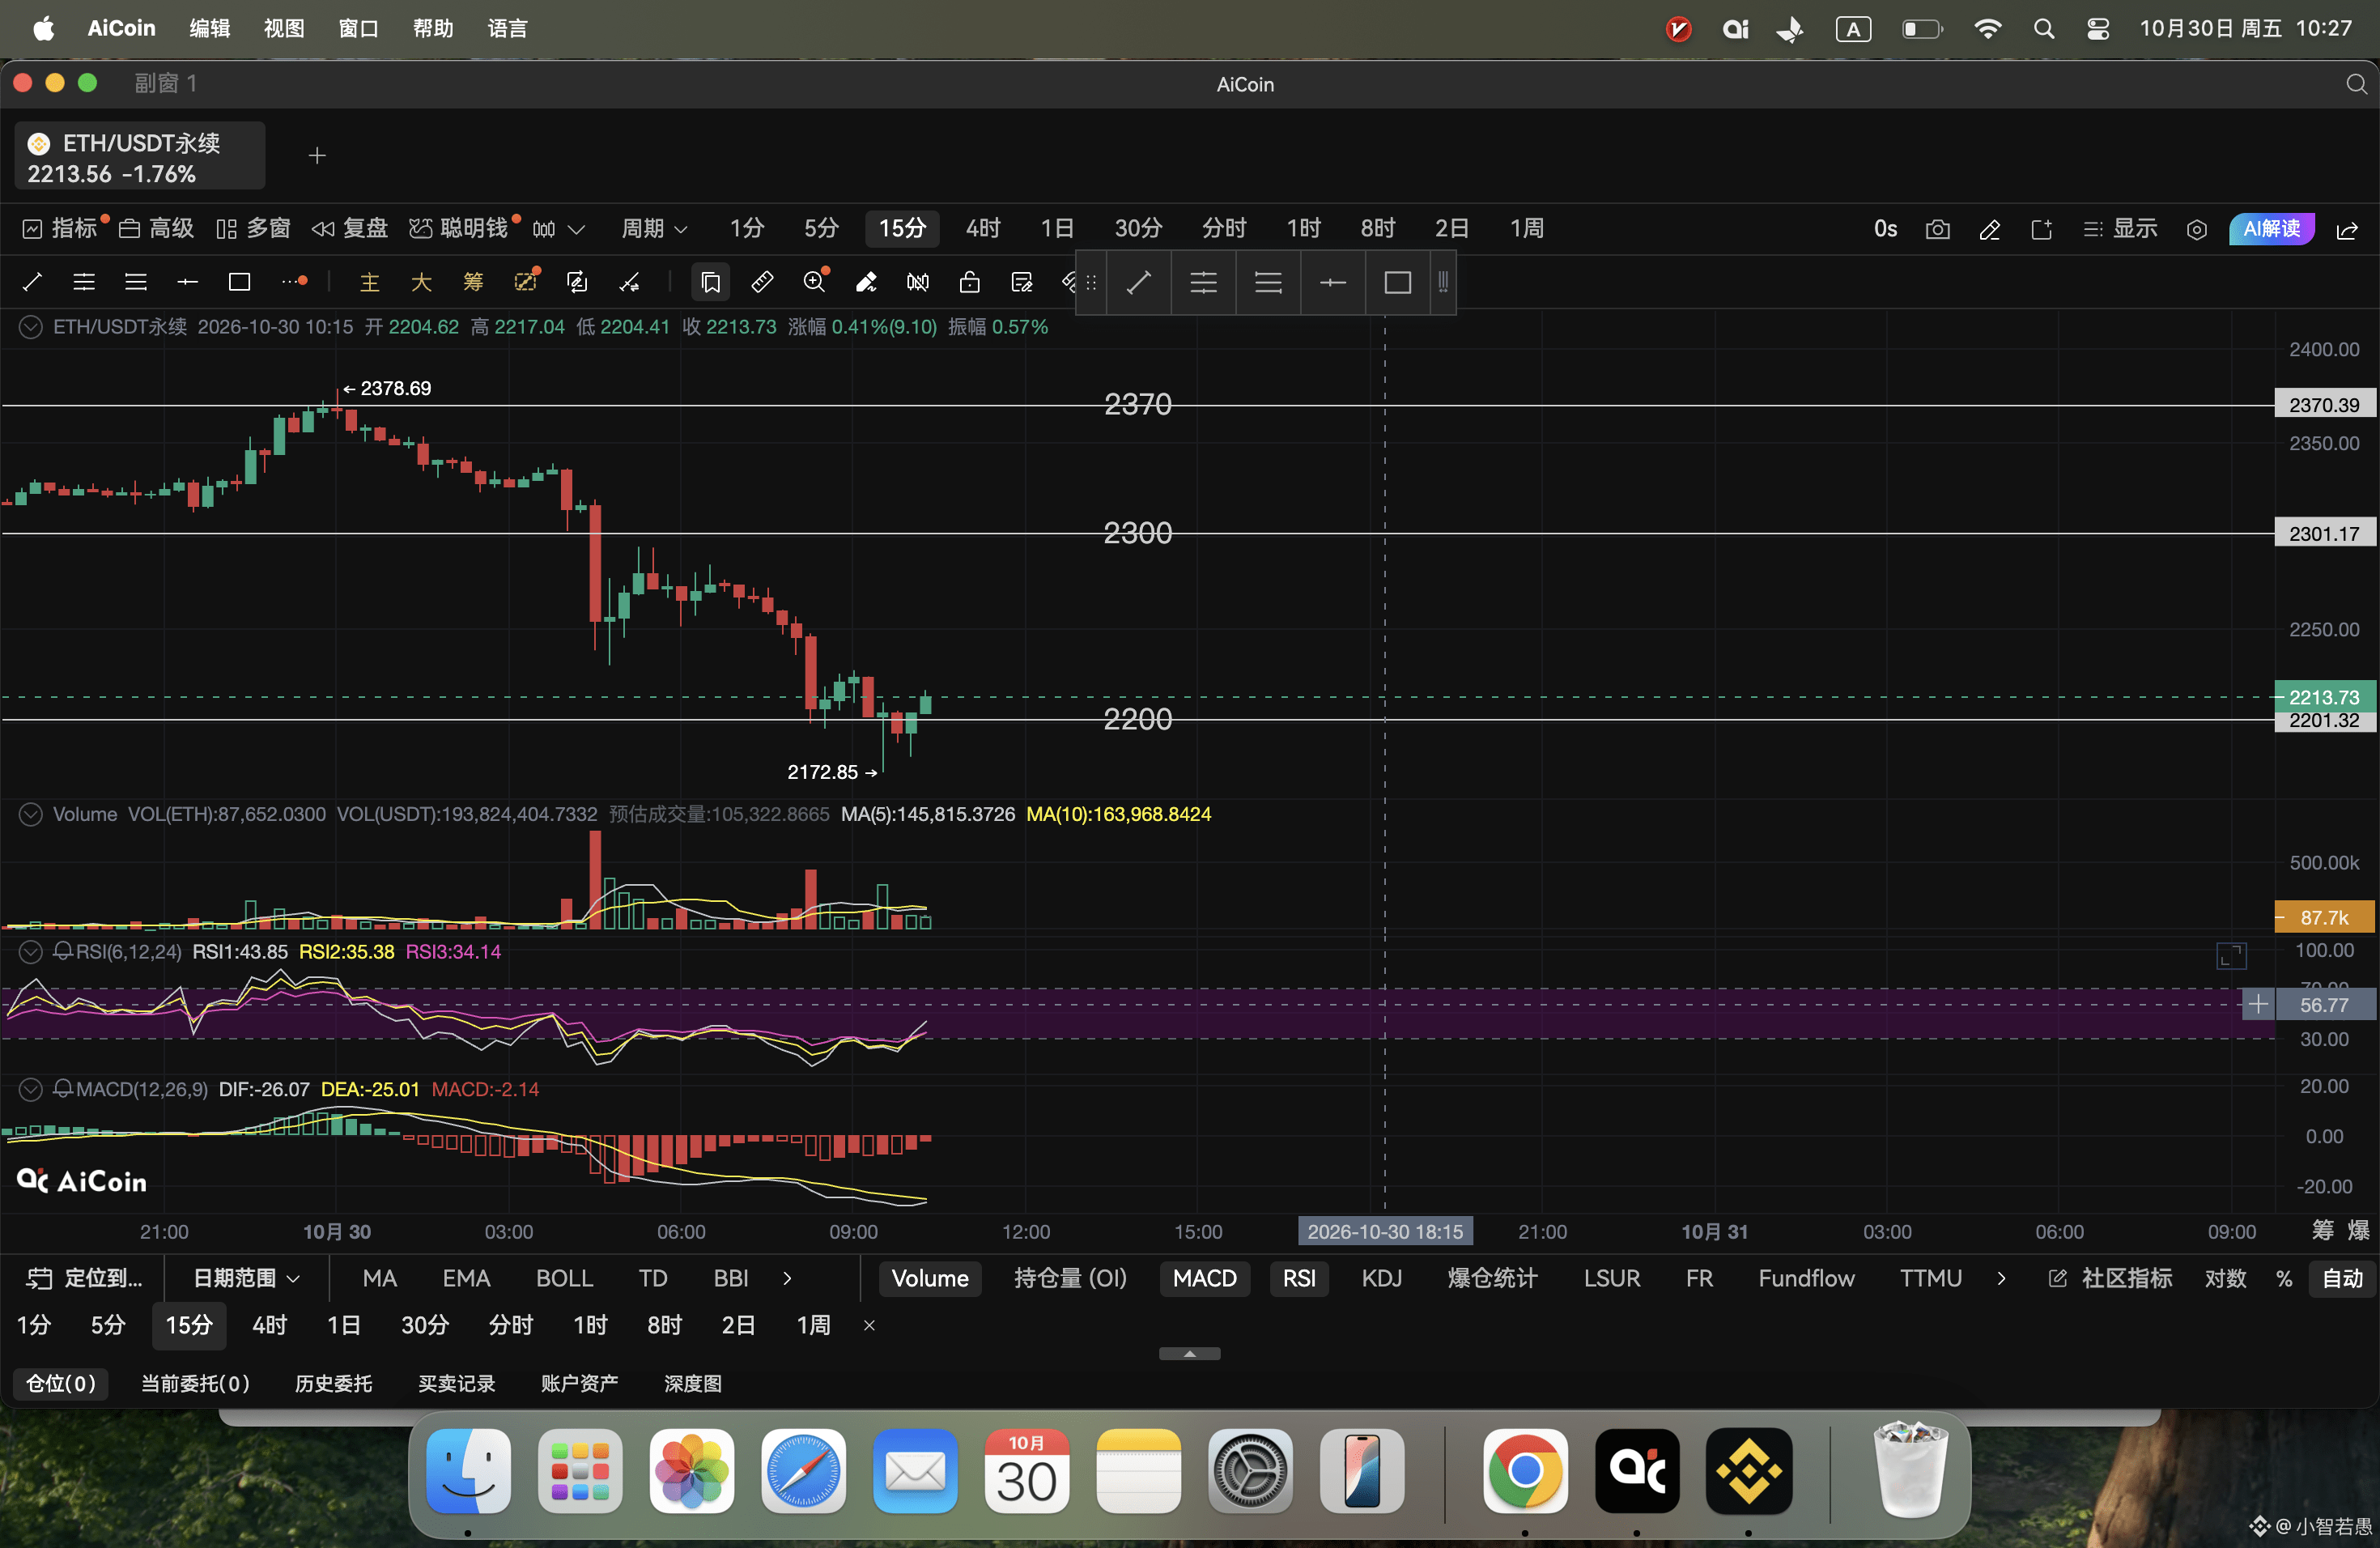
#ETH $ETH
ETH's decline was expected (at least, a decline was highly likely); the daily chart reflects this.
Intraday, look for a pullback and consolidation in the 2200–2300 range.
Small positions can trade both sides of the range.
For larger positions, favor shorts; the long-term outlook is bearish, with a target of 2000–2050.
ETH's decline was expected (at least, a decline was highly likely); the daily chart reflects this.
Intraday, look for a pullback and consolidation in the 2200–2300 range.
Small positions can trade both sides of the range.
For larger positions, favor shorts; the long-term outlook is bearish, with a target of 2000–2050.
2
1
850
·
--
Bearish
$HYPE The upward momentum is slowing. Going long is not recommended; be cautious.
If it breaks above 90 and holds, you can go long.
It may consolidate around 88 for a while. Pay attention to the candlestick direction before placing an order.
{future}(HYPEUSDT)
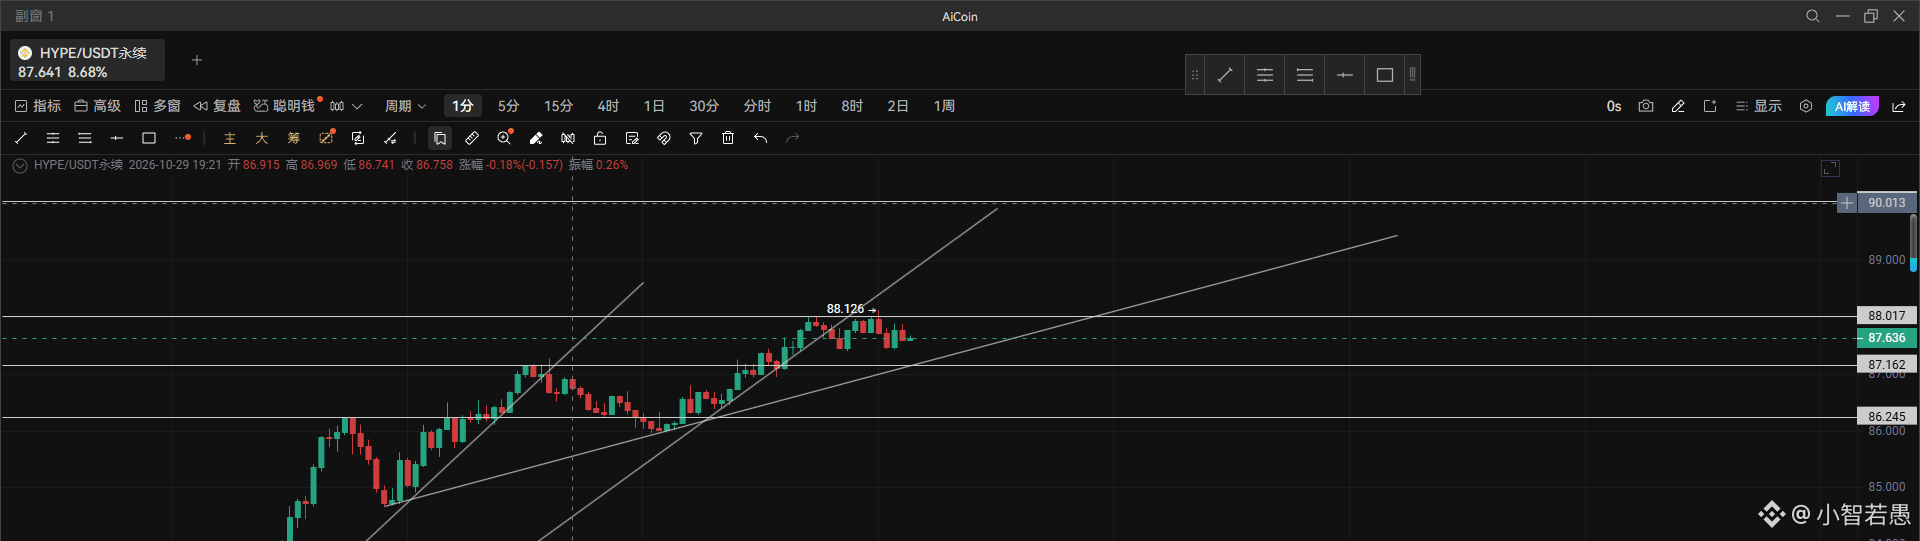
$HYPE The upward momentum is slowing. Going long is not recommended; be cautious.
If it breaks above 90 and holds, you can go long.
It may consolidate around 88 for a while. Pay attention to the candlestick direction before placing an order.
If it breaks above 90 and holds, you can go long.
It may consolidate around 88 for a while. Pay attention to the candlestick direction before placing an order.
1
165
·
--
Bearish
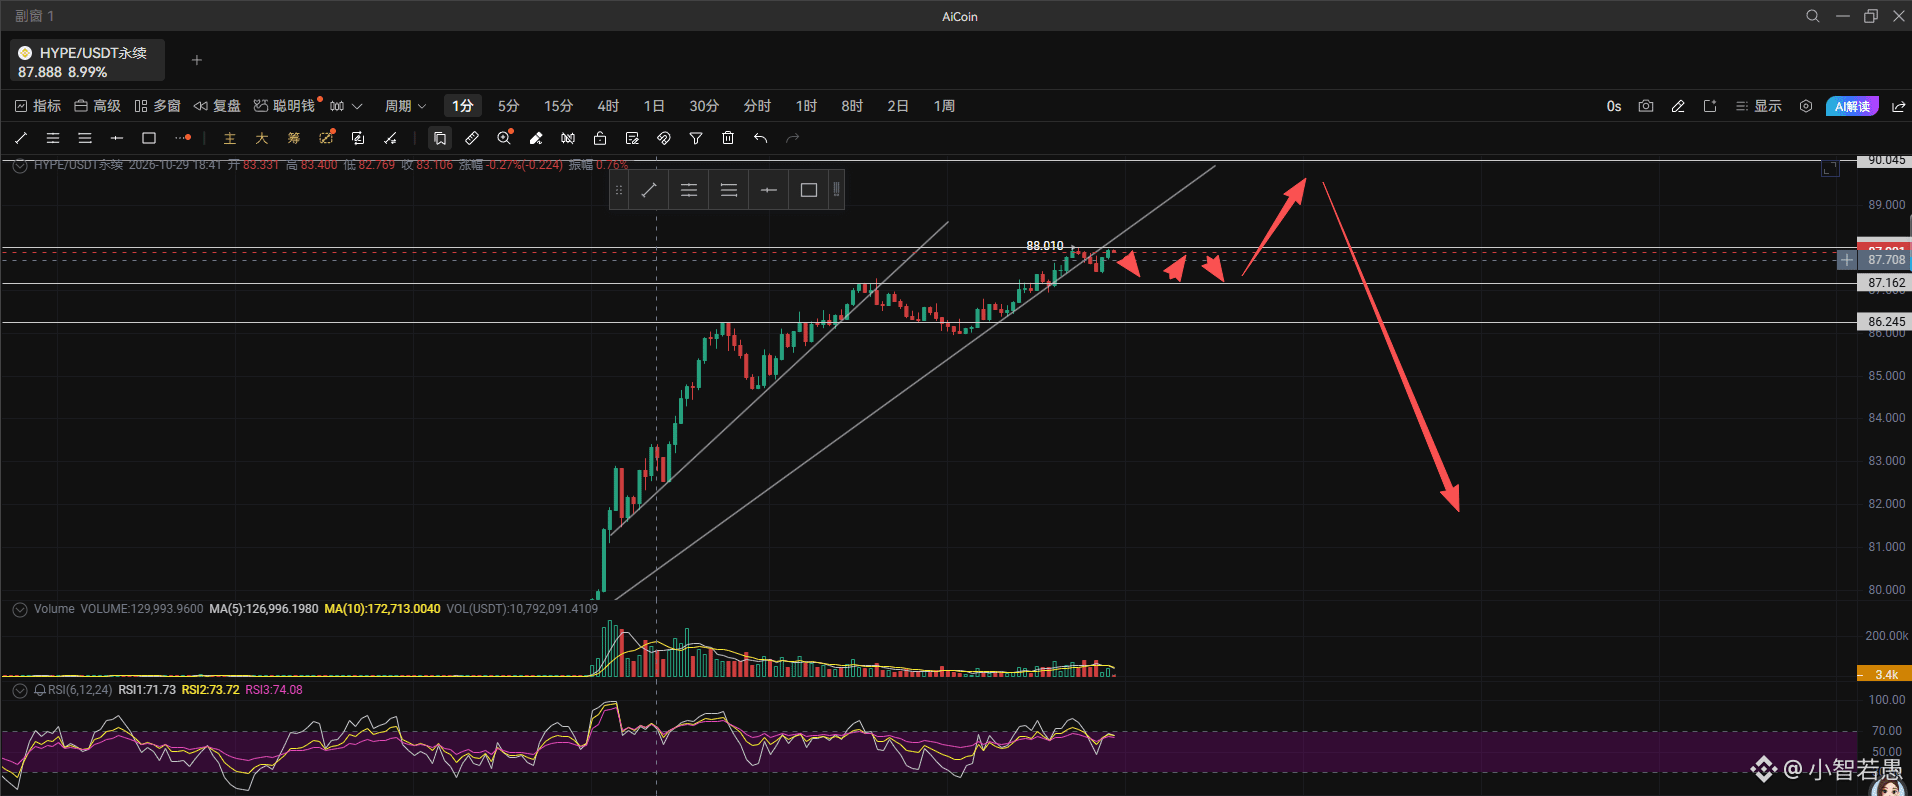
#hype $HYPE
HYPE's upward momentum is slowing.
Now consolidating between 87 and 88; it may continue rising after the consolidation.
90 is a strong psychological resistance level. Watch your take-profit.
At 90, watch how the price moves. If it can't break higher, you could open a small short position.
{future}(HYPEUSDT)
#hype $HYPE
HYPE's upward momentum is slowing.
Now consolidating between 87 and 88; it may continue rising after the consolidation.
90 is a strong psychological resistance level. Watch your take-profit.
At 90, watch how the price moves. If it can't break higher, you could open a small short position.
HYPE's upward momentum is slowing.
Now consolidating between 87 and 88; it may continue rising after the consolidation.
90 is a strong psychological resistance level. Watch your take-profit.
At 90, watch how the price moves. If it can't break higher, you could open a small short position.
160
·
--
Bullish
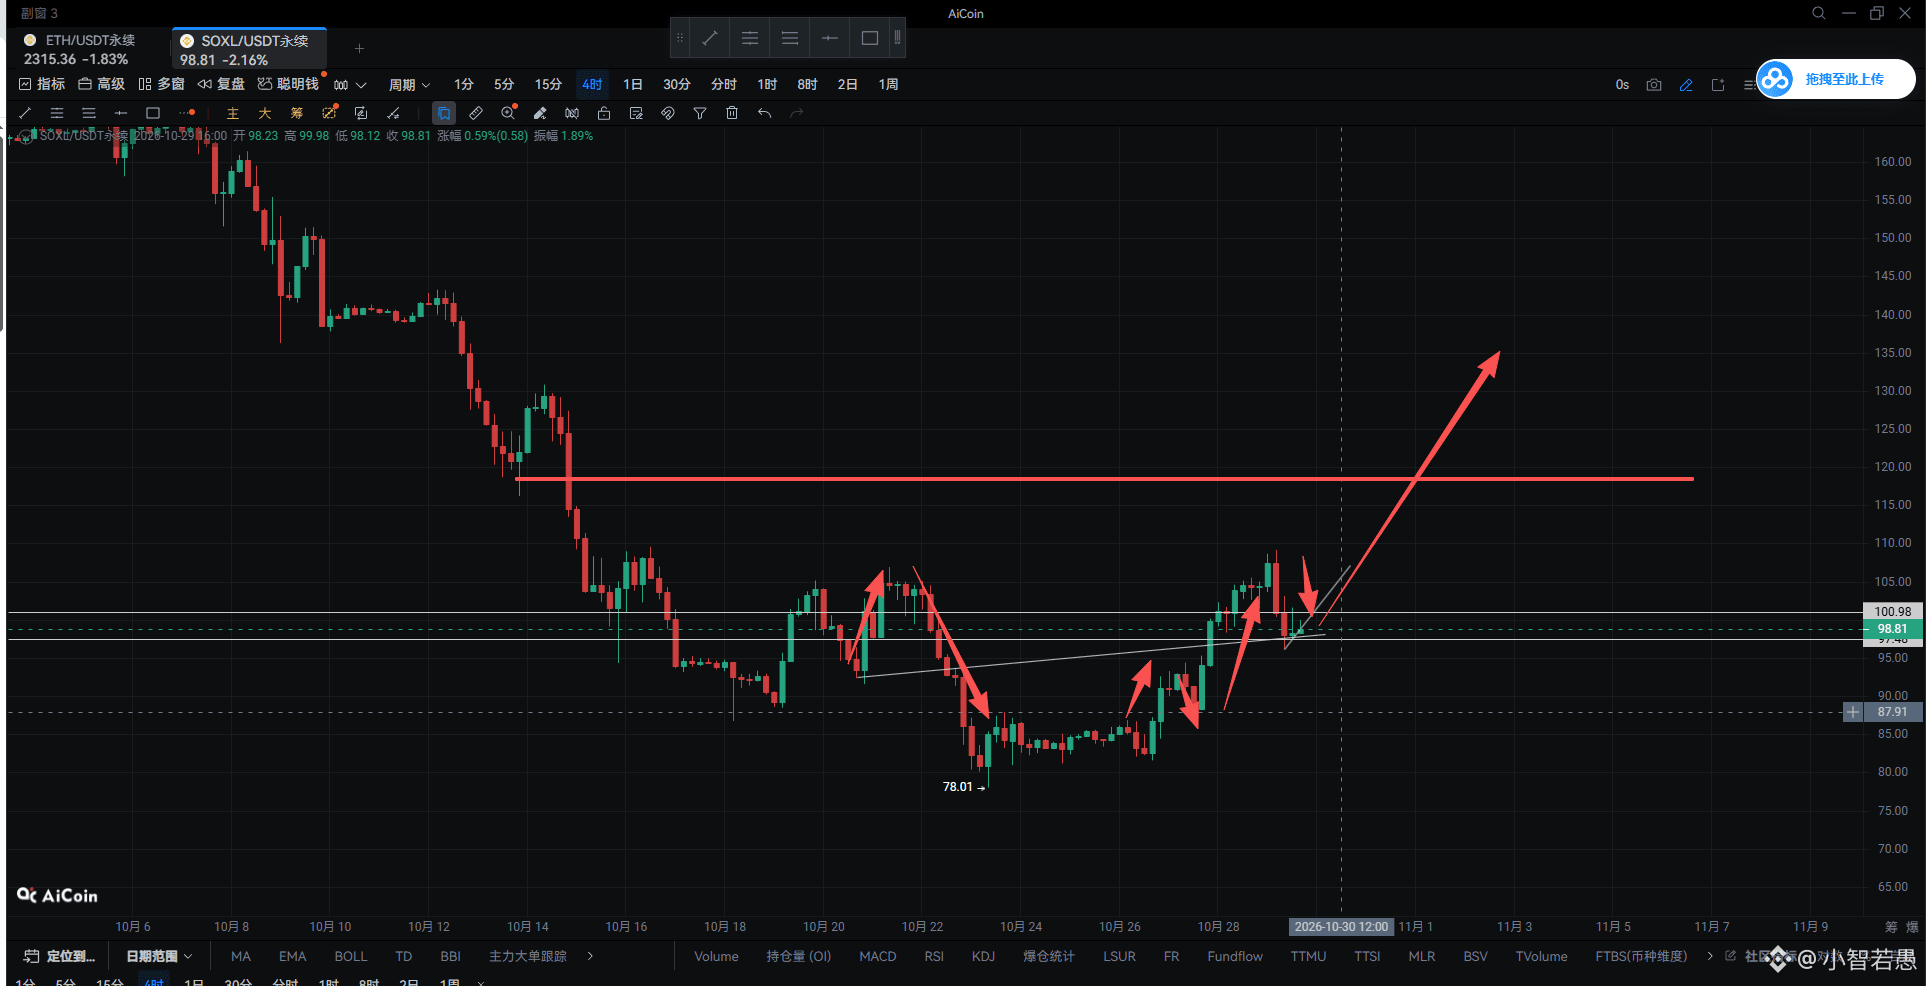
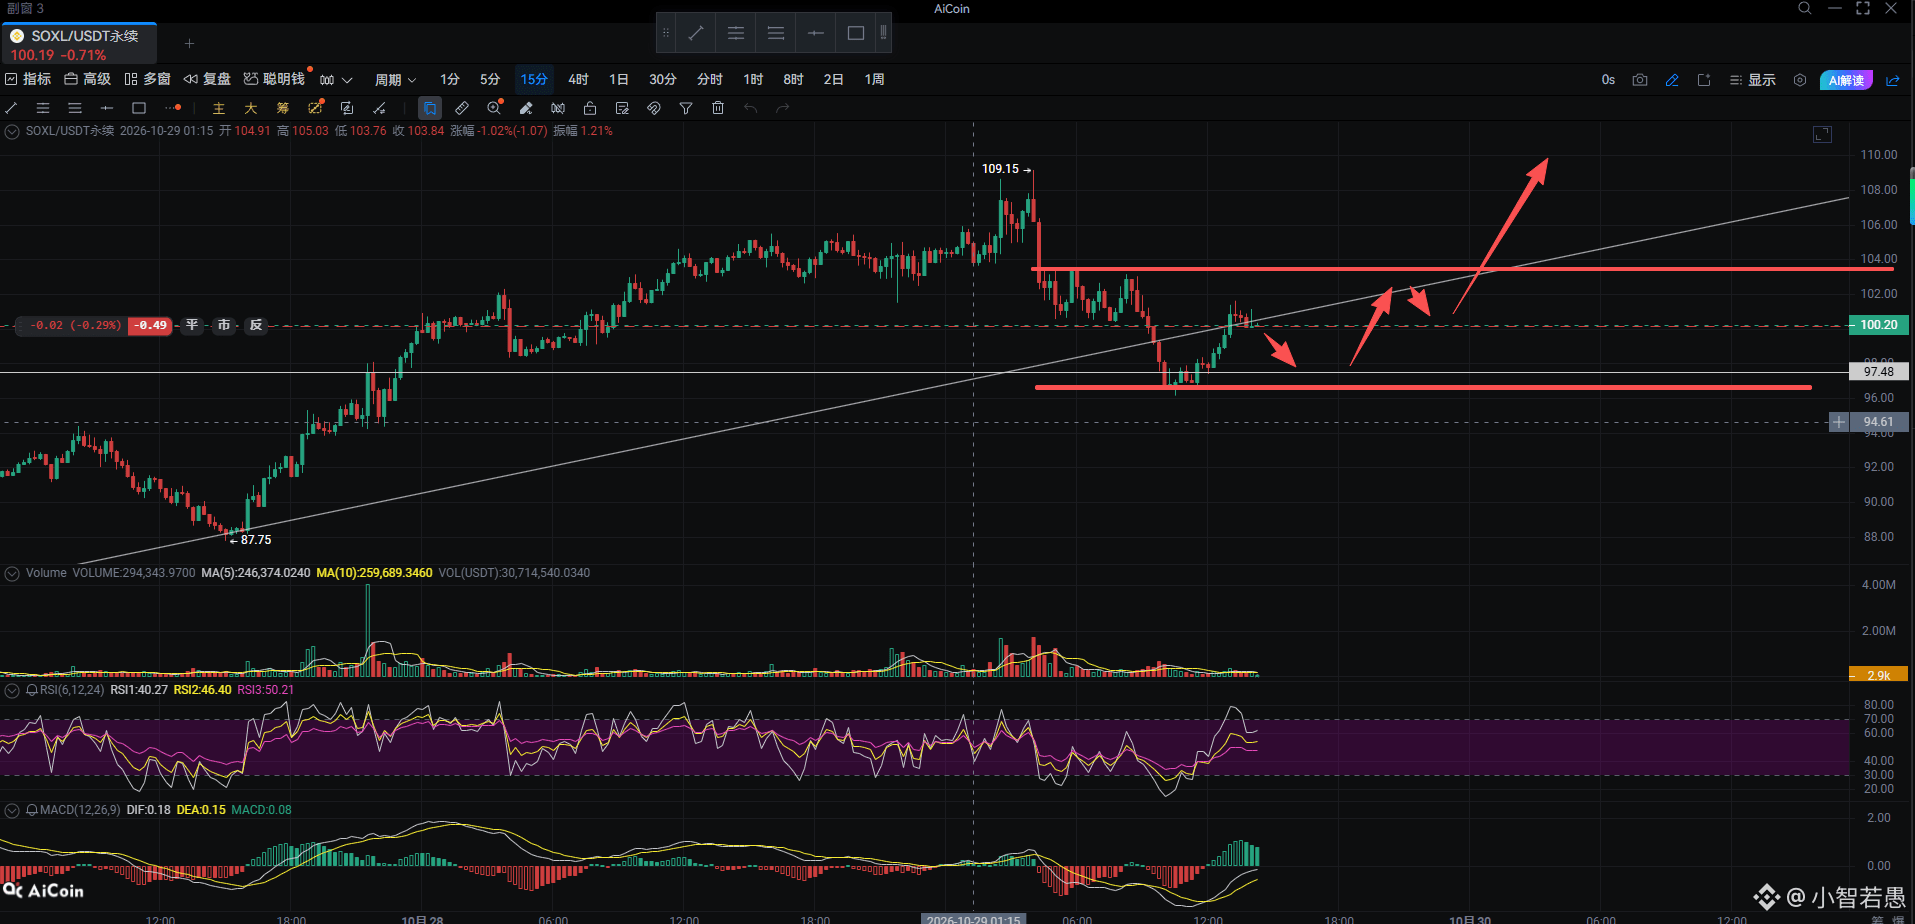
#SOXL $SOXL
Bullish on the daily chart
Expect intraday sideways consolidation (range: 95–105)
With a small position, you can trade both directions within the range
Watch the 95 and 105 levels; if either is broken, cut losses promptly
{future}(SOXLUSDT)
#SOXL $SOXL
Bullish on the daily chart
Expect intraday sideways consolidation (range: 95–105)
With a small position, you can trade both directions within the range
Watch the 95 and 105 levels; if either is broken, cut losses promptly
Bullish on the daily chart
Expect intraday sideways consolidation (range: 95–105)
With a small position, you can trade both directions within the range
Watch the 95 and 105 levels; if either is broken, cut losses promptly
1
748
·
--
Bearish
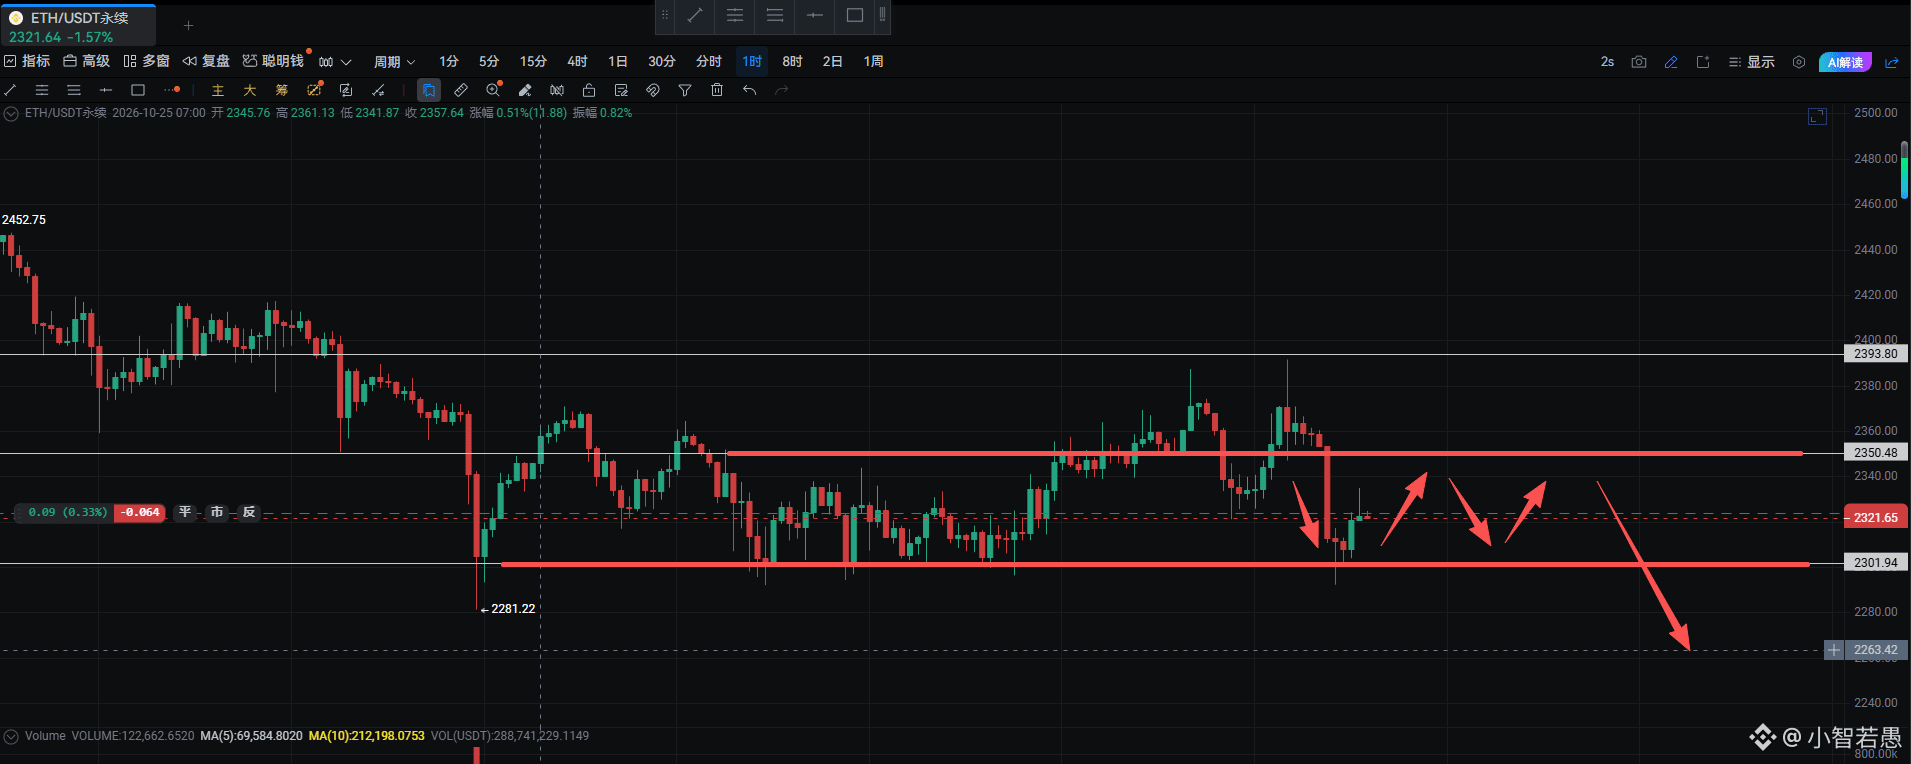
#ETH $ETH
The daily chart is still bearish
Expect sideways movement intraday (range: 2300–2350)
You can open small long and short positions back and forth in the range
{future}(ETHUSDT)
#ETH $ETH
The daily chart is still bearish
Expect sideways movement intraday (range: 2300–2350)
You can open small long and short positions back and forth in the range
The daily chart is still bearish
Expect sideways movement intraday (range: 2300–2350)
You can open small long and short positions back and forth in the range
175
·
--
Bearish
I don't know why,
I opened a short position on ETH
but long positions on FIL and ADA.
My unrealized profits were perfectly hedged out—I did all that for nothing.
$ETH
$FIL
$ADA
{future}(ADAUSDT)
{future}(FILUSDT)
I don't know why,
I opened a short position on ETH
but long positions on FIL and ADA.
My unrealized profits were perfectly hedged out—I did all that for nothing.
$ETH
$FIL
$ADA
I opened a short position on ETH
but long positions on FIL and ADA.
My unrealized profits were perfectly hedged out—I did all that for nothing.
$ETH
$FIL
$ADA
3
4
2k
·
--
I recently bought a few books on candlestick and trend theory.
One saying comes up a lot:
“If your position is making you nervous, close it. That position isn’t right for you.”
Over the past few days, I’ve had small wins and big losses here and there, but overall it’s been okay.
After reflecting on it, I think I was using too much leverage, so the fluctuations kept shaking me around.
I’m adjusting my strategy and switching to lower leverage and daily-chart trends to give that a try.
I recently bought a few books on candlestick and trend theory.
One saying comes up a lot:
“If your position is making you nervous, close it. That position isn’t right for you.”
Over the past few days, I’ve had small wins and big losses here and there, but overall it’s been okay.
After reflecting on it, I think I was using too much leverage, so the fluctuations kept shaking me around.
I’m adjusting my strategy and switching to lower leverage and daily-chart trends to give that a try.
One saying comes up a lot:
“If your position is making you nervous, close it. That position isn’t right for you.”
Over the past few days, I’ve had small wins and big losses here and there, but overall it’s been okay.
After reflecting on it, I think I was using too much leverage, so the fluctuations kept shaking me around.
I’m adjusting my strategy and switching to lower leverage and daily-chart trends to give that a try.
72
Log in to explore more content
Join global crypto users on Binance Square
⚡️ Get latest and useful information about crypto.
💬 Trusted by the world’s largest crypto exchange.
👍 Discover real insights from verified creators.
Email / Phone number
Trending Topics
BinanceReopensWithdrawalsForMoreAssets
571,684 views
2,590 Discussing
Security Incident | Recovery Update #6: Withdrawals Reopen for More Assets (2026-11-03)
Binance Announcement
·192 Likes
·549.4k views
BTCRebounds80K
97,463 views
984 Discussing
Binance98PercentReplenished
53,268 views
725 Discussing