
CryptoBubblesOrg
300 Posts

CryptoBubblesOrg
Report
Block User
Live crypto bubble chart and heatmap. Free, no ads. cryptobubbles.org
13 Following
14 Followers
27 Liked
Posts
All
Videos
Altcoin Season Index: 36/100
Neither side in control yet. This is where rotations start.
Bitcoin over 90 days: +0.5%
Top alts over 90 days: $QNT +174.9%, $NEAR +94.1%, $ARB +75.8%
Is altseason coming, or is it Bitcoin's cycle?
Follow for the whole market in bubbles, every hour.
#Altcoins
Altcoin Season Index: 36/100
Neither side in control yet. This is where rotations start.
Bitcoin over 90 days: +0.5%
Top alts over 90 days: $QNT +174.9%, $NEAR +94.1%, $ARB +75.8%
Is altseason coming, or is it Bitcoin's cycle?
Follow for the whole market in bubbles, every hour.
#Altcoins
Neither side in control yet. This is where rotations start.
Bitcoin over 90 days: +0.5%
Top alts over 90 days: $QNT +174.9%, $NEAR +94.1%, $ARB +75.8%
Is altseason coming, or is it Bitcoin's cycle?
Follow for the whole market in bubbles, every hour.
#Altcoins
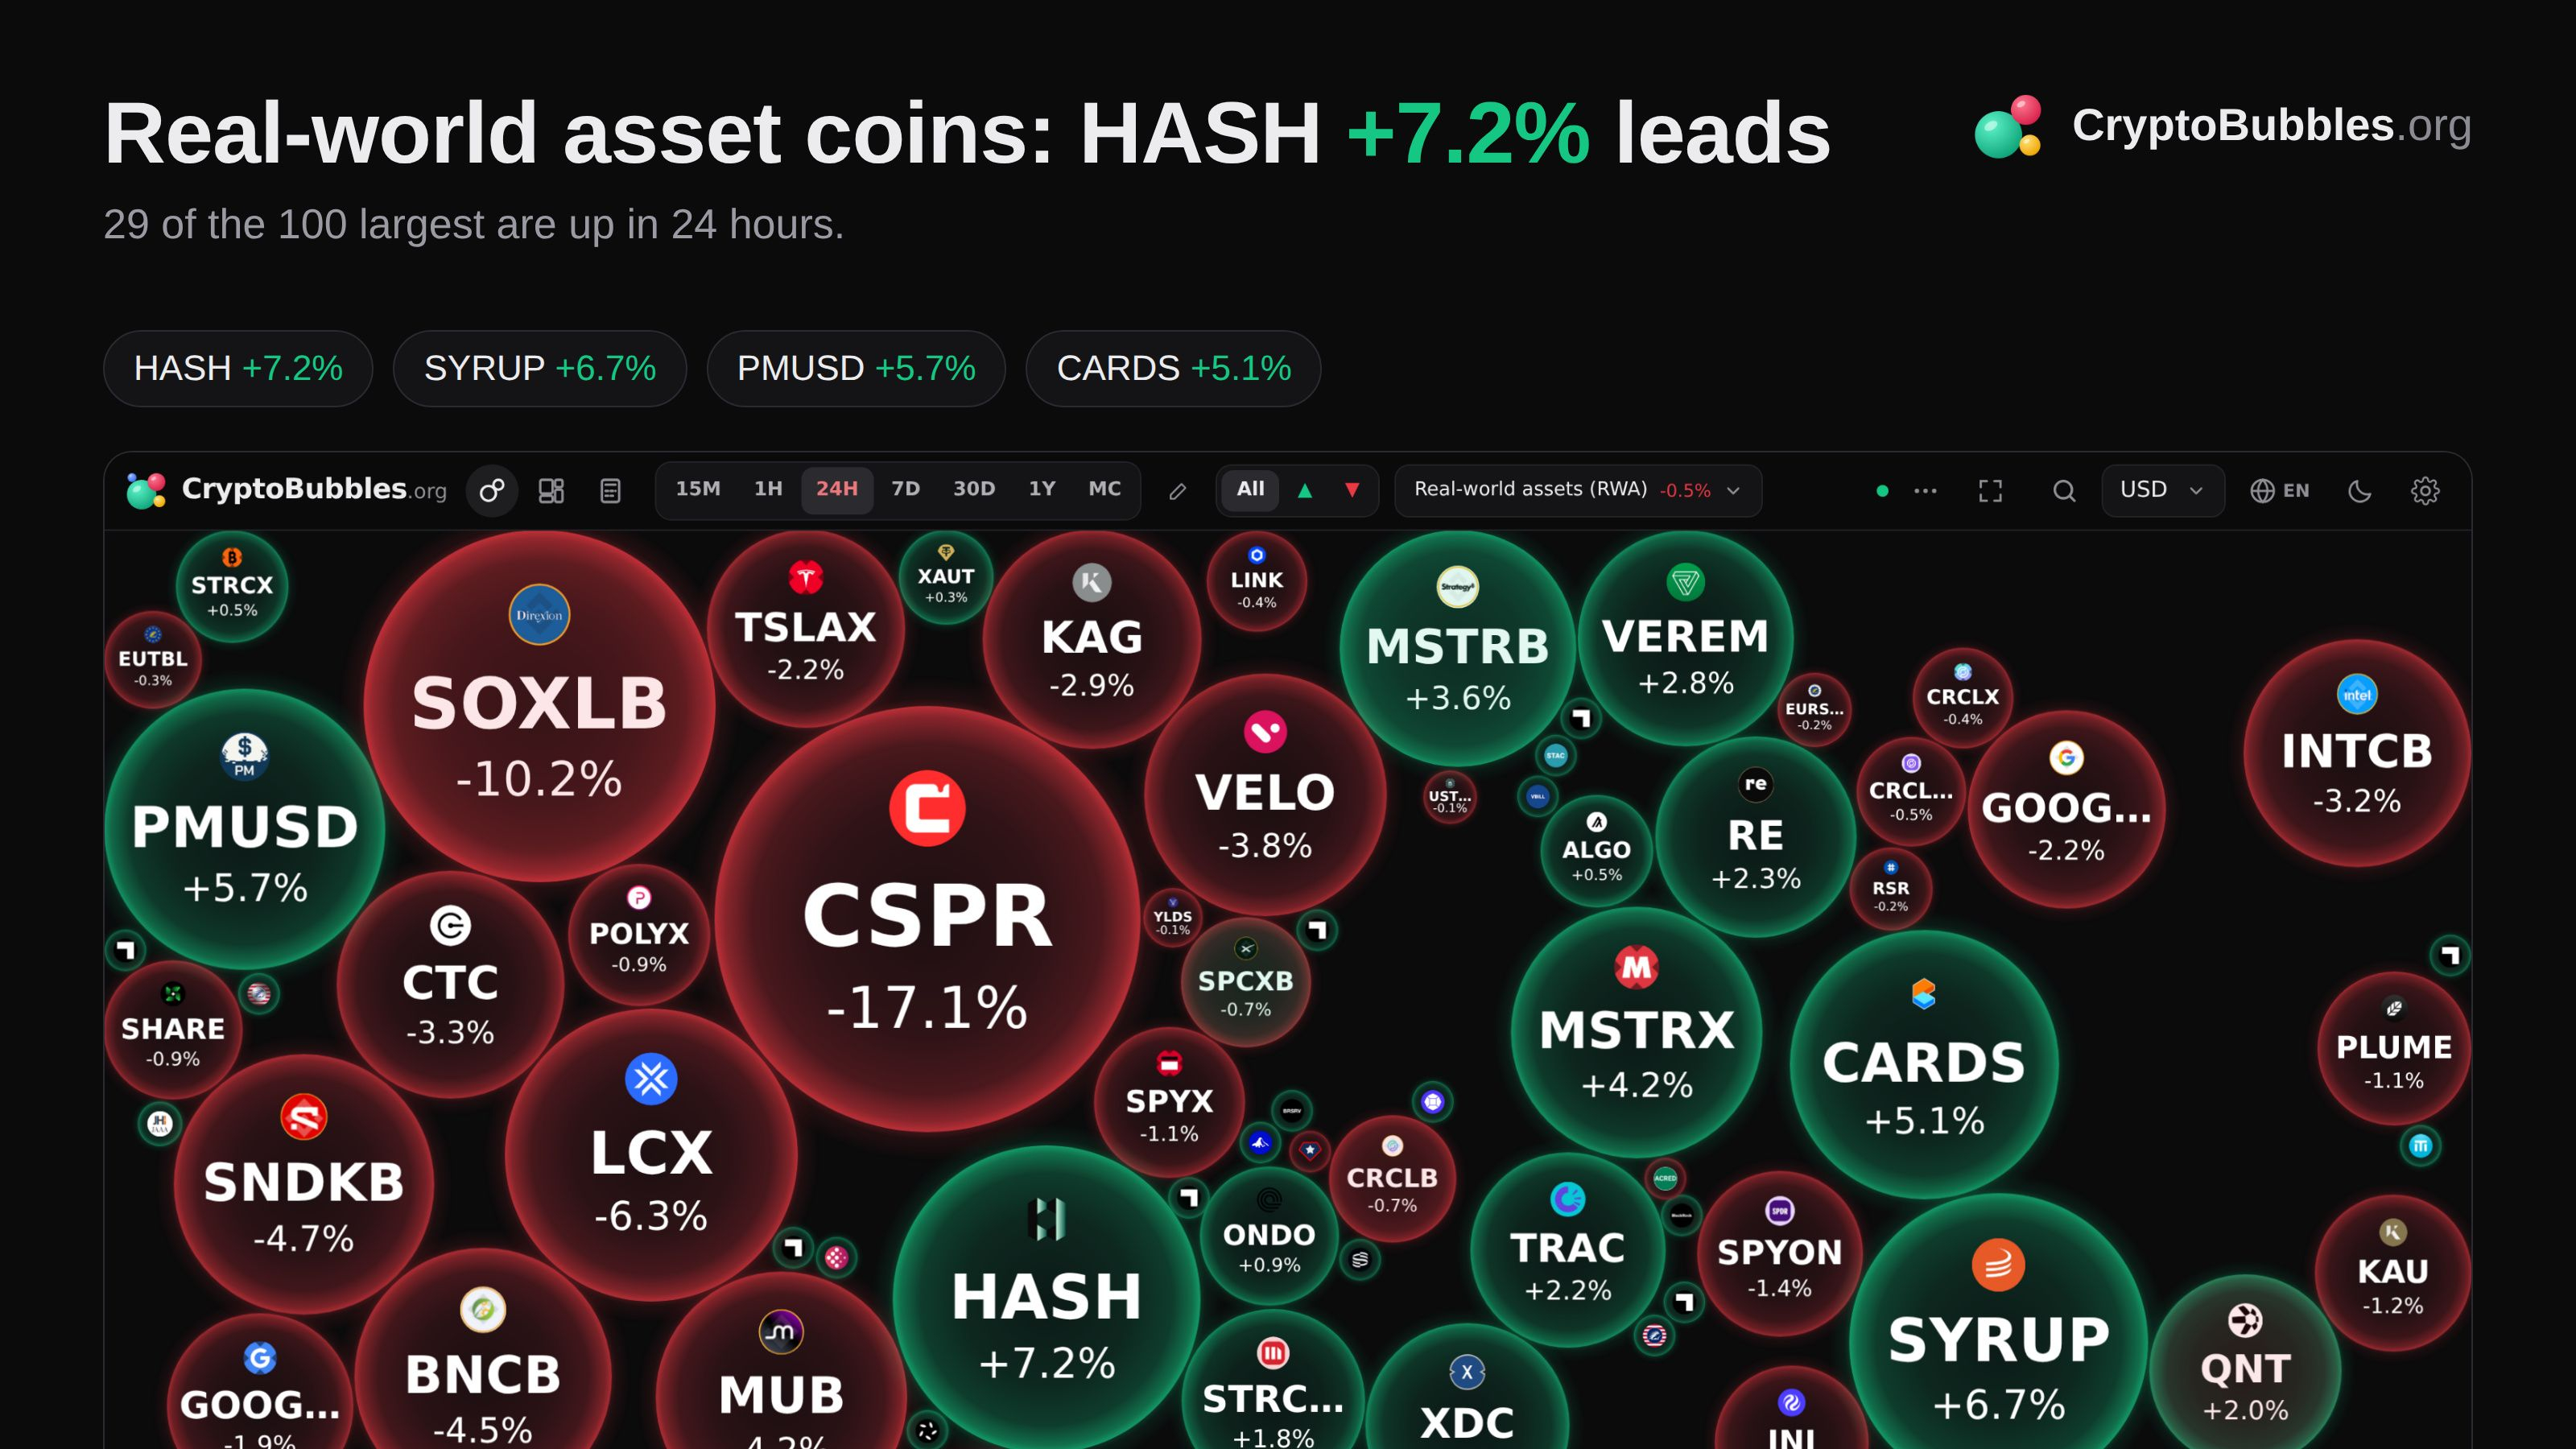
Sector check.
Real-world asset coins are cooling off, but $HASH is up +7.2% against the tide.
29 of the 100 largest are up in 24h.
Also up: $SYRUP +6.7%, PMUSD +5.7%
Lagging: CSPR -17.1%, SOXLB -10.2%
My take: The sector is red almost across the board. One leader does not make a trend.
Name one coin here that survives the next cycle.
Follow for an hourly picture of the market.
#Crypto
Sector check.
Real-world asset coins are cooling off, but $HASH is up +7.2% against the tide.
29 of the 100 largest are up in 24h.
Also up: $SYRUP +6.7%, PMUSD +5.7%
Lagging: CSPR -17.1%, SOXLB -10.2%
My take: The sector is red almost across the board. One leader does not make a trend.
Name one coin here that survives the next cycle.
Follow for an hourly picture of the market.
#Crypto
Real-world asset coins are cooling off, but $HASH is up +7.2% against the tide.
29 of the 100 largest are up in 24h.
Also up: $SYRUP +6.7%, PMUSD +5.7%
Lagging: CSPR -17.1%, SOXLB -10.2%
My take: The sector is red almost across the board. One leader does not make a trend.
Name one coin here that survives the next cycle.
Follow for an hourly picture of the market.
#Crypto
13
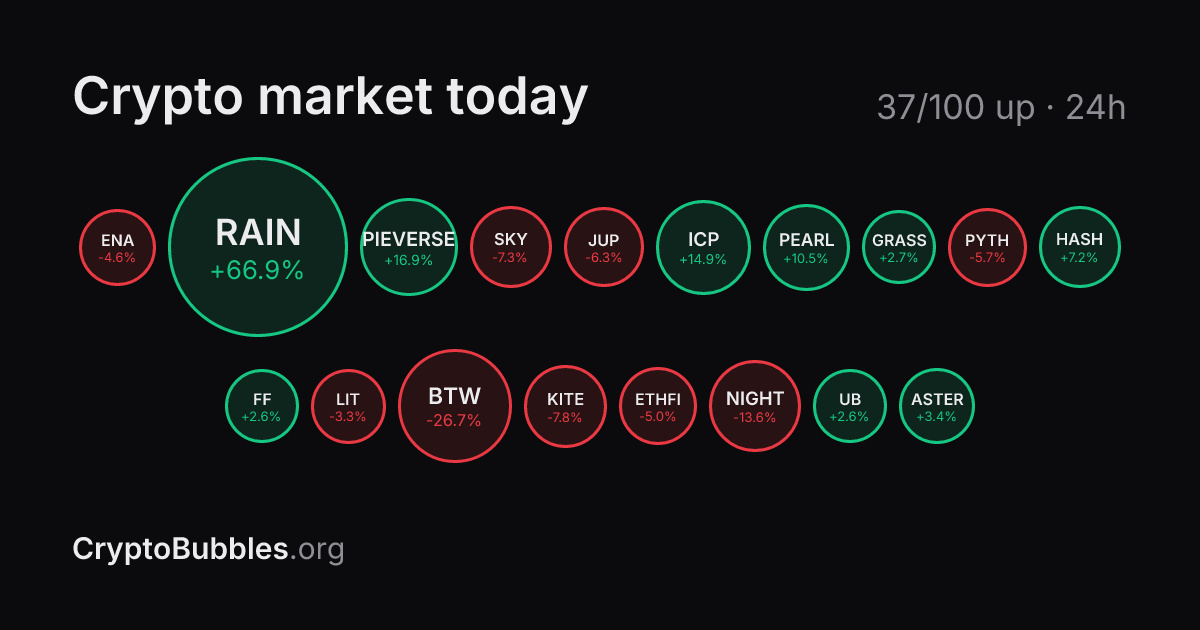
Today's top gainers.
$RAIN is ripping: +90.3% in 24 hours. Here is who is leading the pack.
$RAIN +90.3%
$PIEVERSE +19.9%
$ICP +15.3%
PEARL +11.6%
HASH +8.6%
55 of the top 100 coins are green today.
My take: A move this size in the top 100 is rare. Most of it is usually given back within a week.
Did anyone call this one?
Follow for an hourly picture of the market.
#Crypto
Today's top gainers.
$RAIN is ripping: +90.3% in 24 hours. Here is who is leading the pack.
$RAIN +90.3%
$PIEVERSE +19.9%
$ICP +15.3%
PEARL +11.6%
HASH +8.6%
55 of the top 100 coins are green today.
My take: A move this size in the top 100 is rare. Most of it is usually given back within a week.
Did anyone call this one?
Follow for an hourly picture of the market.
#Crypto
$RAIN is ripping: +90.3% in 24 hours. Here is who is leading the pack.
$RAIN +90.3%
$PIEVERSE +19.9%
$ICP +15.3%
PEARL +11.6%
HASH +8.6%
55 of the top 100 coins are green today.
My take: A move this size in the top 100 is rare. Most of it is usually given back within a week.
Did anyone call this one?
Follow for an hourly picture of the market.
#Crypto
306
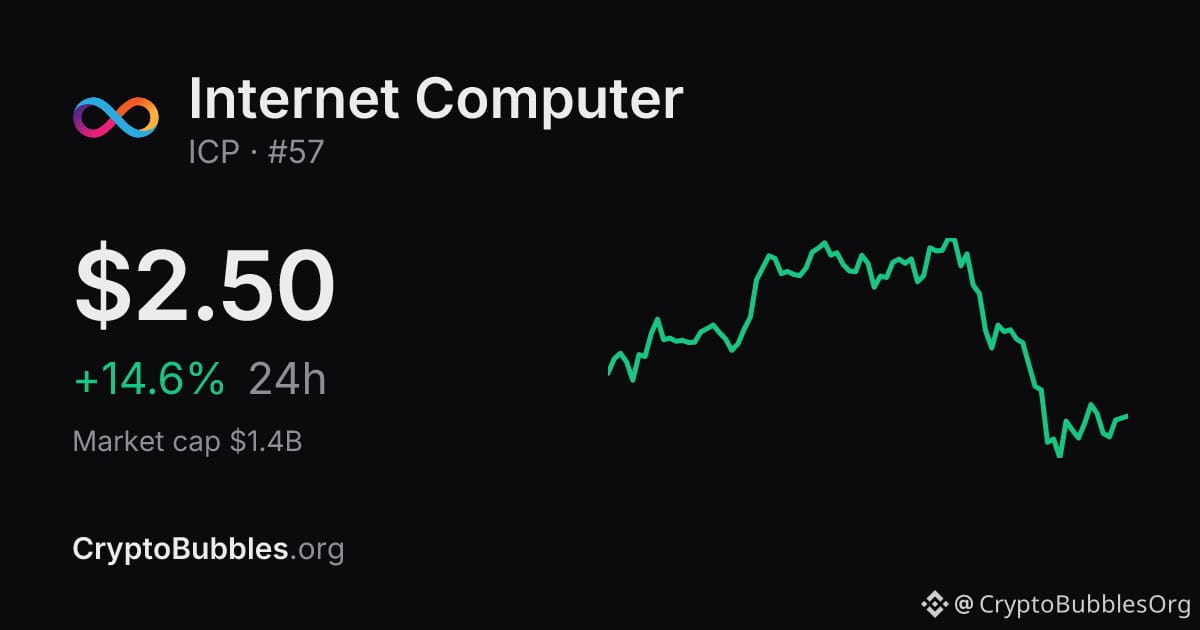
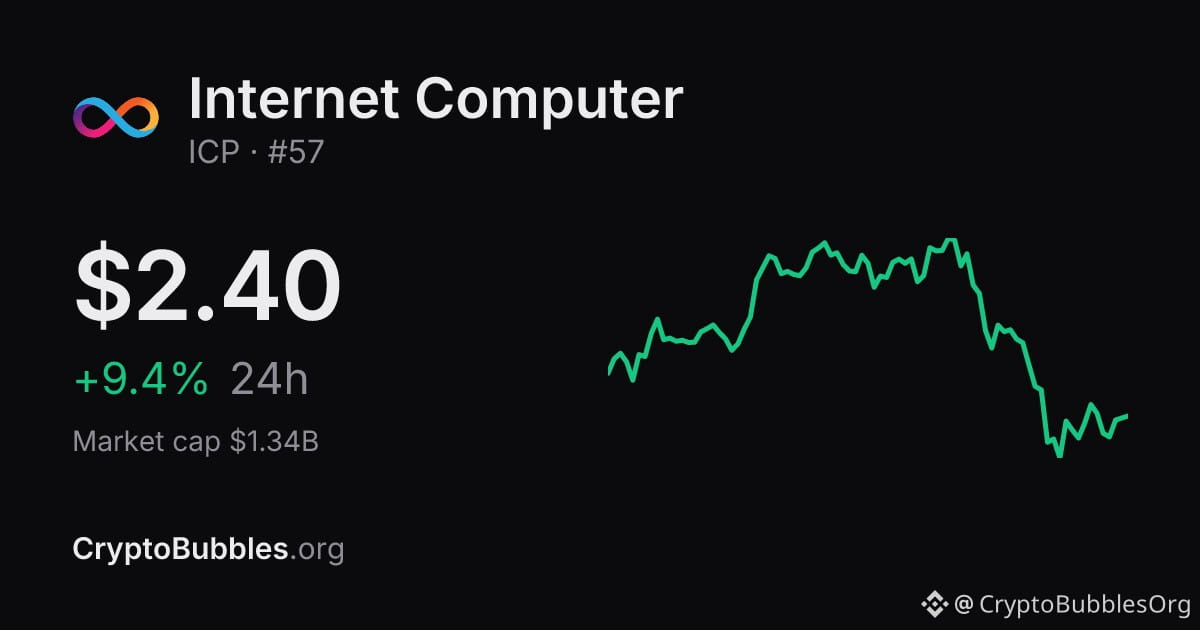
$ICP is exploding: +14.6% in 24 hours.
Price $2.5 · 24h +14.6% · 7d +1.4%
Rank #57 · market cap $1.4B
Moves like this rarely come out of nowhere. Someone knew something, or everyone wants in.
Too late to get in, or just the beginning?
Follow for the whole market in bubbles, every hour.
#CryptoNews
$ICP is exploding: +14.6% in 24 hours.
Price $2.5 · 24h +14.6% · 7d +1.4%
Rank #57 · market cap $1.4B
Moves like this rarely come out of nowhere. Someone knew something, or everyone wants in.
Too late to get in, or just the beginning?
Follow for the whole market in bubbles, every hour.
#CryptoNews
Price $2.5 · 24h +14.6% · 7d +1.4%
Rank #57 · market cap $1.4B
Moves like this rarely come out of nowhere. Someone knew something, or everyone wants in.
Too late to get in, or just the beginning?
Follow for the whole market in bubbles, every hour.
#CryptoNews
24
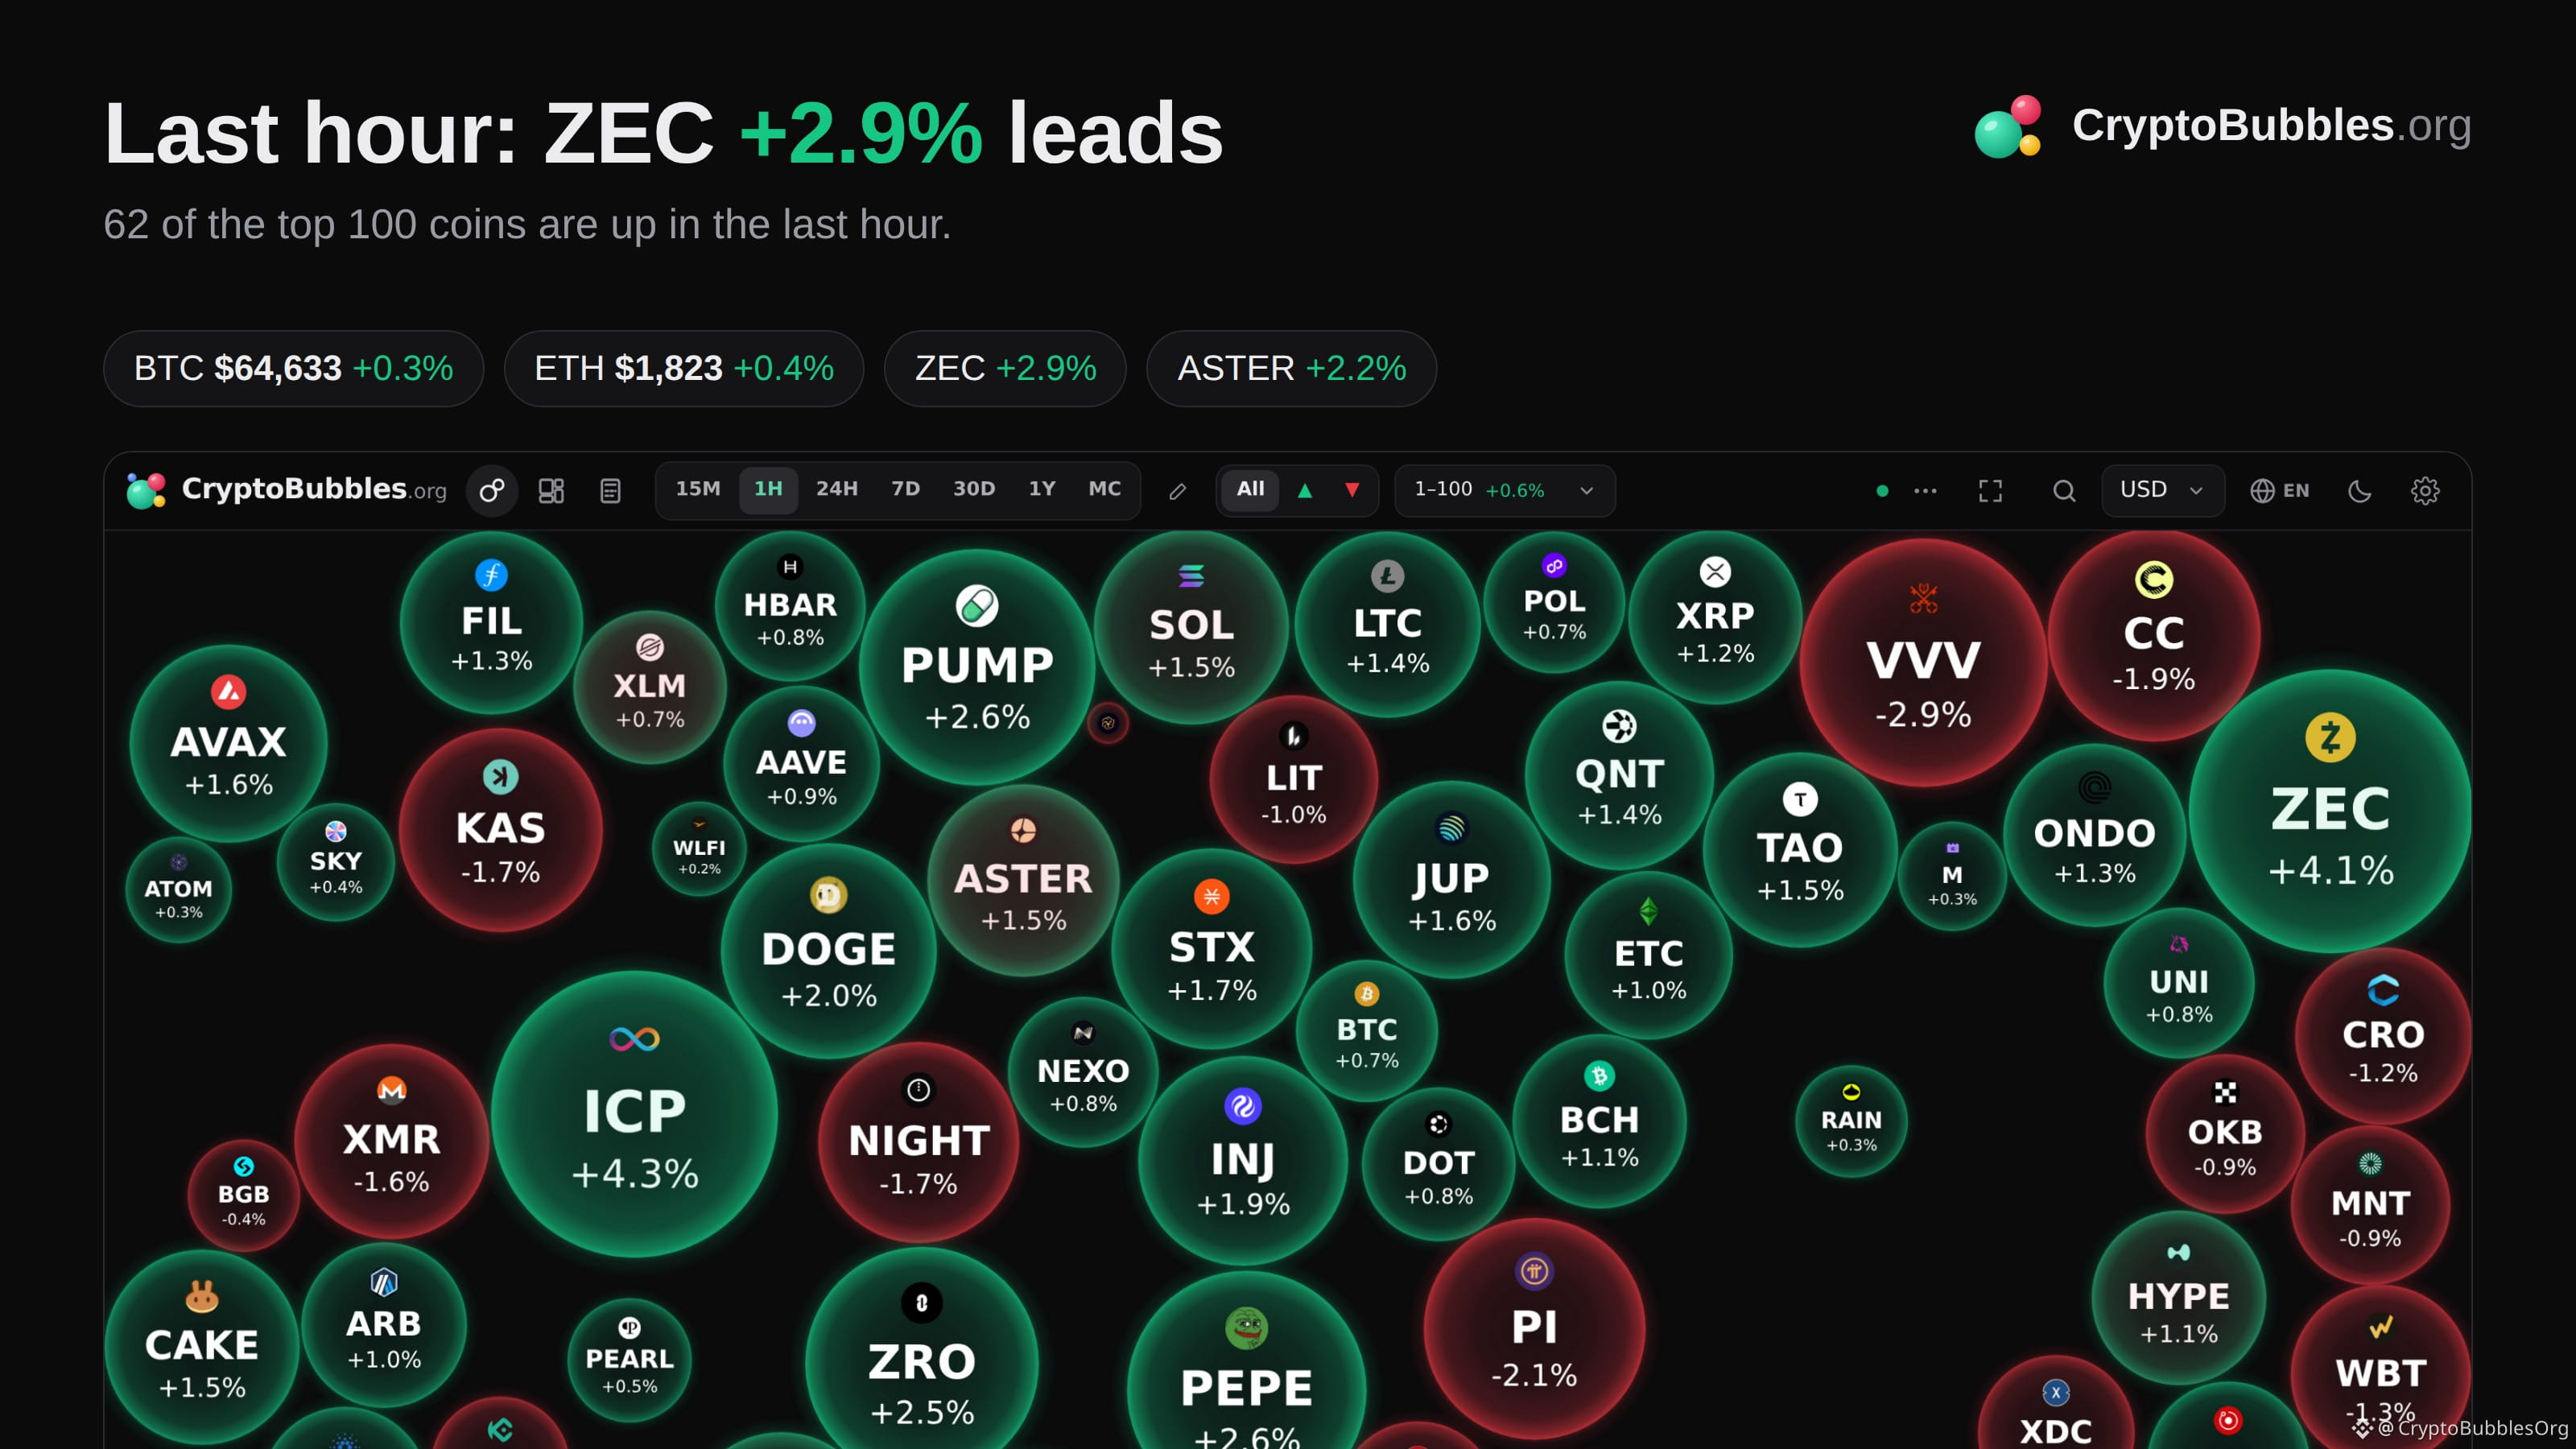
Just looked at the last hour.
$ZEC just moved +2.9% in one hour. Momentum is talking. Are you listening?
62 of the top 100 coins are up this hour.
Fastest: $ZEC +2.9%, $ASTER +2.2%, PIEVERSE +1.9%
Slipping: VVV -2.9%, PI -2.1%
$BTC $64,633 (+0.3%)
My take: Quiet hour. The big moves come right after everyone stops watching.
Anyone in this one right now?
Follow for an hourly picture of the market.
#Crypto
Just looked at the last hour.
$ZEC just moved +2.9% in one hour. Momentum is talking. Are you listening?
62 of the top 100 coins are up this hour.
Fastest: $ZEC +2.9%, $ASTER +2.2%, PIEVERSE +1.9%
Slipping: VVV -2.9%, PI -2.1%
$BTC $64,633 (+0.3%)
My take: Quiet hour. The big moves come right after everyone stops watching.
Anyone in this one right now?
Follow for an hourly picture of the market.
#Crypto
$ZEC just moved +2.9% in one hour. Momentum is talking. Are you listening?
62 of the top 100 coins are up this hour.
Fastest: $ZEC +2.9%, $ASTER +2.2%, PIEVERSE +1.9%
Slipping: VVV -2.9%, PI -2.1%
$BTC $64,633 (+0.3%)
My take: Quiet hour. The big moves come right after everyone stops watching.
Anyone in this one right now?
Follow for an hourly picture of the market.
#Crypto
176
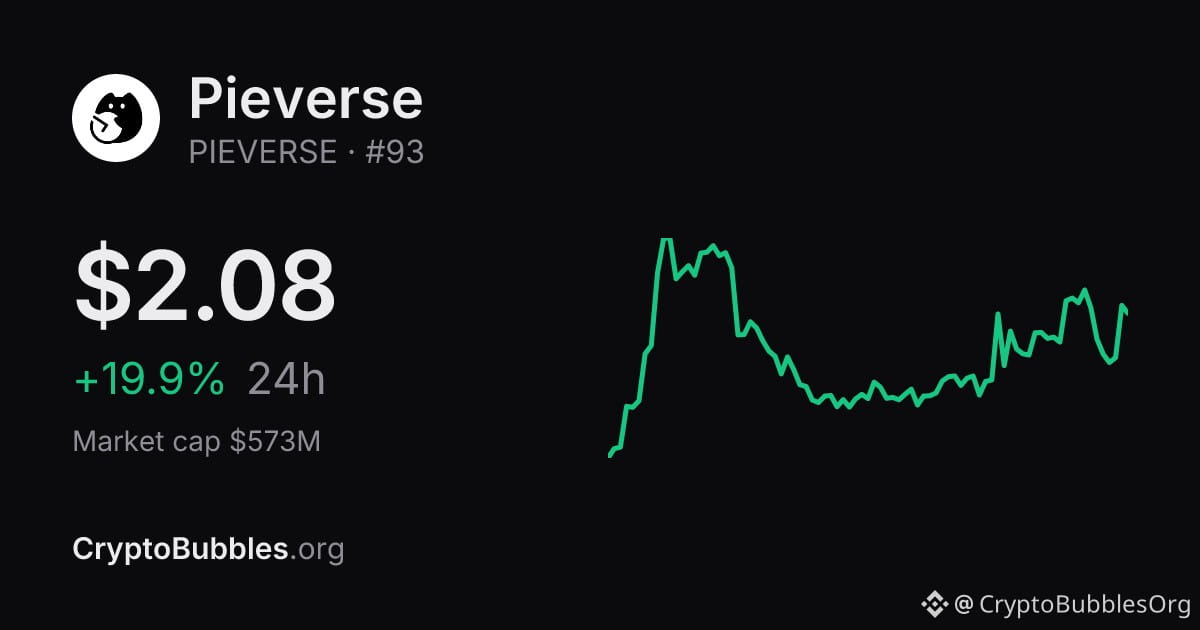
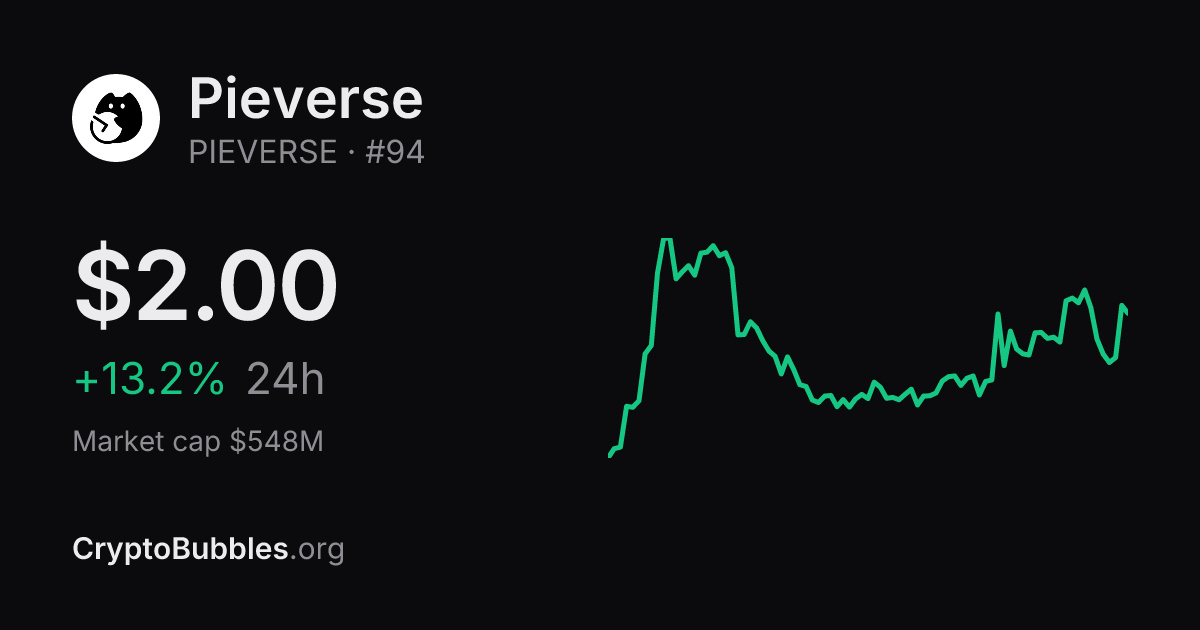
$PIEVERSE is exploding: +13.2% in 24 hours.
Price $2 · 24h +13.2% · 7d +9.5%
Rank #94 · market cap $548M
Moves like this rarely come out of nowhere. Someone knew something, or everyone wants in.
Chasing it, or waiting for the retest?
Follow for the whole market in bubbles, every hour.
#CryptoNews
$PIEVERSE is exploding: +13.2% in 24 hours.
Price $2 · 24h +13.2% · 7d +9.5%
Rank #94 · market cap $548M
Moves like this rarely come out of nowhere. Someone knew something, or everyone wants in.
Chasing it, or waiting for the retest?
Follow for the whole market in bubbles, every hour.
#CryptoNews
Price $2 · 24h +13.2% · 7d +9.5%
Rank #94 · market cap $548M
Moves like this rarely come out of nowhere. Someone knew something, or everyone wants in.
Chasing it, or waiting for the retest?
Follow for the whole market in bubbles, every hour.
#CryptoNews
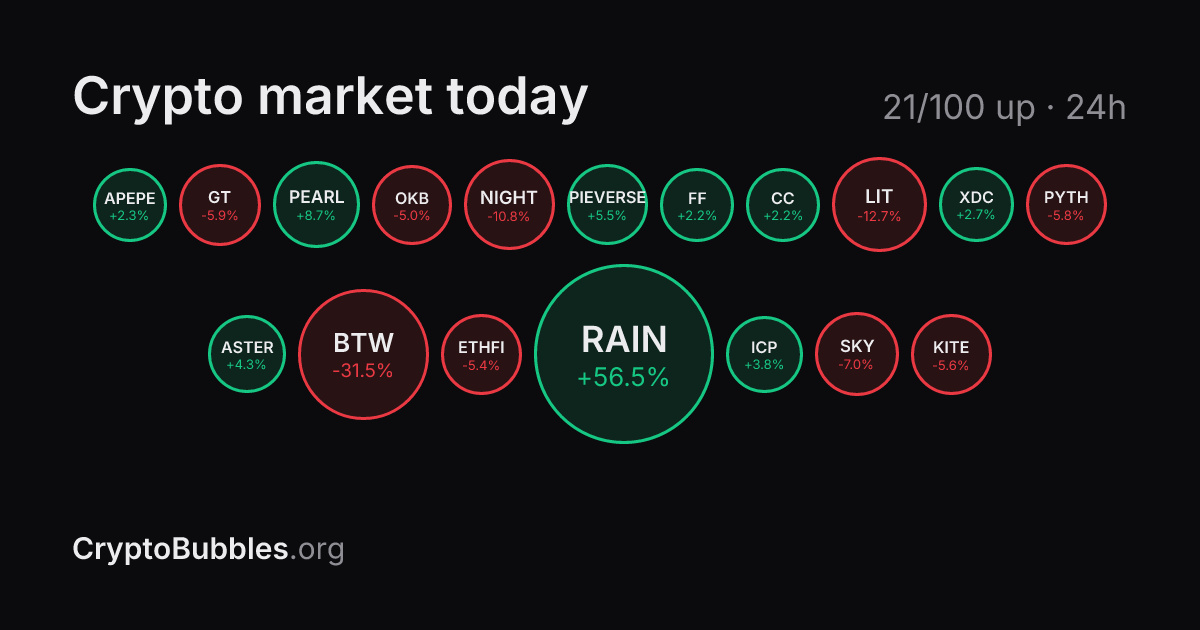
Here is how the market looks today.
The market is coiling: 42/100 green, $RAIN +99.2% quietly leading. Coils like this never last long.
$BTC $64,436 (-0.4%)
$ETH $1,818 (+0.5%)
Leading: $RAIN +99.2%, PIEVERSE +13.2%
Lagging: BTW -23.2%, LIT -8.9%
My take: No clear direction. Days like this are where most people lose money by forcing a trade.
Are you buying today or sitting on your hands?
Follow for an hourly picture of the market.
#Bitcoin
Here is how the market looks today.
The market is coiling: 42/100 green, $RAIN +99.2% quietly leading. Coils like this never last long.
$BTC $64,436 (-0.4%)
$ETH $1,818 (+0.5%)
Leading: $RAIN +99.2%, PIEVERSE +13.2%
Lagging: BTW -23.2%, LIT -8.9%
My take: No clear direction. Days like this are where most people lose money by forcing a trade.
Are you buying today or sitting on your hands?
Follow for an hourly picture of the market.
#Bitcoin
The market is coiling: 42/100 green, $RAIN +99.2% quietly leading. Coils like this never last long.
$BTC $64,436 (-0.4%)
$ETH $1,818 (+0.5%)
Leading: $RAIN +99.2%, PIEVERSE +13.2%
Lagging: BTW -23.2%, LIT -8.9%
My take: No clear direction. Days like this are where most people lose money by forcing a trade.
Are you buying today or sitting on your hands?
Follow for an hourly picture of the market.
#Bitcoin
153
Crypto rule worth remembering:
Unlock schedules matter. A big token unlock can push the price down for weeks, check it before you buy.
What's the one rule you never break?
Follow for the whole market in bubbles, every hour.
#CryptoTips
Crypto rule worth remembering:
Unlock schedules matter. A big token unlock can push the price down for weeks, check it before you buy.
What's the one rule you never break?
Follow for the whole market in bubbles, every hour.
#CryptoTips
Unlock schedules matter. A big token unlock can push the price down for weeks, check it before you buy.
What's the one rule you never break?
Follow for the whole market in bubbles, every hour.
#CryptoTips
68
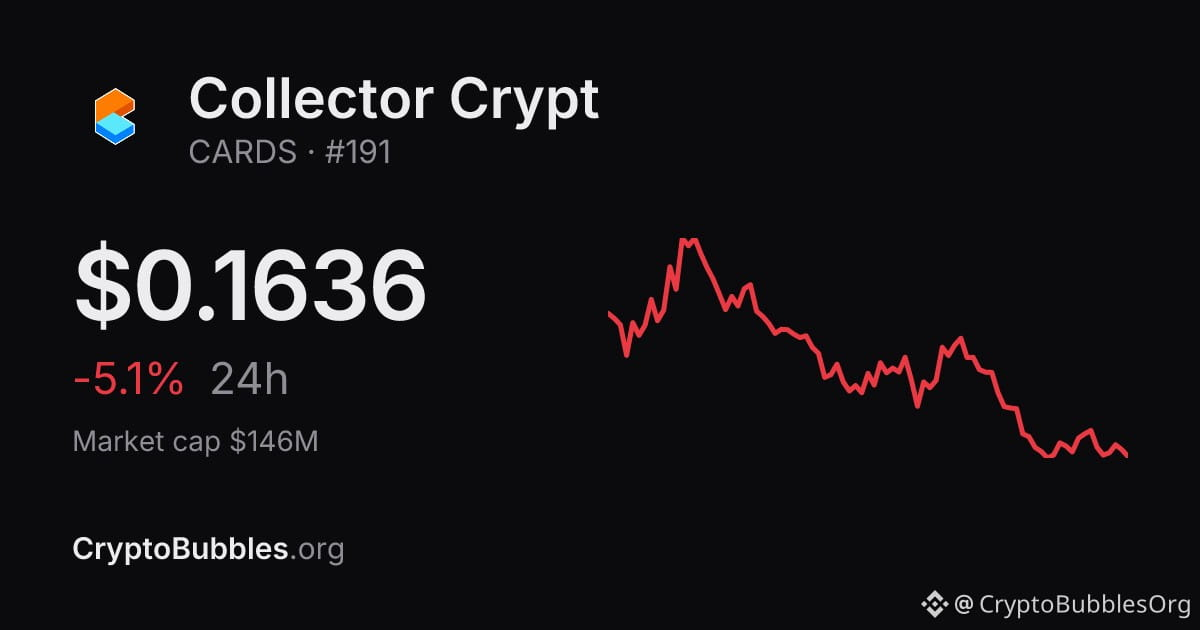
$CARDS is bleeding: -12.7% in 24 hours.
Price $0.149 · 24h -12.7% · 7d -26.3%
Rank #199 · market cap $133M
Panic for some, a discount for others. The chart does not care how you feel.
Buying this dip or staying away?
Follow for the whole market in bubbles, every hour.
#CryptoNews
$CARDS is bleeding: -12.7% in 24 hours.
Price $0.149 · 24h -12.7% · 7d -26.3%
Rank #199 · market cap $133M
Panic for some, a discount for others. The chart does not care how you feel.
Buying this dip or staying away?
Follow for the whole market in bubbles, every hour.
#CryptoNews
Price $0.149 · 24h -12.7% · 7d -26.3%
Rank #199 · market cap $133M
Panic for some, a discount for others. The chart does not care how you feel.
Buying this dip or staying away?
Follow for the whole market in bubbles, every hour.
#CryptoNews
Who owns the market right now.
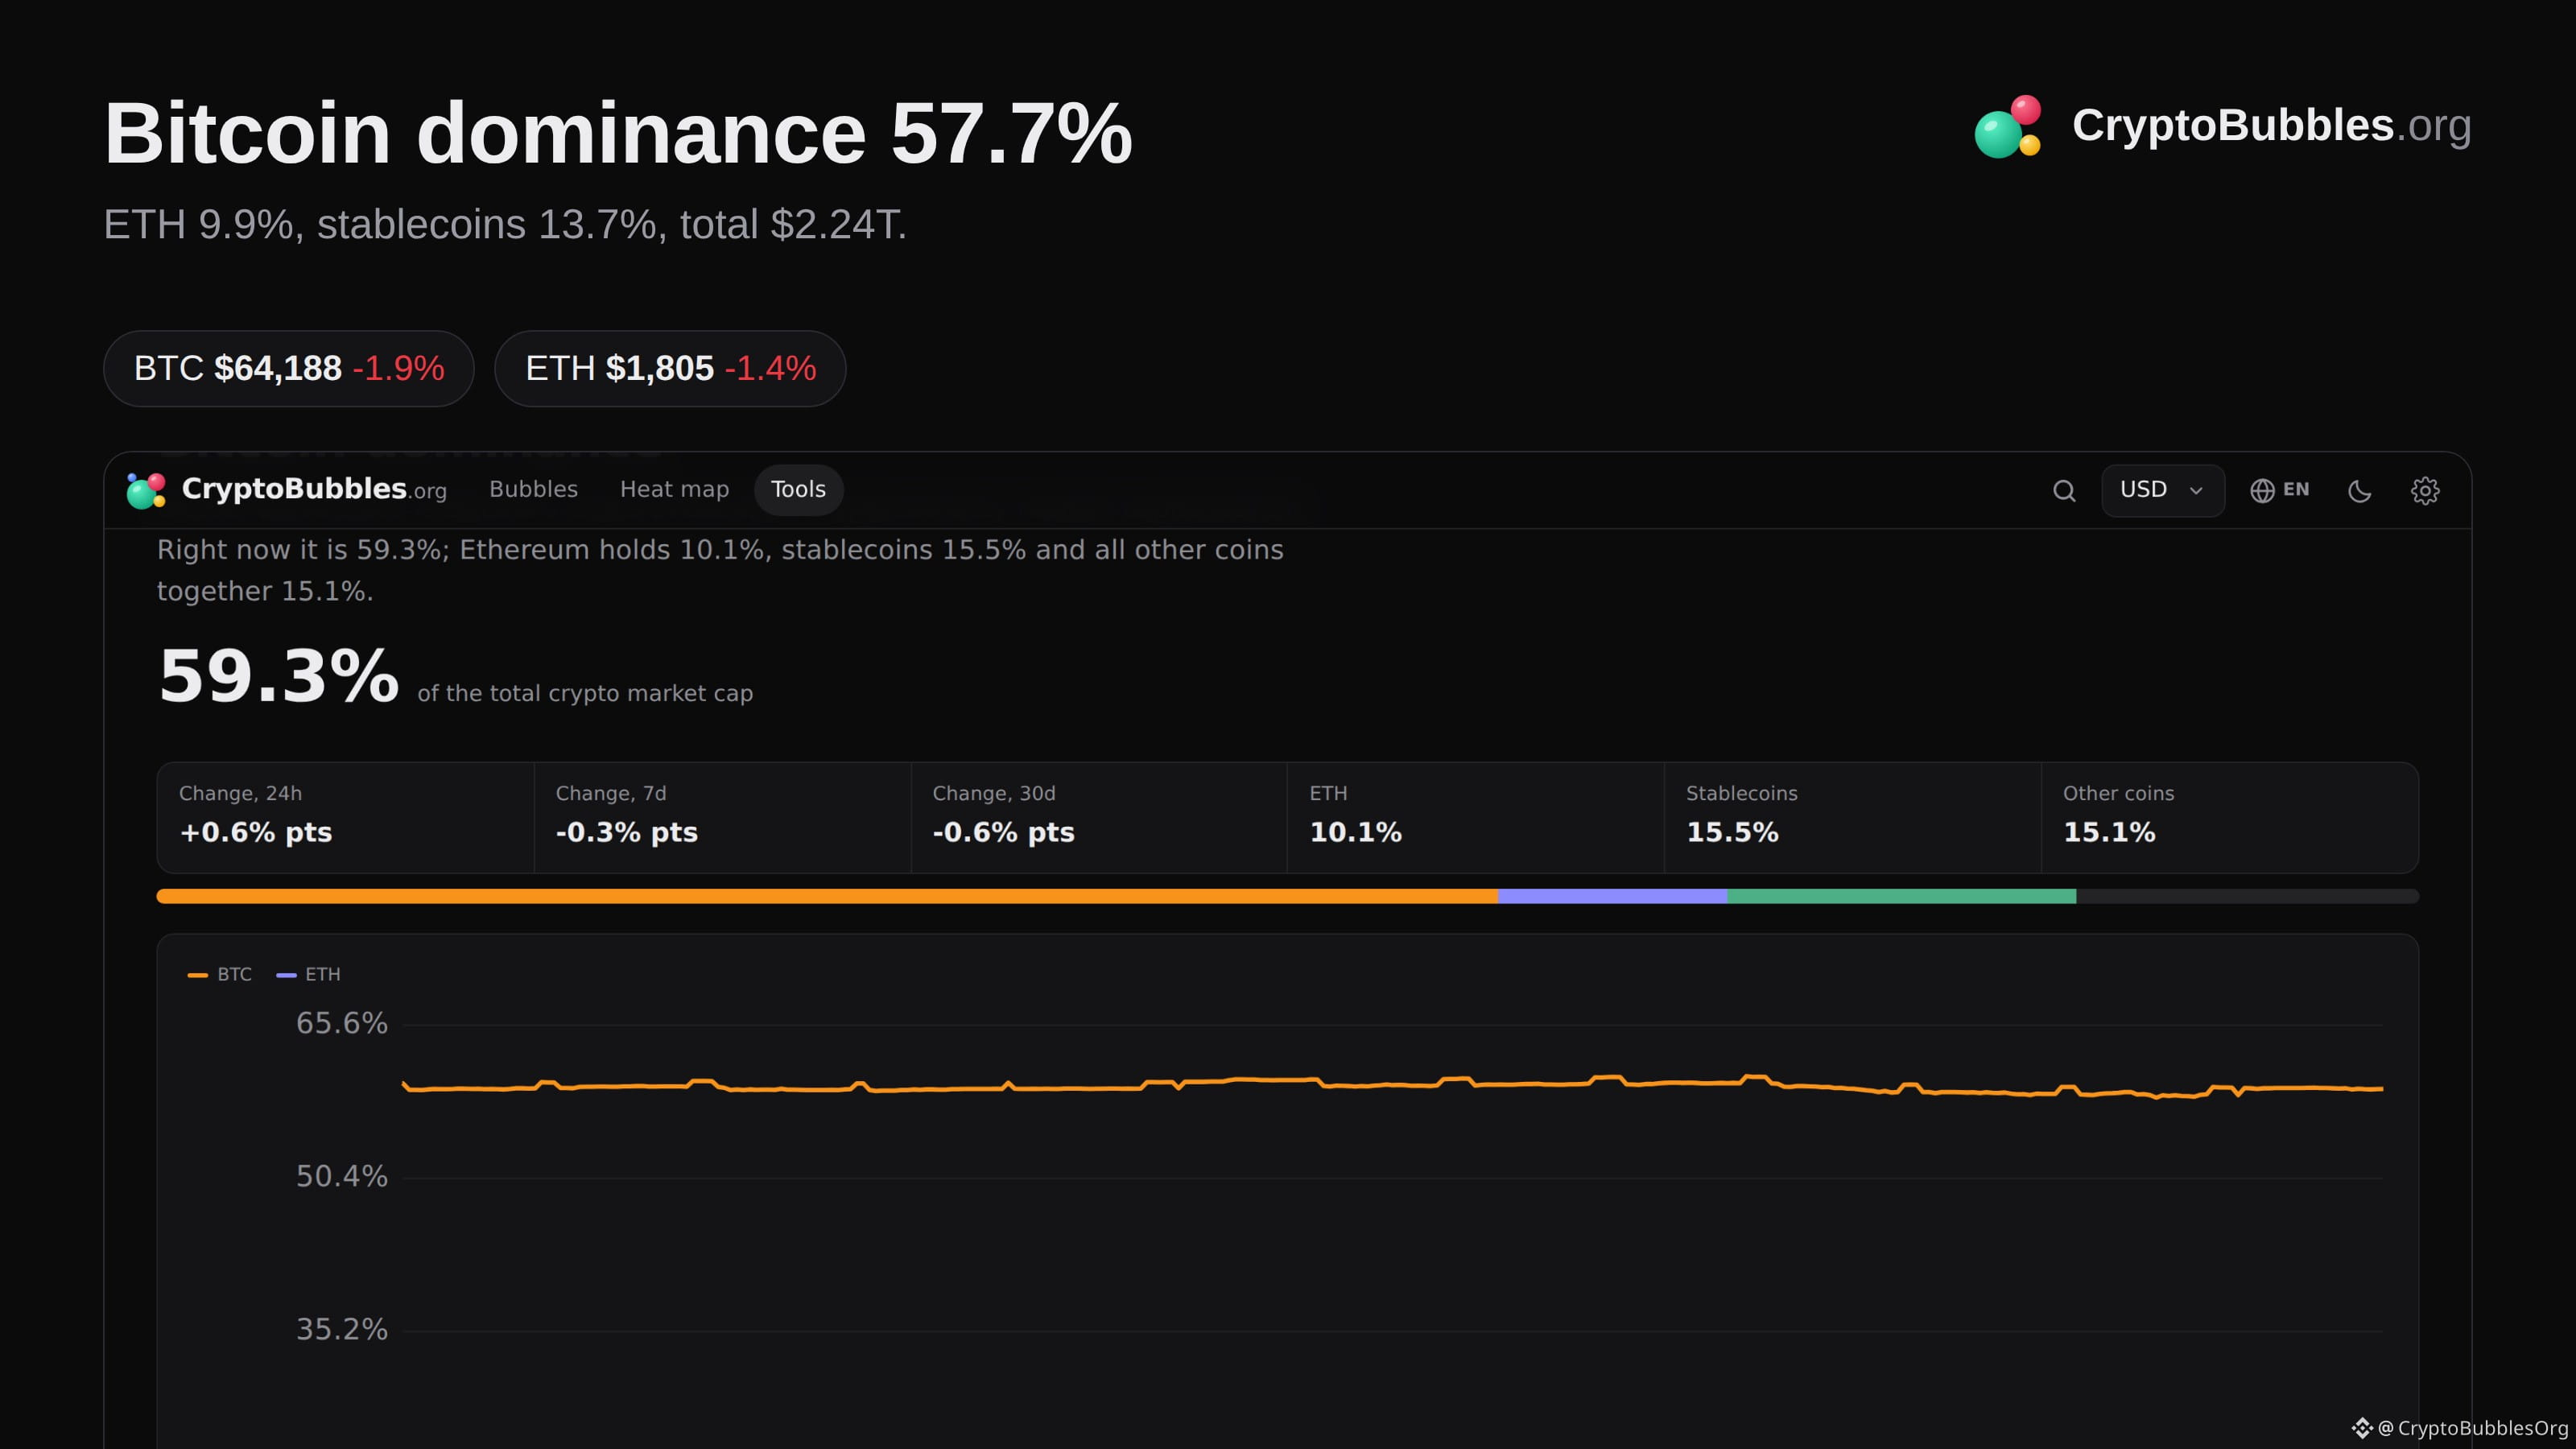
Bitcoin owns 57.7% of the entire crypto market. Altseason starts when this number breaks.
Ethereum 9.9%, stablecoins 13.7%, everything else 18.8%.
Total market cap: $2.24T
$BTC $64,188 (-1.9% today)
My take: Bitcoin owns well over half the market. Alt rallies here tend to be short.
What dominance level makes you rotate into alts?
More market snapshots every hour on my page.
#Bitcoin
Who owns the market right now.
Bitcoin owns 57.7% of the entire crypto market. Altseason starts when this number breaks.
Ethereum 9.9%, stablecoins 13.7%, everything else 18.8%.
Total market cap: $2.24T
$BTC $64,188 (-1.9% today)
My take: Bitcoin owns well over half the market. Alt rallies here tend to be short.
What dominance level makes you rotate into alts?
More market snapshots every hour on my page.
#Bitcoin
Bitcoin owns 57.7% of the entire crypto market. Altseason starts when this number breaks.
Ethereum 9.9%, stablecoins 13.7%, everything else 18.8%.
Total market cap: $2.24T
$BTC $64,188 (-1.9% today)
My take: Bitcoin owns well over half the market. Alt rallies here tend to be short.
What dominance level makes you rotate into alts?
More market snapshots every hour on my page.
#Bitcoin
One picture of the entire market.
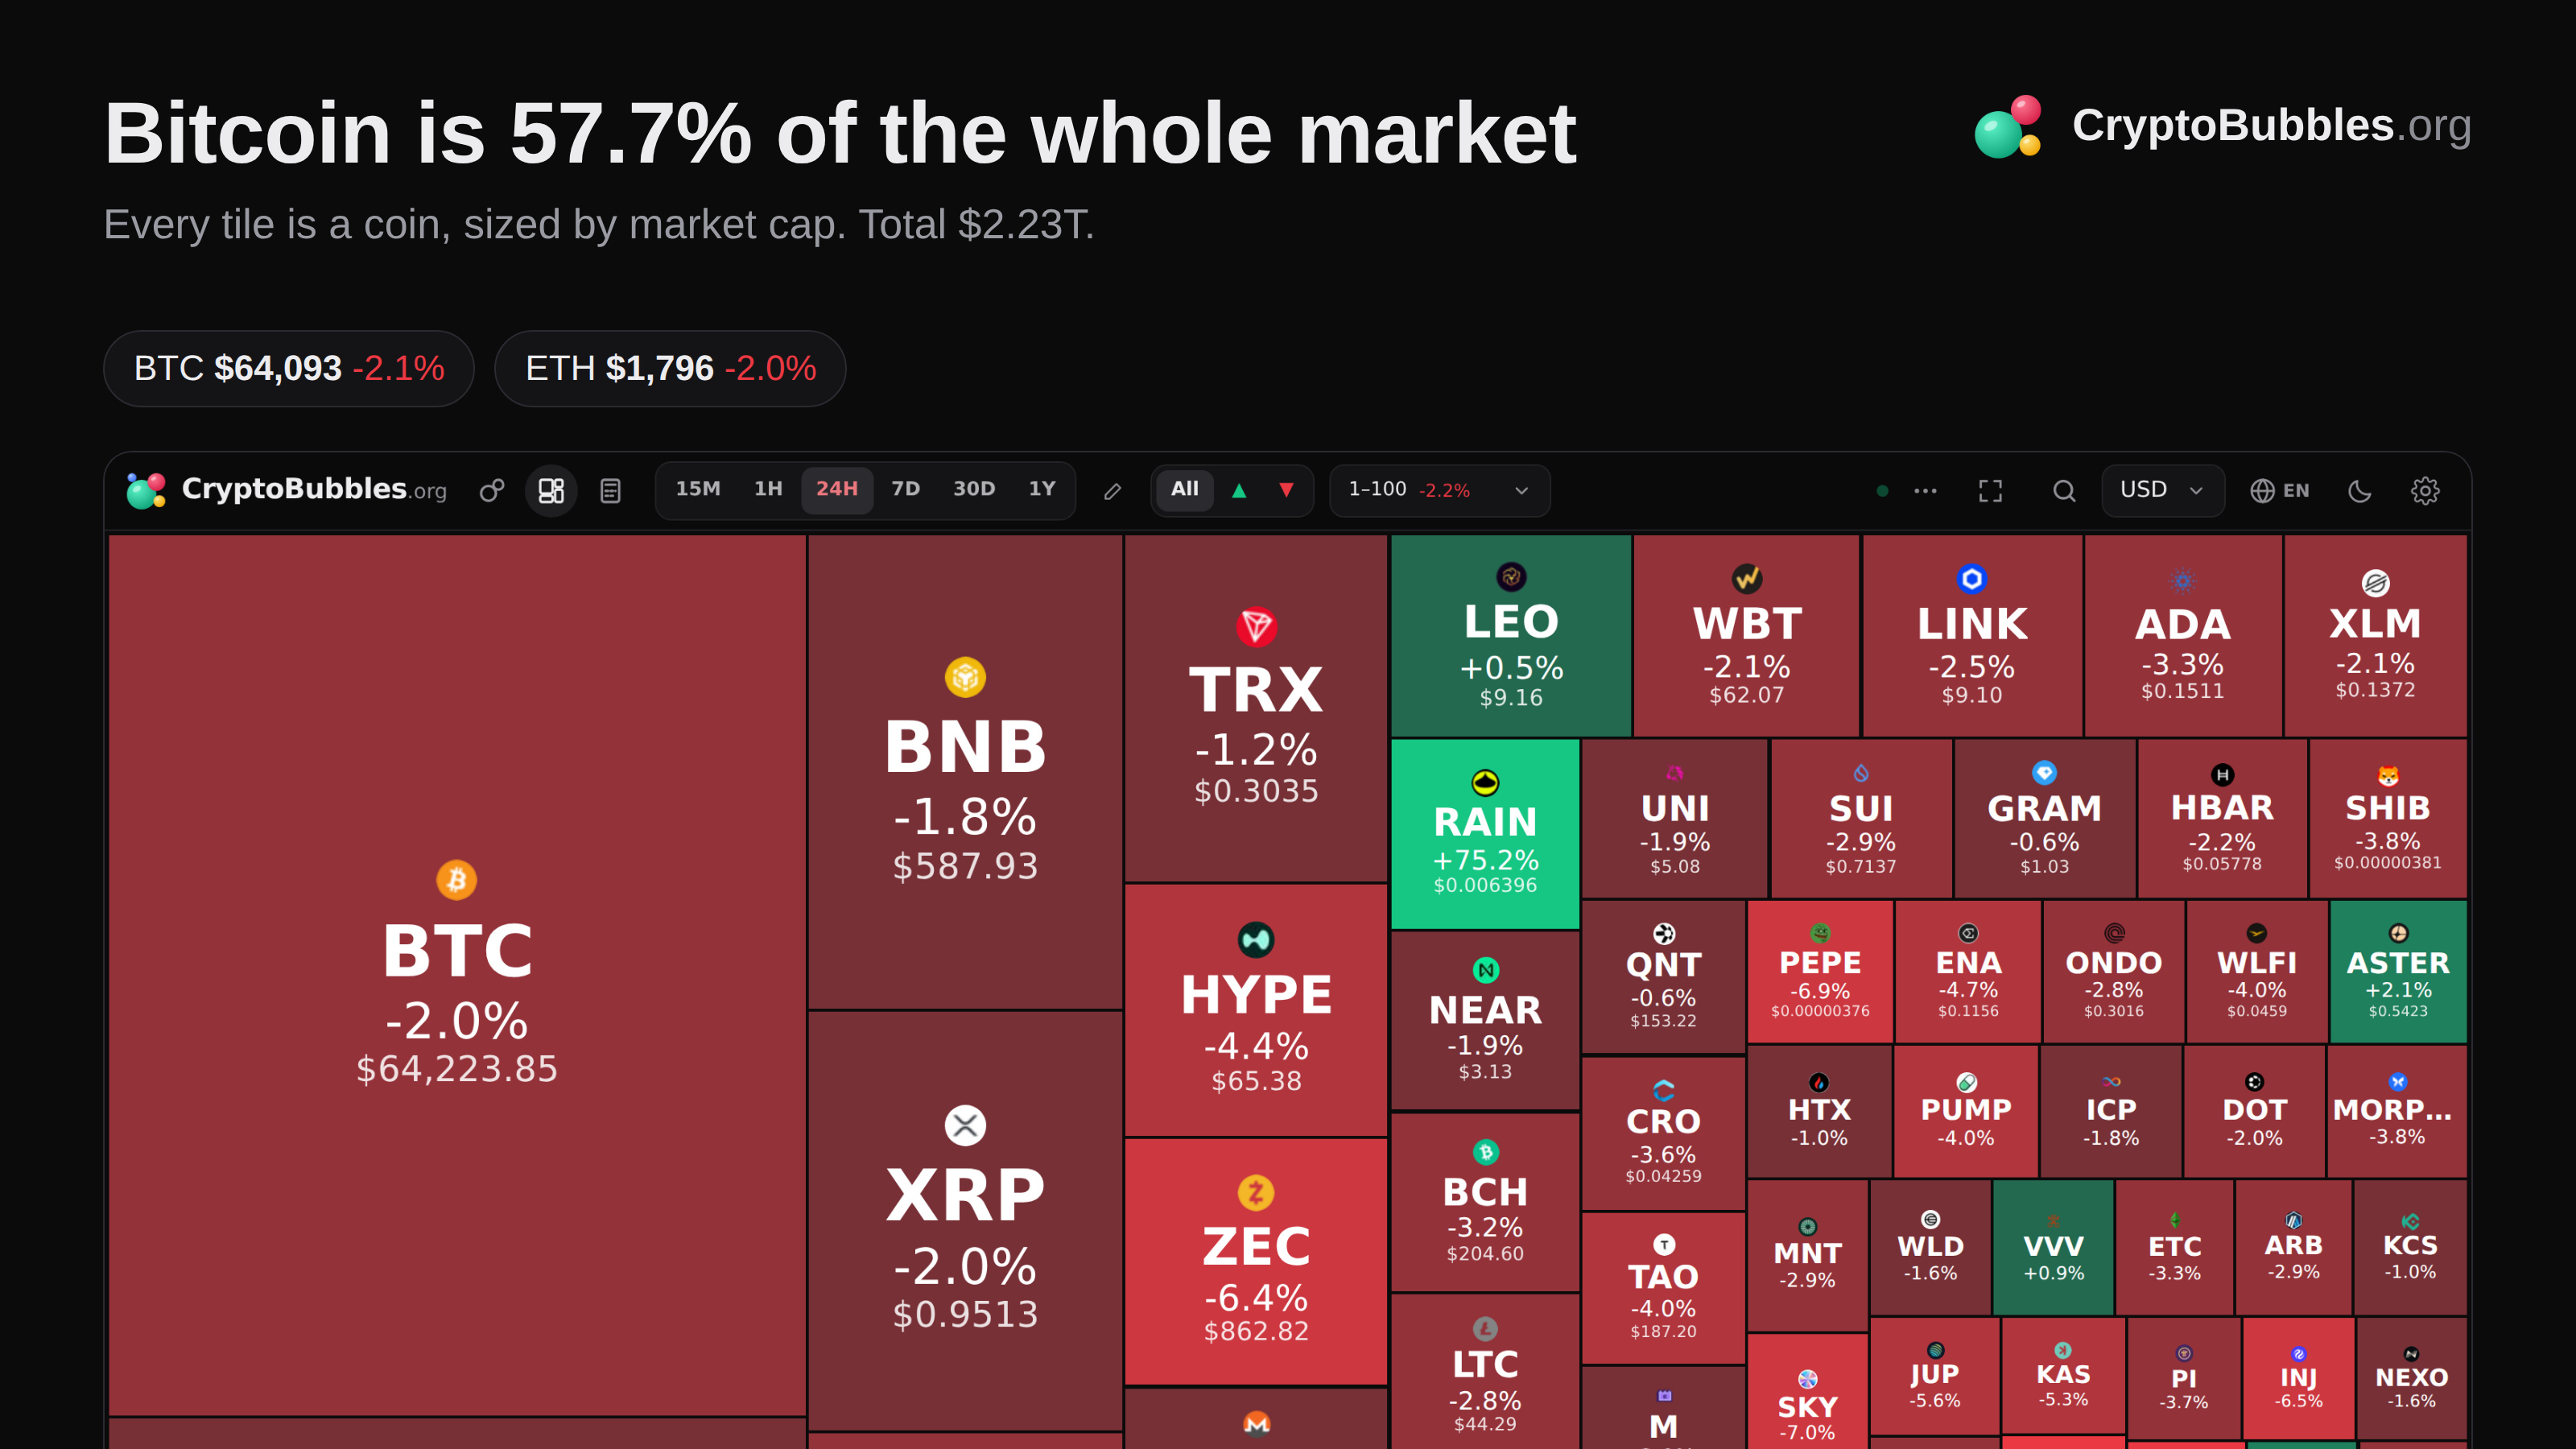
One picture, the whole crypto market: Bitcoin alone is 57.7% of everything.
Total market cap: $2.23T
14 of the top 100 coins are up in 24h.
My take: One tile is bigger than the next hundred combined. Everything else is a bet that this changes.
Will Bitcoin ever drop below half the market for good?
More market snapshots every hour on my page.
#Bitcoin
One picture of the entire market.
One picture, the whole crypto market: Bitcoin alone is 57.7% of everything.
Total market cap: $2.23T
14 of the top 100 coins are up in 24h.
My take: One tile is bigger than the next hundred combined. Everything else is a bet that this changes.
Will Bitcoin ever drop below half the market for good?
More market snapshots every hour on my page.
#Bitcoin
One picture, the whole crypto market: Bitcoin alone is 57.7% of everything.
Total market cap: $2.23T
14 of the top 100 coins are up in 24h.
My take: One tile is bigger than the next hundred combined. Everything else is a bet that this changes.
Will Bitcoin ever drop below half the market for good?
More market snapshots every hour on my page.
#Bitcoin
Article
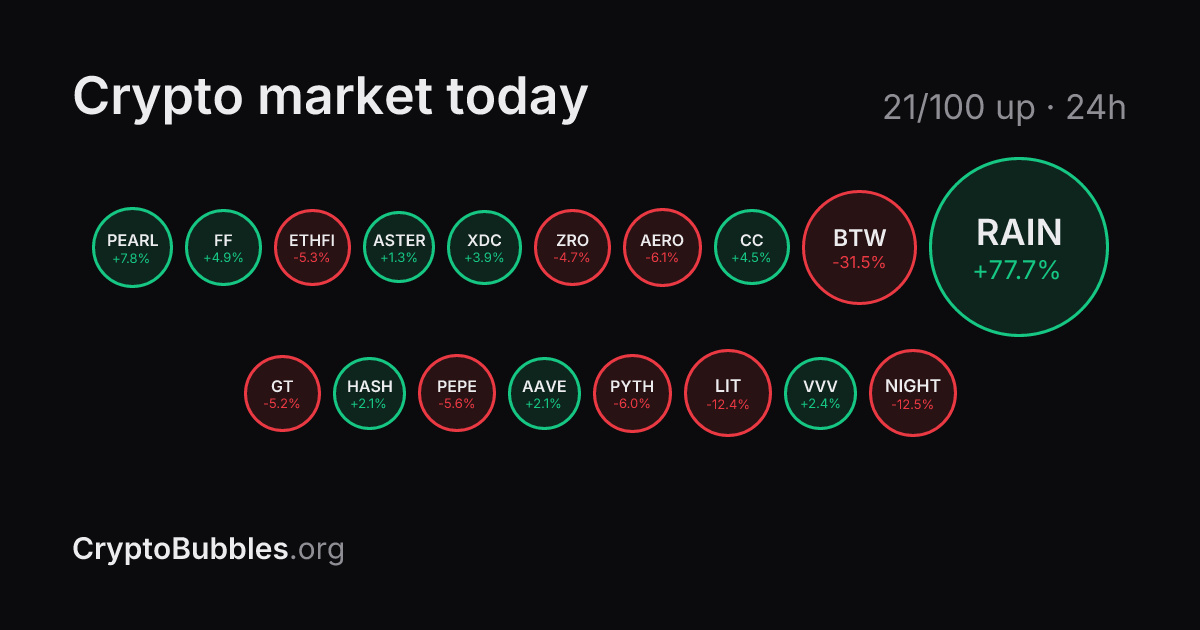
Crypto Bubbles Today (Nov 16): 18 of the Top 100 Green, Bitcoin -2.4%18 of the 100 largest coins are green over the last 24 hours, so this is a red day on my bubble chart. The numbers behind the picture are below.
The big two
$BTC trades at $63,914, -2.4% in 24 hours and -13.8% over the week. $ETH is at $1,787 (-2.4% today). Bitcoin holds 56.8% of the whole market.
Biggest gainers today (top 200, liquid coins)
1. RAIN (Rain): +77.7% · $0.0065
2. AKE (Akedo): +12.9% · $0.0115
3. PEARL (Pearl): +7.8% · $1.63
4. FF (Falcon Finance): +5.0% · $0.1
5. CC (Canton): +4.5% · $0.0842
Biggest drops today
1. BTW (Bitway): -31.5% · $0.417
2. NIGHT (Midnight): -13.7% · $0.0432
3. CARDS (Collector Crypt): -12.6% · $0.15
4. LIT (Lighter): -12.4% · $2.63
5. PYTH (Pyth Network): -7.9% · $0.0527
Sectors
Strongest: Cat coins +2.5%, Meme coins +0.4%, Bitcoin ecosystem +0.2%.
Weakest: Zero knowledge (ZK) -3.8%, Restaking -3.4%, Proof of work -3.2%.
Where the trading is
By volume against market cap the busiest coins in the top 100 are AKE (48% of its market cap traded in a day), ASTER (27% of its market cap traded in a day), PENGU (25% of its market cap traded in a day). High turnover means a coin is in play, in either direction.
Sentiment
The Fear & Greed Index is at 10 (extreme fear), the same as yesterday and 29 a week ago.
My take
When almost the whole chart is red, single coins tell you little. I look at which ones stayed green: they often lead when the market turns.
What does your part of the chart look like today?
I post the whole market in bubbles every hour and this recap every day. Follow so you do not miss it.
#CryptoBubbles #Bitcoin
Crypto Bubbles Today (Nov 16): 18 of the Top 100 Green, Bitcoin -2.4%
18 of the 100 largest coins are green over the last 24 hours, so this is a red day on my bubble chart. The numbers behind the picture are below.
The big two
$BTC trades at $63,914, -2.4% in 24 hours and -13.8% over the week. $ETH is at $1,787 (-2.4% today). Bitcoin holds 56.8% of the whole market.
Biggest gainers today (top 200, liquid coins)
1. RAIN (Rain): +77.7% · $0.0065
2. AKE (Akedo): +12.9% · $0.0115
3. PEARL (Pearl): +7.8% · $1.63
4. FF (Falcon Finance): +5.0% · $0.1
5. CC (Canton): +4.5% · $0.0842
Biggest drops today
1. BTW (Bitway): -31.5% · $0.417
2. NIGHT (Midnight): -13.7% · $0.0432
3. CARDS (Collector Crypt): -12.6% · $0.15
4. LIT (Lighter): -12.4% · $2.63
5. PYTH (Pyth Network): -7.9% · $0.0527
Sectors
Strongest: Cat coins +2.5%, Meme coins +0.4%, Bitcoin ecosystem +0.2%.
Weakest: Zero knowledge (ZK) -3.8%, Restaking -3.4%, Proof of work -3.2%.
Where the trading is
By volume against market cap the busiest coins in the top 100 are AKE (48% of its market cap traded in a day), ASTER (27% of its market cap traded in a day), PENGU (25% of its market cap traded in a day). High turnover means a coin is in play, in either direction.
Sentiment
The Fear & Greed Index is at 10 (extreme fear), the same as yesterday and 29 a week ago.
My take
When almost the whole chart is red, single coins tell you little. I look at which ones stayed green: they often lead when the market turns.
What does your part of the chart look like today?
I post the whole market in bubbles every hour and this recap every day. Follow so you do not miss it.
#CryptoBubbles #Bitcoin
The big two
$BTC trades at $63,914, -2.4% in 24 hours and -13.8% over the week. $ETH is at $1,787 (-2.4% today). Bitcoin holds 56.8% of the whole market.
Biggest gainers today (top 200, liquid coins)
1. RAIN (Rain): +77.7% · $0.0065
2. AKE (Akedo): +12.9% · $0.0115
3. PEARL (Pearl): +7.8% · $1.63
4. FF (Falcon Finance): +5.0% · $0.1
5. CC (Canton): +4.5% · $0.0842
Biggest drops today
1. BTW (Bitway): -31.5% · $0.417
2. NIGHT (Midnight): -13.7% · $0.0432
3. CARDS (Collector Crypt): -12.6% · $0.15
4. LIT (Lighter): -12.4% · $2.63
5. PYTH (Pyth Network): -7.9% · $0.0527
Sectors
Strongest: Cat coins +2.5%, Meme coins +0.4%, Bitcoin ecosystem +0.2%.
Weakest: Zero knowledge (ZK) -3.8%, Restaking -3.4%, Proof of work -3.2%.
Where the trading is
By volume against market cap the busiest coins in the top 100 are AKE (48% of its market cap traded in a day), ASTER (27% of its market cap traded in a day), PENGU (25% of its market cap traded in a day). High turnover means a coin is in play, in either direction.
Sentiment
The Fear & Greed Index is at 10 (extreme fear), the same as yesterday and 29 a week ago.
My take
When almost the whole chart is red, single coins tell you little. I look at which ones stayed green: they often lead when the market turns.
What does your part of the chart look like today?
I post the whole market in bubbles every hour and this recap every day. Follow so you do not miss it.
#CryptoBubbles #Bitcoin
4
Who is winning today.
Today's winners are out: $RAIN +77.7% tops the board.
$RAIN +77.7%
$AKE +12.9%
$PEARL +7.8%
FF +4.9%
CC +4.5%
23 of the top 100 coins are green today.
My take: A move this size in the top 100 is rare. Most of it is usually given back within a week.
Which of these do you trust to hold the gain?
More market snapshots every hour on my page.
#Crypto
Who is winning today.
Today's winners are out: $RAIN +77.7% tops the board.
$RAIN +77.7%
$AKE +12.9%
$PEARL +7.8%
FF +4.9%
CC +4.5%
23 of the top 100 coins are green today.
My take: A move this size in the top 100 is rare. Most of it is usually given back within a week.
Which of these do you trust to hold the gain?
More market snapshots every hour on my page.
#Crypto
Today's winners are out: $RAIN +77.7% tops the board.
$RAIN +77.7%
$AKE +12.9%
$PEARL +7.8%
FF +4.9%
CC +4.5%
23 of the top 100 coins are green today.
My take: A move this size in the top 100 is rare. Most of it is usually given back within a week.
Which of these do you trust to hold the gain?
More market snapshots every hour on my page.
#Crypto
174
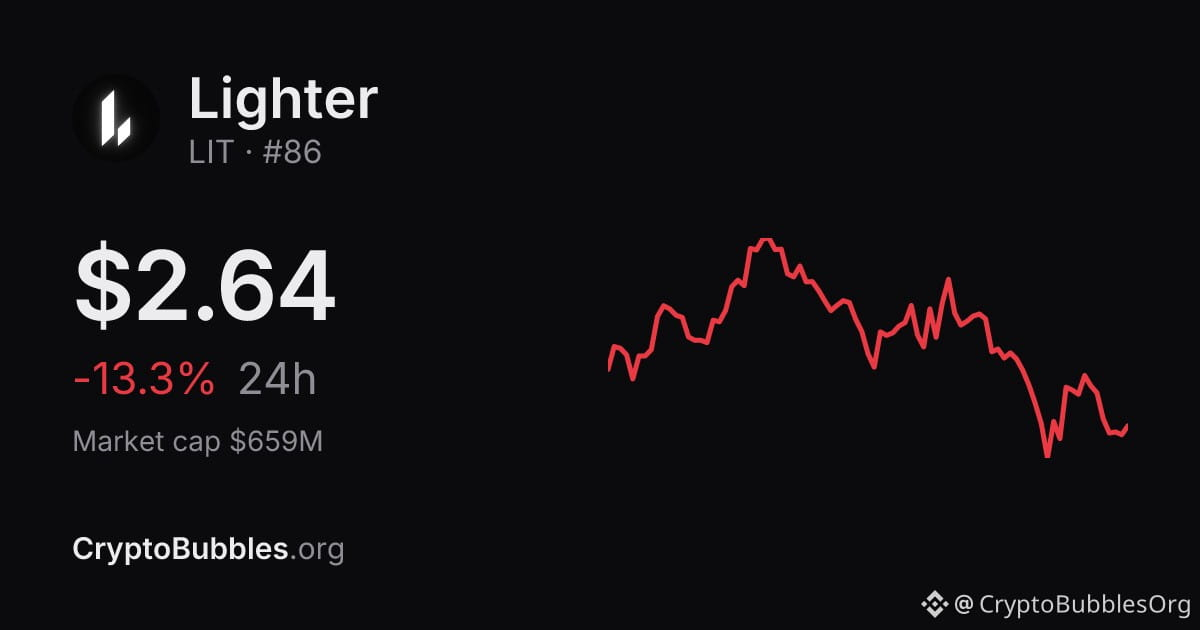
$LIT is bleeding: -13.3% in 24 hours.
Price $2.64 · 24h -13.3% · 7d -12.1%
Rank #86 · market cap $659M
Panic for some, a discount for others. The chart does not care how you feel.
Buying this dip or staying away?
Follow for the whole market in bubbles, every hour.
#CryptoNews
$LIT is bleeding: -13.3% in 24 hours.
Price $2.64 · 24h -13.3% · 7d -12.1%
Rank #86 · market cap $659M
Panic for some, a discount for others. The chart does not care how you feel.
Buying this dip or staying away?
Follow for the whole market in bubbles, every hour.
#CryptoNews
Price $2.64 · 24h -13.3% · 7d -12.1%
Rank #86 · market cap $659M
Panic for some, a discount for others. The chart does not care how you feel.
Buying this dip or staying away?
Follow for the whole market in bubbles, every hour.
#CryptoNews
Bitcoin halving check.
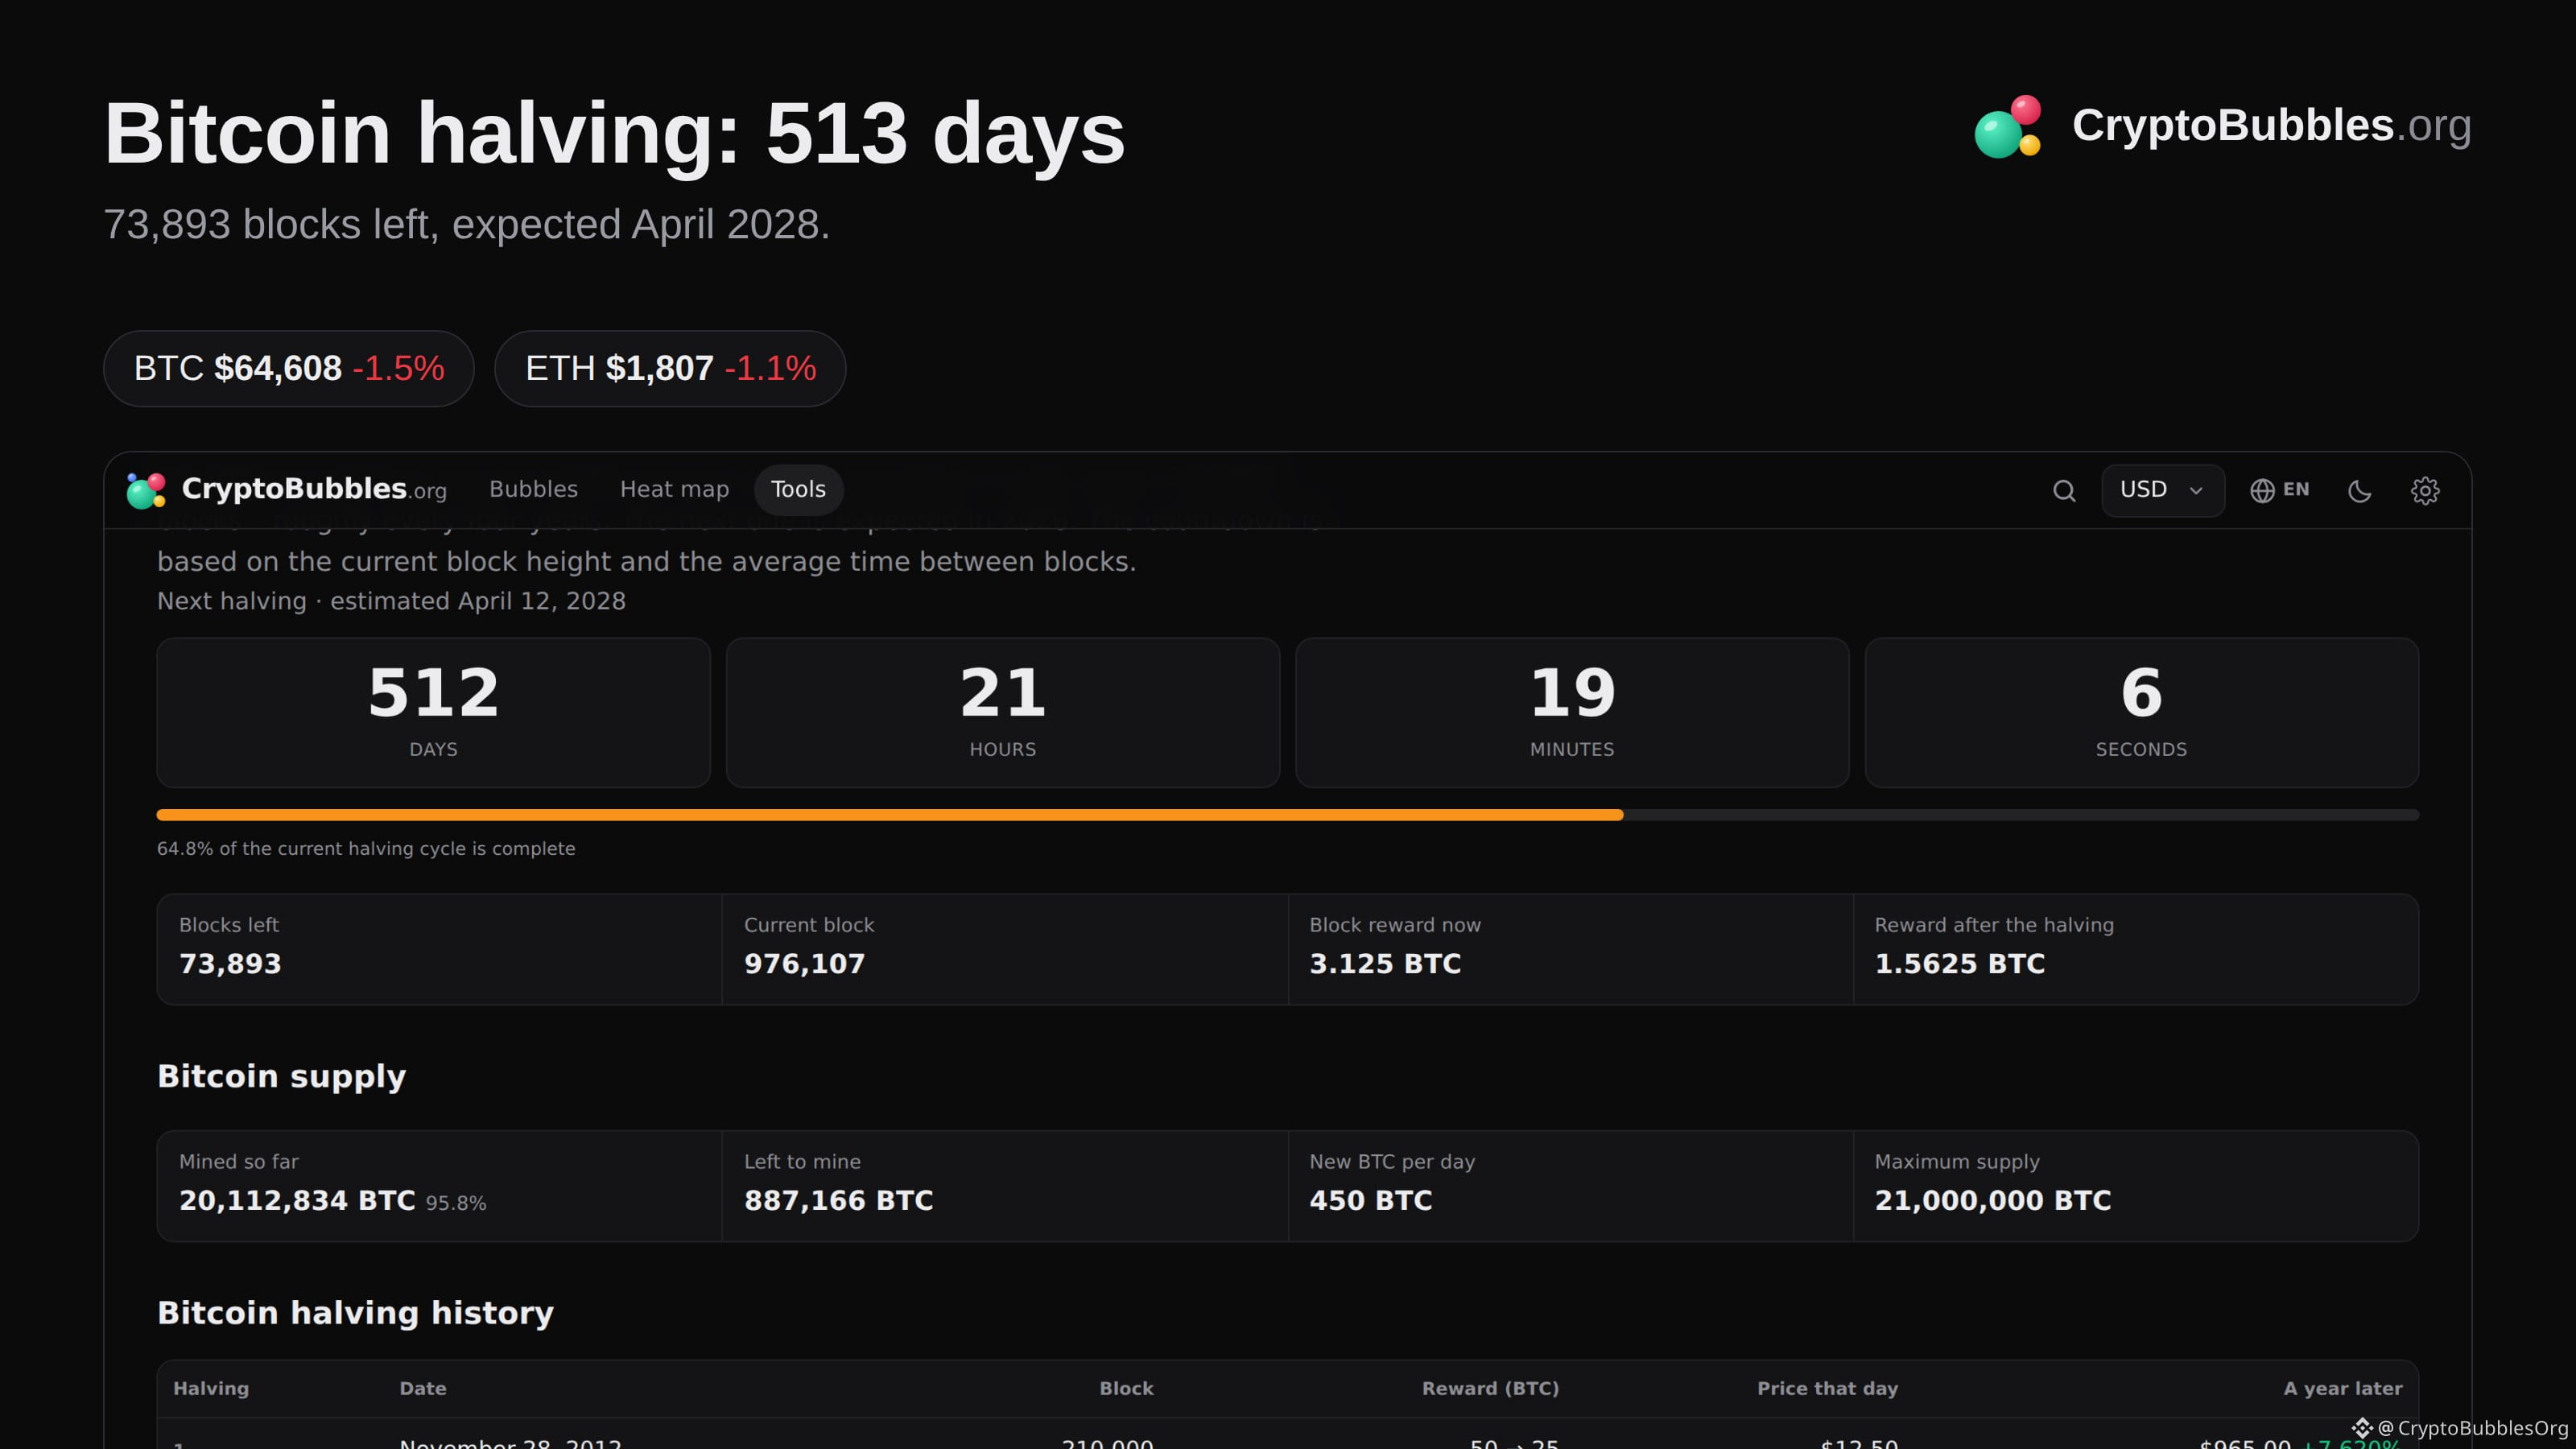
513 days until the Bitcoin halving. New supply gets cut in half, and the clock is ticking.
Blocks left: 73,893 (block 976,107 now), expected April 2028.
Reward drops from 3.125 to 1.5625 BTC.
$BTC $64,608 (-1.5% today)
My take: Every halving so far was "priced in", said people who then watched the price double.
Does the halving still matter, or is it all ETFs now?
More market snapshots every hour on my page.
#Bitcoin
Bitcoin halving check.
513 days until the Bitcoin halving. New supply gets cut in half, and the clock is ticking.
Blocks left: 73,893 (block 976,107 now), expected April 2028.
Reward drops from 3.125 to 1.5625 BTC.
$BTC $64,608 (-1.5% today)
My take: Every halving so far was "priced in", said people who then watched the price double.
Does the halving still matter, or is it all ETFs now?
More market snapshots every hour on my page.
#Bitcoin
513 days until the Bitcoin halving. New supply gets cut in half, and the clock is ticking.
Blocks left: 73,893 (block 976,107 now), expected April 2028.
Reward drops from 3.125 to 1.5625 BTC.
$BTC $64,608 (-1.5% today)
My take: Every halving so far was "priced in", said people who then watched the price double.
Does the halving still matter, or is it all ETFs now?
More market snapshots every hour on my page.
#Bitcoin
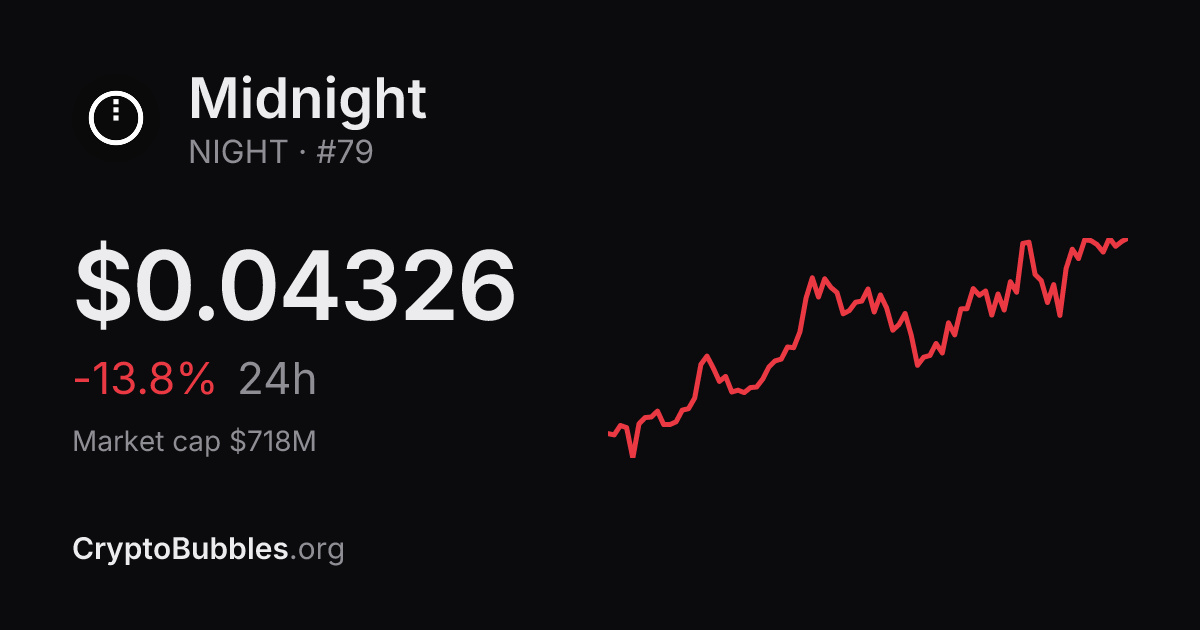
$NIGHT is bleeding: -13.8% in 24 hours.
Price $0.0433 · 24h -13.8% · 7d +14.3%
Rank #79 · market cap $718M
Panic for some, a discount for others. The chart does not care how you feel.
Capitulation, or a gift?
Follow for the whole market in bubbles, every hour.
#CryptoNews
$NIGHT is bleeding: -13.8% in 24 hours.
Price $0.0433 · 24h -13.8% · 7d +14.3%
Rank #79 · market cap $718M
Panic for some, a discount for others. The chart does not care how you feel.
Capitulation, or a gift?
Follow for the whole market in bubbles, every hour.
#CryptoNews
Price $0.0433 · 24h -13.8% · 7d +14.3%
Rank #79 · market cap $718M
Panic for some, a discount for others. The chart does not care how you feel.
Capitulation, or a gift?
Follow for the whole market in bubbles, every hour.
#CryptoNews
22
Daily check-in on crypto.
Red day, 27/100 green. Fear is loud, and fear is where the best entries hide.
$BTC $64,281 (-1.7%)
$ETH $1,796 (-1.6%)
Leading: RAIN +116.7%, PEARL +11.8%
Lagging: BTW -29.2%, NIGHT -13.2%
My take: Even Bitcoin is not a shelter today. Nobody wants risk.
Green or red, what did you do today?
More market snapshots every hour on my page.
#Bitcoin
Daily check-in on crypto.
Red day, 27/100 green. Fear is loud, and fear is where the best entries hide.
$BTC $64,281 (-1.7%)
$ETH $1,796 (-1.6%)
Leading: RAIN +116.7%, PEARL +11.8%
Lagging: BTW -29.2%, NIGHT -13.2%
My take: Even Bitcoin is not a shelter today. Nobody wants risk.
Green or red, what did you do today?
More market snapshots every hour on my page.
#Bitcoin
Red day, 27/100 green. Fear is loud, and fear is where the best entries hide.
$BTC $64,281 (-1.7%)
$ETH $1,796 (-1.6%)
Leading: RAIN +116.7%, PEARL +11.8%
Lagging: BTW -29.2%, NIGHT -13.2%
My take: Even Bitcoin is not a shelter today. Nobody wants risk.
Green or red, what did you do today?
More market snapshots every hour on my page.
#Bitcoin
238
$BTC on this day:
2025: $95,534
2024: $87,292
2022: $16,874
2018: $5,659
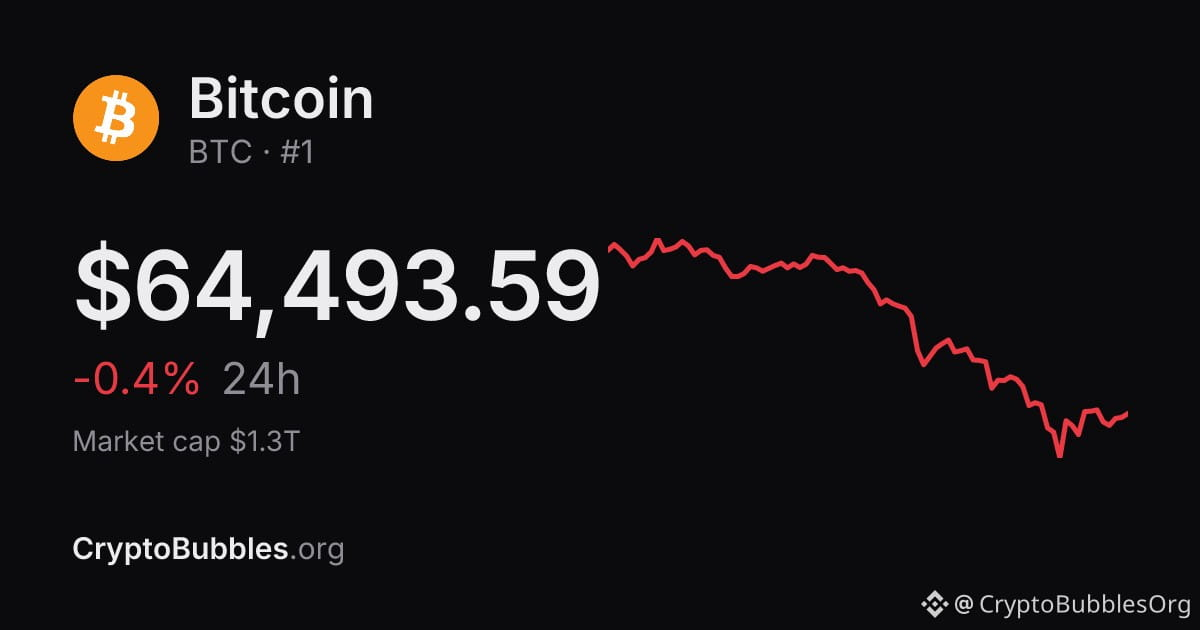
Today: $64,494
Four years of holding: +282.2%. Time in the market beats timing the market.
What was your first Bitcoin buy price?
Follow for the whole market in bubbles, every hour.
#Bitcoin
$BTC on this day:
2025: $95,534
2024: $87,292
2022: $16,874
2018: $5,659
Today: $64,494
Four years of holding: +282.2%. Time in the market beats timing the market.
What was your first Bitcoin buy price?
Follow for the whole market in bubbles, every hour.
#Bitcoin
2025: $95,534
2024: $87,292
2022: $16,874
2018: $5,659
Today: $64,494
Four years of holding: +282.2%. Time in the market beats timing the market.
What was your first Bitcoin buy price?
Follow for the whole market in bubbles, every hour.
#Bitcoin
Log in to explore more content
Join global crypto users on Binance Square
⚡️ Get latest and useful information about crypto.
💬 Trusted by the world’s largest crypto exchange.
👍 Discover real insights from verified creators.
Email / Phone number
Trending Topics
A Packed Week of Earnings and Data Tests Markets
50,707 views
337 Discussing
🚨🇺🇸 BIG WEEK AHEAD FOR THE MARKETS!
Markets are pricing in a Fed rate hike in December and $BTC could see some big moves next week.
Here's what's coming:
• Monday: Fed Chair Warsh speaks
• Tuesday: US Retail Sales + $NVDA earnings
• Wednesday: FOMC Minutes
• Thursday: Jobless Claims + Philly Fed Index
• Friday: Consumer Sentiment + Fed speeches
All eyes on $BTC as another important week begins.
#bitcoin
Mookie
·14 Likes
·6.1k views
AnthropicIPOTestsInvestorAppetiteForAI
85,185 views
1,196 Discussing
BitcoinExtendsLosingStreakToSixWeeks
46,814 views
552 Discussing