
Crypto Fearless
80 Posts

Crypto Fearless
Report
Block User
〘 Crypto Fearless 〙 | Futures & Spot Trader | Technical & Fundamental Analysis | High-Probability Setups | Risk Management | Binance Square Creator
8 Following
7 Followers
9 Liked
Posts
All
Quotes
·
--
Bearish
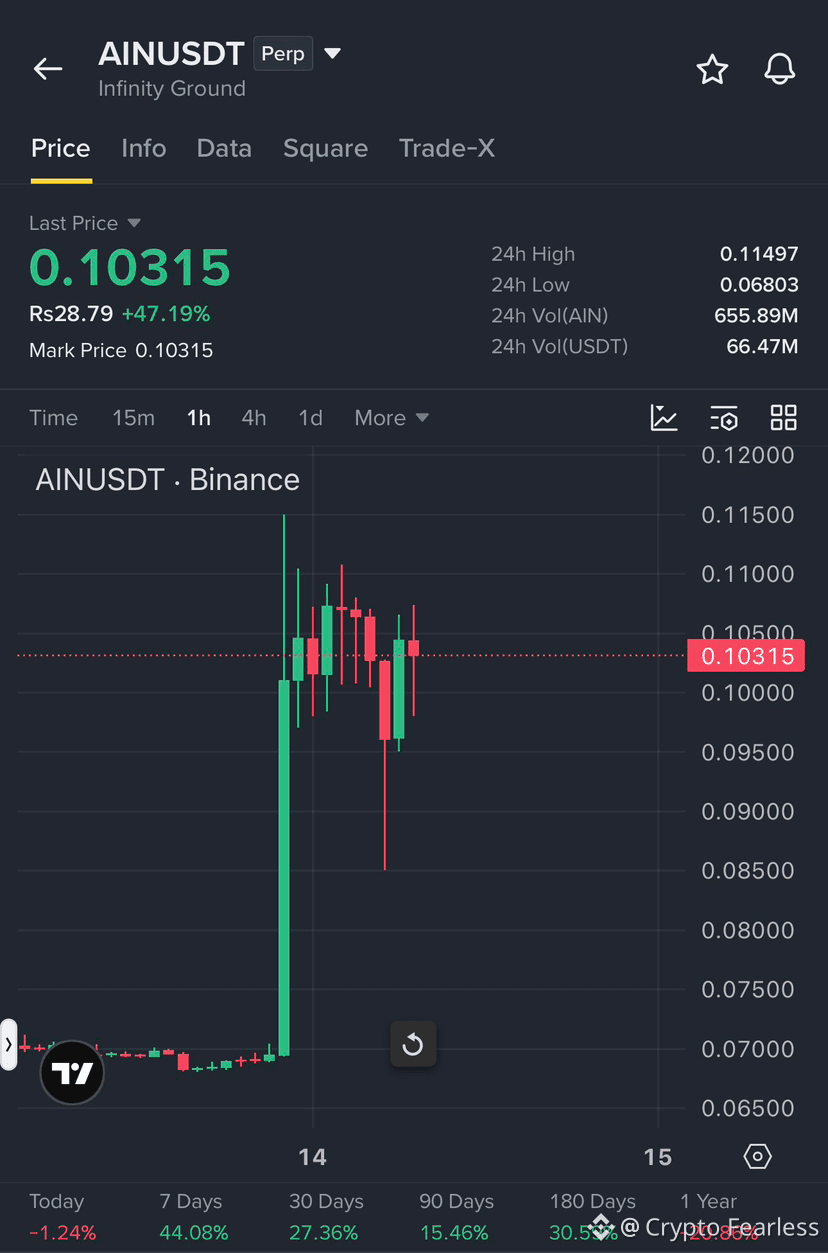
$AIN JUST PUMPED +47% — NOW I’M WATCHING THE REJECTION
$AIN made a powerful move, jumping from the lower levels toward $0.115 before losing momentum around the top.
Now the chart is becoming interesting.
After a vertical pump like this, I don’t want to blindly chase the price. The recent candles are struggling below the $0.108–$0.115 resistance zone, and lower highs are starting to appear.
That tells me buyers are not pushing with the same strength they had during the initial breakout.
For a short-term trade, I’m watching for a rejection and pullback.
Short Entry: $0.103–$0.108
SL: $0.1165
TP1: $0.095
TP2: $0.088
TP3: $0.080
The important support levels are $0.095 and $0.086.
If $AIN loses $0.095 with strong selling pressure, I would expect the correction to become deeper.
But there is one clear invalidation:
If buyers break $0.115 and hold above it, I would cancel the short idea. No stubborn trading.
The setup is simple:
Big pump → resistance → lower highs → possible correction.
I’m not saying the top is guaranteed. I’m saying the risk/reward becomes more interesting if price gives a clean rejection from resistance.
And remember, after a +47% move, volatility can be extreme. On perpetuals, one sudden green candle can liquidate an over-leveraged short very quickly.
Wait for confirmation. Protect the capital. Let the chart come to you.
$AIN JUST PUMPED +47% — NOW I’M WATCHING THE REJECTION
$AIN made a powerful move, jumping from the lower levels toward $0.115 before losing momentum around the top.
Now the chart is becoming interesting.
After a vertical pump like this, I don’t want to blindly chase the price. The recent candles are struggling below the $0.108–$0.115 resistance zone, and lower highs are starting to appear.
That tells me buyers are not pushing with the same strength they had during the initial breakout.
For a short-term trade, I’m watching for a rejection and pullback.
Short Entry: $0.103–$0.108
SL: $0.1165
TP1: $0.095
TP2: $0.088
TP3: $0.080
The important support levels are $0.095 and $0.086.
If $AIN loses $0.095 with strong selling pressure, I would expect the correction to become deeper.
But there is one clear invalidation:
If buyers break $0.115 and hold above it, I would cancel the short idea. No stubborn trading.
The setup is simple:
Big pump → resistance → lower highs → possible correction.
I’m not saying the top is guaranteed. I’m saying the risk/reward becomes more interesting if price gives a clean rejection from resistance.
And remember, after a +47% move, volatility can be extreme. On perpetuals, one sudden green candle can liquidate an over-leveraged short very quickly.
Wait for confirmation. Protect the capital. Let the chart come to you.
$AIN made a powerful move, jumping from the lower levels toward $0.115 before losing momentum around the top.
Now the chart is becoming interesting.
After a vertical pump like this, I don’t want to blindly chase the price. The recent candles are struggling below the $0.108–$0.115 resistance zone, and lower highs are starting to appear.
That tells me buyers are not pushing with the same strength they had during the initial breakout.
For a short-term trade, I’m watching for a rejection and pullback.
Short Entry: $0.103–$0.108
SL: $0.1165
TP1: $0.095
TP2: $0.088
TP3: $0.080
The important support levels are $0.095 and $0.086.
If $AIN loses $0.095 with strong selling pressure, I would expect the correction to become deeper.
But there is one clear invalidation:
If buyers break $0.115 and hold above it, I would cancel the short idea. No stubborn trading.
The setup is simple:
Big pump → resistance → lower highs → possible correction.
I’m not saying the top is guaranteed. I’m saying the risk/reward becomes more interesting if price gives a clean rejection from resistance.
And remember, after a +47% move, volatility can be extreme. On perpetuals, one sudden green candle can liquidate an over-leveraged short very quickly.
Wait for confirmation. Protect the capital. Let the chart come to you.
39
·
--
Bullish
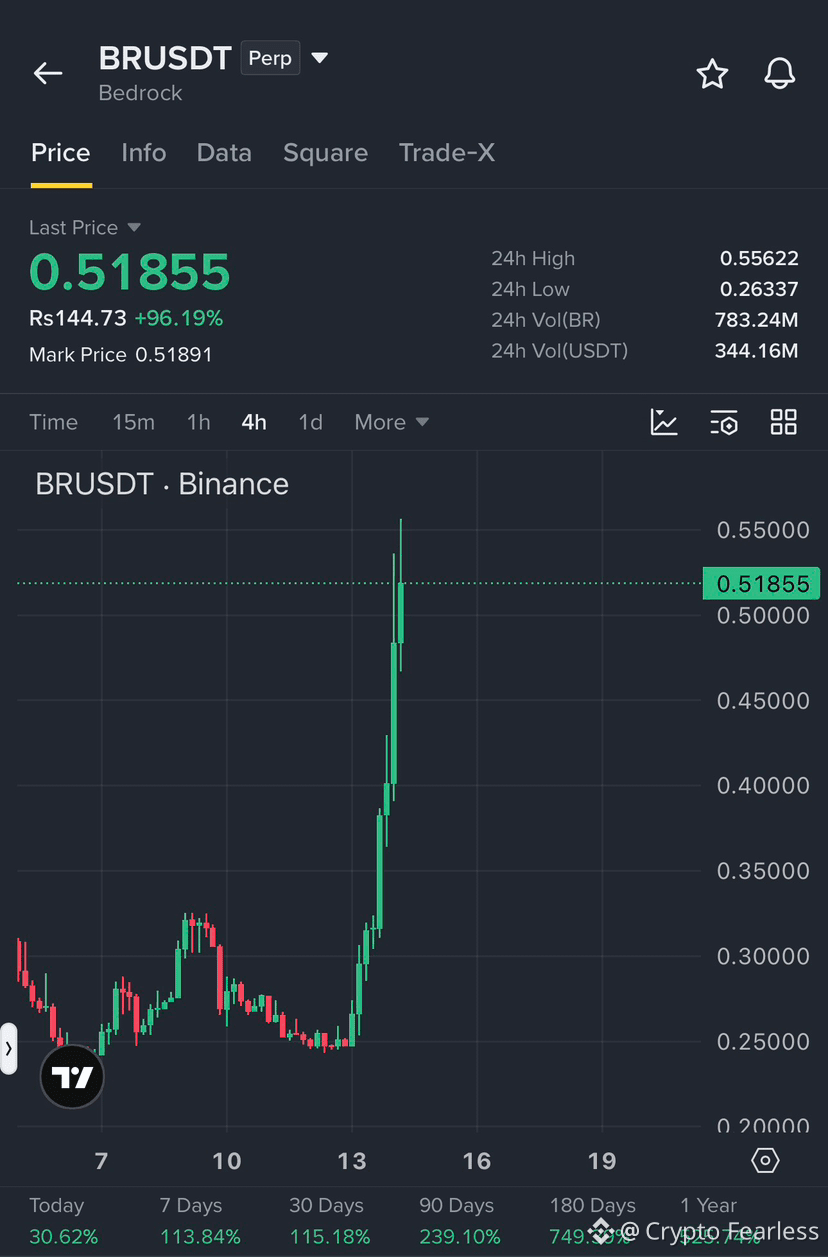
$BR JUST DID +96% — NOW WHAT?
Let’s talk about what this chart is actually showing.
$BRUS started its move from around $0.263 and then exploded higher, reaching a 24H high near $0.556.
That is not a normal move. It is a full momentum breakout.
Looking at the chart, buyers have been in control for several candles. Price is making higher highs and higher lows, while strong volume is supporting the move. That tells me the market is not weak right now.
But here is where I become careful.
After a move of almost 96%, I would not run after the green candles. When everyone starts buying because they see a huge pump, the risk of a sharp pullback becomes much higher.
For me, the most important area is the $0.40–$0.45 zone.
If $BRUS pulls back into this area and buyers defend it, I would be interested in watching for the next move.
My levels:
Support: $0.40–$0.45
Entry zone: $0.42–$0.48
Resistance: $0.556
Next resistance: $0.60
Upside target: $0.68
Invalidation: Below $0.36
The big question now is simple:
Will $BRUS break $0.556 and continue higher, or will the market take some profit first?
If $0.556 breaks with strong buying and price holds above it, $0.60 becomes the next level I’m watching. A clean move through $0.60 could open the way toward $0.68.
But if price gets rejected hard, I would rather wait for the pullback than chase the top.
This is how I look at these setups:
Pump → wait for pullback → watch support → confirm buyers → then enter.
Not:
Pump → FOMO → chase → get trapped.
The chart is bullish, but the entry matters more than the excitement.
I’m watching $BRUS closely. The next pullback could give us a much better opportunity than buying directly into a vertical candle.
Let’s see what buyers do next.
#BRUS #BRUSDT #Binance #Crypto
{alpha}(560xff7d6a96ae471bbcd7713af9cb1feeb16cf56b41)
$BR JUST DID +96% — NOW WHAT?
Let’s talk about what this chart is actually showing.
$BRUS started its move from around $0.263 and then exploded higher, reaching a 24H high near $0.556.
That is not a normal move. It is a full momentum breakout.
Looking at the chart, buyers have been in control for several candles. Price is making higher highs and higher lows, while strong volume is supporting the move. That tells me the market is not weak right now.
But here is where I become careful.
After a move of almost 96%, I would not run after the green candles. When everyone starts buying because they see a huge pump, the risk of a sharp pullback becomes much higher.
For me, the most important area is the $0.40–$0.45 zone.
If $BRUS pulls back into this area and buyers defend it, I would be interested in watching for the next move.
My levels:
Support: $0.40–$0.45
Entry zone: $0.42–$0.48
Resistance: $0.556
Next resistance: $0.60
Upside target: $0.68
Invalidation: Below $0.36
The big question now is simple:
Will $BRUS break $0.556 and continue higher, or will the market take some profit first?
If $0.556 breaks with strong buying and price holds above it, $0.60 becomes the next level I’m watching. A clean move through $0.60 could open the way toward $0.68.
But if price gets rejected hard, I would rather wait for the pullback than chase the top.
This is how I look at these setups:
Pump → wait for pullback → watch support → confirm buyers → then enter.
Not:
Pump → FOMO → chase → get trapped.
The chart is bullish, but the entry matters more than the excitement.
I’m watching $BRUS closely. The next pullback could give us a much better opportunity than buying directly into a vertical candle.
Let’s see what buyers do next.
#BRUS #BRUSDT #Binance #Crypto
Let’s talk about what this chart is actually showing.
$BRUS started its move from around $0.263 and then exploded higher, reaching a 24H high near $0.556.
That is not a normal move. It is a full momentum breakout.
Looking at the chart, buyers have been in control for several candles. Price is making higher highs and higher lows, while strong volume is supporting the move. That tells me the market is not weak right now.
But here is where I become careful.
After a move of almost 96%, I would not run after the green candles. When everyone starts buying because they see a huge pump, the risk of a sharp pullback becomes much higher.
For me, the most important area is the $0.40–$0.45 zone.
If $BRUS pulls back into this area and buyers defend it, I would be interested in watching for the next move.
My levels:
Support: $0.40–$0.45
Entry zone: $0.42–$0.48
Resistance: $0.556
Next resistance: $0.60
Upside target: $0.68
Invalidation: Below $0.36
The big question now is simple:
Will $BRUS break $0.556 and continue higher, or will the market take some profit first?
If $0.556 breaks with strong buying and price holds above it, $0.60 becomes the next level I’m watching. A clean move through $0.60 could open the way toward $0.68.
But if price gets rejected hard, I would rather wait for the pullback than chase the top.
This is how I look at these setups:
Pump → wait for pullback → watch support → confirm buyers → then enter.
Not:
Pump → FOMO → chase → get trapped.
The chart is bullish, but the entry matters more than the excitement.
I’m watching $BRUS closely. The next pullback could give us a much better opportunity than buying directly into a vertical candle.
Let’s see what buyers do next.
#BRUS #BRUSDT #Binance #Crypto
135
·
--
Bearish
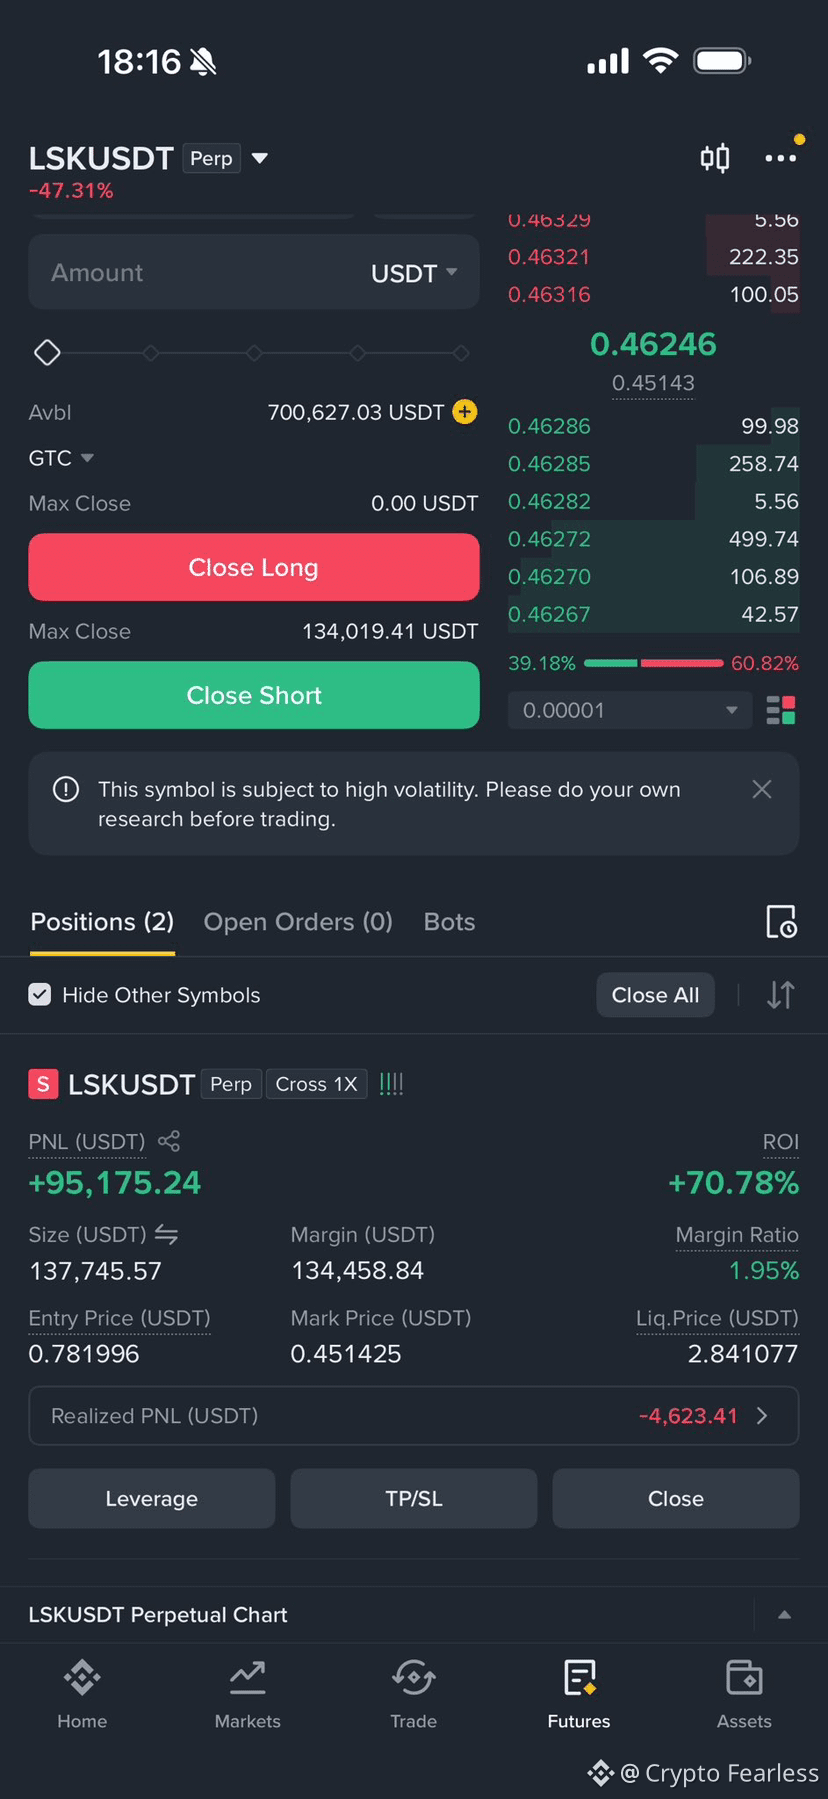
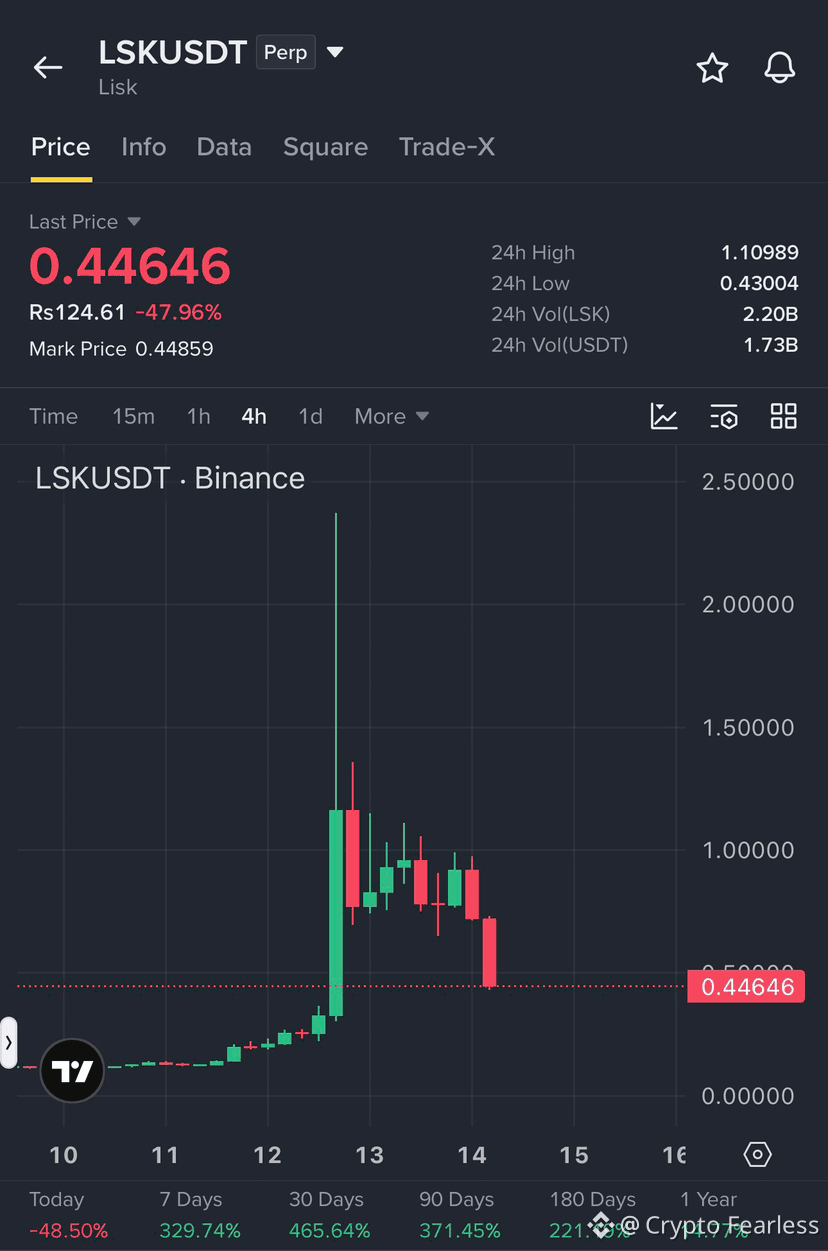
$LSK JUST LOST -48% — CAPITULATION OR DEEPER CRASH?
$LSK has suffered a brutal breakdown after losing the major $0.80–$1.00 consolidation zone.
Price dropped all the way toward $0.43, completely erasing the previous breakout structure. On the daily chart, sellers are clearly in control, and the old range support has now become a major resistance area.
But after such a violent sell-off, I’m watching one important question:
Are sellers finally exhausted, or is another leg down coming?
Key levels I’m watching:
Support: $0.40–$0.43
Resistance: $0.65 / $0.85
Entry zone: $0.42–$0.46
SL: $0.38
TP1: $0.55
TP2: $0.68
TP3: $0.80
My bias is still bearish, but a strong relief bounce is possible if buyers defend the $0.40–$0.43 area.
I would not blindly catch this falling knife. After a move this aggressive, confirmation matters more than trying to call the exact bottom.
If $0.43 holds and lower-timeframe structure starts turning bullish, the rebound could become interesting.
If $0.40 breaks decisively, the whole setup needs to be reconsidered.
The next few candles could tell us whether this is capitulation or just the beginning of another leg down.
Follow for the next setup.
{future}(LSKUSDT)
$LSK JUST LOST -48% — CAPITULATION OR DEEPER CRASH?
$LSK has suffered a brutal breakdown after losing the major $0.80–$1.00 consolidation zone.
Price dropped all the way toward $0.43, completely erasing the previous breakout structure. On the daily chart, sellers are clearly in control, and the old range support has now become a major resistance area.
But after such a violent sell-off, I’m watching one important question:
Are sellers finally exhausted, or is another leg down coming?
Key levels I’m watching:
Support: $0.40–$0.43
Resistance: $0.65 / $0.85
Entry zone: $0.42–$0.46
SL: $0.38
TP1: $0.55
TP2: $0.68
TP3: $0.80
My bias is still bearish, but a strong relief bounce is possible if buyers defend the $0.40–$0.43 area.
I would not blindly catch this falling knife. After a move this aggressive, confirmation matters more than trying to call the exact bottom.
If $0.43 holds and lower-timeframe structure starts turning bullish, the rebound could become interesting.
If $0.40 breaks decisively, the whole setup needs to be reconsidered.
The next few candles could tell us whether this is capitulation or just the beginning of another leg down.
Follow for the next setup.
$LSK has suffered a brutal breakdown after losing the major $0.80–$1.00 consolidation zone.
Price dropped all the way toward $0.43, completely erasing the previous breakout structure. On the daily chart, sellers are clearly in control, and the old range support has now become a major resistance area.
But after such a violent sell-off, I’m watching one important question:
Are sellers finally exhausted, or is another leg down coming?
Key levels I’m watching:
Support: $0.40–$0.43
Resistance: $0.65 / $0.85
Entry zone: $0.42–$0.46
SL: $0.38
TP1: $0.55
TP2: $0.68
TP3: $0.80
My bias is still bearish, but a strong relief bounce is possible if buyers defend the $0.40–$0.43 area.
I would not blindly catch this falling knife. After a move this aggressive, confirmation matters more than trying to call the exact bottom.
If $0.43 holds and lower-timeframe structure starts turning bullish, the rebound could become interesting.
If $0.40 breaks decisively, the whole setup needs to be reconsidered.
The next few candles could tell us whether this is capitulation or just the beginning of another leg down.
Follow for the next setup.
195
·
--
Bearish
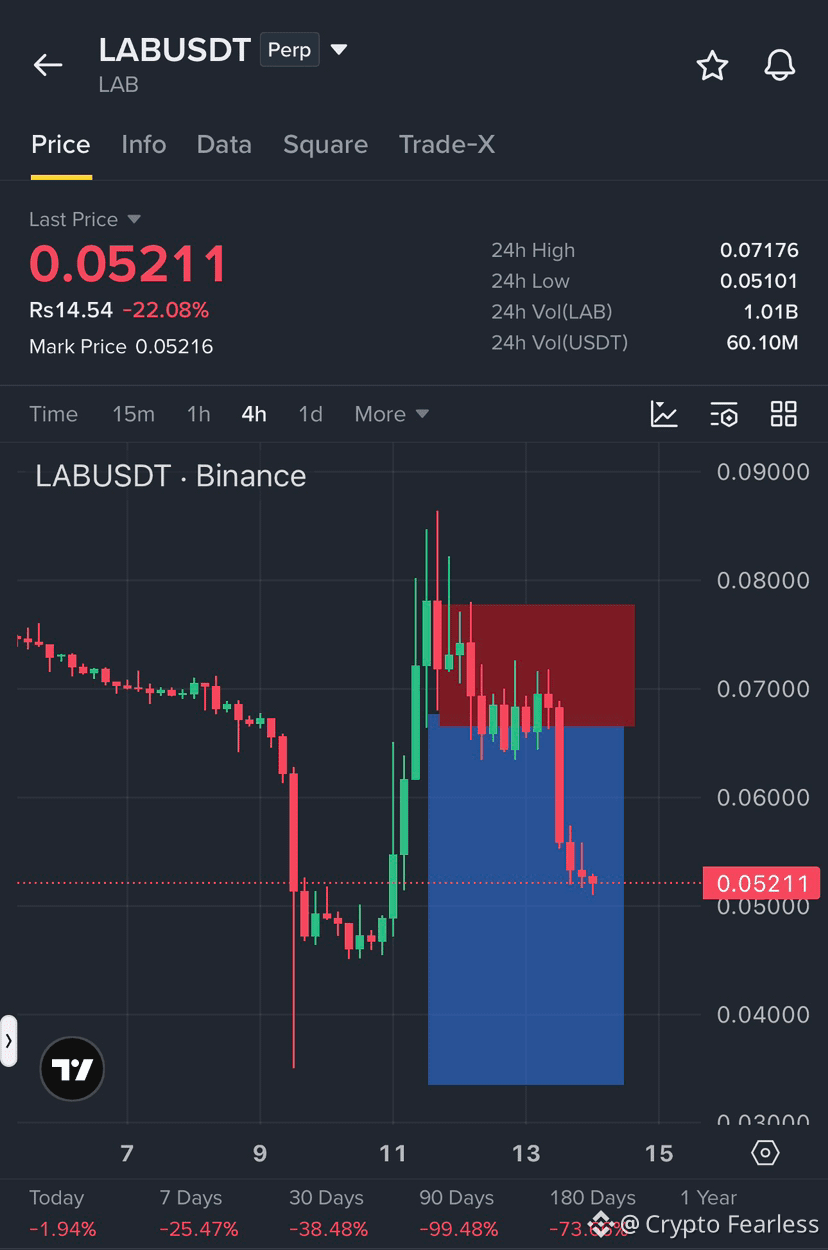
I shared this trade setup 3 days ago, and the first setup is now playing out almost exactly as I expected.
I’m not here to chase pumps or make random calls. I share my setups based on the chart, levels, momentum, and price action.
The first setup followed the plan step by step.
This is why I always say: watch the setup, not the noise.
More setups are coming. Stay focused and manage your risk. $LAB
{alpha}(560x7ec43cf65f1663f820427c62a5780b8f2e25593a)
I shared this trade setup 3 days ago, and the first setup is now playing out almost exactly as I expected.
I’m not here to chase pumps or make random calls. I share my setups based on the chart, levels, momentum, and price action.
The first setup followed the plan step by step.
This is why I always say: watch the setup, not the noise.
More setups are coming. Stay focused and manage your risk. $LAB
I’m not here to chase pumps or make random calls. I share my setups based on the chart, levels, momentum, and price action.
The first setup followed the plan step by step.
This is why I always say: watch the setup, not the noise.
More setups are coming. Stay focused and manage your risk. $LAB
135
·
--
Bullish
$BR — THIS CHART IS TELLING A CLEAR STORY
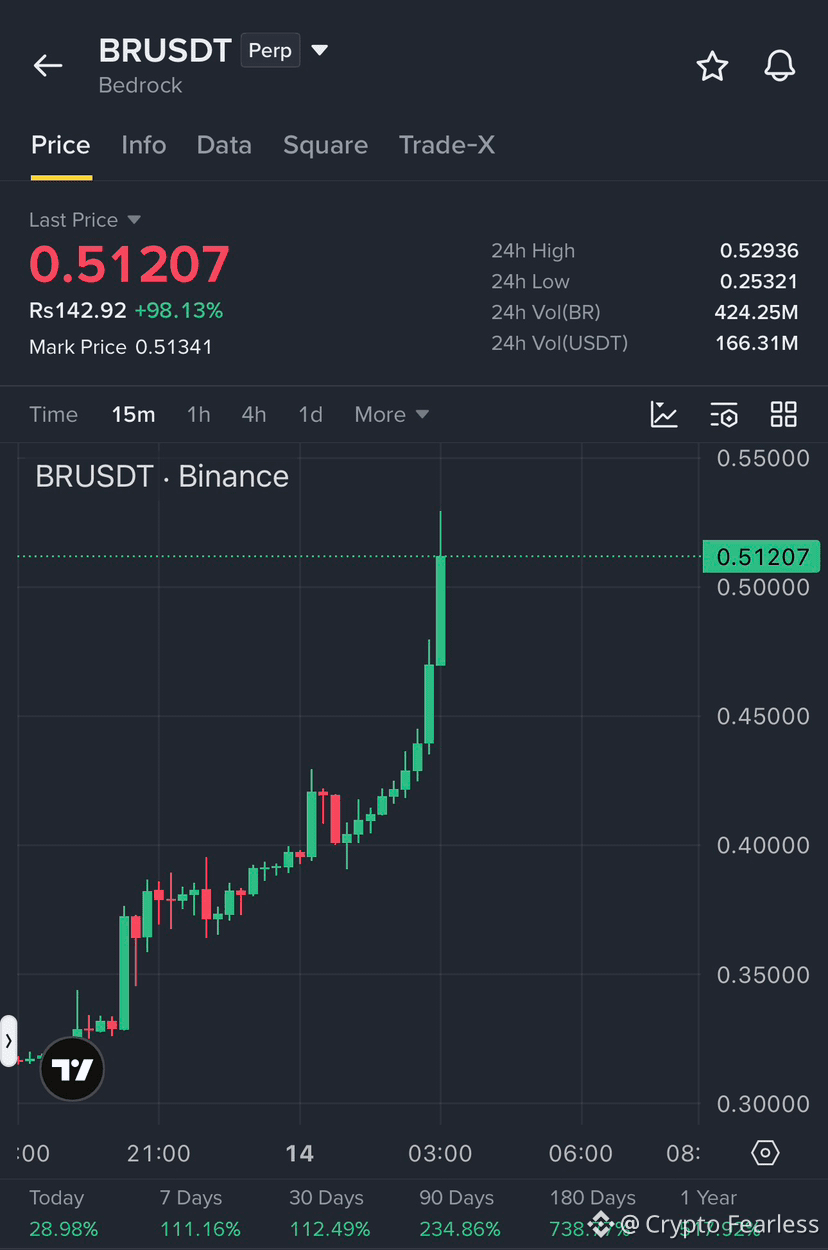
I’m looking at the 15-minute chart of $BRUS, and the price action is very strong.
$BRUS is trading around $0.512, after making a huge move from the $0.30 area. The chart shows a clear series of higher highs and higher lows, which means buyers are controlling the short-term trend.
The most important thing I see is that the move was not just one green candle. Price continued building higher step by step:
$0.30 → $0.35 → $0.40 → $0.45 → $0.50+
That is a strong momentum structure.
But now we are entering a very important area.
The $0.50 level is psychologically important. If buyers can keep price above $0.50 and turn this level into support, the next area I’m watching is around $0.53, which is close to the current 24H high.
A clean breakout above $0.53 could bring another momentum wave.
However, there is another side to this chart.
After a move of almost 100% in 24 hours, chasing the price at the top becomes risky. Strong coins can continue running, but they can also make fast pullbacks when early buyers start taking profits.
For me, these are the levels that matter:
$0.53 — major breakout zone
$0.50 — key psychological support
$0.47 — first pullback area
$0.45 — important short-term support
$0.40 — deeper support
If $BRUS holds above $0.50, I want to see buyers continue defending the level.
If $0.50 breaks with strong selling pressure, I would expect a deeper pullback before considering another move higher.
My view is simple:
Do not chase the green candles. Watch the levels.
The trend is strong, but the best traders are not the people who buy every pump. They wait for confirmation, manage risk, and let the chart come to them.
$BRUS is definitely on my watchlist now.
The next real test is $0.53.
#Binance #Crypto #CryptoTrading
{alpha}(560xff7d6a96ae471bbcd7713af9cb1feeb16cf56b41)
$BR — THIS CHART IS TELLING A CLEAR STORY
I’m looking at the 15-minute chart of $BRUS, and the price action is very strong.
$BRUS is trading around $0.512, after making a huge move from the $0.30 area. The chart shows a clear series of higher highs and higher lows, which means buyers are controlling the short-term trend.
The most important thing I see is that the move was not just one green candle. Price continued building higher step by step:
$0.30 → $0.35 → $0.40 → $0.45 → $0.50+
That is a strong momentum structure.
But now we are entering a very important area.
The $0.50 level is psychologically important. If buyers can keep price above $0.50 and turn this level into support, the next area I’m watching is around $0.53, which is close to the current 24H high.
A clean breakout above $0.53 could bring another momentum wave.
However, there is another side to this chart.
After a move of almost 100% in 24 hours, chasing the price at the top becomes risky. Strong coins can continue running, but they can also make fast pullbacks when early buyers start taking profits.
For me, these are the levels that matter:
$0.53 — major breakout zone
$0.50 — key psychological support
$0.47 — first pullback area
$0.45 — important short-term support
$0.40 — deeper support
If $BRUS holds above $0.50, I want to see buyers continue defending the level.
If $0.50 breaks with strong selling pressure, I would expect a deeper pullback before considering another move higher.
My view is simple:
Do not chase the green candles. Watch the levels.
The trend is strong, but the best traders are not the people who buy every pump. They wait for confirmation, manage risk, and let the chart come to them.
$BRUS is definitely on my watchlist now.
The next real test is $0.53.
#Binance #Crypto #CryptoTrading
I’m looking at the 15-minute chart of $BRUS, and the price action is very strong.
$BRUS is trading around $0.512, after making a huge move from the $0.30 area. The chart shows a clear series of higher highs and higher lows, which means buyers are controlling the short-term trend.
The most important thing I see is that the move was not just one green candle. Price continued building higher step by step:
$0.30 → $0.35 → $0.40 → $0.45 → $0.50+
That is a strong momentum structure.
But now we are entering a very important area.
The $0.50 level is psychologically important. If buyers can keep price above $0.50 and turn this level into support, the next area I’m watching is around $0.53, which is close to the current 24H high.
A clean breakout above $0.53 could bring another momentum wave.
However, there is another side to this chart.
After a move of almost 100% in 24 hours, chasing the price at the top becomes risky. Strong coins can continue running, but they can also make fast pullbacks when early buyers start taking profits.
For me, these are the levels that matter:
$0.53 — major breakout zone
$0.50 — key psychological support
$0.47 — first pullback area
$0.45 — important short-term support
$0.40 — deeper support
If $BRUS holds above $0.50, I want to see buyers continue defending the level.
If $0.50 breaks with strong selling pressure, I would expect a deeper pullback before considering another move higher.
My view is simple:
Do not chase the green candles. Watch the levels.
The trend is strong, but the best traders are not the people who buy every pump. They wait for confirmation, manage risk, and let the chart come to them.
$BRUS is definitely on my watchlist now.
The next real test is $0.53.
#Binance #Crypto #CryptoTrading
209
·
--
Bullish
$BTW — THIS CHART DESERVES ATTENTION
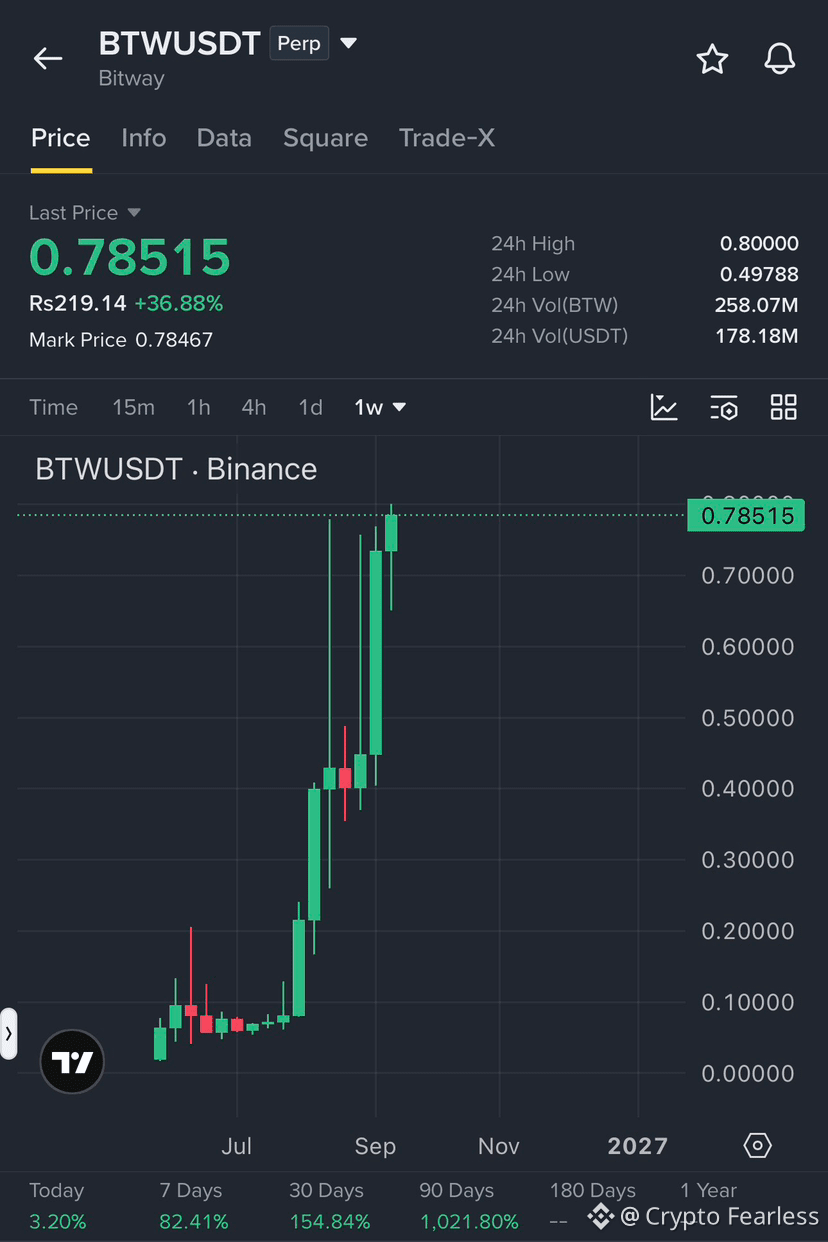
I have been watching $BTW for a while, and the weekly chart is showing something very interesting.
Price is now around $0.785, with the 24H high near $0.80. What stands out to me is not just today’s move, but the bigger picture.
BTW has moved from below $0.10 to around $0.78 in a relatively short period. That is a massive change in price structure.
On the weekly chart, buyers have continued to push price higher after every major breakout. The recent candles are still strong, which tells me momentum is clearly on the buyers’ side.
But this is also the area where I would stay careful.
$0.80 is the key level now.
If BTW breaks above $0.80 and holds it as support, I would watch for the next expansion toward $0.90 and $1.00.
If price gets rejected around $0.80, I would not panic. After such a strong move, a healthy pullback could happen before another attempt higher.
The levels I am watching:
Resistance: $0.80
Breakout zone: Above $0.80
Next targets: $0.90 → $1.00
Important support: $0.70 → $0.60
My main focus is simple: watch the reaction at $0.80.
A clean breakout with strong buying can open the door to another major move. But if buyers fail to hold the breakout, I would rather wait for a better entry than chase the top.
This is the kind of chart where patience matters.
I’m watching $BTW closely. The next weekly candle could be very important.
{alpha}(560x444045b0ee1ee319a660a5e3d604ca0ffa35acaa)
$BTW — THIS CHART DESERVES ATTENTION
I have been watching $BTW for a while, and the weekly chart is showing something very interesting.
Price is now around $0.785, with the 24H high near $0.80. What stands out to me is not just today’s move, but the bigger picture.
BTW has moved from below $0.10 to around $0.78 in a relatively short period. That is a massive change in price structure.
On the weekly chart, buyers have continued to push price higher after every major breakout. The recent candles are still strong, which tells me momentum is clearly on the buyers’ side.
But this is also the area where I would stay careful.
$0.80 is the key level now.
If BTW breaks above $0.80 and holds it as support, I would watch for the next expansion toward $0.90 and $1.00.
If price gets rejected around $0.80, I would not panic. After such a strong move, a healthy pullback could happen before another attempt higher.
The levels I am watching:
Resistance: $0.80
Breakout zone: Above $0.80
Next targets: $0.90 → $1.00
Important support: $0.70 → $0.60
My main focus is simple: watch the reaction at $0.80.
A clean breakout with strong buying can open the door to another major move. But if buyers fail to hold the breakout, I would rather wait for a better entry than chase the top.
This is the kind of chart where patience matters.
I’m watching $BTW closely. The next weekly candle could be very important.
I have been watching $BTW for a while, and the weekly chart is showing something very interesting.
Price is now around $0.785, with the 24H high near $0.80. What stands out to me is not just today’s move, but the bigger picture.
BTW has moved from below $0.10 to around $0.78 in a relatively short period. That is a massive change in price structure.
On the weekly chart, buyers have continued to push price higher after every major breakout. The recent candles are still strong, which tells me momentum is clearly on the buyers’ side.
But this is also the area where I would stay careful.
$0.80 is the key level now.
If BTW breaks above $0.80 and holds it as support, I would watch for the next expansion toward $0.90 and $1.00.
If price gets rejected around $0.80, I would not panic. After such a strong move, a healthy pullback could happen before another attempt higher.
The levels I am watching:
Resistance: $0.80
Breakout zone: Above $0.80
Next targets: $0.90 → $1.00
Important support: $0.70 → $0.60
My main focus is simple: watch the reaction at $0.80.
A clean breakout with strong buying can open the door to another major move. But if buyers fail to hold the breakout, I would rather wait for a better entry than chase the top.
This is the kind of chart where patience matters.
I’m watching $BTW closely. The next weekly candle could be very important.
195
·
--
Bullish
$BTC IS STARTING TO WAKE UP
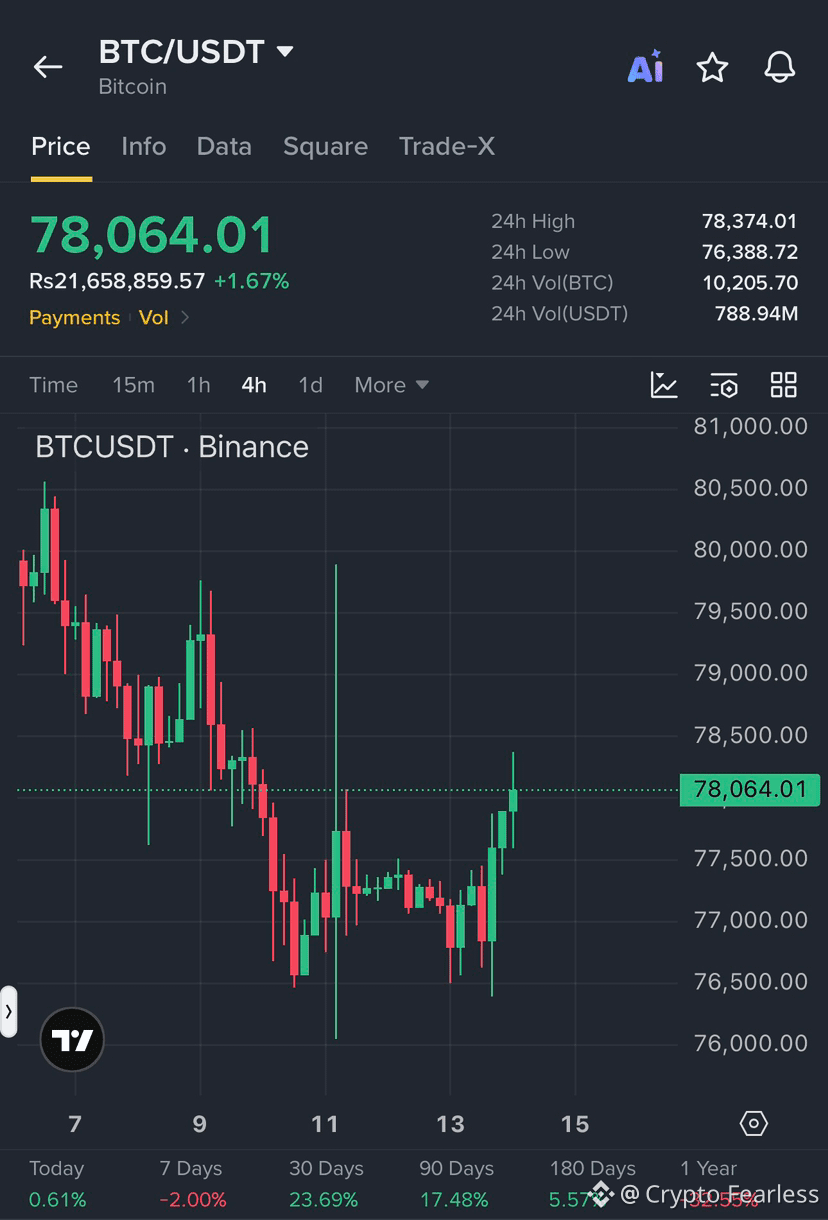
Looking at this 4H chart, BTC has bounced strongly from the $76K area and is now back above $78K.
The important zone for me is $78K–$78.5K.
If BTC breaks and holds above $78.5K, I’m watching $79K → $80K next.
But if $78K gets rejected, a pullback toward $77K–$76.5K is possible before the next move.
For now, I’m watching the reaction at resistance. One clean breakout can change the whole setup.
{future}(BTCUSDT)
$BTC IS STARTING TO WAKE UP
Looking at this 4H chart, BTC has bounced strongly from the $76K area and is now back above $78K.
The important zone for me is $78K–$78.5K.
If BTC breaks and holds above $78.5K, I’m watching $79K → $80K next.
But if $78K gets rejected, a pullback toward $77K–$76.5K is possible before the next move.
For now, I’m watching the reaction at resistance. One clean breakout can change the whole setup.
Looking at this 4H chart, BTC has bounced strongly from the $76K area and is now back above $78K.
The important zone for me is $78K–$78.5K.
If BTC breaks and holds above $78.5K, I’m watching $79K → $80K next.
But if $78K gets rejected, a pullback toward $77K–$76.5K is possible before the next move.
For now, I’m watching the reaction at resistance. One clean breakout can change the whole setup.
30
·
--
Bearish
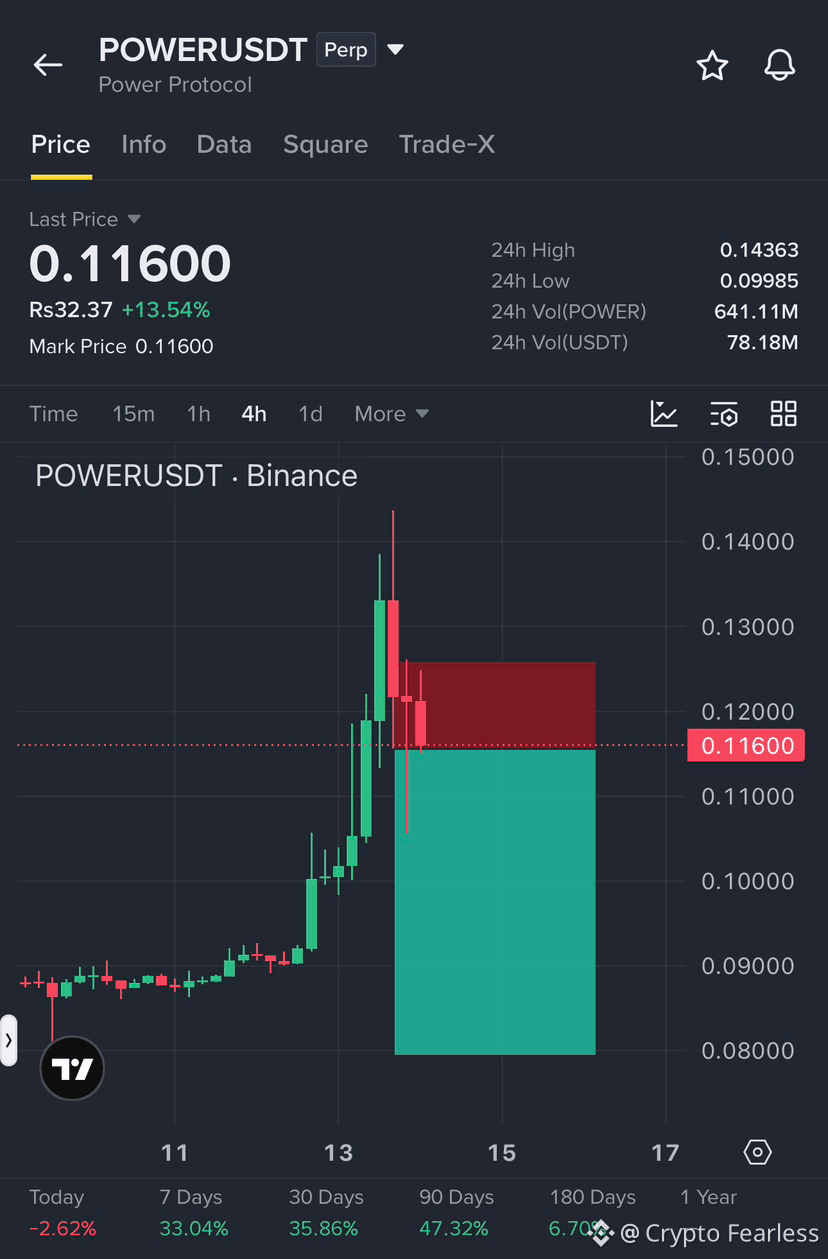
I’m taking a short on $POWER around $0.116 after the sharp rejection from the $0.14 area.
The move was strong, but the chart is now showing selling pressure. I’m looking for a retracement toward the lower support zones.
Entry: $0.116–$0.120
TP1: $0.105
TP2: $0.095
TP3: $0.080
SL: $0.125
My invalidation is a clean breakout and hold above $0.125.
I’m not chasing the move here. The idea is simple: rejection from resistance, controlled entry, and let the setup play out.
{alpha}(560x9dc44ae5be187eca9e2a67e33f27a4c91cea1223)
I’m taking a short on $POWER around $0.116 after the sharp rejection from the $0.14 area.
The move was strong, but the chart is now showing selling pressure. I’m looking for a retracement toward the lower support zones.
Entry: $0.116–$0.120
TP1: $0.105
TP2: $0.095
TP3: $0.080
SL: $0.125
My invalidation is a clean breakout and hold above $0.125.
I’m not chasing the move here. The idea is simple: rejection from resistance, controlled entry, and let the setup play out.
The move was strong, but the chart is now showing selling pressure. I’m looking for a retracement toward the lower support zones.
Entry: $0.116–$0.120
TP1: $0.105
TP2: $0.095
TP3: $0.080
SL: $0.125
My invalidation is a clean breakout and hold above $0.125.
I’m not chasing the move here. The idea is simple: rejection from resistance, controlled entry, and let the setup play out.
140
·
--
Bearish
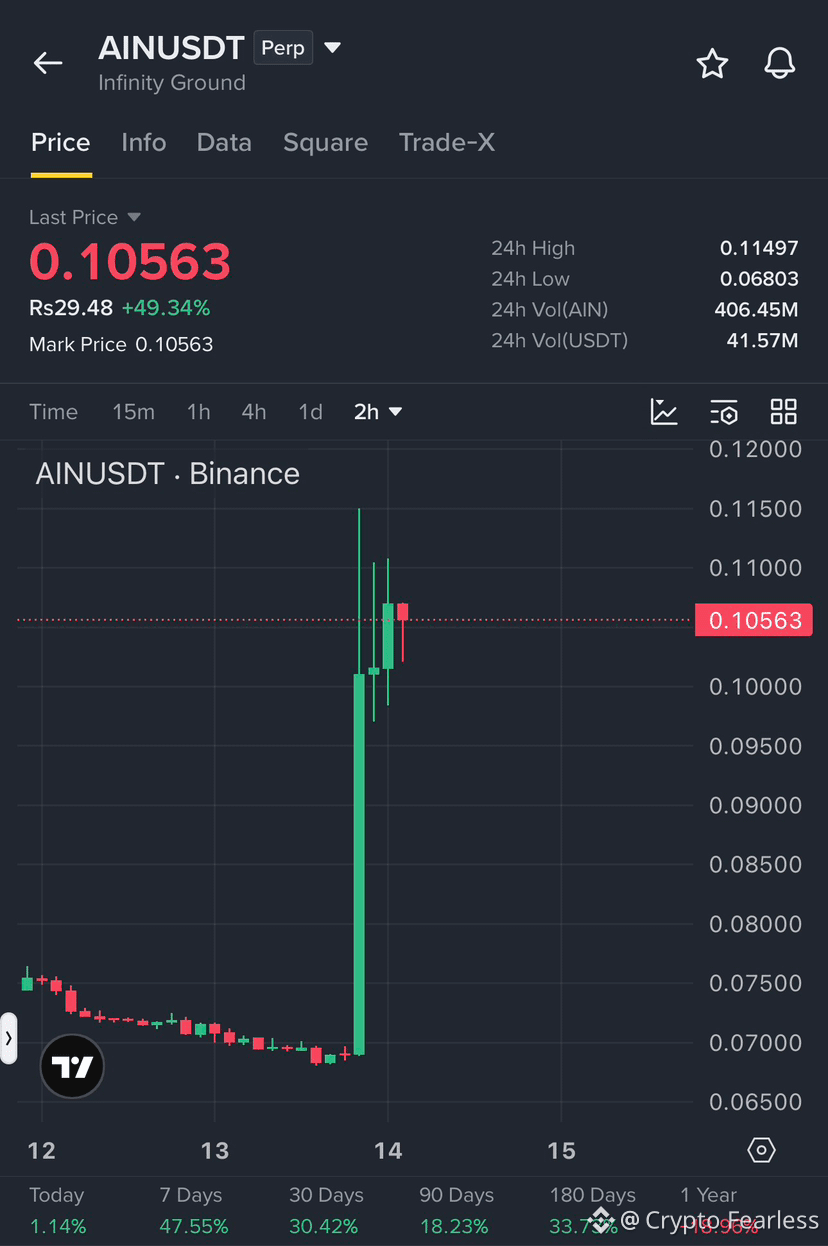
$AIN SHORT TRADE SETUP
After a massive breakout from the $0.069 area, $AIN is now showing rejection near $0.108–$0.115 resistance.
SHORT ENTRY: $0.107–$0.112
TP1: $0.100
TP2: $0.095
TP3: $0.088
STOP LOSS: $0.116
If $0.115 breaks and holds, invalidate the short setup.
Do not chase the move. Wait for rejection confirmation.
{alpha}(560x9558a9254890b2a8b057a789f413631b9084f4a3)
$AIN SHORT TRADE SETUP
After a massive breakout from the $0.069 area, $AIN is now showing rejection near $0.108–$0.115 resistance.
SHORT ENTRY: $0.107–$0.112
TP1: $0.100
TP2: $0.095
TP3: $0.088
STOP LOSS: $0.116
If $0.115 breaks and holds, invalidate the short setup.
Do not chase the move. Wait for rejection confirmation.
After a massive breakout from the $0.069 area, $AIN is now showing rejection near $0.108–$0.115 resistance.
SHORT ENTRY: $0.107–$0.112
TP1: $0.100
TP2: $0.095
TP3: $0.088
STOP LOSS: $0.116
If $0.115 breaks and holds, invalidate the short setup.
Do not chase the move. Wait for rejection confirmation.
1
83
·
--
Bullish
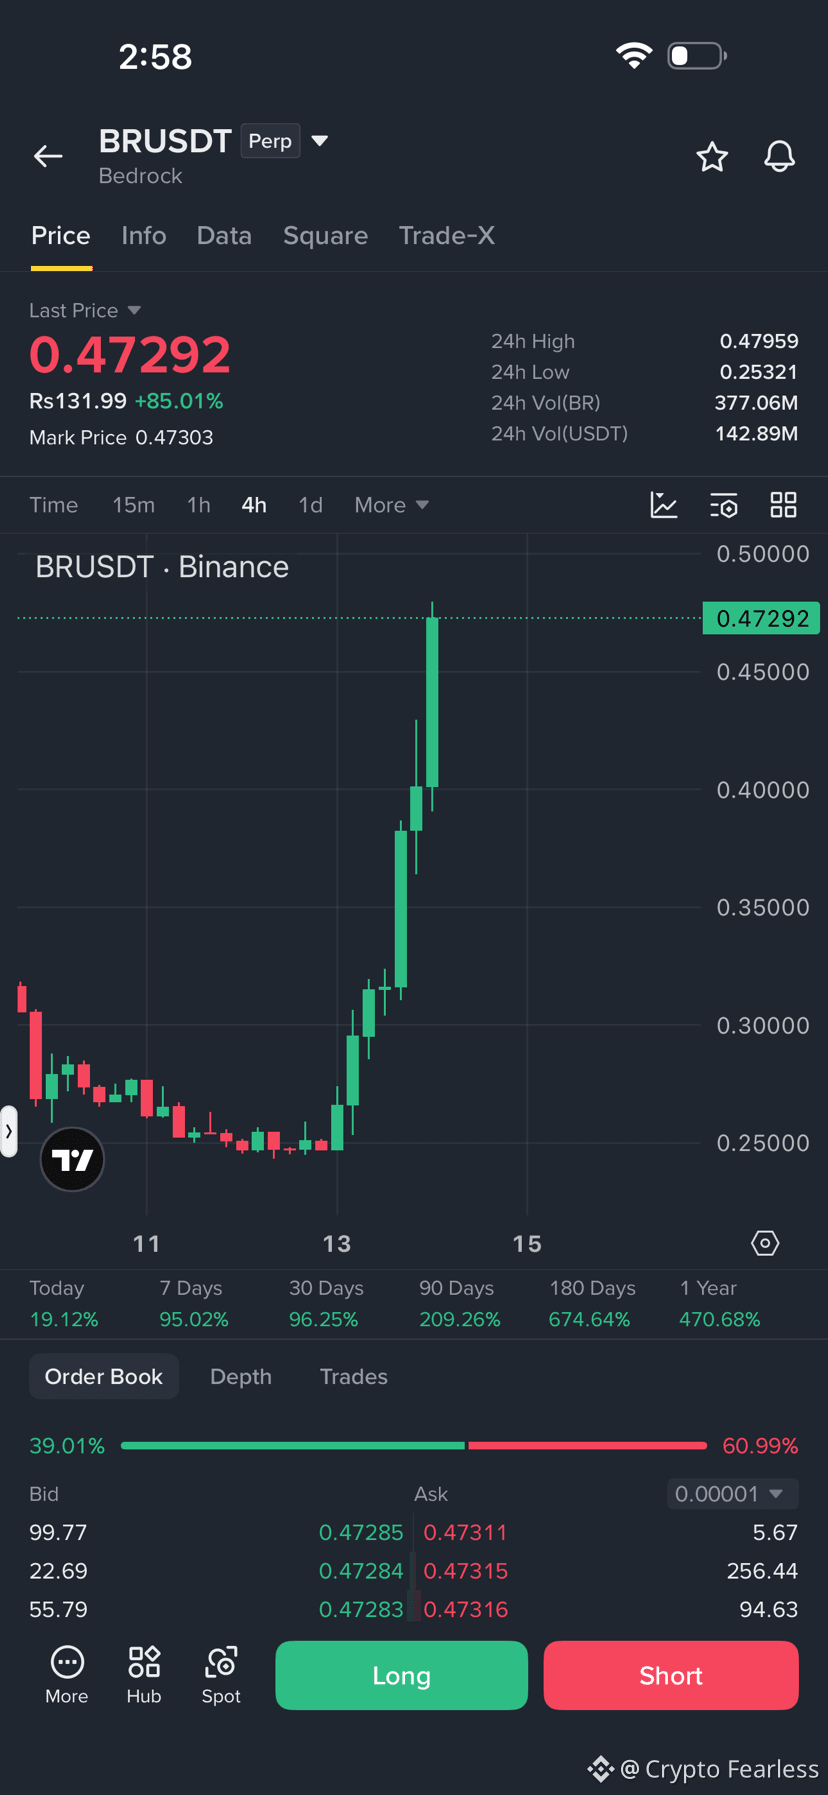
$BR has made a massive +85% move and is now trading near $0.473.
LONG ENTRY: $0.445–$0.460
TP1: $0.480
TP2: $0.500
TP3: $0.530
STOP LOSS: $0.425
Do not chase the pump. Wait for a pullback and confirmation of buyers.
High volatility — manage risk carefully.
{alpha}(560xff7d6a96ae471bbcd7713af9cb1feeb16cf56b41)
$BR has made a massive +85% move and is now trading near $0.473.
LONG ENTRY: $0.445–$0.460
TP1: $0.480
TP2: $0.500
TP3: $0.530
STOP LOSS: $0.425
Do not chase the pump. Wait for a pullback and confirmation of buyers.
High volatility — manage risk carefully.
LONG ENTRY: $0.445–$0.460
TP1: $0.480
TP2: $0.500
TP3: $0.530
STOP LOSS: $0.425
Do not chase the pump. Wait for a pullback and confirmation of buyers.
High volatility — manage risk carefully.
1
297
Since early 2025… the markets have been unforgiving.
Wild swings, heavy manipulation… and the truth is roughly 80% of traders are bleeding money.
Not because the game is rigged…
but because most people aren't trading — they're betting.
They chase pumps… overleverage… throw risk management out the window…
and end up feeding the bigger players.
Now let me flip the script…
Since the start of 2025 I've pulled in over $1.75M in profit trading futures.
Not through blind scalping…
but by riding trends, swing trading, and reading the bigger picture.
And no, this isn't bragging.
This is a wake-up call.
Because trading might be the hardest way to make "easy" money.
Some of you will read this and feel fired up…
some will scroll past…
and some will start doubting yourselves instead of leveling up.
That's what separates people.
Also — I don't stick to one account or wallet.
I run several. Not everything needs to be on display.
You'll only find me on Binance Square and X — no personal life on show.
Privacy, focus, execution. That's my code.
Here's the bottom line:
👉 The market isn't what decides your success — you are.
👉 Discipline, mindset, knowledge — that's what actually matters.
Staring at charts alone won't make you profitable.
You need:
• Fundamentals
• On-chain awareness
• Tracking smart money
Only then can you survive this chaos.
Stay steady… keep sharpening yourself…
Your own success story is coming.
And for as long as I'm here…
I'll keep sharing the ride with you.
We rise together. 🫡
Since early 2025… the markets have been unforgiving.
Wild swings, heavy manipulation… and the truth is roughly 80% of traders are bleeding money.
Not because the game is rigged…
but because most people aren't trading — they're betting.
They chase pumps… overleverage… throw risk management out the window…
and end up feeding the bigger players.
Now let me flip the script…
Since the start of 2025 I've pulled in over $1.75M in profit trading futures.
Not through blind scalping…
but by riding trends, swing trading, and reading the bigger picture.
And no, this isn't bragging.
This is a wake-up call.
Because trading might be the hardest way to make "easy" money.
Some of you will read this and feel fired up…
some will scroll past…
and some will start doubting yourselves instead of leveling up.
That's what separates people.
Also — I don't stick to one account or wallet.
I run several. Not everything needs to be on display.
You'll only find me on Binance Square and X — no personal life on show.
Privacy, focus, execution. That's my code.
Here's the bottom line:
👉 The market isn't what decides your success — you are.
👉 Discipline, mindset, knowledge — that's what actually matters.
Staring at charts alone won't make you profitable.
You need:
• Fundamentals
• On-chain awareness
• Tracking smart money
Only then can you survive this chaos.
Stay steady… keep sharpening yourself…
Your own success story is coming.
And for as long as I'm here…
I'll keep sharing the ride with you.
We rise together. 🫡
Wild swings, heavy manipulation… and the truth is roughly 80% of traders are bleeding money.
Not because the game is rigged…
but because most people aren't trading — they're betting.
They chase pumps… overleverage… throw risk management out the window…
and end up feeding the bigger players.
Now let me flip the script…
Since the start of 2025 I've pulled in over $1.75M in profit trading futures.
Not through blind scalping…
but by riding trends, swing trading, and reading the bigger picture.
And no, this isn't bragging.
This is a wake-up call.
Because trading might be the hardest way to make "easy" money.
Some of you will read this and feel fired up…
some will scroll past…
and some will start doubting yourselves instead of leveling up.
That's what separates people.
Also — I don't stick to one account or wallet.
I run several. Not everything needs to be on display.
You'll only find me on Binance Square and X — no personal life on show.
Privacy, focus, execution. That's my code.
Here's the bottom line:
👉 The market isn't what decides your success — you are.
👉 Discipline, mindset, knowledge — that's what actually matters.
Staring at charts alone won't make you profitable.
You need:
• Fundamentals
• On-chain awareness
• Tracking smart money
Only then can you survive this chaos.
Stay steady… keep sharpening yourself…
Your own success story is coming.
And for as long as I'm here…
I'll keep sharing the ride with you.
We rise together. 🫡

8
·
--
Bearish
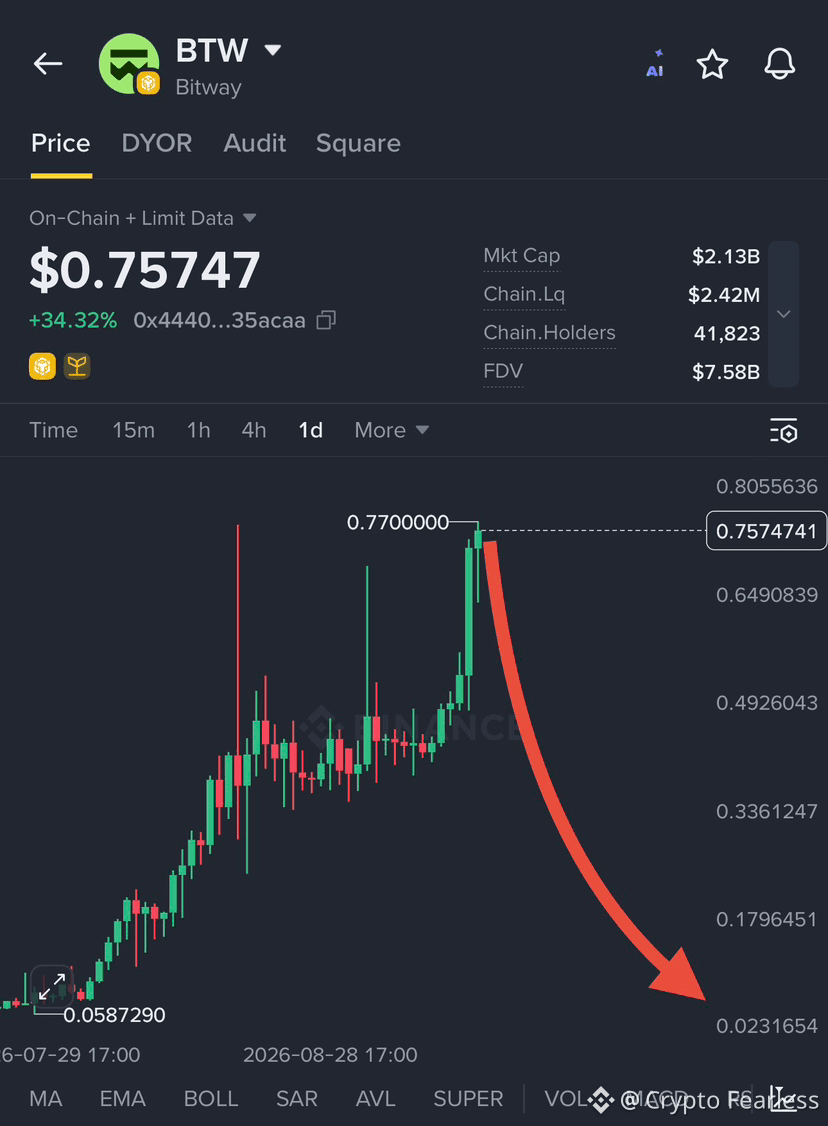
The candles are talking — $BTW is officially on the radar. 👑
{alpha}(560x444045b0ee1ee319a660a5e3d604ca0ffa35acaa)
The candles are talking — $BTW is officially on the radar. 👑
88
·
--
Bullish
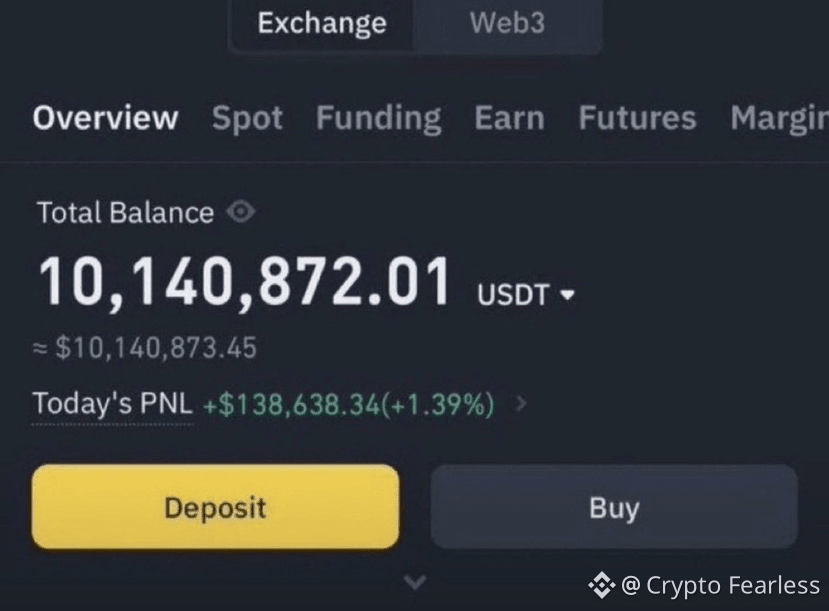
$10.1M balance, $138K daily profit — the kind of numbers that make people pay attention. 🔥
$10.1M balance, $138K daily profit — the kind of numbers that make people pay attention. 🔥
18
·
--
Bullish
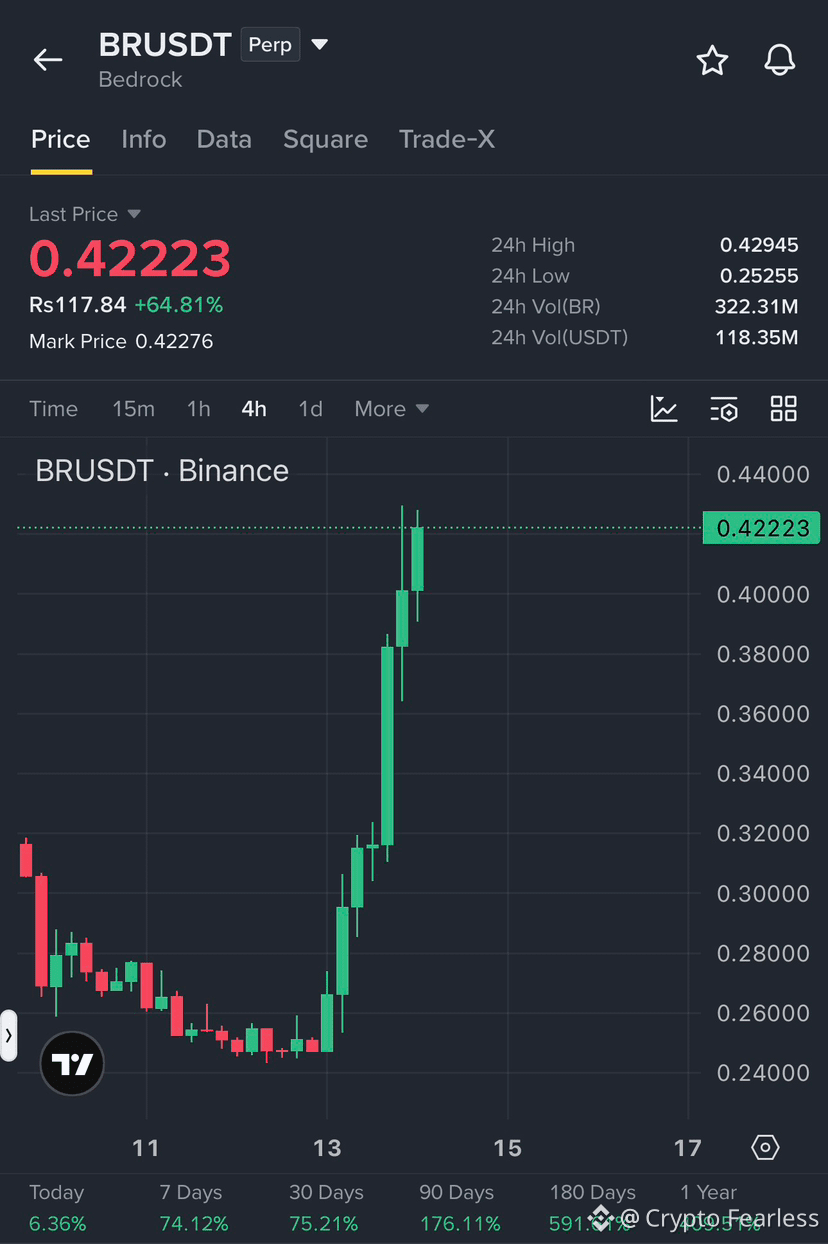
DON’T SHORT $BR
I am seeing a lot of people opening short positions on $BR because it has been pumped 70% and is the top gainer on Binance from yesterday.
But lemme tell you something.
I am seeing $LSK like pump in $BR. There is no resistance above. Volume is also strong and there isn’t a single candle spike like 20% or 30% and instead the pump is gradual and steady.
Also if you see 7D and 30D gain they are also very low to open short.
That’s why I will suggest not to open short and wait for it to reach around $1.
{alpha}(560xff7d6a96ae471bbcd7713af9cb1feeb16cf56b41)
DON’T SHORT $BR
I am seeing a lot of people opening short positions on $BR because it has been pumped 70% and is the top gainer on Binance from yesterday.
But lemme tell you something.
I am seeing $LSK like pump in $BR . There is no resistance above. Volume is also strong and there isn’t a single candle spike like 20% or 30% and instead the pump is gradual and steady.
Also if you see 7D and 30D gain they are also very low to open short.
That’s why I will suggest not to open short and wait for it to reach around $1.
I am seeing a lot of people opening short positions on $BR because it has been pumped 70% and is the top gainer on Binance from yesterday.
But lemme tell you something.
I am seeing $LSK like pump in $BR . There is no resistance above. Volume is also strong and there isn’t a single candle spike like 20% or 30% and instead the pump is gradual and steady.
Also if you see 7D and 30D gain they are also very low to open short.
That’s why I will suggest not to open short and wait for it to reach around $1.
12
·
--
Bearish
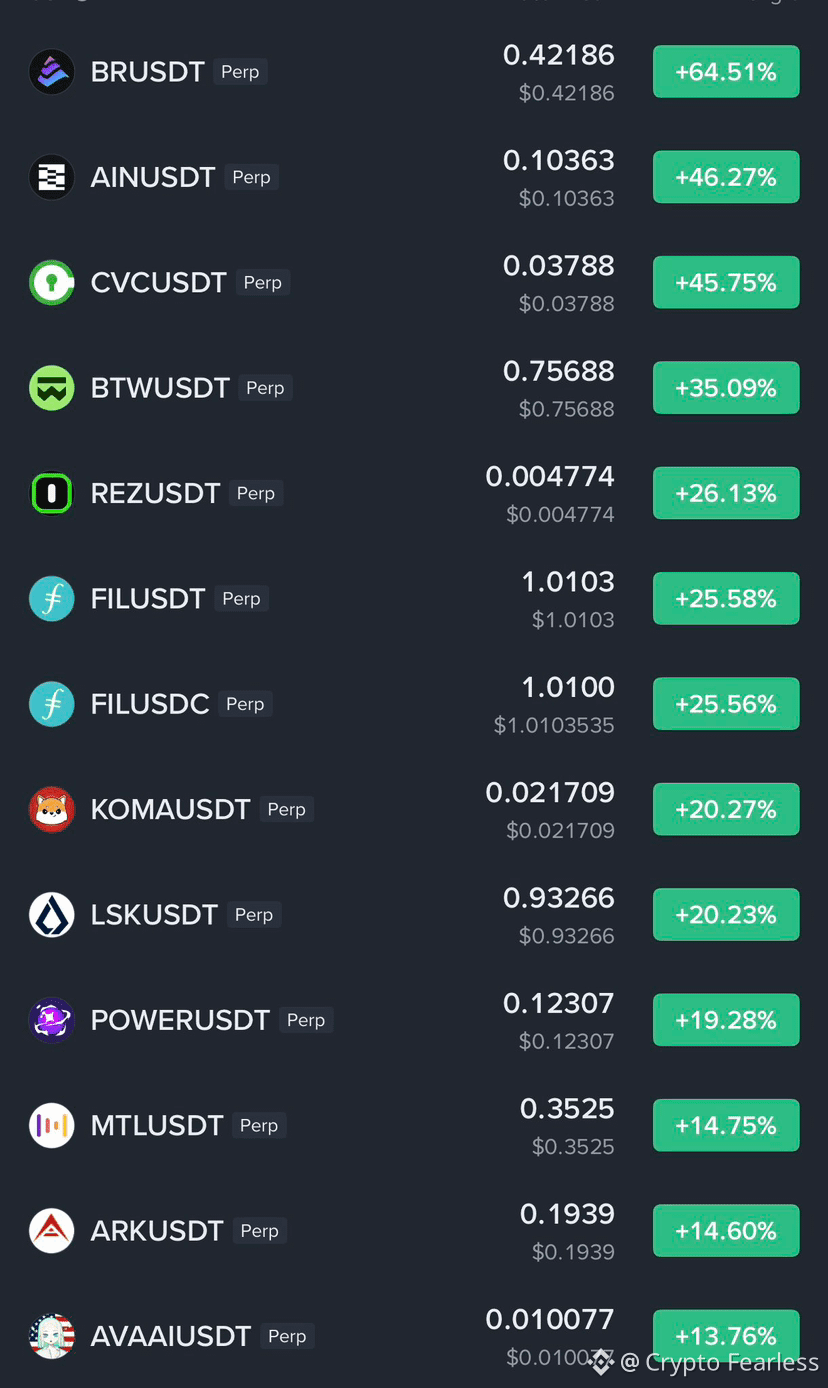
There are some good SHORT setups being formed on some top gainers.
Here are my few short setups that I will open:
$REZ short on $0.006
$BTW short on $0.8
$AIN short on $0.12
$龙虾 short on $0.15
$CVC short on $0.06
$LSK short on $1.4
$BR short on $0.1
I don’t want to FOMO, that’s why I will try to open short from higher prices.
DYOR - NFA
{alpha}(560x9558a9254890b2a8b057a789f413631b9084f4a3)
{alpha}(560x444045b0ee1ee319a660a5e3d604ca0ffa35acaa)
{future}(REZUSDT)
There are some good SHORT setups being formed on some top gainers.
Here are my few short setups that I will open:
$REZ short on $0.006
$BTW short on $0.8
$AIN short on $0.12
$龙虾 short on $0.15
$CVC short on $0.06
$LSK short on $1.4
$BR short on $0.1
I don’t want to FOMO, that’s why I will try to open short from higher prices.
DYOR - NFA
Here are my few short setups that I will open:
$REZ short on $0.006
$BTW short on $0.8
$AIN short on $0.12
$龙虾 short on $0.15
$CVC short on $0.06
$LSK short on $1.4
$BR short on $0.1
I don’t want to FOMO, that’s why I will try to open short from higher prices.
DYOR - NFA
9
·
--
Bullish
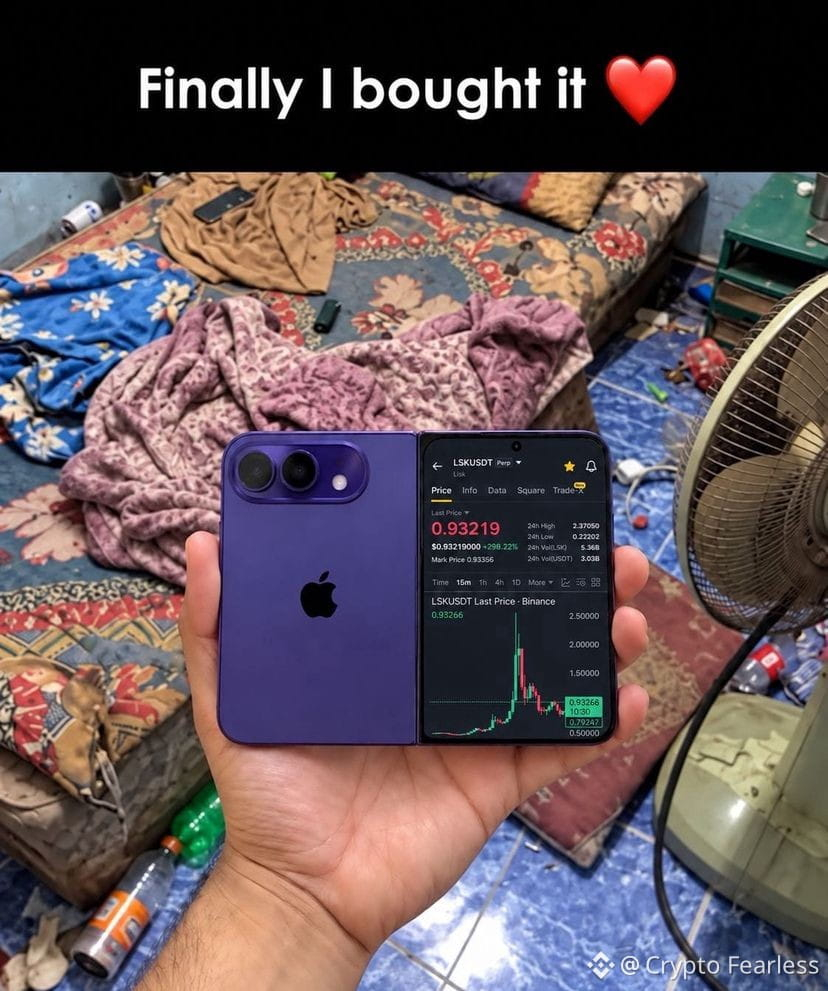
"Not to jinx it, but $LSK might've just changed my life 🤣"
{future}(LSKUSDT)
"Not to jinx it, but $LSK might've just changed my life 🤣"
212
·
--
Bearish
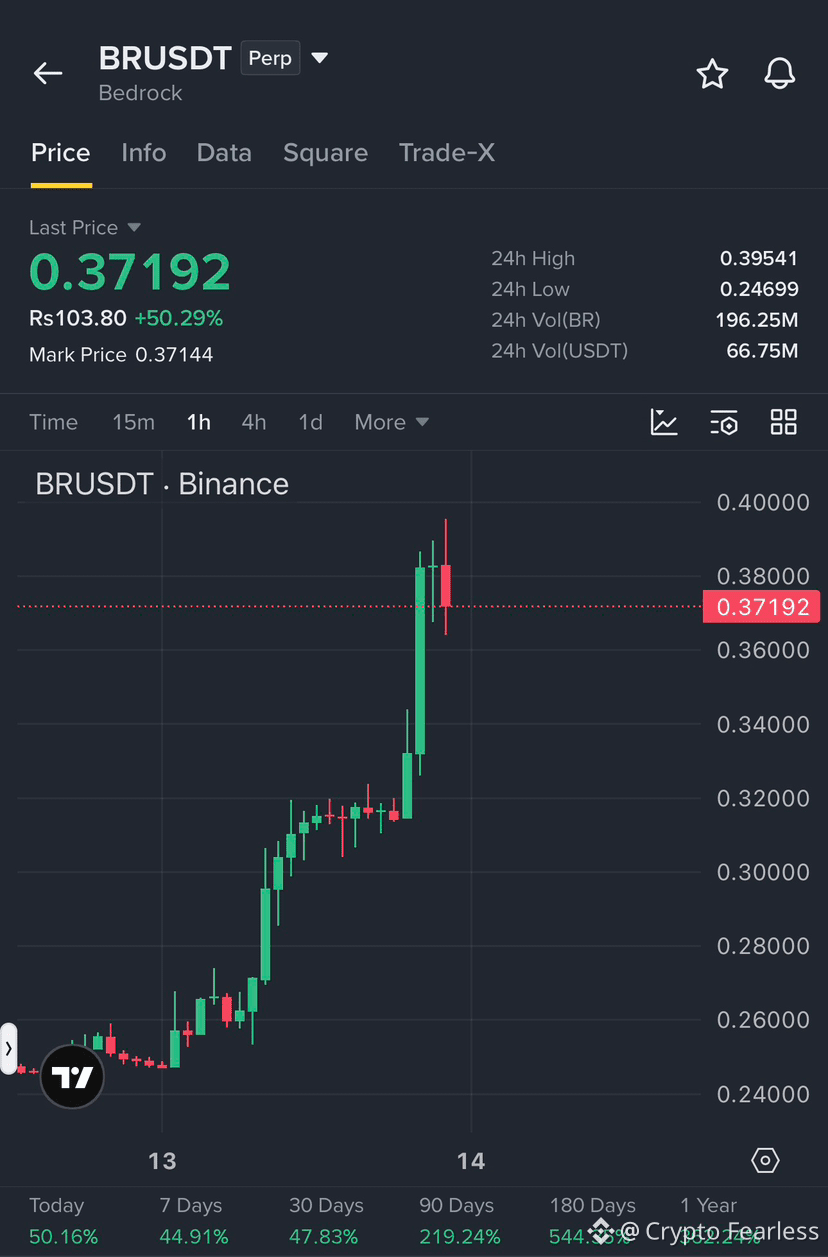
$BR is showing signs of a short-term dump rejection after the huge move.
{alpha}(560xff7d6a96ae471bbcd7713af9cb1feeb16cf56b41)
$BR is showing signs of a short-term dump rejection after the huge move.
81
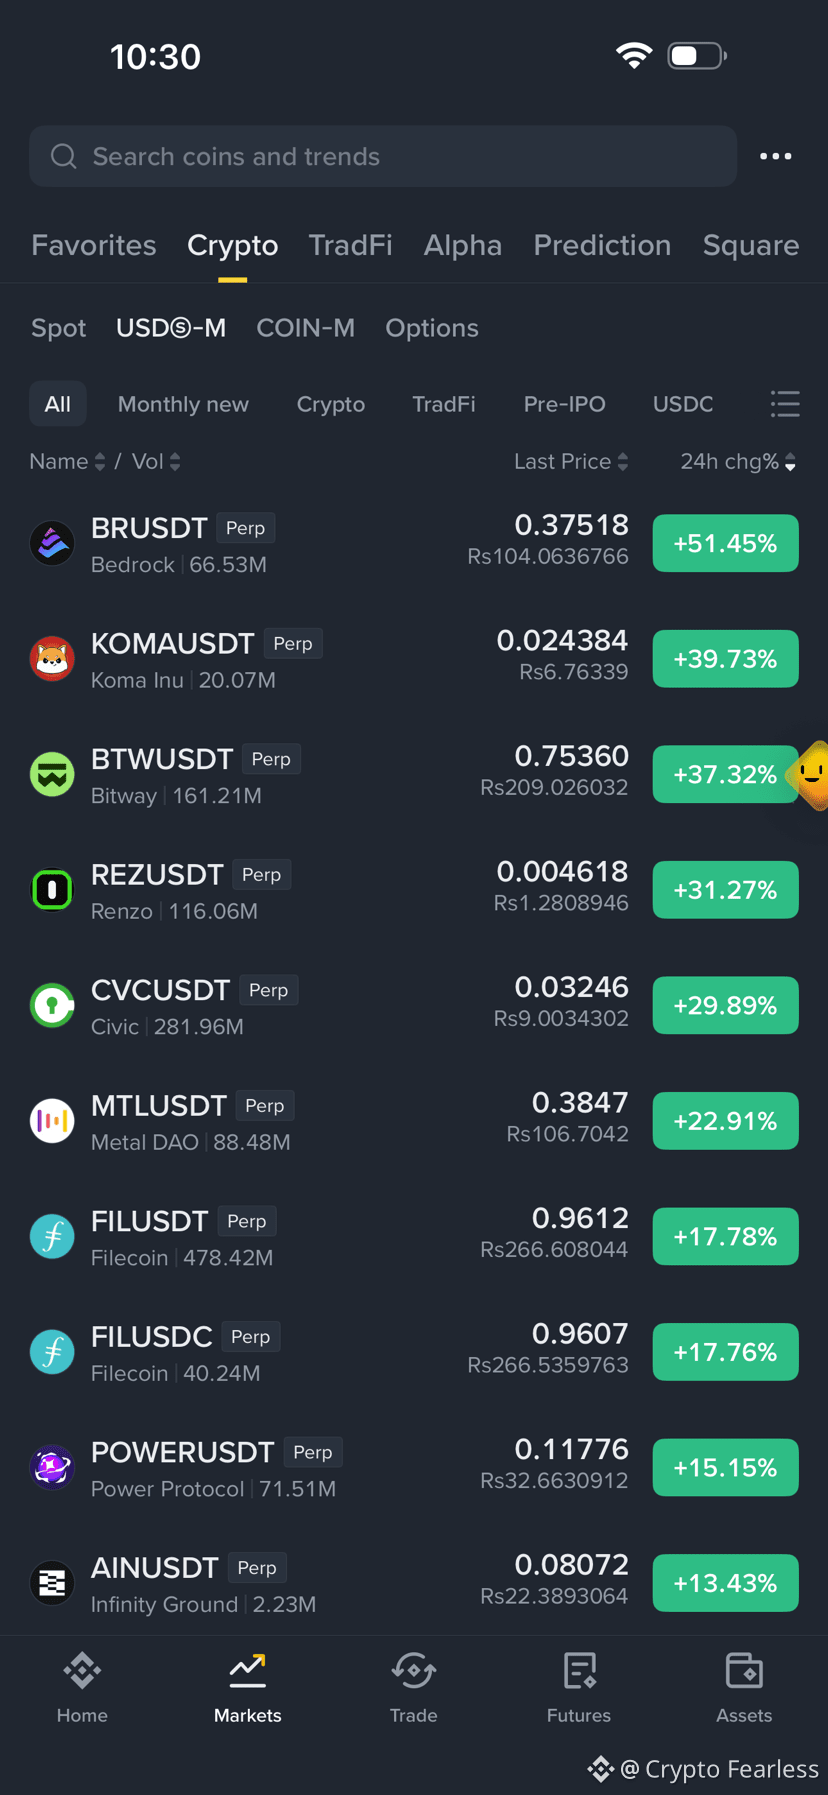
Perpetual futures top gainers are flashing massive green across the board—are you chasing FOMO or waiting for confirmed pullbacks?
USDⓈ-M futures show aggressive upside momentum across multiple tickers, led by BRUSDT surging +51.45% to 0.37518, closely followed by KOMAUSDT (0.024384, +39.73%), BTWUSDT (0.75360, +37.32%), and REZUSDT (0.004618, +31.27%). Established names like FILUSDT (0.9612, +17.78%) are also attracting significant volume ($478.42M), confirming widespread short-term speculative capital inflows.
Structure: Market-wide perpetual futures breakout and momentum expansion phase
Support: Dynamic support zones (Wait for lower-timeframe 15m/1h demand areas)
Resistance: Key high-water marks (BR: 0.37518, KOMA: 0.024384, BTW: 0.75360, FIL: 0.9612)
Bias: Neutral-Bullish (Focus strictly on pullback confirmations)
Trade Plan:
Entry: Wait for local 15m/1h price consolidation on pullbacks near key breakout levels
SL: Below local swing lows of chosen setups
TP1: Retest of 24h peak
TP2: Breakout expansion zone
TP3: Macro higher-timeframe resistance level
Chasing vertical green spikes on high-leverage perpetual contracts carries severe liquidation risk during sudden market-wide flushes. Exercise strict position sizing, keep leverage conservative, and wait for clear lower-timeframe market structure setups before taking trades.
Follow Crypto Fearless for daily market analysis, trading psychology, and high-quality crypto trade setups. Share your market view in the comments.
Perpetual futures top gainers are flashing massive green across the board—are you chasing FOMO or waiting for confirmed pullbacks?
USDⓈ-M futures show aggressive upside momentum across multiple tickers, led by BRUSDT surging +51.45% to 0.37518, closely followed by KOMAUSDT (0.024384, +39.73%), BTWUSDT (0.75360, +37.32%), and REZUSDT (0.004618, +31.27%). Established names like FILUSDT (0.9612, +17.78%) are also attracting significant volume ($478.42M), confirming widespread short-term speculative capital inflows.
Structure: Market-wide perpetual futures breakout and momentum expansion phase
Support: Dynamic support zones (Wait for lower-timeframe 15m/1h demand areas)
Resistance: Key high-water marks (BR: 0.37518, KOMA: 0.024384, BTW: 0.75360, FIL: 0.9612)
Bias: Neutral-Bullish (Focus strictly on pullback confirmations)
Trade Plan:
Entry: Wait for local 15m/1h price consolidation on pullbacks near key breakout levels
SL: Below local swing lows of chosen setups
TP1: Retest of 24h peak
TP2: Breakout expansion zone
TP3: Macro higher-timeframe resistance level
Chasing vertical green spikes on high-leverage perpetual contracts carries severe liquidation risk during sudden market-wide flushes. Exercise strict position sizing, keep leverage conservative, and wait for clear lower-timeframe market structure setups before taking trades.
Follow Crypto Fearless for daily market analysis, trading psychology, and high-quality crypto trade setups. Share your market view in the comments.
USDⓈ-M futures show aggressive upside momentum across multiple tickers, led by BRUSDT surging +51.45% to 0.37518, closely followed by KOMAUSDT (0.024384, +39.73%), BTWUSDT (0.75360, +37.32%), and REZUSDT (0.004618, +31.27%). Established names like FILUSDT (0.9612, +17.78%) are also attracting significant volume ($478.42M), confirming widespread short-term speculative capital inflows.
Structure: Market-wide perpetual futures breakout and momentum expansion phase
Support: Dynamic support zones (Wait for lower-timeframe 15m/1h demand areas)
Resistance: Key high-water marks (BR: 0.37518, KOMA: 0.024384, BTW: 0.75360, FIL: 0.9612)
Bias: Neutral-Bullish (Focus strictly on pullback confirmations)
Trade Plan:
Entry: Wait for local 15m/1h price consolidation on pullbacks near key breakout levels
SL: Below local swing lows of chosen setups
TP1: Retest of 24h peak
TP2: Breakout expansion zone
TP3: Macro higher-timeframe resistance level
Chasing vertical green spikes on high-leverage perpetual contracts carries severe liquidation risk during sudden market-wide flushes. Exercise strict position sizing, keep leverage conservative, and wait for clear lower-timeframe market structure setups before taking trades.
Follow Crypto Fearless for daily market analysis, trading psychology, and high-quality crypto trade setups. Share your market view in the comments.
272
·
--
Bearish
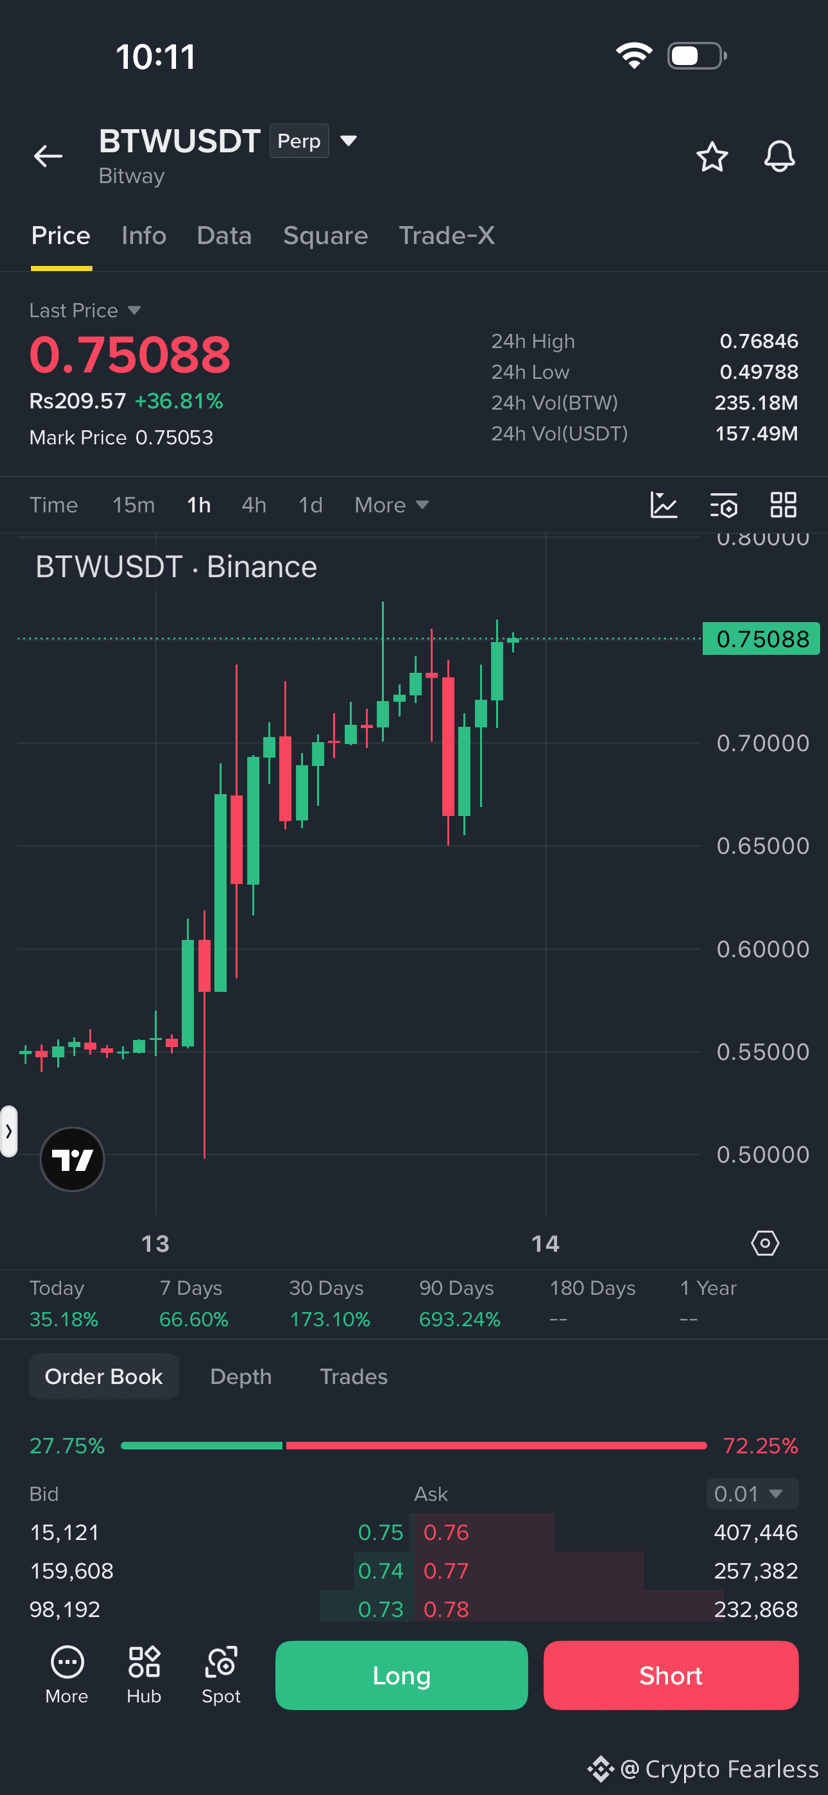
$BTW SHORT — WILL THE NEXT DUMP CONFIRM?
I’ve opened a short on BTW. I’m watching the same bearish pattern that played out on VELVET, CYS and LAB. If BTW follows the same structure, downside could come next.
{alpha}(560x444045b0ee1ee319a660a5e3d604ca0ffa35acaa)
$BTW SHORT — WILL THE NEXT DUMP CONFIRM?
I’ve opened a short on BTW. I’m watching the same bearish pattern that played out on VELVET, CYS and LAB. If BTW follows the same structure, downside could come next.
I’ve opened a short on BTW. I’m watching the same bearish pattern that played out on VELVET, CYS and LAB. If BTW follows the same structure, downside could come next.
123
Log in to explore more content
Join global crypto users on Binance Square
⚡️ Get latest and useful information about crypto.
💬 Trusted by the world’s largest crypto exchange.
👍 Discover real insights from verified creators.
Email / Phone number