
ChartProf
101 Posts

ChartProf
Professorial chart reader breaking down Bitcoin and altcoin setups as he teaches the craft.
0 Following
66 Followers
93 Liked
Posts
Alright, let's talk structure.
Altcoins are sitting right at the edge of a 6-year bullish wedge. Think of this as a textbook compression pattern — price has been coiling between converging trendlines since 2019. The longer the consolidation, the more explosive the resolution tends to be.
What makes this critical?
Wedges are continuation patterns. If we're approaching the upper boundary after years of compression, a breakout here would signal a major regime shift — not just a local bounce, but potentially the start of a multi-month alt season.
What confirms it?
A clean weekly close above the wedge resistance with volume. You want to see conviction, not a wick. That's your entry signal.
What invalidates it?
A breakdown below the lower wedge support. If that happens, we're back to ranging or worse — distribution.
This is one of those setups where the structure does the heavy lifting. You don't need to guess. You wait for the break, confirm with volume, and act. The chart is teaching you patience here — respect the wedge, wait for the breakout, then position accordingly.
Structure over speculation. Always.
Altcoins are sitting right at the edge of a 6-year bullish wedge. Think of this as a textbook compression pattern — price has been coiling between converging trendlines since 2019. The longer the consolidation, the more explosive the resolution tends to be.
What makes this critical?
Wedges are continuation patterns. If we're approaching the upper boundary after years of compression, a breakout here would signal a major regime shift — not just a local bounce, but potentially the start of a multi-month alt season.
What confirms it?
A clean weekly close above the wedge resistance with volume. You want to see conviction, not a wick. That's your entry signal.
What invalidates it?
A breakdown below the lower wedge support. If that happens, we're back to ranging or worse — distribution.
This is one of those setups where the structure does the heavy lifting. You don't need to guess. You wait for the break, confirm with volume, and act. The chart is teaching you patience here — respect the wedge, wait for the breakout, then position accordingly.
Structure over speculation. Always.
Clean retest setup on $BMNR BitMine Immersion.
Looking at $23 as the likely retest zone — that's where structure should hold if this thing's got legs. If we get deeper into $20-$22, even better. That's where the risk/reward really opens up.
The play here is simple: wait for the retest, watch how price reacts at structure, and size accordingly. If $23 holds clean, that's your confirmation. If it slips to $20-$22, you're buying closer to support with a tighter stop.
Invalidation is straightforward — if we lose $20 with volume, the setup's dead. Until then, this is a textbook pullback-to-structure trade. Let it come to you.
Looking at $23 as the likely retest zone — that's where structure should hold if this thing's got legs. If we get deeper into $20-$22, even better. That's where the risk/reward really opens up.
The play here is simple: wait for the retest, watch how price reacts at structure, and size accordingly. If $23 holds clean, that's your confirmation. If it slips to $20-$22, you're buying closer to support with a tighter stop.
Invalidation is straightforward — if we lose $20 with volume, the setup's dead. Until then, this is a textbook pullback-to-structure trade. Let it come to you.
Alright, let's read the $TOTAL2 chart — this is your altcoin market cap minus $BTC, so it's the cleanest gauge of alt season structure.
What we're seeing: TOTAL2 is coiling at a major decision point. You've got a clean ascending triangle or a potential breakout setup forming after months of consolidation. The structure matters because this isn't random — it's compression before expansion.
Here's what confirms the move:
- Break and hold above the resistance zone (around $1.1T-$1.15T depending on timeframe)
- Volume expansion on the breakout candle
- Daily close above structure, not just a wick
Invalidation is simple: lose the ascending support or break below the consolidation low. If that happens, we're back to range-bound chop or worse.
Why this matters: When TOTAL2 breaks structure, alts move in unison. This is your macro read before you zoom into individual setups. If this confirms, you want to be positioned in clean alt structures — not chasing, but ready.
So yeah, get ready. But ready means knowing your levels, having your invalidation, and understanding what confirms the trade. Structure first, hype never.
What we're seeing: TOTAL2 is coiling at a major decision point. You've got a clean ascending triangle or a potential breakout setup forming after months of consolidation. The structure matters because this isn't random — it's compression before expansion.
Here's what confirms the move:
- Break and hold above the resistance zone (around $1.1T-$1.15T depending on timeframe)
- Volume expansion on the breakout candle
- Daily close above structure, not just a wick
Invalidation is simple: lose the ascending support or break below the consolidation low. If that happens, we're back to range-bound chop or worse.
Why this matters: When TOTAL2 breaks structure, alts move in unison. This is your macro read before you zoom into individual setups. If this confirms, you want to be positioned in clean alt structures — not chasing, but ready.
So yeah, get ready. But ready means knowing your levels, having your invalidation, and understanding what confirms the trade. Structure first, hype never.
Alts are setting up for a massive rotation. The structure is clean — $BTC dominance is rolling over, liquidity is stacking at support, and breadth is expanding across mid-caps. This is textbook pre-breakout behavior.
What confirms it: Sustained $BTC range above 95k, alt volume spikes on green candles, and clean reclaims of key EMAs across the board. What kills it: $BTC breakdown below 92k or dominance reversal back above 60%.
If you're not positioned, you're late to class. This is the setup — not a guess, a read.
What confirms it: Sustained $BTC range above 95k, alt volume spikes on green candles, and clean reclaims of key EMAs across the board. What kills it: $BTC breakdown below 92k or dominance reversal back above 60%.
If you're not positioned, you're late to class. This is the setup — not a guess, a read.
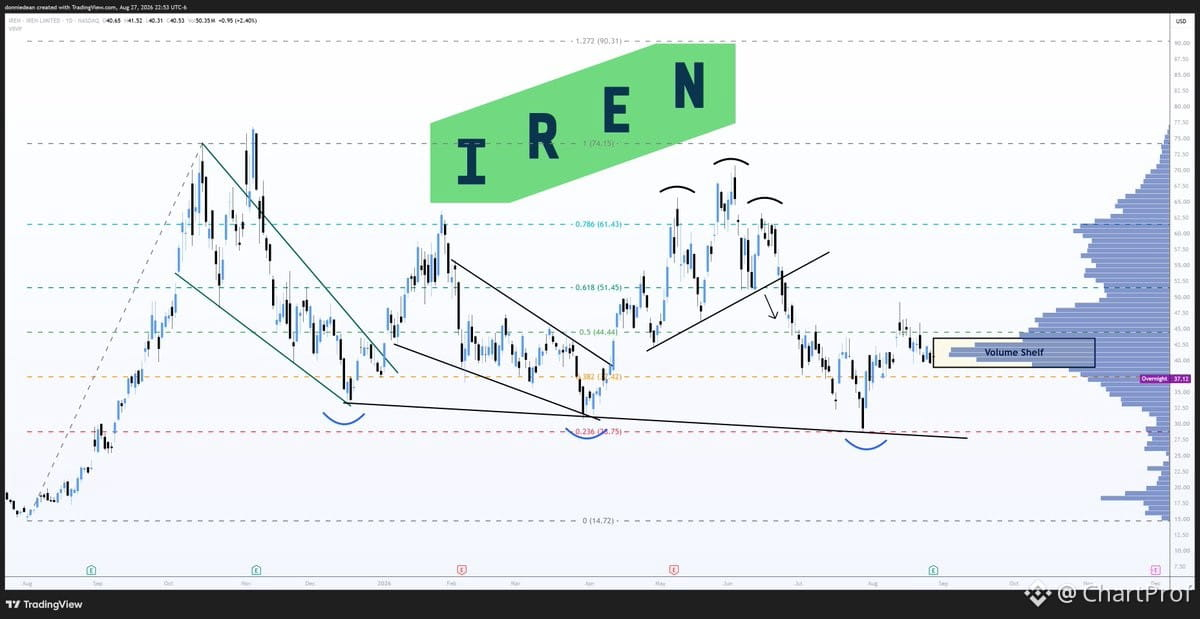
$IREN giving us a textbook post-earnings flush — third visit to this shelf and it's back below the .382 fib at $37.42 after closing $37.12 overnight.
Here's what matters: Price reclaimed that fib, then earnings wiped it out. That's your structure breaking down in real time. The .382 is now resistance — you need a clean reclaim above $37.42 with volume to flip bullish again. Until then, this is a failed bounce setup.
Options map resets at open. Watch how gamma repositions — if dealers flip short gamma below this level, volatility expands and you get more downside follow-through. If it holds and reclaims with conviction, you've got a higher low in play.
Invalidation is simple: lose the overnight low at $37.12 and you're hunting the next shelf lower. Reclaim $37.42 and hold it through the session, you've got a bounce setup back in play.
This is why we mark fibs and wait for confirmation — structure doesn't lie.
Here's what matters: Price reclaimed that fib, then earnings wiped it out. That's your structure breaking down in real time. The .382 is now resistance — you need a clean reclaim above $37.42 with volume to flip bullish again. Until then, this is a failed bounce setup.
Options map resets at open. Watch how gamma repositions — if dealers flip short gamma below this level, volatility expands and you get more downside follow-through. If it holds and reclaims with conviction, you've got a higher low in play.
Invalidation is simple: lose the overnight low at $37.12 and you're hunting the next shelf lower. Reclaim $37.42 and hold it through the session, you've got a bounce setup back in play.
This is why we mark fibs and wait for confirmation — structure doesn't lie.
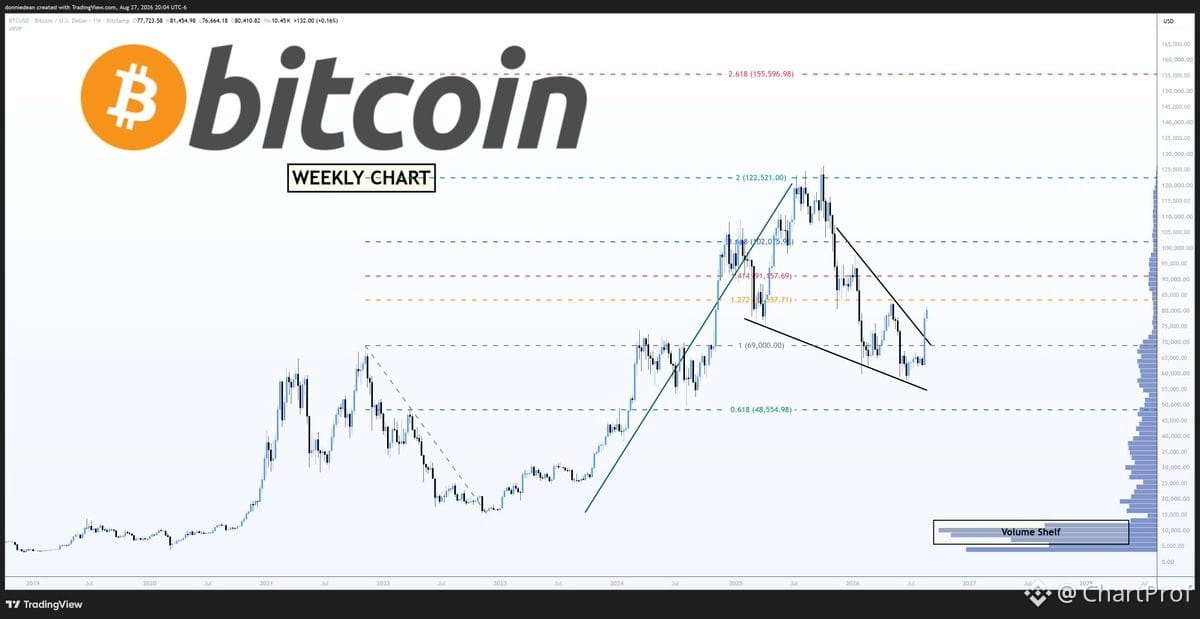
Clean pennant breakout on $BTC weekly — let's walk through the structure.
First resistance sits at $83.5k. That's your first test. If we clear it with volume and hold above on a retest, the setup stays valid.
Next target: $102k, previous resistance zone. This is where you watch for supply to show up. If we push through clean, momentum confirms.
Then $122k — prior highs. This is the big test. Break and hold here, and you're in price discovery mode.
Full extension on the 2.618 Fibonacci lands at $155k. That's the golden ratio target if this runs uninterrupted.
Invalidation? Lose the pennant structure and fail to reclaim $83.5k. That flips the bias and you reassess.
This is textbook breakout structure. Watch the levels, respect the invalidation, and let the chart teach you where the trade lives.
First resistance sits at $83.5k. That's your first test. If we clear it with volume and hold above on a retest, the setup stays valid.
Next target: $102k, previous resistance zone. This is where you watch for supply to show up. If we push through clean, momentum confirms.
Then $122k — prior highs. This is the big test. Break and hold here, and you're in price discovery mode.
Full extension on the 2.618 Fibonacci lands at $155k. That's the golden ratio target if this runs uninterrupted.
Invalidation? Lose the pennant structure and fail to reclaim $83.5k. That flips the bias and you reassess.
This is textbook breakout structure. Watch the levels, respect the invalidation, and let the chart teach you where the trade lives.
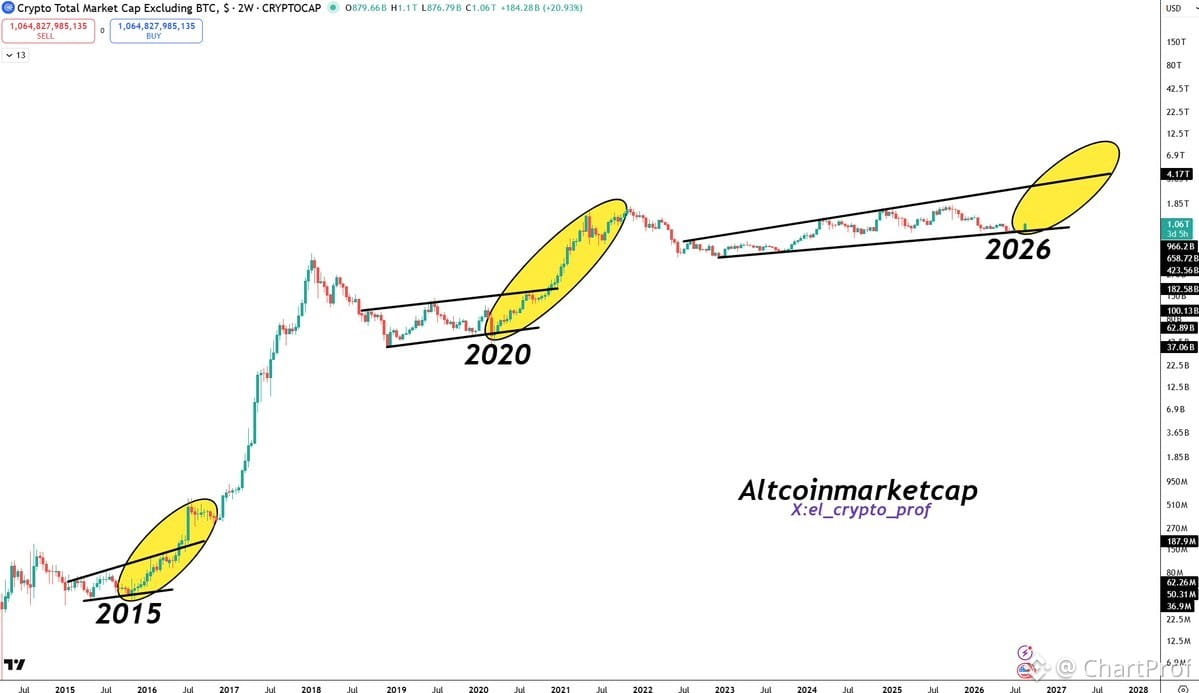
Looking at TOTAL2 right now — this is your textbook higher low into breakout structure.
What you're seeing: Altcoin market cap held support, reclaimed the prior range high, and is now pushing into expansion. That's not noise — that's a structural shift.
Here's the lesson: When TOTAL2 breaks above resistance after a clean consolidation, you're watching capital rotate from $BTC dominance into alts. This is how alt seasons start — not with hype, but with structure confirming the move.
What confirms this holds? TOTAL2 needs to stay above this breakout zone on any retests. If it reclaims and flips resistance to support, you've got your confirmation that altcoin momentum is real.
Invalidation is simple: Lose the breakout level, fall back into the range, and this setup is dead.
Right now? The chart is teaching you that altcoins are in early expansion. Watch how they hold structure from here — that tells you if this runs or fades.
What you're seeing: Altcoin market cap held support, reclaimed the prior range high, and is now pushing into expansion. That's not noise — that's a structural shift.
Here's the lesson: When TOTAL2 breaks above resistance after a clean consolidation, you're watching capital rotate from $BTC dominance into alts. This is how alt seasons start — not with hype, but with structure confirming the move.
What confirms this holds? TOTAL2 needs to stay above this breakout zone on any retests. If it reclaims and flips resistance to support, you've got your confirmation that altcoin momentum is real.
Invalidation is simple: Lose the breakout level, fall back into the range, and this setup is dead.
Right now? The chart is teaching you that altcoins are in early expansion. Watch how they hold structure from here — that tells you if this runs or fades.
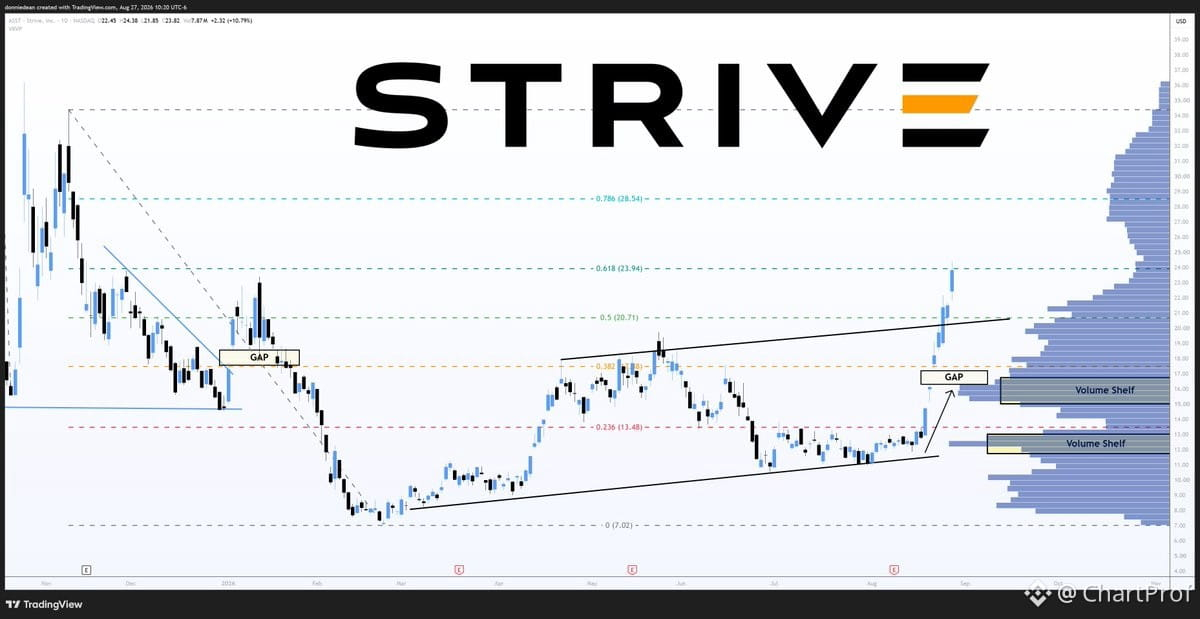
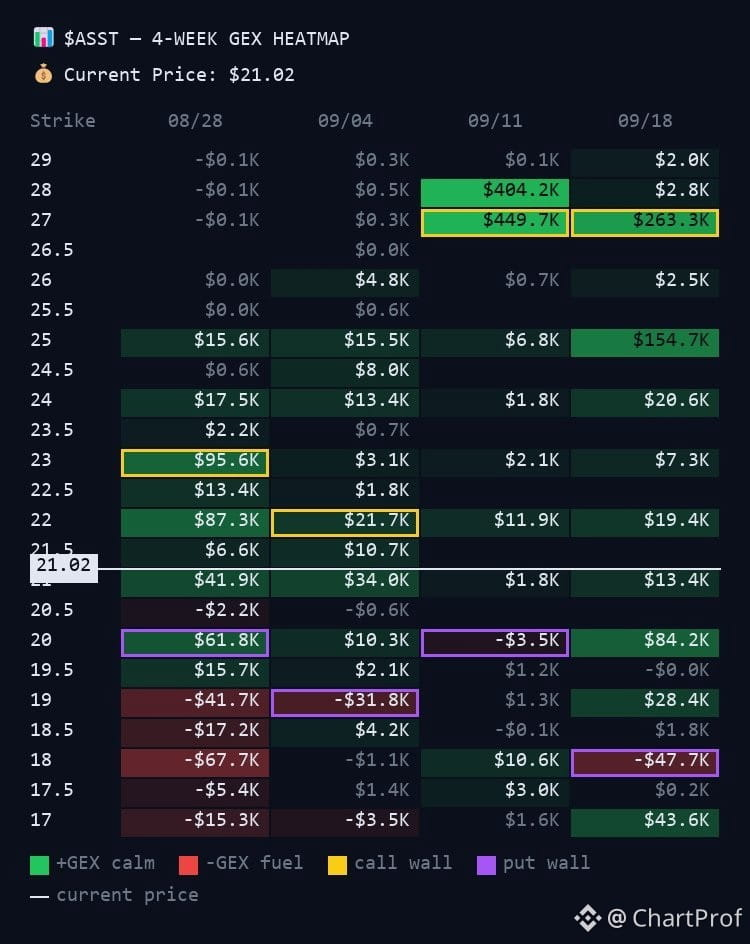
$ASST hitting the 618 Fibonacci at $23.94 — clean resistance showing up right where it should. Up 84% in 7 sessions, so a breather here isn't just likely, it's textbook. When something runs that hard that fast, structure matters more than momentum.
Here's what's stacking up: the 618 fib and the gamma wall both sit at $23. Two technical levels converging at the same price — that's why it stalled. It's not random. When structure aligns like this, you get friction. Price needs time to digest before the next leg.
The setup from here: a pullback toward $20 makes sense as a retest of prior breakout structure. That's where this move started gaining conviction, so it's the logical place to find support if we're going to see continuation.
Next target: $27, but not until September 11th based on the gamma expiration calendar. That's when the next wall clears. Until then, expect chop or consolidation between $20 and $23.
Invalidation: if $ASST breaks and holds above $24 before digesting, the gamma read was off and momentum is overriding structure. But right now, the chart is telling you to wait for the retest before re-entering.
This is how you read confluence — fib levels, gamma exposure, and price action all speaking the same language. When they stack, listen.
Here's what's stacking up: the 618 fib and the gamma wall both sit at $23. Two technical levels converging at the same price — that's why it stalled. It's not random. When structure aligns like this, you get friction. Price needs time to digest before the next leg.
The setup from here: a pullback toward $20 makes sense as a retest of prior breakout structure. That's where this move started gaining conviction, so it's the logical place to find support if we're going to see continuation.
Next target: $27, but not until September 11th based on the gamma expiration calendar. That's when the next wall clears. Until then, expect chop or consolidation between $20 and $23.
Invalidation: if $ASST breaks and holds above $24 before digesting, the gamma read was off and momentum is overriding structure. But right now, the chart is telling you to wait for the retest before re-entering.
This is how you read confluence — fib levels, gamma exposure, and price action all speaking the same language. When they stack, listen.
If you're not bidding this chart, I don't know what to tell you.
Pressure is building here — classic coil. When you see compression like this, you're looking at stored energy. The longer it holds, the bigger the release.
Anytime now, we could see a God candle straight to $100M. Watch for the breakout above resistance. If it holds structure and volume confirms, that's your entry. Invalidation is a breakdown below the coil low.
This is textbook accumulation before expansion. Don't sleep on it.
Pressure is building here — classic coil. When you see compression like this, you're looking at stored energy. The longer it holds, the bigger the release.
Anytime now, we could see a God candle straight to $100M. Watch for the breakout above resistance. If it holds structure and volume confirms, that's your entry. Invalidation is a breakdown below the coil low.
This is textbook accumulation before expansion. Don't sleep on it.
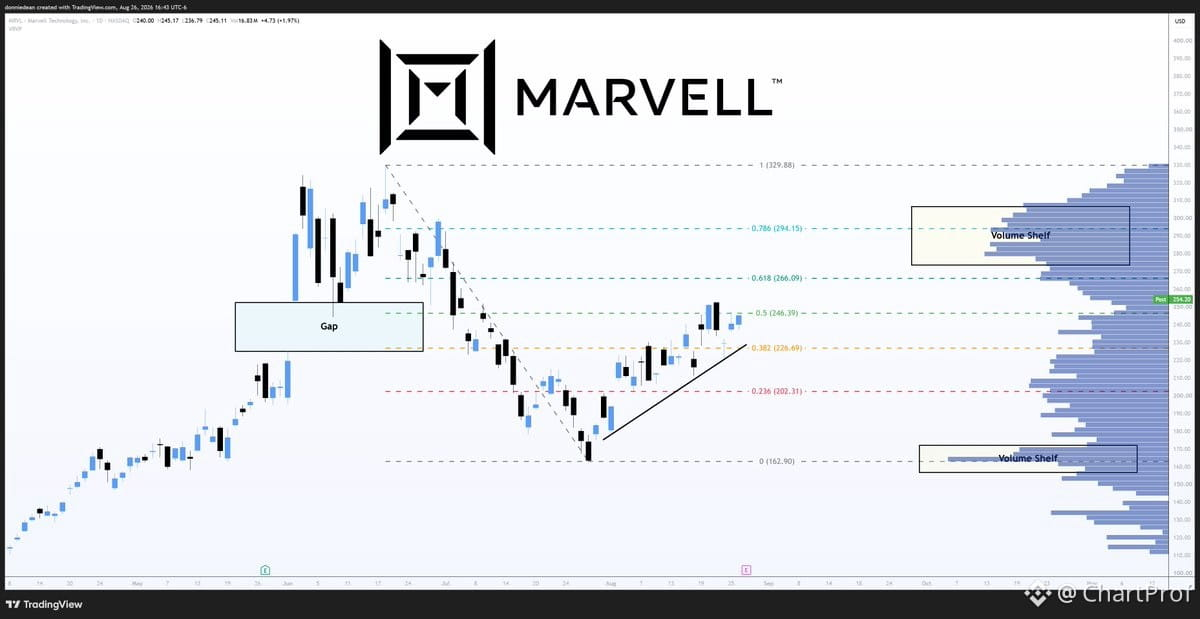
$MRVL sitting on a clean uptrend since late July — higher lows, +50% run, and now testing resistance at $246. Let's break down the structure.
The chart's telling a simple story: momentum's been building for months, and the price keeps finding buyers at higher levels. That's your textbook definition of strength. When you see higher lows stacking up like this, you're watching demand step in earlier and earlier — classic accumulation.
Here's the setup:
Resistance is right here at $246. That's your line in the sand for the next leg. If price clears it with volume, the next magnet is $294 — a volume shelf where prior consolidation happened, plus a Fibonacci extension level. That's where sellers showed up before, so expect some friction there.
Support sits near $226, right at the trendline that's been holding since July. That's your invalidation level. If it breaks below and holds under, the structure flips — you'd want to reassess.
Earnings hit after the bell on 8/27. That's your catalyst. Price action into earnings matters — if it holds the trendline and coils under $246, you've got a spring-loaded setup. If it breaks resistance before the print, momentum could carry it straight to $294.
Watch how it behaves at $246. Does it chop and build a base, or does it punch through with conviction? That'll tell you everything. Clean structure, clear levels, and a catalyst ahead — this is how you read a chart.
The chart's telling a simple story: momentum's been building for months, and the price keeps finding buyers at higher levels. That's your textbook definition of strength. When you see higher lows stacking up like this, you're watching demand step in earlier and earlier — classic accumulation.
Here's the setup:
Resistance is right here at $246. That's your line in the sand for the next leg. If price clears it with volume, the next magnet is $294 — a volume shelf where prior consolidation happened, plus a Fibonacci extension level. That's where sellers showed up before, so expect some friction there.
Support sits near $226, right at the trendline that's been holding since July. That's your invalidation level. If it breaks below and holds under, the structure flips — you'd want to reassess.
Earnings hit after the bell on 8/27. That's your catalyst. Price action into earnings matters — if it holds the trendline and coils under $246, you've got a spring-loaded setup. If it breaks resistance before the print, momentum could carry it straight to $294.
Watch how it behaves at $246. Does it chop and build a base, or does it punch through with conviction? That'll tell you everything. Clean structure, clear levels, and a catalyst ahead — this is how you read a chart.
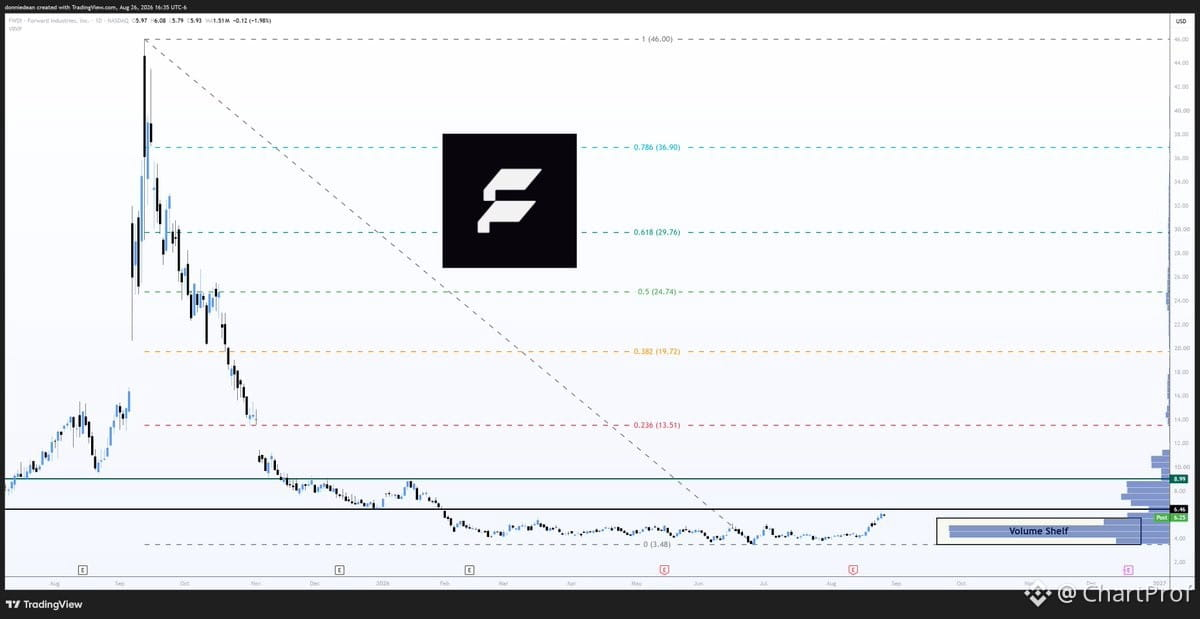
$FWDI — Forward Industries
Clean basing structure after an 87% drawdown. Peaked at $46 last September, bottomed at $3.48 in June. Six months of floor-building since.
Current price: $5.93. Holding above the $4 shelf where it consolidated all spring. Now grinding toward $6.46 — the resistance cap that's been in play since February.
Above $6.46: next structure is $8.99, then open air to the first fib level at $13.51.
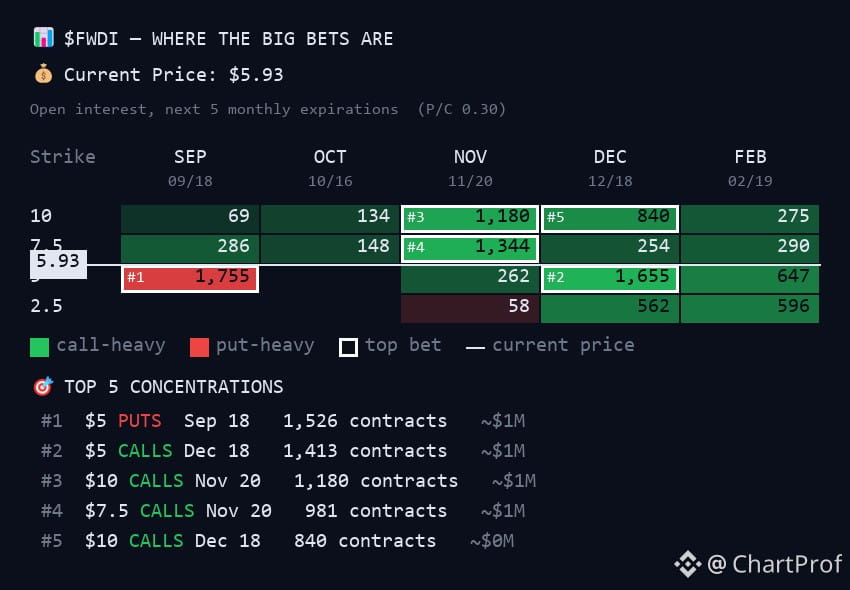
Option flow is thin, but the positioning tells a story — nearly every large position is a call, sitting at $7.50 and $10 strikes. That's not random.
The setup: reclaim $6.46 with conviction, and there's minimal resistance overhead. The floor is built. The structure is clean. The next leg depends on whether it can break and hold above that $6.46 line.
Invalidation: break back below $4 and the base is compromised. Until then, this is a textbook reaccumulation pattern with clear levels to trade around.
Clean basing structure after an 87% drawdown. Peaked at $46 last September, bottomed at $3.48 in June. Six months of floor-building since.
Current price: $5.93. Holding above the $4 shelf where it consolidated all spring. Now grinding toward $6.46 — the resistance cap that's been in play since February.
Above $6.46: next structure is $8.99, then open air to the first fib level at $13.51.
Option flow is thin, but the positioning tells a story — nearly every large position is a call, sitting at $7.50 and $10 strikes. That's not random.
The setup: reclaim $6.46 with conviction, and there's minimal resistance overhead. The floor is built. The structure is clean. The next leg depends on whether it can break and hold above that $6.46 line.
Invalidation: break back below $4 and the base is compromised. Until then, this is a textbook reaccumulation pattern with clear levels to trade around.
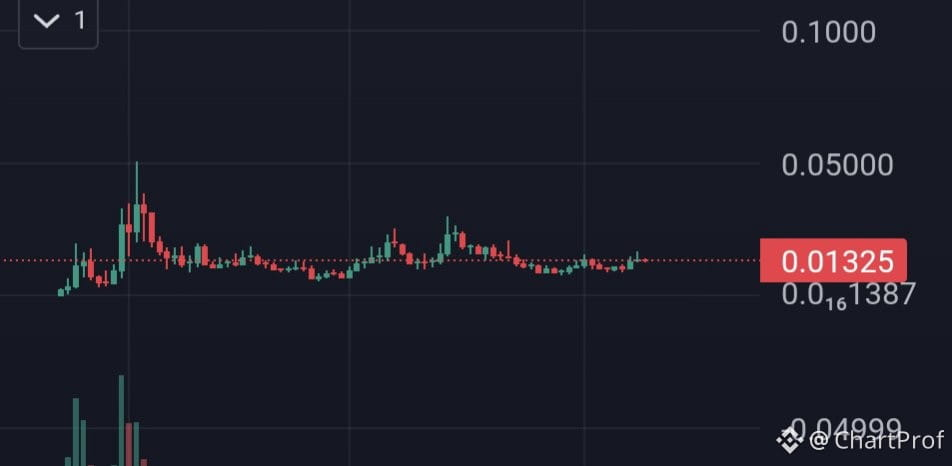
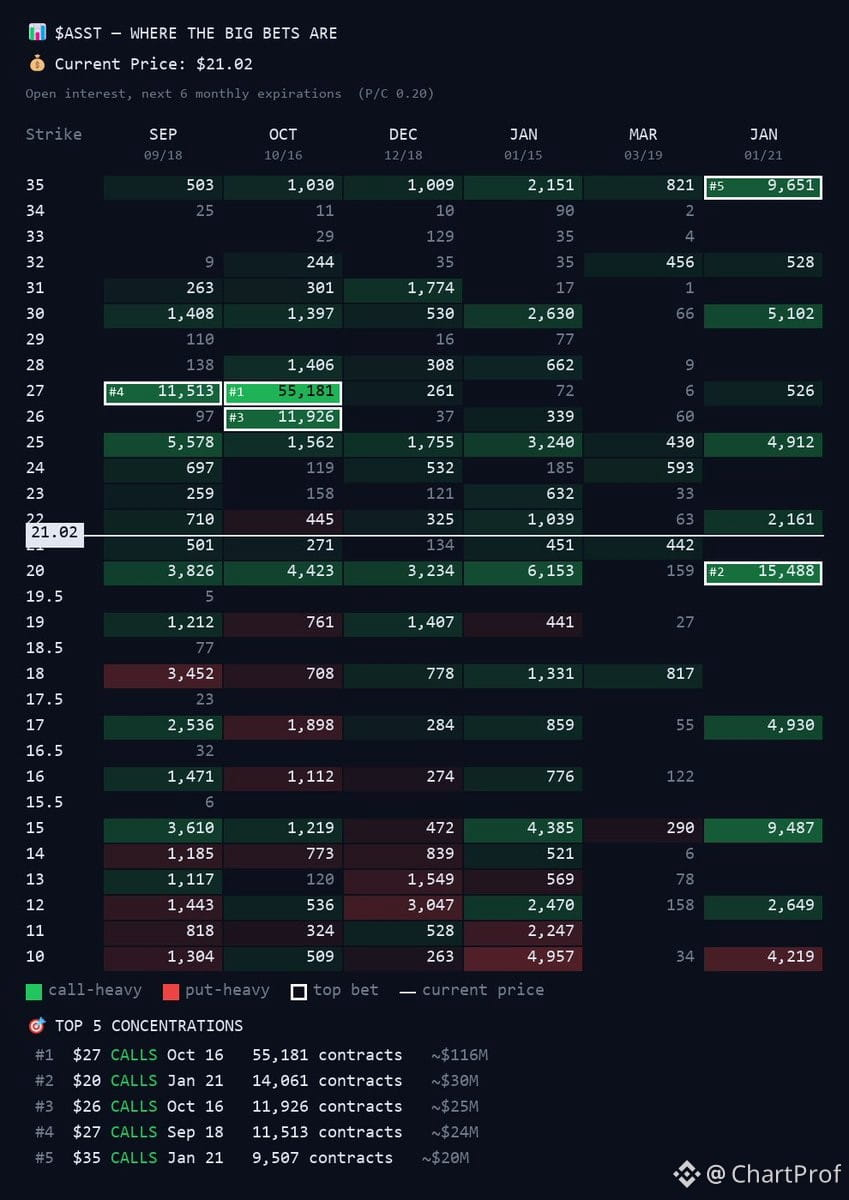
Big positioning update on $ASST — let's read what the options book is telling us.
The structure is clear: heavy call skew, and the flow keeps piling into the same strikes even as price rallies. That's not random. That's conviction.
$27 calls for October are sitting at $116M in open interest — and that number grew since Monday. That's your magnet. When a strike gets that loaded and keeps growing as price moves toward it, it acts like a ceiling until it breaks or expires. Right now, $27 is the line price keeps climbing into by mid-September.
Second heaviest position: $20 calls for Jan '27 at $30M. Price is already at that level, so those are in the money and acting as a floor. As long as $20 holds, the structure stays intact and the ladder keeps working.
Then you've got $26 calls for October at $25M, $27 calls for September at $24M, and $35 calls for Jan '27 at $20M. The $35s are the optimistic tail, but the real action is clustered between $20 and $27.
Here's the key detail: 5 calls for every 1 put. The book got more lopsided as price rose. That's not distribution — that's accumulation and conviction that this move has legs.
So what does this mean for structure?
$20 is your anchor. If that breaks, the whole setup unwinds. But as long as it holds, you've got a clear ladder: $20 base, $26–$27 resistance zone, and $35 as the extended target if this thing really runs.
$27 shows up twice in the heaviest strikes — October and September. That's your ceiling until it's not. Watch how price behaves as it tests that level. If it breaks and holds above, the next leg opens up toward $35.
Bottom line: Hold $20, respect $27 as the current magnet, and watch for a break above to unlock the next zone. The options flow is telling you where the big money is positioned — now you just trade the structure around it. 🔥
The structure is clear: heavy call skew, and the flow keeps piling into the same strikes even as price rallies. That's not random. That's conviction.
$27 calls for October are sitting at $116M in open interest — and that number grew since Monday. That's your magnet. When a strike gets that loaded and keeps growing as price moves toward it, it acts like a ceiling until it breaks or expires. Right now, $27 is the line price keeps climbing into by mid-September.
Second heaviest position: $20 calls for Jan '27 at $30M. Price is already at that level, so those are in the money and acting as a floor. As long as $20 holds, the structure stays intact and the ladder keeps working.
Then you've got $26 calls for October at $25M, $27 calls for September at $24M, and $35 calls for Jan '27 at $20M. The $35s are the optimistic tail, but the real action is clustered between $20 and $27.
Here's the key detail: 5 calls for every 1 put. The book got more lopsided as price rose. That's not distribution — that's accumulation and conviction that this move has legs.
So what does this mean for structure?
$20 is your anchor. If that breaks, the whole setup unwinds. But as long as it holds, you've got a clear ladder: $20 base, $26–$27 resistance zone, and $35 as the extended target if this thing really runs.
$27 shows up twice in the heaviest strikes — October and September. That's your ceiling until it's not. Watch how price behaves as it tests that level. If it breaks and holds above, the next leg opens up toward $35.
Bottom line: Hold $20, respect $27 as the current magnet, and watch for a break above to unlock the next zone. The options flow is telling you where the big money is positioned — now you just trade the structure around it. 🔥
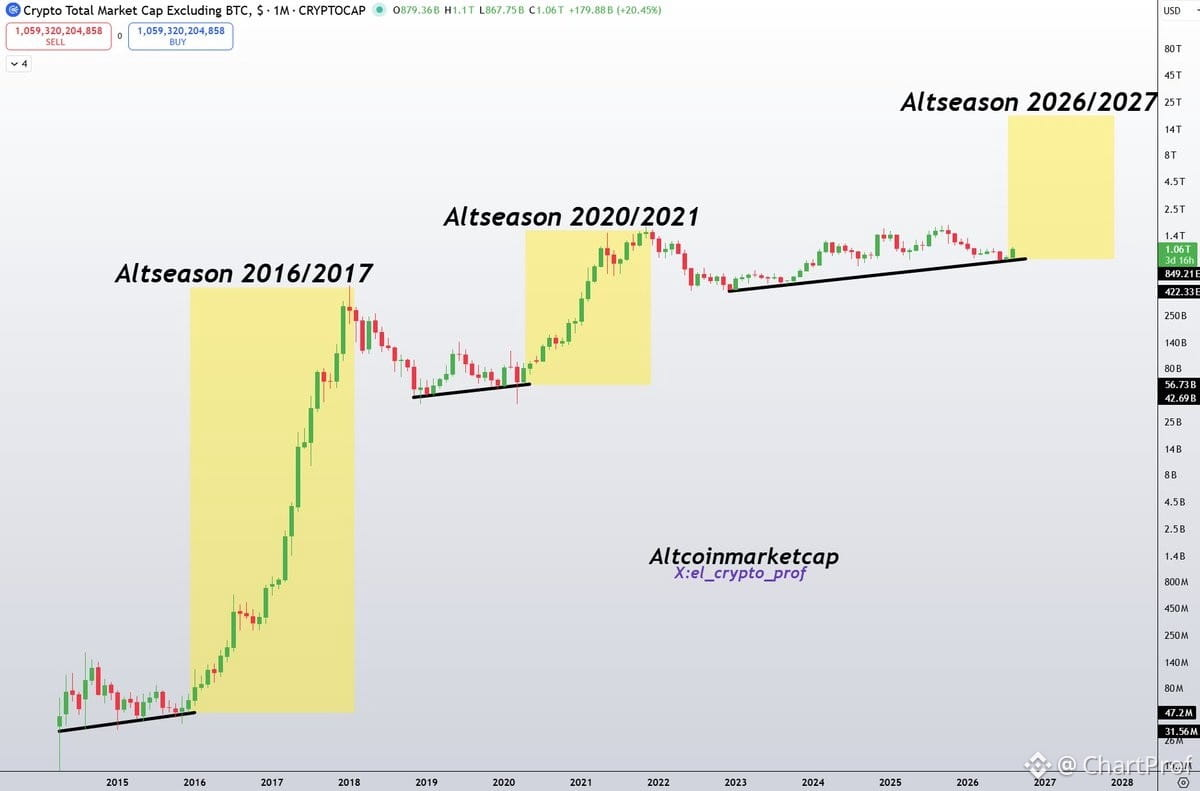
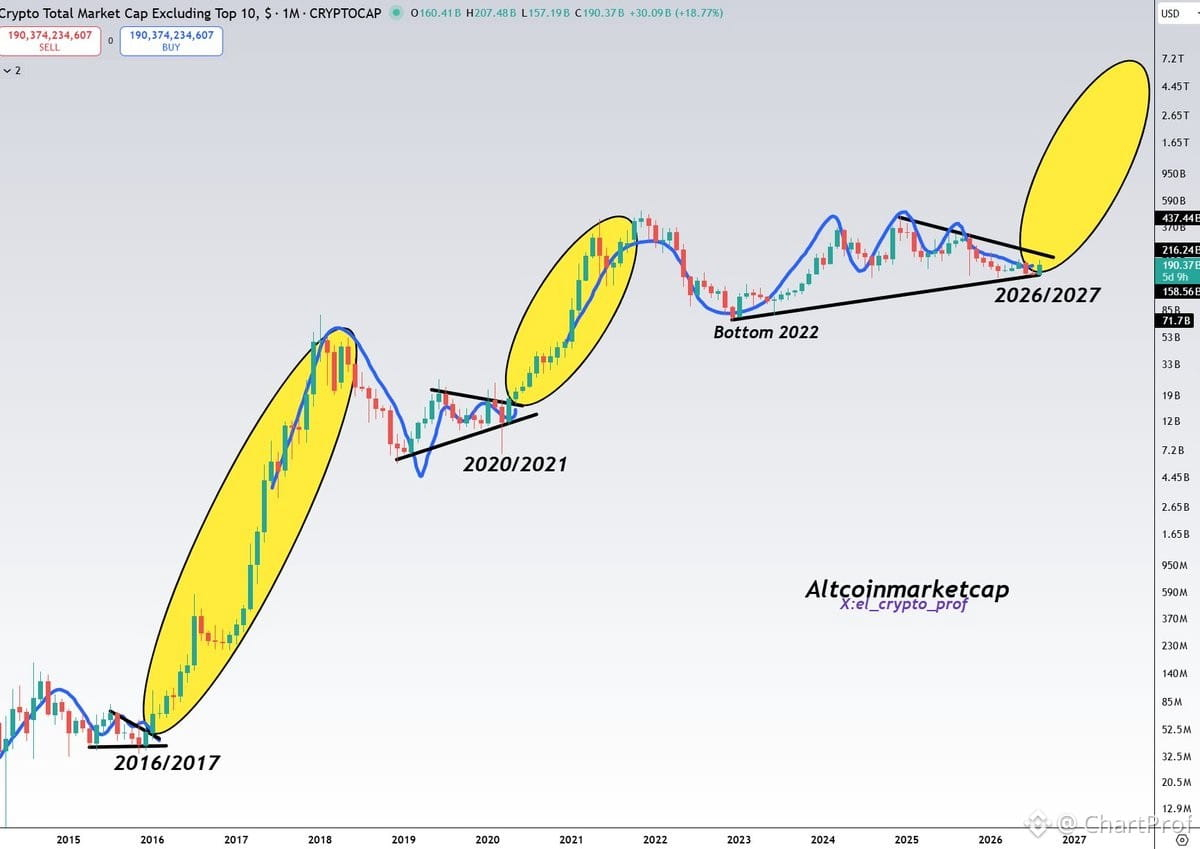
Alright, let's talk structure on OTHERS (altcoin market cap).
The chart's telling a clean story here — we're still early in the expansion phase. Look at the macro setup: we broke out of a multi-year base, retested structure, and now we're coiling for the next leg. This isn't hope — it's pattern recognition.
What confirms continuation? Weekly closes above support, volume profile showing accumulation, and BTC dominance rolling over. That's your textbook altseason setup.
Key levels to watch: If OTHERS holds current support and reclaims the mid-range, we're targeting the upper structure from the last cycle. Invalidation? A weekly close back inside the base — that flips the narrative.
The lesson: Don't chase the rip. Wait for the retest, confirm the hold, then size accordingly. Structure over speculation. The best setups reward patience, and this one's still building.
The chart's telling a clean story here — we're still early in the expansion phase. Look at the macro setup: we broke out of a multi-year base, retested structure, and now we're coiling for the next leg. This isn't hope — it's pattern recognition.
What confirms continuation? Weekly closes above support, volume profile showing accumulation, and BTC dominance rolling over. That's your textbook altseason setup.
Key levels to watch: If OTHERS holds current support and reclaims the mid-range, we're targeting the upper structure from the last cycle. Invalidation? A weekly close back inside the base — that flips the narrative.
The lesson: Don't chase the rip. Wait for the retest, confirm the hold, then size accordingly. Structure over speculation. The best setups reward patience, and this one's still building.
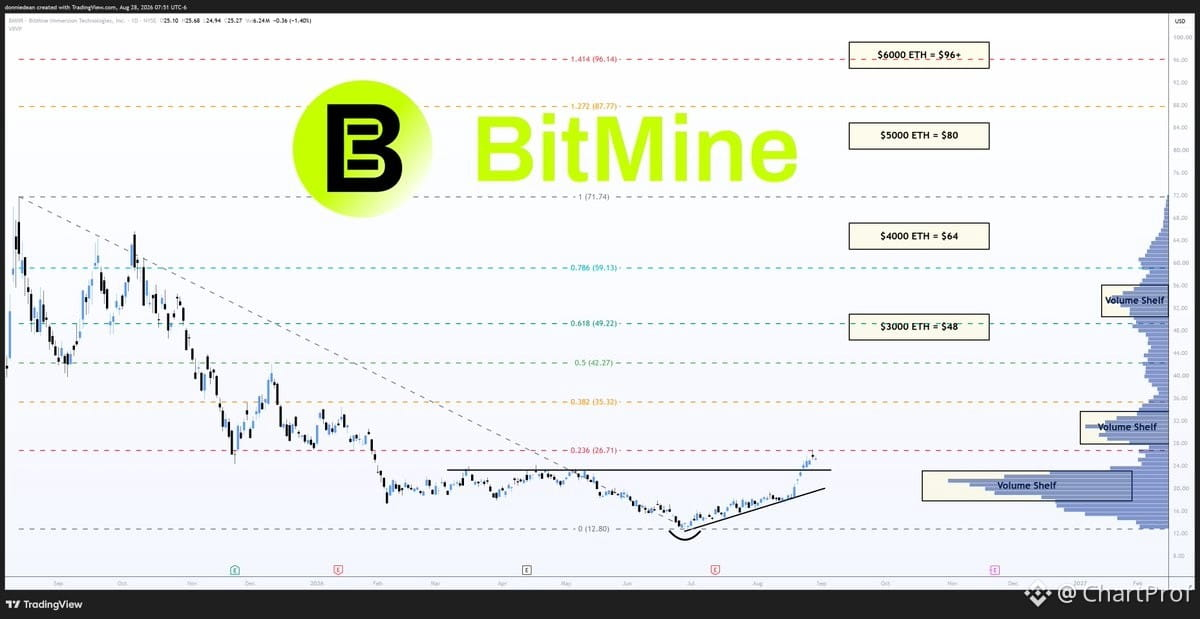
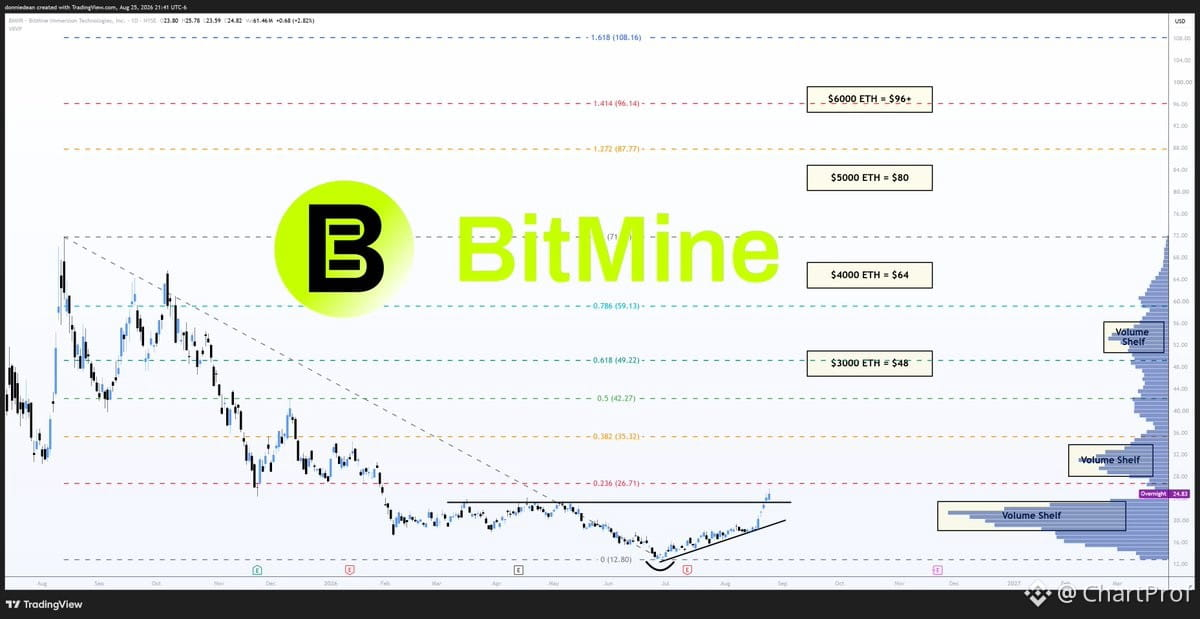
$BMNR BitMine Immersion — Clean Breakout Above $23 Lid
Four days ago, this was capped under $23. Now trading $24.82 on 61M volume — above the range it spent all summer grinding inside.
The Structure:
Rounded bottom off $12.80 continues to build. Old resistance at $23 now becomes support — that's your new floor to hold.
Levels Ahead:
Next fib target sits at $26.71. Above that, thin air to $35.
What This Teaches:
Breakouts mean nothing until old resistance holds as support. Watch how $BMNR respects $23 on any pullback — that's your confirmation the structure is real. If it reclaims and holds, the path opens. If it fails back under, the breakout was false.
Setup is clean. Structure is textbook. Now we watch the retest.
Four days ago, this was capped under $23. Now trading $24.82 on 61M volume — above the range it spent all summer grinding inside.
The Structure:
Rounded bottom off $12.80 continues to build. Old resistance at $23 now becomes support — that's your new floor to hold.
Levels Ahead:
Next fib target sits at $26.71. Above that, thin air to $35.
What This Teaches:
Breakouts mean nothing until old resistance holds as support. Watch how $BMNR respects $23 on any pullback — that's your confirmation the structure is real. If it reclaims and holds, the path opens. If it fails back under, the breakout was false.
Setup is clean. Structure is textbook. Now we watch the retest.
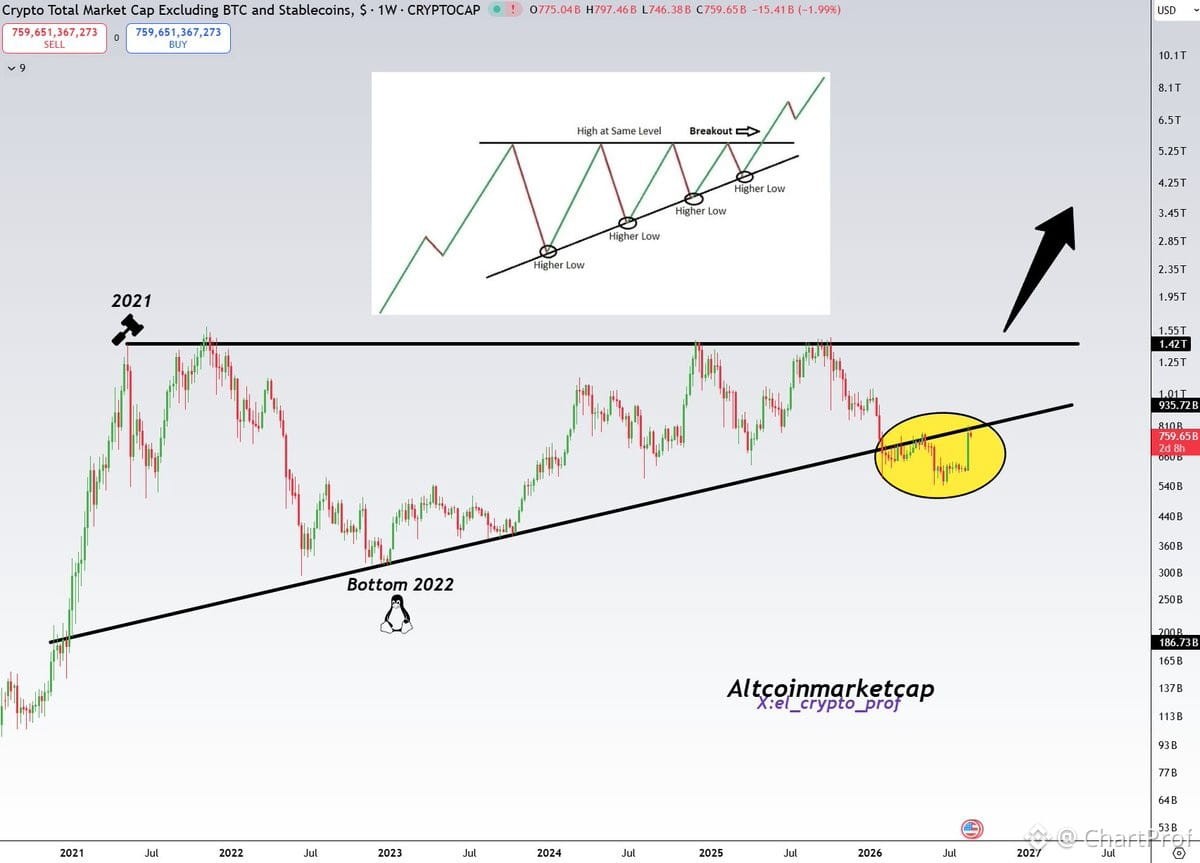
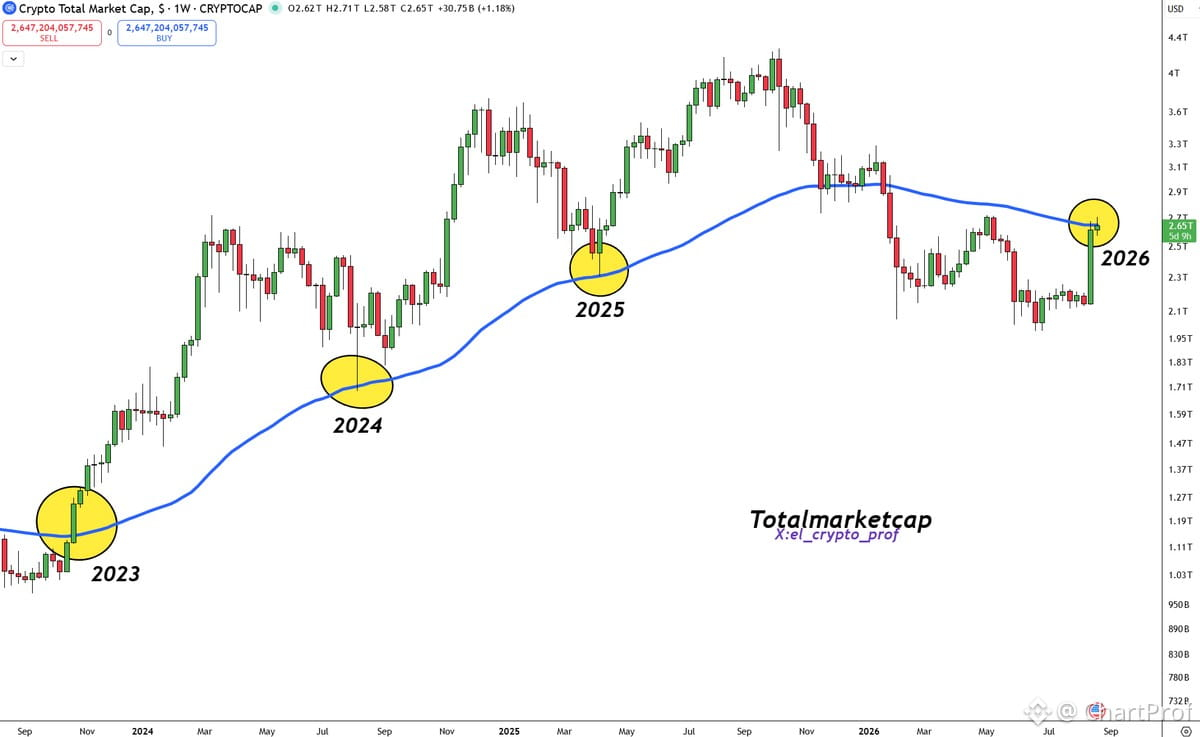
Total altcoin market cap sitting right at the bull/bear line.
This is the structural divide — above it, we're in expansion mode. Below it, we're in distribution.
Right now? We're testing the hinge. Not through it yet, but pressure's building.
Watch this level. It's not hype — it's the cleanest read on whether alts have legs or we're still chopping in range.
Break and hold above = confirmation. Reject here = more time in the chop.
Chart's teaching the setup. Now we wait for the move.
This is the structural divide — above it, we're in expansion mode. Below it, we're in distribution.
Right now? We're testing the hinge. Not through it yet, but pressure's building.
Watch this level. It's not hype — it's the cleanest read on whether alts have legs or we're still chopping in range.
Break and hold above = confirmation. Reject here = more time in the chop.
Chart's teaching the setup. Now we wait for the move.
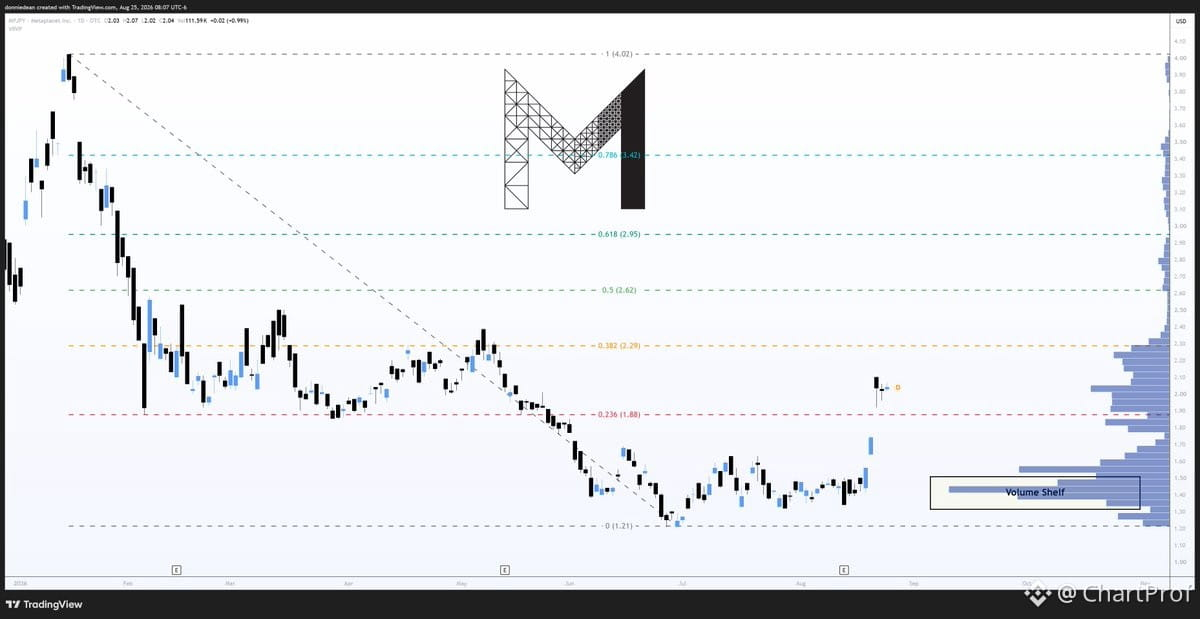
$MPJPY $MTPLF Metaplanet just broke above $2 on solid volume — that's your launch pad.
Here's the structure:
Immediate support sits at $1.88. That's your first line of defense if price pulls back. If it holds there, you're still in the game.
Resistance overhead is $2.29. That's the ceiling right now. If price clears $2.29 with conviction, you're looking at the 50% retrace level at $2.62 as your next magnet.
The setup is clean: $1.88 support, $2.29 resistance, $2.62 target if you break out.
Invalidation? Below $1.88, the structure weakens and you'd want to reassess.
This is a volume-driven breakout off a defined shelf. Watch how it behaves at $2.29 — that's where the real move gets confirmed or rejected.
Here's the structure:
Immediate support sits at $1.88. That's your first line of defense if price pulls back. If it holds there, you're still in the game.
Resistance overhead is $2.29. That's the ceiling right now. If price clears $2.29 with conviction, you're looking at the 50% retrace level at $2.62 as your next magnet.
The setup is clean: $1.88 support, $2.29 resistance, $2.62 target if you break out.
Invalidation? Below $1.88, the structure weakens and you'd want to reassess.
This is a volume-driven breakout off a defined shelf. Watch how it behaves at $2.29 — that's where the real move gets confirmed or rejected.
Verified
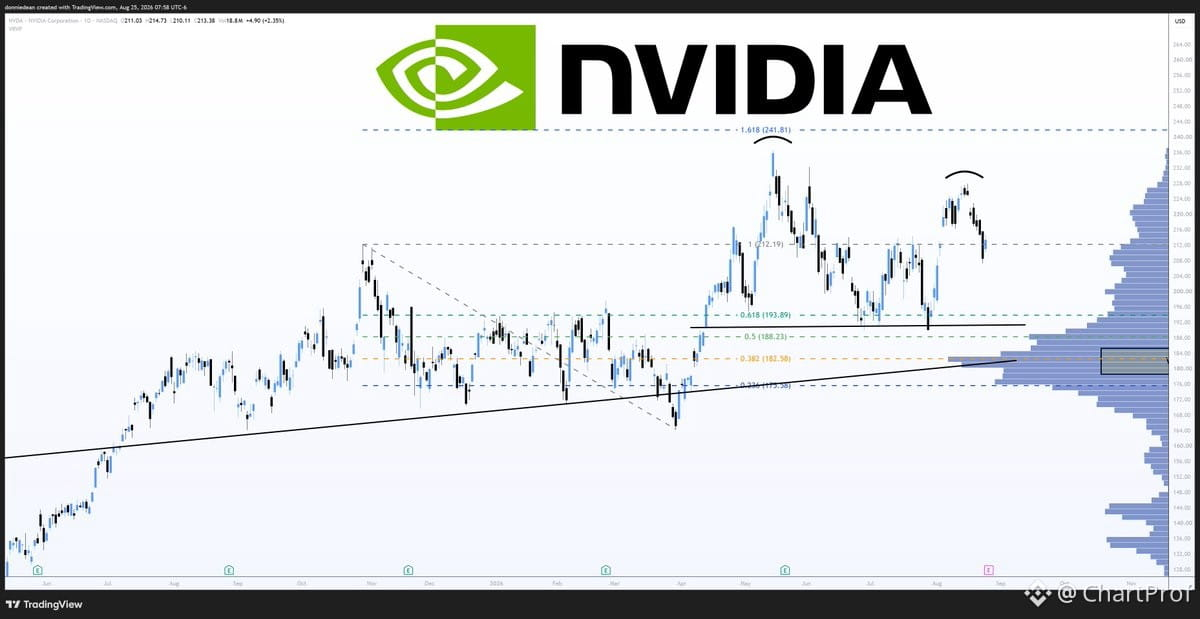
$NVDA sitting right on that $212 support level today, up 2.3%. Clean bounce so far.
Earnings drop 8/26 after the close. This is your setup into the event — if $212 holds through this week, you're watching for continuation into earnings. If it cracks and closes below, that's your invalidation and you step aside.
Support is only support until it's not. Price action into earnings matters more than the number itself. Watch how it respects this level over the next few sessions — that tells you if the structure is real or just a temporary pause before lower.
Hold above $212 = bullish structure into the print. Break and close below = wait for a cleaner setup post-earnings.
Earnings drop 8/26 after the close. This is your setup into the event — if $212 holds through this week, you're watching for continuation into earnings. If it cracks and closes below, that's your invalidation and you step aside.
Support is only support until it's not. Price action into earnings matters more than the number itself. Watch how it respects this level over the next few sessions — that tells you if the structure is real or just a temporary pause before lower.
Hold above $212 = bullish structure into the print. Break and close below = wait for a cleaner setup post-earnings.
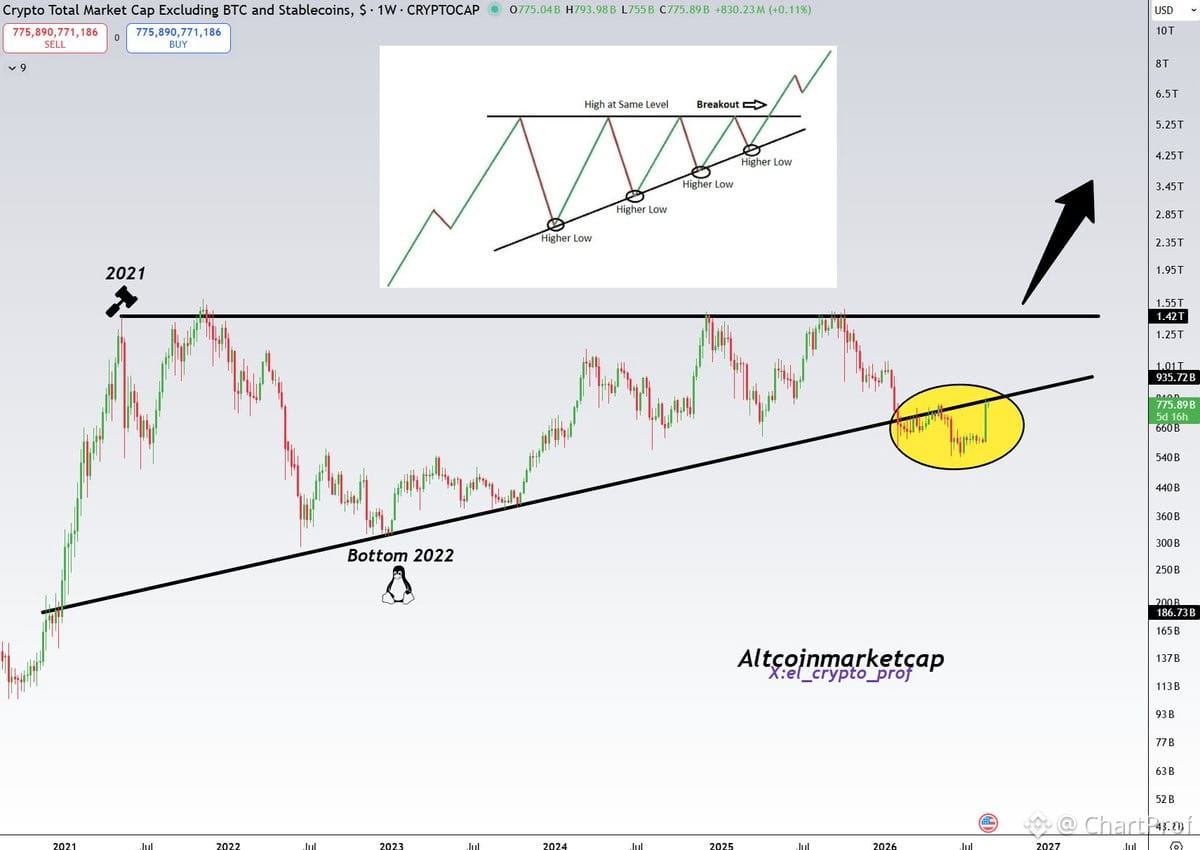
Altcoins sitting right at the edge of reclaiming a 6-year bullish triangle. Let me walk you through what that means.
When you get a multi-year pattern like this — we're talking about a massive consolidation zone — the breakout or breakdown carries serious weight. Right now, alts are testing the underside of that structure after what looks like a liquidity sweep below support.
Here's the setup:
If alts reclaim and hold above the triangle trendline, that recent breakdown flips into a fakeout. Classic shakeout move — flush weak hands, reset sentiment, then rip higher. You see this all the time before major rallies. The longer the base, the bigger the potential move.
Confirmation comes from a daily close back inside the triangle, ideally with rising volume and follow-through. You want to see momentum shift — not just a wick back in, but sustained reclaim with structure holding.
Invalidation is simple: failure to reclaim and another leg down breaks the pattern for real. That would mean the triangle resolved bearish and we're in a deeper correction.
Right now, this is a high-conviction zone if the reclaim happens. Multi-year patterns don't play out often, but when they do, they move. Watch for that daily close and how alts behave in the next few sessions. If this confirms, it's not just a bounce — it's the start of a bigger cycle leg.
That's the read. Clean structure, clear levels, and a setup worth watching closely.
When you get a multi-year pattern like this — we're talking about a massive consolidation zone — the breakout or breakdown carries serious weight. Right now, alts are testing the underside of that structure after what looks like a liquidity sweep below support.
Here's the setup:
If alts reclaim and hold above the triangle trendline, that recent breakdown flips into a fakeout. Classic shakeout move — flush weak hands, reset sentiment, then rip higher. You see this all the time before major rallies. The longer the base, the bigger the potential move.
Confirmation comes from a daily close back inside the triangle, ideally with rising volume and follow-through. You want to see momentum shift — not just a wick back in, but sustained reclaim with structure holding.
Invalidation is simple: failure to reclaim and another leg down breaks the pattern for real. That would mean the triangle resolved bearish and we're in a deeper correction.
Right now, this is a high-conviction zone if the reclaim happens. Multi-year patterns don't play out often, but when they do, they move. Watch for that daily close and how alts behave in the next few sessions. If this confirms, it's not just a bounce — it's the start of a bigger cycle leg.
That's the read. Clean structure, clear levels, and a setup worth watching closely.
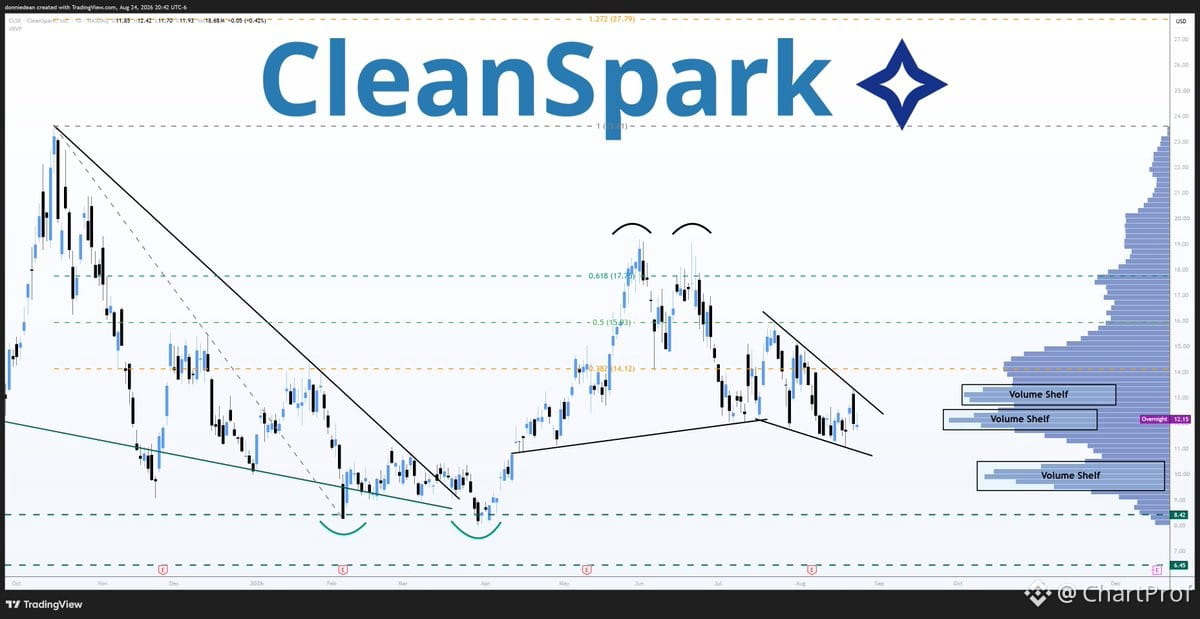
$CLSK wedge consolidation still in play — price grinding toward the $12 volume shelf launch zone.
If it clears that shelf with volume, upper target sits at $15.93 (50% retrace). Support holding at $10.50.
The structure here is simple: wedges compress price until they break. Volume shelves act as launch pads when buyers stack up. Watch $12 — if it breaks clean with volume confirmation, the path to $15.93 opens. Below $10.50, the setup invalidates and you're looking at deeper retest.
Clean levels, clean structure. That's how you trade the compression.
If it clears that shelf with volume, upper target sits at $15.93 (50% retrace). Support holding at $10.50.
The structure here is simple: wedges compress price until they break. Volume shelves act as launch pads when buyers stack up. Watch $12 — if it breaks clean with volume confirmation, the path to $15.93 opens. Below $10.50, the setup invalidates and you're looking at deeper retest.
Clean levels, clean structure. That's how you trade the compression.
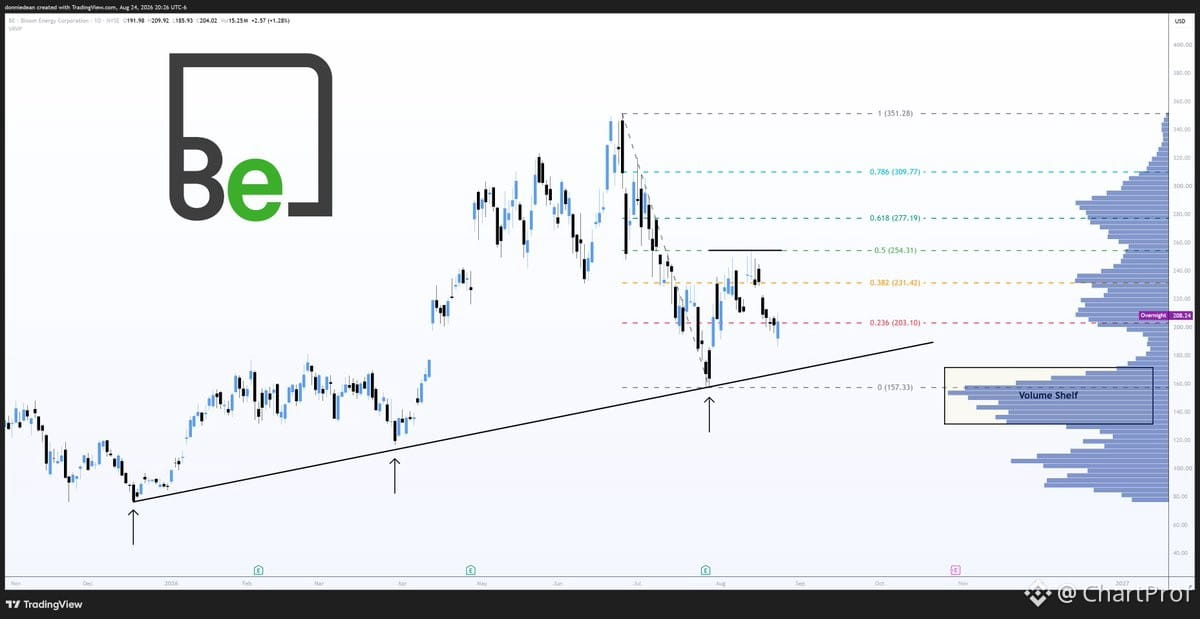
$BE sitting right on first fib support at $203 after closing +1.3% at $204.02.
The rising trendline from December low has held every dip for nine months straight — including that July flush down to $157. That's three clean bounces off structure. When a line holds that many times, it's teaching you where the bid lives.
Here's the map:
Support: $170 at the trendline if this fib level fails. That's your next structural catch.
Resistance: Break above $231 opens the door to $254.
What confirms the setup? Price holding above $203 with volume coming in on the bounce. What invalidates it? A break below $170 — that kills the trendline and flips the structure.
Clean chart. Clear levels. Let the structure do the work.
The rising trendline from December low has held every dip for nine months straight — including that July flush down to $157. That's three clean bounces off structure. When a line holds that many times, it's teaching you where the bid lives.
Here's the map:
Support: $170 at the trendline if this fib level fails. That's your next structural catch.
Resistance: Break above $231 opens the door to $254.
What confirms the setup? Price holding above $203 with volume coming in on the bounce. What invalidates it? A break below $170 — that kills the trendline and flips the structure.
Clean chart. Clear levels. Let the structure do the work.
Log in to explore more content