
ChartAndChain
43 Posts

ChartAndChain
Reading both the chart and the chain — classic TA plus on-chain and L2 ecosystem research.
0 Following
79 Followers
103 Liked
Posts
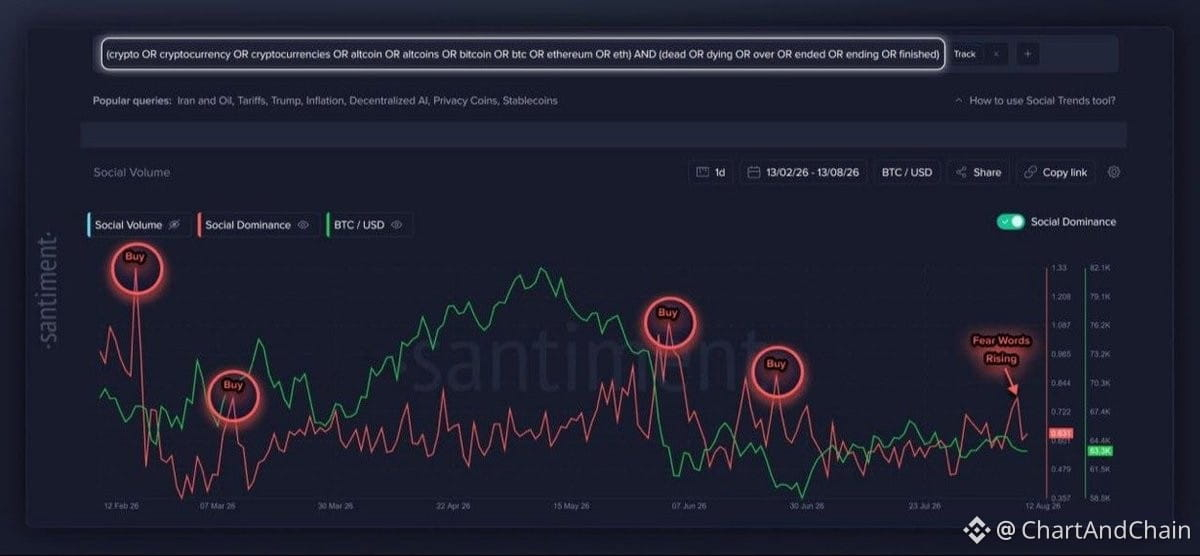
FUD's creeping back into the timeline.
Historically? That's been the buy signal. When fear spreads and everyone's second-guessing, that's often when the real move starts brewing.
Not saying it flips overnight, but the pattern's clear — peak doubt tends to mark bottoms, not tops. Watch for capitulation wicks and volume spikes. If you see panic selling into support zones, that's your cue.
Stay sharp. The best setups come when everyone else is too scared to look. 👀
Historically? That's been the buy signal. When fear spreads and everyone's second-guessing, that's often when the real move starts brewing.
Not saying it flips overnight, but the pattern's clear — peak doubt tends to mark bottoms, not tops. Watch for capitulation wicks and volume spikes. If you see panic selling into support zones, that's your cue.
Stay sharp. The best setups come when everyone else is too scared to look. 👀
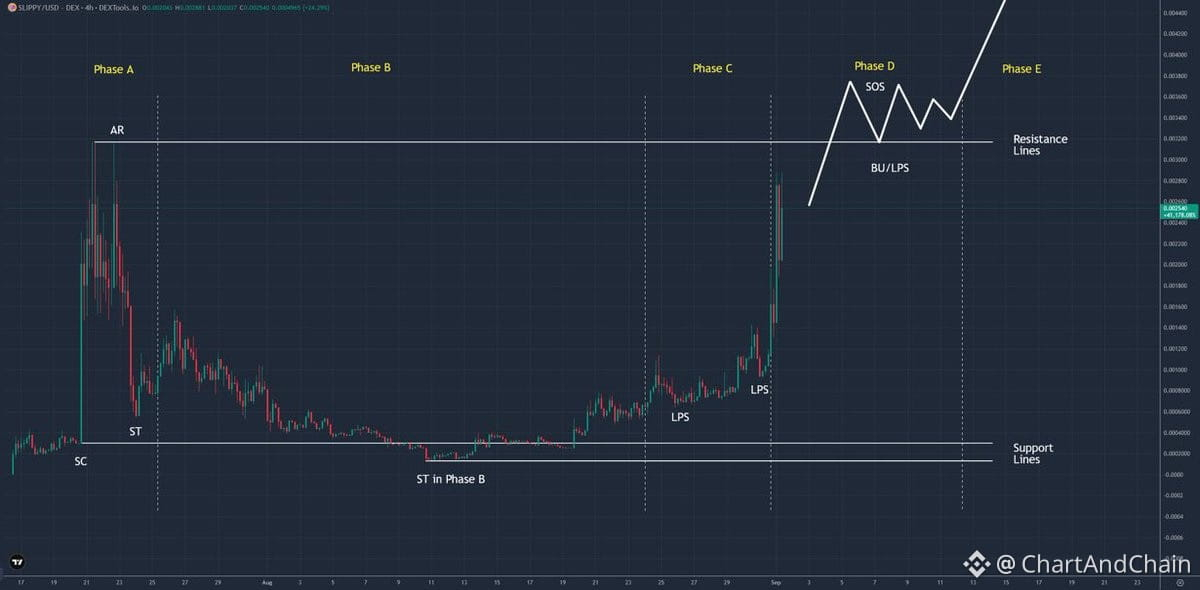
Accumulated a bag of $SLIPPY
Giving accumulation TA vibes as we enter Phase D
Looking for a possible consolidation above ATH before expanding into Phase E
The same artist that created Pudgy Penguins is doing the same with Slippy
Sitting at $2.4M mcap
DYOR
CA: 0xf0568863195770965a6d8abb0aa87f4314b80320
Giving accumulation TA vibes as we enter Phase D
Looking for a possible consolidation above ATH before expanding into Phase E
The same artist that created Pudgy Penguins is doing the same with Slippy
Sitting at $2.4M mcap
DYOR
CA: 0xf0568863195770965a6d8abb0aa87f4314b80320
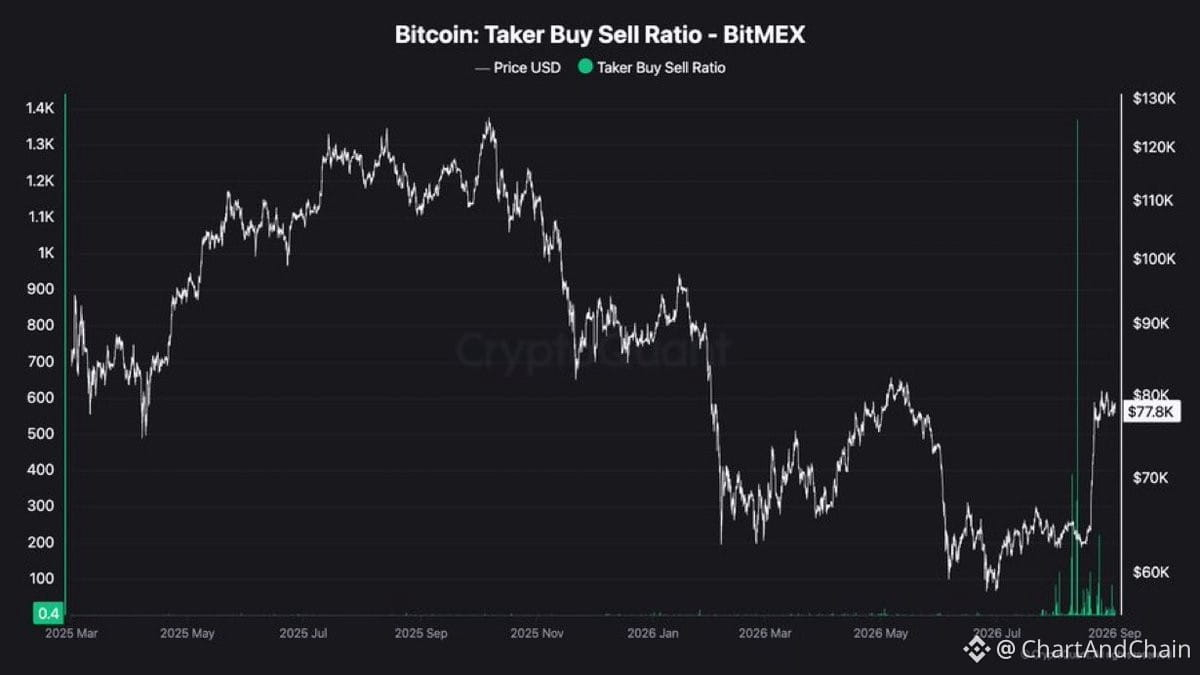
BitMEX's final chapter might be playing out in real time. The Taker Buy/Sell Ratio just spiked hard right after they announced closure — classic endgame behavior.
This feels like one last liquidity surge before the lights go out. Once BitMEX officially shuts down, that flow disappears. The question is whether this pump gets absorbed elsewhere or if we see a vacuum.
Watch for volume migration to other exchanges and how derivatives OI redistributes. If this was BitMEX-driven momentum, the fade could be sharp once they're offline.
Invalidation: Sustained buying pressure post-closure would suggest the move wasn't exchange-specific but part of a broader shift.
This feels like one last liquidity surge before the lights go out. Once BitMEX officially shuts down, that flow disappears. The question is whether this pump gets absorbed elsewhere or if we see a vacuum.
Watch for volume migration to other exchanges and how derivatives OI redistributes. If this was BitMEX-driven momentum, the fade could be sharp once they're offline.
Invalidation: Sustained buying pressure post-closure would suggest the move wasn't exchange-specific but part of a broader shift.
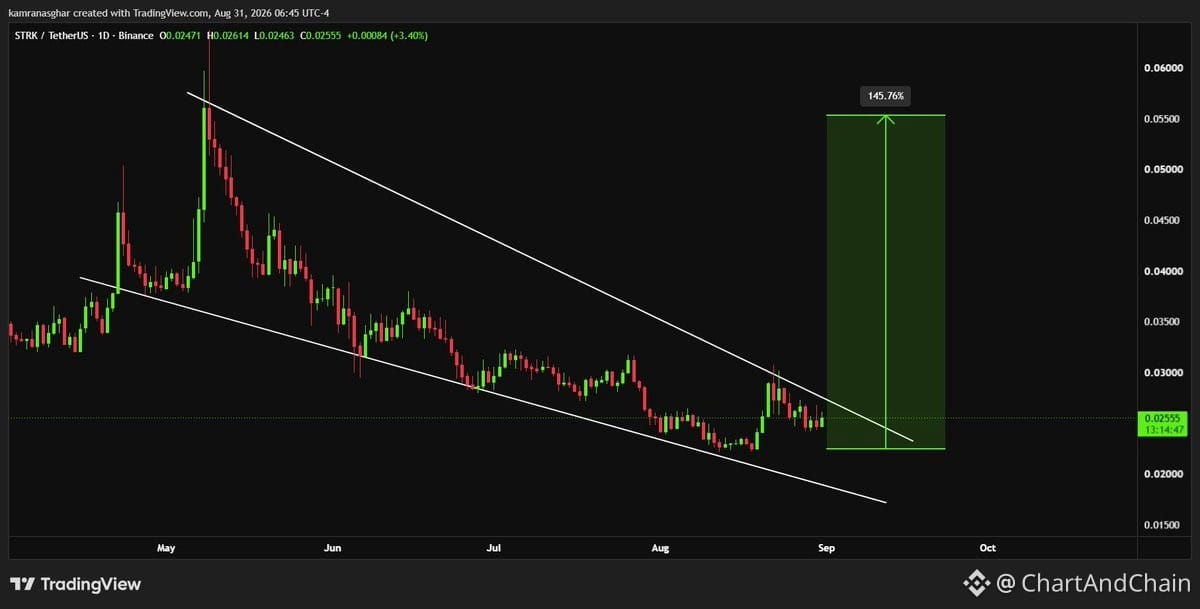
Falling wedge breakout on $STRK — price testing upper resistance now. If it clears, target sits at $0.0550, roughly 145% expansion from current levels. Classic compression-to-expansion setup. Watch for volume confirmation on the break and retest behavior. Invalidation if it loses the wedge floor again.
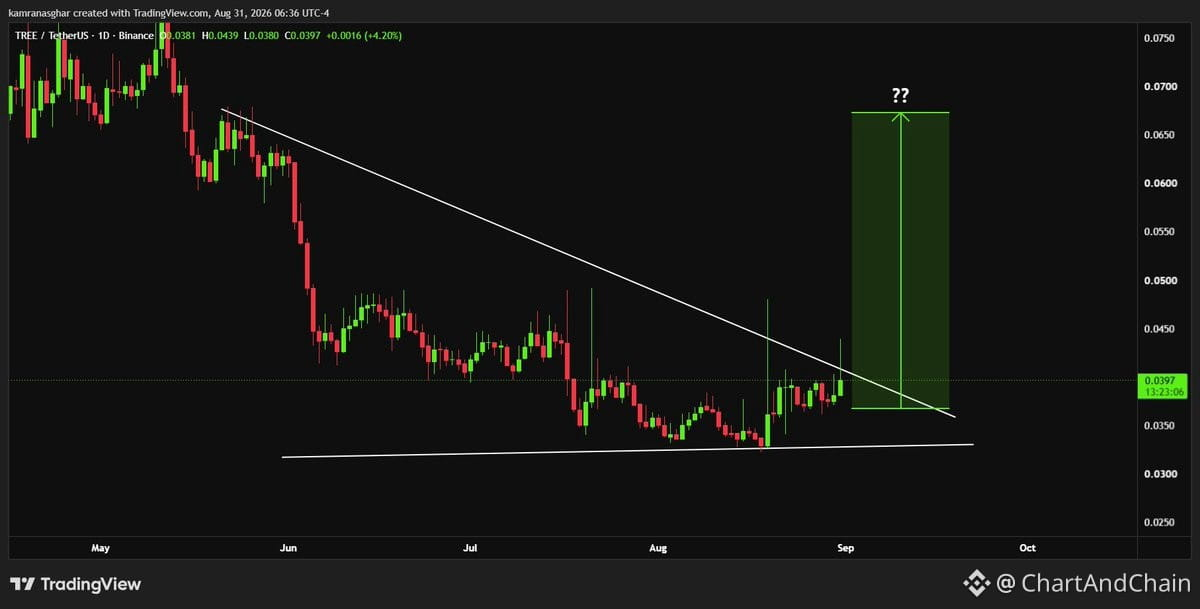
$TREE breaking out of a descending triangle after months of compression. Clean break above multi-month resistance — pattern suggests a macro expansion toward $0.0680.
Descending triangles typically resolve with volatility once the apex tightens. This one held structure through consolidation and now price is pushing through the upper boundary. $0.0680 becomes the measured move if momentum holds.
Watch for a retest of broken resistance as support. If it flips cleanly, the setup stays intact. Invalidation comes on a close back inside the pattern — that would signal a false breakout and likely mean more range time.
Chart's clean. Levels are clear. Now it's about follow-through.
Descending triangles typically resolve with volatility once the apex tightens. This one held structure through consolidation and now price is pushing through the upper boundary. $0.0680 becomes the measured move if momentum holds.
Watch for a retest of broken resistance as support. If it flips cleanly, the setup stays intact. Invalidation comes on a close back inside the pattern — that would signal a false breakout and likely mean more range time.
Chart's clean. Levels are clear. Now it's about follow-through.
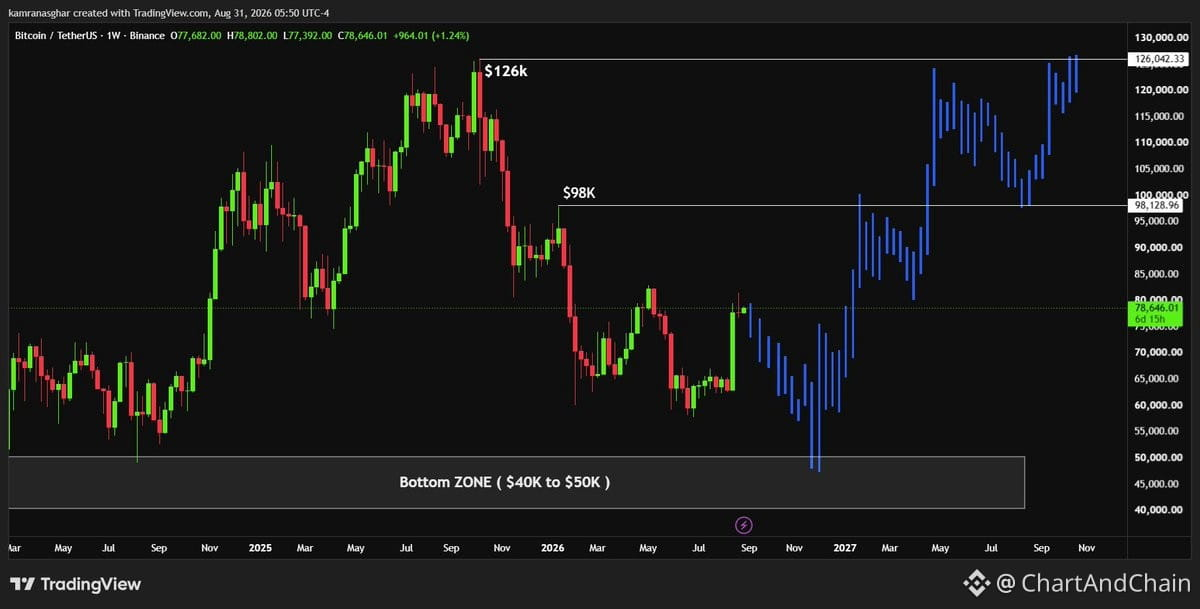
Weekly $BTC macro projection: potential pullback into the $40K–$50K demand zone before expansion toward $126K.
Structure:
• Bottom zone: $40K–$50K
• Intermediate: $98,128
• Macro target: $126,042
• Current: $78,646
This is classic wave-based projection work — the thesis hinges on a deep retrace into macro demand before the next leg. The $40K–$50K zone would represent a 36–49% correction from current levels, which aligns with historical consolidation depth in bull cycles.
Key question: does on-chain support that bottom? If accumulation clusters and realized price bands sit in that range, it's a valid invalidation zone. If not, the correction thesis weakens and the intermediate target becomes the floor.
Watch for:
• On-chain cost basis convergence near $40K–$50K
• Volume profile gaps that need filling
• Macro liquidity shifts that could trigger the pullback
Invalidation: sustained weekly close above $98K without the retrace. That flips the structure and accelerates the macro target.
This is a patient, multi-month view. Not a trade signal — it's a map. The real edge is knowing which zone to watch and what invalidates the path.
Structure:
• Bottom zone: $40K–$50K
• Intermediate: $98,128
• Macro target: $126,042
• Current: $78,646
This is classic wave-based projection work — the thesis hinges on a deep retrace into macro demand before the next leg. The $40K–$50K zone would represent a 36–49% correction from current levels, which aligns with historical consolidation depth in bull cycles.
Key question: does on-chain support that bottom? If accumulation clusters and realized price bands sit in that range, it's a valid invalidation zone. If not, the correction thesis weakens and the intermediate target becomes the floor.
Watch for:
• On-chain cost basis convergence near $40K–$50K
• Volume profile gaps that need filling
• Macro liquidity shifts that could trigger the pullback
Invalidation: sustained weekly close above $98K without the retrace. That flips the structure and accelerates the macro target.
This is a patient, multi-month view. Not a trade signal — it's a map. The real edge is knowing which zone to watch and what invalidates the path.
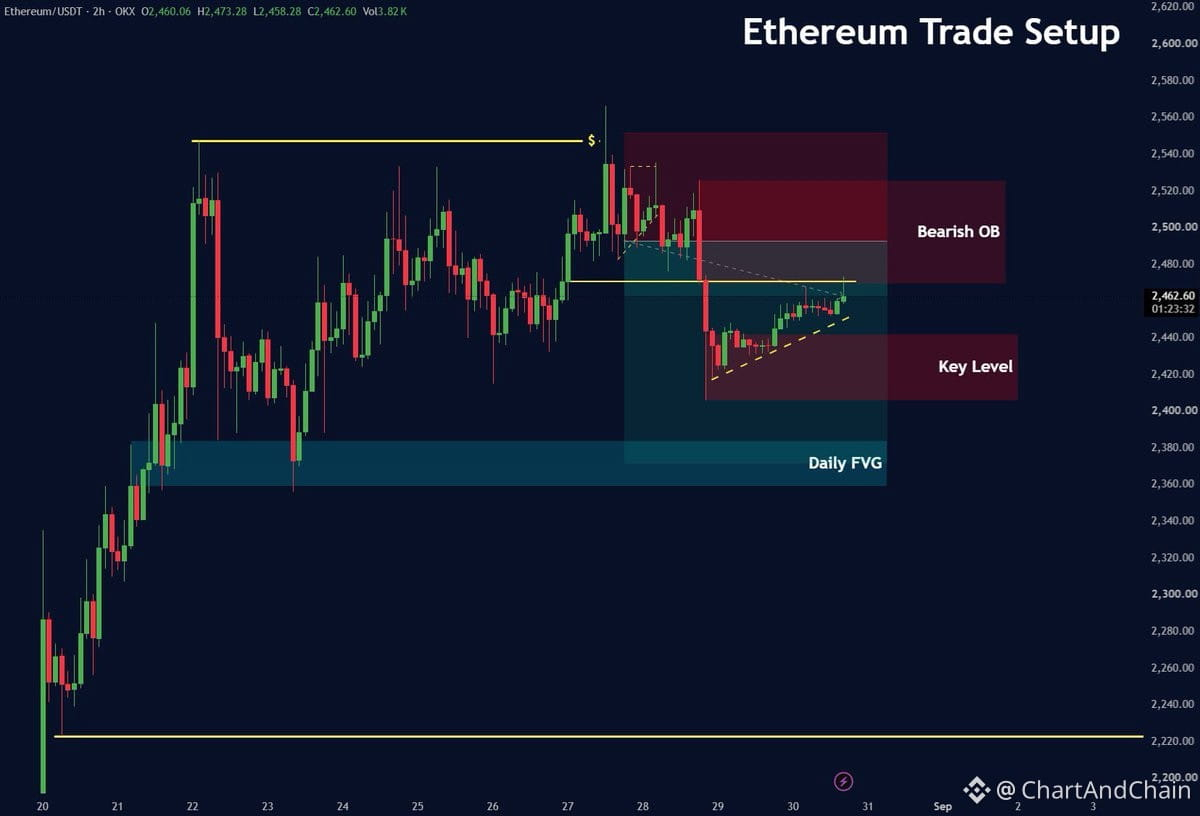
$ETH sitting right at the 4H bearish order block now. Clean tap.
Liquidity's built below — key zone is $2,440–$2,450. That's the line.
For bears to keep control, need a 4H close under that level. Clean break = continuation signal.
Watching this candle close closely. Price structure matters here — hold above and it's a fake-out, break below and the path opens lower.
Levels first, then direction.
Liquidity's built below — key zone is $2,440–$2,450. That's the line.
For bears to keep control, need a 4H close under that level. Clean break = continuation signal.
Watching this candle close closely. Price structure matters here — hold above and it's a fake-out, break below and the path opens lower.
Levels first, then direction.
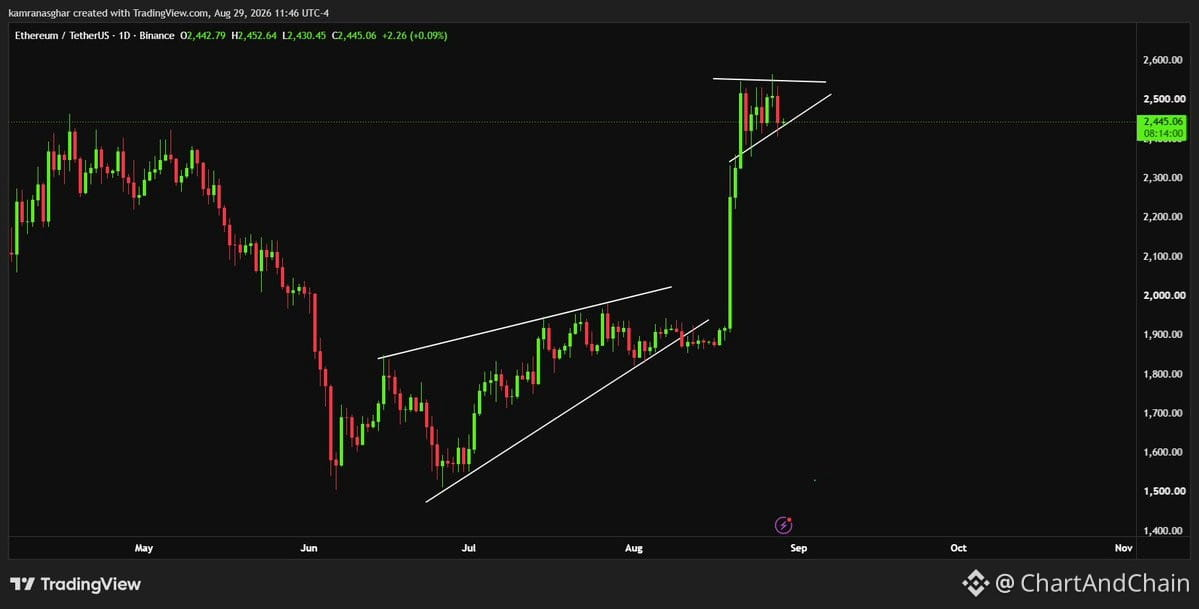
$ETH sitting in a textbook bull flag after the channel breakout. Price coiled tight between $2,400–$2,420 support and $2,550 resistance.
The setup's clean: daily timeframe consolidation, volume drying up, structure holding. Break above $2,550 flips this into continuation mode. Lose $2,400 and the flag invalidates.
Watching $2,550 for the trigger. Until then, it's a wait inside the range.
The setup's clean: daily timeframe consolidation, volume drying up, structure holding. Break above $2,550 flips this into continuation mode. Lose $2,400 and the flag invalidates.
Watching $2,550 for the trigger. Until then, it's a wait inside the range.
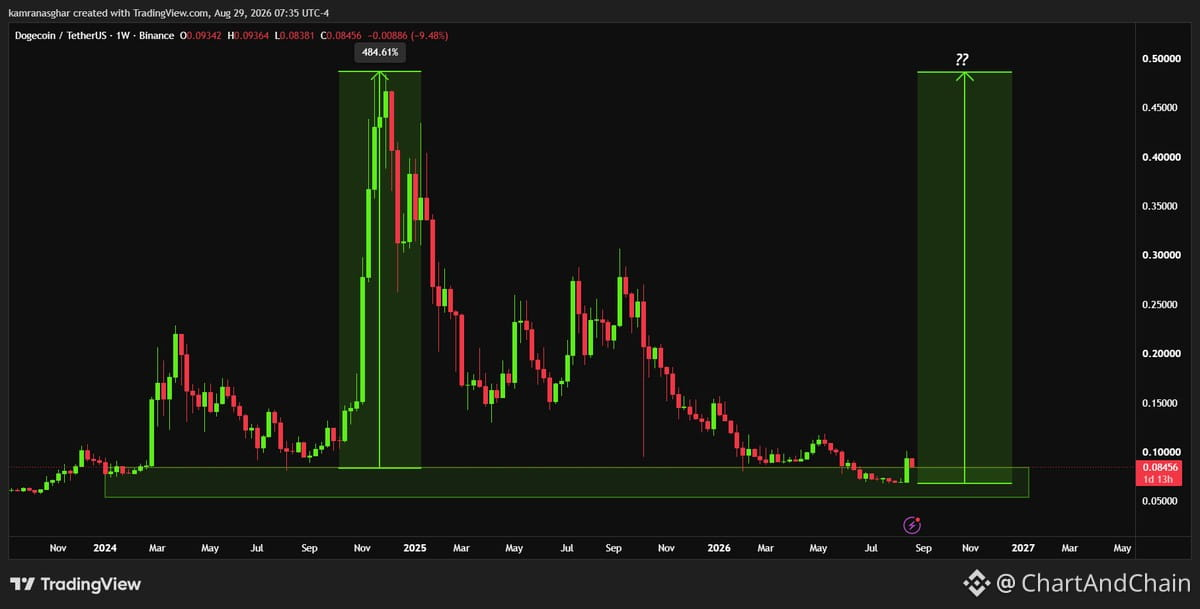
$DOGE sitting back at a macro accumulation zone that matters — $0.0600 to $0.0800 range, the same base that launched the prior +484% leg. Price currently at $0.0845, just above the zone.
Weekly structure looks like it's setting up for a reversal if this level holds. Clean retest of support, volume thinning out, and the zone lines up with previous consolidation before the last major move.
If $DOGE can reclaim and hold above $0.0800 with conviction, the macro target sits around $0.4800+. That's the measured move if we get a repeat of the prior cycle structure.
Watch for a weekly close above the zone and rising volume on the breakout. Invalidation comes on a breakdown below $0.0600 with follow-through. Setup favors patience here — let the base confirm before chasing.
Weekly structure looks like it's setting up for a reversal if this level holds. Clean retest of support, volume thinning out, and the zone lines up with previous consolidation before the last major move.
If $DOGE can reclaim and hold above $0.0800 with conviction, the macro target sits around $0.4800+. That's the measured move if we get a repeat of the prior cycle structure.
Watch for a weekly close above the zone and rising volume on the breakout. Invalidation comes on a breakdown below $0.0600 with follow-through. Setup favors patience here — let the base confirm before chasing.
Double top on the 4H for $NPC after a solid run — classic reversal setup worth watching.
Entry zone: $0.0166–$0.0173
Target: $0.0110
Stop: $0.0198
Structure's clean — neckline break would confirm. If it holds above $0.0198, setup's dead. Risk/reward lines up if the top holds and momentum shifts. Watch for volume drop on the retest before committing.
Entry zone: $0.0166–$0.0173
Target: $0.0110
Stop: $0.0198
Structure's clean — neckline break would confirm. If it holds above $0.0198, setup's dead. Risk/reward lines up if the top holds and momentum shifts. Watch for volume drop on the retest before committing.
AI is changing how traders process information, but it's not replacing judgment.
Every trader sees the same charts. The edge is in how fast and how well you process what matters. AI scans thousands of assets in minutes — volume spikes, sentiment shifts, correlation breaks, unusual flows, emerging patterns. It finds signals hidden in noise, tests scenarios, and flags conditions as they align.
What AI handles well:
• Pattern recognition at scale
• Fast news and sentiment processing
• Scenario testing and backtesting
• Real-time condition flagging
What it can't model: human behavior.
Markets aren't just data. Fear, greed, liquidity shocks, unexpected news, one viral post — all can flip structure instantly. AI doesn't feel panic or FOMO. It doesn't know when the crowd is about to break.
The best traders aren't choosing between AI and experience. They use AI to process faster, then apply their own judgment on when to act and when to step back.
AI improves the process. Discipline controls the outcome.
Every trader sees the same charts. The edge is in how fast and how well you process what matters. AI scans thousands of assets in minutes — volume spikes, sentiment shifts, correlation breaks, unusual flows, emerging patterns. It finds signals hidden in noise, tests scenarios, and flags conditions as they align.
What AI handles well:
• Pattern recognition at scale
• Fast news and sentiment processing
• Scenario testing and backtesting
• Real-time condition flagging
What it can't model: human behavior.
Markets aren't just data. Fear, greed, liquidity shocks, unexpected news, one viral post — all can flip structure instantly. AI doesn't feel panic or FOMO. It doesn't know when the crowd is about to break.
The best traders aren't choosing between AI and experience. They use AI to process faster, then apply their own judgment on when to act and when to step back.
AI improves the process. Discipline controls the outcome.

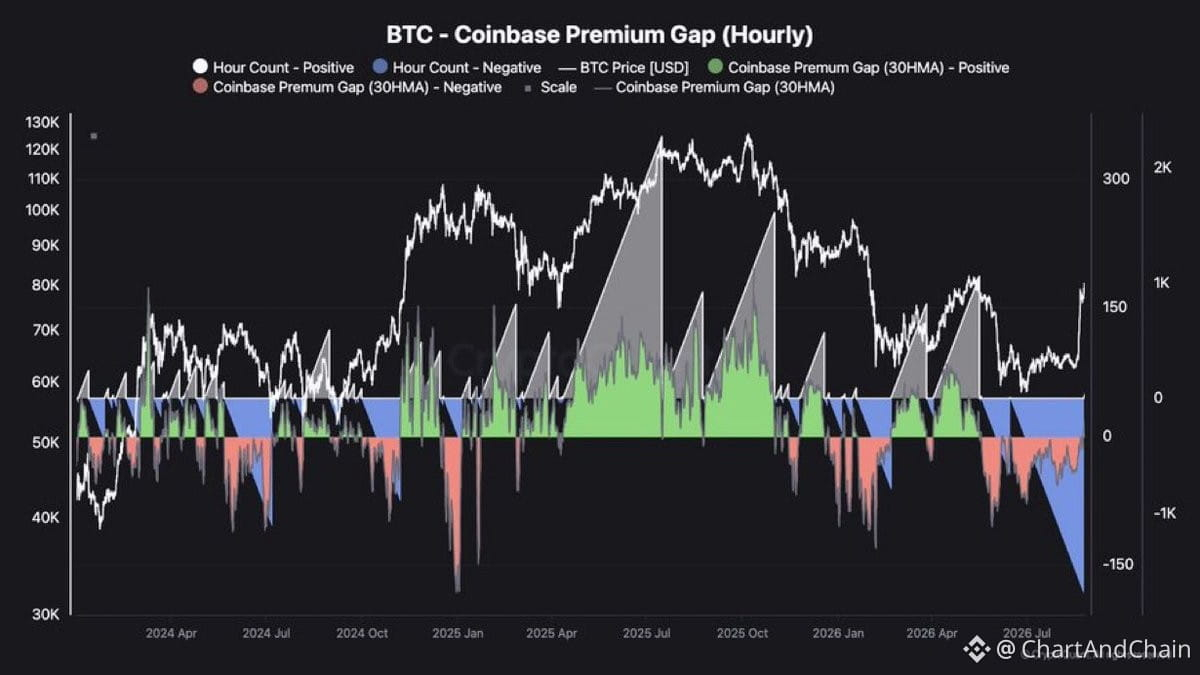
The Coinbase premium just flipped green after sitting negative for over three months. That's the first real sign of U.S. spot demand returning — not just leverage pumping the price.
When the premium turns positive, it means buyers on Coinbase are paying more than other exchanges. That usually signals real capital inflow, not just perps getting squeezed.
If this holds, it changes the structure. The last few months were driven by offshore leverage and arb plays. A sustained green premium means actual spot buying is back in the mix.
Watch for follow-through. One flip isn't a trend, but if it stays green and volume confirms, the next leg up has better legs under it.
When the premium turns positive, it means buyers on Coinbase are paying more than other exchanges. That usually signals real capital inflow, not just perps getting squeezed.
If this holds, it changes the structure. The last few months were driven by offshore leverage and arb plays. A sustained green premium means actual spot buying is back in the mix.
Watch for follow-through. One flip isn't a trend, but if it stays green and volume confirms, the next leg up has better legs under it.
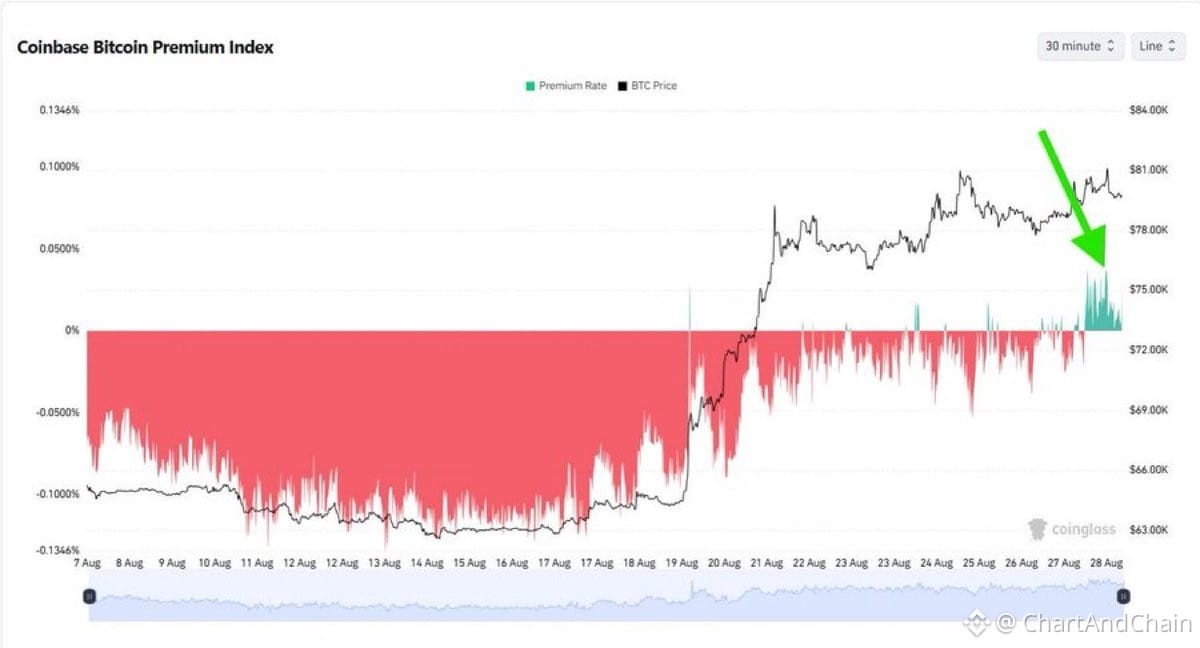
US demand is finally waking up 🇺🇸
$BTC pushed higher and the Coinbase premium flipped positive for the first time in 40 days. That's the first real signal of US retail and institutional flow coming back after a long stretch of offshore dominance.
When Coinbase trades at a premium to other exchanges, it means US buyers are paying up. That 40-day gap? That was US sitting out while Asia and Europe moved the market. Now they're back in.
This isn't just a price pump. It's a shift in who's driving demand. US flow tends to bring momentum and size. If this holds, it could mark the start of a broader re-engagement from stateside capital.
Watch whether the premium sustains or fades. If it sticks, expect more follow-through. If it collapses quickly, it was just a blip.
$BTC pushed higher and the Coinbase premium flipped positive for the first time in 40 days. That's the first real signal of US retail and institutional flow coming back after a long stretch of offshore dominance.
When Coinbase trades at a premium to other exchanges, it means US buyers are paying up. That 40-day gap? That was US sitting out while Asia and Europe moved the market. Now they're back in.
This isn't just a price pump. It's a shift in who's driving demand. US flow tends to bring momentum and size. If this holds, it could mark the start of a broader re-engagement from stateside capital.
Watch whether the premium sustains or fades. If it sticks, expect more follow-through. If it collapses quickly, it was just a blip.
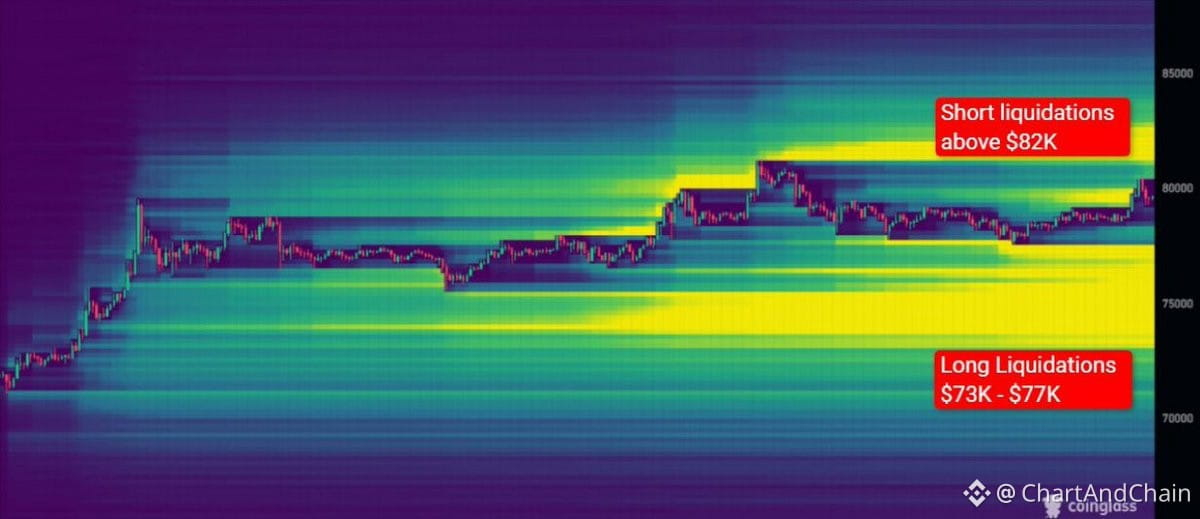
$BTC liquidation map shows a setup worth watching. Small cluster above $82K, but the real liquidity sits between $73K–$77K. That's a thick zone.
Liquidity magnets rarely get ignored. Price tends to sweep these pockets, especially when they're this concentrated. The $73K–$77K range could act as a draw if momentum shifts or if we see a flush to clear leveraged longs.
Watch how $BTC reacts around current structure. If support cracks, that lower liquidity zone becomes the likely target. If we hold and push higher, the $82K cluster is secondary but still in play.
Liquidation-driven moves aren't predictive on their own, but they add context to where price might hunt next. The heavier the cluster, the stronger the pull.
Liquidity magnets rarely get ignored. Price tends to sweep these pockets, especially when they're this concentrated. The $73K–$77K range could act as a draw if momentum shifts or if we see a flush to clear leveraged longs.
Watch how $BTC reacts around current structure. If support cracks, that lower liquidity zone becomes the likely target. If we hold and push higher, the $82K cluster is secondary but still in play.
Liquidation-driven moves aren't predictive on their own, but they add context to where price might hunt next. The heavier the cluster, the stronger the pull.
South Korea's Mirae Asset is pushing into digital assets with a $109B target business — crypto, stablecoins, RWAs, and tokenized securities all in scope.
This is institutional capital pivoting hard into on-chain infrastructure. When a legacy asset manager of this scale commits to tokenized securities and RWAs, it signals structural shift, not speculation. They're building rails for real-world value to move on-chain.
Stablecoins and tokenized assets are the bridge between TradFi and crypto rails. If Mirae executes, it validates the thesis that the next cycle isn't just retail aping memecoins — it's institutions migrating balance sheets onto programmable ledgers.
Watch how they structure custody, which chains they settle on, and whether they lean Ethereum L2s or alternative ecosystems. The infrastructure choices here will shape capital flows across DeFi, RWA protocols, and settlement layers for years.
This isn't noise. This is capital with intent.
This is institutional capital pivoting hard into on-chain infrastructure. When a legacy asset manager of this scale commits to tokenized securities and RWAs, it signals structural shift, not speculation. They're building rails for real-world value to move on-chain.
Stablecoins and tokenized assets are the bridge between TradFi and crypto rails. If Mirae executes, it validates the thesis that the next cycle isn't just retail aping memecoins — it's institutions migrating balance sheets onto programmable ledgers.
Watch how they structure custody, which chains they settle on, and whether they lean Ethereum L2s or alternative ecosystems. The infrastructure choices here will shape capital flows across DeFi, RWA protocols, and settlement layers for years.
This isn't noise. This is capital with intent.


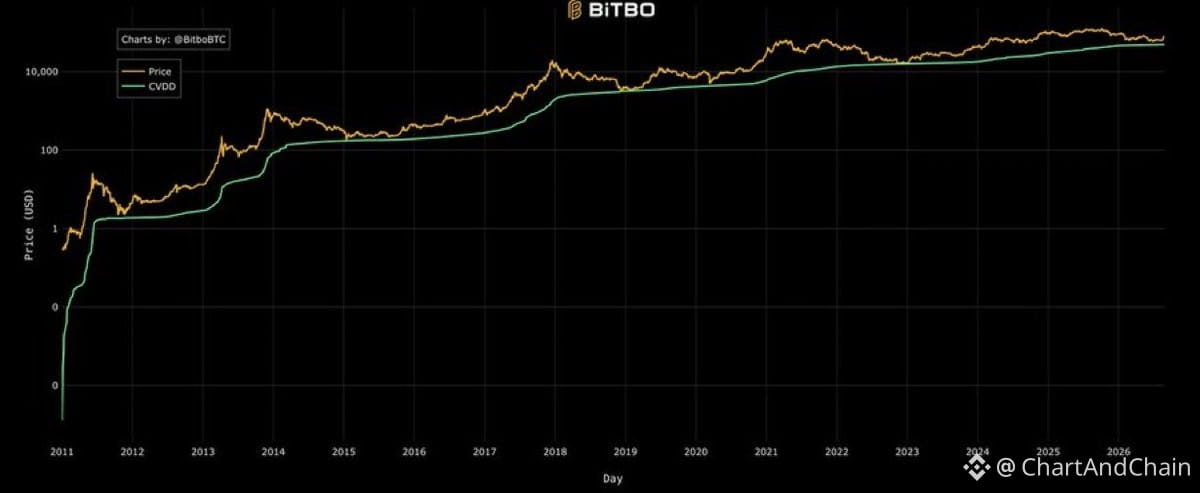
$BTC has never bottomed above the CVDD line.
Current CVDD sits at $49,000.
A flush down to that level looks increasingly unlikely at this point.
After a cycle with no real euphoria, $BTC might be setting up one of its least painful bottoms in history.
Bitcoin is evolving.
Current CVDD sits at $49,000.
A flush down to that level looks increasingly unlikely at this point.
After a cycle with no real euphoria, $BTC might be setting up one of its least painful bottoms in history.
Bitcoin is evolving.
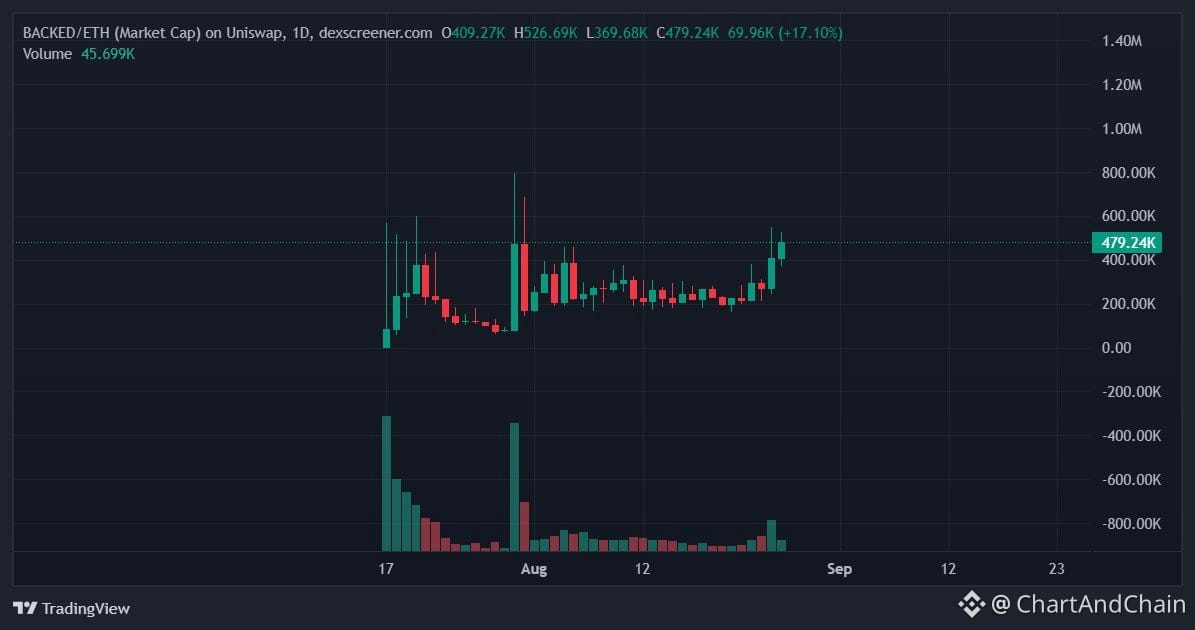
Aped $BACKED at ~$450K MC.
@isBacked_ is building a stock-backed token on Robinhood Chain — basically tokenized equity (AAPL, NVDA, TSLA, MSFT, GOOGL, AMZN, META) sitting in a vault.
Mechanic:
• 3% trading tax (in ETH) buys more stocks → grows the reserve
• Holders can redeem $BACKED for their proportional share of the vault
• Redemptions burn supply → backing per token rises over time
Flywheel is clean: volume → more stocks → deeper reserve → stronger backing.
At $450K MC vs $115K+ reserve value, you're buying above backing but the gap isn't wild — especially if the tokenized stock narrative on Robinhood Chain catches momentum.
CA: 0x7168563B0E70124f0C7c0cF2F13a8D1861BAf4A5
NFA.
@isBacked_ is building a stock-backed token on Robinhood Chain — basically tokenized equity (AAPL, NVDA, TSLA, MSFT, GOOGL, AMZN, META) sitting in a vault.
Mechanic:
• 3% trading tax (in ETH) buys more stocks → grows the reserve
• Holders can redeem $BACKED for their proportional share of the vault
• Redemptions burn supply → backing per token rises over time
Flywheel is clean: volume → more stocks → deeper reserve → stronger backing.
At $450K MC vs $115K+ reserve value, you're buying above backing but the gap isn't wild — especially if the tokenized stock narrative on Robinhood Chain catches momentum.
CA: 0x7168563B0E70124f0C7c0cF2F13a8D1861BAf4A5
NFA.
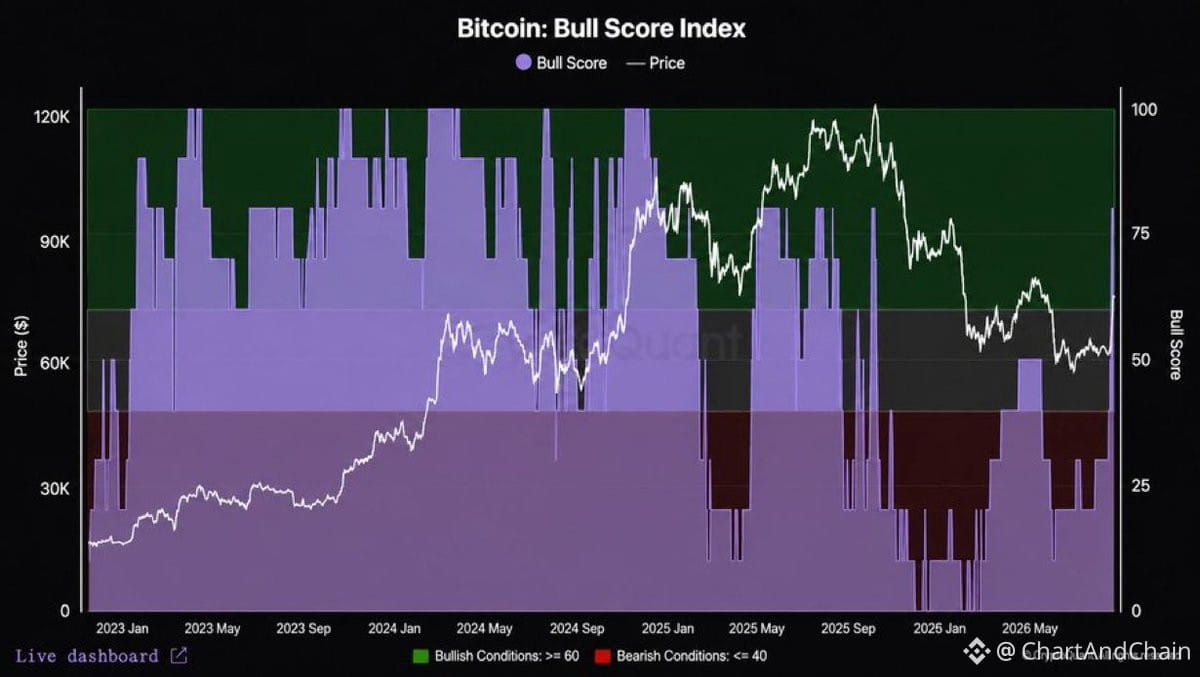
$BTC Bull Score spiked from 30 to 80 in a week — fastest flip in 12 months. That's a meaningful structural shift, not noise.
Key level: $83K. A daily close above confirms the momentum shift and opens the door for continuation. Below that, we're still in chop.
Watch the close, not the wick.
Key level: $83K. A daily close above confirms the momentum shift and opens the door for continuation. Below that, we're still in chop.
Watch the close, not the wick.
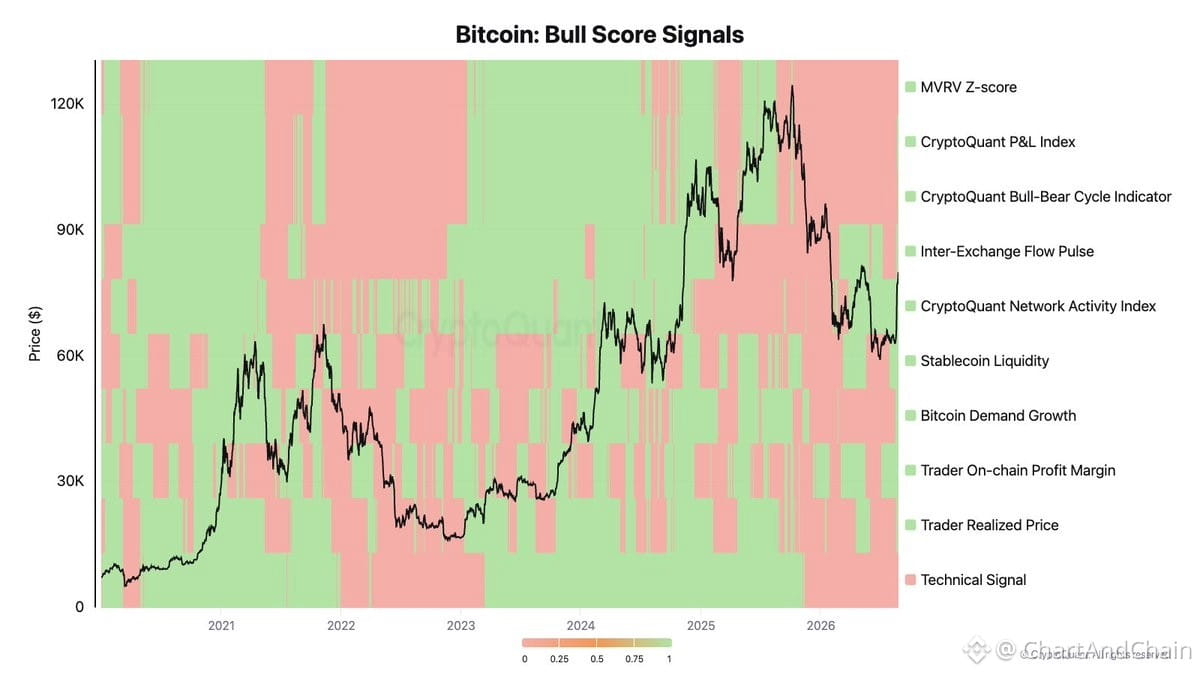
$BTC flipped to bull regime across most on-chain metrics. Early-stage bull structure forming, but official confirmation still pending — price needs to clear the 365-day MA at $83K.
Two risks in play:
1. Unrealized profit levels spiked after the rally, opening the door for profit-taking
2. Exchange inflows ticking up, signaling potential sell pressure
Structure is constructive, but watch for a pullback before continuation. The 365-day MA is the line — above it, bull confirmed. Below it, we're still in transition.
Chart looks good. Chain looks stretched. Let the level decide.
Two risks in play:
1. Unrealized profit levels spiked after the rally, opening the door for profit-taking
2. Exchange inflows ticking up, signaling potential sell pressure
Structure is constructive, but watch for a pullback before continuation. The 365-day MA is the line — above it, bull confirmed. Below it, we're still in transition.
Chart looks good. Chain looks stretched. Let the level decide.
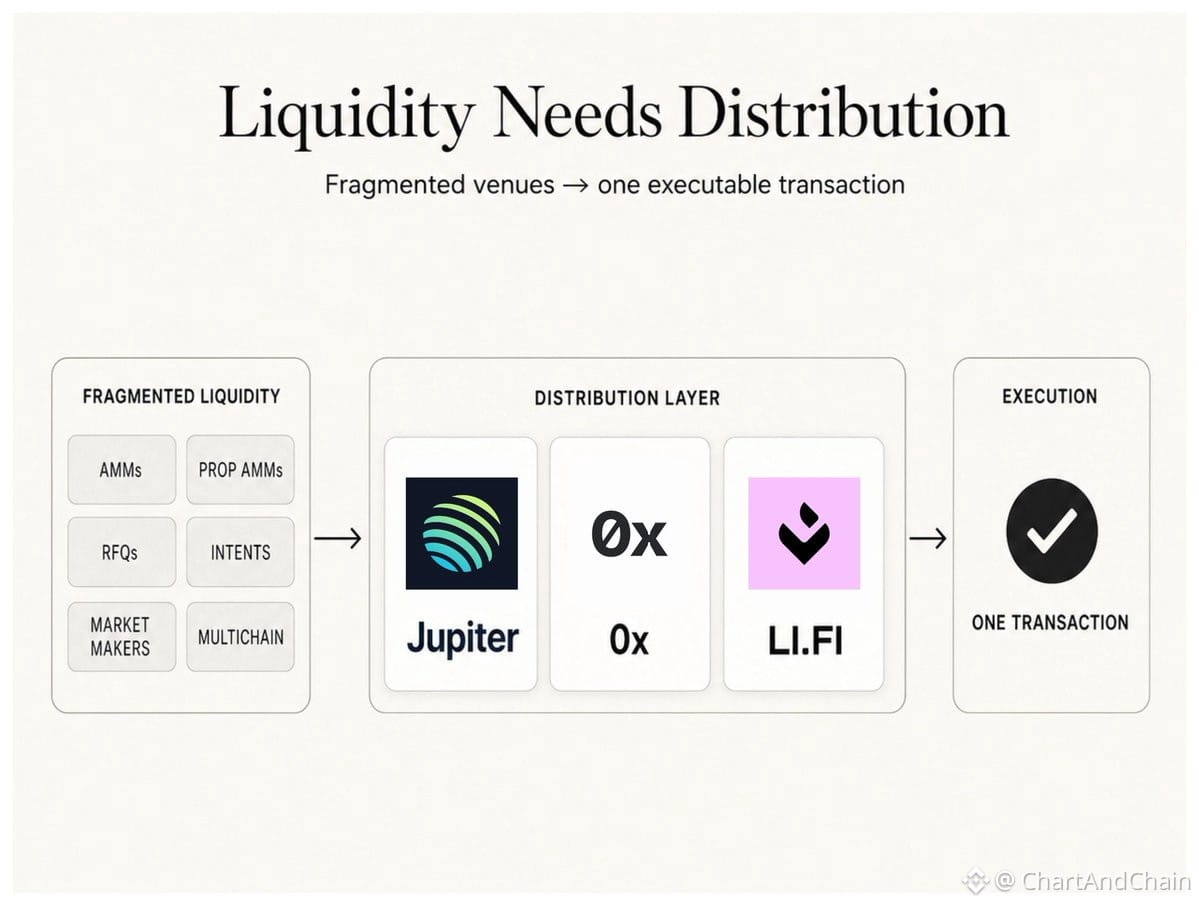
Onchain liquidity is fragmented — scattered across AMMs, RFQ systems, intent protocols, and chains. The real unlock isn't just attracting LP capital. It's infra that compares venues and routes execution cleanly.
Three protocols doing this well:
$JUP on Solana — aggregates AMMs, prop AMMs, and market makers into one swap layer. When you trade, Jupiter compares depth and prices, then builds the best route. It's the distribution layer for Solana liquidity. Already routing tokenized stocks from xStocks and the Securitize-Jump partnership.
0x Protocol on Ethereum and beyond — powers wallets and apps with aggregated liquidity. Combines AMMs, DEXs, and professional quotes via RFQ. Over the past year, routed ~$300M in tokenized gold ($PAXG, $XAUT) across 13 chains. Also supports tokenized bonds and yield assets on 9 chains. Backs execution for Coinbase and Robinhood. Not just crypto — it's becoming the execution layer for RWAs.
LiFi Protocol — solves cross-chain liquidity with compliance controls. Connects DEXs, aggregators, bridges, and intent systems. Can restrict routes to approved solvers that meet KYC/AML standards. Used by Ondo for tokenized stocks and ETFs on Ethereum and BNB Chain. OpenEden uses it to convert assets into $USDC before investing in tokenized bonds. Compliance-aware routing will matter more as institutions move onchain.
The shift: liquidity isn't just about depth. For tokenized stocks, credit, commodities, and yield-bearing RWAs, you need accurate pricing, reliable secondary markets, active risk management, broad distribution, and compliant settlement.
Issuing an asset onchain is step one. The protocols that make it liquid, accessible, and operationally sound may capture more value than the market prices in today.
Three protocols doing this well:
$JUP on Solana — aggregates AMMs, prop AMMs, and market makers into one swap layer. When you trade, Jupiter compares depth and prices, then builds the best route. It's the distribution layer for Solana liquidity. Already routing tokenized stocks from xStocks and the Securitize-Jump partnership.
0x Protocol on Ethereum and beyond — powers wallets and apps with aggregated liquidity. Combines AMMs, DEXs, and professional quotes via RFQ. Over the past year, routed ~$300M in tokenized gold ($PAXG, $XAUT) across 13 chains. Also supports tokenized bonds and yield assets on 9 chains. Backs execution for Coinbase and Robinhood. Not just crypto — it's becoming the execution layer for RWAs.
LiFi Protocol — solves cross-chain liquidity with compliance controls. Connects DEXs, aggregators, bridges, and intent systems. Can restrict routes to approved solvers that meet KYC/AML standards. Used by Ondo for tokenized stocks and ETFs on Ethereum and BNB Chain. OpenEden uses it to convert assets into $USDC before investing in tokenized bonds. Compliance-aware routing will matter more as institutions move onchain.
The shift: liquidity isn't just about depth. For tokenized stocks, credit, commodities, and yield-bearing RWAs, you need accurate pricing, reliable secondary markets, active risk management, broad distribution, and compliant settlement.
Issuing an asset onchain is step one. The protocols that make it liquid, accessible, and operationally sound may capture more value than the market prices in today.
Log in to explore more content