
钱往哪走
5.1k Posts

钱往哪走
Report
Block User
不猜方向,只看钱往哪走。判断发出来,到期自己回来对账。
High-Frequency Trader
2.6 Years
2 Following
212 Followers
198 Liked
Posts
All
Quotes
PINNED
·
--
📌 New here? Start with this: what this account covers and where to beginThis account is called “Where the Money Flows.” The name says it all: no guessing market direction, no trading calls—just one question: where is the money going, and why?
① Who this is for
For people who want to understand crypto without getting lost in jargon or trading hype. I don’t recommend what to buy or predict price levels.
② Three main themes
1. Course series · 42 lessons (up to lesson 15 so far; one lesson a day)
Each lesson explains one concept clearly, so you can look it up yourself afterward:
1. What exactly is a blockchain?
2. How did Bitcoin come about?
3. Who keeps the books? Mining and consensus
📌 New here? Start with this: what this account covers and where to begin
This account is called “Where the Money Flows.” The name says it all: no guessing market direction, no trading calls—just one question: where is the money going, and why?
① Who this is for
For people who want to understand crypto without getting lost in jargon or trading hype. I don’t recommend what to buy or predict price levels.
② Three main themes
1. Course series · 42 lessons (up to lesson 15 so far; one lesson a day)
Each lesson explains one concept clearly, so you can look it up yourself afterward:
1. What exactly is a blockchain?
2. How did Bitcoin come about?
3. Who keeps the books? Mining and consensus
① Who this is for
For people who want to understand crypto without getting lost in jargon or trading hype. I don’t recommend what to buy or predict price levels.
② Three main themes
1. Course series · 42 lessons (up to lesson 15 so far; one lesson a day)
Each lesson explains one concept clearly, so you can look it up yourself afterward:
1. What exactly is a blockchain?
2. How did Bitcoin come about?
3. Who keeps the books? Mining and consensus
2
510
·
--
Article
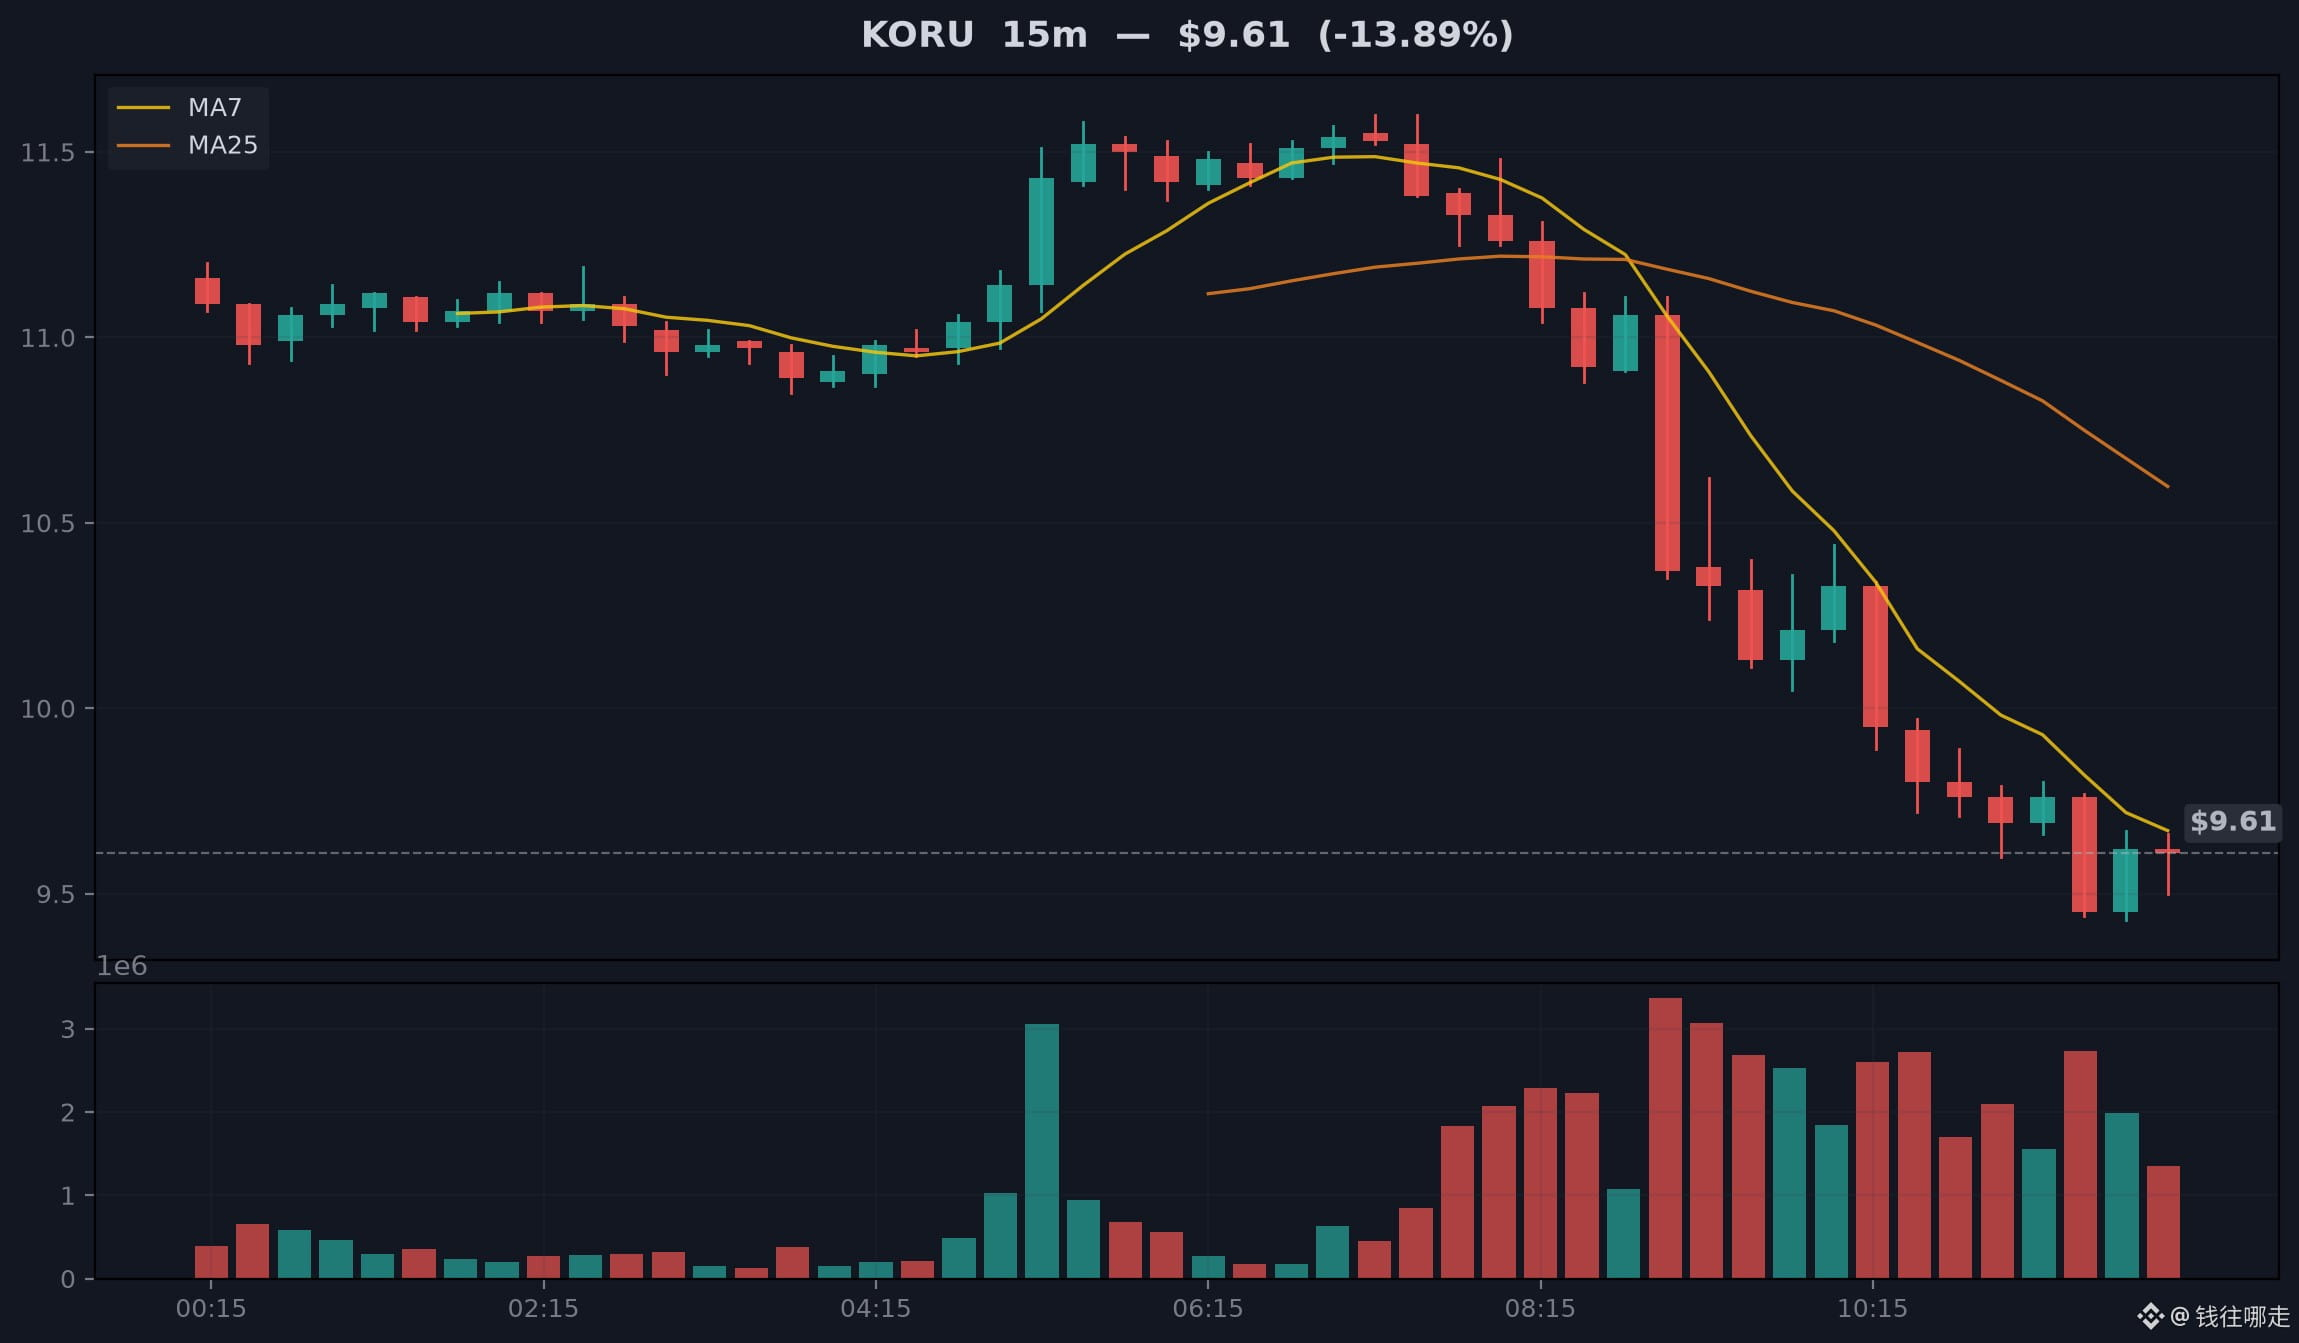
🚀 Has KORU finished building momentum? OI + bullish large traders—breakout imminentWhere is the money going? Don’t rush to look for a reason—let’s put the numbers on the table first.
KORU is down 10.91%, with $890 million in 24-hour trading volume. With that kind of volume alongside this drop, I’m not joining the crowd and calling for a short just yet. The structural read is slightly bullish, but unconfirmed. Put simply, some money is being absorbed, but it’s too early to draw a firm conclusion. Open interest supports this view: +4.2% over 1 hour and +16% over 3 hours. Three-hour open interest is rising, which means new money is coming in, and it’s reached $106 million—not a minor move. The large-trader long/short ratio is 12.02, so large traders are adding longs. But 92.3% of accounts are long, and such extreme readings often show up near local highs. So I see this crowded long trade as a risk, not a bullish signal. 9.5 is support; if it breaks, I’ll consider the accumulation thesis a failure. 9.62 is resistance; only a move above it would confirm the structure. I’m not betting on a direction in between. Which price level are you watching? Let me know in the comments.
🚀 Has KORU finished building momentum? OI + bullish large traders—breakout imminent
Where is the money going? Don’t rush to look for a reason—let’s put the numbers on the table first.
KORU is down 10.91%, with $890 million in 24-hour trading volume. With that kind of volume alongside this drop, I’m not joining the crowd and calling for a short just yet. The structural read is slightly bullish, but unconfirmed. Put simply, some money is being absorbed, but it’s too early to draw a firm conclusion. Open interest supports this view: +4.2% over 1 hour and +16% over 3 hours. Three-hour open interest is rising, which means new money is coming in, and it’s reached $106 million—not a minor move. The large-trader long/short ratio is 12.02, so large traders are adding longs. But 92.3% of accounts are long, and such extreme readings often show up near local highs. So I see this crowded long trade as a risk, not a bullish signal. 9.5 is support; if it breaks, I’ll consider the accumulation thesis a failure. 9.62 is resistance; only a move above it would confirm the structure. I’m not betting on a direction in between. Which price level are you watching? Let me know in the comments.
KORU is down 10.91%, with $890 million in 24-hour trading volume. With that kind of volume alongside this drop, I’m not joining the crowd and calling for a short just yet. The structural read is slightly bullish, but unconfirmed. Put simply, some money is being absorbed, but it’s too early to draw a firm conclusion. Open interest supports this view: +4.2% over 1 hour and +16% over 3 hours. Three-hour open interest is rising, which means new money is coming in, and it’s reached $106 million—not a minor move. The large-trader long/short ratio is 12.02, so large traders are adding longs. But 92.3% of accounts are long, and such extreme readings often show up near local highs. So I see this crowded long trade as a risk, not a bullish signal. 9.5 is support; if it breaks, I’ll consider the accumulation thesis a failure. 9.62 is resistance; only a move above it would confirm the structure. I’m not betting on a direction in between. Which price level are you watching? Let me know in the comments.
45
·
--
📖 System Course | Lesson 24 · What Is the Funding Rate?No matter how accurately you calculate the liquidation price, it only tells you “when you’ll be forcibly liquidated.” It doesn’t answer another, more frustrating question: If I got the direction right, why is the money in my account still gradually shrinking? To answer that, we first need to understand a sum of money that keeps changing hands in perpetual futures—the funding rate.
Let’s start with the bottom line: The funding rate is a sum of money that longs and shorts periodically pay each other in perpetual futures. It’s usually settled every 8 hours, three times a day. Pay attention to two key terms in that sentence: longs and shorts. A long is someone who is bullish—in other words, someone who has already bought and is waiting for the price to rise. A short is someone who is bearish—in other words, someone who has already sold and is waiting for the price to fall. This money passes back and forth between these two groups; it doesn’t go into the exchange’s pocket.
📖 System Course | Lesson 24 · What Is the Funding Rate?
No matter how accurately you calculate the liquidation price, it only tells you “when you’ll be forcibly liquidated.” It doesn’t answer another, more frustrating question: If I got the direction right, why is the money in my account still gradually shrinking? To answer that, we first need to understand a sum of money that keeps changing hands in perpetual futures—the funding rate.
Let’s start with the bottom line: The funding rate is a sum of money that longs and shorts periodically pay each other in perpetual futures. It’s usually settled every 8 hours, three times a day. Pay attention to two key terms in that sentence: longs and shorts. A long is someone who is bullish—in other words, someone who has already bought and is waiting for the price to rise. A short is someone who is bearish—in other words, someone who has already sold and is waiting for the price to fall. This money passes back and forth between these two groups; it doesn’t go into the exchange’s pocket.
Let’s start with the bottom line: The funding rate is a sum of money that longs and shorts periodically pay each other in perpetual futures. It’s usually settled every 8 hours, three times a day. Pay attention to two key terms in that sentence: longs and shorts. A long is someone who is bullish—in other words, someone who has already bought and is waiting for the price to rise. A short is someone who is bearish—in other words, someone who has already sold and is waiting for the price to fall. This money passes back and forth between these two groups; it doesn’t go into the exchange’s pocket.
63
·
--
Article
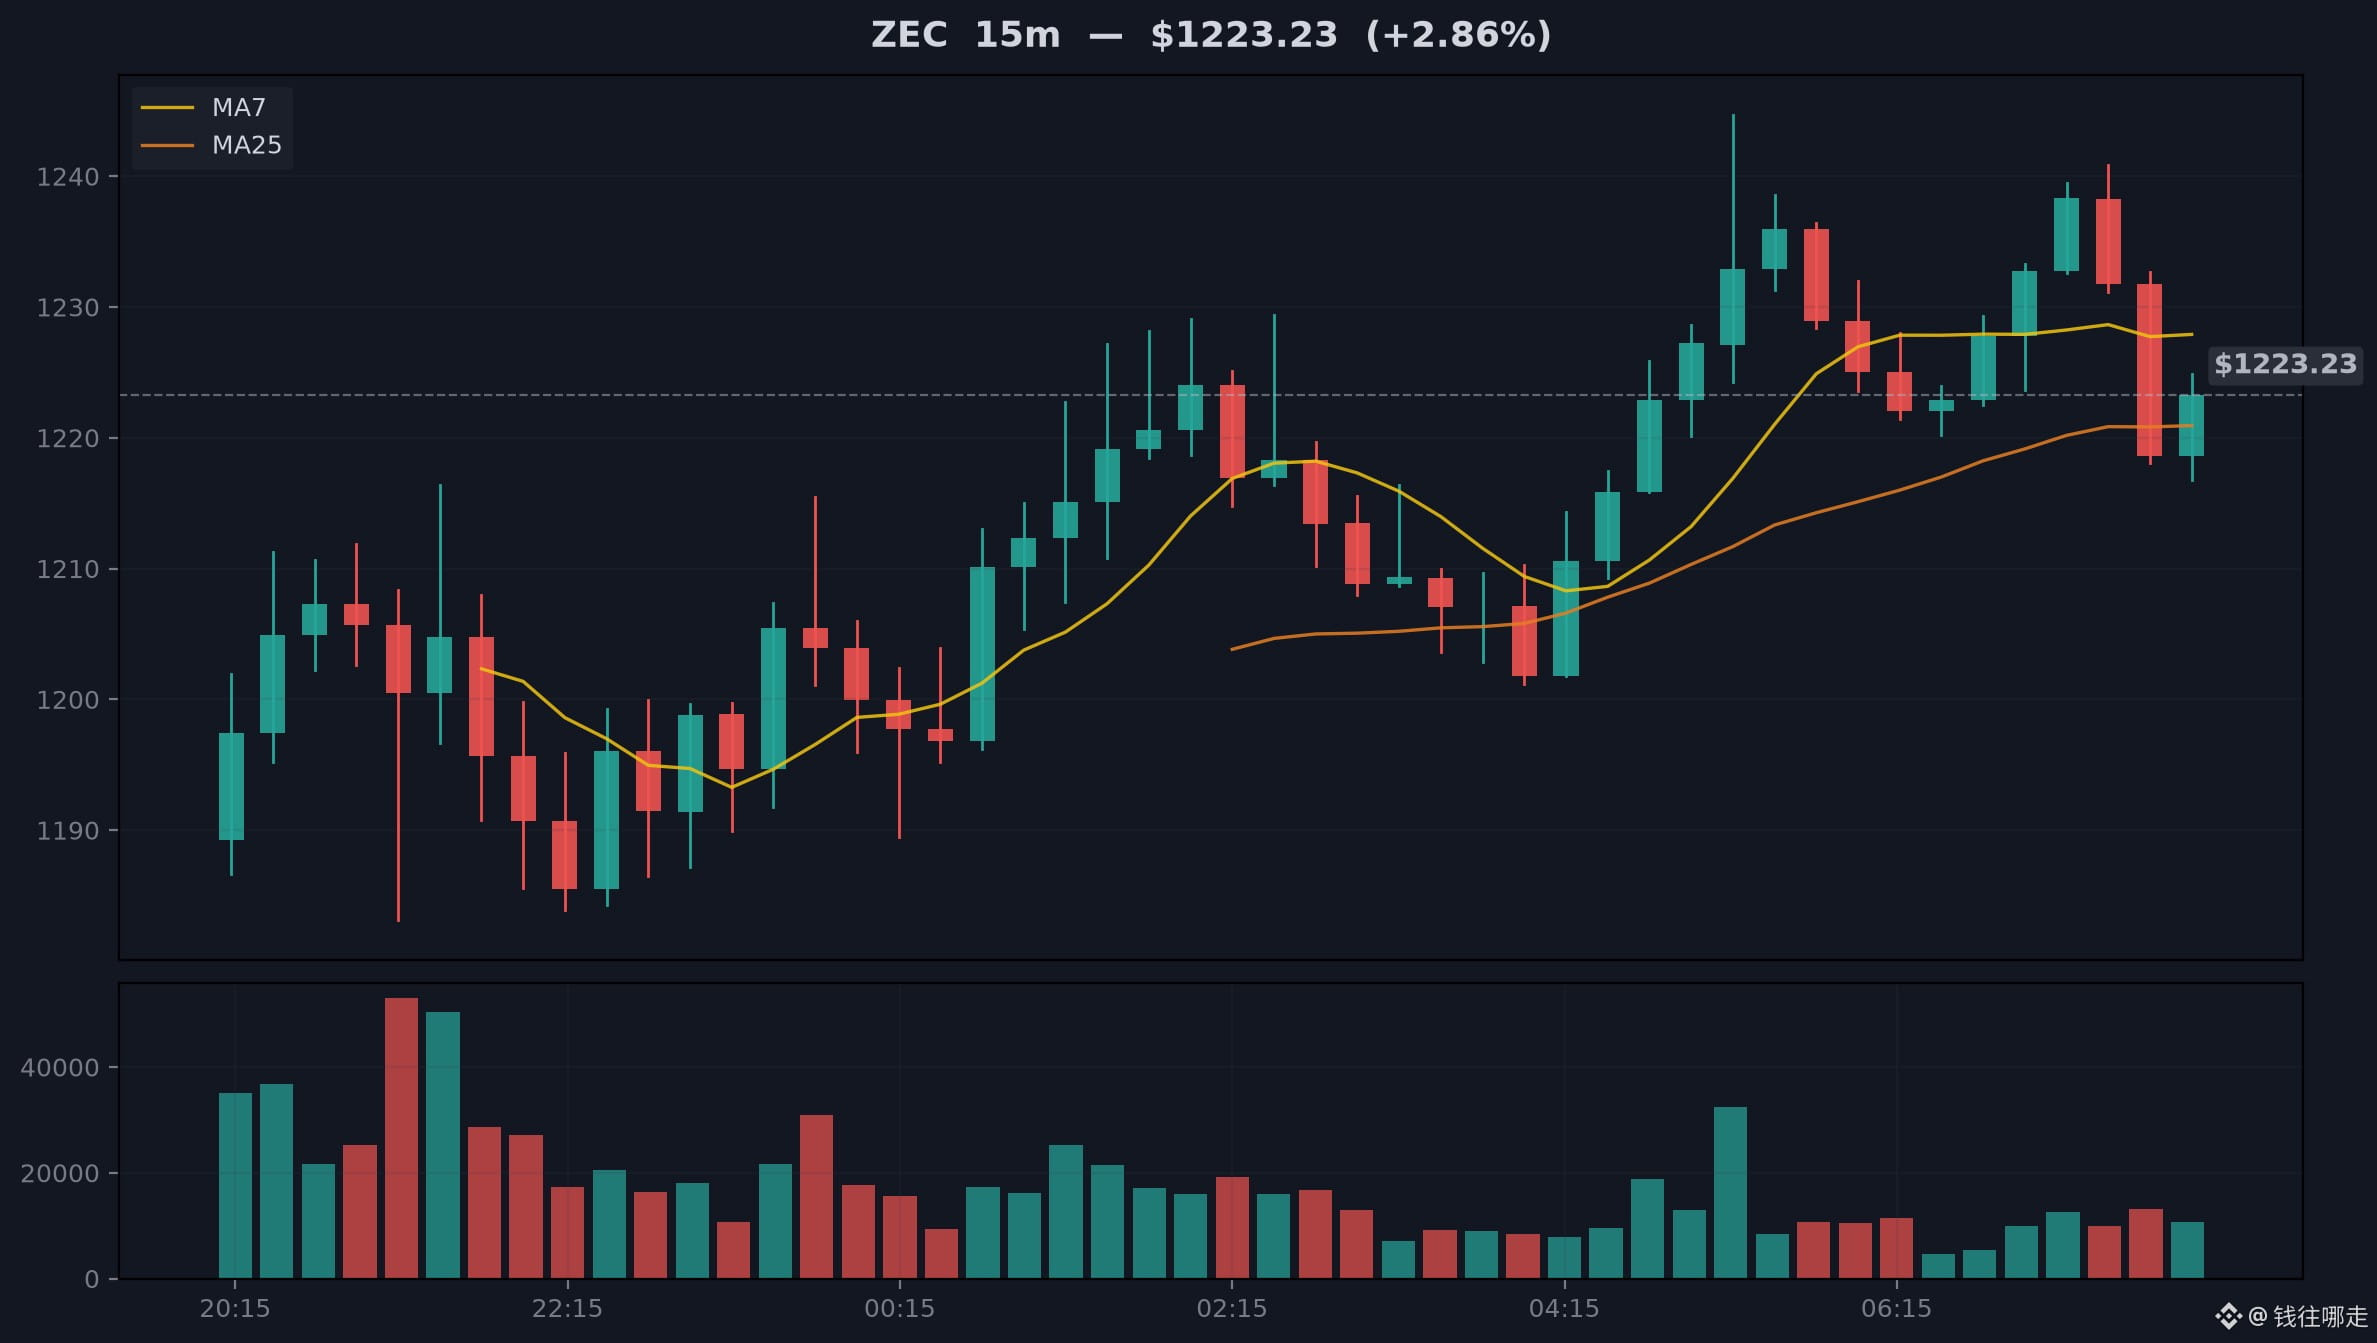
↘️ $ZEC Large-Trader Long/Short Ratio at 0.71—What’s Next?Where the money is flowing: for today’s big bullish candle, I’m only looking at the money flow.
$ZEC This high-volume breakout is actually slightly bearish structurally, and it’s not confirmed yet. It’s up 7.45% over 24 hours, with a trading volume of $1.747 billion, and it’s still 2.0% below the 24-hour high. Let me make my reasoning clear: the large-trader long/short ratio is 0.71, meaning large traders are reducing their long positions. Long accounts make up 41.5%, which means there could easily be selling pressure overhead during a rebound.
The funding rate is 0.0001. A positive value means longs are paying, so the long side is a little crowded, but the figure is too small for me to count it. The active buy/sell ratio is 1.05, meaning buying and selling are basically balanced, with a slight tilt toward buyers. The structure is slightly bullish, but that’s not confirmed either. So I’m not betting on a direction here; I’ll wait for the boundaries to give a signal: if it breaks below 1210.18, I’ll turn bearish; if it gets above 1228.19, I’ll turn bullish. I’m spelling out both sides now so I can’t make excuses later.
↘️ $ZEC Large-Trader Long/Short Ratio at 0.71—What’s Next?
Where the money is flowing: for today’s big bullish candle, I’m only looking at the money flow.
$ZEC This high-volume breakout is actually slightly bearish structurally, and it’s not confirmed yet. It’s up 7.45% over 24 hours, with a trading volume of $1.747 billion, and it’s still 2.0% below the 24-hour high. Let me make my reasoning clear: the large-trader long/short ratio is 0.71, meaning large traders are reducing their long positions. Long accounts make up 41.5%, which means there could easily be selling pressure overhead during a rebound.
The funding rate is 0.0001. A positive value means longs are paying, so the long side is a little crowded, but the figure is too small for me to count it. The active buy/sell ratio is 1.05, meaning buying and selling are basically balanced, with a slight tilt toward buyers. The structure is slightly bullish, but that’s not confirmed either. So I’m not betting on a direction here; I’ll wait for the boundaries to give a signal: if it breaks below 1210.18, I’ll turn bearish; if it gets above 1228.19, I’ll turn bullish. I’m spelling out both sides now so I can’t make excuses later.
$ZEC This high-volume breakout is actually slightly bearish structurally, and it’s not confirmed yet. It’s up 7.45% over 24 hours, with a trading volume of $1.747 billion, and it’s still 2.0% below the 24-hour high. Let me make my reasoning clear: the large-trader long/short ratio is 0.71, meaning large traders are reducing their long positions. Long accounts make up 41.5%, which means there could easily be selling pressure overhead during a rebound.
The funding rate is 0.0001. A positive value means longs are paying, so the long side is a little crowded, but the figure is too small for me to count it. The active buy/sell ratio is 1.05, meaning buying and selling are basically balanced, with a slight tilt toward buyers. The structure is slightly bullish, but that’s not confirmed either. So I’m not betting on a direction here; I’ll wait for the boundaries to give a signal: if it breaks below 1210.18, I’ll turn bearish; if it gets above 1228.19, I’ll turn bullish. I’m spelling out both sides now so I can’t make excuses later.
121
·
--
🪙 New Coin Explainer | 【ICNT Rose 37% in a Day: What Should Beginners Know?】First, look at where the money is flowing. I have my doubts about this bullish candle.
Here's the takeaway: $ICNT rose about 37.6% over the past 24 hours, reaching around $0.229, just 3.1% below its 24-hour high. Trading volume also surged to about $65.8 million, open interest stood at around $5.72 million, and the price rose 13.1% in three hours. In short, this is a combination of a “price surge on increased volume” and a “rapid rise in open interest”—a classic sign of short-term strength.
ICNT is a new project token in the crypto sector, and its market cap and liquidity are still relatively small. Small-cap coins like this tend to have light order books, so trading worth tens of millions of dollars can push the price up noticeably—and send it down just as quickly. So when you see a figure like 37%, don't get excited just yet; understand that the volatility is magnified to begin with.
🪙 New Coin Explainer | 【ICNT Rose 37% in a Day: What Should Beginners Know?】
First, look at where the money is flowing. I have my doubts about this bullish candle.
Here's the takeaway: $ICNT rose about 37.6% over the past 24 hours, reaching around $0.229, just 3.1% below its 24-hour high. Trading volume also surged to about $65.8 million, open interest stood at around $5.72 million, and the price rose 13.1% in three hours. In short, this is a combination of a “price surge on increased volume” and a “rapid rise in open interest”—a classic sign of short-term strength.
ICNT is a new project token in the crypto sector, and its market cap and liquidity are still relatively small. Small-cap coins like this tend to have light order books, so trading worth tens of millions of dollars can push the price up noticeably—and send it down just as quickly. So when you see a figure like 37%, don't get excited just yet; understand that the volatility is magnified to begin with.
Here's the takeaway: $ICNT rose about 37.6% over the past 24 hours, reaching around $0.229, just 3.1% below its 24-hour high. Trading volume also surged to about $65.8 million, open interest stood at around $5.72 million, and the price rose 13.1% in three hours. In short, this is a combination of a “price surge on increased volume” and a “rapid rise in open interest”—a classic sign of short-term strength.
ICNT is a new project token in the crypto sector, and its market cap and liquidity are still relatively small. Small-cap coins like this tend to have light order books, so trading worth tens of millions of dollars can push the price up noticeably—and send it down just as quickly. So when you see a figure like 37%, don't get excited just yet; understand that the volatility is magnified to begin with.
6
·
--
Article
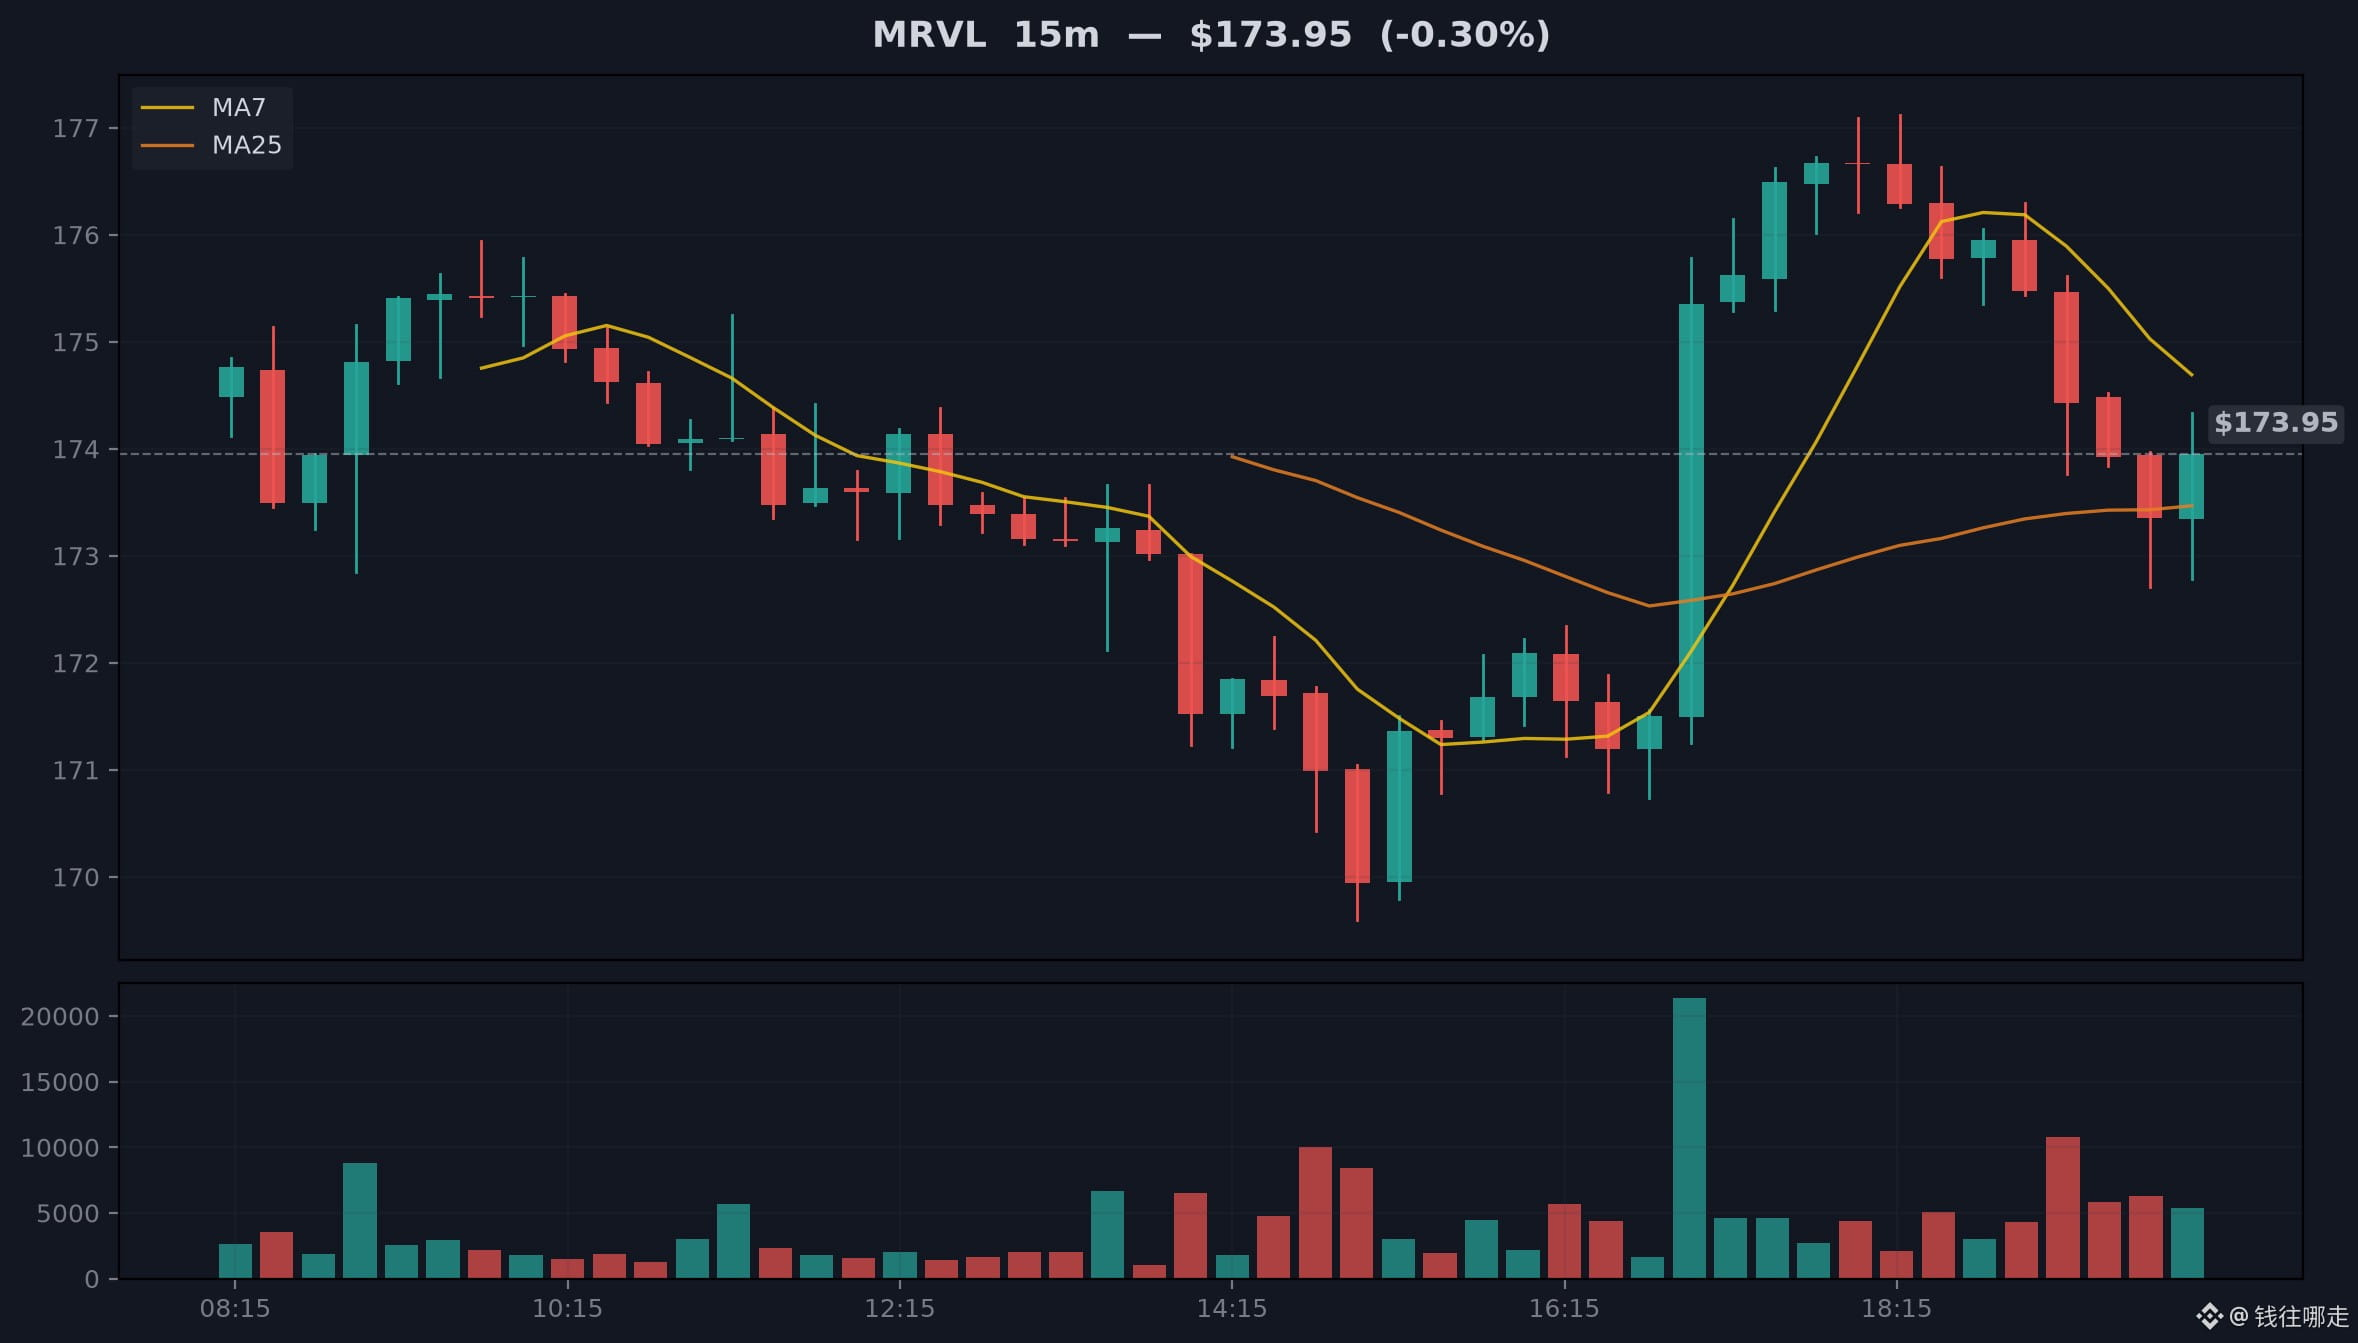
💎 Calm Before MRVL’s Breakout: OI Accumulation + Longs in Control = A Signal Ready to ExplodeFirst, let’s see where the money is going. In this downturn, I’m only watching two things.
MRVL fell 11.75% in a day, with $246 million in trading volume. The volume is real, but I don’t want to spin a story based on the drop alone. The structure leans slightly bullish, but it’s not confirmed yet, so I’m not betting on a direction at this level.
There are only two reasons. Open interest is up 2.3% over 1 hour and 6.7% over 3 hours. With price moving this much and open interest still rising, it suggests new money is coming in to buy, not fleeing. But the top traders' long/short ratio has reached an extreme of 5.7, with long accounts making up 85.1%. Readings like this often appear near local highs, so I’m reluctant to treat it as a tailwind. On one side, money is flowing in; on the other, positioning is too crowded. The forces are pulling in opposite directions, so I won’t draw a conclusion.
💎 Calm Before MRVL’s Breakout: OI Accumulation + Longs in Control = A Signal Ready to Explode
First, let’s see where the money is going. In this downturn, I’m only watching two things.
MRVL fell 11.75% in a day, with $246 million in trading volume. The volume is real, but I don’t want to spin a story based on the drop alone. The structure leans slightly bullish, but it’s not confirmed yet, so I’m not betting on a direction at this level.
There are only two reasons. Open interest is up 2.3% over 1 hour and 6.7% over 3 hours. With price moving this much and open interest still rising, it suggests new money is coming in to buy, not fleeing. But the top traders' long/short ratio has reached an extreme of 5.7, with long accounts making up 85.1%. Readings like this often appear near local highs, so I’m reluctant to treat it as a tailwind. On one side, money is flowing in; on the other, positioning is too crowded. The forces are pulling in opposite directions, so I won’t draw a conclusion.
MRVL fell 11.75% in a day, with $246 million in trading volume. The volume is real, but I don’t want to spin a story based on the drop alone. The structure leans slightly bullish, but it’s not confirmed yet, so I’m not betting on a direction at this level.
There are only two reasons. Open interest is up 2.3% over 1 hour and 6.7% over 3 hours. With price moving this much and open interest still rising, it suggests new money is coming in to buy, not fleeing. But the top traders' long/short ratio has reached an extreme of 5.7, with long accounts making up 85.1%. Readings like this often appear near local highs, so I’m reluctant to treat it as a tailwind. On one side, money is flowing in; on the other, positioning is too crowded. The forces are pulling in opposite directions, so I won’t draw a conclusion.
17
·
--
🪙 Where Does This Coin Come From? | ㉘ PayPal USD: A Dollar Created by a CompanyImagine PayPal USD’s creation process in an everyday setting: it’s like the printer behind a bank counter. The teller taps a few keys, and a new receipt appears on paper—except here, what gets printed is digital. Many people who first hear about stablecoins assume they’re generated by computers crunching numbers, like Bitcoin. But that’s not how PYUSD works. New PYUSD isn’t “mined”; instead, a licensed company records it directly in its ledger in exchange for the U.S. dollars it receives.
① How is it created?
PYUSD is created through centralized issuance. In plain English, that means one company is responsible for “printing” it, and another is responsible for distributing it. Specifically, Paxos, as the issuer, mints and burns PYUSD; PayPal distributes it to users. You give the issuer a sum of U.S. dollars, and it records that amount in its reserves, then creates an equivalent amount of PYUSD on the blockchain. Conversely, when someone returns PYUSD, the issuer burns the corresponding amount, and the dollars in its reserves decrease accordingly. The reserves consist of U.S. dollars and dollar equivalents—that is, cash and short-term assets that can be easily converted into cash.
🪙 Where Does This Coin Come From? | ㉘ PayPal USD: A Dollar Created by a Company
Imagine PayPal USD’s creation process in an everyday setting: it’s like the printer behind a bank counter. The teller taps a few keys, and a new receipt appears on paper—except here, what gets printed is digital. Many people who first hear about stablecoins assume they’re generated by computers crunching numbers, like Bitcoin. But that’s not how PYUSD works. New PYUSD isn’t “mined”; instead, a licensed company records it directly in its ledger in exchange for the U.S. dollars it receives.
① How is it created?
PYUSD is created through centralized issuance. In plain English, that means one company is responsible for “printing” it, and another is responsible for distributing it. Specifically, Paxos, as the issuer, mints and burns PYUSD; PayPal distributes it to users. You give the issuer a sum of U.S. dollars, and it records that amount in its reserves, then creates an equivalent amount of PYUSD on the blockchain. Conversely, when someone returns PYUSD, the issuer burns the corresponding amount, and the dollars in its reserves decrease accordingly. The reserves consist of U.S. dollars and dollar equivalents—that is, cash and short-term assets that can be easily converted into cash.
① How is it created?
PYUSD is created through centralized issuance. In plain English, that means one company is responsible for “printing” it, and another is responsible for distributing it. Specifically, Paxos, as the issuer, mints and burns PYUSD; PayPal distributes it to users. You give the issuer a sum of U.S. dollars, and it records that amount in its reserves, then creates an equivalent amount of PYUSD on the blockchain. Conversely, when someone returns PYUSD, the issuer burns the corresponding amount, and the dollars in its reserves decrease accordingly. The reserves consist of U.S. dollars and dollar equivalents—that is, cash and short-term assets that can be easily converted into cash.
44
·
--
Article
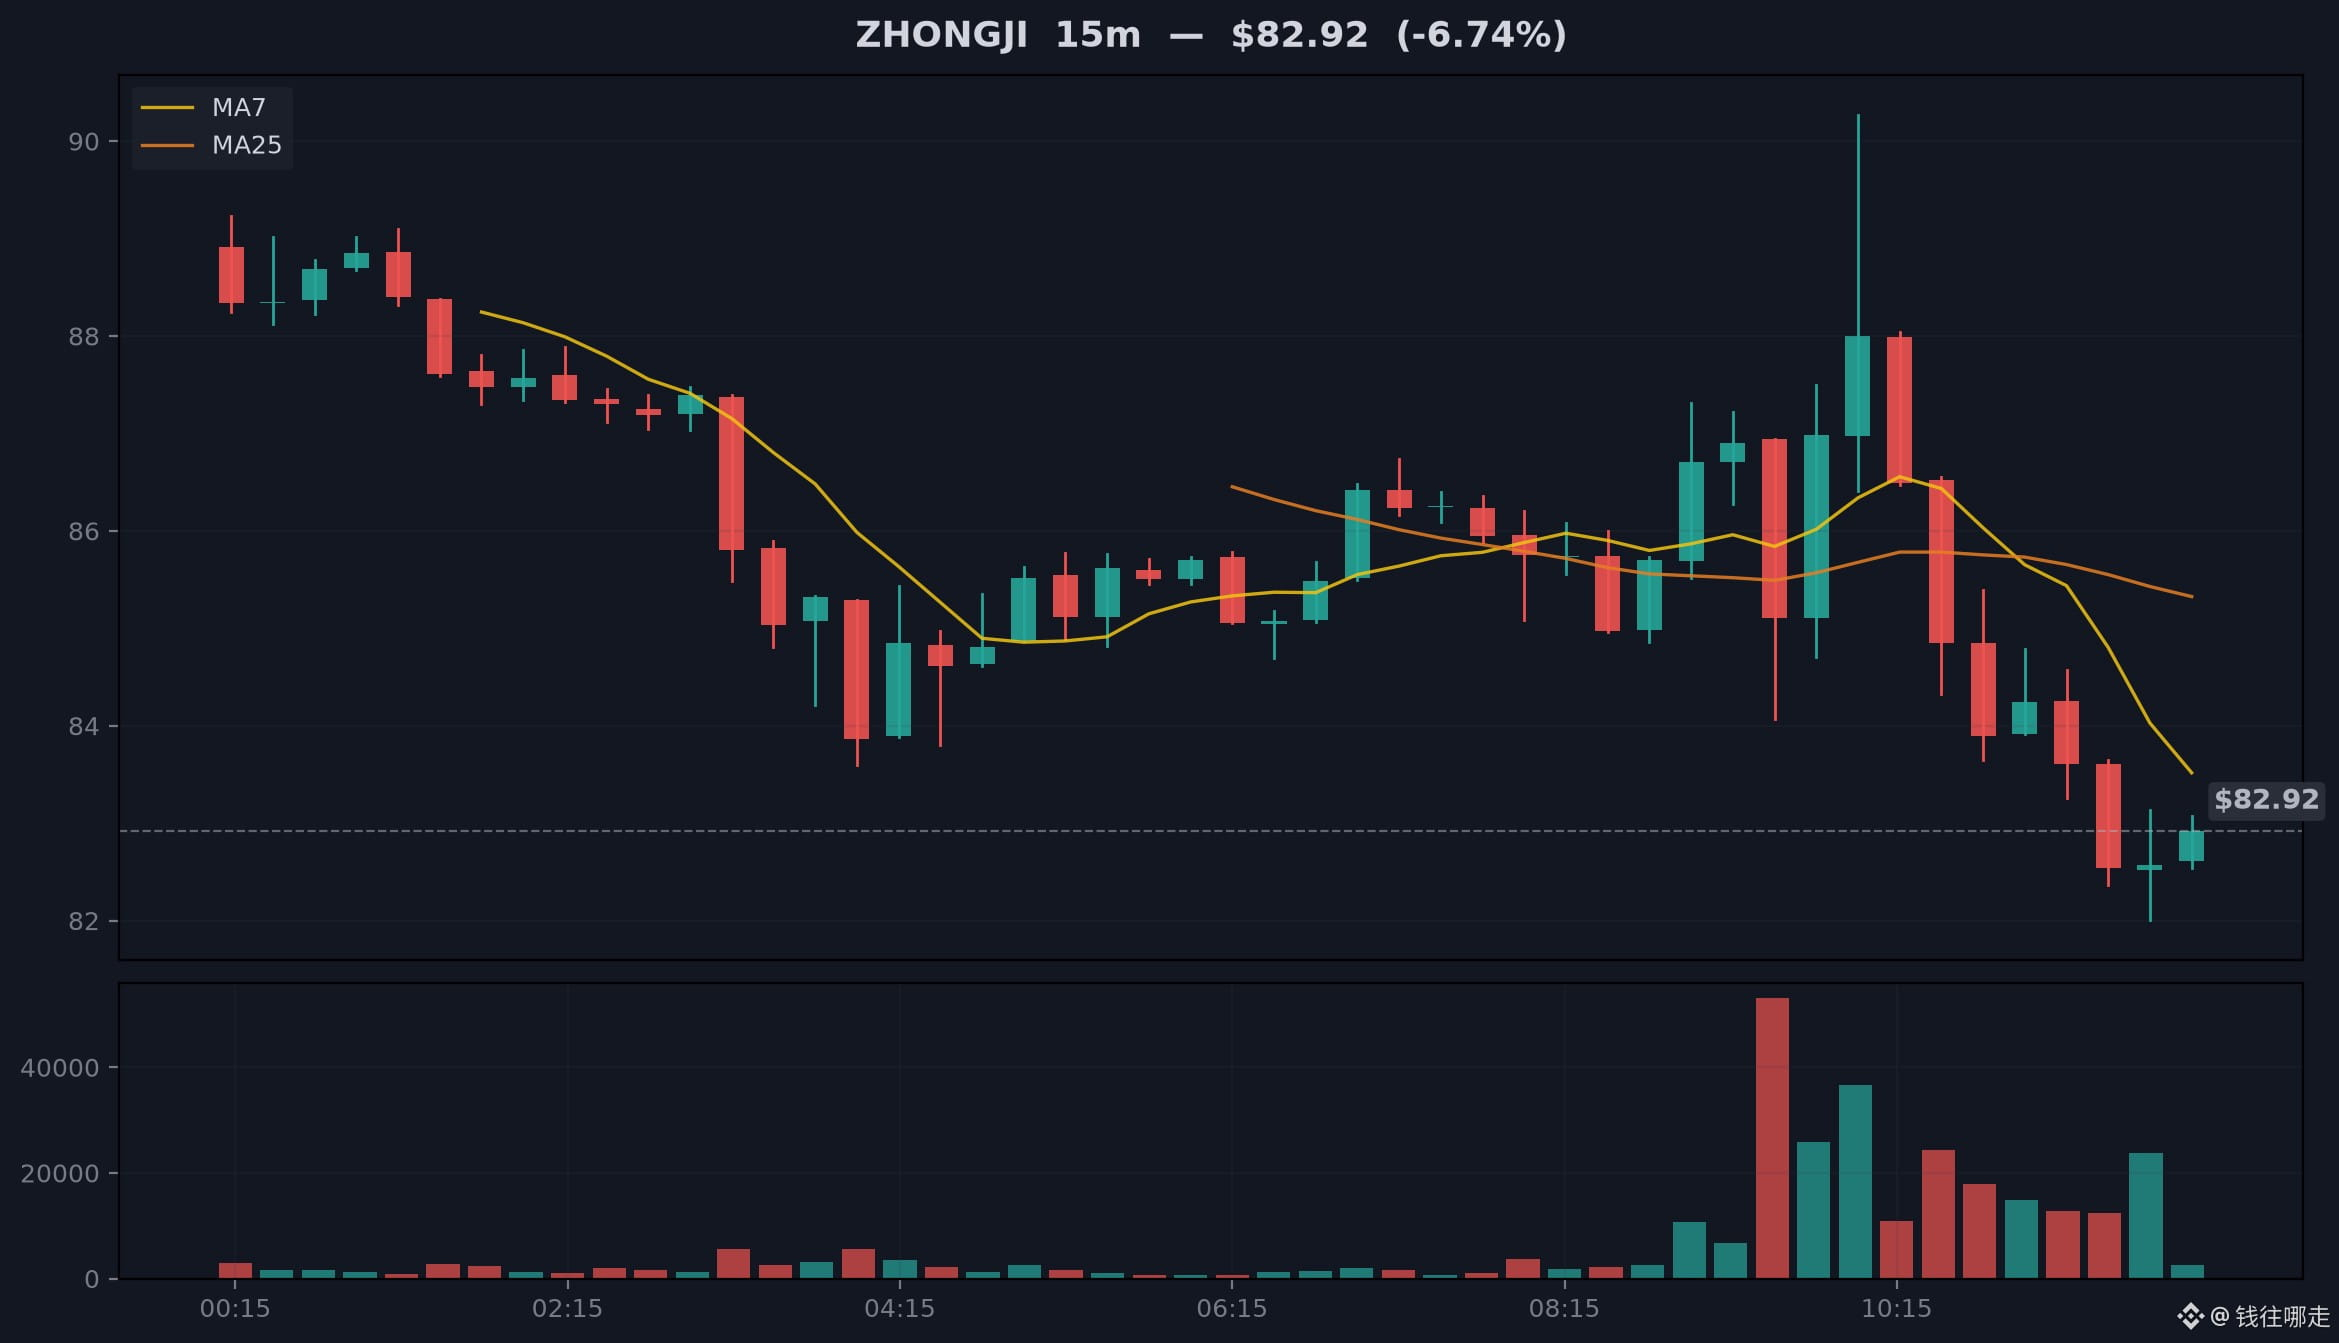
🚀 Is ZHONGJI ready to break out? OI + bullish whale activity, breakout imminentFirst, let's see where the money is flowing. In this downturn, I'm watching just two things.
【Structure】ZHONGJI -12.1%; flows haven't turned around yet — slightly bearish, but unconfirmed. That's all.
📋 Key data
ZHONGJI: Price 82.59, 24h volume 50M.
Taker buy/sell ratio 0.794; sell pressure is weighing on price. OI 1h -1.5%, open interest is falling. Funding rate 0.001526; longs are paying.
Key levels: Above 83.2400, I turn bullish | Below 82.0100, I turn bearish
• Long 444.0 AGTUSDT contracts, average price 0.04, unrealized profit +0.53
A quick look at the broader market. BTC is at 76.8K, down 2.2% over 24 hours.
🚀 Is ZHONGJI ready to break out? OI + bullish whale activity, breakout imminent
First, let's see where the money is flowing. In this downturn, I'm watching just two things.
【Structure】ZHONGJI -12.1%; flows haven't turned around yet — slightly bearish, but unconfirmed. That's all.
📋 Key data
ZHONGJI: Price 82.59, 24h volume 50M.
Taker buy/sell ratio 0.794; sell pressure is weighing on price. OI 1h -1.5%, open interest is falling. Funding rate 0.001526; longs are paying.
Key levels: Above 83.2400, I turn bullish | Below 82.0100, I turn bearish
• Long 444.0 AGTUSDT contracts, average price 0.04, unrealized profit +0.53
A quick look at the broader market. BTC is at 76.8K, down 2.2% over 24 hours.
【Structure】ZHONGJI -12.1%; flows haven't turned around yet — slightly bearish, but unconfirmed. That's all.
📋 Key data
ZHONGJI: Price 82.59, 24h volume 50M.
Taker buy/sell ratio 0.794; sell pressure is weighing on price. OI 1h -1.5%, open interest is falling. Funding rate 0.001526; longs are paying.
Key levels: Above 83.2400, I turn bullish | Below 82.0100, I turn bearish
• Long 444.0 AGTUSDT contracts, average price 0.04, unrealized profit +0.53
A quick look at the broader market. BTC is at 76.8K, down 2.2% over 24 hours.
19
·
--
🪙 Where Does This Coin Come From? | ㉗ USD Coin: How Dollars Become Coins on the Blockchain① How is it created?
Where exactly does USDC come from, and who decides how much of it there is? The answer may be completely different from what you think: there’s no “mining” involved. Behind every $USDC is a real dollar deposited into the issuer’s account. USD Coin (USDC) is issued by a company called Circle, and the process can be broken down into two steps: someone gives Circle dollars or other reserves, and Circle “mints” an equivalent amount of USDC on Ethereum and other blockchains, crediting it to that person. Conversely, when someone wants to exchange USDC back for dollars, Circle “burns” it and pays out the dollars. So the only thing that triggers the creation of new coins is the issuer minting them after receiving reserves—not computing power, collateral, or voting. The issuer claims this mechanism maintains a 1:1 peg to the US dollar, meaning every coin in circulation is backed by reserves worth about one dollar.
🪙 Where Does This Coin Come From? | ㉗ USD Coin: How Dollars Become Coins on the Blockchain
① How is it created?
Where exactly does USDC come from, and who decides how much of it there is? The answer may be completely different from what you think: there’s no “mining” involved. Behind every $USDC is a real dollar deposited into the issuer’s account. USD Coin (USDC) is issued by a company called Circle, and the process can be broken down into two steps: someone gives Circle dollars or other reserves, and Circle “mints” an equivalent amount of USDC on Ethereum and other blockchains, crediting it to that person. Conversely, when someone wants to exchange USDC back for dollars, Circle “burns” it and pays out the dollars. So the only thing that triggers the creation of new coins is the issuer minting them after receiving reserves—not computing power, collateral, or voting. The issuer claims this mechanism maintains a 1:1 peg to the US dollar, meaning every coin in circulation is backed by reserves worth about one dollar.
Where exactly does USDC come from, and who decides how much of it there is? The answer may be completely different from what you think: there’s no “mining” involved. Behind every $USDC is a real dollar deposited into the issuer’s account. USD Coin (USDC) is issued by a company called Circle, and the process can be broken down into two steps: someone gives Circle dollars or other reserves, and Circle “mints” an equivalent amount of USDC on Ethereum and other blockchains, crediting it to that person. Conversely, when someone wants to exchange USDC back for dollars, Circle “burns” it and pays out the dollars. So the only thing that triggers the creation of new coins is the issuer minting them after receiving reserves—not computing power, collateral, or voting. The issuer claims this mechanism maintains a 1:1 peg to the US dollar, meaning every coin in circulation is backed by reserves worth about one dollar.
16
·
--
📖 System Course | Lesson 23 · Where Does the Liquidation Price Come From?Most people select isolated or cross margin and then never touch that setting again. But it actually determines the price at which the system will forcibly take the money in your account. To understand this, we first need to get clear on something more fundamental: how exactly is the liquidation price calculated?
Let’s start with the bottom line. Liquidation happens when your margin falls below the minimum required by the exchange. The system doesn’t wait for your consent—it forcibly closes the position. The liquidation price is the price at which your margin is just depleted and your position is forcibly closed. Note that this means “your margin is depleted,” not “you’ve lost a certain amount.” We’ll take a closer look at the difference later.
📖 System Course | Lesson 23 · Where Does the Liquidation Price Come From?
Most people select isolated or cross margin and then never touch that setting again. But it actually determines the price at which the system will forcibly take the money in your account. To understand this, we first need to get clear on something more fundamental: how exactly is the liquidation price calculated?
Let’s start with the bottom line. Liquidation happens when your margin falls below the minimum required by the exchange. The system doesn’t wait for your consent—it forcibly closes the position. The liquidation price is the price at which your margin is just depleted and your position is forcibly closed. Note that this means “your margin is depleted,” not “you’ve lost a certain amount.” We’ll take a closer look at the difference later.
Let’s start with the bottom line. Liquidation happens when your margin falls below the minimum required by the exchange. The system doesn’t wait for your consent—it forcibly closes the position. The liquidation price is the price at which your margin is just depleted and your position is forcibly closed. Note that this means “your margin is depleted,” not “you’ve lost a certain amount.” We’ll take a closer look at the difference later.
71
·
--
Article
💎 ESPORTS Before the Breakout: OI Accumulation + Bullish Dominance = A Signal Ready to ExplodeFirst, watch where the money is flowing. In this downturn, I’m focused on just two things.
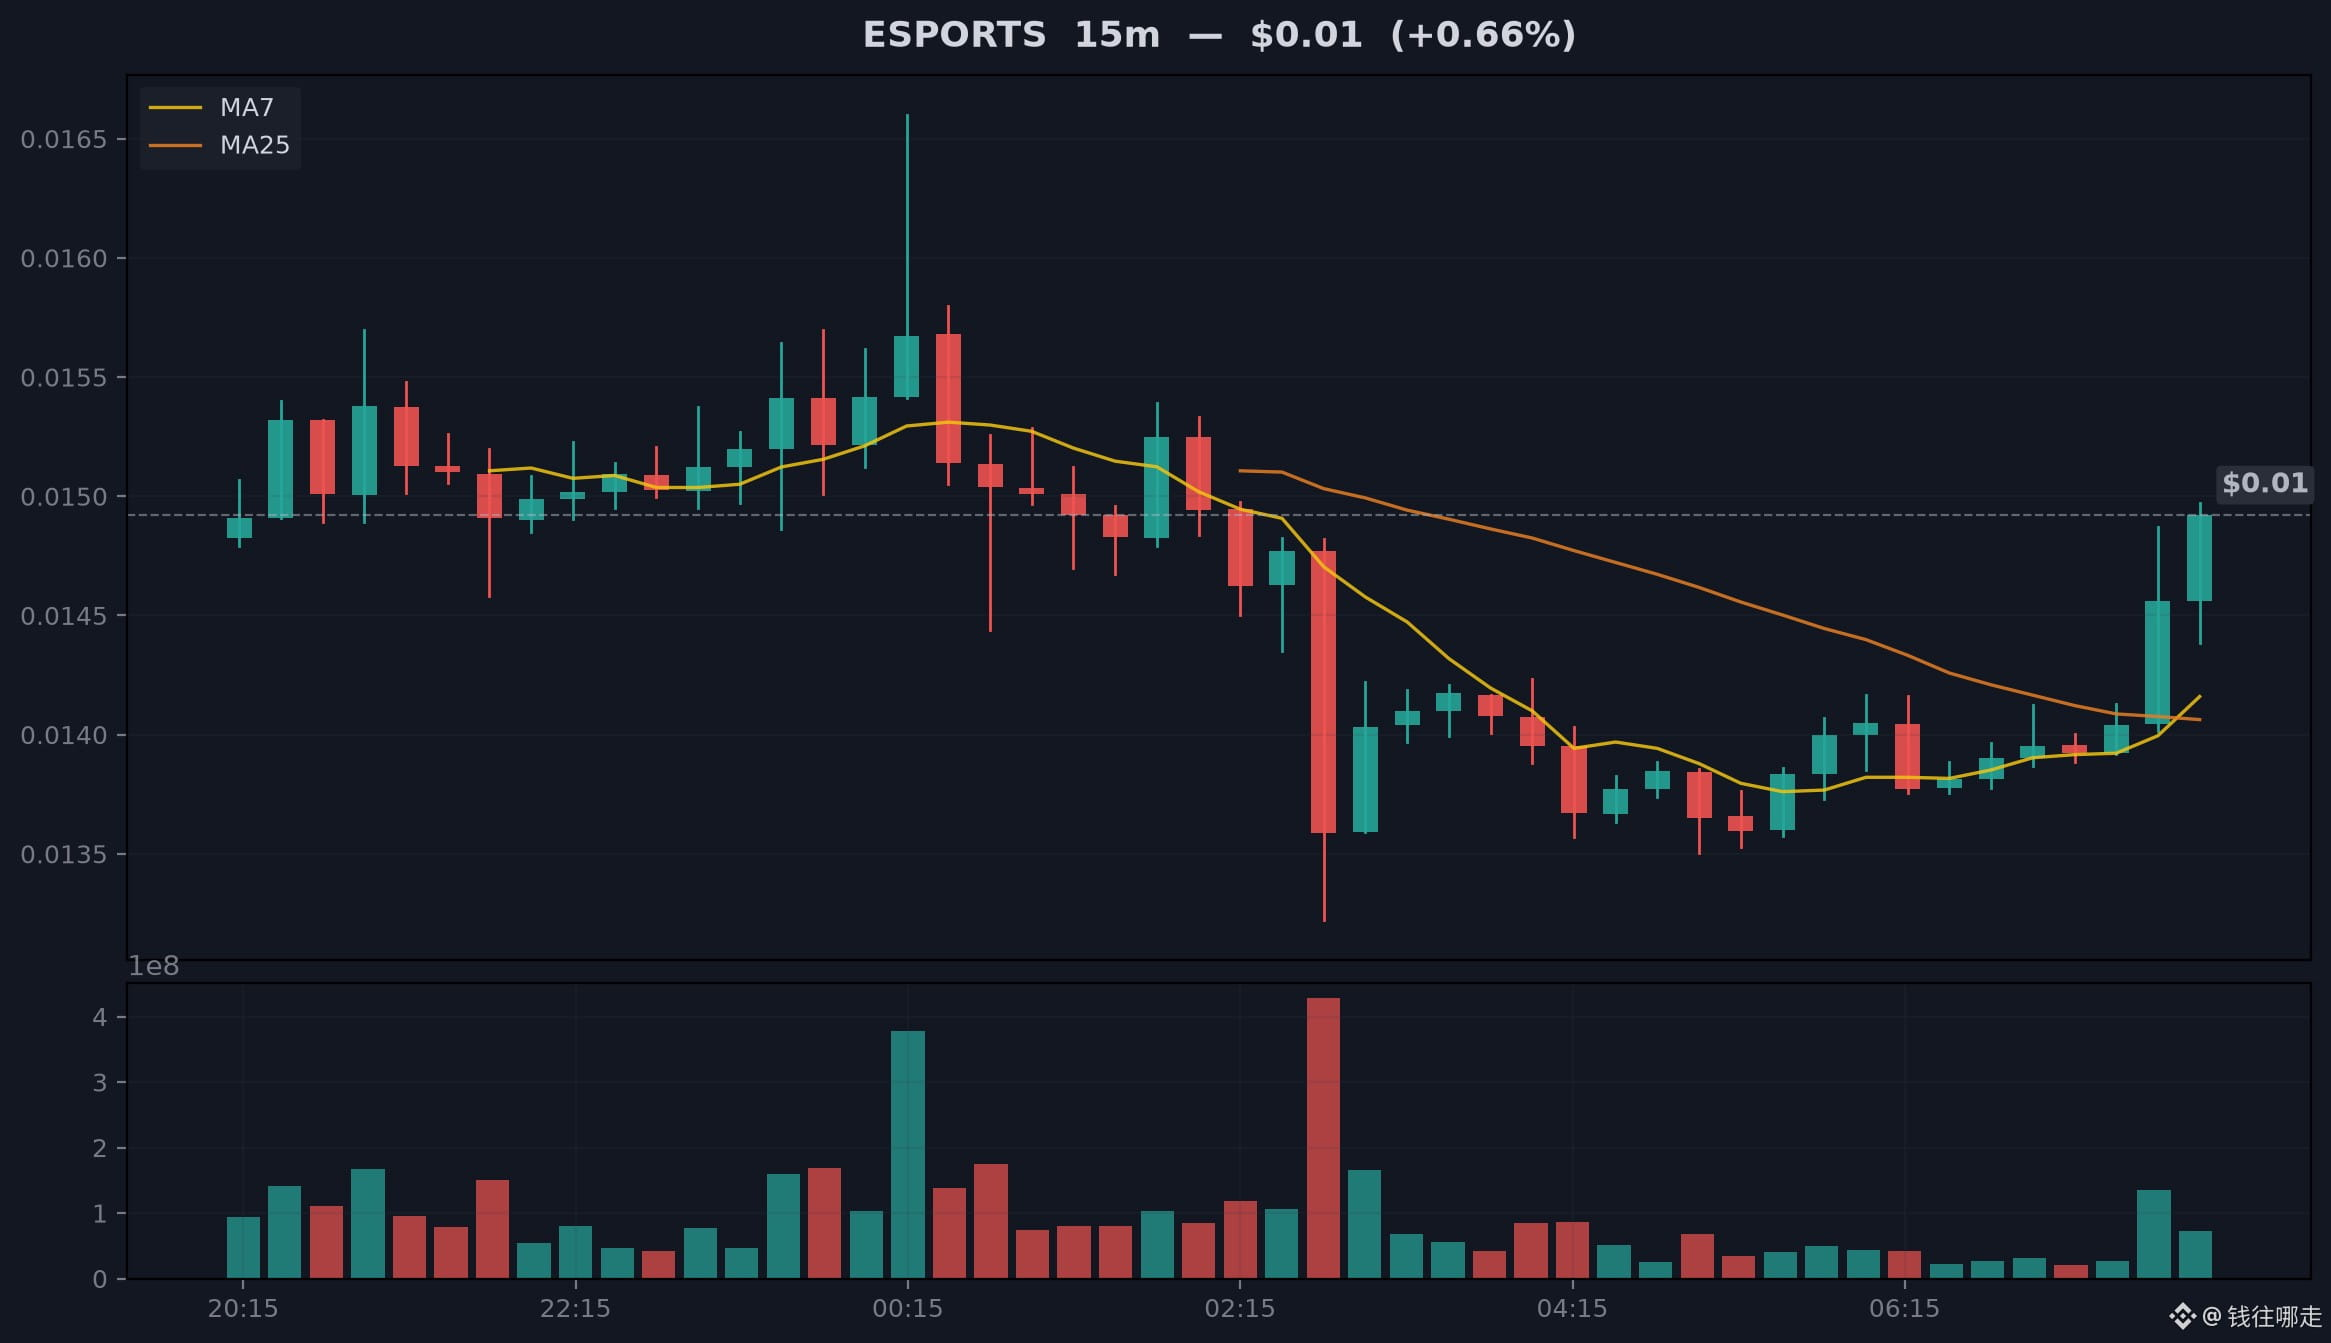
ESPORTS is down 15.94% today, with a trading volume of $254 million. Volume is substantial, but the structure is only slightly bullish and hasn’t been confirmed yet. Here’s my conclusion upfront: I’m not betting on a direction at this level. The reason is that open interest is rising: +3.9% over 1 hour and +5.4% over 3 hours. New money is coming in, and bulls are adding to their positions. The taker buy/sell ratio is 1.295, with taker buys clearly in the lead, which is bullish in the short term—but it’s still unconfirmed. Taken together, these two factors make me reluctant to take a short position. The key levels are support at 0.014482 and resistance at 0.014685: a break below 0.014482 would mean this accumulation has been invalidated, and I’d turn bearish; a move above 0.014685 would mean the anticipated breakout has materialized, and I’d turn bullish. In between, it’s just choppy price action. The Gaming sector sank along with the broader market today; nothing to pick out there. If the data changes, I’ll say so plainly.
💎 ESPORTS Before the Breakout: OI Accumulation + Bullish Dominance = A Signal Ready to Explode
First, watch where the money is flowing. In this downturn, I’m focused on just two things.
ESPORTS is down 15.94% today, with a trading volume of $254 million. Volume is substantial, but the structure is only slightly bullish and hasn’t been confirmed yet. Here’s my conclusion upfront: I’m not betting on a direction at this level. The reason is that open interest is rising: +3.9% over 1 hour and +5.4% over 3 hours. New money is coming in, and bulls are adding to their positions. The taker buy/sell ratio is 1.295, with taker buys clearly in the lead, which is bullish in the short term—but it’s still unconfirmed. Taken together, these two factors make me reluctant to take a short position. The key levels are support at 0.014482 and resistance at 0.014685: a break below 0.014482 would mean this accumulation has been invalidated, and I’d turn bearish; a move above 0.014685 would mean the anticipated breakout has materialized, and I’d turn bullish. In between, it’s just choppy price action. The Gaming sector sank along with the broader market today; nothing to pick out there. If the data changes, I’ll say so plainly.
ESPORTS is down 15.94% today, with a trading volume of $254 million. Volume is substantial, but the structure is only slightly bullish and hasn’t been confirmed yet. Here’s my conclusion upfront: I’m not betting on a direction at this level. The reason is that open interest is rising: +3.9% over 1 hour and +5.4% over 3 hours. New money is coming in, and bulls are adding to their positions. The taker buy/sell ratio is 1.295, with taker buys clearly in the lead, which is bullish in the short term—but it’s still unconfirmed. Taken together, these two factors make me reluctant to take a short position. The key levels are support at 0.014482 and resistance at 0.014685: a break below 0.014482 would mean this accumulation has been invalidated, and I’d turn bearish; a move above 0.014685 would mean the anticipated breakout has materialized, and I’d turn bullish. In between, it’s just choppy price action. The Gaming sector sank along with the broader market today; nothing to pick out there. If the data changes, I’ll say so plainly.
62
·
--
🔎 A few coins I’m watching (11-03 07:08)Top 8 ranked by the fastest 3-hour increase in open interest:
$HAEDALUSDT $EVAAUSDT $MEGAUSDT
1. HAEDALUSDT 0.02869 24h +19.4% Open interest (3h) +8.5% 24h volume 31M 4% below the 24h high
Open interest and price are rising, and plenty of people are chasing. Wait for a pullback before considering it.
2. EVAAUSDT 1.5361 24h +26.2% Open interest (3h) +4.9% 24h volume 88M 4% below the 24h high
Open interest and price are rising, and plenty of people are chasing. Wait for a pullback before considering it.
3. MEGAUSDT 0.04512 24h +3.0% Open interest (3h) +4.9% 24h volume 25M 5% below the 24h high
Open interest and price are rising, and plenty of people are chasing. Wait for a pullback before considering it.
🔎 A few coins I’m watching (11-03 07:08)
Top 8 ranked by the fastest 3-hour increase in open interest:
$HAEDALUSDT $EVAAUSDT $MEGAUSDT
1. HAEDALUSDT 0.02869 24h +19.4% Open interest (3h) +8.5% 24h volume 31M 4% below the 24h high
Open interest and price are rising, and plenty of people are chasing. Wait for a pullback before considering it.
2. EVAAUSDT 1.5361 24h +26.2% Open interest (3h) +4.9% 24h volume 88M 4% below the 24h high
Open interest and price are rising, and plenty of people are chasing. Wait for a pullback before considering it.
3. MEGAUSDT 0.04512 24h +3.0% Open interest (3h) +4.9% 24h volume 25M 5% below the 24h high
Open interest and price are rising, and plenty of people are chasing. Wait for a pullback before considering it.
$HAEDALUSDT $EVAAUSDT $MEGAUSDT
1. HAEDALUSDT 0.02869 24h +19.4% Open interest (3h) +8.5% 24h volume 31M 4% below the 24h high
Open interest and price are rising, and plenty of people are chasing. Wait for a pullback before considering it.
2. EVAAUSDT 1.5361 24h +26.2% Open interest (3h) +4.9% 24h volume 88M 4% below the 24h high
Open interest and price are rising, and plenty of people are chasing. Wait for a pullback before considering it.
3. MEGAUSDT 0.04512 24h +3.0% Open interest (3h) +4.9% 24h volume 25M 5% below the 24h high
Open interest and price are rising, and plenty of people are chasing. Wait for a pullback before considering it.
15
·
--
🔎 A few coins I'm watching (11-03 06:08)Top 8 ranked by the fastest 3-hour increase in open interest:
$HOTUSDT $AGTUSDT $XRPUSDT
1. HOTUSDT 0.0004306 24h +14.9% Open interest 3h +8.8% 24h volume 117M 7% below 24h high
Activity is average; keep it on the radar for now
2. AGTUSDT 0.03398 24h +11.7% Open interest 3h +6.3% 24h volume 37M 6% below 24h high
Activity is average; keep it on the radar for now
3. XRPUSDT 1.2512 24h +0.3% Open interest 3h +6.0% 24h volume 595M 1% below 24h high
Open interest and price are rising, with plenty of buyers chasing. Wait for a pullback before considering it
4. ICNTUSDT 0.1913 24h +9.1% Open interest 3h +5.3% 24h volume 9M 2% below 24h high
🔎 A few coins I'm watching (11-03 06:08)
Top 8 ranked by the fastest 3-hour increase in open interest:
$HOTUSDT $AGTUSDT $XRPUSDT
1. HOTUSDT 0.0004306 24h +14.9% Open interest 3h +8.8% 24h volume 117M 7% below 24h high
Activity is average; keep it on the radar for now
2. AGTUSDT 0.03398 24h +11.7% Open interest 3h +6.3% 24h volume 37M 6% below 24h high
Activity is average; keep it on the radar for now
3. XRPUSDT 1.2512 24h +0.3% Open interest 3h +6.0% 24h volume 595M 1% below 24h high
Open interest and price are rising, with plenty of buyers chasing. Wait for a pullback before considering it
4. ICNTUSDT 0.1913 24h +9.1% Open interest 3h +5.3% 24h volume 9M 2% below 24h high
$HOTUSDT $AGTUSDT $XRPUSDT
1. HOTUSDT 0.0004306 24h +14.9% Open interest 3h +8.8% 24h volume 117M 7% below 24h high
Activity is average; keep it on the radar for now
2. AGTUSDT 0.03398 24h +11.7% Open interest 3h +6.3% 24h volume 37M 6% below 24h high
Activity is average; keep it on the radar for now
3. XRPUSDT 1.2512 24h +0.3% Open interest 3h +6.0% 24h volume 595M 1% below 24h high
Open interest and price are rising, with plenty of buyers chasing. Wait for a pullback before considering it
4. ICNTUSDT 0.1913 24h +9.1% Open interest 3h +5.3% 24h volume 9M 2% below 24h high
10
·
--
🔎 A few coins I'm watching (11-03 05:08)Top 8 ranked by the fastest 3-hour increase in open interest:
$HOTUSDT $AGTUSDT $XRPUSDT
1. HOTUSDT 0.0004544 24h +20.1% Open interest 3h +25.2% 24h volume 108M 2% below 24h high
Open interest is rising and price is climbing; plenty of people are chasing. Wait for a pullback before considering it
2. AGTUSDT 0.03528 24h +16.0% Open interest 3h +7.0% 24h volume 35M 2% below 24h high
Open interest is rising and price is climbing; plenty of people are chasing. Wait for a pullback before considering it
3. XRPUSDT 1.2482 24h -0.1% Open interest 3h +6.4% 24h volume 581M 1% below 24h high
Nothing much happening; just keep it in mind for now
4. GRVTUSDT 0.2224 24h +1.7% Open interest 3h +6.1% 24h volume 12M 11% below 24h high
🔎 A few coins I'm watching (11-03 05:08)
Top 8 ranked by the fastest 3-hour increase in open interest:
$HOTUSDT $AGTUSDT $XRPUSDT
1. HOTUSDT 0.0004544 24h +20.1% Open interest 3h +25.2% 24h volume 108M 2% below 24h high
Open interest is rising and price is climbing; plenty of people are chasing. Wait for a pullback before considering it
2. AGTUSDT 0.03528 24h +16.0% Open interest 3h +7.0% 24h volume 35M 2% below 24h high
Open interest is rising and price is climbing; plenty of people are chasing. Wait for a pullback before considering it
3. XRPUSDT 1.2482 24h -0.1% Open interest 3h +6.4% 24h volume 581M 1% below 24h high
Nothing much happening; just keep it in mind for now
4. GRVTUSDT 0.2224 24h +1.7% Open interest 3h +6.1% 24h volume 12M 11% below 24h high
$HOTUSDT $AGTUSDT $XRPUSDT
1. HOTUSDT 0.0004544 24h +20.1% Open interest 3h +25.2% 24h volume 108M 2% below 24h high
Open interest is rising and price is climbing; plenty of people are chasing. Wait for a pullback before considering it
2. AGTUSDT 0.03528 24h +16.0% Open interest 3h +7.0% 24h volume 35M 2% below 24h high
Open interest is rising and price is climbing; plenty of people are chasing. Wait for a pullback before considering it
3. XRPUSDT 1.2482 24h -0.1% Open interest 3h +6.4% 24h volume 581M 1% below 24h high
Nothing much happening; just keep it in mind for now
4. GRVTUSDT 0.2224 24h +1.7% Open interest 3h +6.1% 24h volume 12M 11% below 24h high
5
·
--
🔎 A few coins I'm watching (11-03 04:08)The top 8 ranked by fastest 3-hour increase in open interest:
$NOMUSDT $HOTUSDT $GRVTUSDT
1. NOMUSDT 0.0016 24h +6.0% Open interest 3h +12.0% 24h volume 9M 7% below 24h high
Nothing much happening; just keeping an eye on it
2. HOTUSDT 0.0004328 24h +13.2% Open interest 3h +11.2% 24h volume 95M 3% below 24h high
Open interest and price are rising, with plenty of people chasing. Wait for a pullback
3. GRVTUSDT 0.243 24h +10.8% Open interest 3h +8.9% 24h volume 8M 2% below 24h high
Open interest and price are rising, with plenty of people chasing. Wait for a pullback
4. XRPUSDT 1.2515 24h +0.3% Open interest 3h +5.6% 24h volume 553M 1% below 24h high
🔎 A few coins I'm watching (11-03 04:08)
The top 8 ranked by fastest 3-hour increase in open interest:
$NOMUSDT $HOTUSDT $GRVTUSDT
1. NOMUSDT 0.0016 24h +6.0% Open interest 3h +12.0% 24h volume 9M 7% below 24h high
Nothing much happening; just keeping an eye on it
2. HOTUSDT 0.0004328 24h +13.2% Open interest 3h +11.2% 24h volume 95M 3% below 24h high
Open interest and price are rising, with plenty of people chasing. Wait for a pullback
3. GRVTUSDT 0.243 24h +10.8% Open interest 3h +8.9% 24h volume 8M 2% below 24h high
Open interest and price are rising, with plenty of people chasing. Wait for a pullback
4. XRPUSDT 1.2515 24h +0.3% Open interest 3h +5.6% 24h volume 553M 1% below 24h high
$NOMUSDT $HOTUSDT $GRVTUSDT
1. NOMUSDT 0.0016 24h +6.0% Open interest 3h +12.0% 24h volume 9M 7% below 24h high
Nothing much happening; just keeping an eye on it
2. HOTUSDT 0.0004328 24h +13.2% Open interest 3h +11.2% 24h volume 95M 3% below 24h high
Open interest and price are rising, with plenty of people chasing. Wait for a pullback
3. GRVTUSDT 0.243 24h +10.8% Open interest 3h +8.9% 24h volume 8M 2% below 24h high
Open interest and price are rising, with plenty of people chasing. Wait for a pullback
4. XRPUSDT 1.2515 24h +0.3% Open interest 3h +5.6% 24h volume 553M 1% below 24h high
9
·
--
🔎 A few coins I'm watching (11-03 03:08)Top 8 ranked by the fastest 3-hour increase in open interest:
$NOMUSDT $HOTUSDT $ACTUSDT
1. NOMUSDT 0.001598 24h +4.9% Open interest 3h +13.8% 24h volume 8M 7% below 24h high
Nothing unusual; just keeping an eye on it for now
2. HOTUSDT 0.0004257 24h +10.5% Open interest 3h +6.7% 24h volume 86M 4% below 24h high
Open interest is rising and price is climbing; plenty of people are chasing it. Wait for a pullback before considering it
3. ACTUSDT 0.008118 24h -0.5% Open interest 3h +5.8% 24h volume 3M 6% below 24h high
Open interest is rising while price is falling, suggesting someone is building positions on the way down
4. GRVTUSDT 0.2383 24h +8.1% Open interest 3h +5.2% 24h volume 5M 1% below 24h high
🔎 A few coins I'm watching (11-03 03:08)
Top 8 ranked by the fastest 3-hour increase in open interest:
$NOMUSDT $HOTUSDT $ACTUSDT
1. NOMUSDT 0.001598 24h +4.9% Open interest 3h +13.8% 24h volume 8M 7% below 24h high
Nothing unusual; just keeping an eye on it for now
2. HOTUSDT 0.0004257 24h +10.5% Open interest 3h +6.7% 24h volume 86M 4% below 24h high
Open interest is rising and price is climbing; plenty of people are chasing it. Wait for a pullback before considering it
3. ACTUSDT 0.008118 24h -0.5% Open interest 3h +5.8% 24h volume 3M 6% below 24h high
Open interest is rising while price is falling, suggesting someone is building positions on the way down
4. GRVTUSDT 0.2383 24h +8.1% Open interest 3h +5.2% 24h volume 5M 1% below 24h high
$NOMUSDT $HOTUSDT $ACTUSDT
1. NOMUSDT 0.001598 24h +4.9% Open interest 3h +13.8% 24h volume 8M 7% below 24h high
Nothing unusual; just keeping an eye on it for now
2. HOTUSDT 0.0004257 24h +10.5% Open interest 3h +6.7% 24h volume 86M 4% below 24h high
Open interest is rising and price is climbing; plenty of people are chasing it. Wait for a pullback before considering it
3. ACTUSDT 0.008118 24h -0.5% Open interest 3h +5.8% 24h volume 3M 6% below 24h high
Open interest is rising while price is falling, suggesting someone is building positions on the way down
4. GRVTUSDT 0.2383 24h +8.1% Open interest 3h +5.2% 24h volume 5M 1% below 24h high
37
·
--
🪙 Where Did This Coin Come From? | Act I: The AI Prophecy (ACT)📌 Rules (the same for every post)
· Buy the one crypto perpetual contract across the entire market with the fastest increase in open interest over 3 hours
· Direction: Ask the model to decide before opening a position (long/short/no trade); for this trade: long
· Position size: 100% of available equity; if the previous trade lost money, or the direction is opposite to the previous trade, open at 100% (1× leverage, hold only one position at a time)
· Close positions manually only; the program won’t close them on its own
· If the loss exceeds $1.50 and the model has turned bearish on this coin ⇒ close the position first, then take the opposite direction at 10%
· Set an opposite-direction stop on the exchange at 15%–35% (based on 3× the hourly volatility; the more volatile it is, the farther away the stop), and it will close the position automatically if the price really drops that far
🪙 Where Did This Coin Come From? | Act I: The AI Prophecy (ACT)
📌 Rules (the same for every post)
· Buy the one crypto perpetual contract across the entire market with the fastest increase in open interest over 3 hours
· Direction: Ask the model to decide before opening a position (long/short/no trade); for this trade: long
· Position size: 100% of available equity; if the previous trade lost money, or the direction is opposite to the previous trade, open at 100% (1× leverage, hold only one position at a time)
· Close positions manually only; the program won’t close them on its own
· If the loss exceeds $1.50 and the model has turned bearish on this coin ⇒ close the position first, then take the opposite direction at 10%
· Set an opposite-direction stop on the exchange at 15%–35% (based on 3× the hourly volatility; the more volatile it is, the farther away the stop), and it will close the position automatically if the price really drops that far
· Buy the one crypto perpetual contract across the entire market with the fastest increase in open interest over 3 hours
· Direction: Ask the model to decide before opening a position (long/short/no trade); for this trade: long
· Position size: 100% of available equity; if the previous trade lost money, or the direction is opposite to the previous trade, open at 100% (1× leverage, hold only one position at a time)
· Close positions manually only; the program won’t close them on its own
· If the loss exceeds $1.50 and the model has turned bearish on this coin ⇒ close the position first, then take the opposite direction at 10%
· Set an opposite-direction stop on the exchange at 15%–35% (based on 3× the hourly volatility; the more volatile it is, the farther away the stop), and it will close the position automatically if the price really drops that far
36
·
--
🪙 How this coin came about | UAI (UAI)📌 Rules (the same for every post)
· Across the entire crypto perpetual-futures market, buy whichever coin has the fastest-rising open interest over the past 3 hours
· Direction: Before opening a position, let the model decide whether to go long, go short, or sit out. For this trade: short
· Position size: 10% of available equity ×; if the previous trade lost money, or the direction is opposite to the previous trade, open at 20% × (1x leverage, hold only one position at a time)
· Close positions manually only; the program won’t close them on its own
· If the loss exceeds $1.50 and the model has turned bearish on this coin ⇒ close the position first, then open a position in the opposite direction at 10%
· Place an exchange-side stop order 15%–35% in the opposite direction (based on 3× the hourly volatility; the more volatile, the farther away). If the price really reaches that level, the exchange closes the position automatically
🪙 How this coin came about | UAI (UAI)
📌 Rules (the same for every post)
· Across the entire crypto perpetual-futures market, buy whichever coin has the fastest-rising open interest over the past 3 hours
· Direction: Before opening a position, let the model decide whether to go long, go short, or sit out. For this trade: short
· Position size: 10% of available equity ×; if the previous trade lost money, or the direction is opposite to the previous trade, open at 20% × (1x leverage, hold only one position at a time)
· Close positions manually only; the program won’t close them on its own
· If the loss exceeds $1.50 and the model has turned bearish on this coin ⇒ close the position first, then open a position in the opposite direction at 10%
· Place an exchange-side stop order 15%–35% in the opposite direction (based on 3× the hourly volatility; the more volatile, the farther away). If the price really reaches that level, the exchange closes the position automatically
· Across the entire crypto perpetual-futures market, buy whichever coin has the fastest-rising open interest over the past 3 hours
· Direction: Before opening a position, let the model decide whether to go long, go short, or sit out. For this trade: short
· Position size: 10% of available equity ×; if the previous trade lost money, or the direction is opposite to the previous trade, open at 20% × (1x leverage, hold only one position at a time)
· Close positions manually only; the program won’t close them on its own
· If the loss exceeds $1.50 and the model has turned bearish on this coin ⇒ close the position first, then open a position in the opposite direction at 10%
· Place an exchange-side stop order 15%–35% in the opposite direction (based on 3× the hourly volatility; the more volatile, the farther away). If the price really reaches that level, the exchange closes the position automatically
40
·
--
🔥 Hot Topic Explainer | 【What’s Behind ARIA’s 45% Surge in One Day?】It’s me again. When a coin surges, first look at where the money is coming from.
Bottom line: $ARIA rose from a low of $0.082 to a high of $0.135 over the past 24 hours, a gain of more than 45%, with trading volume of around $142 million. That’s no longer a minor move—it means money on a scale that makes it a market-wide hotspot is flowing in and out.
ARIA is in the small-cap token category, priced at only around $0.12, with a relatively small market cap. These coins have a “small boat, easy to turn” quality: a trade worth a few million dollars barely makes a ripple in Bitcoin, but can push ARIA’s price up significantly. That’s why its volatility is naturally more extreme than that of major coins—the difficulty of rising 45% is the same as falling 45%.
🔥 Hot Topic Explainer | 【What’s Behind ARIA’s 45% Surge in One Day?】
It’s me again. When a coin surges, first look at where the money is coming from.
Bottom line: $ARIA rose from a low of $0.082 to a high of $0.135 over the past 24 hours, a gain of more than 45%, with trading volume of around $142 million. That’s no longer a minor move—it means money on a scale that makes it a market-wide hotspot is flowing in and out.
ARIA is in the small-cap token category, priced at only around $0.12, with a relatively small market cap. These coins have a “small boat, easy to turn” quality: a trade worth a few million dollars barely makes a ripple in Bitcoin, but can push ARIA’s price up significantly. That’s why its volatility is naturally more extreme than that of major coins—the difficulty of rising 45% is the same as falling 45%.
Bottom line: $ARIA rose from a low of $0.082 to a high of $0.135 over the past 24 hours, a gain of more than 45%, with trading volume of around $142 million. That’s no longer a minor move—it means money on a scale that makes it a market-wide hotspot is flowing in and out.
ARIA is in the small-cap token category, priced at only around $0.12, with a relatively small market cap. These coins have a “small boat, easy to turn” quality: a trade worth a few million dollars barely makes a ripple in Bitcoin, but can push ARIA’s price up significantly. That’s why its volatility is naturally more extreme than that of major coins—the difficulty of rising 45% is the same as falling 45%.
60
·
--
Article
💎 The Calm Before BIRB’s Breakout: OI Accumulation + Bullish Edge = A Signal Ready to ExplodeIt's me again. When something is rallying hard, first look at where the money is coming from.
Let me start with my take on BIRB: the structure leans slightly bullish, but it’s not confirmed, so I’m not rushing to call it. The current price is 0.07998, up 2.50% over 24 hours, with $32.7 million in trading volume—there’s activity. What makes me want to take a closer look is open interest: up 1.2% over 1 hour and 4.3% over 3 hours. Open interest is rising, which means new money is coming in. That’s the interpretation I’m going with. But the taker buy/sell ratio is 0.968, with selling pressure weighing on the market. More buyers doesn’t necessarily mean aggressive buying—the two sides are still fairly balanced, so price has to show us the direction. I’m watching the key levels closely: if it breaks below 0.07951, this bullish structure is invalidated and I’ll turn bearish; only a move above 0.08047 would confirm it, and I’ll turn bullish. In between, I’d rather stay out than guess. There are 135 coins in the Alpha sector, 22.2% are up, and the sector average is -2.4%. The sector itself isn’t giving me a directional signal, so this is all about BIRB. Honestly, this kind of pre-breakout accumulation pattern is the easiest to get fooled by. I’ve been burned before, and if the data changes, I’ll post about it on the Square right away. Do you hold any BIRB? What’s your entry price? Let’s talk in the comments.
💎 The Calm Before BIRB’s Breakout: OI Accumulation + Bullish Edge = A Signal Ready to Explode
It's me again. When something is rallying hard, first look at where the money is coming from.
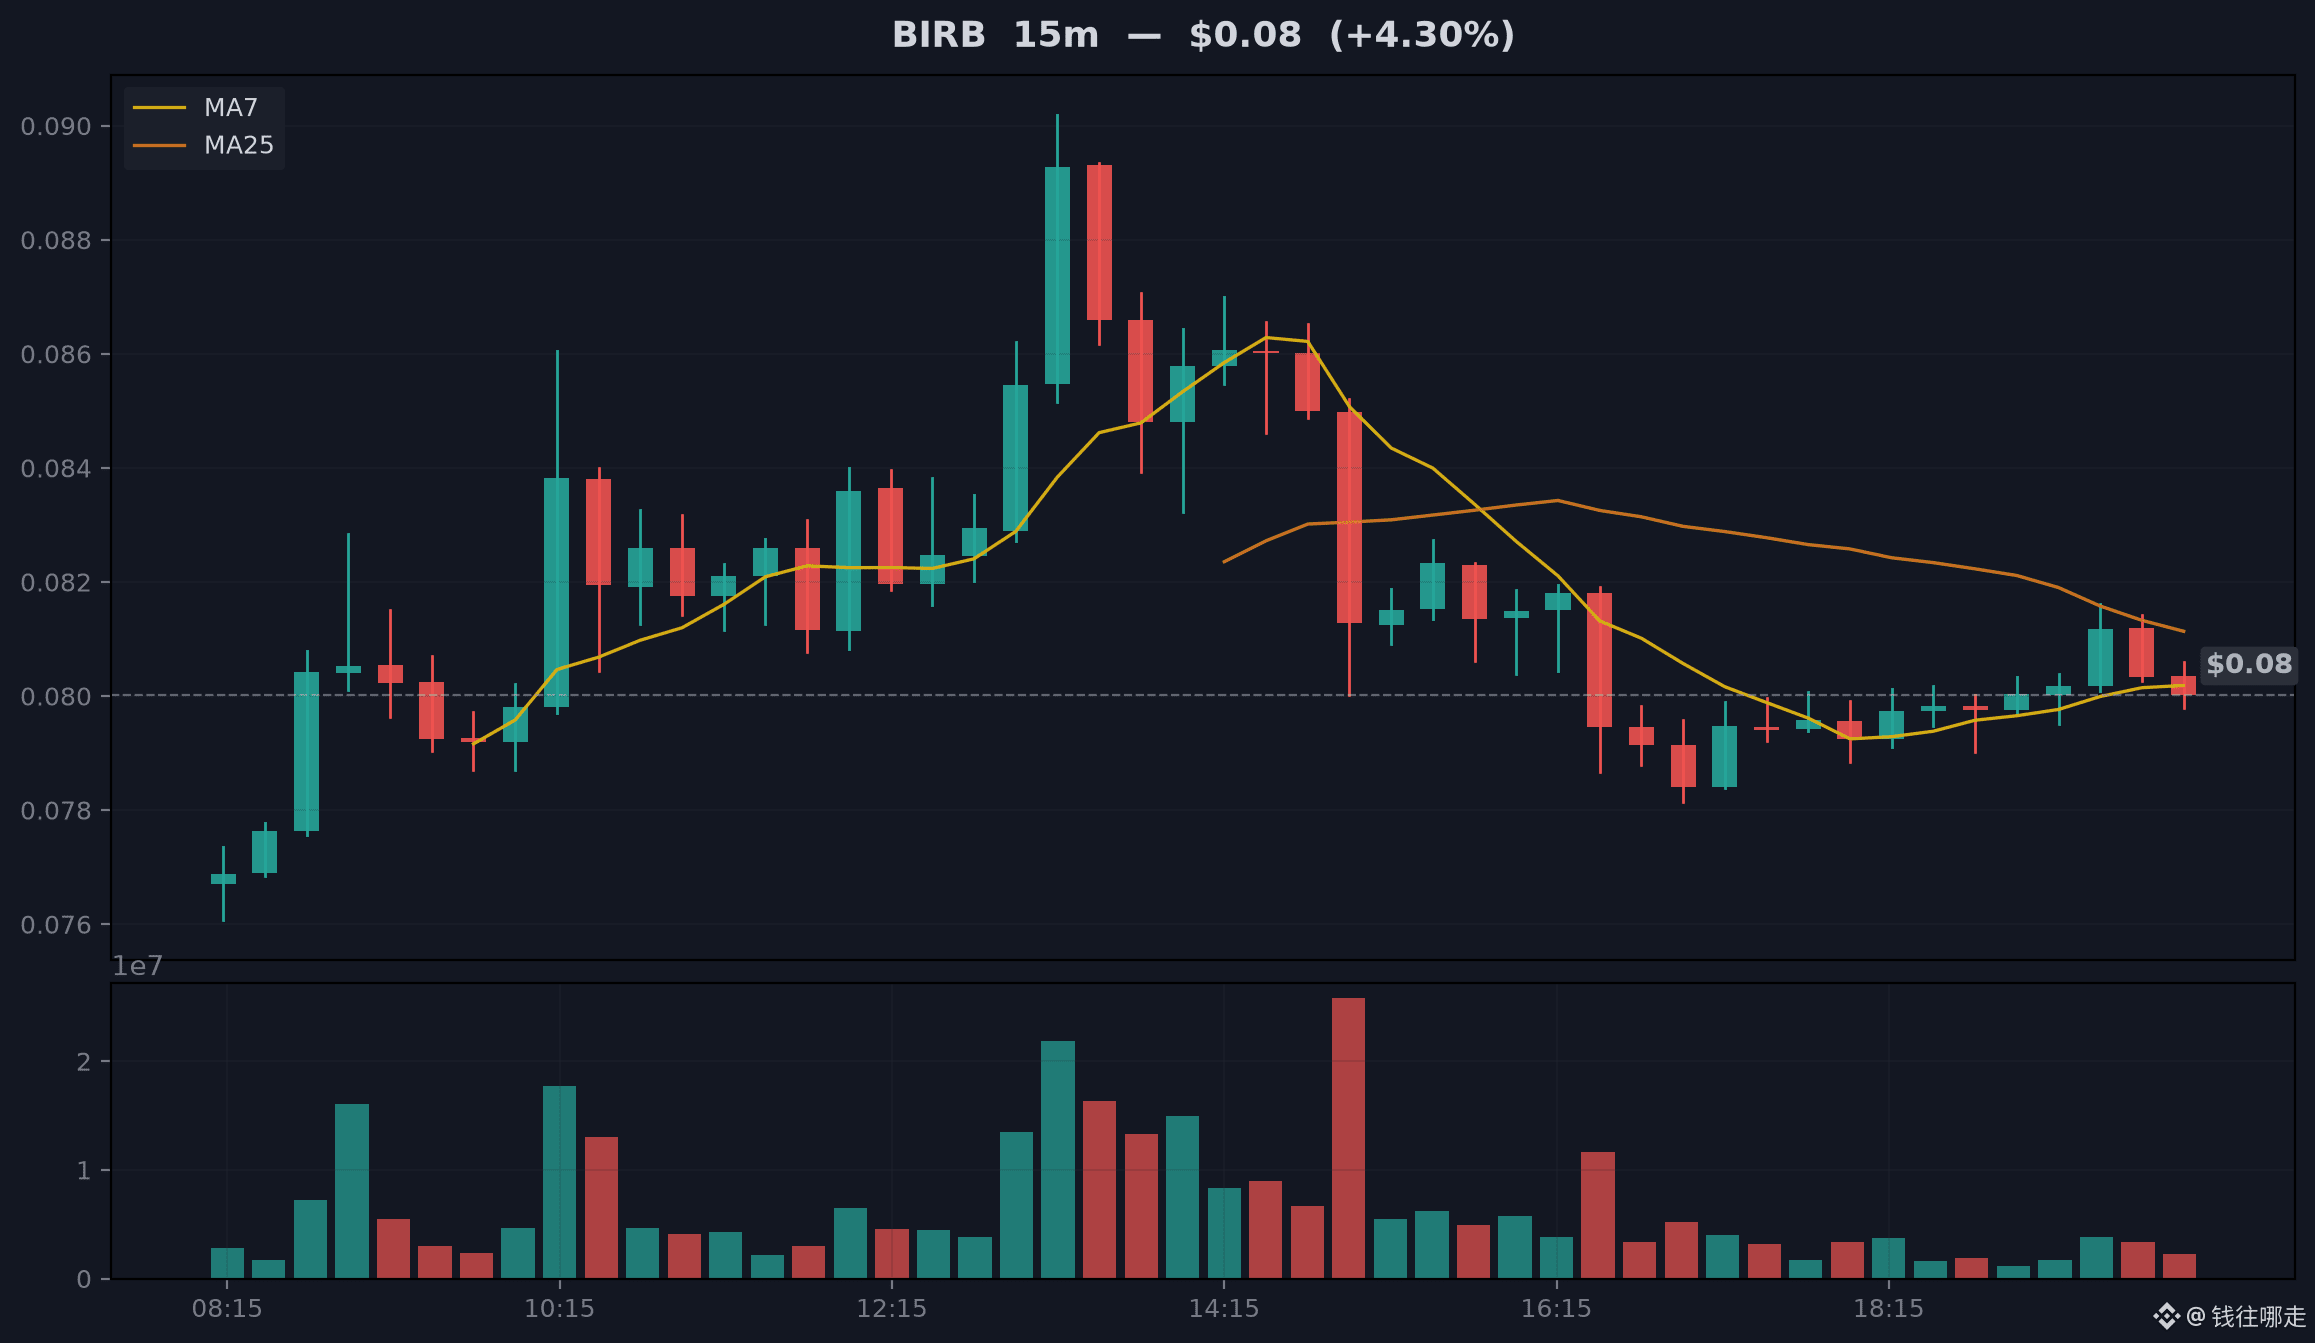
Let me start with my take on BIRB: the structure leans slightly bullish, but it’s not confirmed, so I’m not rushing to call it. The current price is 0.07998, up 2.50% over 24 hours, with $32.7 million in trading volume—there’s activity. What makes me want to take a closer look is open interest: up 1.2% over 1 hour and 4.3% over 3 hours. Open interest is rising, which means new money is coming in. That’s the interpretation I’m going with. But the taker buy/sell ratio is 0.968, with selling pressure weighing on the market. More buyers doesn’t necessarily mean aggressive buying—the two sides are still fairly balanced, so price has to show us the direction. I’m watching the key levels closely: if it breaks below 0.07951, this bullish structure is invalidated and I’ll turn bearish; only a move above 0.08047 would confirm it, and I’ll turn bullish. In between, I’d rather stay out than guess. There are 135 coins in the Alpha sector, 22.2% are up, and the sector average is -2.4%. The sector itself isn’t giving me a directional signal, so this is all about BIRB. Honestly, this kind of pre-breakout accumulation pattern is the easiest to get fooled by. I’ve been burned before, and if the data changes, I’ll post about it on the Square right away. Do you hold any BIRB? What’s your entry price? Let’s talk in the comments.
Let me start with my take on BIRB: the structure leans slightly bullish, but it’s not confirmed, so I’m not rushing to call it. The current price is 0.07998, up 2.50% over 24 hours, with $32.7 million in trading volume—there’s activity. What makes me want to take a closer look is open interest: up 1.2% over 1 hour and 4.3% over 3 hours. Open interest is rising, which means new money is coming in. That’s the interpretation I’m going with. But the taker buy/sell ratio is 0.968, with selling pressure weighing on the market. More buyers doesn’t necessarily mean aggressive buying—the two sides are still fairly balanced, so price has to show us the direction. I’m watching the key levels closely: if it breaks below 0.07951, this bullish structure is invalidated and I’ll turn bearish; only a move above 0.08047 would confirm it, and I’ll turn bullish. In between, I’d rather stay out than guess. There are 135 coins in the Alpha sector, 22.2% are up, and the sector average is -2.4%. The sector itself isn’t giving me a directional signal, so this is all about BIRB. Honestly, this kind of pre-breakout accumulation pattern is the easiest to get fooled by. I’ve been burned before, and if the data changes, I’ll post about it on the Square right away. Do you hold any BIRB? What’s your entry price? Let’s talk in the comments.
19
Log in to explore more content
Join global crypto users on Binance Square
⚡️ Get latest and useful information about crypto.
💬 Trusted by the world’s largest crypto exchange.
👍 Discover real insights from verified creators.
Email / Phone number
Trending Topics
USMidterms-WhatAreMarketsExpecting?
67,744 views
658 Discussing
Democratic Congressional Sweep Shakes Trump Trades in AI Stocks and Crypto
Binance News
·9 Likes
·3.9k views
USOctoberNFP-AreRateCutsStillPossible
235,352 views
1,864 Discussing
AMDBeatsExpectations-AINarrativeContinues
15,521 views
245 Discussing