
Amr_faras 2024
180 Posts

Amr_faras 2024
Open Trade
Frequent Trader
2.6 Years
4 Following
30 Followers
98 Liked
Posts
Portfolio
All
Quotes
#SOMI
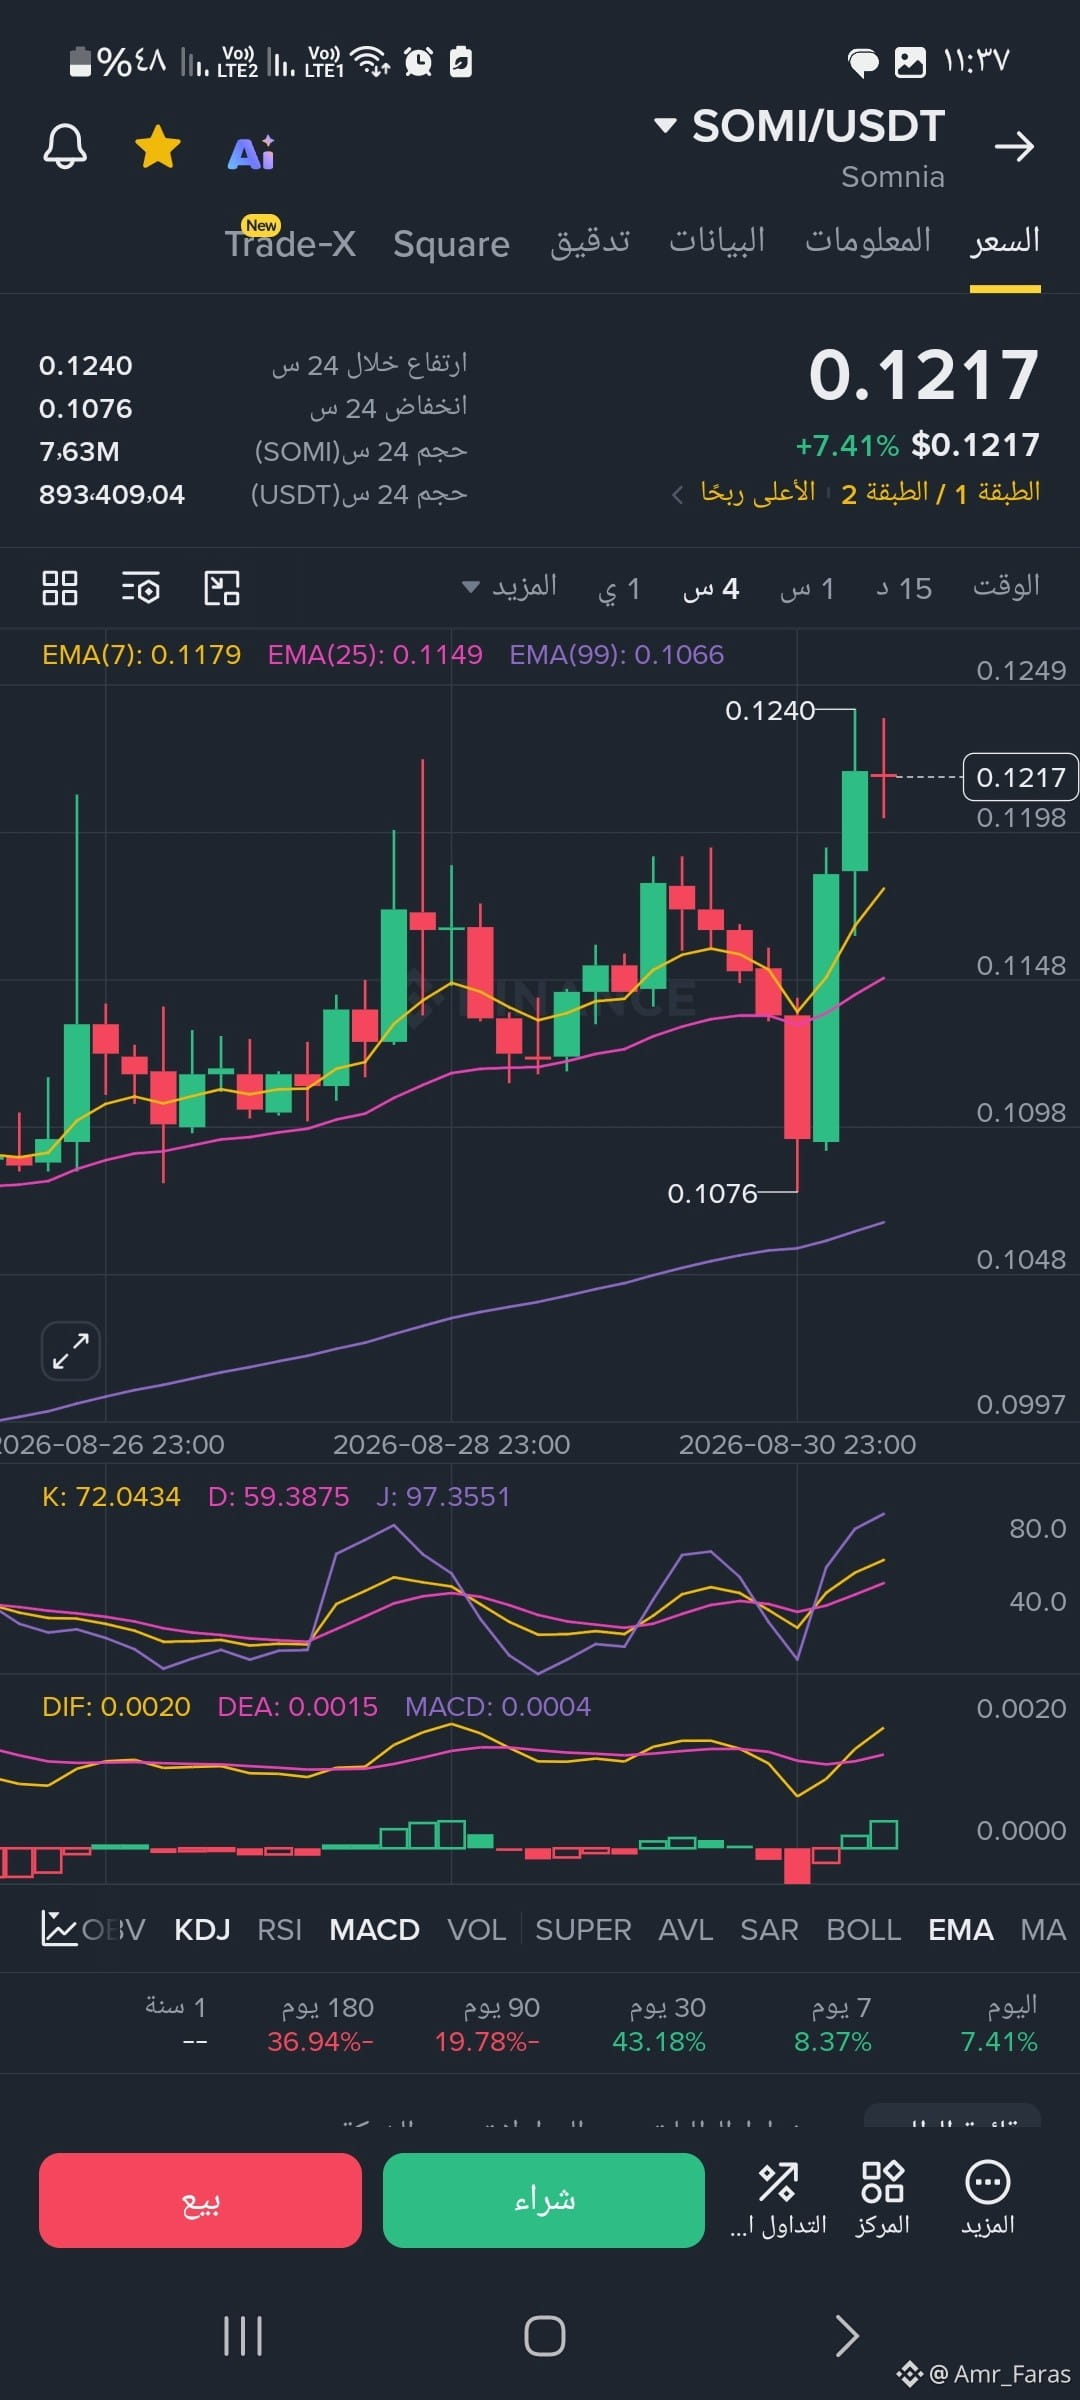
📌 Summary and upcoming movement forecasts: Positive scenario (upward): If the price manages to break above the previous nearby high at 0.1240 USDT and hold above it, the next target may move toward levels 0.1280 - 0.1300 USDT. Negative scenario (correction): If the price encounters resistance at the current high and profit-taking occurs, the expected nearby support levels for the rebound are 0.1180 USDT (EMA 7 line), followed by stronger support at 0.1150 USDT.
*** Current trend: The price is in an upward path in the short term, where we notice the formation of two rising lows (the area around 0.1076, followed by the strong recent surge). Last candles: A strong, full green candle is visible, reflecting clear control by buyers (buying momentum is strong right now).
📌 Summary and upcoming movement forecasts: Positive scenario (upward): If the price manages to break above the previous nearby high at 0.1240 USDT and hold above it, the next target may move toward levels 0.1280 - 0.1300 USDT. Negative scenario (correction): If the price encounters resistance at the current high and profit-taking occurs, the expected nearby support levels for the rebound are 0.1180 USDT (EMA 7 line), followed by stronger support at 0.1150 USDT.
*** Current trend: The price is in an upward path in the short term, where we notice the formation of two rising lows (the area around 0.1076, followed by the strong recent surge). Last candles: A strong, full green candle is visible, reflecting clear control by buyers (buying momentum is strong right now).
#COOKIE
Technical Indicators (Momentum and Liquidity)
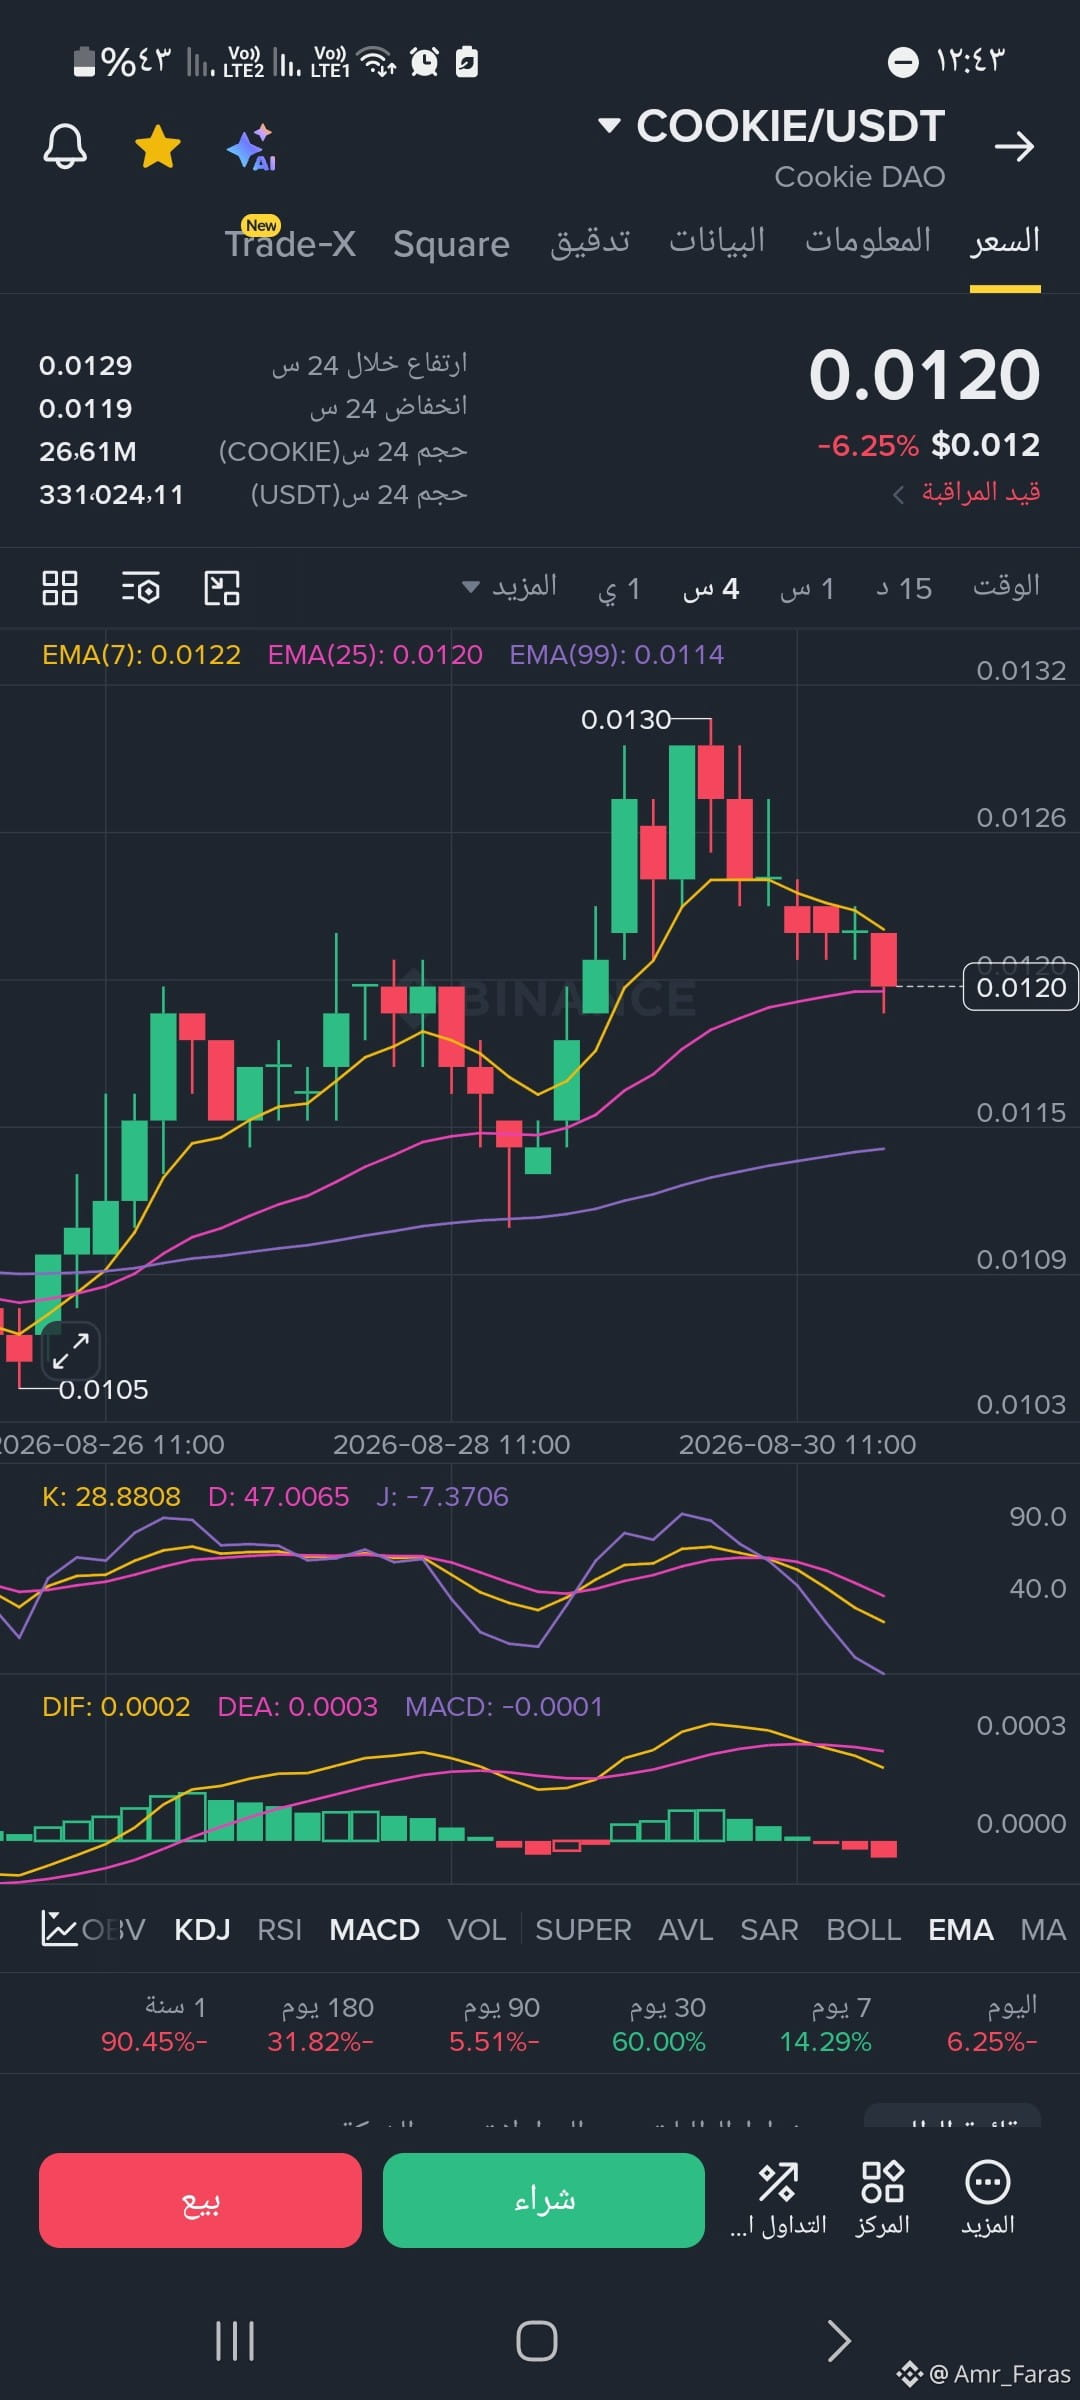
KDJ Indicator: The K (purple) line crosses downward with the D line and heads toward levels 40.0 and 28.8. This bearish crossover reflects the continuation of the current downward momentum, but it is gradually approaching oversold areas.
MACD Indicator:
Lines: The DIF line (0.0002) and the DEA line (0.0003) are very close to each other and above the zero line, which means the overall uptrend has not ended completely, but its strength is weakening (weaker momentum).
Histogram: The bars have started turning red below the zero line by a value around -0.0001-, suggesting the likelihood of continued sideways-to-bearish oscillation in the short term
Technical Indicators (Momentum and Liquidity)
KDJ Indicator: The K (purple) line crosses downward with the D line and heads toward levels 40.0 and 28.8. This bearish crossover reflects the continuation of the current downward momentum, but it is gradually approaching oversold areas.
MACD Indicator:
Lines: The DIF line (0.0002) and the DEA line (0.0003) are very close to each other and above the zero line, which means the overall uptrend has not ended completely, but its strength is weakening (weaker momentum).
Histogram: The bars have started turning red below the zero line by a value around -0.0001-, suggesting the likelihood of continued sideways-to-bearish oscillation in the short term
#Ong
Expected Support and Resistance Levels
Resistance Levels (if price rebounds upward):
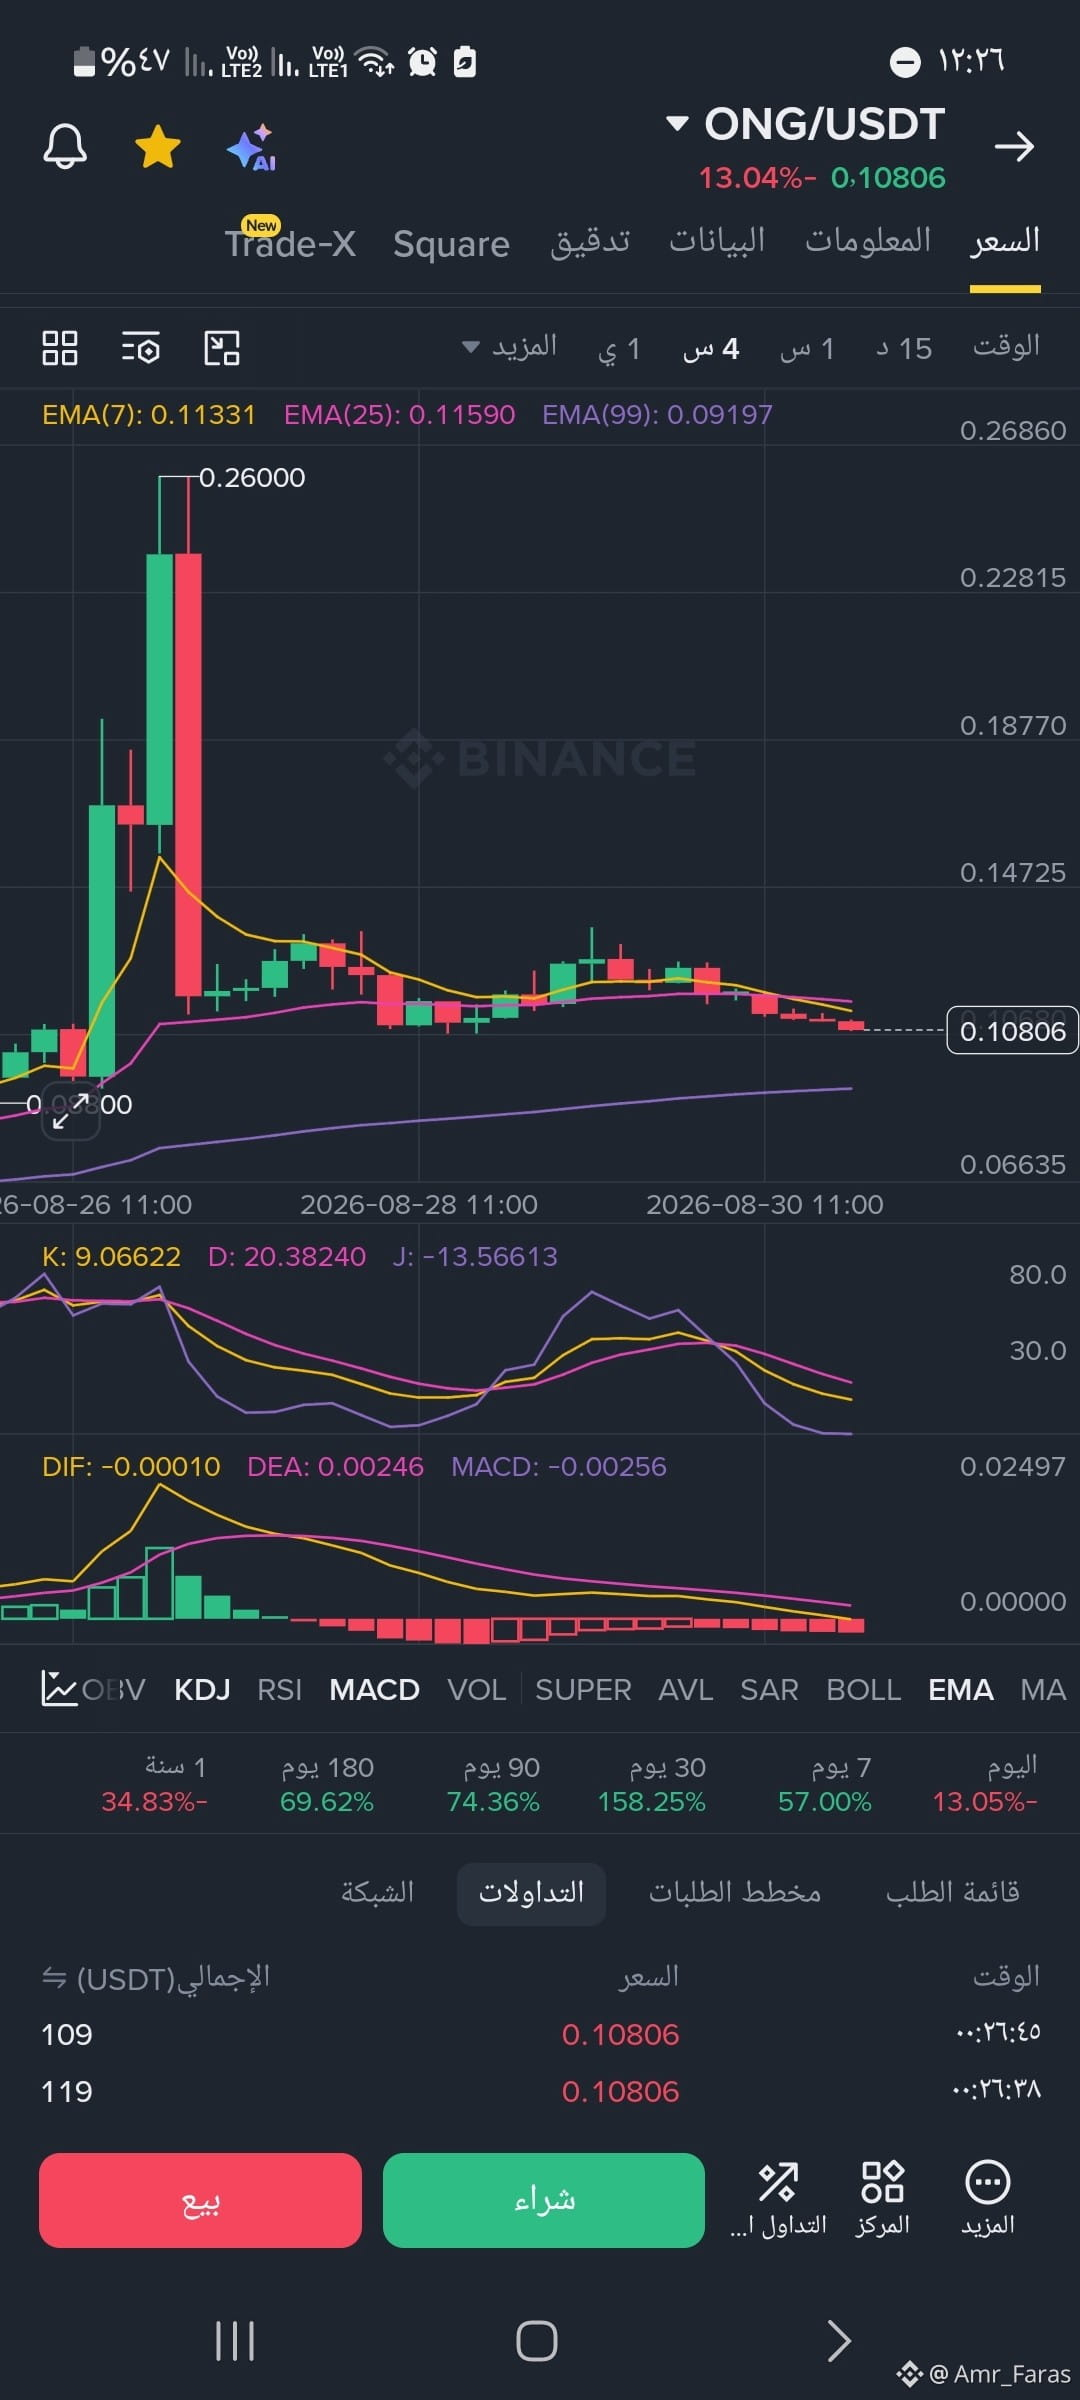
First Resistance: 0.11331 to 0.11590 (the zone of the moving averages that turned into dynamic resistance points).
Second Resistance: Psychological resistance levels near 0.14725.
Support Levels (if the decline continues):
First Support: 0.09197 (supported by the EMA 99 average), and it is considered a very important rebound zone for maintaining the market structure.
Second Support: The previous lows shown on the chart around the levels
Expected Support and Resistance Levels
Resistance Levels (if price rebounds upward):
First Resistance: 0.11331 to 0.11590 (the zone of the moving averages that turned into dynamic resistance points).
Second Resistance: Psychological resistance levels near 0.14725.
Support Levels (if the decline continues):
First Support: 0.09197 (supported by the EMA 99 average), and it is considered a very important rebound zone for maintaining the market structure.
Second Support: The previous lows shown on the chart around the levels
#SCR
📌 Expected Support and Resistance Levels
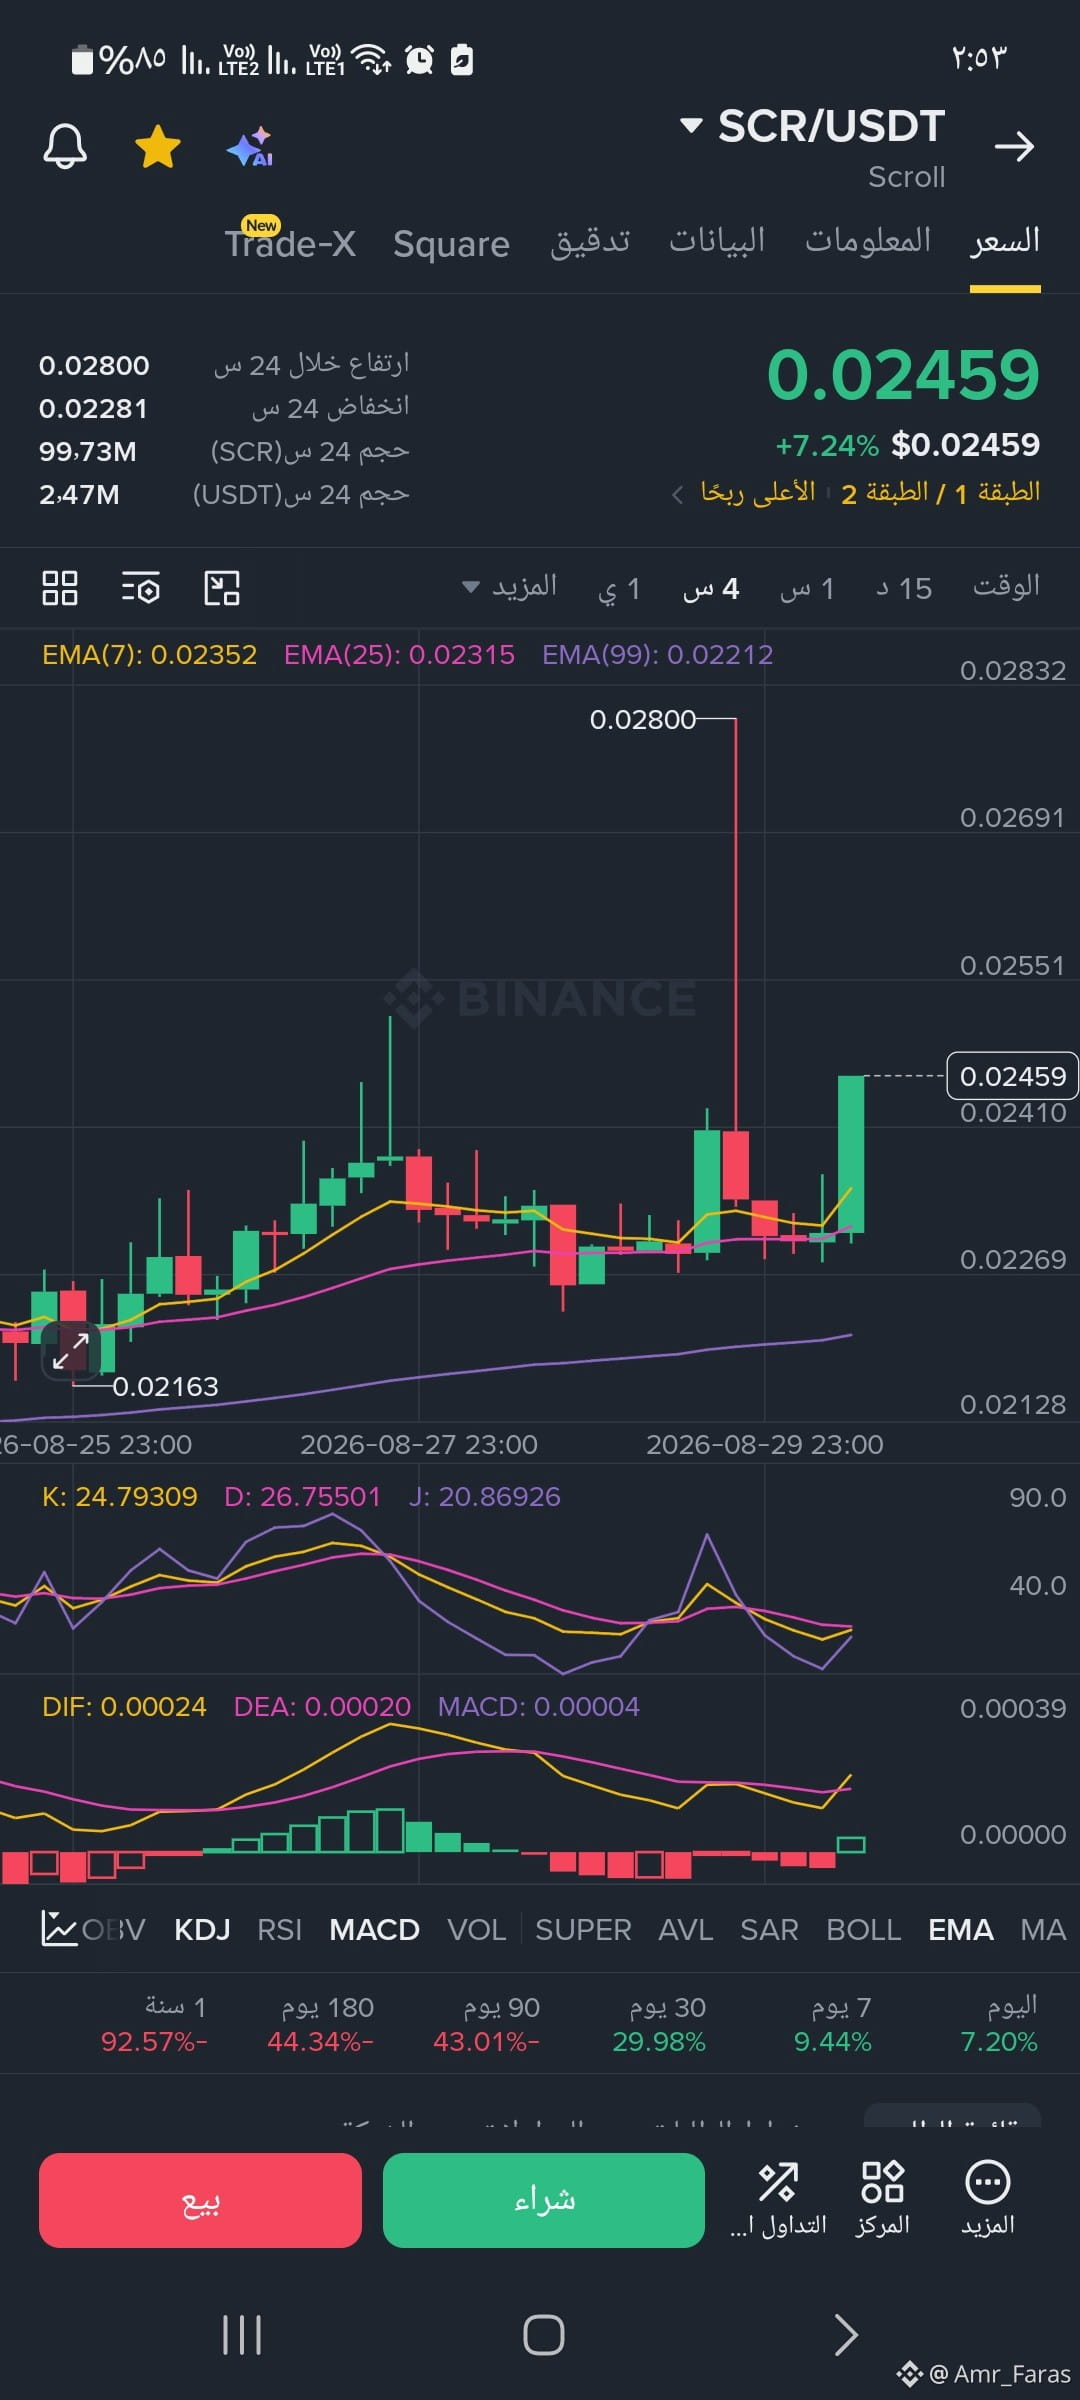
Near Resistance: The previous peak that the price attempted to test recently, near the level of 0.02691 USDT, reaching the most prominent peak shown on the chart at 0.02800 USDT.
Near Support: The level at 0.02350 USDT (supported by the EMA 7), followed by the stronger support level at 0.02163 USDT.
📌 Expected Support and Resistance Levels
Near Resistance: The previous peak that the price attempted to test recently, near the level of 0.02691 USDT, reaching the most prominent peak shown on the chart at 0.02800 USDT.
Near Support: The level at 0.02350 USDT (supported by the EMA 7), followed by the stronger support level at 0.02163 USDT.
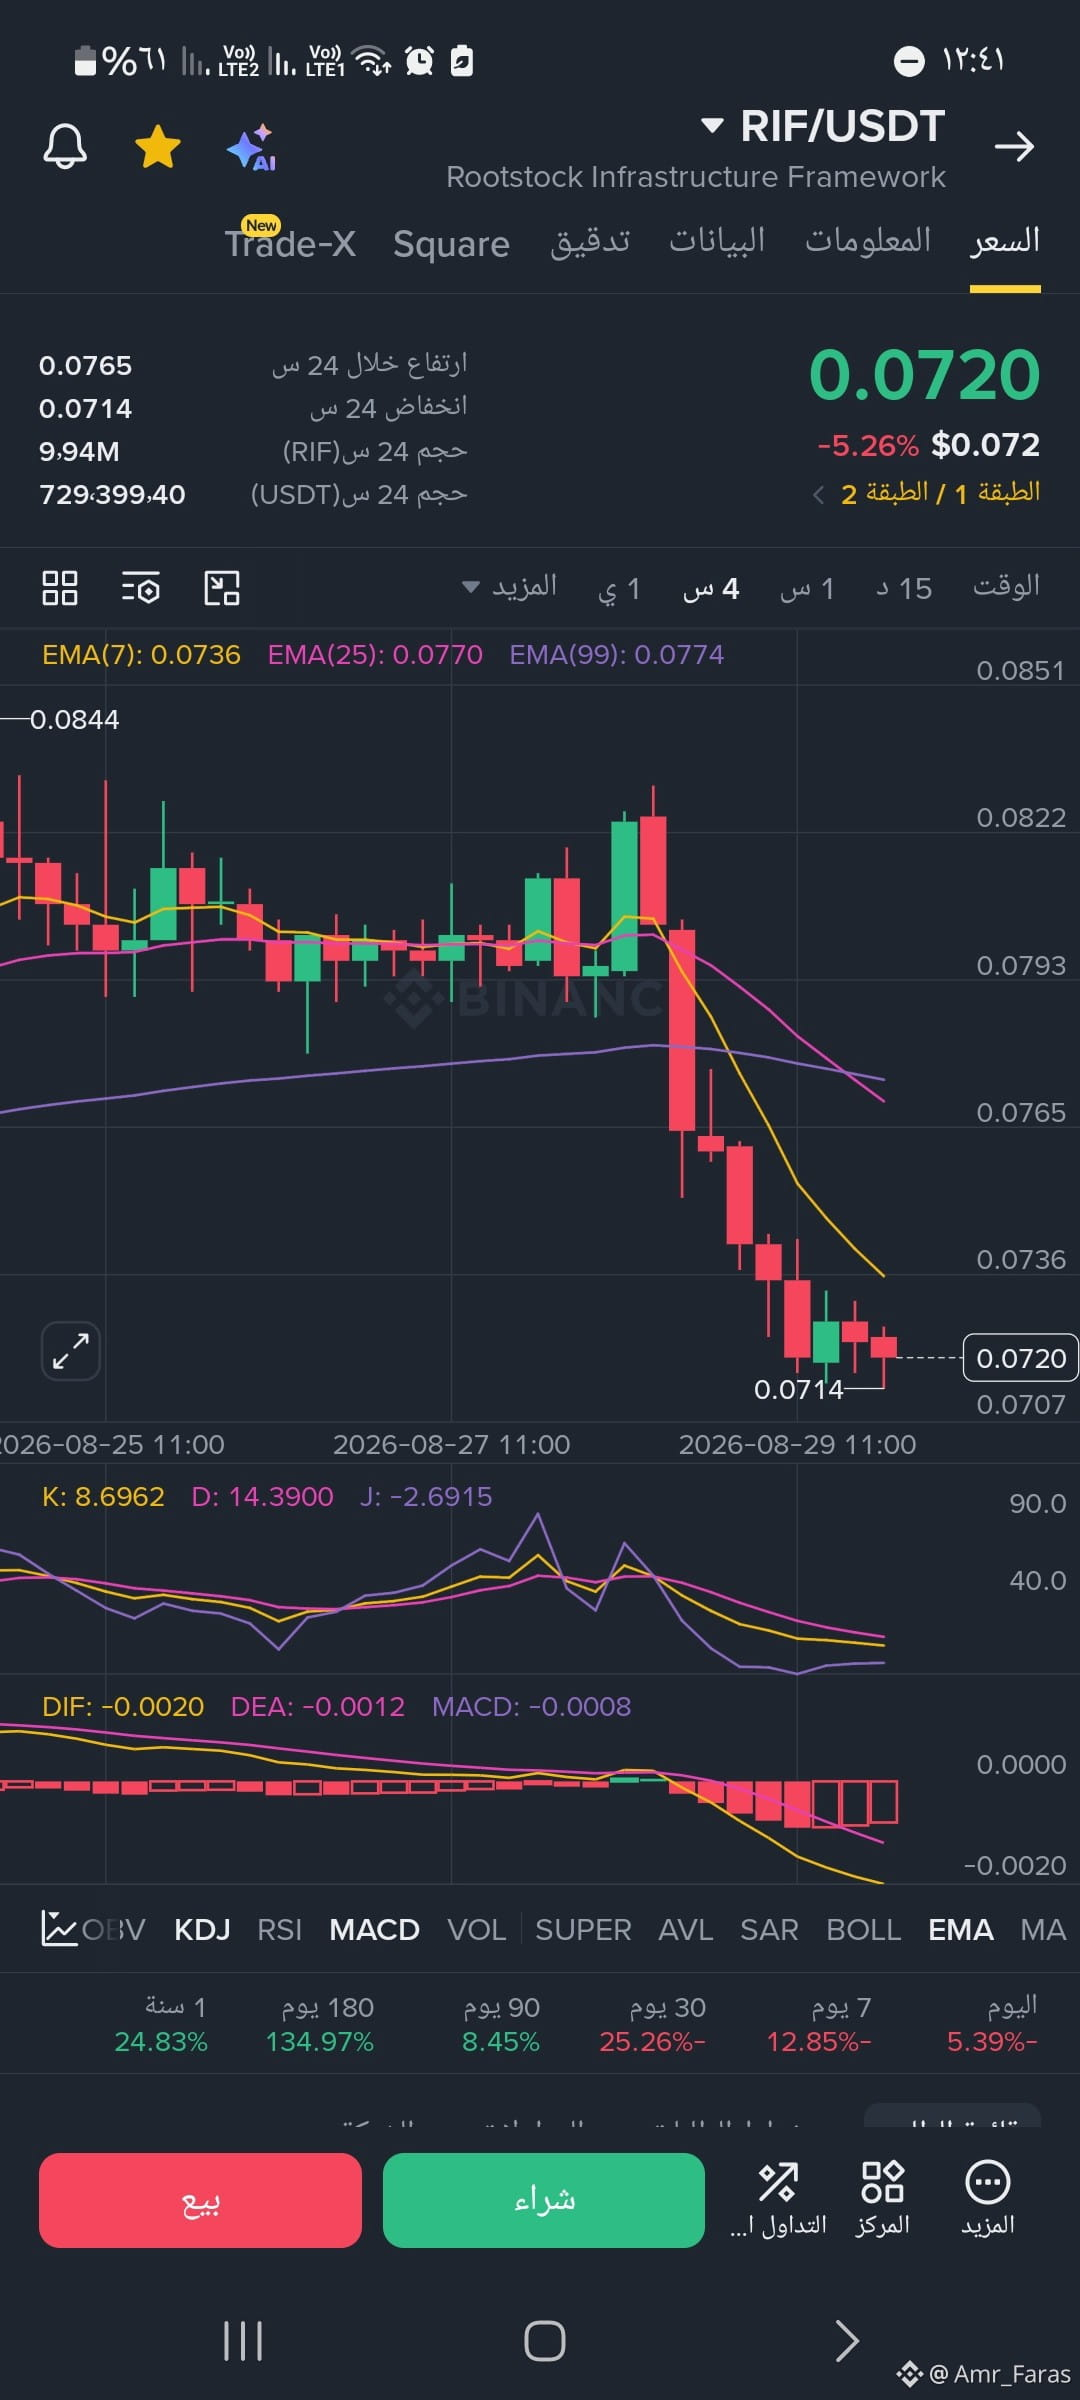
#RIF 💡 Summary and Market Expectations The market is going through an overbought selling phase that is putting pressure on prices; entering buy (Long) trades right now involves high risk due to the absence of a clear reversal signal or a distinct reversal candle. It is preferable to monitor price behavior at the support level of 0.0714 USDT to confirm its ability to hold, or to wait for an upward breakout of the EMA(7) line before considering a temporary corrective bounce.
#ONGUSDT🚨
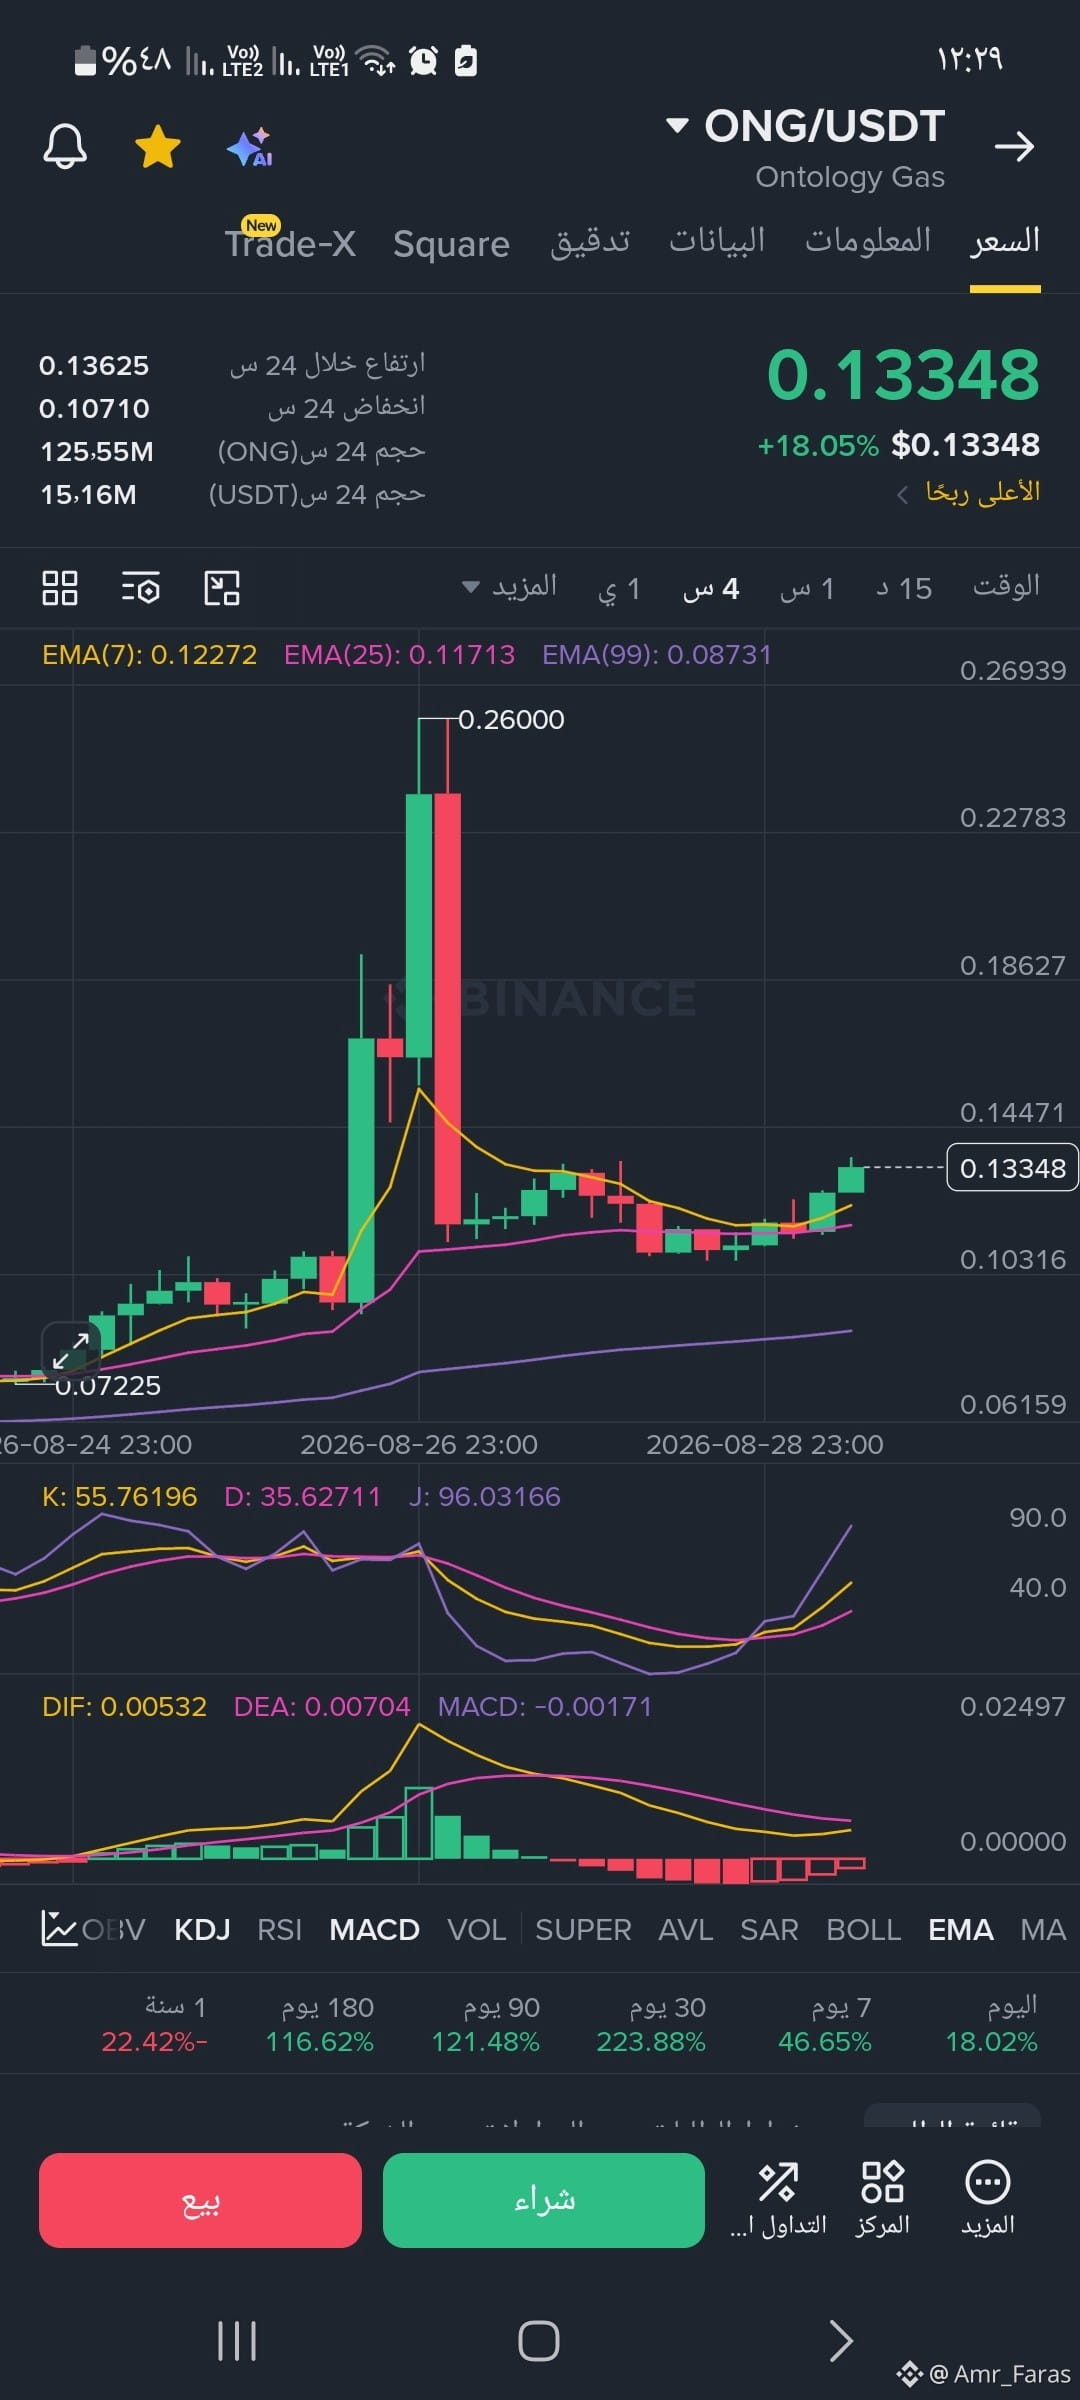
💡 Technical Summary and Forecast
The cryptocurrency is currently in a consolidation and stabilization phase after the intense volatility that occurred. Price stability above the moving average levels (especially above 0.12200) is considered a positive signal for building a new uptrend base. If it breaks through nearby immediate resistance zones and the price holds steady, it may target 0.14471 as the first milestone. A break below the nearby support level at 0.11700 could open the door for further correction toward stronger nearby support levels close to the EMA
💡 Technical Summary and Forecast
The cryptocurrency is currently in a consolidation and stabilization phase after the intense volatility that occurred. Price stability above the moving average levels (especially above 0.12200) is considered a positive signal for building a new uptrend base. If it breaks through nearby immediate resistance zones and the price holds steady, it may target 0.14471 as the first milestone. A break below the nearby support level at 0.11700 could open the door for further correction toward stronger nearby support levels close to the EMA
#ONG/USDT
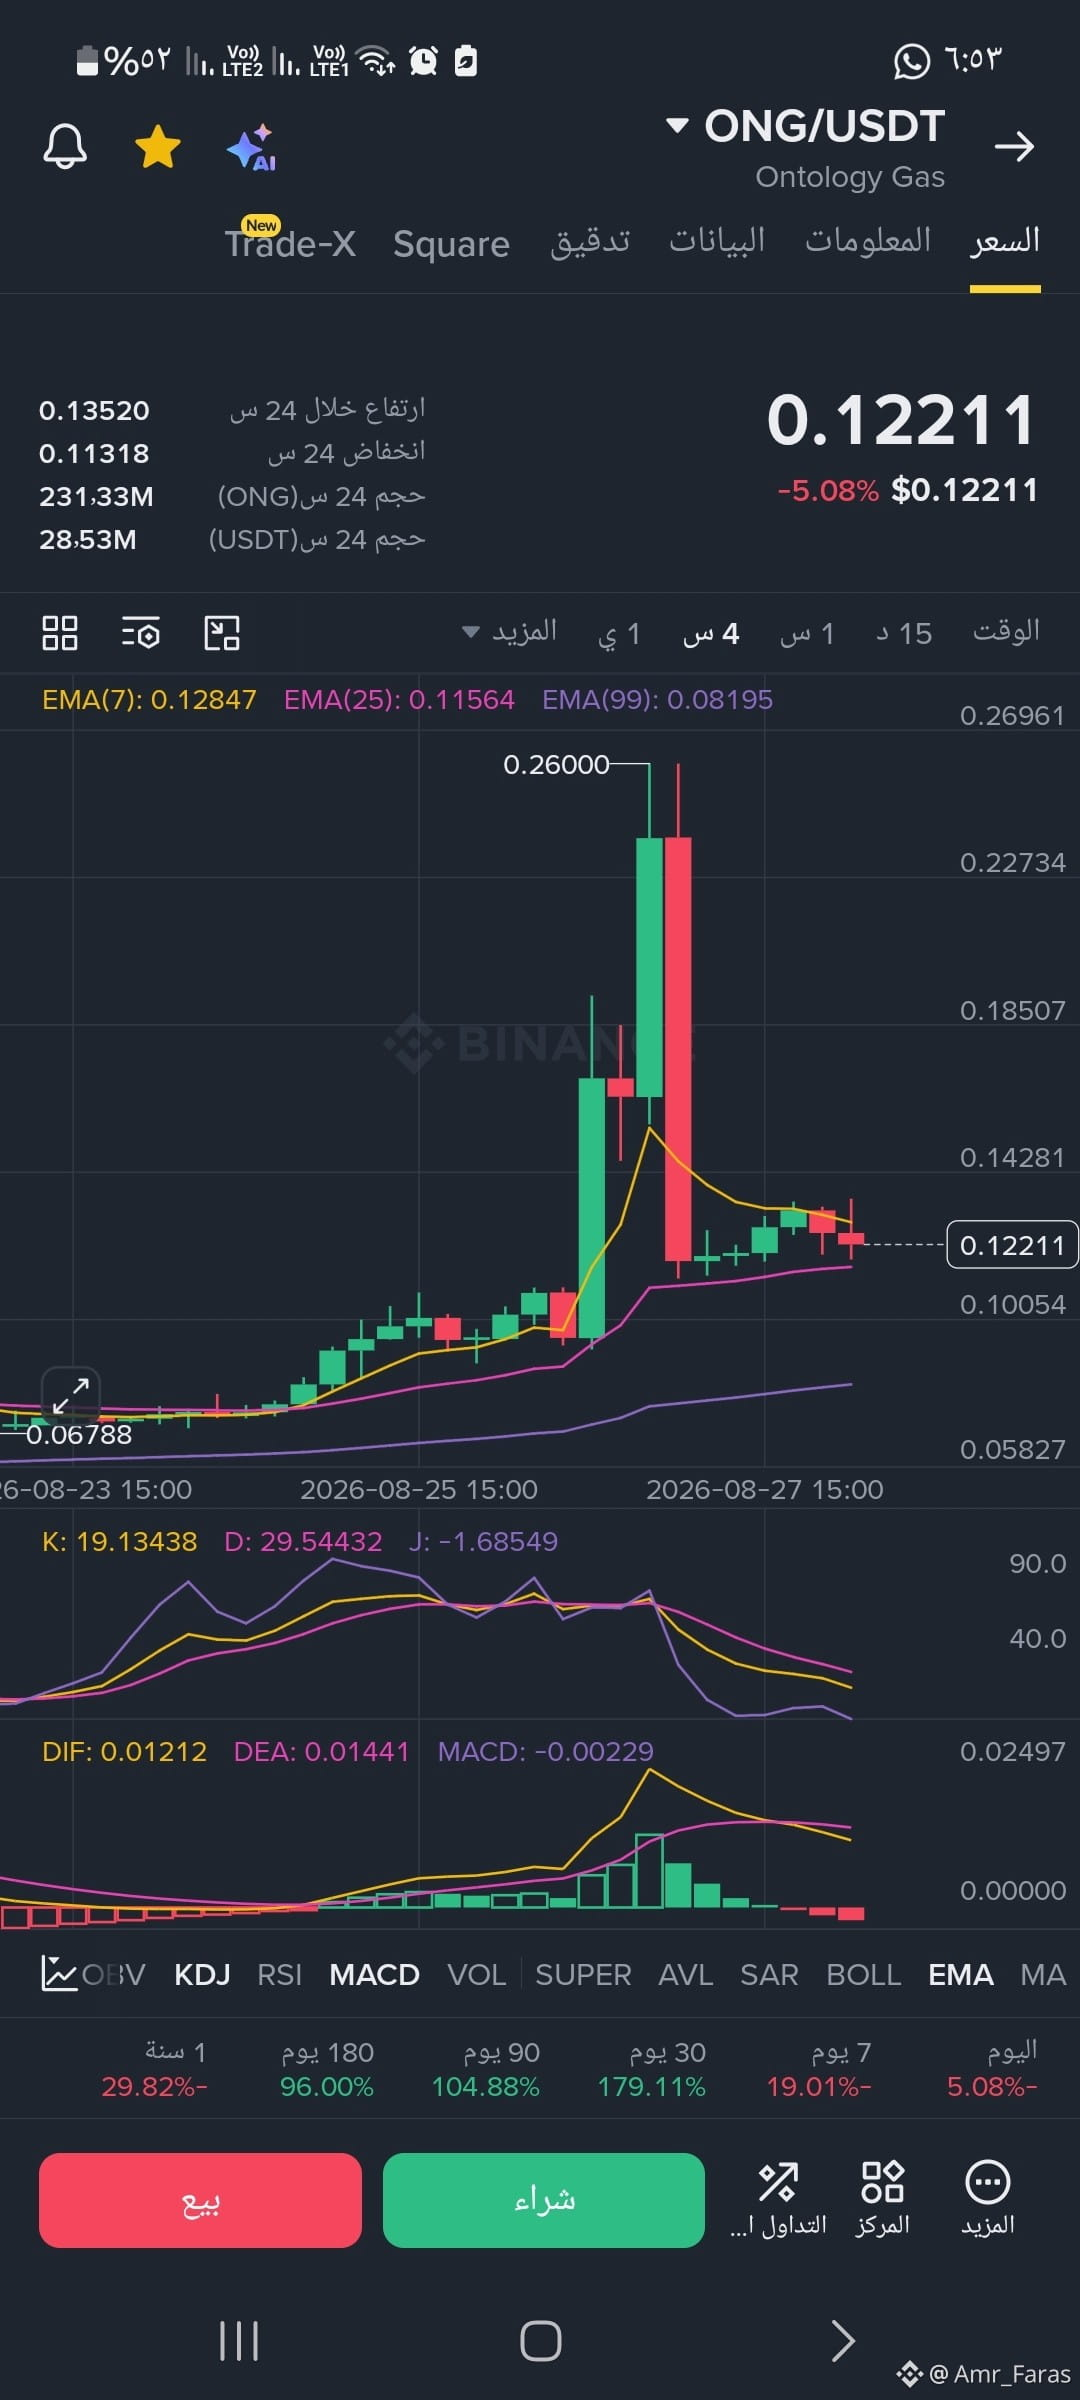
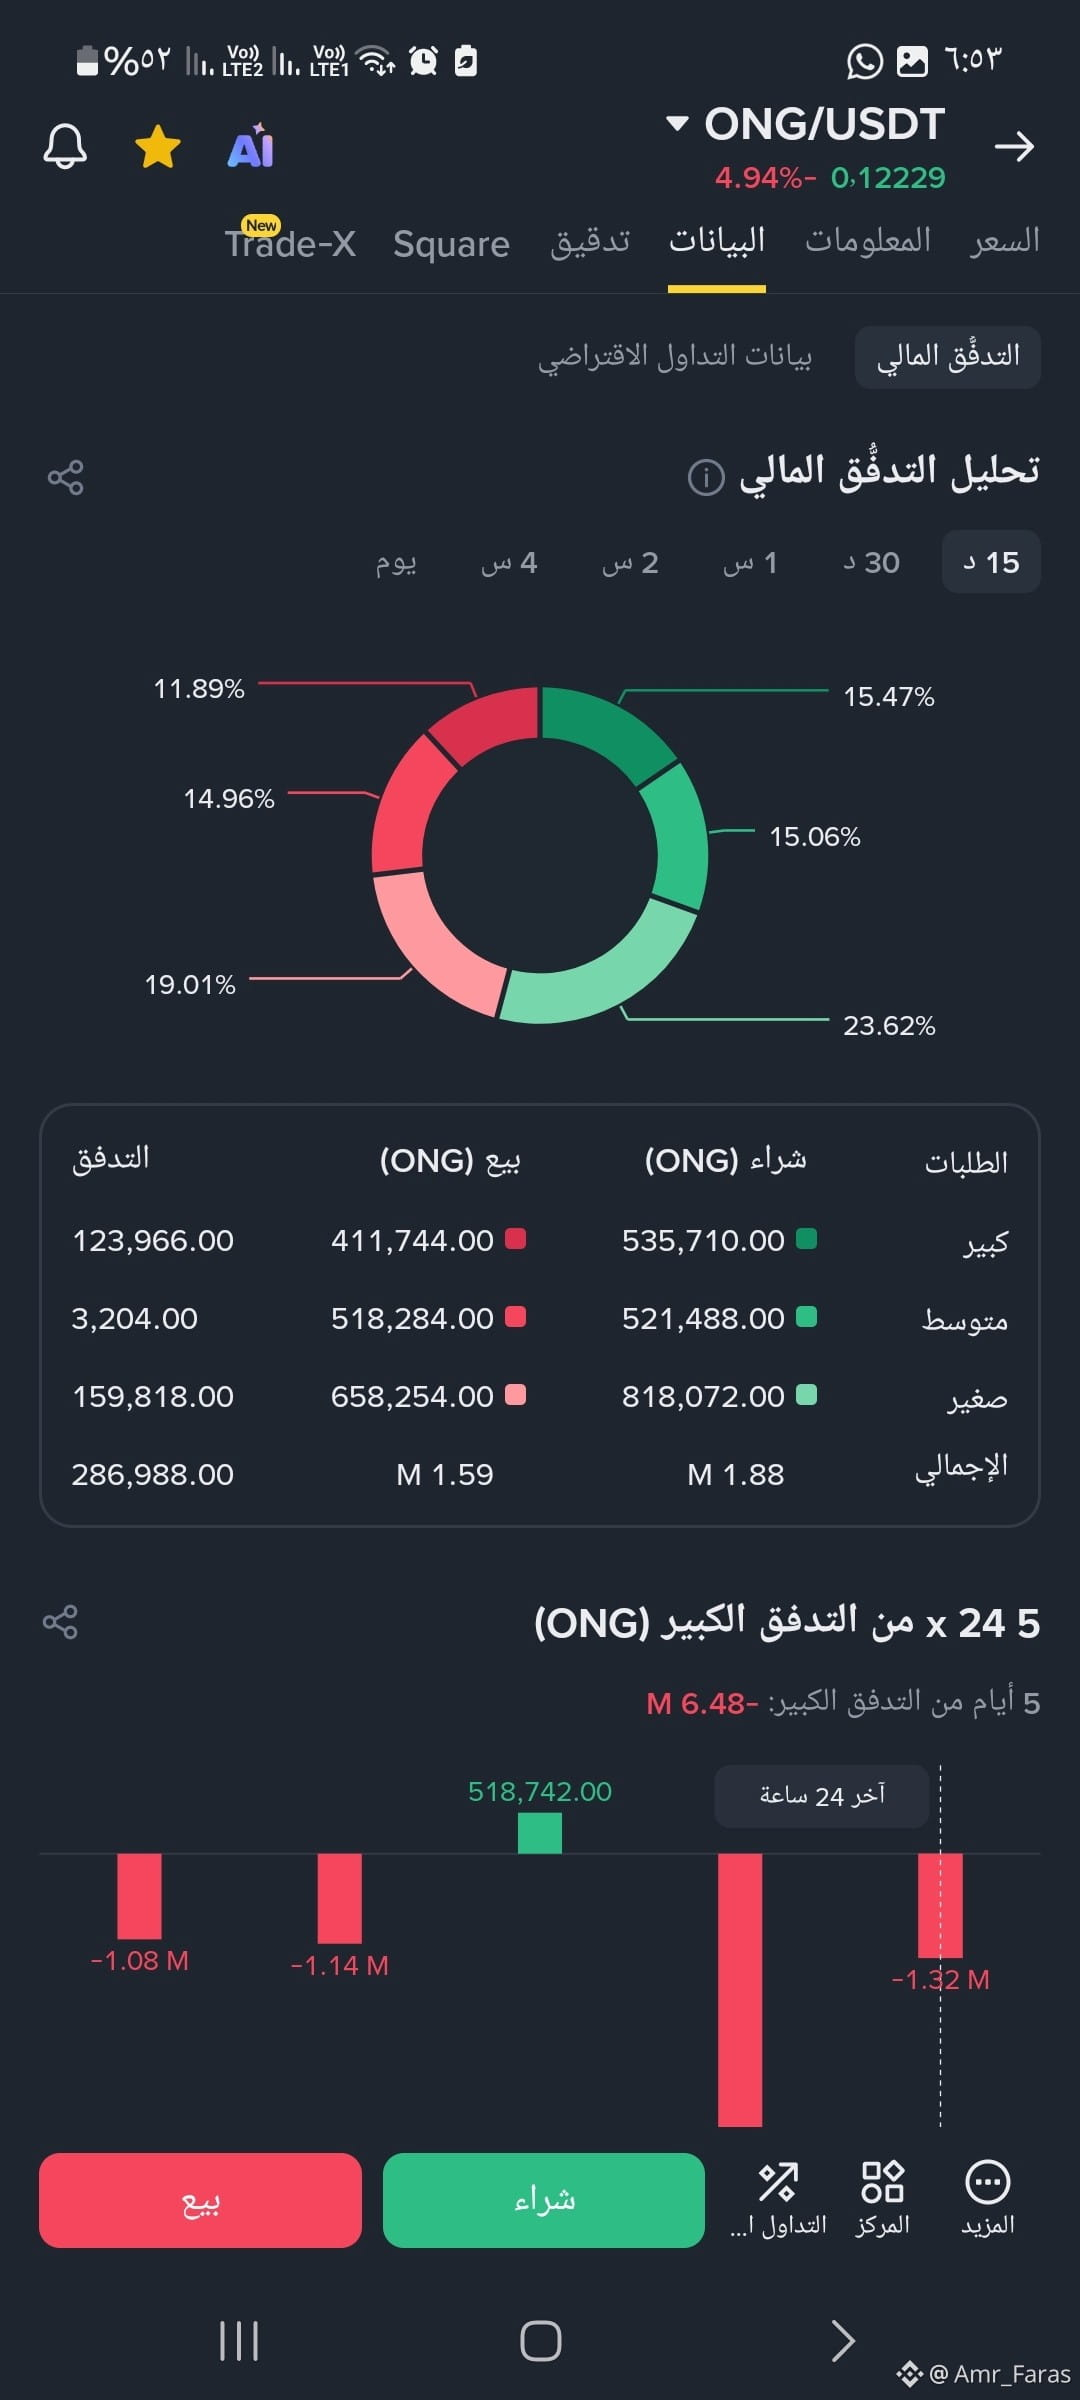
📌 Technical summary for the linkage between the two charts: The coin is currently in a phase of "absorbing selling pressure." The current decline is a natural result of taking profits after the wild rally to 0.26000. Liquidity data (Chart 1), along with the price approaching the EMA(25) support and the KDJ being oversold (Chart 2), indicate that the coin is trying to form a rebound bottom at levels 0.11500 - 0.12200. If buyers manage to hold this support, we may see a new upward wave
📌 Technical summary for the linkage between the two charts: The coin is currently in a phase of "absorbing selling pressure." The current decline is a natural result of taking profits after the wild rally to 0.26000. Liquidity data (Chart 1), along with the price approaching the EMA(25) support and the KDJ being oversold (Chart 2), indicate that the coin is trying to form a rebound bottom at levels 0.11500 - 0.12200. If buyers manage to hold this support, we may see a new upward wave
#VETUSDT
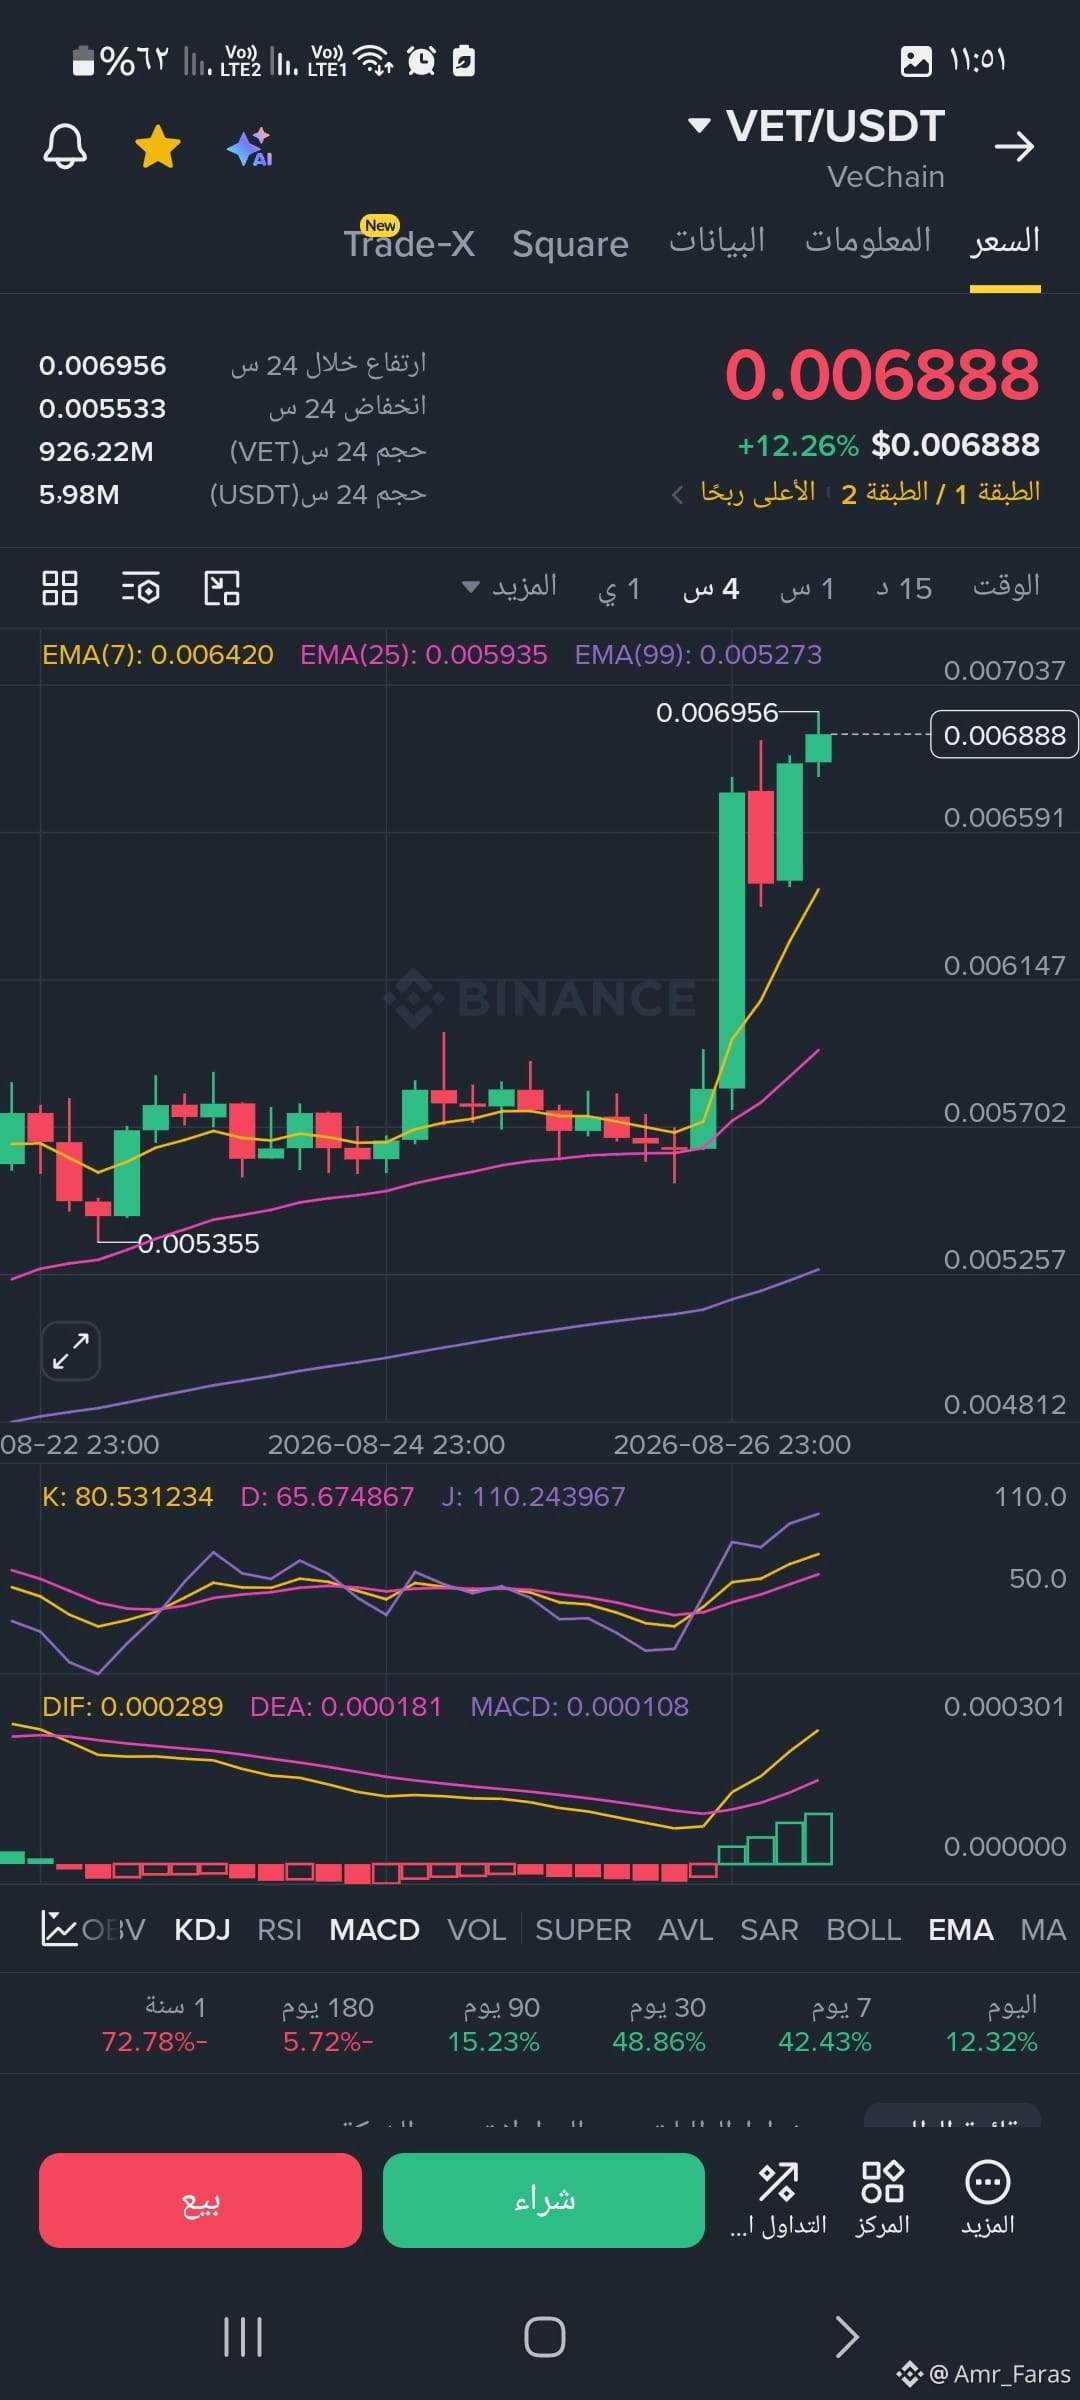
Through technical analysis of the indicators shown on the chart:Trend: The price is in a strong upward phase with a breakout above after a period of sideways fluctuation. The price is currently trading above the EMA 7, 25, and 99 exponential moving average lines, which is a strong positive indicator of the current bullish momentum.MACD indicator: It shows a bullish crossover above the zero line, along with an increase in the green momentum bars, supporting the continuation of buying strength at this time.
Through technical analysis of the indicators shown on the chart:Trend: The price is in a strong upward phase with a breakout above after a period of sideways fluctuation. The price is currently trading above the EMA 7, 25, and 99 exponential moving average lines, which is a strong positive indicator of the current bullish momentum.MACD indicator: It shows a bullish crossover above the zero line, along with an increase in the green momentum bars, supporting the continuation of buying strength at this time.
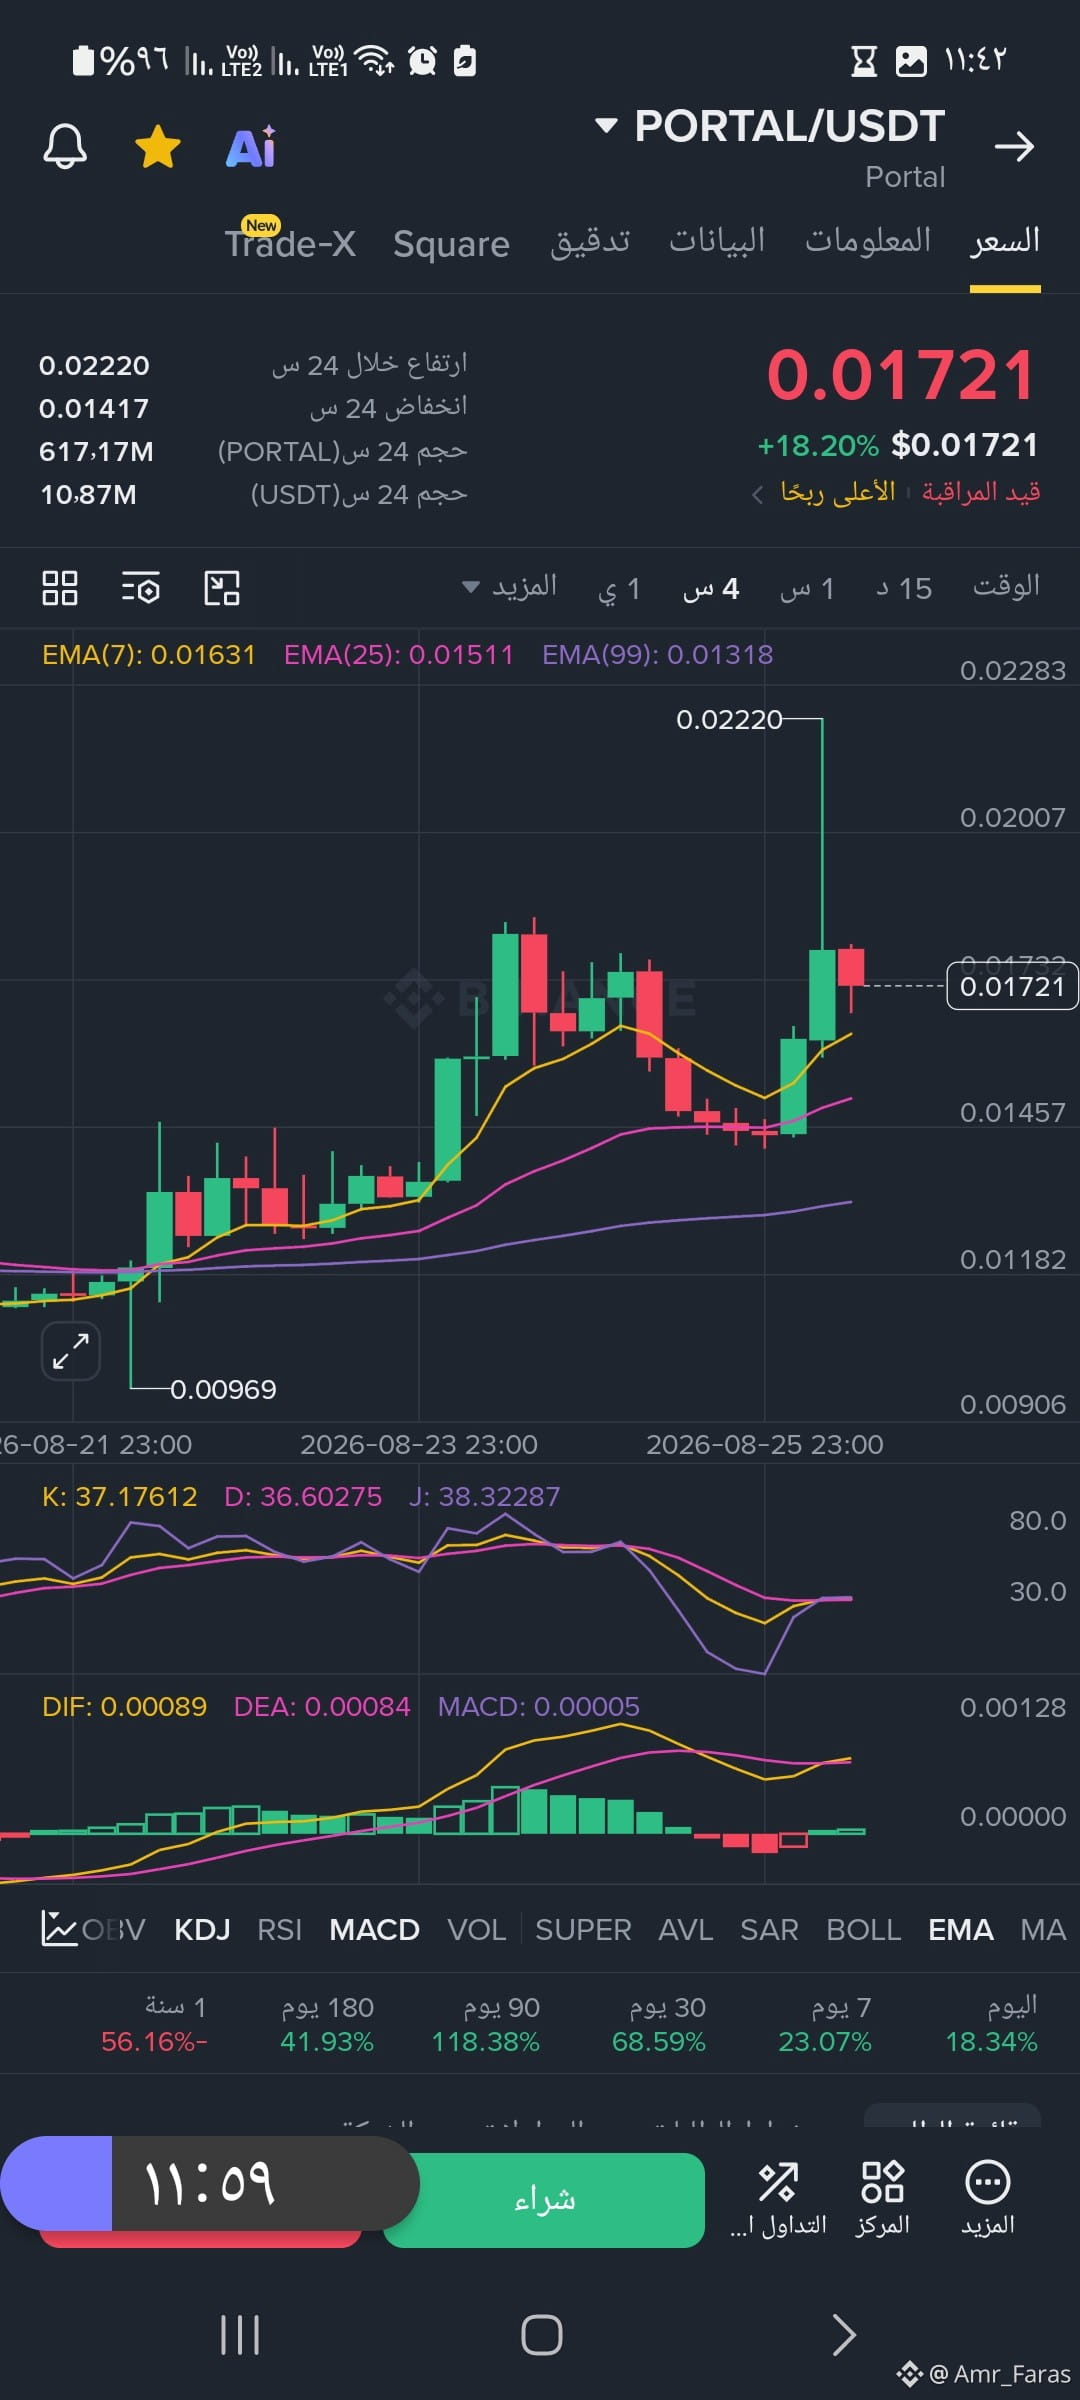
💡 Forward-looking view and proposed strategyPositive scenario: Stability above the 0.01630–0.01700 zone, along with forming a bullish crossover in the KDJ indicator, will drive the coin to retest the resistance at 0.02000, then 0.02220.Negative scenario: Breaking support at 0.01630 with a full candle close means the correction will extend to test the lower support zones at 0.01510 and 0.01450 to regroup forces again
#Portal
#Portal
Amr_faras 2024
·
--
#Portal
#IMXUSDT
💡 Strategic summary for linking the two pictures
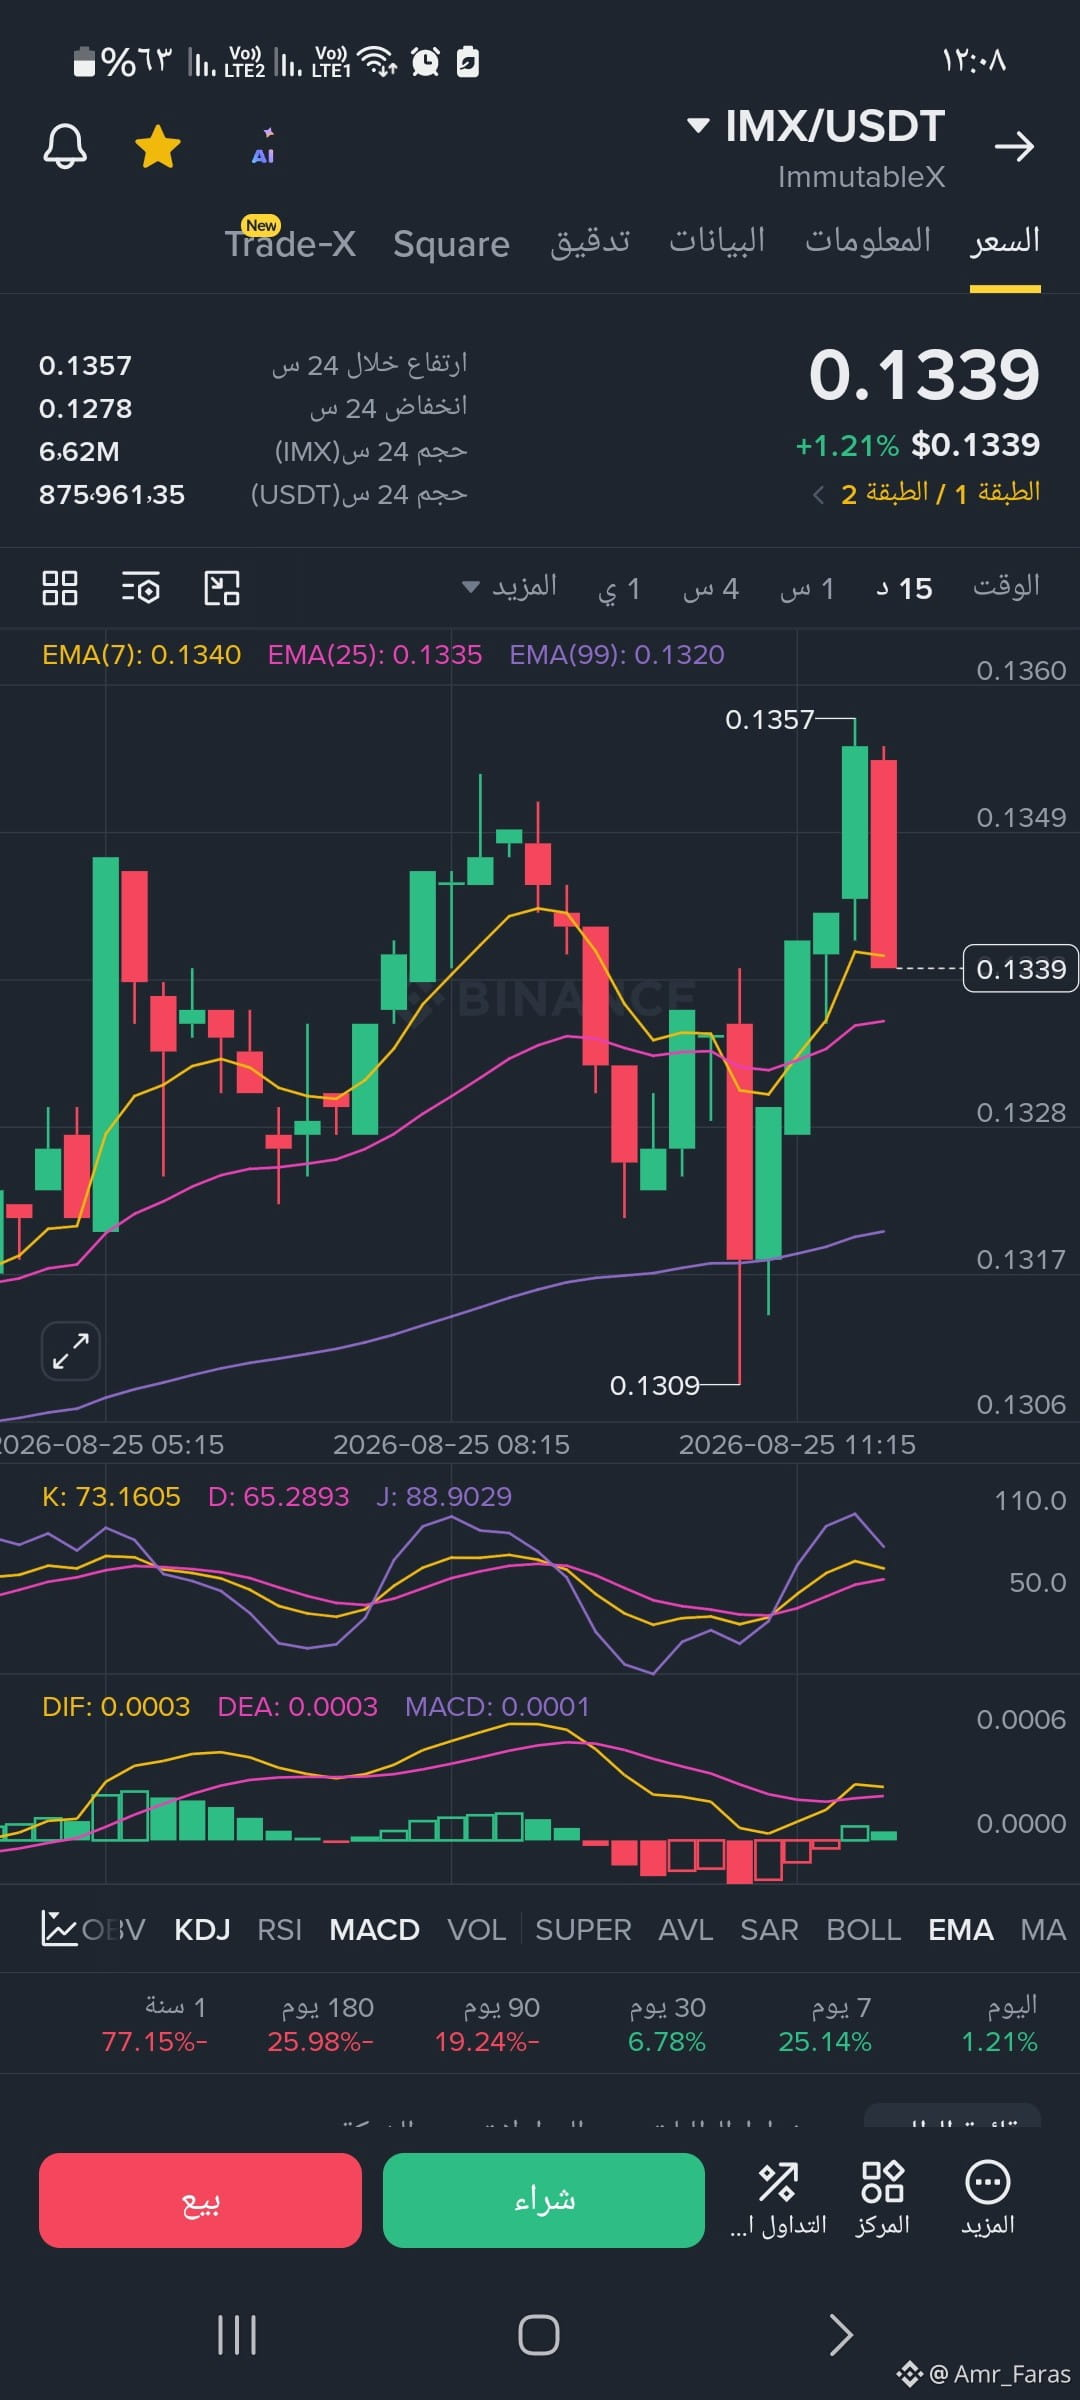
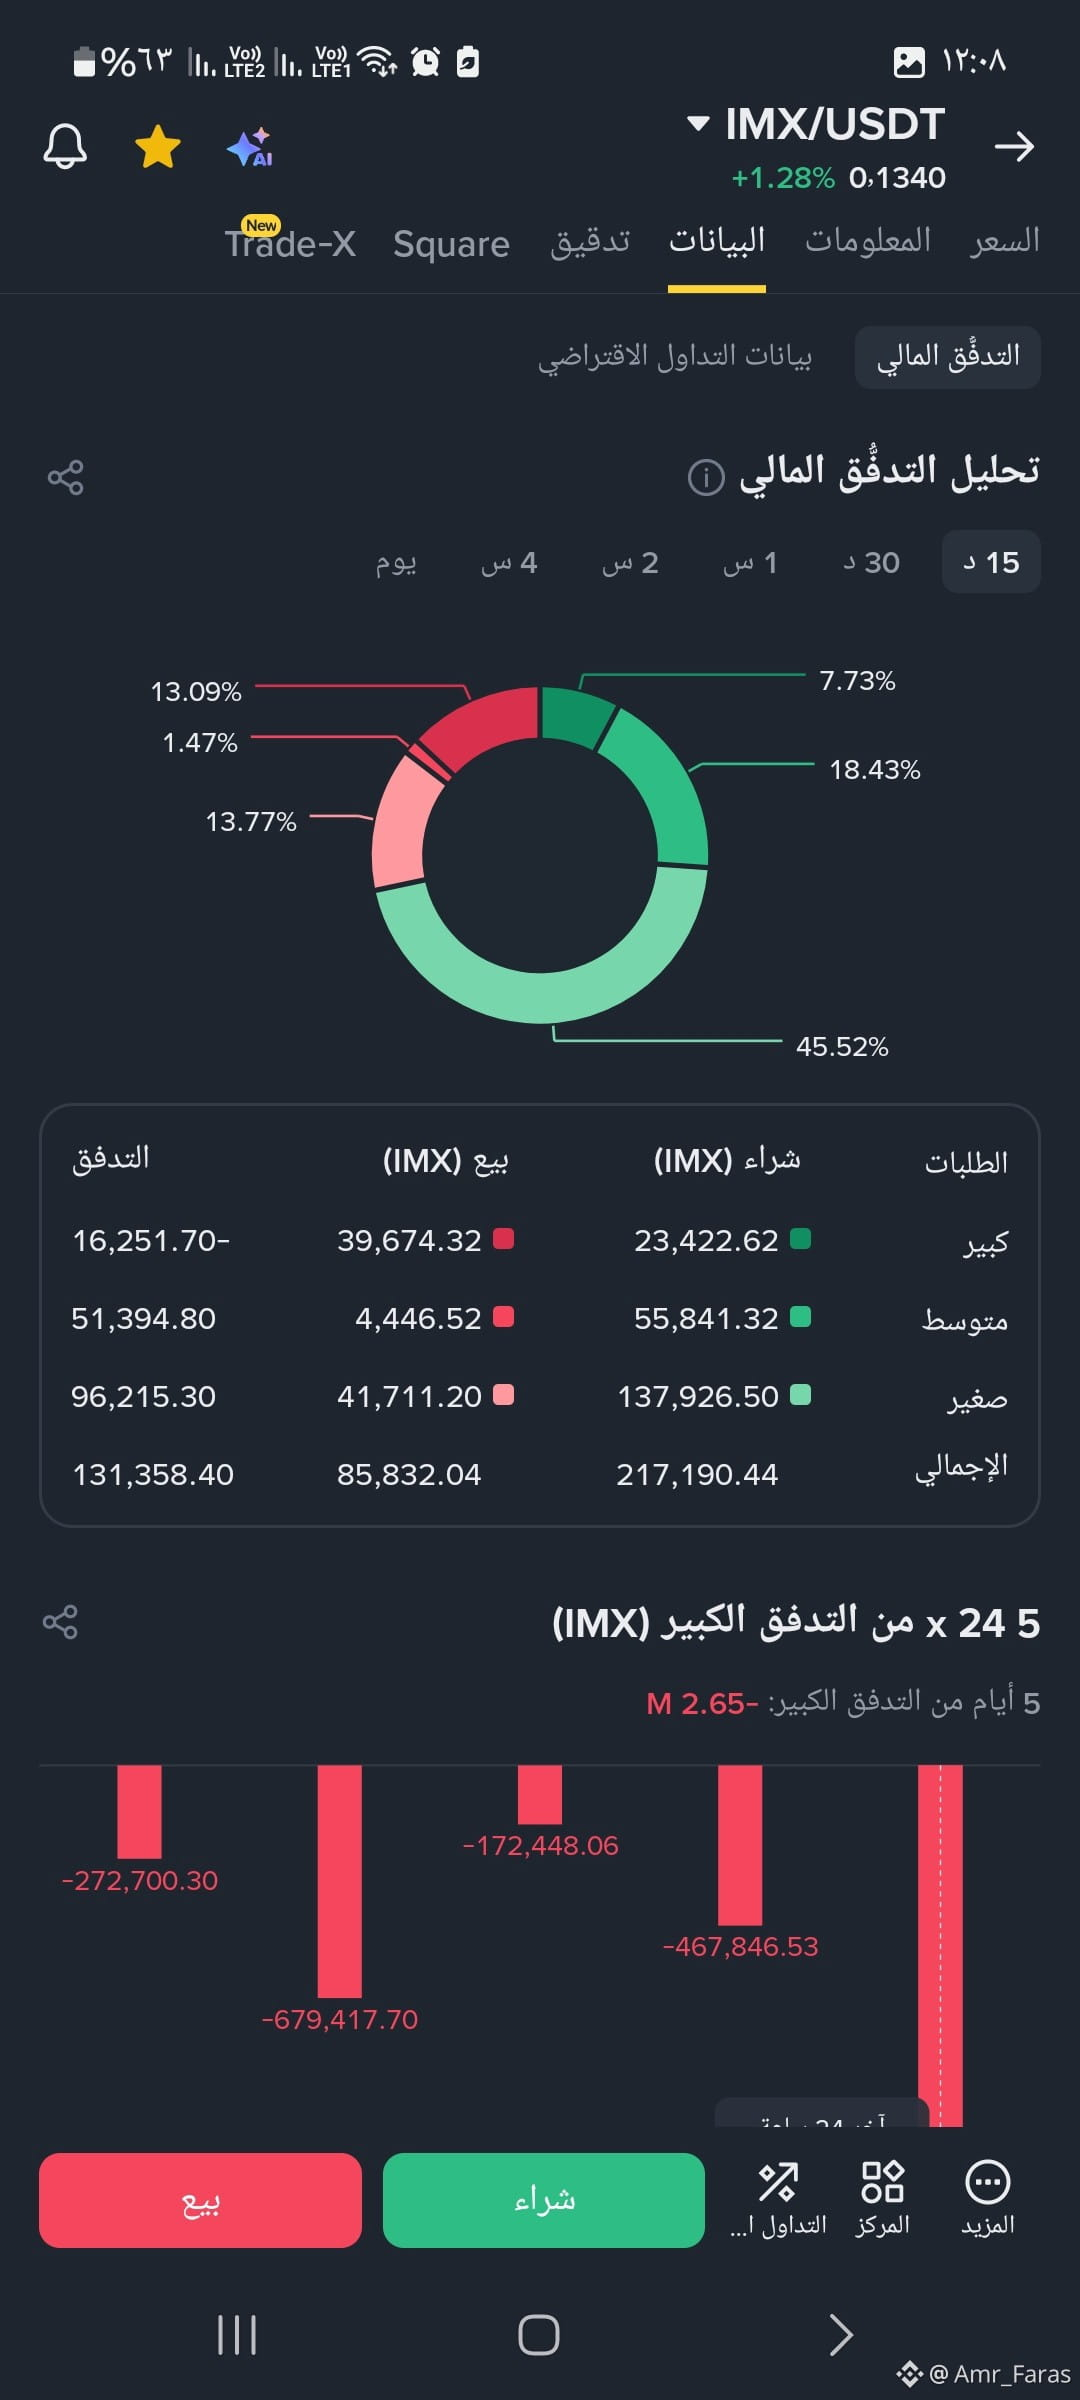
The currency is currently in a state of “covert whale distribution matched by an emotional accumulation by individuals.” Technically, the price is trying to hold on to moving averages (EMA 7 at 0.1340 and EMA 25 at 0.1335), but with whale liquidity leaving (from the first picture) and the KDJ indicator becoming overbought (from the second picture), the risk increases
💡 Strategic summary for linking the two pictures
The currency is currently in a state of “covert whale distribution matched by an emotional accumulation by individuals.” Technically, the price is trying to hold on to moving averages (EMA 7 at 0.1340 and EMA 25 at 0.1335), but with whale liquidity leaving (from the first picture) and the KDJ indicator becoming overbought (from the second picture), the risk increases
Amr_faras 2024
·
--
#Portal
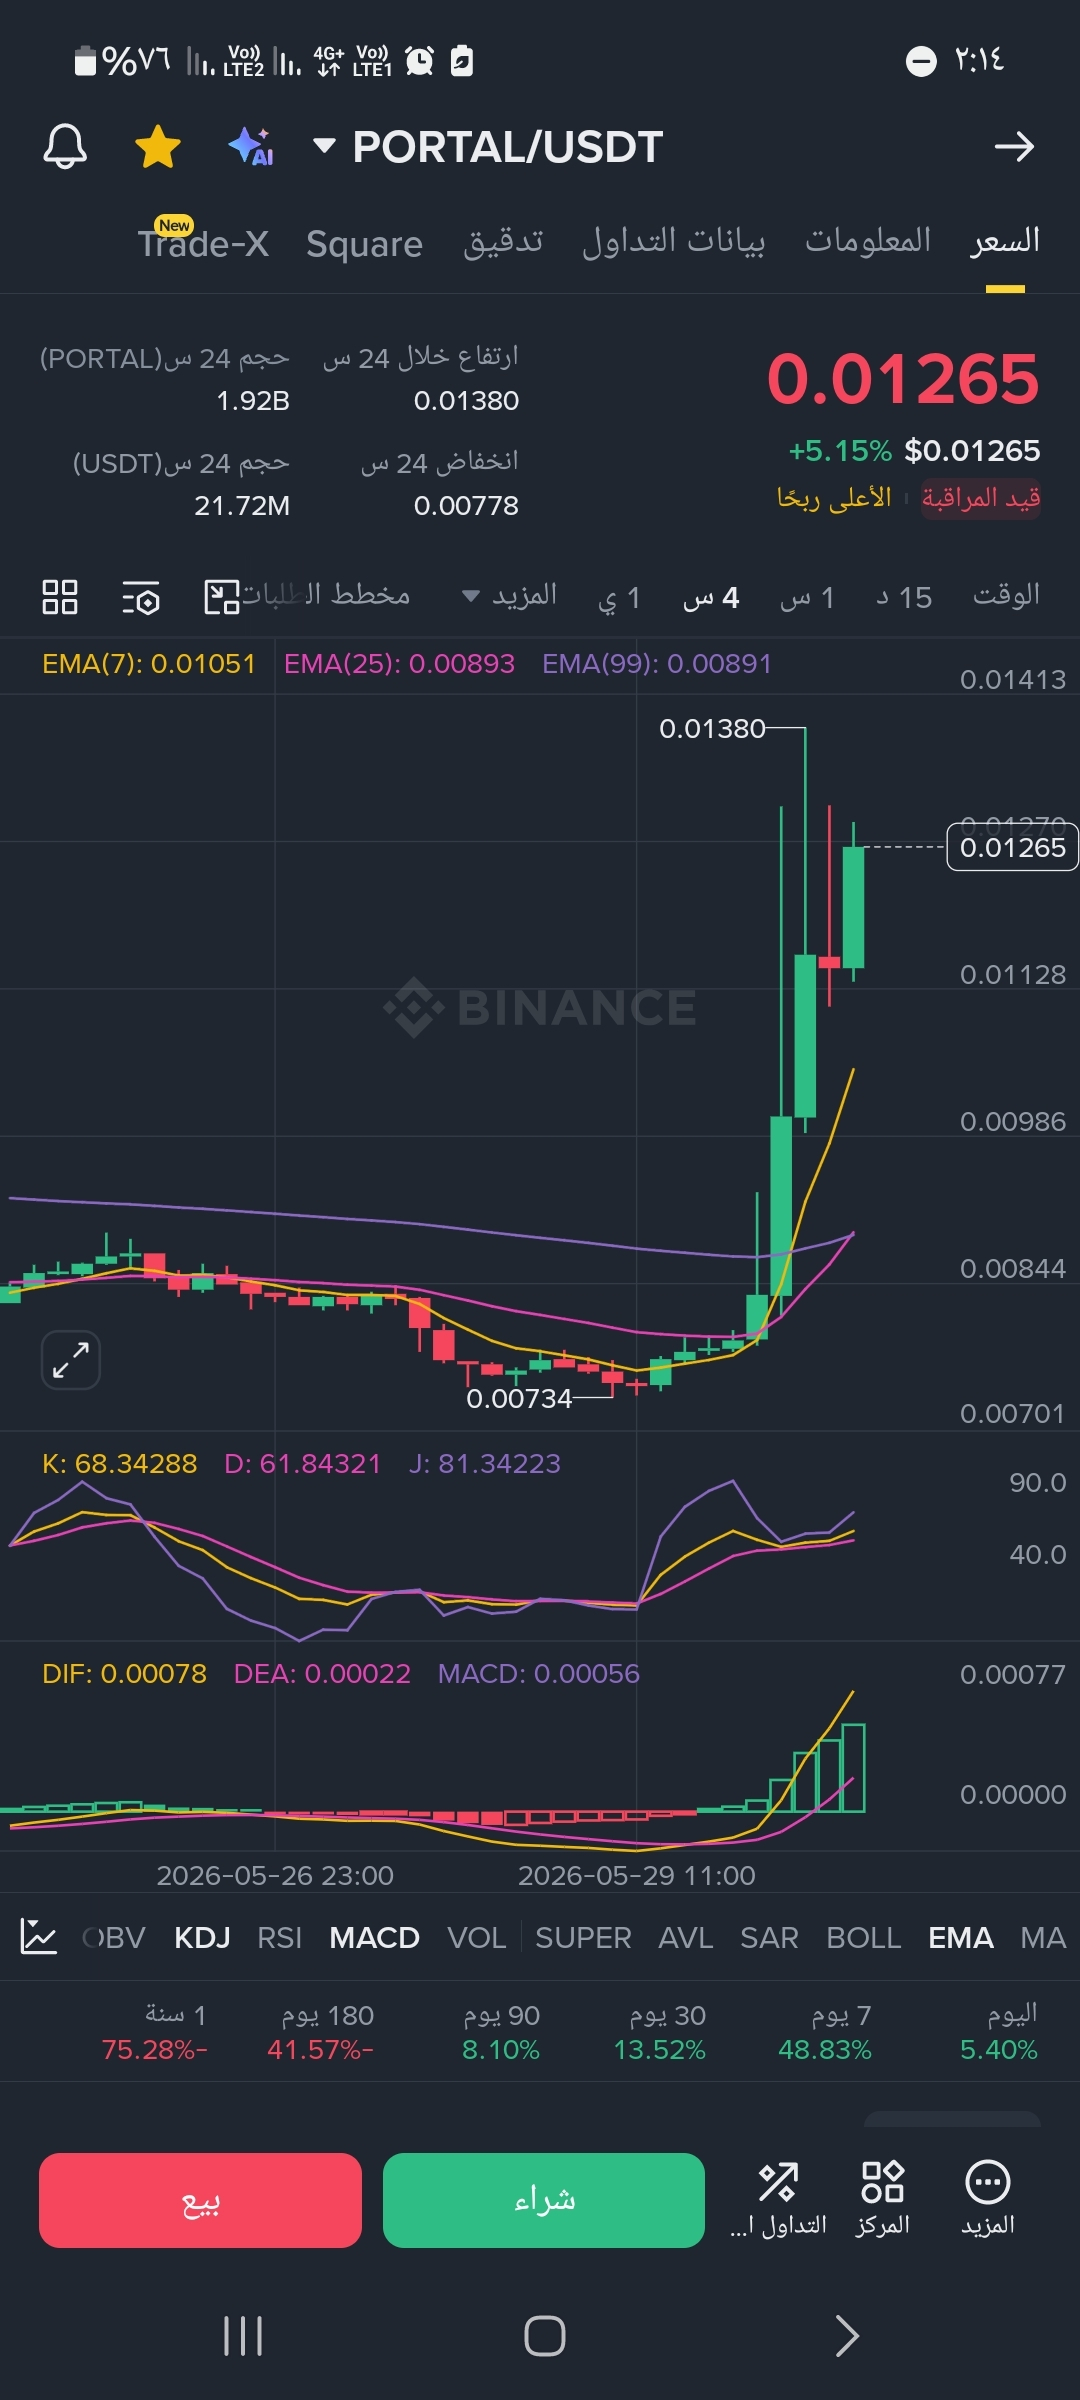
📌 Forecasts and Smart Trading Plan:
The coin is at its peak glow and positivity, but the golden rule always applies: don't chase those giant green candlesticks directly to avoid getting stuck at a momentary high.
If you own the coin from the bottom of the accumulation (a precious catch, congrats!):
Book a portion of your profits: the current peak levels between 0.0126 and 0.0138 are excellent areas to take some profits (for example, 30%).
Use a trailing stop: raise your stop loss to protect your remaining profits and set it below the 0.0105 levels (at the EMA 7 support line). As long as the price maintains this line, keep the trade open because the upcoming targets may open the door for visits to 0.0150 and then 0.0170.
If you are out of the trade and looking for a safe entry point:
Wait for a correction and be patient: entering now carries high risk. The best scenario is to wait for a healthy pullback or retest to touch the first support line EMA(7) around the 0.01050 - 0.01100 areas.
If the price drops there and consolidates, it will be an ideal and typical entry point with a safe and tight stop loss by closing a 4-hour candlestick below 0.00950.
📌 Forecasts and Smart Trading Plan:
The coin is at its peak glow and positivity, but the golden rule always applies: don't chase those giant green candlesticks directly to avoid getting stuck at a momentary high.
If you own the coin from the bottom of the accumulation (a precious catch, congrats!):
Book a portion of your profits: the current peak levels between 0.0126 and 0.0138 are excellent areas to take some profits (for example, 30%).
Use a trailing stop: raise your stop loss to protect your remaining profits and set it below the 0.0105 levels (at the EMA 7 support line). As long as the price maintains this line, keep the trade open because the upcoming targets may open the door for visits to 0.0150 and then 0.0170.
If you are out of the trade and looking for a safe entry point:
Wait for a correction and be patient: entering now carries high risk. The best scenario is to wait for a healthy pullback or retest to touch the first support line EMA(7) around the 0.01050 - 0.01100 areas.
If the price drops there and consolidates, it will be an ideal and typical entry point with a safe and tight stop loss by closing a 4-hour candlestick below 0.00950.
#pol
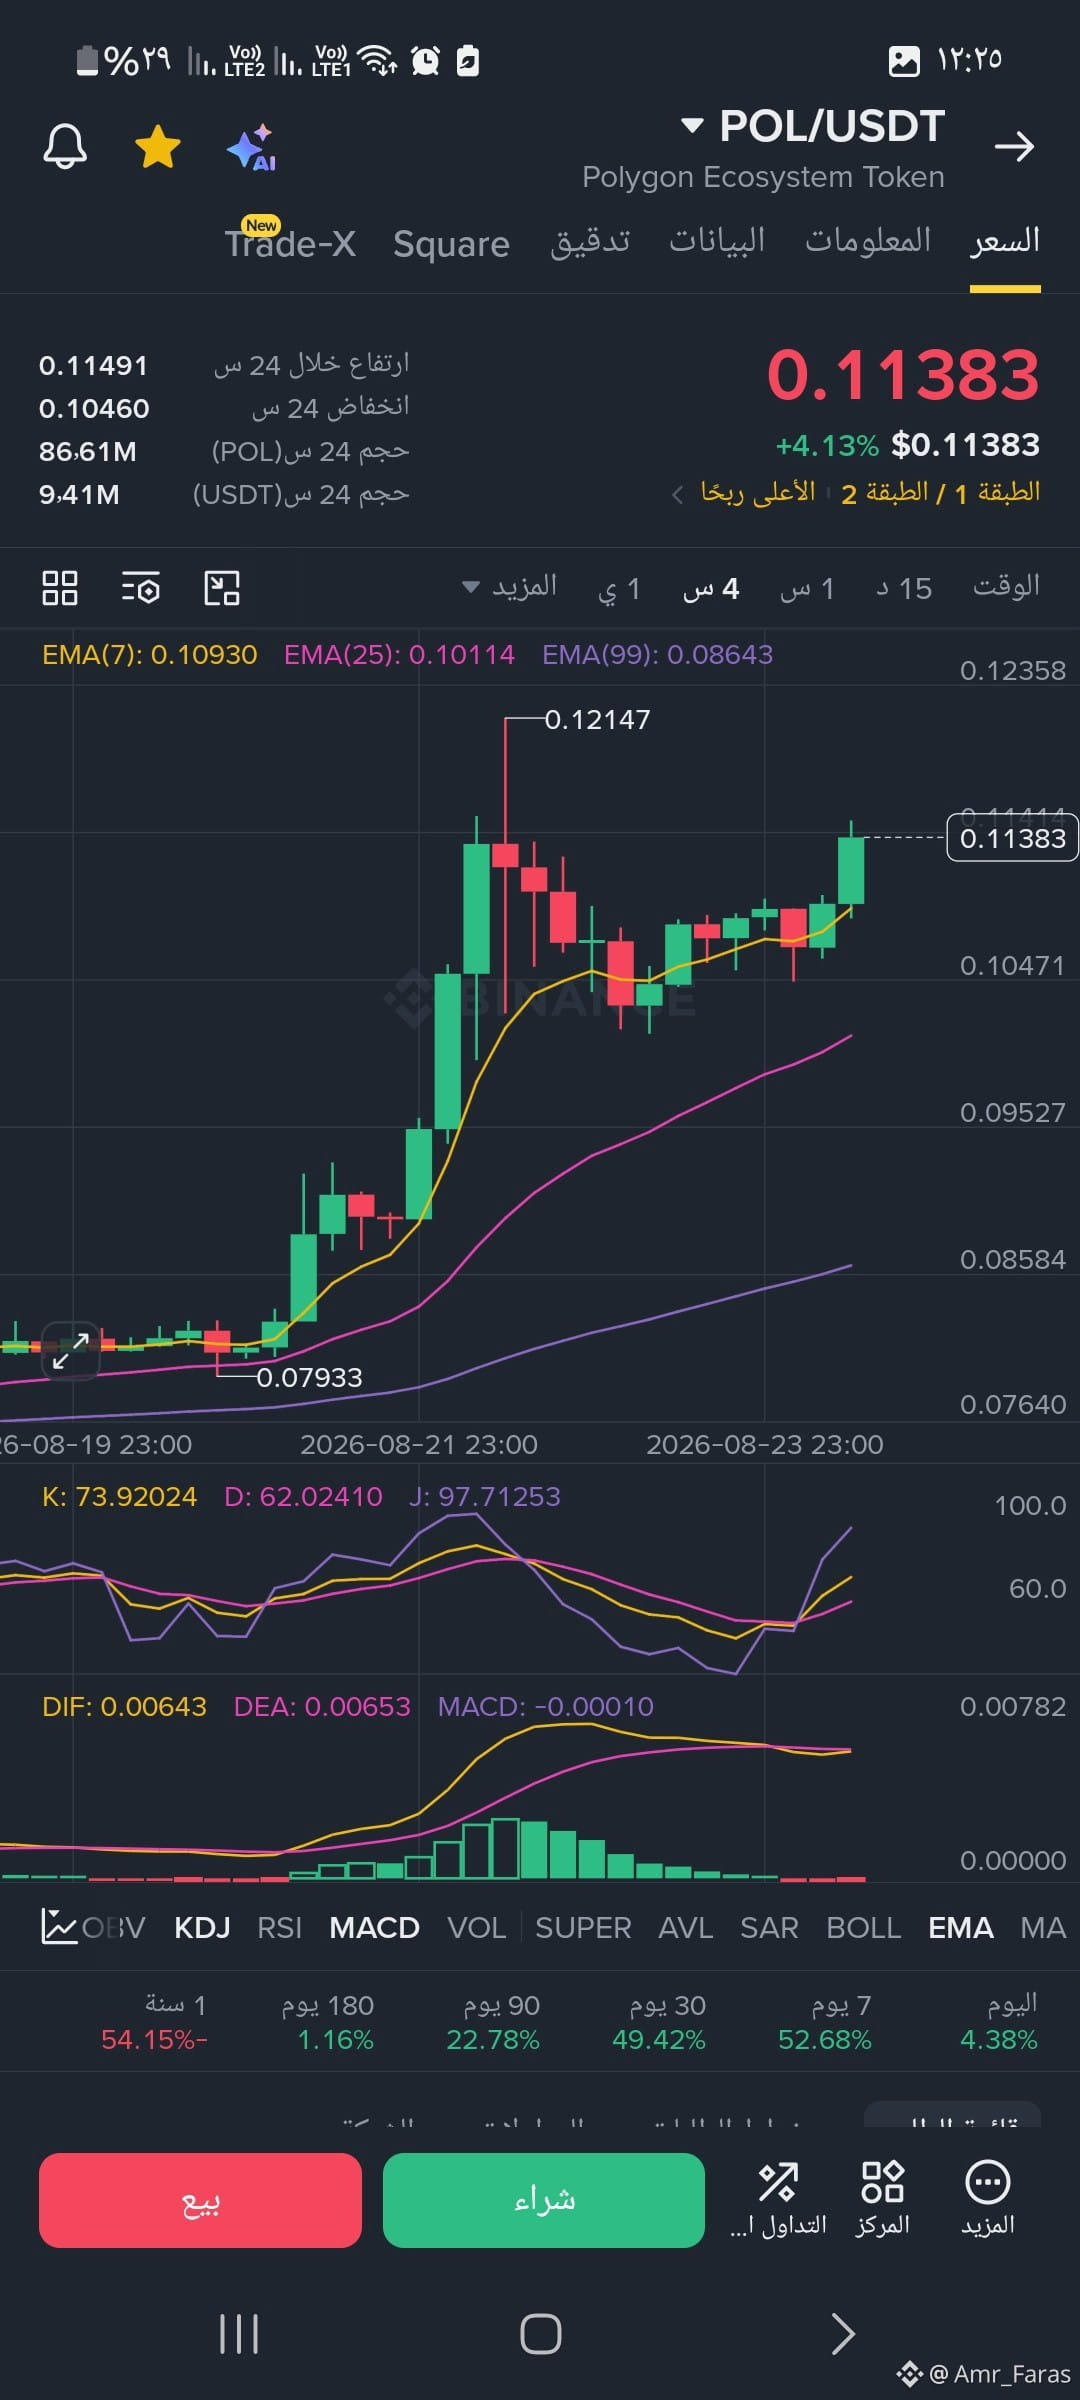
Expected Scenarios (Support and Resistance Levels)🎯 Resistance Targets:First resistance and the previous peak at 0.12147. Breaking through it and closing above it opens the way to levels 0.12358 and higher.🛡️ Support Protection Levels:First support (near): the EMA(7) level at 0.10930. Second support (stronger): the EMA(25) level near 0.10114
Expected Scenarios (Support and Resistance Levels)🎯 Resistance Targets:First resistance and the previous peak at 0.12147. Breaking through it and closing above it opens the way to levels 0.12358 and higher.🛡️ Support Protection Levels:First support (near): the EMA(7) level at 0.10930. Second support (stronger): the EMA(25) level near 0.10114
#XPL
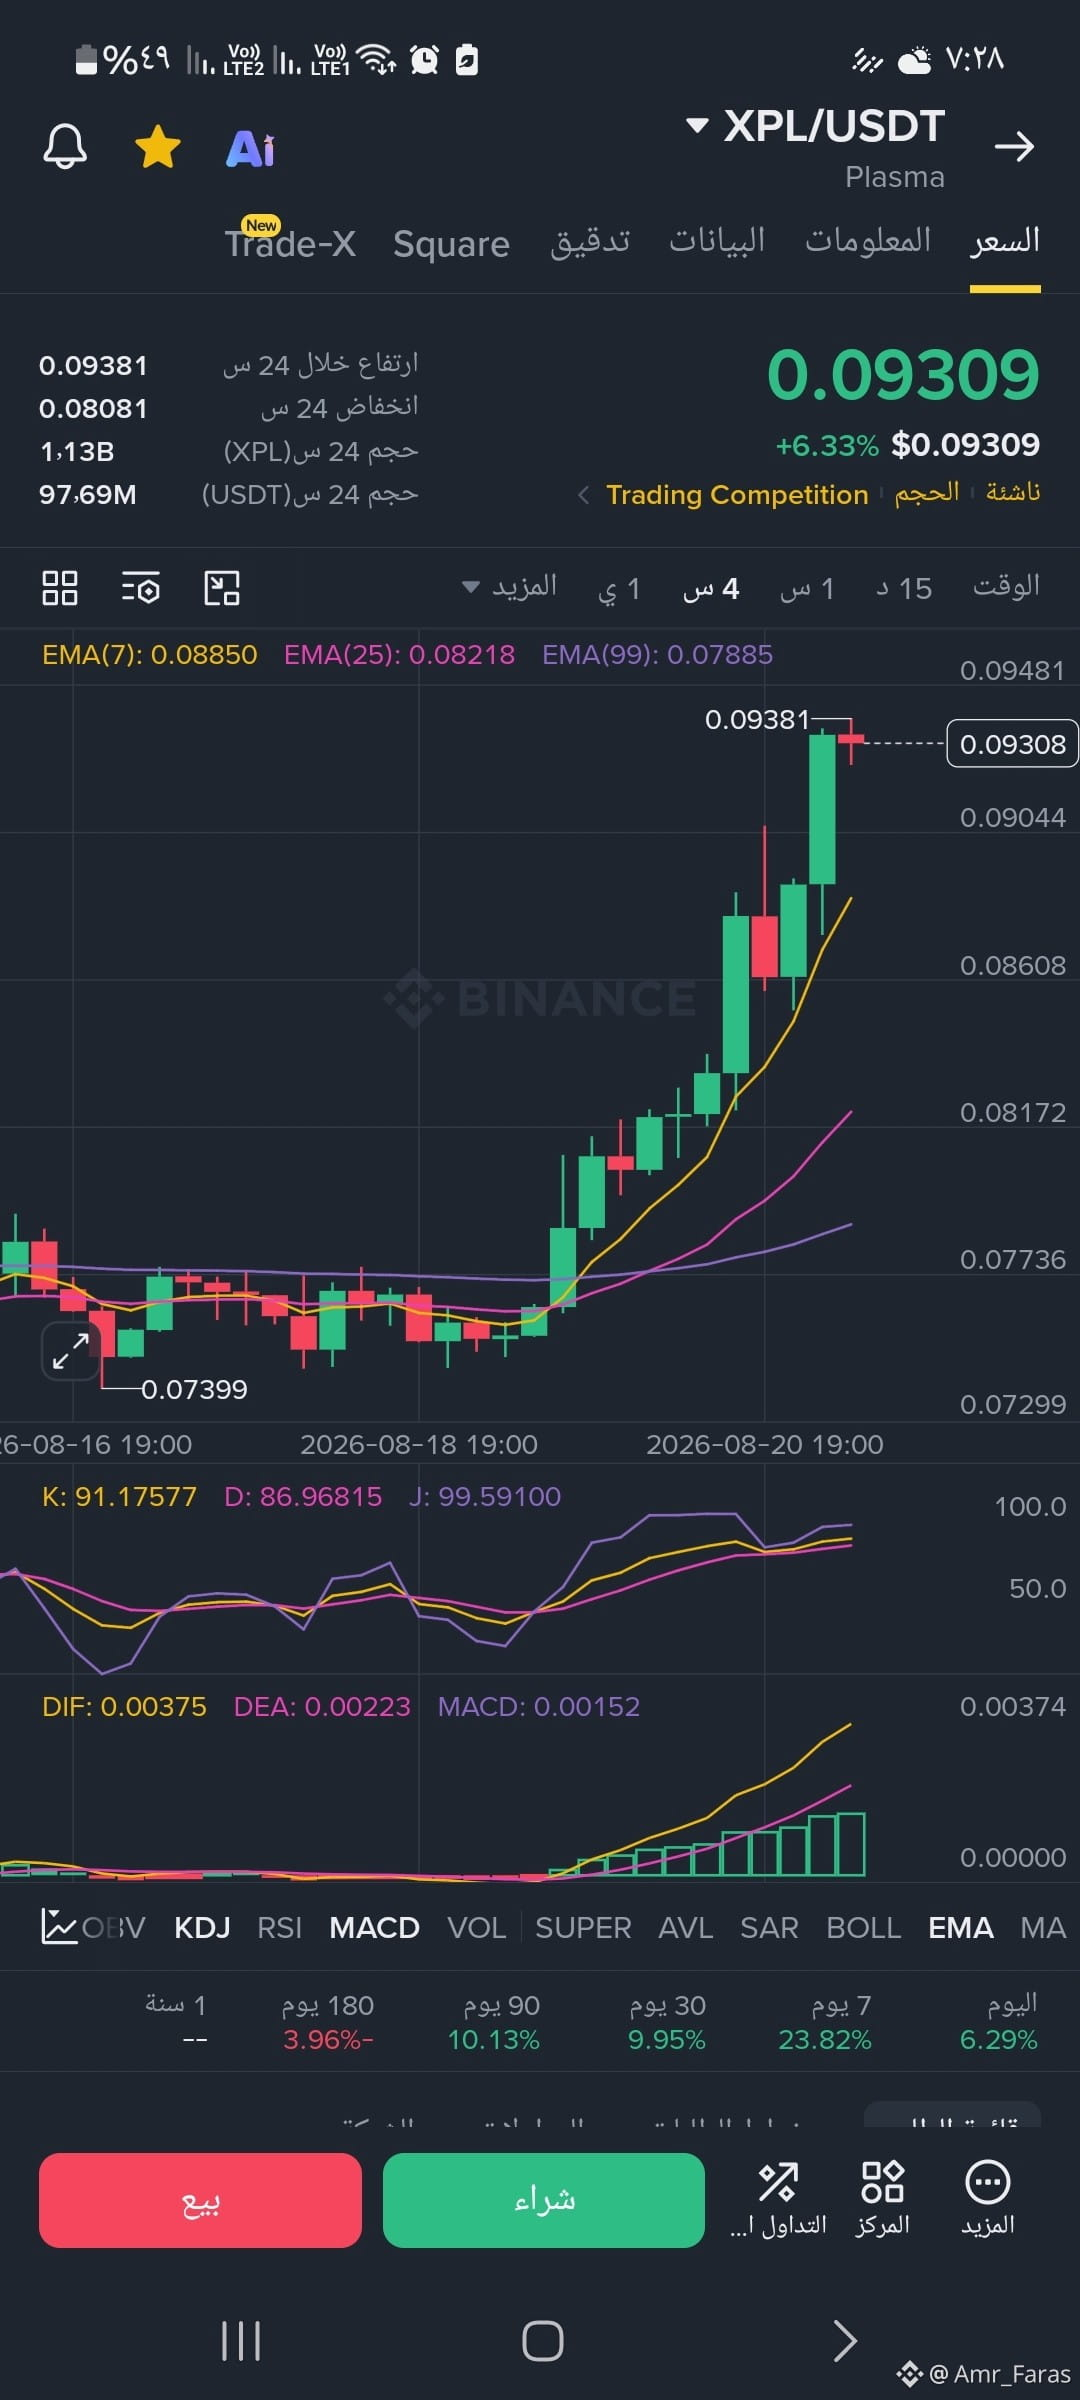
💡 Summary and strategic outlookCurrent situation: The trend is strongly bullish, supported by high momentum from indicators and moving averages.Trading strategy:Entering at these high levels involves high risk due to the clear overbought signal on the KDJ indicator.It’s better to wait for a retest of nearby support areas (such as the EMA(7) line around 0.08850 or the previously broken-through peak) to establish new long positions more safely if the price stabilizes above them.
💡 Summary and strategic outlookCurrent situation: The trend is strongly bullish, supported by high momentum from indicators and moving averages.Trading strategy:Entering at these high levels involves high risk due to the clear overbought signal on the KDJ indicator.It’s better to wait for a retest of nearby support areas (such as the EMA(7) line around 0.08850 or the previously broken-through peak) to establish new long positions more safely if the price stabilizes above them.
#idusdt
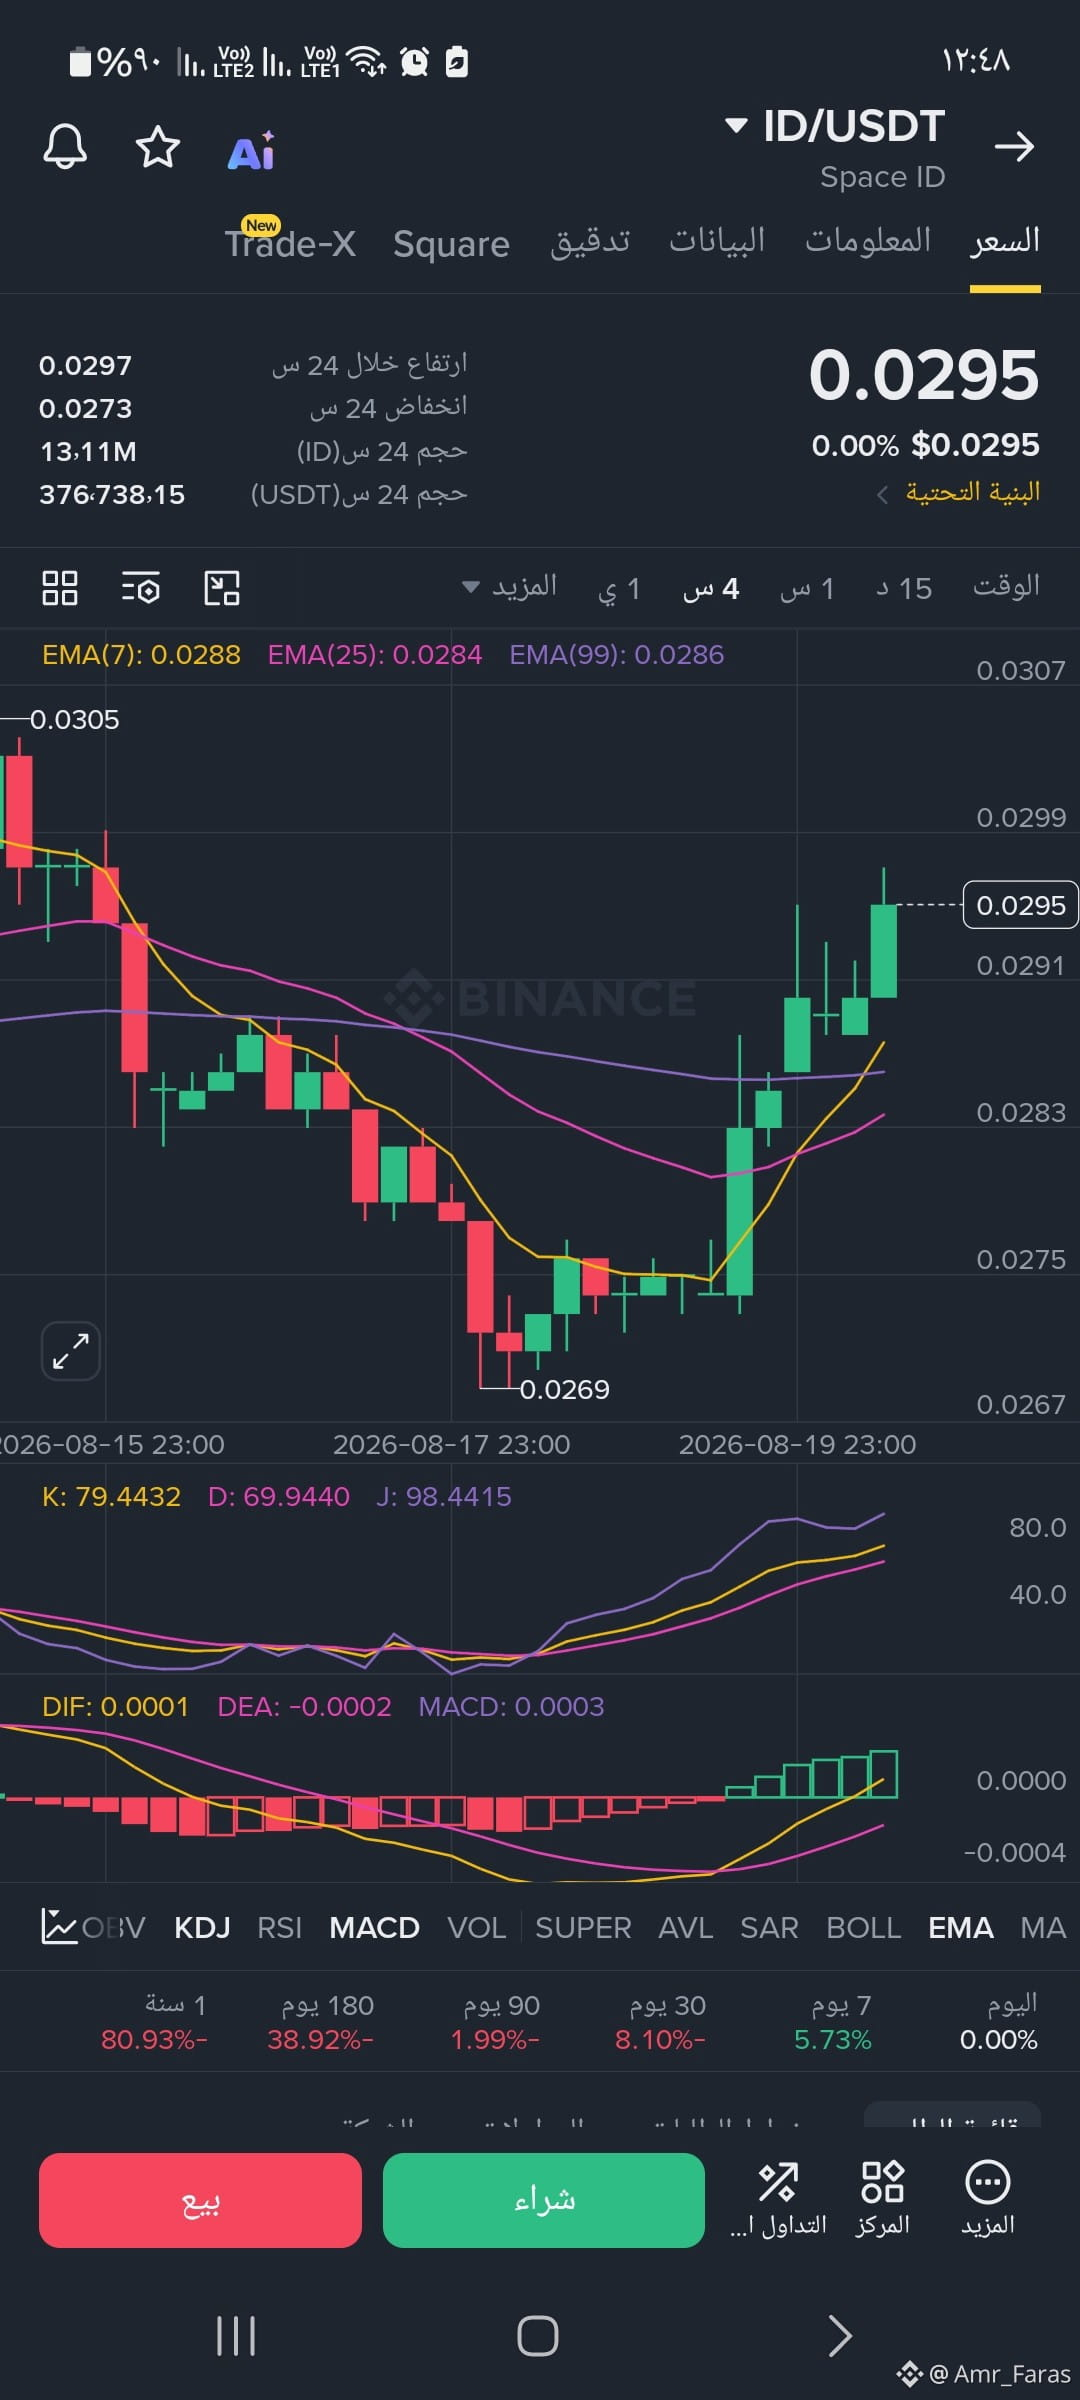
The currency is currently in a recovery state with very strong bullish momentum in the short term, and a positive reversal pattern is starting to form supported by a MACD crossover and a breakout of the moving averages. However, please be cautious of the rapid fluctuations in altcoins #ID/USDT
The currency is currently in a recovery state with very strong bullish momentum in the short term, and a positive reversal pattern is starting to form supported by a MACD crossover and a breakout of the moving averages. However, please be cautious of the rapid fluctuations in altcoins #ID/USDT
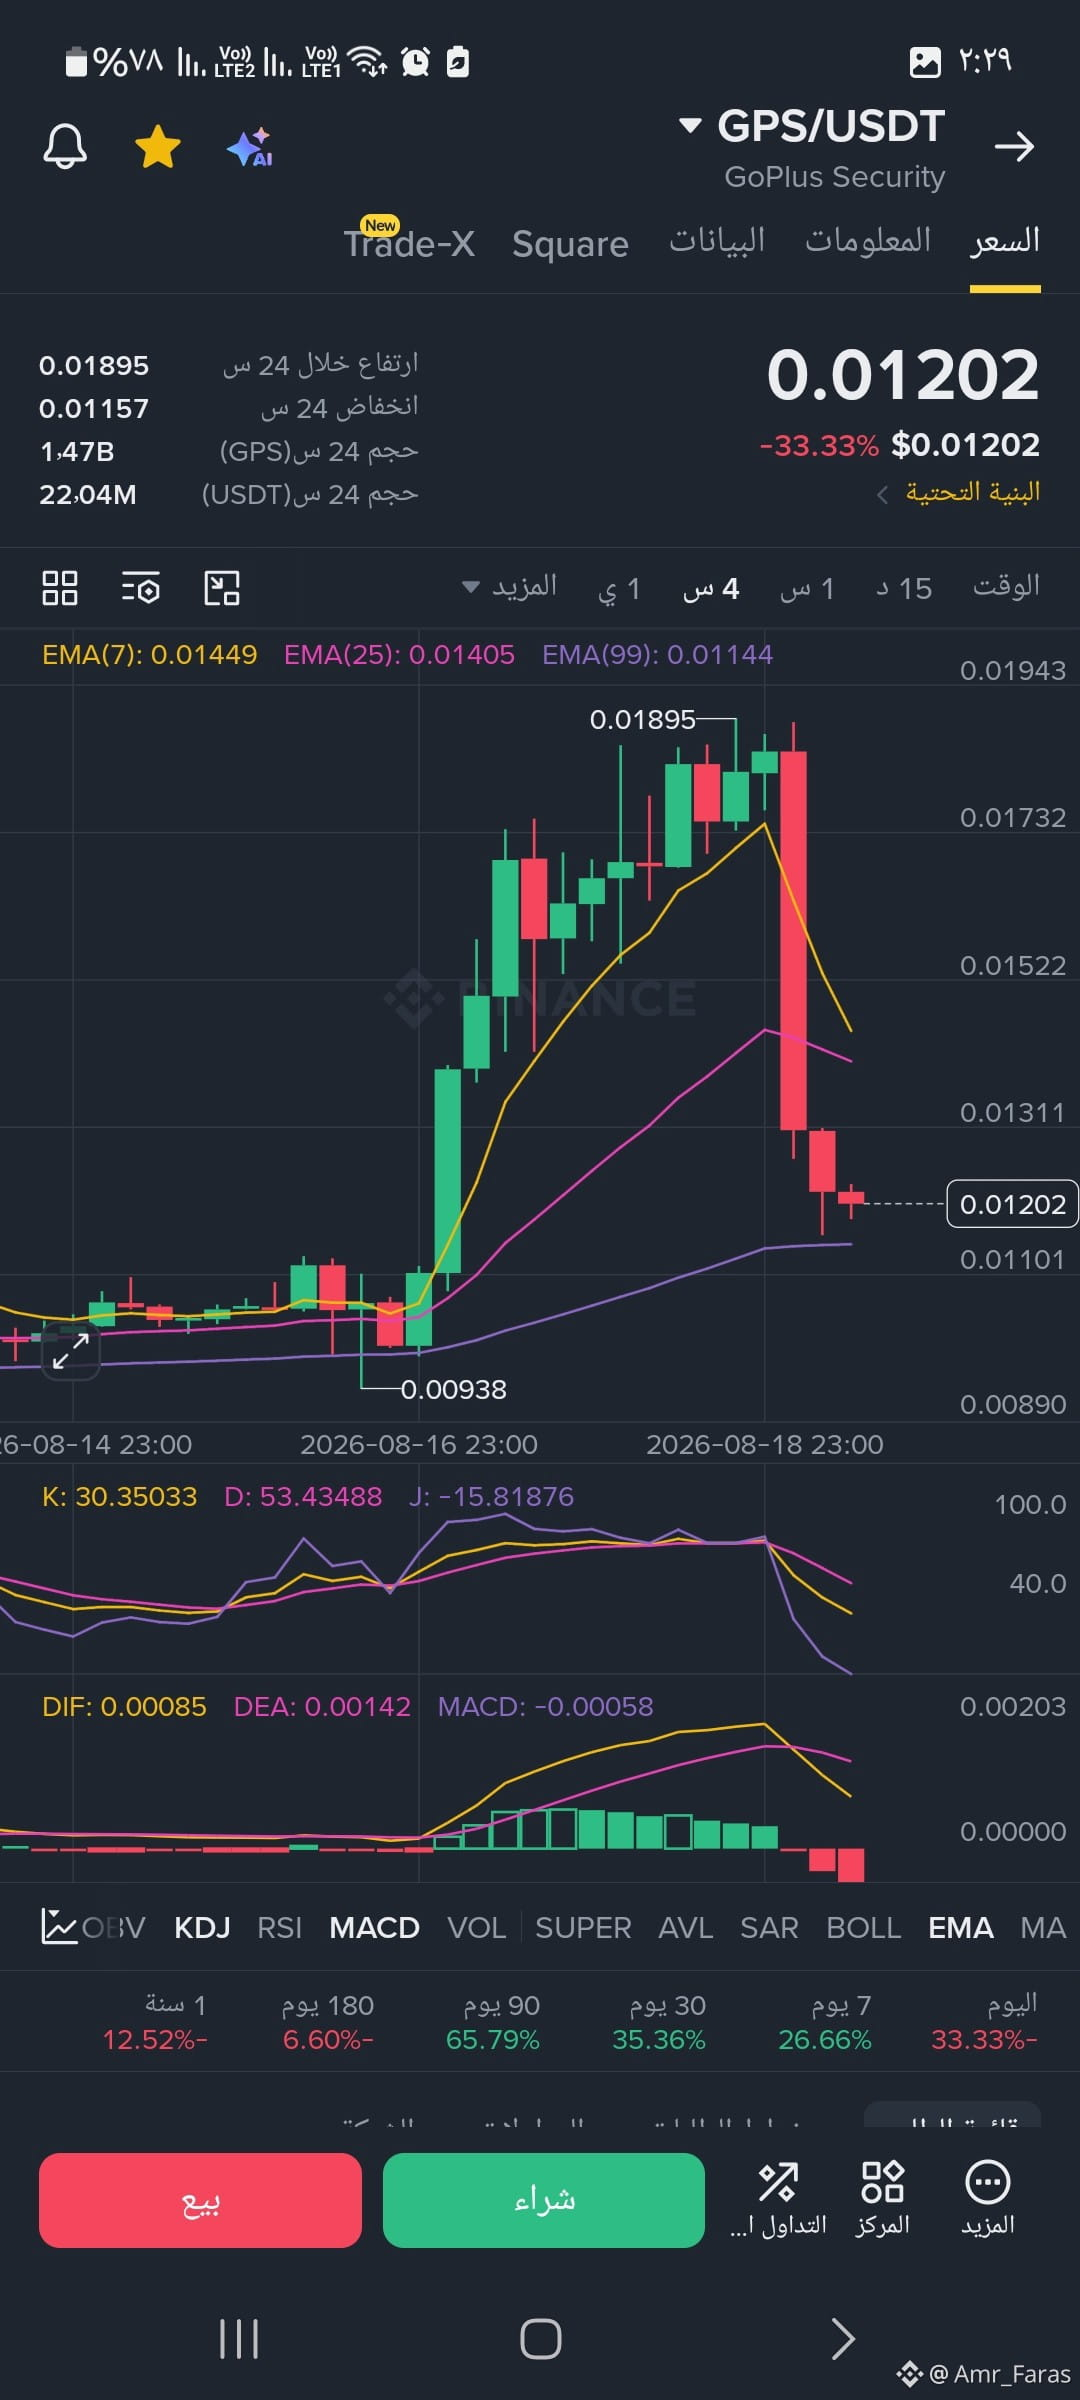
#GPS
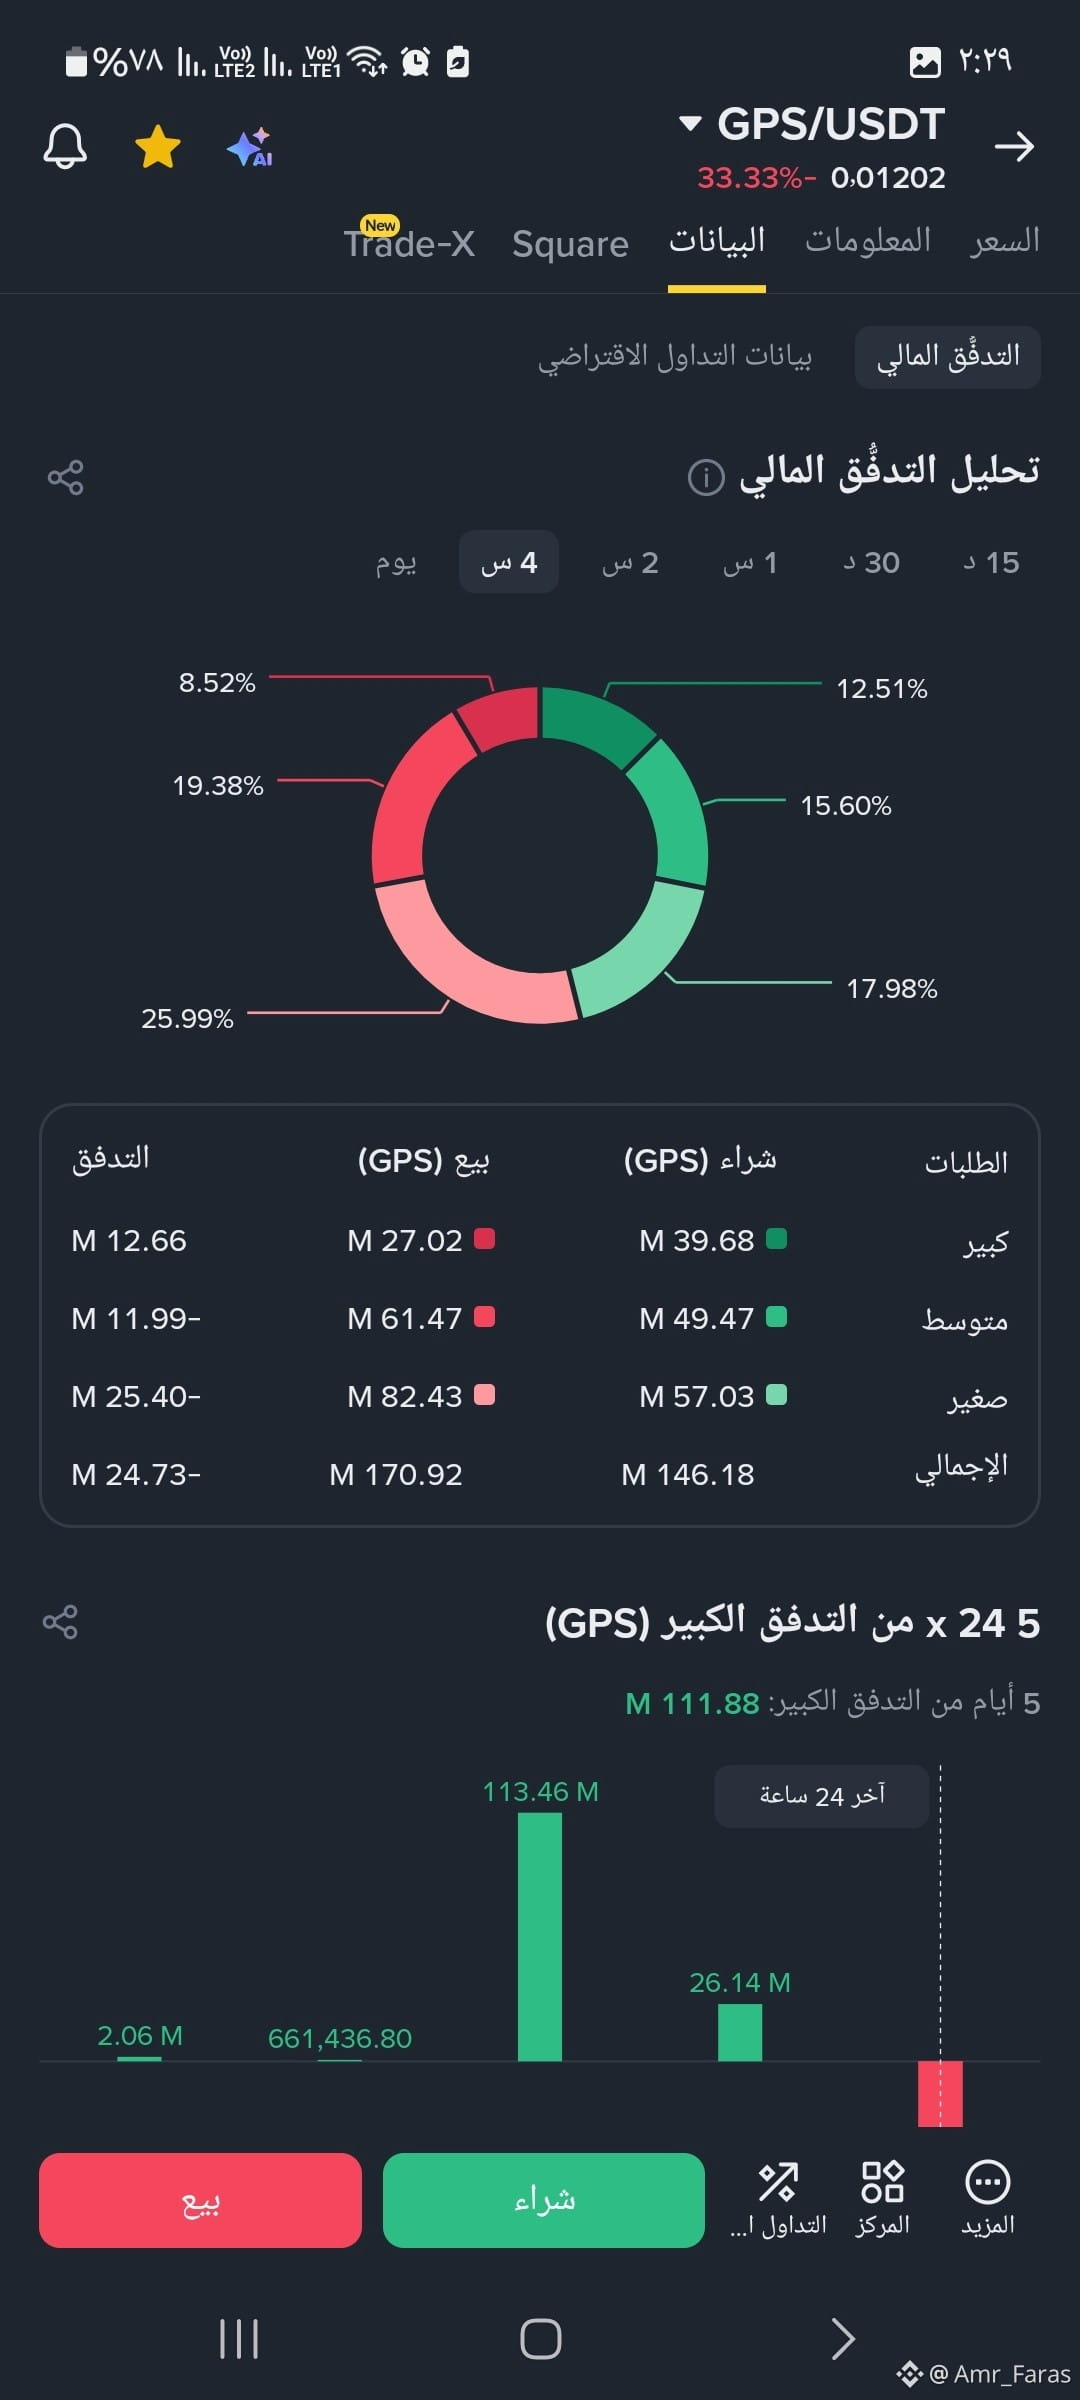
Cumulative Flow (5 days):
Total inflow remains very positive at 111.88M+ GPS, despite a slight bearish shift in the other 24-hour band.
Key Levels & Strategic Outlook
Support & Stop-Loss Levels:
First Support (Pivot): 0.01157 - 0.01144 (the intraday low and the 99 EMA mid-support).
Stop-Loss: A 4-hour candle close below 0.01144 opens the door for a drop toward the low at 0.00938.
Resistance Levels & Targets:
First Resistance (Retest): 0.01405 - 0.01449 (EMA 25 and EMA 7 levels).
Second Resistance: Regaining the 0.01522 level to return for a retest of the top at 0.01895.
Cumulative Flow (5 days):
Total inflow remains very positive at 111.88M+ GPS, despite a slight bearish shift in the other 24-hour band.
Key Levels & Strategic Outlook
Support & Stop-Loss Levels:
First Support (Pivot): 0.01157 - 0.01144 (the intraday low and the 99 EMA mid-support).
Stop-Loss: A 4-hour candle close below 0.01144 opens the door for a drop toward the low at 0.00938.
Resistance Levels & Targets:
First Resistance (Retest): 0.01405 - 0.01449 (EMA 25 and EMA 7 levels).
Second Resistance: Regaining the 0.01522 level to return for a retest of the top at 0.01895.
#OPN
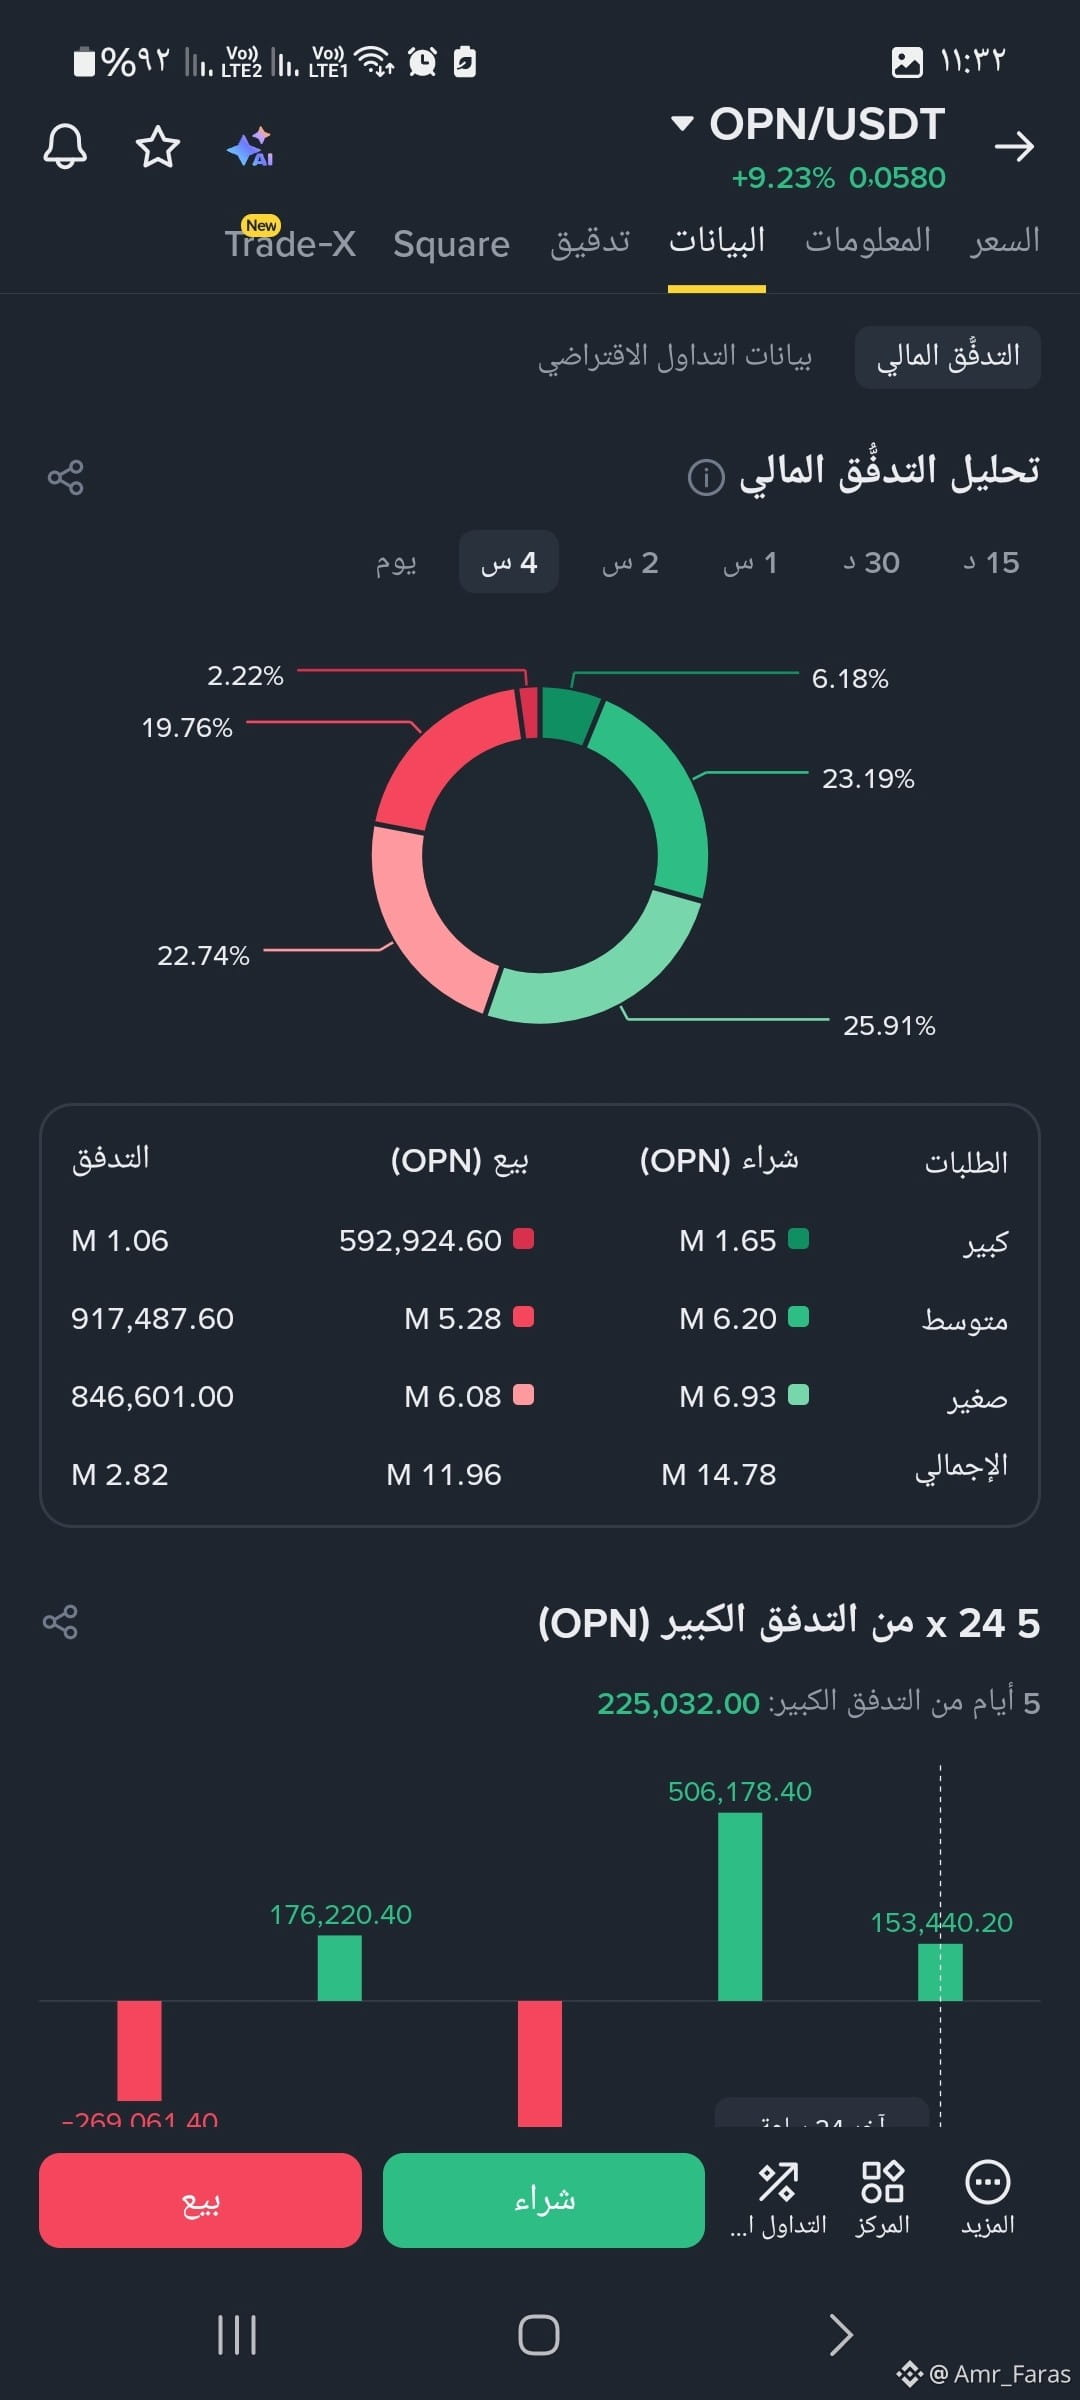
Cumulative Flow (5 days):
Total inflow is positive at 225,032.00 OPN, with consecutive green purchase liquidity candles during the last 24 hours (record the latest liquidity candle: +153,440.20 OPN).
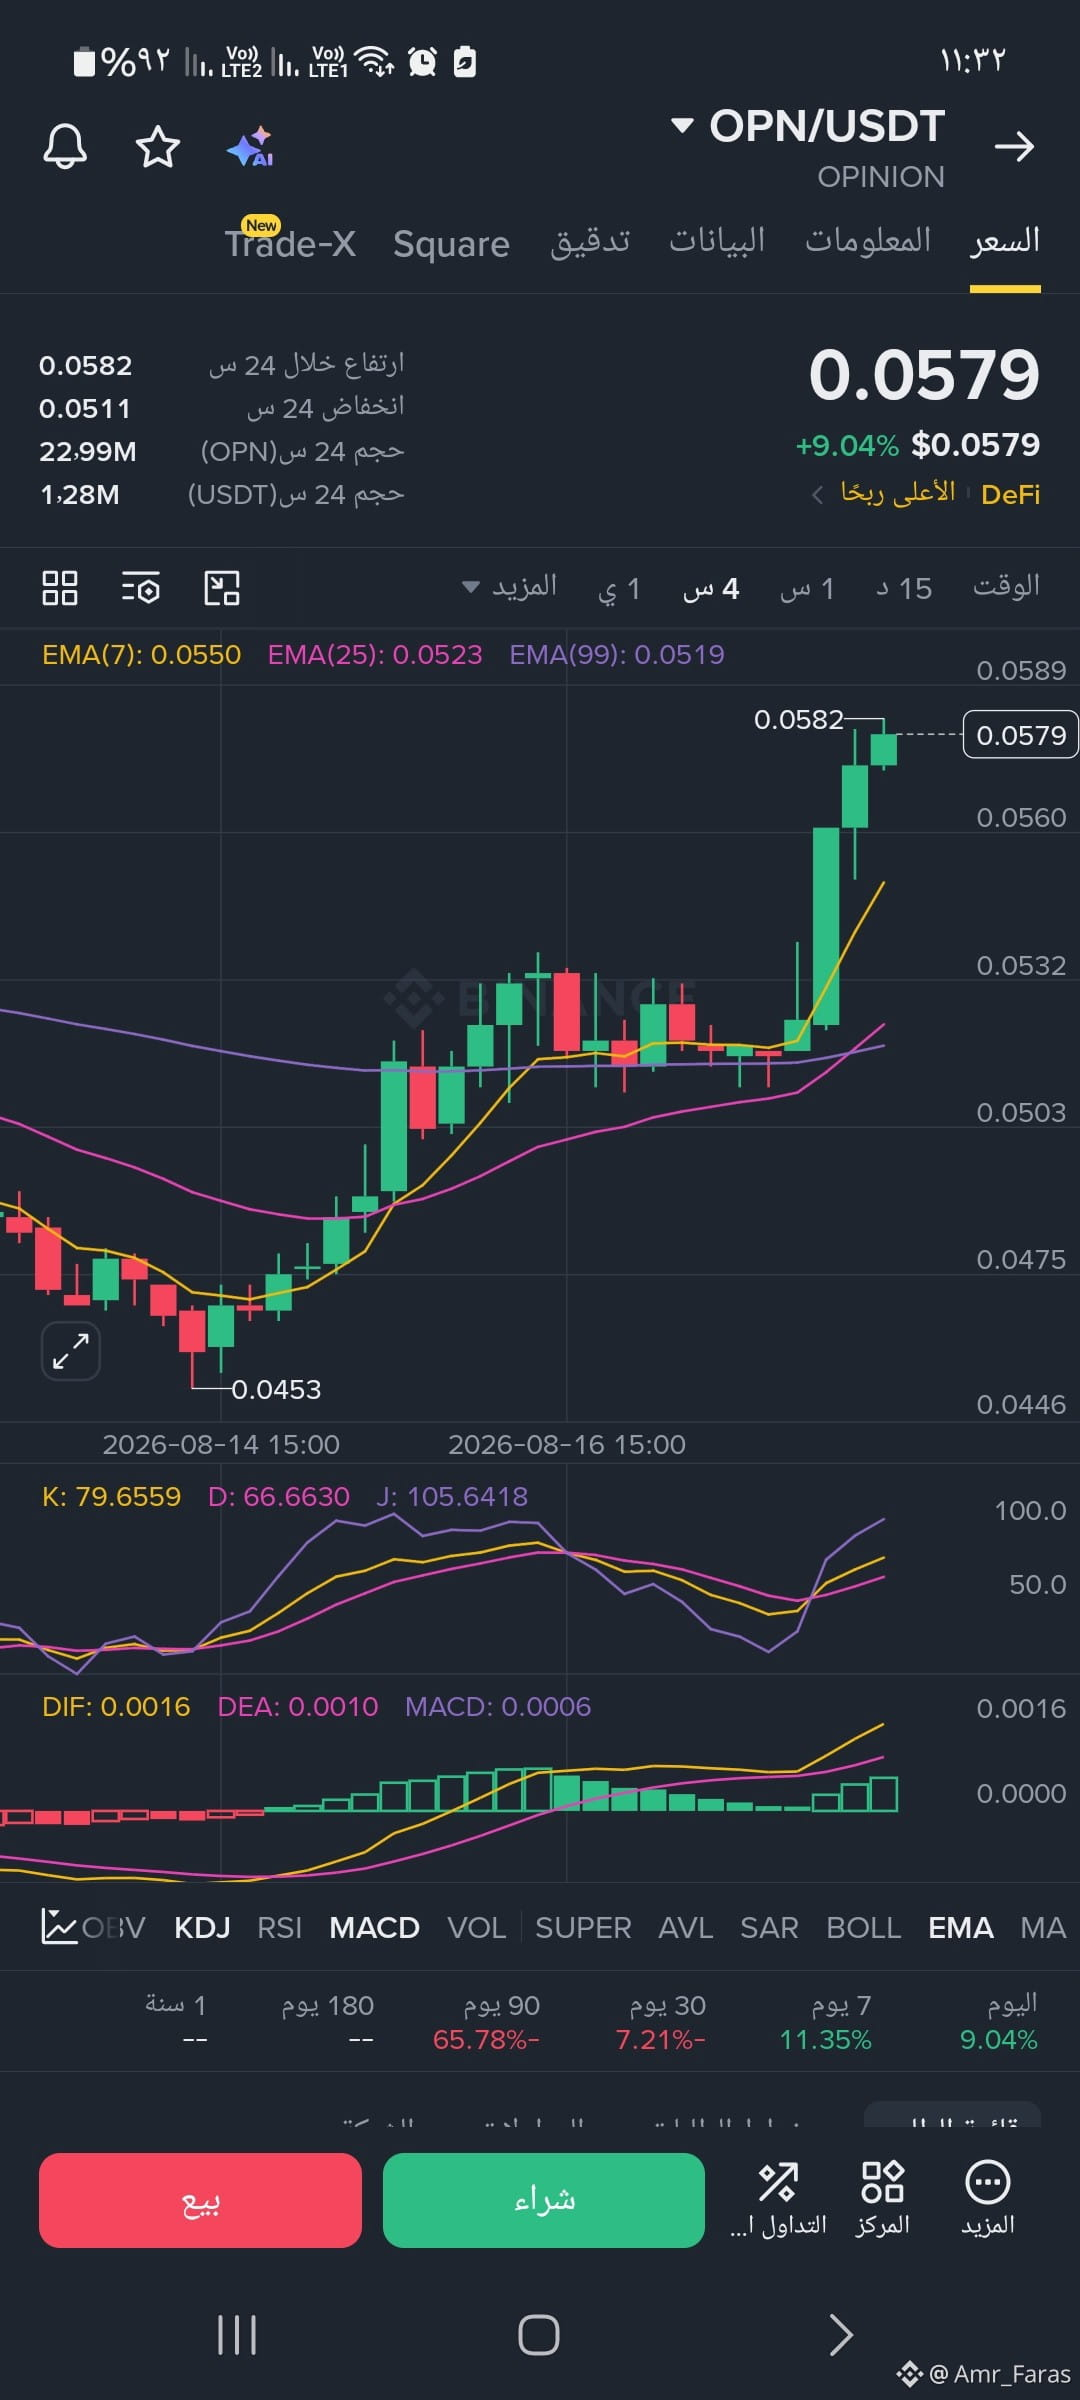
Key Levels & Strategic Outlook
Resistance Levels & Price Targets:
First Resistance: 0.0582 - 0.0589 (the intraday high and the current channel ceiling).
Next Target: if the breakout and consolidation above 0.0589 continues, upward-move targets will open toward 0.0620.
Support Levels & Stop Loss:
First Support: the 0.0550 zone (EMA 7).
Second Support (retest): the 0.0523 - 0.0519 zone (EMA 25 and EMA 99).
Stop Loss: a 4-hour candlestick close below 0.0510 will invalidate the current bullish scenario.
Cumulative Flow (5 days):
Total inflow is positive at 225,032.00 OPN, with consecutive green purchase liquidity candles during the last 24 hours (record the latest liquidity candle: +153,440.20 OPN).
Key Levels & Strategic Outlook
Resistance Levels & Price Targets:
First Resistance: 0.0582 - 0.0589 (the intraday high and the current channel ceiling).
Next Target: if the breakout and consolidation above 0.0589 continues, upward-move targets will open toward 0.0620.
Support Levels & Stop Loss:
First Support: the 0.0550 zone (EMA 7).
Second Support (retest): the 0.0523 - 0.0519 zone (EMA 25 and EMA 99).
Stop Loss: a 4-hour candlestick close below 0.0510 will invalidate the current bullish scenario.
#promo
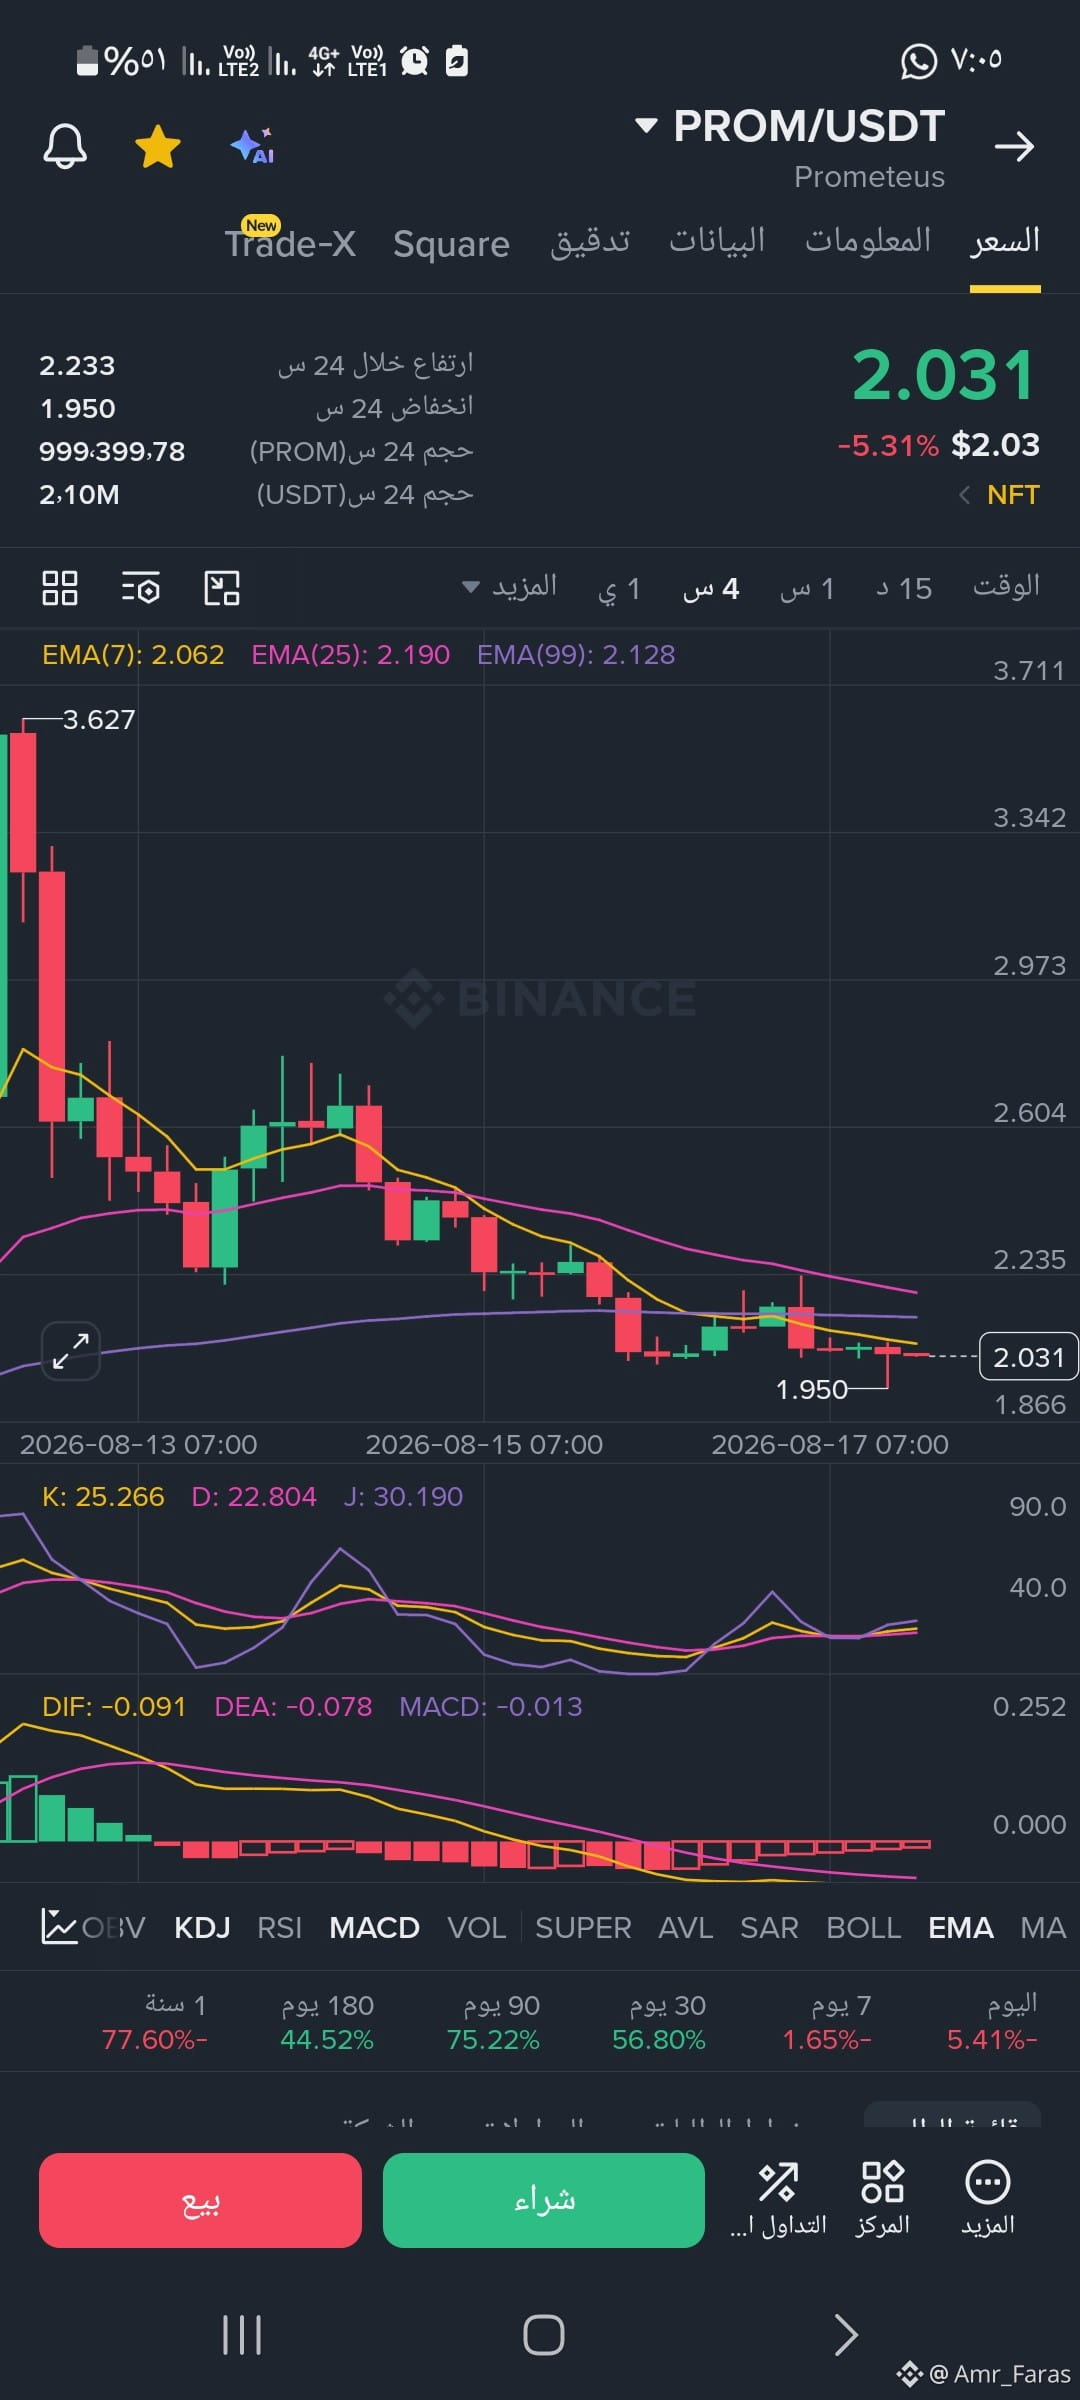
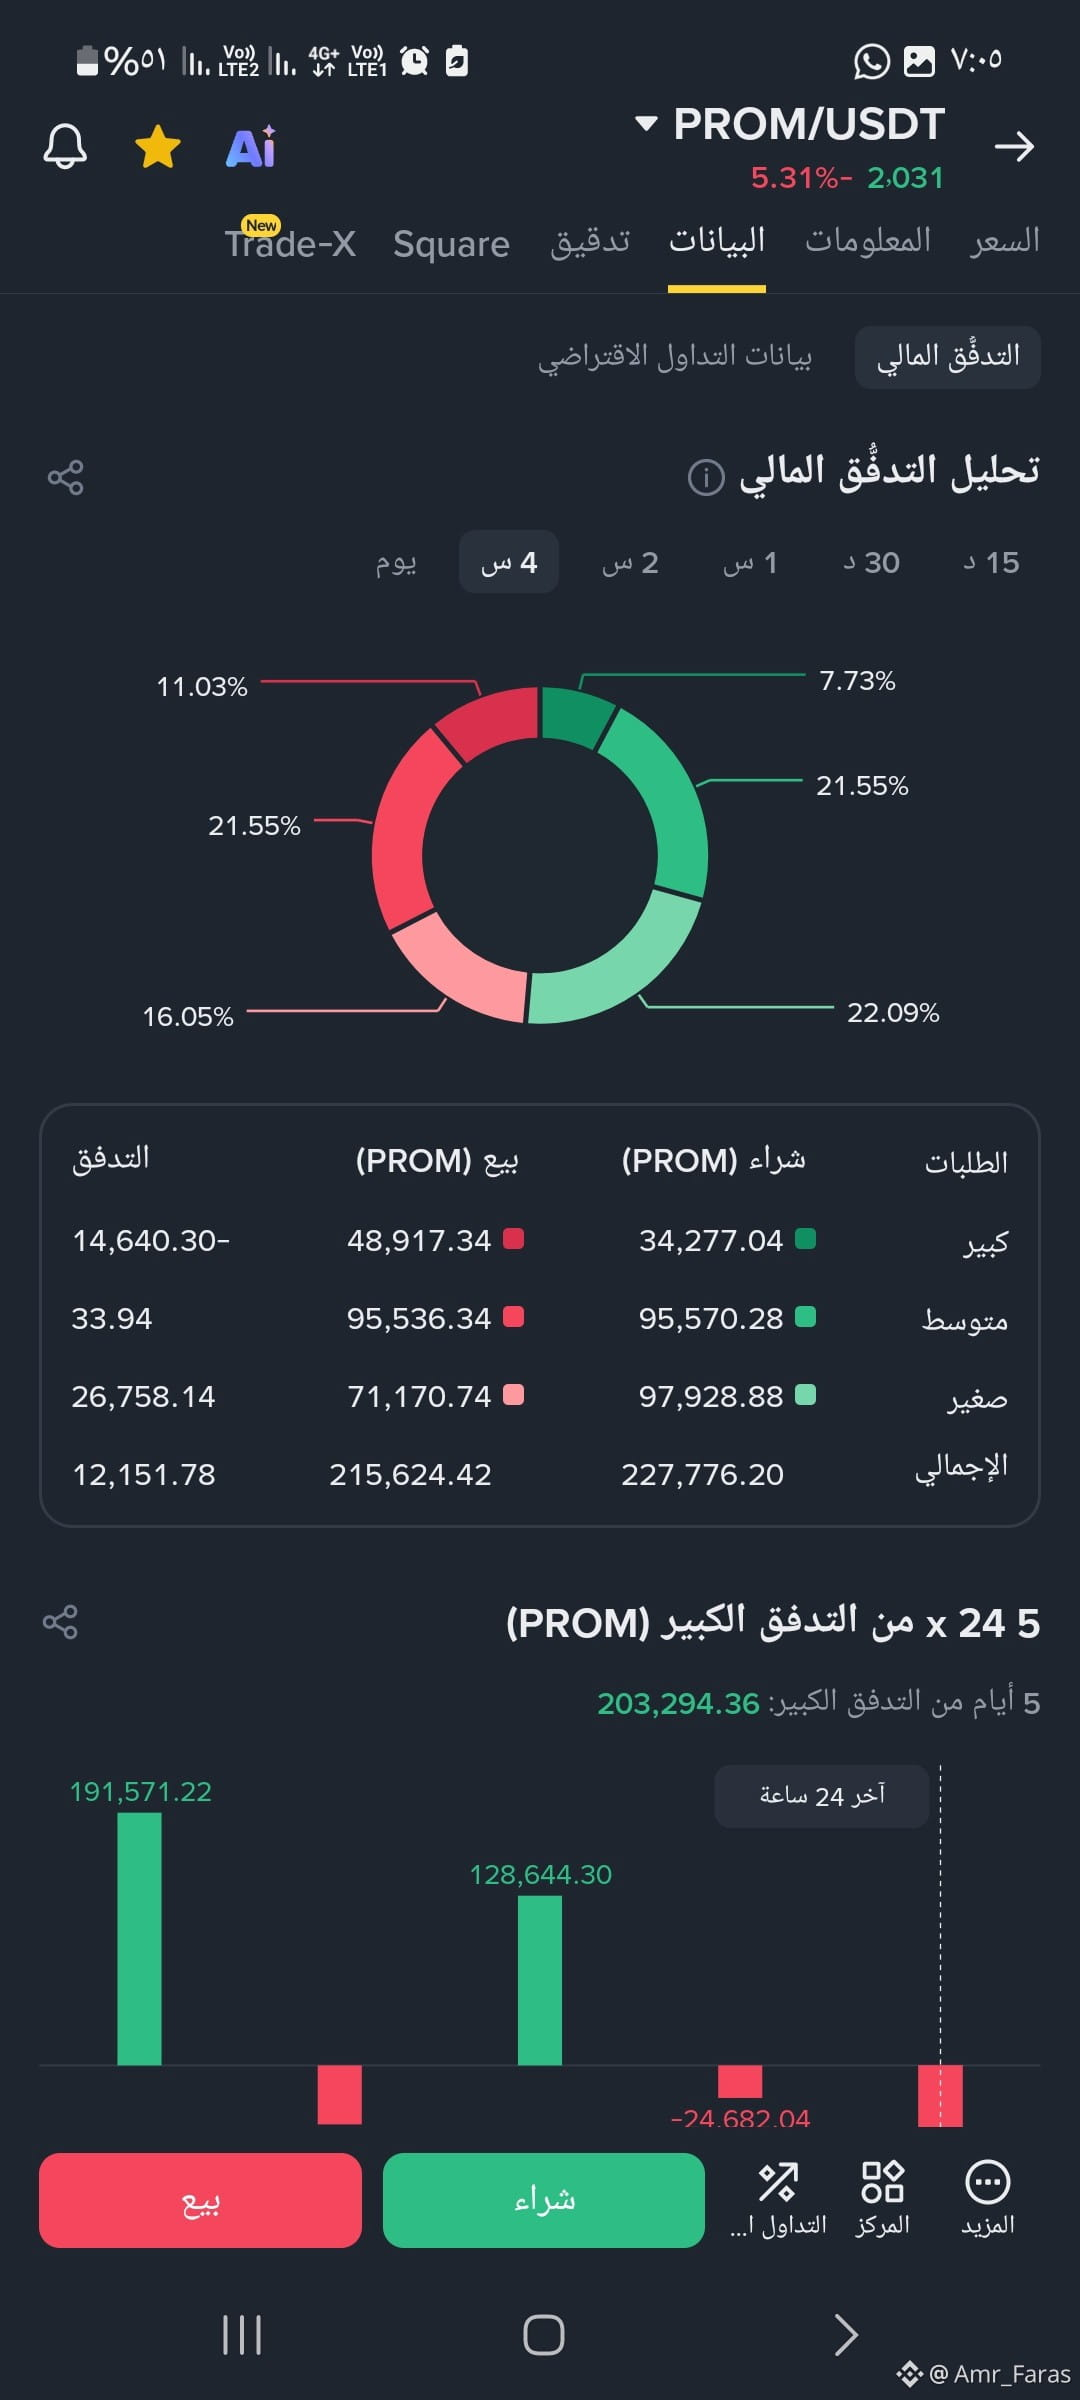
Pivot Levels and Strategic Outlook
Resistance Levels and Targets:
First Resistance: Break above 2.062 (EMA 7).
Second Resistance (Pivot): 2.128 - 2.190 (EMA 99 and EMA 25). Breaking above it opens the way toward 2.604.
Support Levels and Stop Loss:
Main Support: 1.950 (the immediate low).
Stop Loss: A 4-hour candle close below 1.950 cancels the bullish rebound scenario
Pivot Levels and Strategic Outlook
Resistance Levels and Targets:
First Resistance: Break above 2.062 (EMA 7).
Second Resistance (Pivot): 2.128 - 2.190 (EMA 99 and EMA 25). Breaking above it opens the way toward 2.604.
Support Levels and Stop Loss:
Main Support: 1.950 (the immediate low).
Stop Loss: A 4-hour candle close below 1.950 cancels the bullish rebound scenario
#GPS
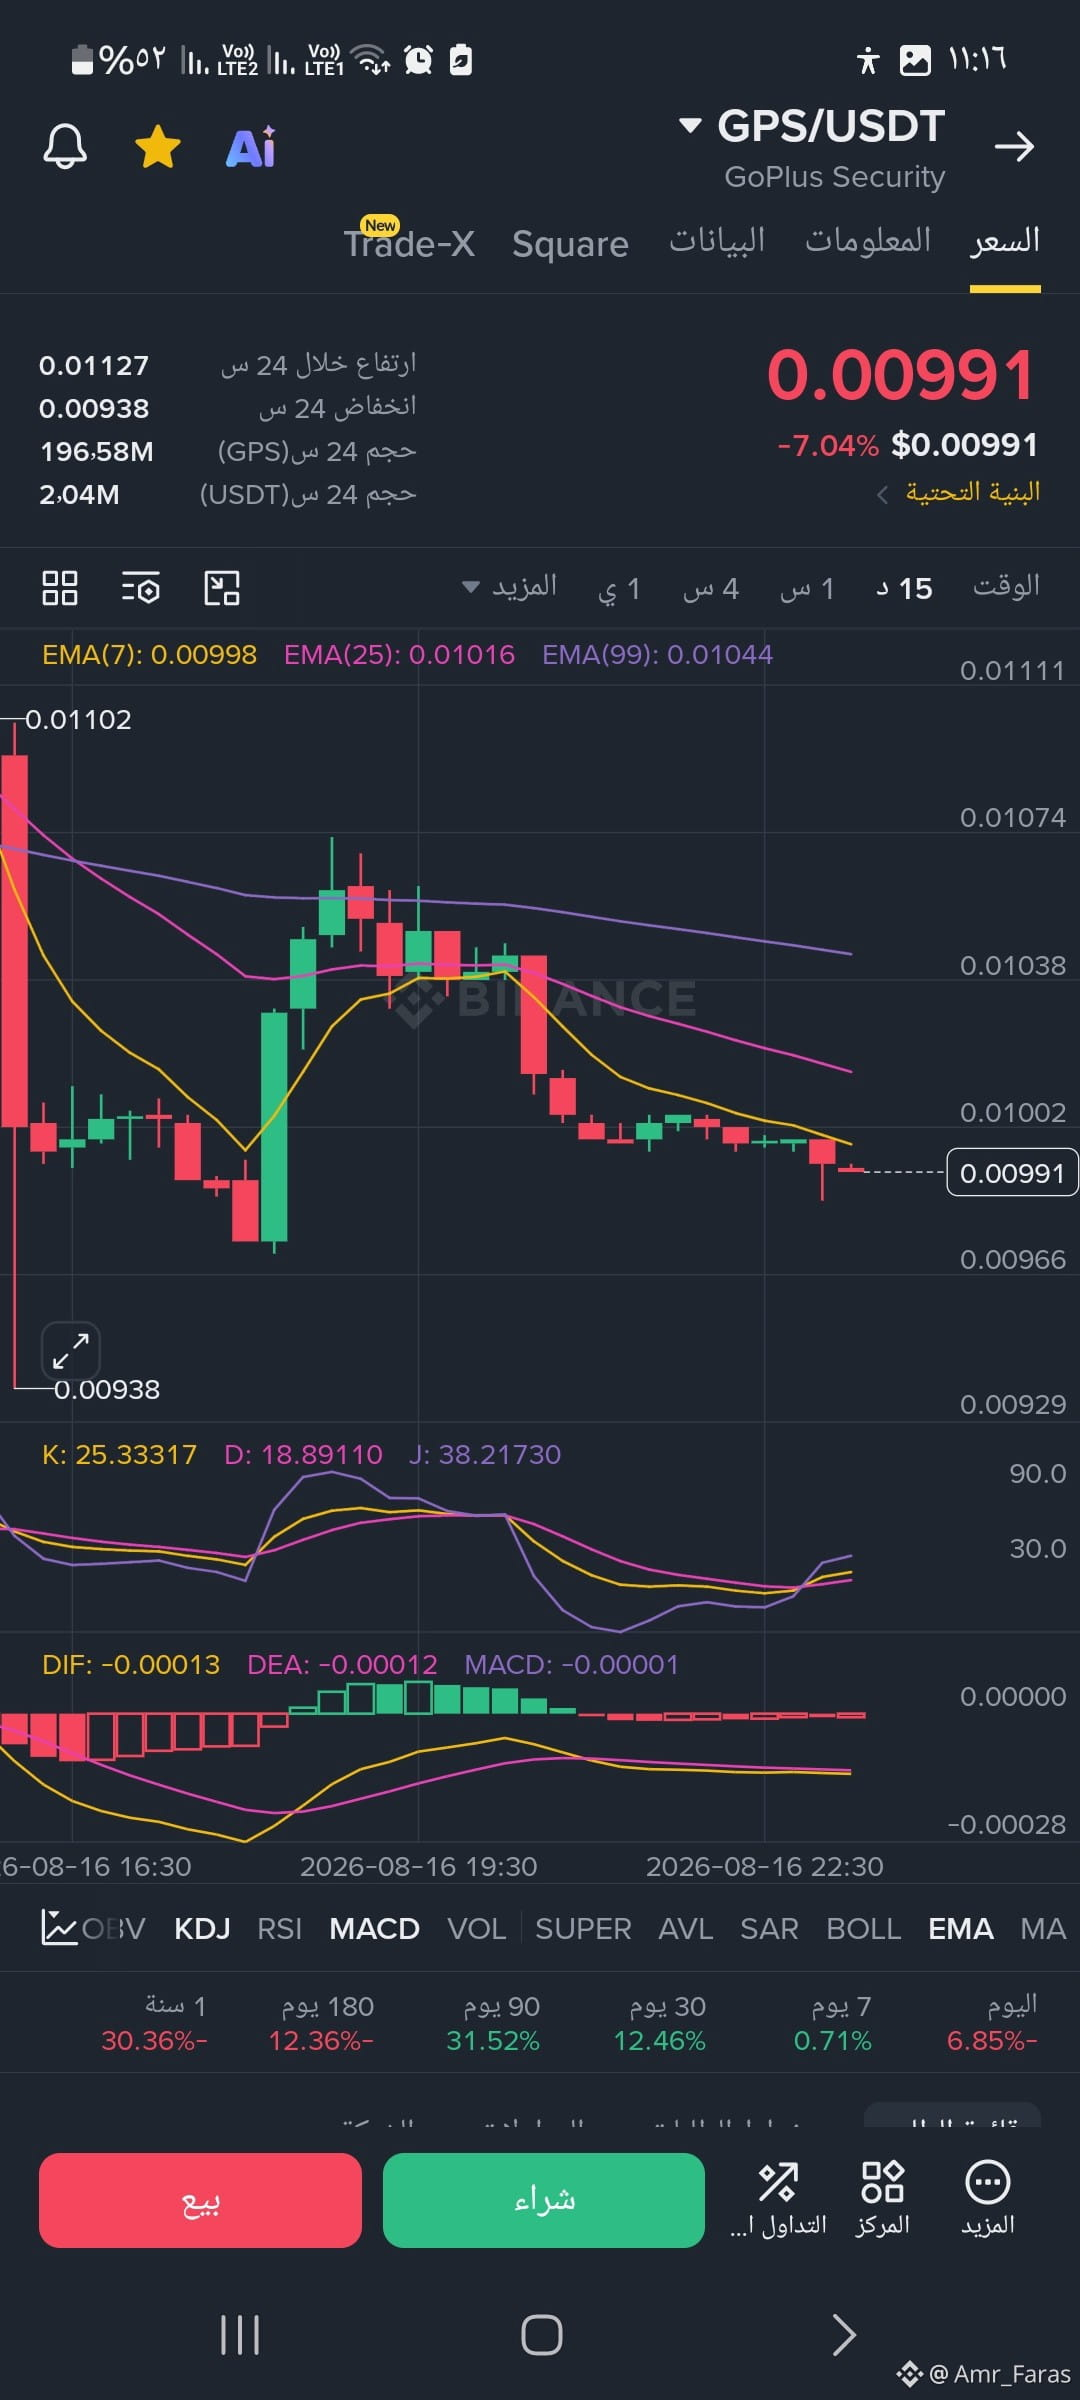
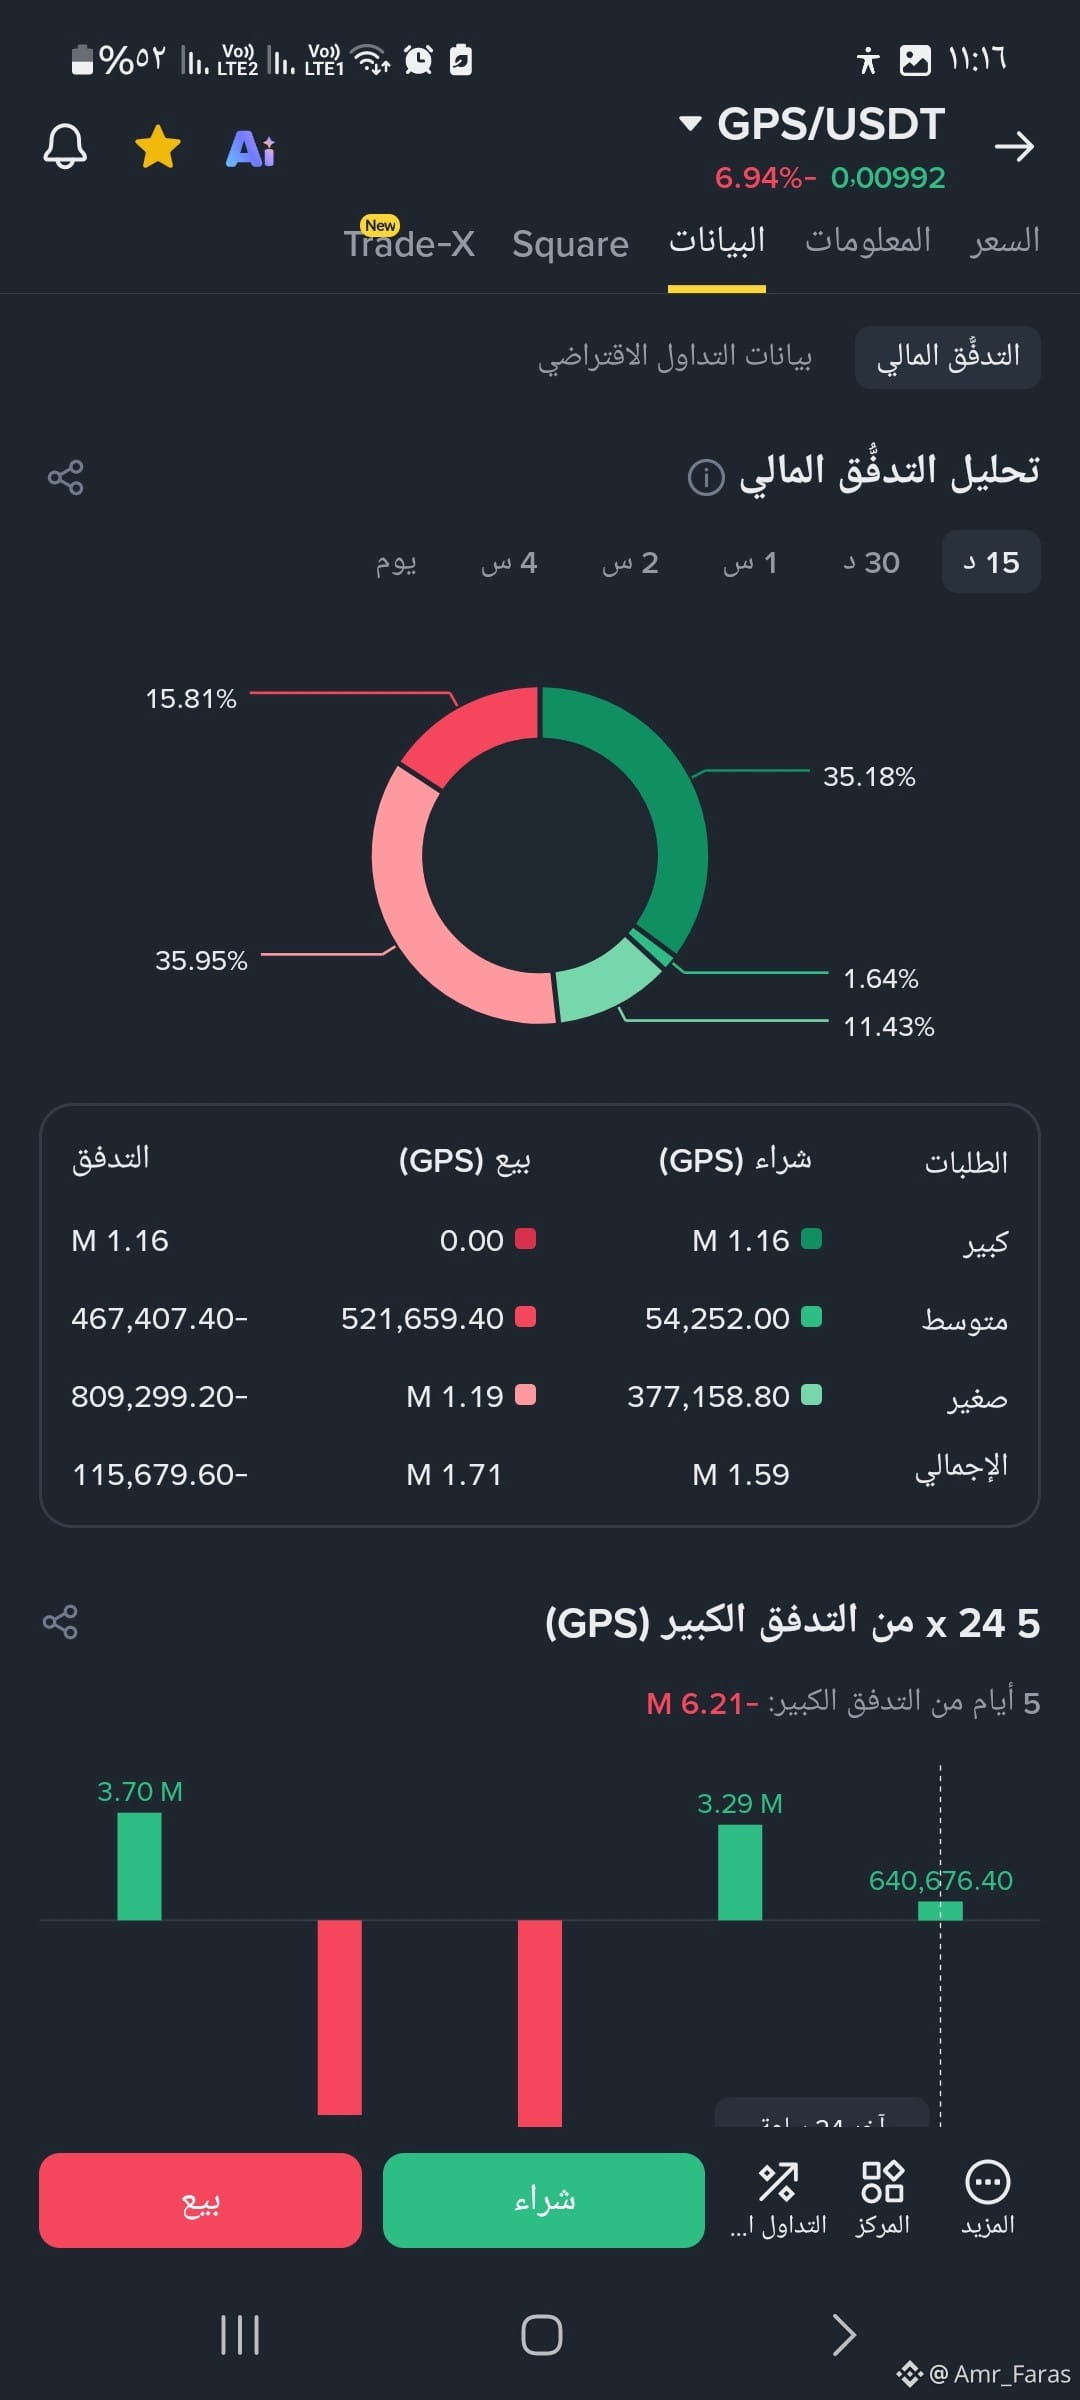
📌 Summary and Strategy
The coin is in a stabilization and brief accumulation phase above the 0.00938 bottom.
Upside targets (Targets):
First target: Break 0.01000 and hold above it to test 0.01016 (EMA 25).
Second target: Break above 0.01044 (EMA 99) to return toward the 0.01100 zones.
Support Zones and Safety Valve:
Immediate support: 0.00966 - 0.00938.
Stop Loss: A break of the 0.00938 bottom with a clear close
📌 Summary and Strategy
The coin is in a stabilization and brief accumulation phase above the 0.00938 bottom.
Upside targets (Targets):
First target: Break 0.01000 and hold above it to test 0.01016 (EMA 25).
Second target: Break above 0.01044 (EMA 99) to return toward the 0.01100 zones.
Support Zones and Safety Valve:
Immediate support: 0.00966 - 0.00938.
Stop Loss: A break of the 0.00938 bottom with a clear close
#ID/USDT
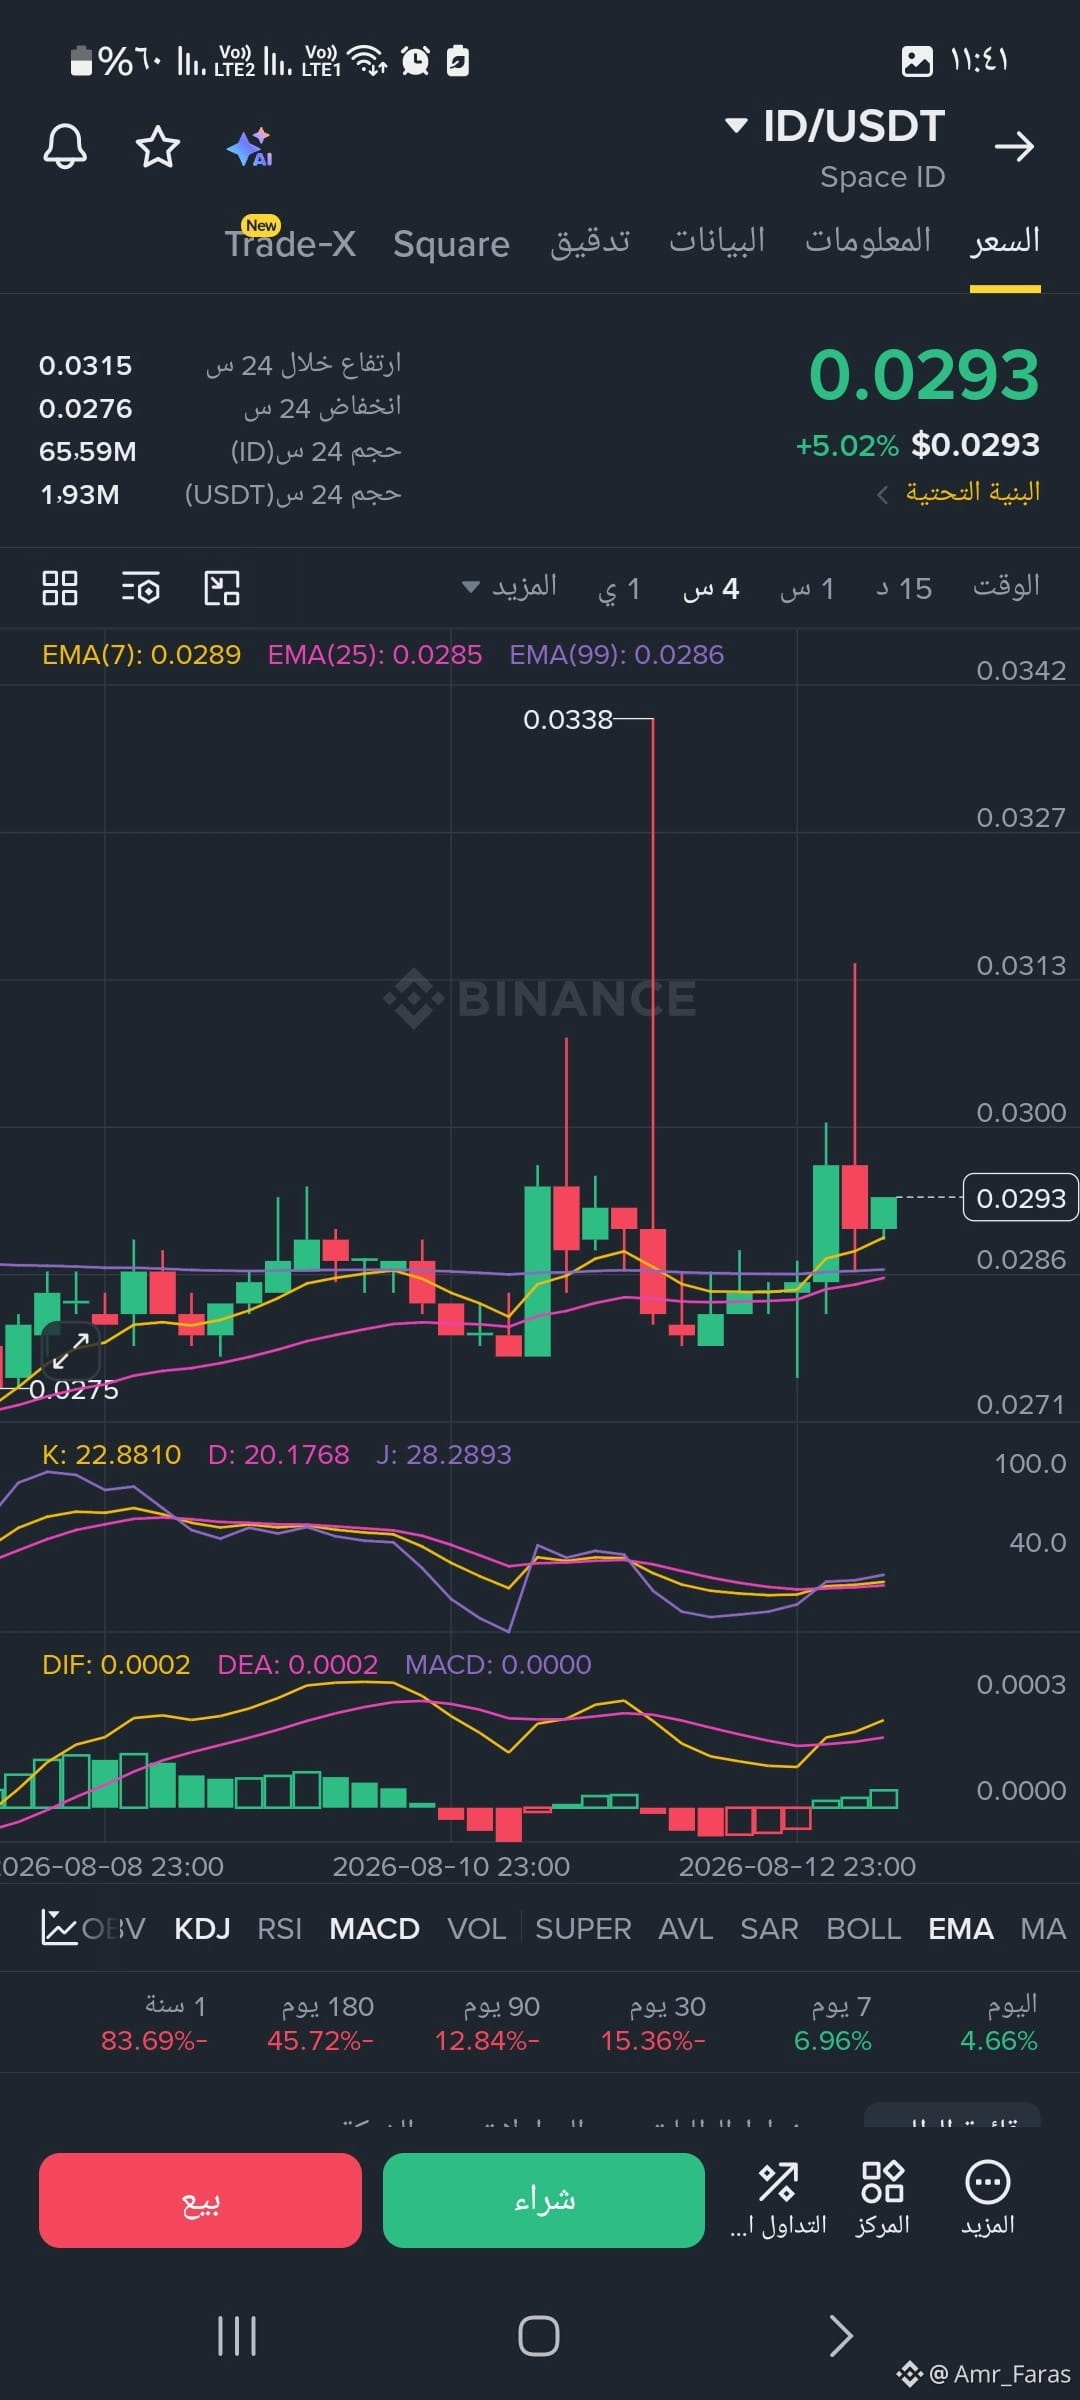
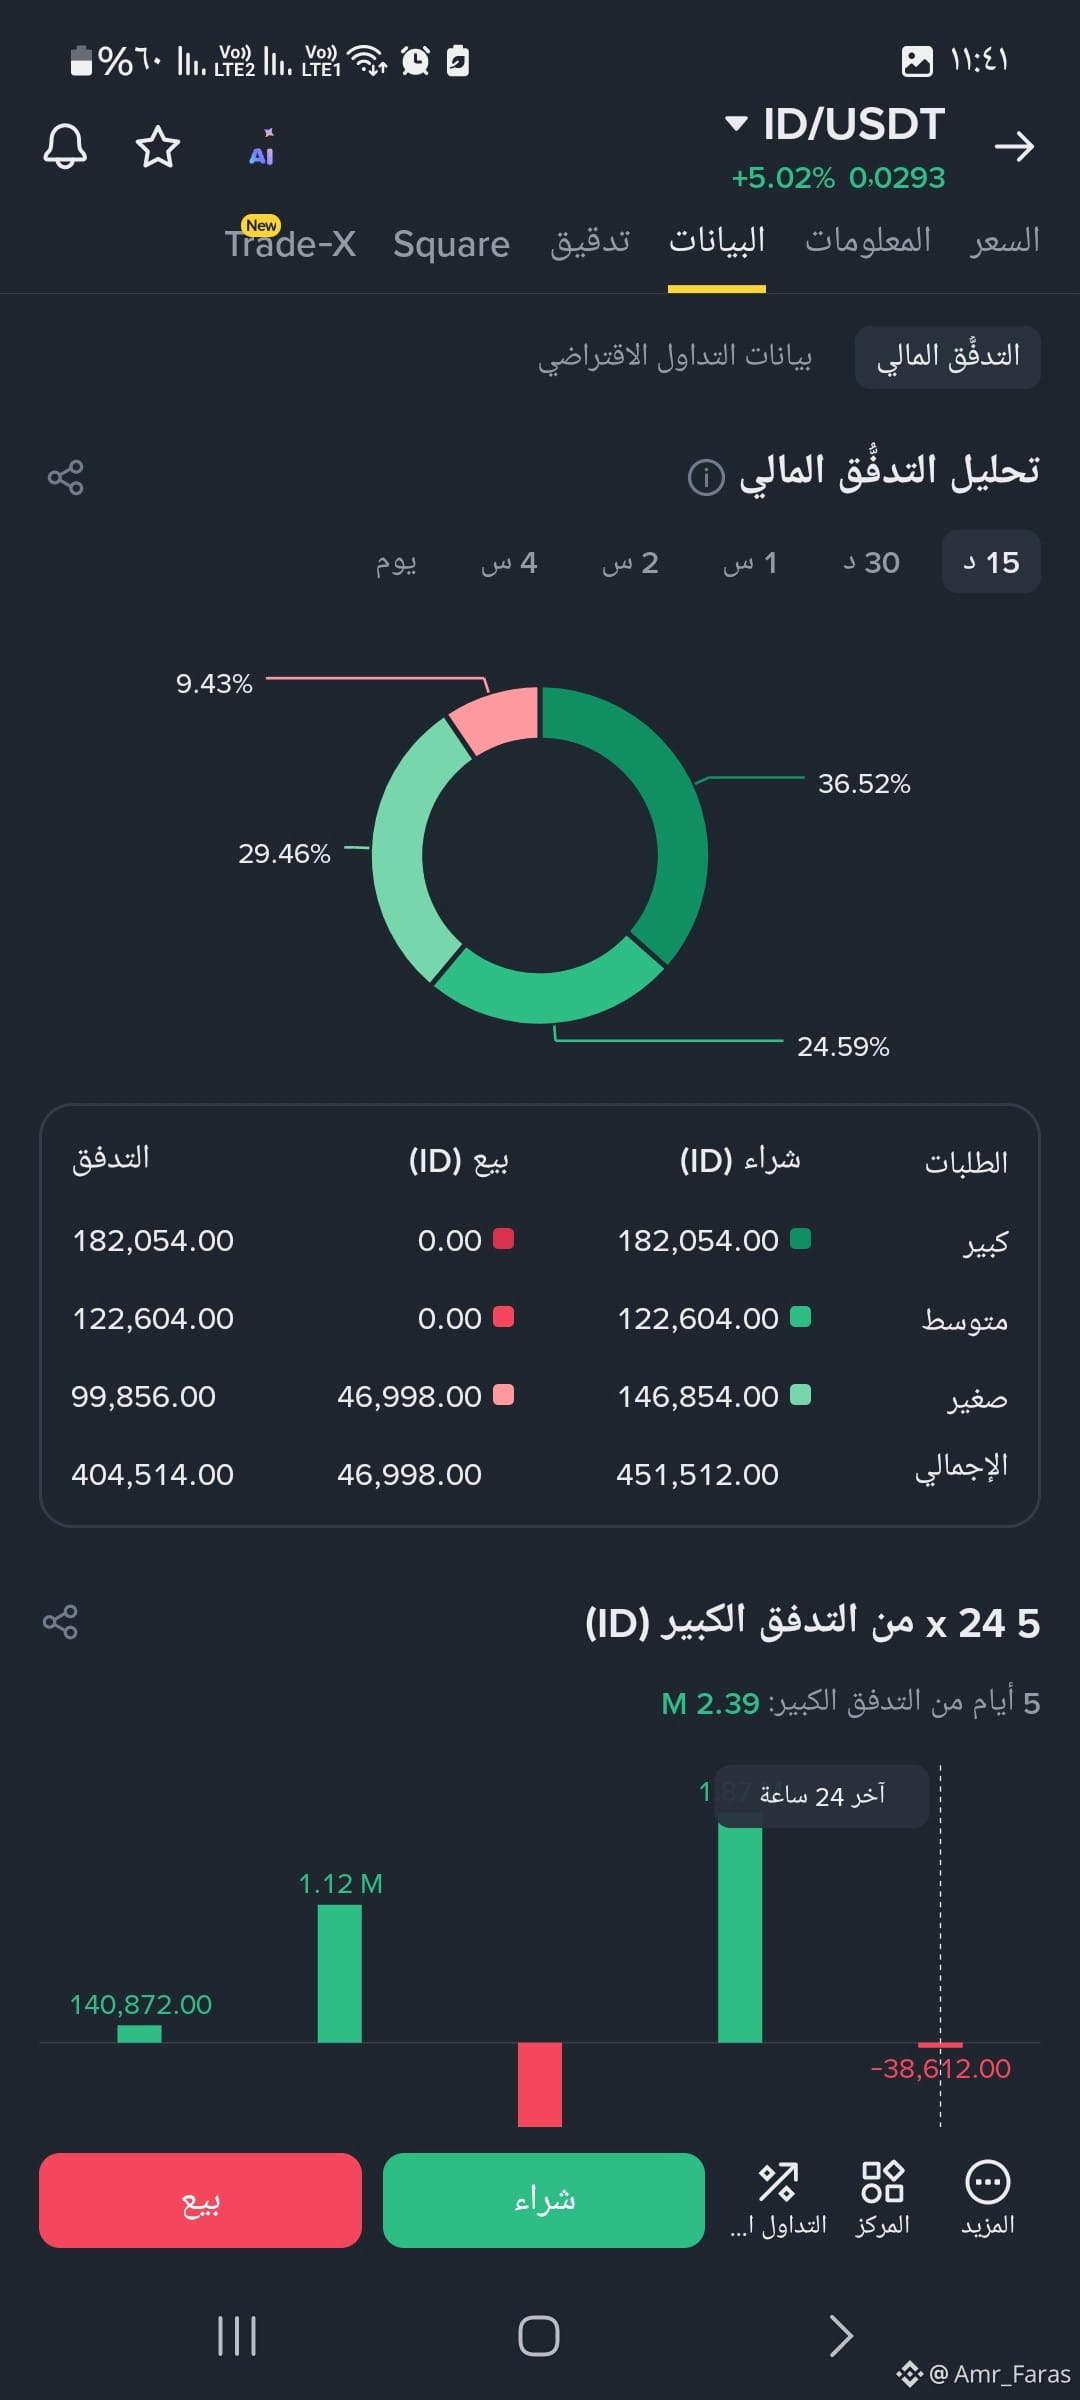
📌 Summary and Strategy
The technical and financial indicators appear positive and stable, with strong support from buying liquidity and trading above the moving average bundle.
Upside Targets:
First Target: Re-test the immediate resistance at 0.0300 - 0.0315.
Second Target: Break above 0.0315 and move toward the nearby peak at 0.0338.
Support Zones and Safety Valve:
First Support: Levels 0.0289 - 0.0285 (the EMA 7, EMA 25, and EMA 99 support zone).
Stop Loss: A break of 0.0275 confirmed by the close of a 4-hour candle invalidates the current upside scenario
📌 Summary and Strategy
The technical and financial indicators appear positive and stable, with strong support from buying liquidity and trading above the moving average bundle.
Upside Targets:
First Target: Re-test the immediate resistance at 0.0300 - 0.0315.
Second Target: Break above 0.0315 and move toward the nearby peak at 0.0338.
Support Zones and Safety Valve:
First Support: Levels 0.0289 - 0.0285 (the EMA 7, EMA 25, and EMA 99 support zone).
Stop Loss: A break of 0.0275 confirmed by the close of a 4-hour candle invalidates the current upside scenario
#Radworks
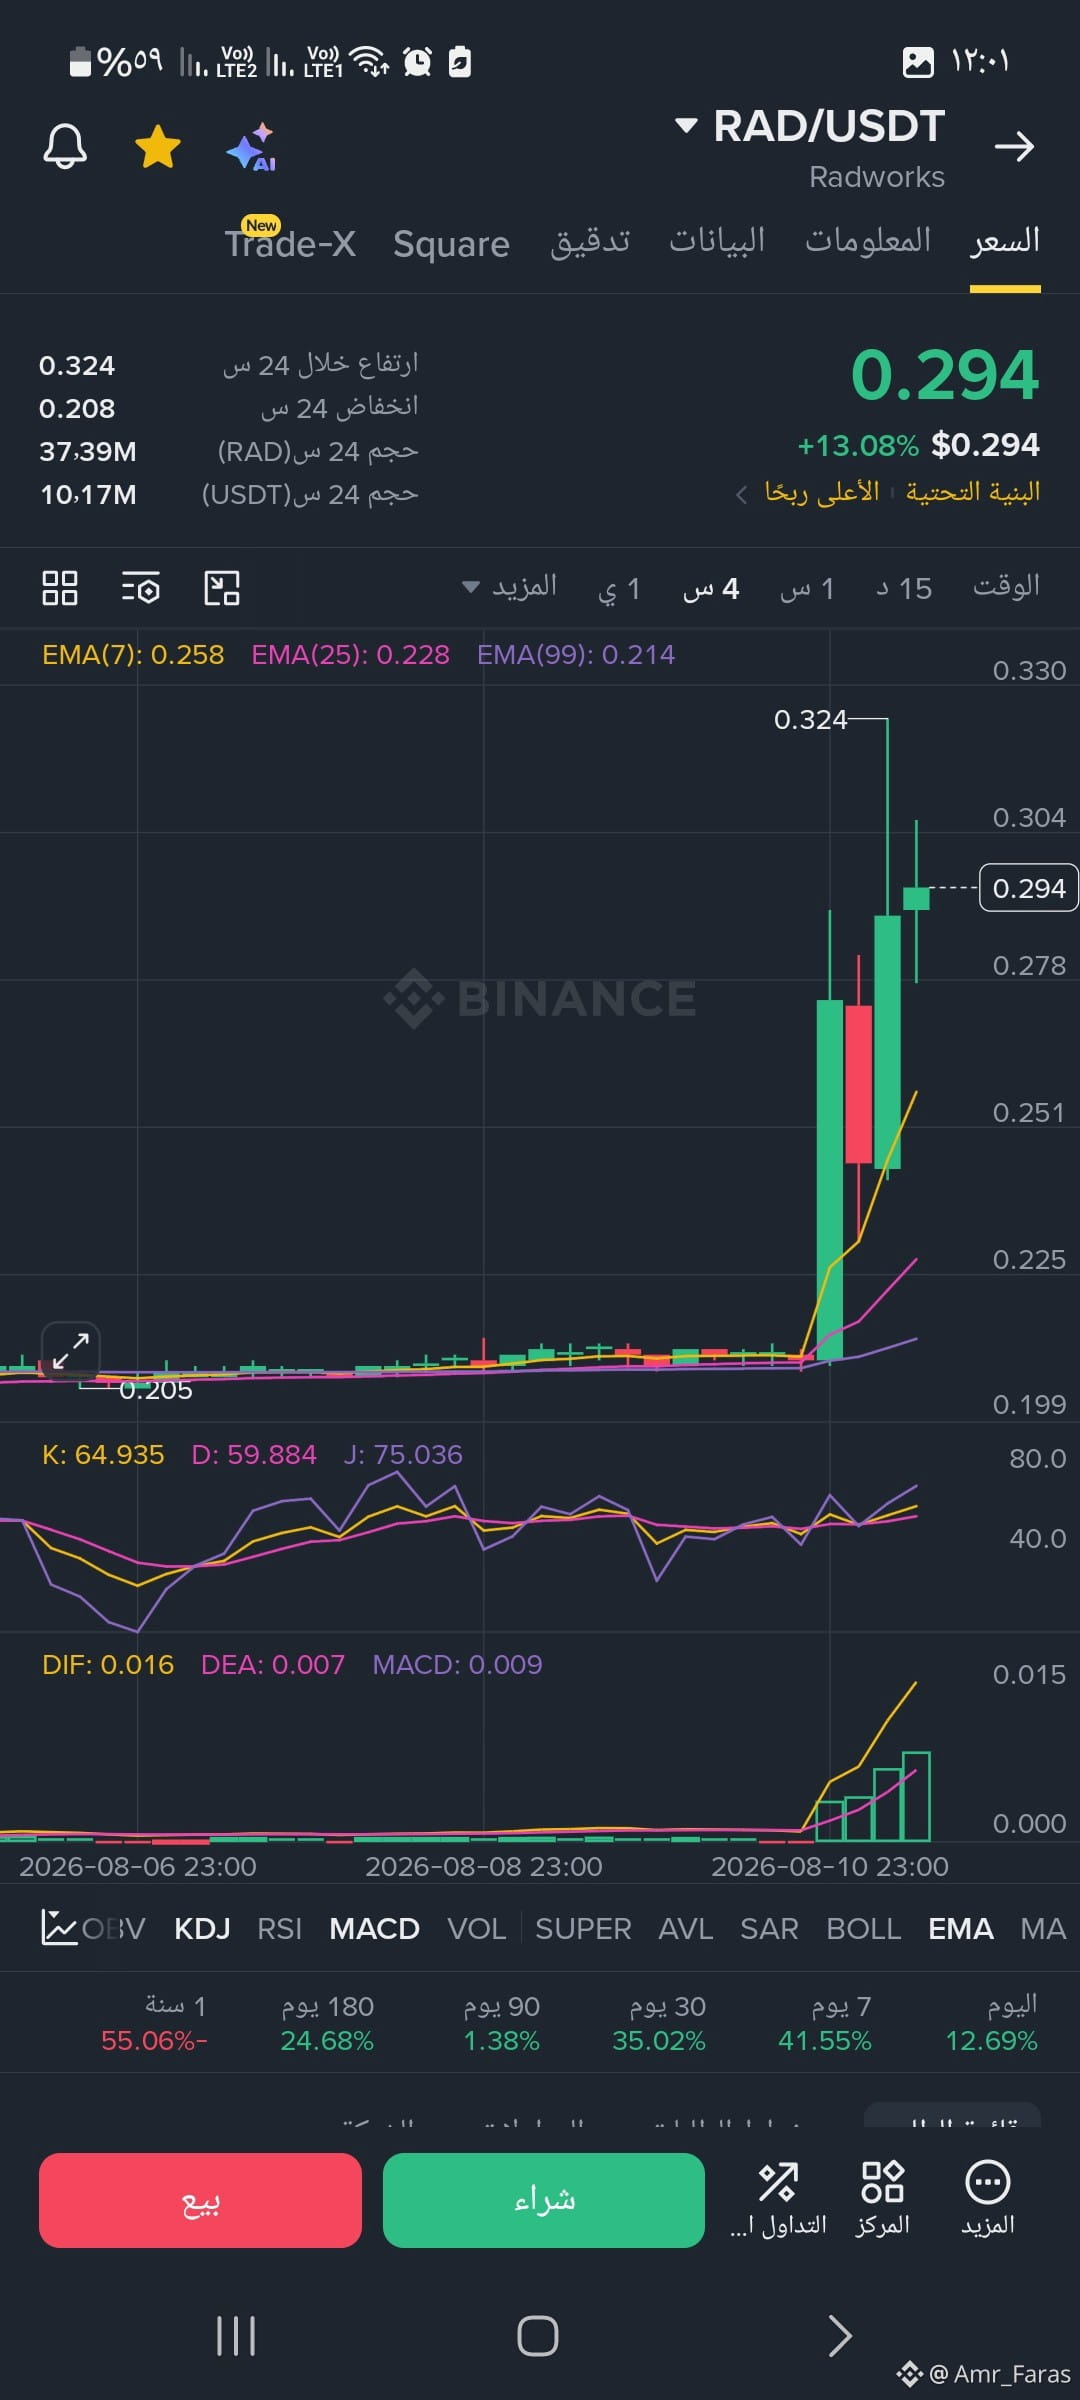
Summary and Strategy
The currency is going through a sharp upward wave (Pump), and it is currently in the consolidation phase above the 0.290 level.
Upside Targets:
First target: Re-test the top at 0.324, then break through toward 0.330.
Second target: Surpassing 0.330 opens the way for the price to complete the vertical climb to the 0.350 - 0.380 levels.
Support and Re-test Areas:
First support: Levels 0.278 - 0.258 (EMA 7 support zone).
Pivot support (safety valve): Zone 0.228 (EMA 25).
💡 Warning for speculators: Sharp price bursts require caution—don’t enter with full liquidity all at once at the peaks (to avoid FOMO). It’s preferable to set a flexible stop-loss below 0.258 to secure profits
Summary and Strategy
The currency is going through a sharp upward wave (Pump), and it is currently in the consolidation phase above the 0.290 level.
Upside Targets:
First target: Re-test the top at 0.324, then break through toward 0.330.
Second target: Surpassing 0.330 opens the way for the price to complete the vertical climb to the 0.350 - 0.380 levels.
Support and Re-test Areas:
First support: Levels 0.278 - 0.258 (EMA 7 support zone).
Pivot support (safety valve): Zone 0.228 (EMA 25).
💡 Warning for speculators: Sharp price bursts require caution—don’t enter with full liquidity all at once at the peaks (to avoid FOMO). It’s preferable to set a flexible stop-loss below 0.258 to secure profits
Log in to explore more content